
Towards the Rational Design of Stable Electrocatalysts for Green Hydrogen Production


1
Stat Key Laboratory for Physical Chemistry of Solid Surfaces, Collaborative Innovation Center of Chemistry for Energy Materials and National, College of Chemistry and Chemical Engineering, Xiamen University, Xiamen 361005, China
2
National Key Laboratory of Science and Technology on Vessel Integrated Power System, Naval University of Engineering, Wuhan 430033, China
3
Innovation Laboratory for Sciences and Technologies of Energy Materials of Fujian Province (IKKEM), Xiamen 361005, China
*
Author to whom correspondence should be addressed.
Catalysts 2022, 12(2), 204; https://0-doi-org.brum.beds.ac.uk/10.3390/catal12020204
Submission received: 17 December 2021
/
Revised: 19 January 2022
/
Accepted: 25 January 2022
/
Published: 8 February 2022
(This article belongs to the Special Issue Novel Developments in Fuel-Cell Oxygen Reduction Electrocatalysts)
Abstract
:Now, it is time to set up reliable water electrolysis stacks with active and robust electrocatalysts to produce green hydrogen. Compared with catalytic kinetics, much less attention has been paid to catalyst stability, and the weak understanding of the catalyst deactivation mechanism restricts the design of robust electrocatalysts. Herein, we discuss the issues of catalysts’ stability evaluation and characterization, and the degradation mechanism. The systematic understanding of the degradation mechanism would help us to formulate principles for the design of stable catalysts. Particularly, we found that the dissolution rate for different 3d transition metals differed greatly: Fe dissolves 114 and 84 times faster than Co and Ni. Based on this trend, we designed Fe@Ni and FeNi@Ni core-shell structures to achieve excellent stability in a 1 A cm−2 current density, as well as good catalytic activity at the same time.
1. Introduction
The pace at which humanity is moving towards renewable energy has been greatly accelerated. It is a worldwide consensus that green hydrogen, the hydrogen produced from renewable energy, will be a major fuel in a future sustainable society [1,2]. Water electrolysis powered by the electricity from renewable energy offers an ideal solution to satisfy the hydrogen supply for the scalable implementation of hydrogen fuel vehicles, along with the simultaneous mitigation of CO2 emissions. Although this is an attractive blueprint, some technical challenges need to be overcome. A primary challenge is that the devices need to work reliably over years, calling for the high stability of every element (e.g., the catalysts and membrane) in the device under working conditions.
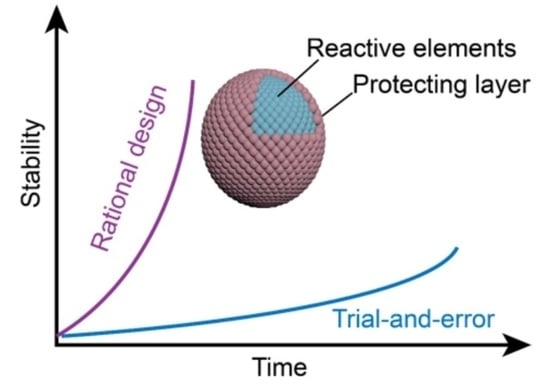
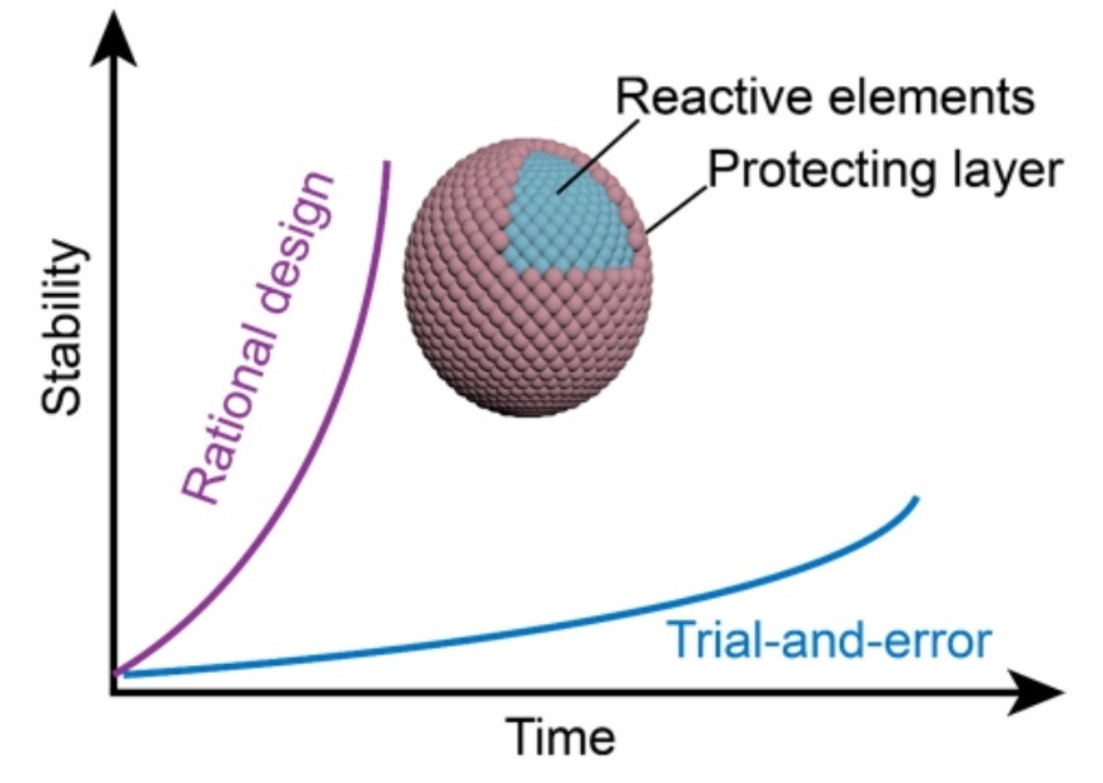
However, so far, the study of catalyst stability has been conducted poorly. The screening of stable catalysts relies on a trial-and-error approach, which is time-consuming and not always reliable. On one hand, technical factors (e.g., electrode fabrication, catalyst support and catalyst loading) in stability tests significantly influence the electrochemical results, which usually bring in artifacts of stability data [3,4]. On the other hand, many fundamental problems regarding catalyst stability are not clear; thus, the rules to guide catalyst design or selection are lacking. In this work, we highlight the concept of rational catalyst design in the development of stable catalysts for water splitting based on a comprehensive understanding of the catalyst degradation pathway. The problems in catalyst stability evaluation and the possible degradation mechanism of the device are discussed. The corrosion trend and mechanism revealed from this work inspire the design of core-shell catalyst Fe@Ni and FeNi@Ni for an oxygen evolution reaction (OER). The corrosion-resistant outer layer of Ni successfully protects the underlying Fe substrate, resulting in a highly stable and active catalyst.
2. Results and Discussion
Uncovering the degradation mechanism of the catalyst is essential in order to improve the performance stability. The common degradation mechanism and characterization techniques are summarized in Table 1. Among the various degradation pathways, catalyst dissolution is usually the major cause of activity loss when using many OER and HER catalysts [4,5,6,7]. The dissolution of the anode is caused by the high working potential and corrosive electrolyte, whereas cathode dissolution mainly originates from the reduction of surface oxides formed in the resting state [7,8]. It has been shown that the cathode potential could rise up to about 1 V vs. the reversible hydrogen electrode (RHE) after the shut-down of the proton exchange membrane water electrolyzer (PEMWE) because of oxygen crossover from the anode side [8]. Therefore, the dissolution of HER catalysts should not be neglected. Owing to the rapid dissolution, many highly active OER catalysts such as RuO2 and layered Ni-Fe oxyhydroxides are found to be unstable under working conditions [9,10]. Generally, a hydrated amorphous structure is more active but less stable, while the crystalline phase is less active but more stable [11]. In addition to the materials’ structures and properties, the working conditions such as the potential, temperature and turnover frequency (TOF) also influence the dissolution rate. So far, the understanding of dissolution behavior is based on data characterized by monitoring the change of catalysts and elements in an electrolyte [10,12]. However, the molecular-level understanding of catalyst dissolution under working conditions is still missing; thus, no clear rule has been proposed to select corrosion-resistant materials in catalyst design and preparation.
The working environment of water electrolysis can induce the transformation of active sites, such as oxidation/reduction and/or hydration/dehydration. The activity loss originates from the change of the binding energy of the reaction intermediates, which determines the intrinsic catalytic activity [13,14,15]. This type of degradation can be characterized by ex-situ surface science techniques. Catalyst particle growth is common with metal catalysts via dissolution and re-deposition. This mechanism can be revealed by detecting the morphology change of catalysts. The generation of a passivation layer usually causes a quick rise-up of overpotential, particularly in acidic OER electrodes, where the catalyst substrate (e.g., titanium) is prone to oxidation. Therefore, a stable anode requires a very compact catalyst coating to prevent the oxidation of the Ti substrate, as TiO2 is insulating [16]. The passivation layer formed on a glassy carbon electrode is the reason for the artifact in stability tests in OER [4].
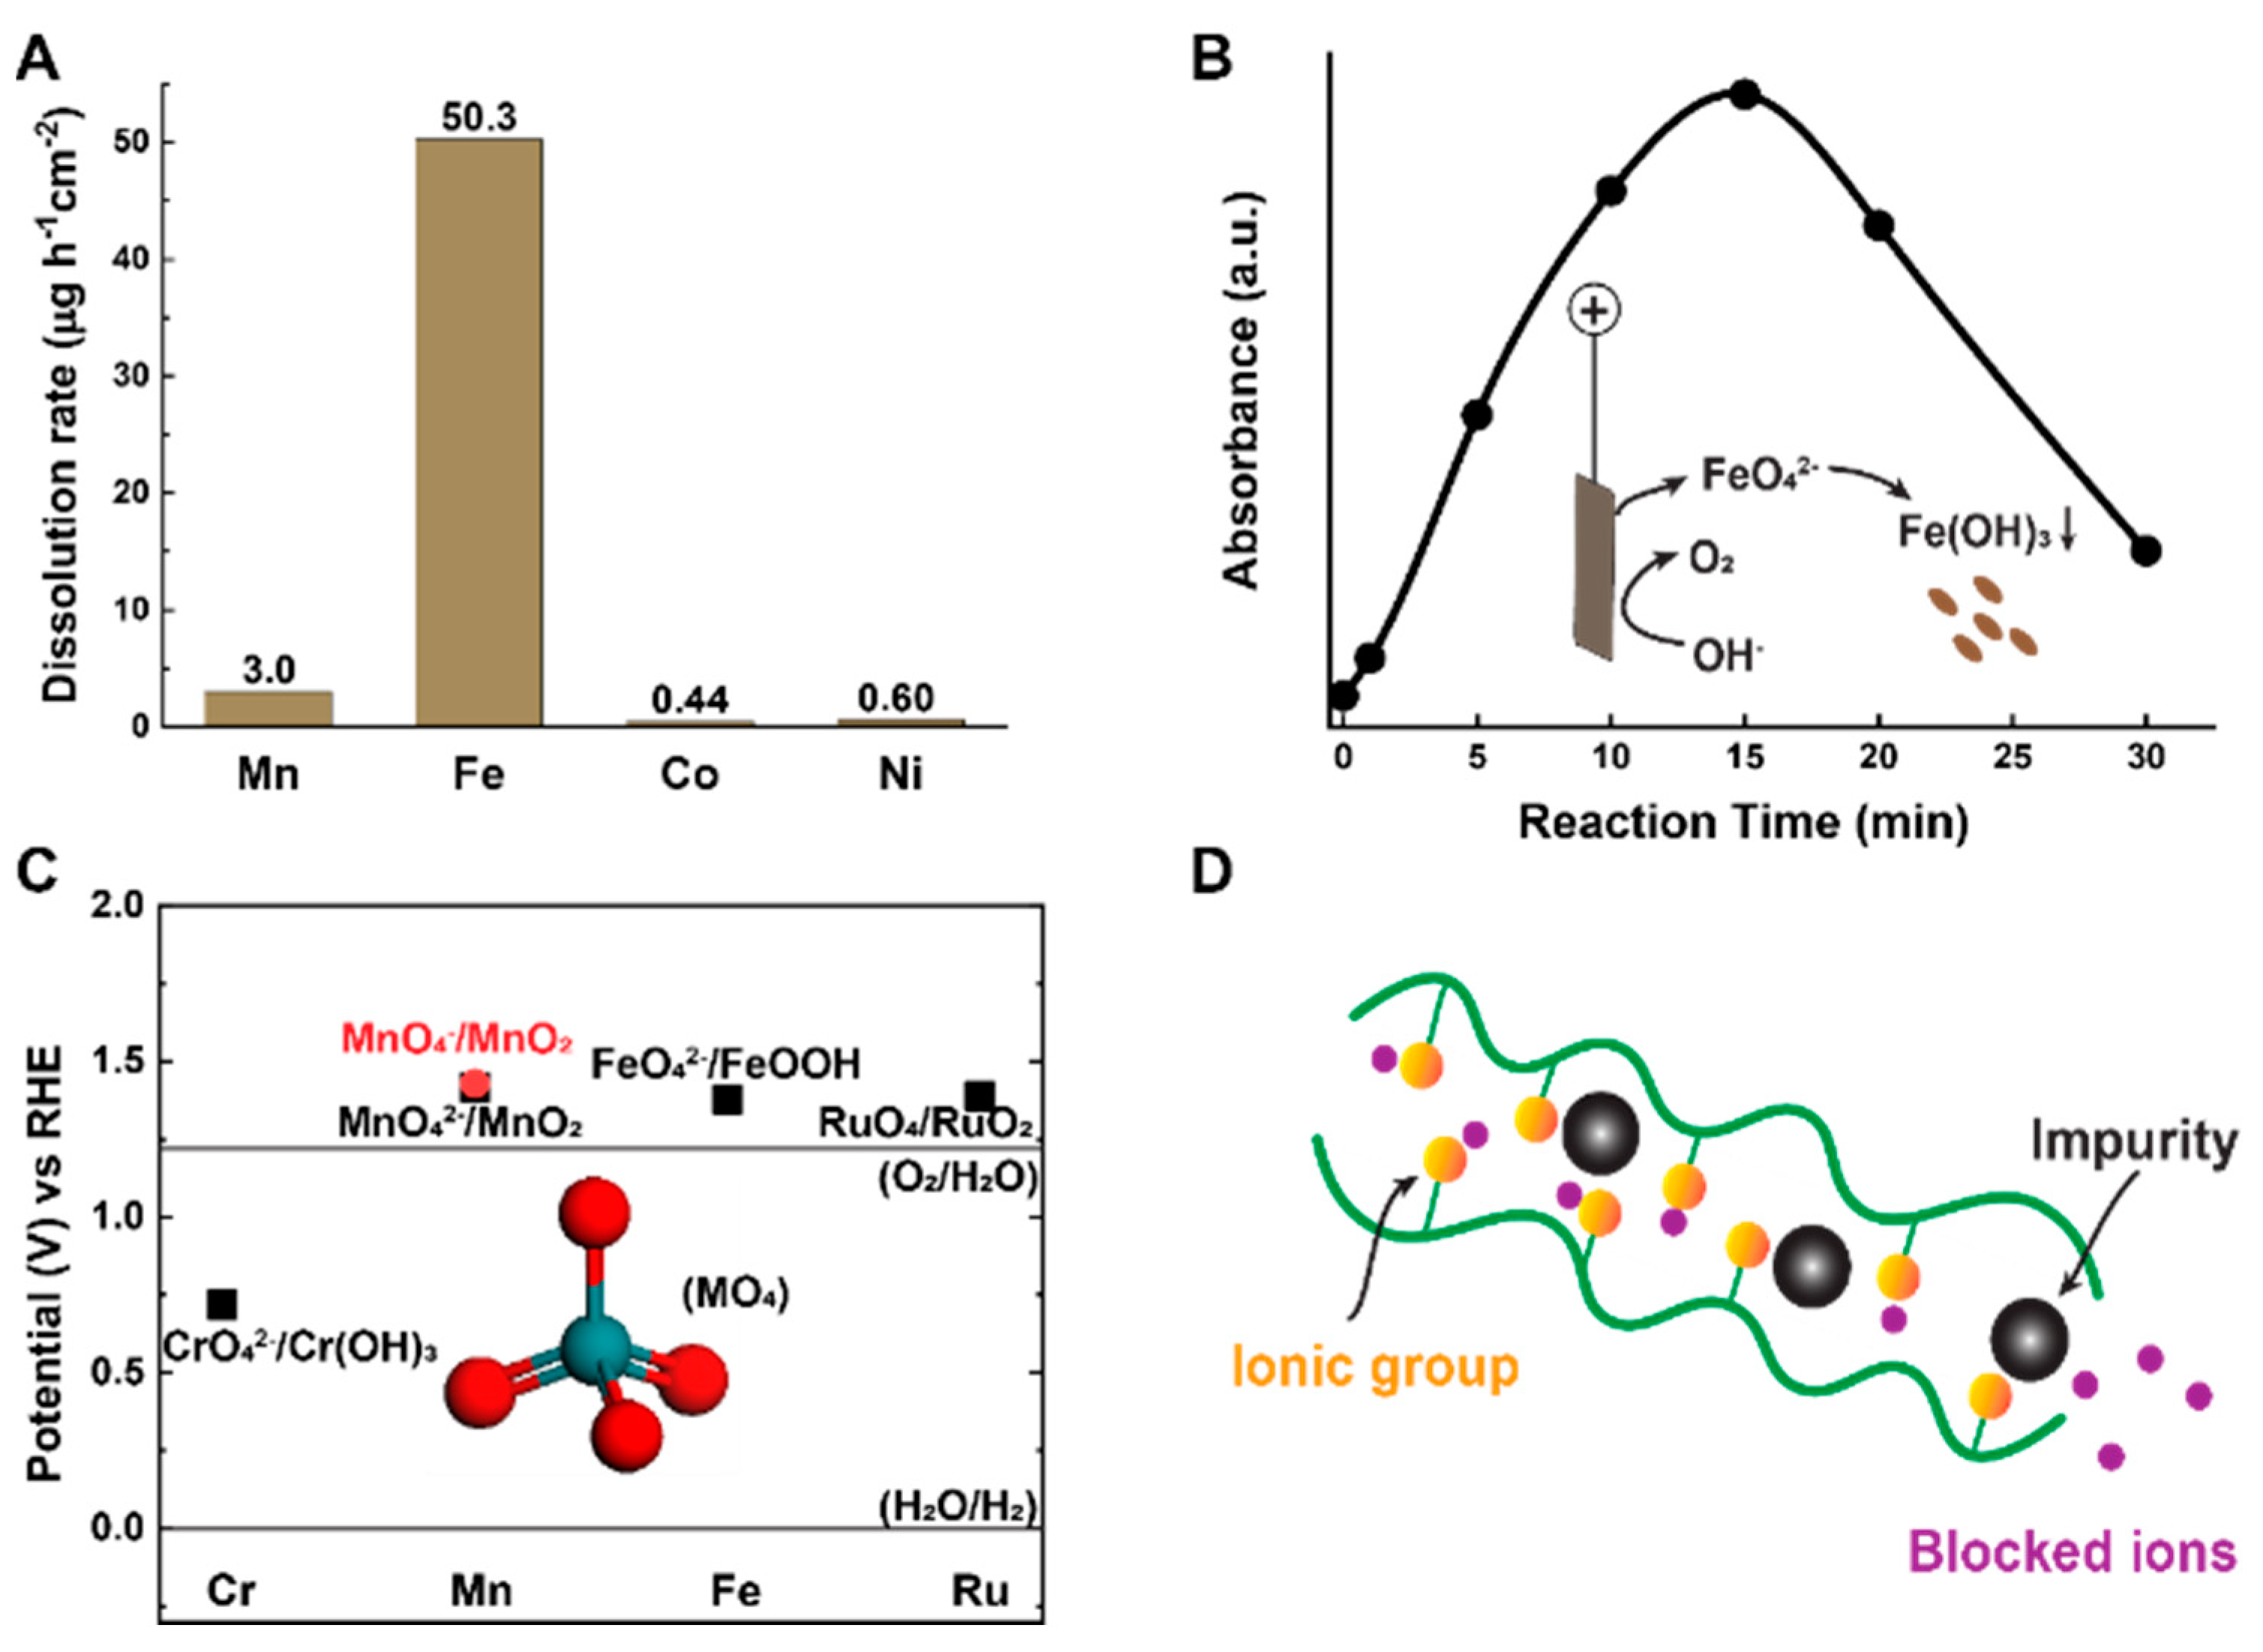
A practical consideration to reduce the catalyst cost is to develop 3d transition-metal based catalysts due to their high abundance [17,18]. However, the real stability of these catalysts is still under debate: some researchers have claimed the high stability of a catalyst [19], while others have demonstrated the rapid dissolution of the similar one [10,12]. Here, we provide a comparative study of the dissolution behavior in order to identify the intrinsic stability of the 3d transition metals in alkaline OER (see the experimental details in the Supplemental Information). Our data in Figure 1A shows that Mn and Fe dissolve rapidly, while Co and Ni are stable, which is consistent with the trend observed by Markovic et al. [20]. The dissolution rate differs by as much as two orders of magnitude. As a conclusion, Mn and Fe will have stability issues due to the tendency towards dissolution. Our observed dissolution trend can explain the selective leaching of Fe from a Ni-Fe oxide catalyst [12]. Then, a question arises: in which pathway or which form does the dissolution occur? Firstly, we can exclude the dissolution by low-valent (II, III) ions, as the solubility of the hydroxides formed in an alkaline solution is out of the detection limit of current ICP-MS (see a detailed explanation in the Supplemental Information). Based on our experimental observations, we believe that the dissolution occurs via the formation of soluble high-valent metal oxyanions (oxide) or colloid. This proposal was directly verified regarding Fe dissolution, where the FeO42− evolving from the electrode was detected by UV-vis spectroscopy (Figure 1B and Figure S2). The evolved FeO42− then decomposed into Fe(OH)3 precipitate in the electrolyte due to its low stability. The ease of the Fe dissolution via the FeO42− pathway can be explained by the thermodynamic potential of its redox. As illustrated in Figure 1C, the redox potential for the formation of soluble or volatile (MO4x−) for M = Fe, Cr, Mn and Ru overlaps with the working potential of OER [21]. Thus, these elements tend to be leached from catalysts during OER catalysis. The thermodynamic instability for the elements under OER working conditions would cause a stability issue in the catalysts, which should be paid special attention. Our study here provides an important guideline in catalyst design. Although Mn and Fe are two of the most commonly employed components for OER catalysts, their intrinsic instability should be paid great attention.
Besides the stability of the catalyst itself, a good catalyst should also work compatibly with the other elements in devices, particularly with the membrane. The membrane is another central part of electrolyzer; it selectively transports ions (i.e., H+ (H3O+) or OH−) and separates products (O2 and H2) to produce high-purity H2. Here, we discuss the ways in which the catalyst degradation influences the functionality of two types of membranes, i.e., the PEM (proton exchange membrane) and the AEM (anion exchange membrane). In principle, the PEM also allows the transportation of other cations besides protons, while the AEM can transport different types of anions. However, only H+ (H3O+) and OH− have the highest conductivity in the PEM and AEM, respectively. Therefore, the dissolved components of catalysts would exert a severe influence on the performance of the ionic conductivity and stability of membrane. For example, as was demonstrated in the PEMWE devices, a 10 ppm Fe3+ impurity in the water supply results in an increase of the cell voltage by 0.74 V [22,23,24]. Although stable electrochemical performances have been reported for many catalysts, the dissolved metal cations remain a potential problem. Similar effects also exist for the AEM, e.g., it has been demonstrated that a trace amount of CO2 can severely impair the performance of the AEM [25,26,27]. Because carbon materials are subject to corrosion, the compatibility of carbon catalysts and the catalysts supported on carbon need to be verified carefully in devices in the future. Additionally, the high-valent metal oxyanions are strong oxidants, which possibly cause the oxidative degradation of the AEM backbone and ionic group.
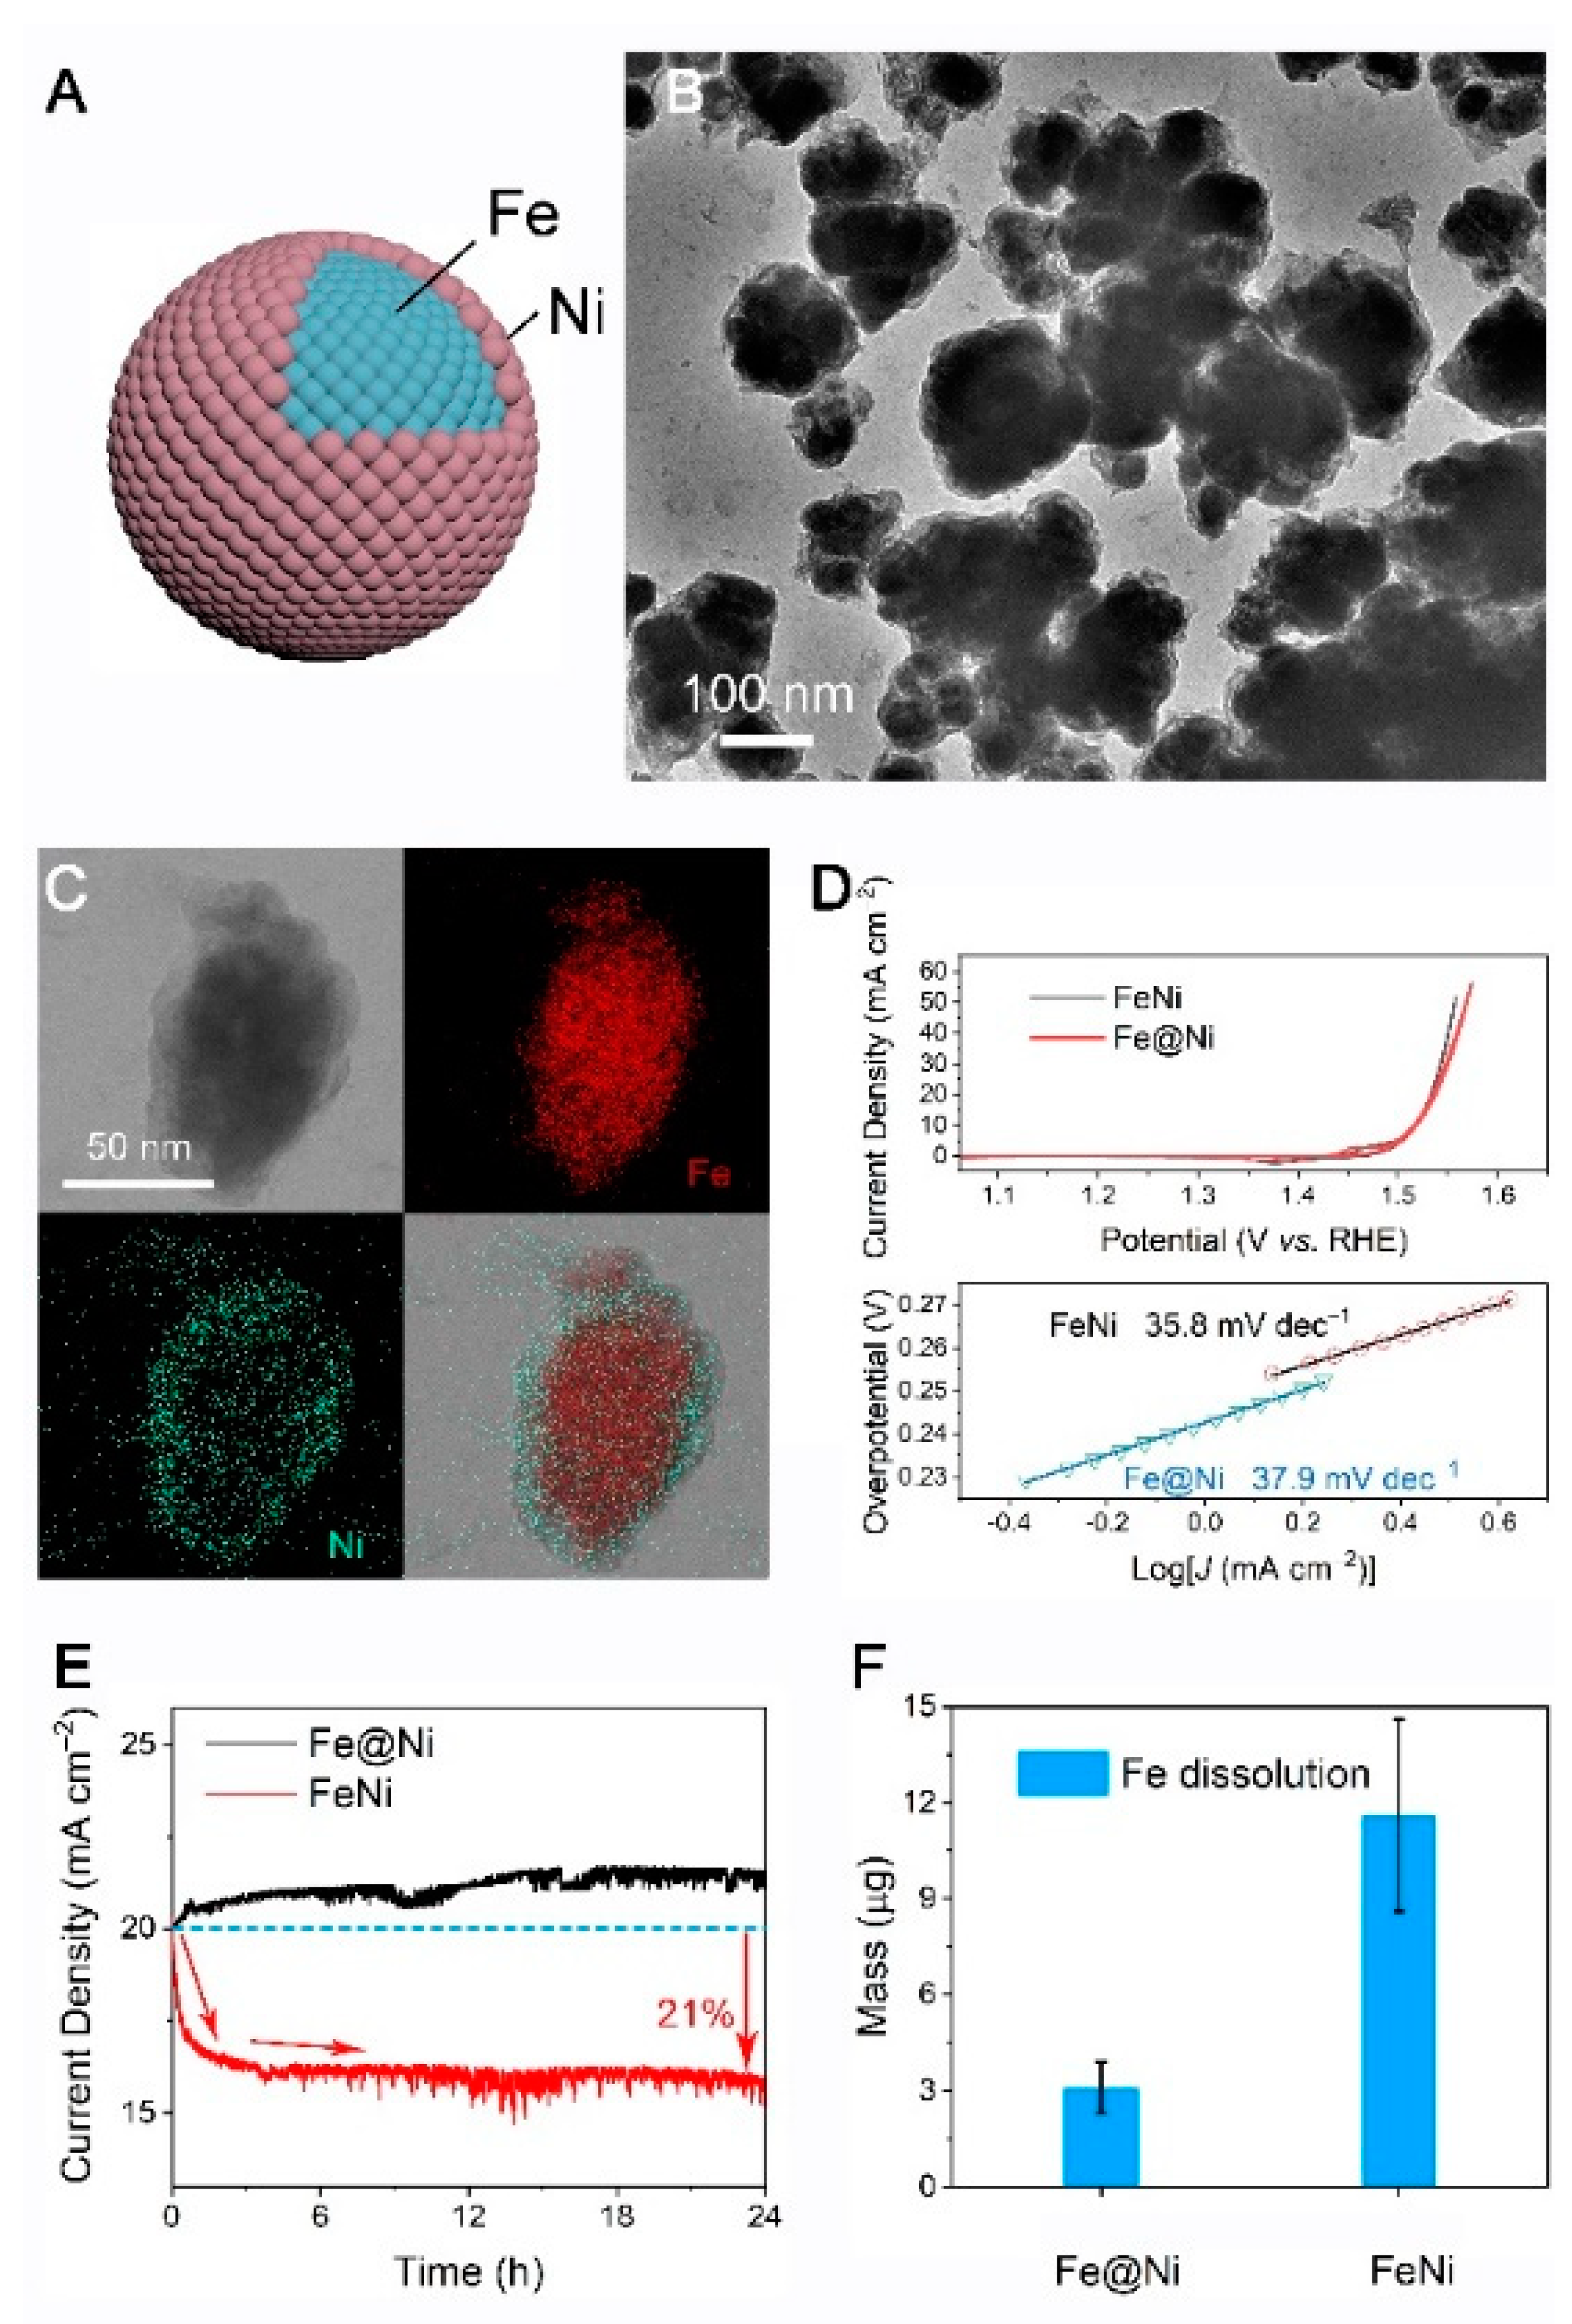
The experimental results confirmed our proposal. The core-shell catalyst Fe@Ni was synthesized using Ni to replace the outer layer of the Fe substrate (nanoparticles). The detailed synthesis process is described in the Supplemental Information. The elemental mappings, as displayed in Figure 2C, verify the core-shell structure of Fe@Ni. The core-shell Fe@Ni catalyst maintains the excellent activity of the regular FeNi catalyst: no significant difference in the polarization curve or Tafel slope (Figure 2D) was noticeable, and the catalytic activity of the Fe@Ni catalyst is also comparable to the reported FeNi catalyst in the literature [28,29,30,31]. In contrast, the stability of the Fe@Ni catalyst is much better than that of the FeNi with homogeneous composition, and no degradation was observed over a 24 h stability test, while the current of FeNi decreases rapidly and then approaches a stable value (Figure 2E). The polarization curves before and after the 24 h stability test (Figure S3) displayed the stability difference for the two kinds of catalysts: no significant change was observed on Fe@Ni, whereas the FeNi catalyst degraded dramatically. The Fe dissolution characterized by ICP-MS, as shown in Figure 2F, identified the origin of the stability difference: the Fe dissolves four times faster from regular FeNi compared to the core-shell Fe@Ni catalyst. The current variation profile of the FeNi catalyst is due to the leaching of the outer layer of Fe from catalyst, leaving a Ni-rich surface. Therefore, the FeNi catalyst generates a similar core-shell Fe@Ni structure during the course of the stability test. This degradation behavior verifies the success of our design principle in another aspect. Our designed Fe@Ni catalyst would be a practical catalyst for future water electrolyzer devices.
It is generally accepted that the ratio of Fe:Ni should be near 3:7 so that it can performs better activities. In contrast, the FeNi@Ni and Fe@Ni core-shell catalysts were contrasted in order to find a better catalyst, with better activity and durability. As is consistent with the forecast, FeNi@Ni shows a lower overpotential value than Fe@Ni at the same current density (Figure S4A), which is consequent with the increasing Ni proportion. Moreover, the Tafel slope exhibited an apparent decline with the rising ratio of Ni, showing that FeNi@Ni has better activities. In the research of OER and water splitting, the activity and stability contributed to the practical application significantly. Hence, the better activity of FeNi@Ni should be explored.
Figure S5A exhibits the X-ray diffraction pattern (XRD), which shows the amorphous structure of both FeNi and FeNi@Ni. It has been claimed that more active sites could be offered according to the amorphous structure. Simultaneously, the FeNi@Ni has a homogeneous diameter approaching 30 nm on average (Figure S5B). The surfactant-free and magnetic properties result in the accumulation of nanoparticles. The TEM pattern demonstrates the accumulated nanoparticles with the same diameter as the SEM pattern. Moreover, the selected area electron diffraction (SAED) further attested to the amorphous structure for FeNi@Ni. X-ray photoelectron spectroscopy (XPS) could reveal the information of the elements and the valence state information (Figure S5D). Obviously, the content of surface Fe has barely been attested. Considering the XPS depth detection of 2 nm, the weak peaks of Fe in Figure S5E should be expressed as the Fe component in the inner layer. These peaks are composed of metal Fe0 and oxidation Fe3+, displaying the oxidation of the Fe compound. As a contrast, the Ni 2p high-resolution XPS pattern displays obvious Ni compound peaks (Figure S5F) which are much sharper and more distinct, further confirming the Ni shell of the FeNi@Ni catalyst. In addition, XPS etching was used to further confirm the compounds in the different depths of the core-shell structure. The nanoparticle was etched about seven times, and every step was 2.88 nm. In the contrast pattern (Figure S6A), the original high-resolution Fe 2p XPS curve is mild, and there is no distinct peak. With the increasing depth, two peaks identifying Fe3+ and Fe0 apparently arise. Simultaneously, the separated patterns in the different steps display legible changes in detail (Figure S6B–G). The peaks at 707.4 and 711.4 eV corresponding to Fe0 and Fe3+ rise. However, the area of Fe0 increases while the area of Fe3+ is declines. This indicates that the main mode of existence of Fe is metal Fe and some oxidation Fe. Furthermore, the XPS contrast pattern for Ni exhibits more different and distinct phenomena (Figure S7A). The no etching curve exhibits one sharp peak in 856.5 eV representing the Ni2+ of NiO in 2p3/2, which means that the outer shell should be NiO resulting from the oxidation of Ni. In addition, with the etching depth increasing, the Ni2+ peak is declining to disappear, while there is revealed a new peak at 853.3 eV representing Ni0 of metal Ni in 2p3/2. In this case, the main inner Ni compounds should be metal Ni and a bit of oxidation Ni. Moreover, the separated contrast patterns in the different steps are demonstrated in Figure S7B–G. This etching test summarizes the identification of the average element ratio from shell to core. From Figure S8, the shell should be less than 2 nm. As described in the pattern, the ratio of Ni:Fe is nearly 0.92:0.08 at the beginning. Besides this, the Ni:Fe ratio will be become a constant proportion of 0.75:0.25 after the etching steps, demonstrating a core shell structure of FeNi@Ni.
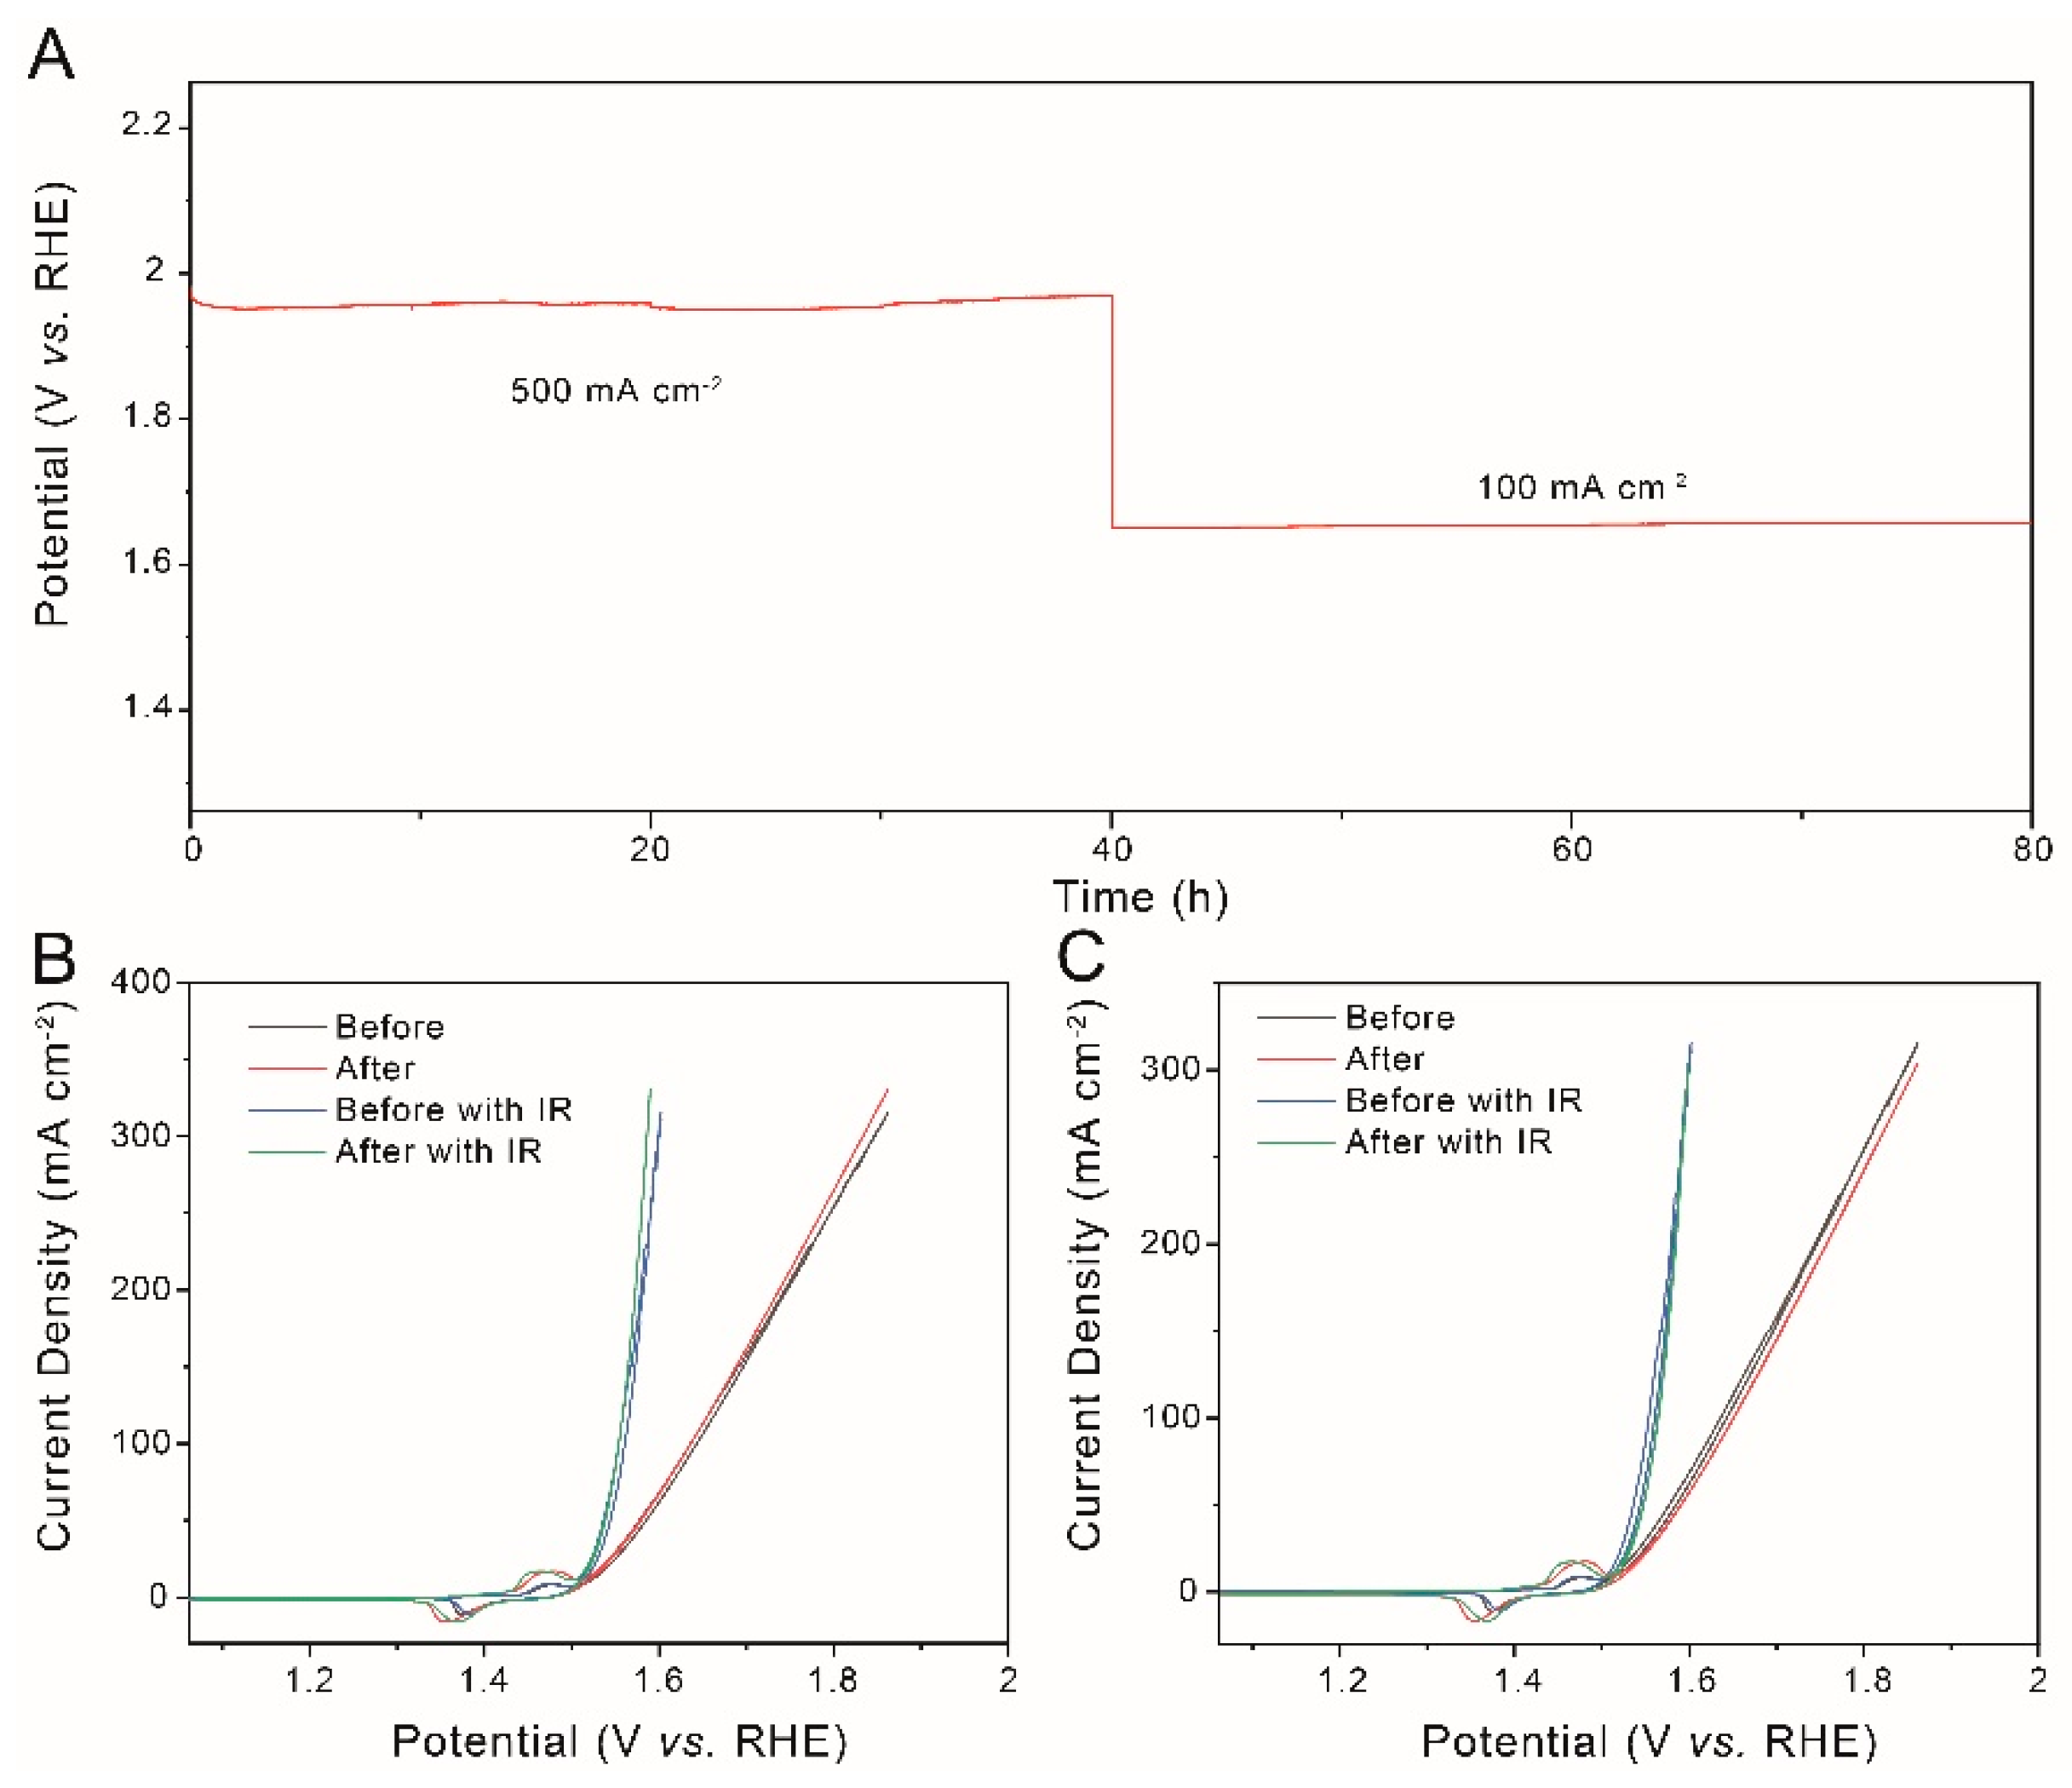
The operation expression at a high current density in a three-electrode system is the priority reflection for practical application. FeNi@Ni catalysts were loaded onto nickel foam (NF) for further testing at room temperature. The linear sweep voltammetry (LSV) curves display an excellent OER performance, and only need 345 mV overpotential with IR correction to reach 300 mA cm−2. The Tafel slope is about 36.7 mV dec−1, expressing the third step as a rate-determining step (RDS). Besides this, after the circle voltammetry (CV) test, the double-layer capacitance was about 7.47 mF cm−2. Despite the excellent catalysis activity, the most important consideration point is the durability of catalysts. Figure 3 illustrates the chronopotentiometry test at different current densities, and the corresponding CV curves. Significantly, there was no decline during the 80 h stability test. Likewise, the before and after CV curves also exhibit tiny changes no matter whether they are 500 or 100 mA cm−2, showing the brilliant durability and stability at low current density. The average current density is about 0.2 to 0.4 A cm−2 for practical alkaline electrolysis. However, for next-generation anion exchange membrane (AEM) electrolysis, the processing current density should reach at least 1 A cm−2. Thus, the high current density operation indicators should be considered and verified. Figure S9 illustrates the high current density test for both the FeNi and FeNi@Ni catalysts. According to the conclusion from the chronopotentiometry and LSV test, FeNi@Ni exhibits better durability and activity than the FeNi catalyst. Likewise, the ICP results and the comparison of the counter electrodes identify the impressive decline of the dissolution, especially for perishable Fe.
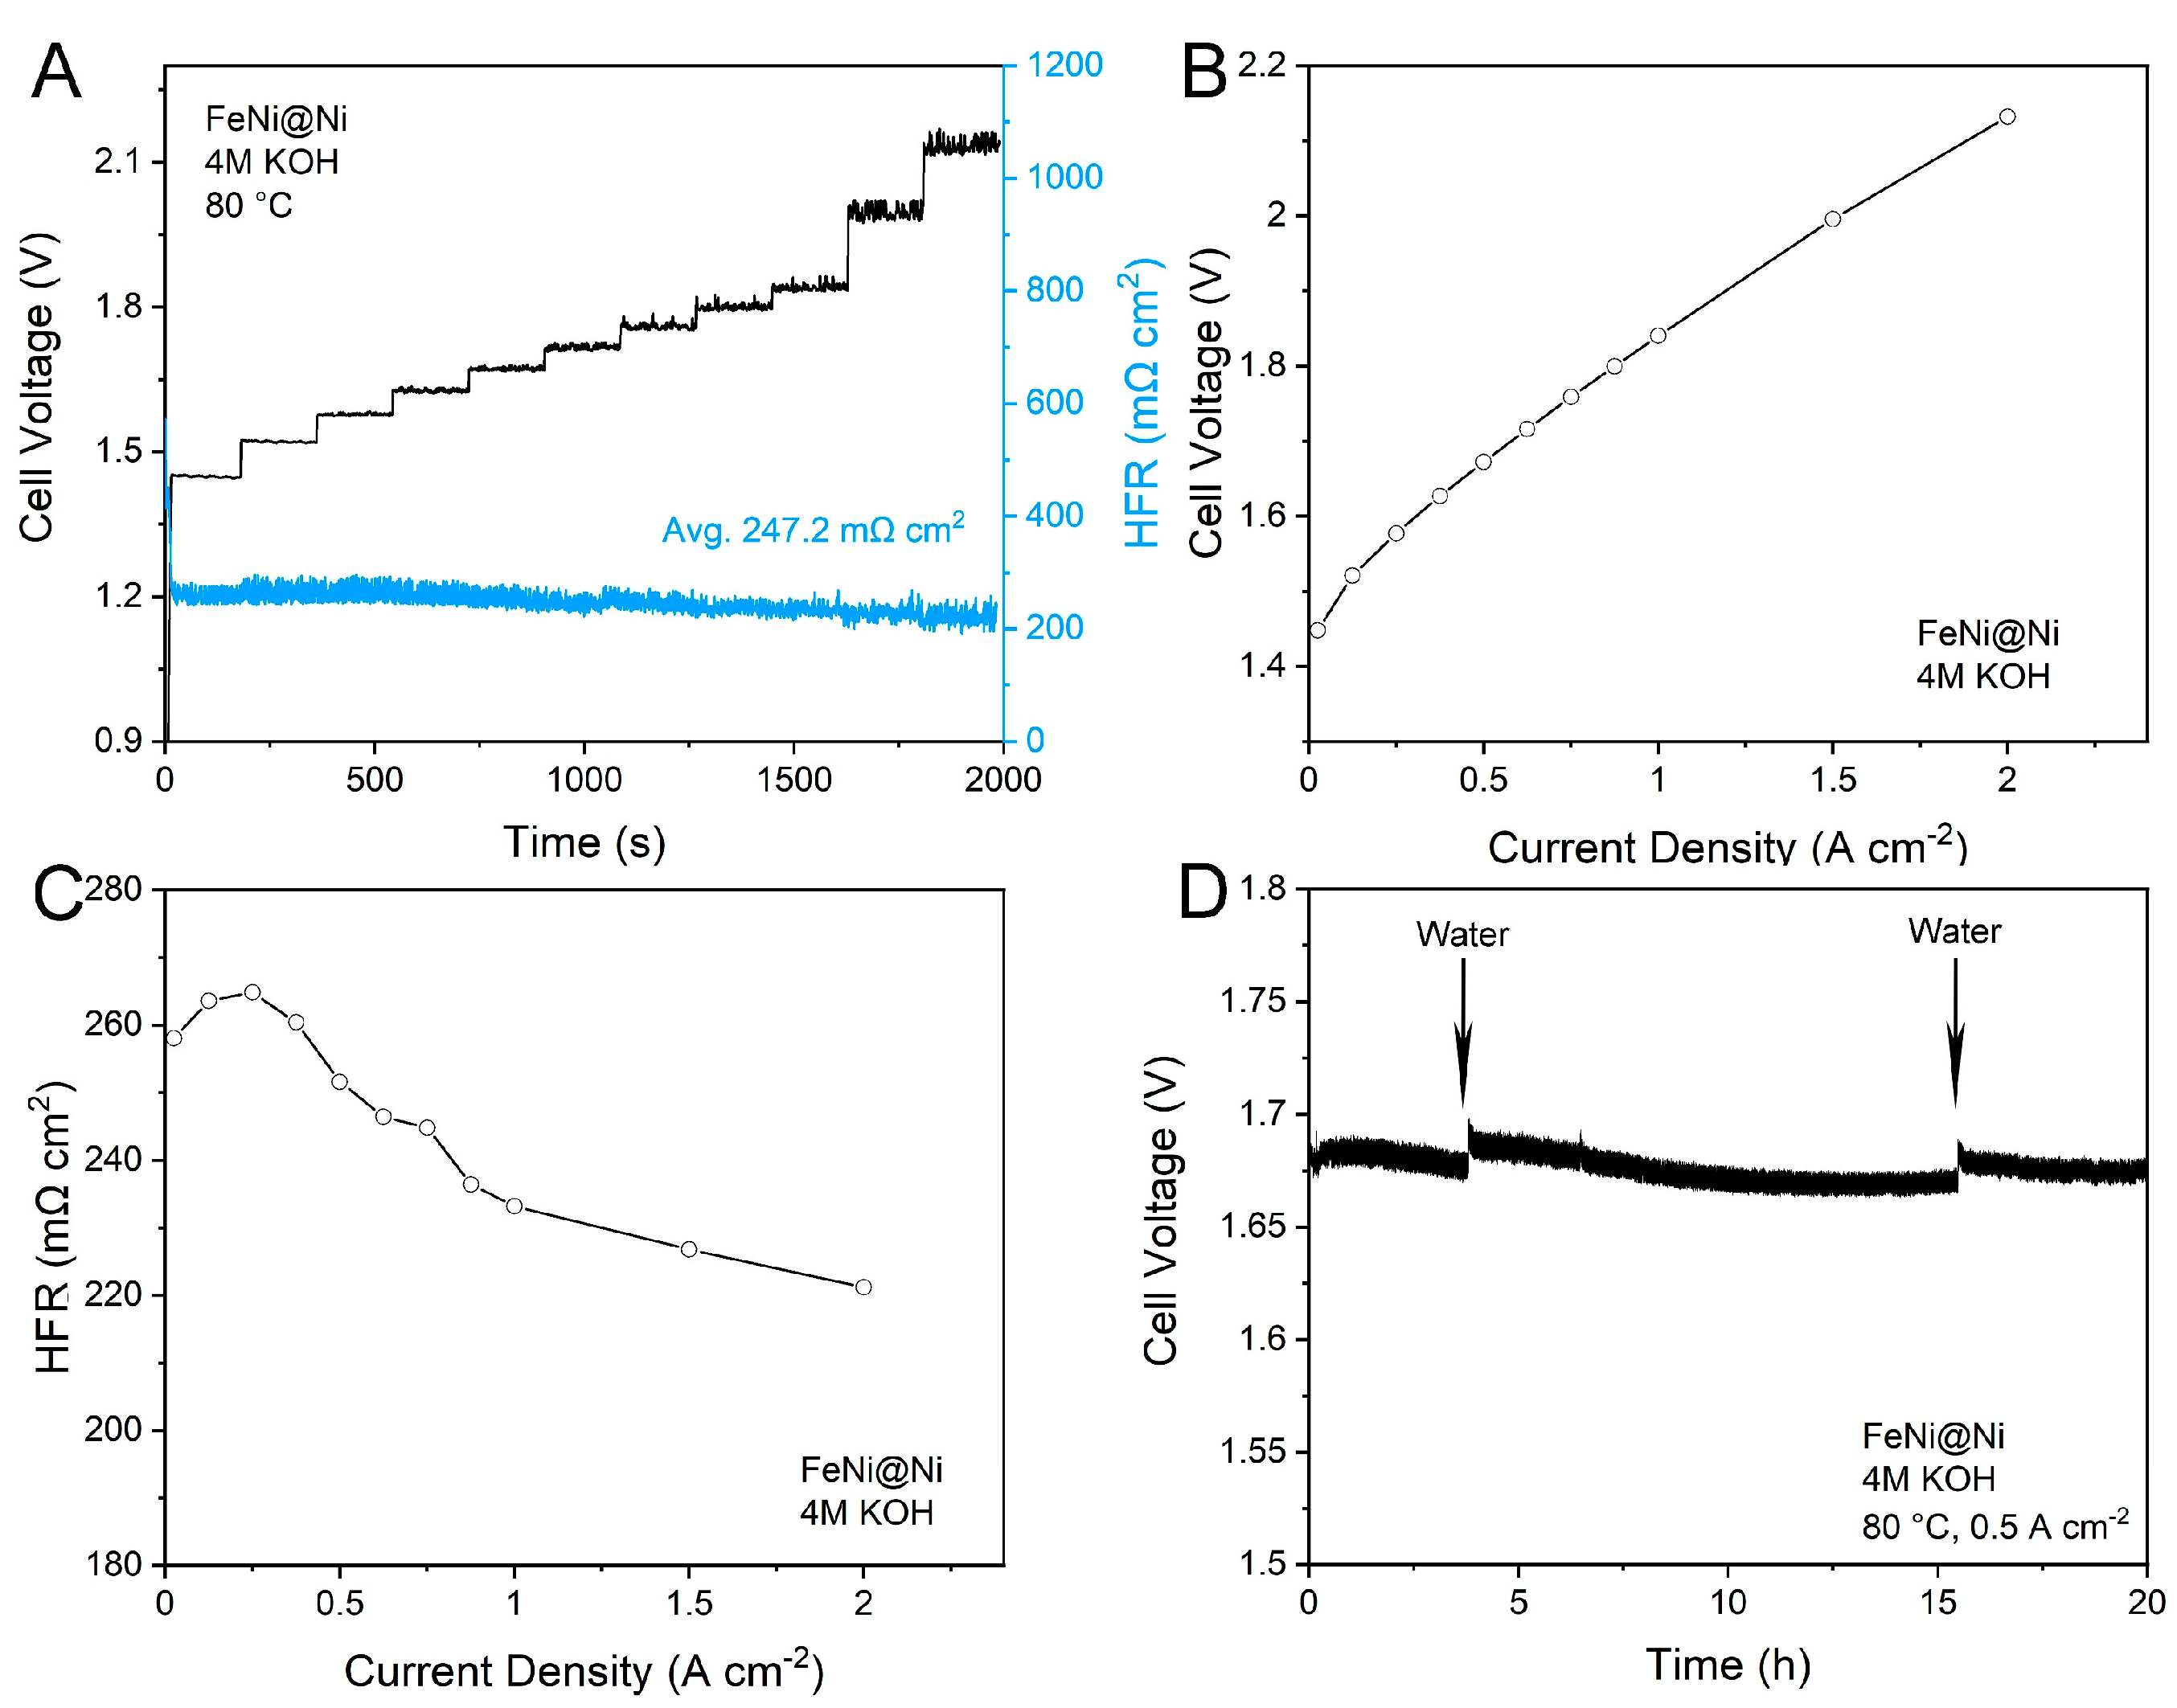
The AEM electrolyzer is competitive with next-generation water-splitting reactors, which contain the advantages of a PEM electrolyzer as well as the economical feature of ordinary alkaline electrolysis. In this study, an AEM single cell test was used to verify the application probability of the designed electrocatalyst. Commercial FAA-3 worked as anion exchange membrane for the exchange of the OH− ions. As illustrated in Figure S10, when operating in the 1 A cm−2 current density, the cell voltage reached just 1.64 V. Notably, the loads of FeNi@Ni and Pt/C (60%) are 3 and 0.5 mg cm−2. As the Hofmann degradation described, the OH− ions will inactive the quaternary ammonium membrane, especially at high temperatures. Therefore, the durability test in Figure S10D demonstrates a rising curve, demonstrating an instable membrane or electrocatalyst. Considering the possibility of membrane deactivation, the anion exchange membrane had to be altered to a stable one. In contrast, the changed membrane is stable but has high resistance. As illustrated in Figure 4, despite operating in a 4M KOH electrolyte, the high frequency resistance (HFR) was still maintained at about 247.2 mΩ cm−2. Consequently, the cell voltage was raised to 1.84 V when the operation current density was 1 A cm−2. Likewise, as was attributed to the stable AEM, the stability test of FeNi@Ni using a single cell illustrates the impressive stability which was identified as a perspective of the practical application.
3. Conclusions
The stability of the catalyst is an important property in practical considerations for industrial applications. However, many stability characterizations based on a simple trial-and-error method cannot formulate predictive rules for the rapid screening of robust catalysts. Instead, we suggest that more attention should be paid to revealing the fundamental rules of catalyst stability. Our study here shows that Mn and Fe are intrinsically unstable under the working conditions of OER, whereas Co and Ni are very stable. Based on this trend, we design a Fe@Ni core-shell catalyst that is able to achieve high stability in water electrolysis while maintaining excellent OER activity simultaneously. This work demonstrates the power of the rational catalyst design of stable catalysts based on a clear understanding of the catalyst degradation pathway.
Supplementary Materials
The following are available online at https://0-www-mdpi-com.brum.beds.ac.uk/article/10.3390/catal12020204/s1. Table S1. Calculated solubility of hydroxide for various 3d transition metals; Table S2. ICP-MS results of the dissolved 3d transition metals; Figure S1. Comparison between ICP-MS results with the solubility of metal hydroxides. The solubility of the metal hydroxides are orders of magnitude lower than the sensitivity of ICP-MS, im-plying that the dissolved metals should not be in the form of metal hydroxides; Figure S2. Detection of FeO42− evolved from Fe electrode in OER by UV-vis spectroscopy. The maximum absorption occurs around 510 nm. The absorption increases from the start of reaction, and then de-creases over time; Figure S3. LSV curves before and after 24 h chronopotentiometry test of Fe@Ni (A) and FeNi (B); Figure S4. LSV curves of Fe@Ni and FeNi@Ni (A) and corresponding Tafel slope (B); Figure S5. X-ray diffraction pattern for FeNi and FeNi@Ni (A). The SEM image for FeNi@Ni catalysts (B). The TEM and SAED image (C). Corresponding XPS and high-resolution Fe 2p and Ni 2p XPS patterns (D). Figure S6. XPS etching test for FeNi@Ni catalysts. The comparison of high-resolution Fe 2p XPS curves in different etching step (A), 2.88 nm etching (B), 5.76 nm etching (C), 8.64 nm etching (D), 11.52 nm etching (E), 14.40 nm etching (F), 17.28 nm etching (G); Figure S7. XPS etching test for FeNi@Ni catalysts. The comparison of high-resolution Ni 2p XPS curves in different etching step (A), 2.88 nm etching (B), 5.76 nm etching (C), 8.64 nm etching (D), 11.52 nm etching (E), 14.40 nm etching (F), 17.28 nm etching (G); Figure S8. The contrast of Ni and Fe content in FeNi@Ni structure with different depth; Figure S9. The chronopotentiometry test at current density of 1 A cm−2 for FeNi (A) and FeNi@Ni (D), the cor-responding before and after CV curves (B,E), the ICP test for Fe and Ni dissolution; Figure S10. AEMWEs performance at 80 °C and 4M KOH. (A,B) Polarization curve of AEMWE single cell with FeNi@Ni anode coupled with commercial Pt/C (60%) cathode. (C) The HFR pattern for single cell. (D) Stability test for single cell at cell voltage of 1 A cm−2 [32,33,34].
Author Contributions
Conceptualization, X.W. and H.T.; methodology, X.W.; software, J.Z.; validation, S.B., X.W. and H.T.; formal analysis, H.T.; investigation, H.T.; resources, H.T.; data curation, X.W.; writing—original draft preparation, H.T.; writing—review and editing, X.W.; visualization, X.W.; supervision, H.T.; project administration, H.T.; funding acquisition, H.T. All authors have read and agreed to the published version of the manuscript.
Funding
This work was supported by the Science and Technology Projects of the Innovation Laboratory for Sciences and Technologies of Energy Materials of Fujian Province (IKKEM).
Data Availability Statement
Please see the data supporting at https://susy.mdpi.com/user/manuscripts/displayFile/c6c0e967b56b737b12313f60270109df/supplementary.
Conflicts of Interest
The authors declare no conflict of interest.
Abbreviations
| ICP-MS: | inductively coupled plasma mass spectrometry |
| SEM: | scanning electron microscopy |
| UV-vis spectroscopy: | ultraviolet–visible spectroscopy |
| XPS: | X-ray photoelectron spectroscopy |
| XRD: | X-ray diffraction |
| IL-TEM: | identical location TEM |
| EIS: | electrochemical impedance spectroscopy |
References
- Greeley, J.; Markovic, N.M. The road from animal electricity to green energy: Combining experiment and theory in electrocatalysis. Energy Environ. Sci. 2012, 5, 9246–9256. [Google Scholar] [CrossRef]
- Mergel, J.; Carmo, M.; Fritz, D.; Stolten, D. Transition to Renewable Energy Systems; Stolten, D., Scherer, V., Eds.; Wiley: New York, NY, USA, 2013; pp. 423–450. [Google Scholar]
- Frydendal, R.; Paoli, E.A.; Knudsen, B.P.; Wickman, B.; Malacrida, P.; Stephens, I.E.L.; Chorkendorff, I. Benchmarking the stability of oxygen evolution reaction catalysts: The importance of monitoring mass losses. ChemElectroChem 2014, 1, 2075–2081. [Google Scholar] [CrossRef] [Green Version]
- Geiger, S.; Kasian, O.; Mingers, A.M.; Nicley, S.S.; Haenen, K.; Mayrhofer, K.J.J.; Cherevko, S. Catalyst stability benchmarking for the oxygen evolution reaction: The importance of backing electrode material and dissolution in accelerated aging studies. ChemSusChem 2017, 10, 4140–4143. [Google Scholar] [CrossRef] [PubMed]
- Cherevko, S. Stability and dissolution of electrocatalysts: Building the bridge between model and “real world” systems. Curr. Opin. Electrochem. 2018, 8, 118–125. [Google Scholar] [CrossRef]
- Kasian, O.; Grote, J.-P.; Geiger, S.; Cherevko, S.; Mayrhofer, K.J.J. The common intermediates of oxygen evolution and dissolution reactions during water electrolysis on iridium. Angew. Chem. Int. Ed. 2018, 57, 2488–2491. [Google Scholar] [CrossRef] [PubMed]
- Cherevko, S.; Geiger, S.; Kasian, O.; Kulyk, N.; Grote, J.-P.; Savan, A.; Shrestha, B.R.; Merzlikin, S.; Breitbach, B.; Ludwig, A.; et al. Oxygen and hydrogen evolution reactions on Ru, RuO2, Ir, and IrO2 thin film electrodes in acidic and alkaline electrolytes: A comparative study on activity and stability. Catal. Today 2016, 262, 170–180. [Google Scholar] [CrossRef]
- Brightman, E.; Dodwell, J.; van Dijk, N.; Hinds, G. In situ characterisation of PEM water electrolysers using a novel reference electrode. Electrochem. Commun. 2015, 52, 1–4. [Google Scholar] [CrossRef]
- Danilovic, N.; Subbaraman, R.; Chang, K.C.; Chang, S.H.; Kang, Y.J.; Snyder, J.; Paulikas, A.P.; Strmcnik, D.; Kim, Y.T.; Myers, D.; et al. Activity-stability trends for the oxygen evolution reaction on monometallic oxides in acidic environments. J. Phys. Chem. Lett. 2014, 5, 2474–2478. [Google Scholar] [CrossRef]
- Chen, R.; Hung, S.F.; Zhou, D.; Gao, J.; Yang, C.; Tao, H.; Yang, H.B.; Zhang, L.; Zhang, L.; Xiong, Q.; et al. Layered structure causes bulk nife layered double hydroxide unstable in alkaline oxygen evolution reaction. Adv. Mater. 2019, 31, 1903909. [Google Scholar] [CrossRef]
- Cherevko, S.; Reier, T.; Zeradjanin, A.R.; Pawolek, Z.; Strasser, P.; Mayrhofer, K.J.J. Stability of nanostructured iridium oxide electrocatalysts during oxygen evolution reaction in acidic environment. Electrochem. Commun. 2014, 48, 81–85. [Google Scholar] [CrossRef] [Green Version]
- Speck, F.D.; Dettelbach, K.E.; Sherbo, R.S.; Salvatore, D.A.; Huang, A.; Berlinguette, C.P. On the electrolytic stability of iron-nickel oxides. Chem 2017, 2, 590–597. [Google Scholar] [CrossRef] [Green Version]
- Kasian, O.; Geiger, S.; Mayrhofer, K.J.J.; Cherevko, S. Electrochemical on-line ICP-MS in electrocatalysis research. Chem. Rec. 2018, 19, 2130–2142. [Google Scholar] [CrossRef] [PubMed]
- Tao, H.B.; Zhang, J.; Chen, J.; Zhang, L.; Xu, Y.; Chen, J.G.; Liu, B. Revealing energetics of surface oxygen redox from kinetic fingerprint in oxygen electrocatalysis. J. Am. Chem. Soc. 2019, 141, 13803–13811. [Google Scholar] [CrossRef] [PubMed]
- Tao, H.B.; Xu, Y.; Huang, X.; Chen, J.; Pei, L.; Zhang, J.; Chen, J.G.; Liu, B. A general method to probe oxygen evolution intermediates at operating conditions. Joule 2019, 3, 1498–1509. [Google Scholar] [CrossRef]
- Kariman, A.; Marshall, A.T. Improving the stability of DSA electrodes by the addition of TiO2 nanoparticles. J. Electrochem. Soc. 2019, 166, E248–E251. [Google Scholar] [CrossRef]
- Tao, H.B.; Fang, L.; Chen, J.; Yang, H.B.; Gao, J.; Miao, J.; Chen, S.; Liu, B. Identification of surface reactivity descriptor for transition metal oxides in oxygen evolution reaction. J. Am. Chem. Soc. 2016, 138, 9978–9985. [Google Scholar] [CrossRef]
- Subbaraman, R.; Tripkovic, D.; Chang, K.-C.; Strmcnik, D.; Paulikas, A.P.; Hirunsit, P.; Chan, M.; Greeley, J.; Stamenkovic, V.; Markovic, N.M. Trends in activity for the water electrolyser reactions on 3d M(Ni, Co, Fe, Mn) hydr(oxy)oxide catalysts. Nat. Mater. 2012, 11, 550–557. [Google Scholar] [CrossRef] [PubMed]
- Roy, C.; Sebok, B.; Scott, S.B.; Fiordaliso, E.M.; Sørensen, J.E.; Bodin, A.; Trimarco, D.B.; Damsgaard, C.D.; Vesborg, P.C.K.; Hansen, O.; et al. Impact of nanoparticle size and lattice oxygen on water oxidation on NiFeOxHy. Nat. Catal. 2018, 1, 820–829. [Google Scholar] [CrossRef]
- Chung, D.Y.; Lopes, P.P.; Martins, P.F.B.D.; He, H.; Kawaguchi, T.; Zapol, P.; You, H.; Tripkovic, D.; Strmcnik, D.; Zhu, Y.; et al. Dynamic stability of active sites in hydr(oxy)oxides for the oxygen evolution reaction. Nat. Energy 2020, 5, 222–230. [Google Scholar] [CrossRef]
- Wiberg, E.; Nils Wiberg, N.; Holleman, A.F. Inorganic Chemistry; Academic Press: New York, NY, USA, 2001. [Google Scholar]
- Li, N.; Araya, S.S.; Kær, S.K. The effect of Fe3+ contamination in feed water on proton exchange membrane electrolyzer performance. Int. J. Hydrog. Energy 2019, 44, 12952–12957. [Google Scholar] [CrossRef]
- Frensch, S.H.; Serre, G.; Fouda-Onana, F.; Jensen, H.C.; Christensen, M.L.; Araya, S.S.; Kær, S.K. Impact of iron and hydrogen peroxide on membrane degradation for polymer electrolyte membrane water electrolysis: Computational and experimental investigation on fluoride emission. J. Power Sources 2019, 420, 54–62. [Google Scholar] [CrossRef]
- Li, N.; Araya, S.S.; Kær, S.K. Long-term contamination effect of iron ions on cell performance degradation of proton exchange membrane water electrolyser. J. Power Sources 2019, 434, 226755. [Google Scholar] [CrossRef]
- Suzuki, S.; Muroyama, H.; Matsui, T.; Eguchi, K. Influence of CO2 dissolution into anion exchange membrane on fuel cell performance. Electrochim. Acta 2013, 88, 552–558. [Google Scholar] [CrossRef]
- Matsui, Y.; Saito, M.; Tasaka, A.; Inaba, M. Influence of carbon dioxide on the performance of anion-exchange membrane fuel cells. ECS Trans. 2010, 25, 105–110. [Google Scholar] [CrossRef]
- Ziv, N.; Mondal, A.N.; Weissbach, T.; Holdcroft, S.; Dekel, D.R. Effect of CO2 on the properties of anion exchange membranes for fuel cell applications. J. Membr. Sci. 2019, 586, 140–150. [Google Scholar] [CrossRef]
- Trotochaud, L.; Young, S.L.; Ranney, J.K.; Boettcher, S.W. Nickel–iron oxyhydroxide oxygen-evolution electrocatalysts: The role of intentional and incidental iron incorporation. J. Am. Chem. Soc. 2014, 136, 6744–6753. [Google Scholar] [CrossRef] [PubMed]
- Burke, M.S.; Kast, M.G.; Trotochaud, L.; Smith, A.M.; Boettcher, S.W. Cobalt–iron (oxy)hydroxide oxygen evolution electrocatalysts: The role of structure and composition on activity, stability, and mechanism. J. Am. Chem. Soc. 2015, 137, 3638–3648. [Google Scholar] [CrossRef] [Green Version]
- Swierk, J.R.; Klaus, S.; Trotochaud, L.; Bell, A.T.; Tilley, T.D. Electrochemical study of the energetics of the oxygen evolution reaction at nickel iron (oxy)hydroxide catalysts. J. Phys. Chem. C 2015, 119, 19022–19029. [Google Scholar] [CrossRef] [Green Version]
- Zhou, D.; Wang, S.; Jia, Y.; Xiong, X.; Yang, H.; Liu, S.; Tang, J.; Zhang, J.; Liu, D.; Zheng, L.; et al. NiFe hydroxide lattice tensile strain: Enhancement of adsorption of oxygenated intermediates for efficient water oxidation catalysis. Angew. Chem. Int. Ed. 2019, 58, 736–740. [Google Scholar] [CrossRef]
- Subbaraman, R.; Danilovic, N.; Lopes, P.P.; Tripkovic, D.; Strmcnik, D.; Stamenkovic, V.R.; Markovic, N.M. Origin of anomalous activities for electrocatalysts in alkaline electrolytes. J. Phys. Chem. C 2012, 116, 22231–22237. [Google Scholar] [CrossRef]
- Bielski, B.H.J.; Thomas, M.J. Studies of hypervalent iron in aqueous solutions. 1. Radiation-induced reduction of iron(VI) to iron(V) by CO2. J. Am. Chem. Soc. 1987, 109, 7761–7764. [Google Scholar] [CrossRef]
- Haynes, W.M. CRC Handbook of Chemistry and Physics; CRC Press: Boca Raton, FL, USA, 2014. [Google Scholar]
Figure 1.
Characterization of the dissolution of 3d transition-metal catalysts, and the mechanistic analysis. (A) Dissolution rate of 3d transition metals during OER. (B) Identification of the Fe dissolution pathway. The concentration of FeO42− increases rapidly at the beginning of OER, and declines over time. The inset illustrates the route of Fe dissolution: soluble FeO42− is generated under the OER working potential and is leached from the electrode, then FeO42− decomposes in the solution to form an Fe(OH)3 precipitate. (C) Potential diagrams of the redox responsible for the element dissolution. (D) Illustration of the declined ionic conductivity of the membrane due to the influence of impurity.

Figure 2.
Design of a stable Fe@Ni catalyst for OER. (A) Conceptual design of the catalyst structure. An outer layer of Ni acts as protective layer for the underlying Fe, while their electronic interaction ensures the optimal binding energy of oxygen intermediates on the surface Ni layer. (B) Transmission electron microscopy (TEM) image of the as-synthesized Fe@Ni catalyst. (C) Elemental mappings of the Fe@Ni catalyst. (D) Electrochemical kinetics of Fe@Ni in OER catalysis. (E) Stability comparison between Fe@Ni and the regular FeNi catalyst in OER. (F) Comparison of the Fe dissolution between Fe@Ni and FeNi after the stability test.

Figure 3.
The chronopotentiometry test at current densities of 500 mA cm−2 and 100 mA cm−2 (A), and the corresponding before-and-after CV curves (B,C).
Figure 3.
The chronopotentiometry test at current densities of 500 mA cm−2 and 100 mA cm−2 (A), and the corresponding before-and-after CV curves (B,C).

Figure 4.
AEMWEs performance at 80 °C and 4M KOH. (A,B) Polarization curve of an AEMWE single cell with an FeNi@Ni anode coupled with a commercial Pt/C (60%) cathode. (C) The HFR pattern for a single cell. (D) The stability test for a single cell at a cell voltage of 0.5 A cm−2.
Figure 4.
AEMWEs performance at 80 °C and 4M KOH. (A,B) Polarization curve of an AEMWE single cell with an FeNi@Ni anode coupled with a commercial Pt/C (60%) cathode. (C) The HFR pattern for a single cell. (D) The stability test for a single cell at a cell voltage of 0.5 A cm−2.


Table 1.
Typical degradation mechanism of catalysts and the recommended characterization techniques.
Table 1.
Typical degradation mechanism of catalysts and the recommended characterization techniques.
| Degradation Mechanism | Characterization Techniques | Signals in Characterization |
|---|---|---|
| Dissolution | ICP-MS, SEM, UV-vis spectroscopy | Morphology, surface area |
| Active site transformation | XPS, XRD | Chemical reactivity of active site |
| Particle growth | TEM, SEM | Morphology, surface area |
| Hydrogen embrittlement | EIS, SEM | Loss in electrical conductivity |
Abbreviation: ICP-MS: inductively coupled plasma mass spectrometry; SEM: scanning electron microscopy; UV-vis spectroscopy: Ultraviolet–visible spectroscopy; XPS: X-ray photoelectron spectroscopy; XRD: X-ray diffraction; IL-TEM: identical location TEM; and EIS: electrochemical impedance spectroscopy.
Publisher’s Note: MDPI stays neutral with regard to jurisdictional claims in published maps and institutional affiliations. |
© 2022 by the authors. Licensee MDPI, Basel, Switzerland. This article is an open access article distributed under the terms and conditions of the Creative Commons Attribution (CC BY) license (https://creativecommons.org/licenses/by/4.0/).
Share and Cite
MDPI and ACS Style
Wang, X.; Bi, S.; Zhang, J.; Tao, H. Towards the Rational Design of Stable Electrocatalysts for Green Hydrogen Production. Catalysts 2022, 12, 204. https://0-doi-org.brum.beds.ac.uk/10.3390/catal12020204
AMA Style
Wang X, Bi S, Zhang J, Tao H. Towards the Rational Design of Stable Electrocatalysts for Green Hydrogen Production. Catalysts. 2022; 12(2):204. https://0-doi-org.brum.beds.ac.uk/10.3390/catal12020204
Chicago/Turabian StyleWang, Xiangxi, Shengjie Bi, Junming Zhang, and Huabing Tao. 2022. "Towards the Rational Design of Stable Electrocatalysts for Green Hydrogen Production" Catalysts 12, no. 2: 204. https://0-doi-org.brum.beds.ac.uk/10.3390/catal12020204
Note that from the first issue of 2016, this journal uses article numbers instead of page numbers. See further details here.