1. Introduction
Fuel cells and metal-air batteries have attracted much attention owing to the demand for an environment-friendly conversion system and energy storage [
1]. The reaction mechanism of a fuel cell and metal-air battery is oxidation-reduction reaction, and both of the cathode reaction are oxygen reduction reaction (ORR). However, fuel cells and metal-air batteries are inseparable from the use of catalysts, and the current lack of high-performance and low-cost ORR catalysts make them unable to achieve large-scale practical applications [
2,
3]. At present, the electrocatalysts for ORR mainly fall into four categories: platinum group metal (PGM or noble) catalysts, non-PGM catalysts, carbon-based catalysts, and single-atom-based catalysts [
4,
5]. Although PGM or noble catalysts have great advantages in ORR activity among alkaline and acid electrolytes, it is not the best choice in terms of price or durability. These serious problems hinder their further development. In order to realize the large-scale application of fuel cells and metal-air batteries, there is an urgent need to develop excellent performance for non-noble metal replacement catalysts. In other words, non-PGM catalysts need to have high electrocatalytic activity and long-term stability [
6,
7].
In recent years, the graphene-like transition metal dichalcogenides (TMDCs) have been widely acclaimed for their layered structure and low cost. Additionally, they are an environment-friendly material [
8,
9]. In particular, MoS
2 has a unique two-dimensional layered structure and exhibits outstanding thermal, electrical, and catalytic properties, therefore, it has been proposed to be a very promising electrocatalyst for ORR among TMDCs’ family [
10,
11]. However, the catalytic activity of pristine MoS
2 in acidic media is still far from what is expected, as a result of the low density of active sites [
12]. It is firstly reported that ultrathin MoS
2 layers were prepared by ultrasonically exfoliated method and used as ORR electrocatalyst. It is also found that their catalytic activity is size-dependent [
13]. There are a large number of Mo atoms at the edge of MoS
2 with layered structure, which can be served as the active site for the adsorption of molecular oxygen. Water and hydroxyl ions may easily be reduced respectively under acidic or alkaline condition [
14]. Meanwhile, porous structure and the specific surface area of carbon-based TMDCs have a large correlation to the reachability of the active sites and ORR activity [
15,
16,
17,
18]. Accordingly, it is highly desired to develop porous carbon structures rich in MoS
2 active sites.
In addition, studies have shown that a suitable support can effectively improve the activity of TMDCs catalysts. So far, Vulcan XC-72R (VC) is still the most common, simple, and stable catalyst support in PEMFCs on account of its wide commercial practicability, excellent chemical stability, and relatively large specific surface area. Moreover, the high conductivity of VC could further promote the electron transfer in the ORR process [
19]. VC can not only be a commonly used support to load catalytic materials for ORR [
20,
21], but also shows certain activity for ORR by itself [
22].
Herein, we report a flowerball-like MoS2 without using reductant and morphology control reagent. This synthesis strategy could prevent the agglomeration of MoS2 layers simply and effectively. Consequently, the as-prepared MoS2/VC nanocomposite exhibits excellent performance against ORR in alkaline or acidic solution, whether in terms of activity, stability, or resistance to methanol. The specially improved ORR activity is beneficial from the uniform flowerball-like MoS2 distributing onto porous carbon, which is capable of providing abundant Mo edges as catalytic active center for ORR.
2. Results and Discussion
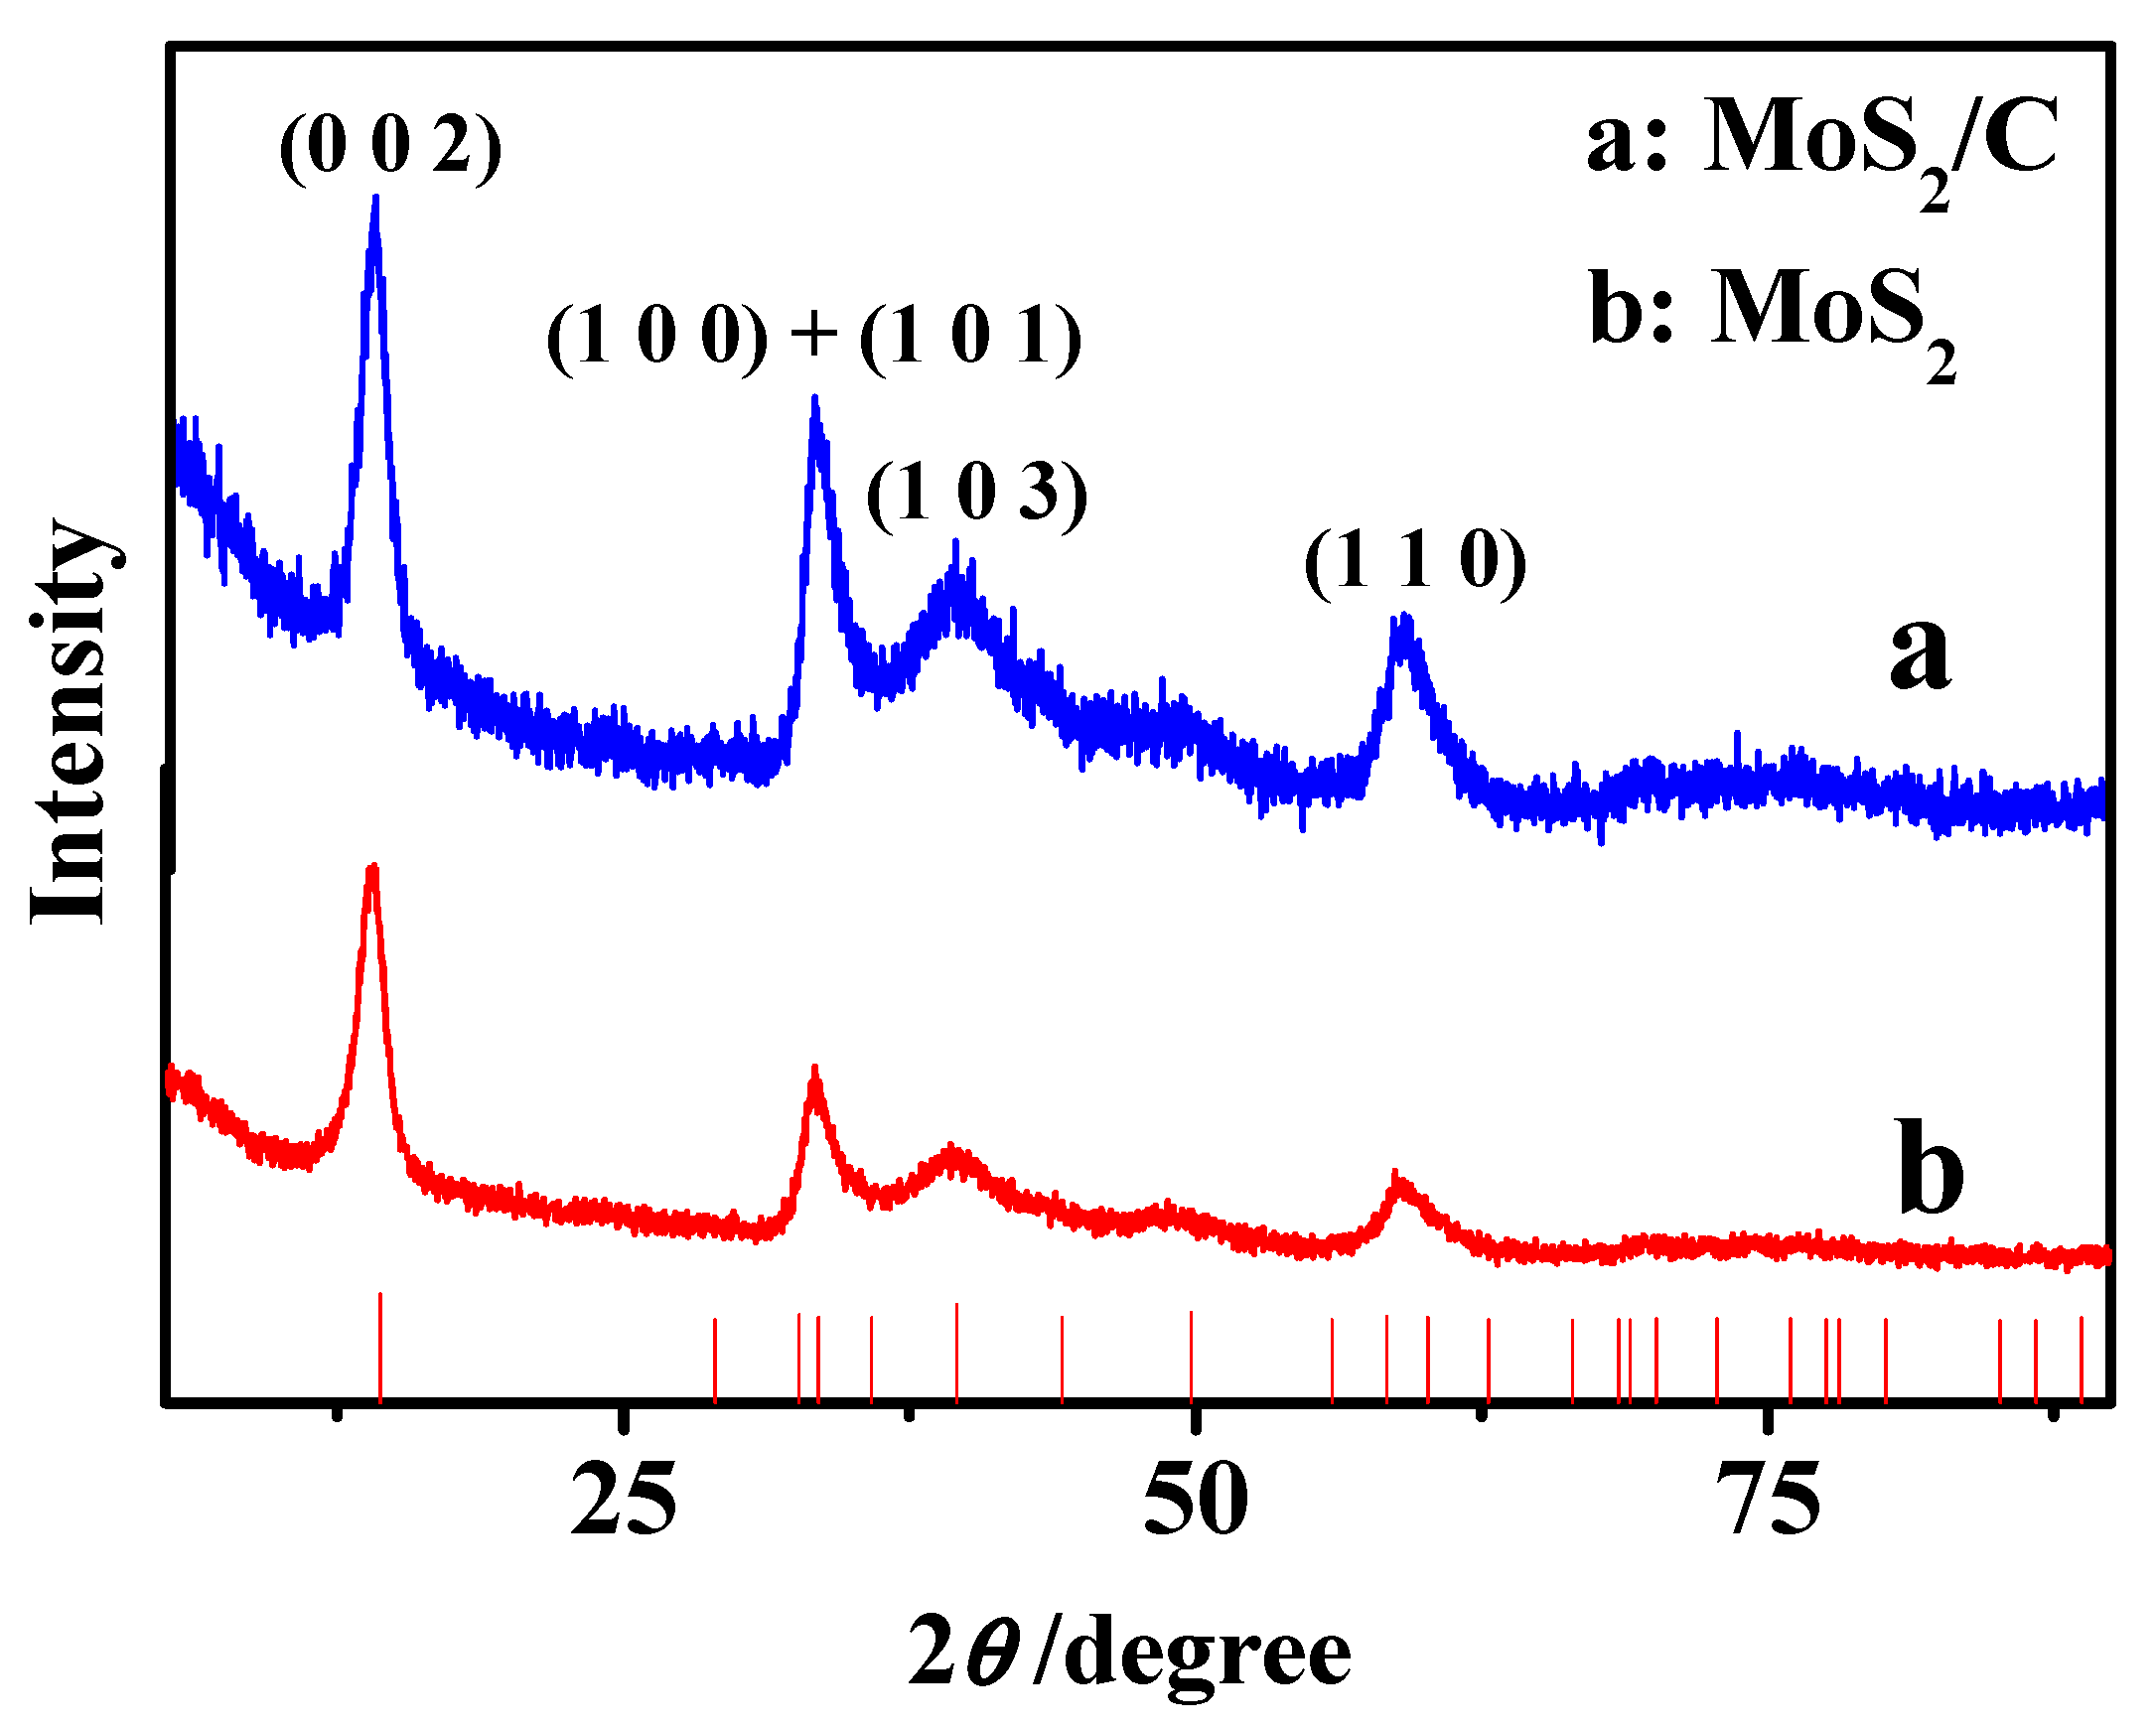
XRD patterns (
Figure 1) displays as-synthesized MoS
2 and MoS
2/C. Diffraction peaks centered at 14.38°, 32.68°, 33.51°, 39.54°, and 58.33° can be indexed to (002), (100), (101), (103), and (110) planes of hexagonal MoS
2 (2H- MoS
2, JCPDS 01-1201) [
23,
24], respectively. According to the Bragg equation (2dsinθ = nλ, λ = 0.15418 nm for Cu Kalpha), the interplanar distance of MoS
2 (002) in the composite material is calculated to be mainly 0.62 nm, which further confirms that the synthesized sample is ordinary hexagonal MoS
2.
As shown in
Figure 2, SEM images of different magnification exhibits flowerball-like shape of MoS
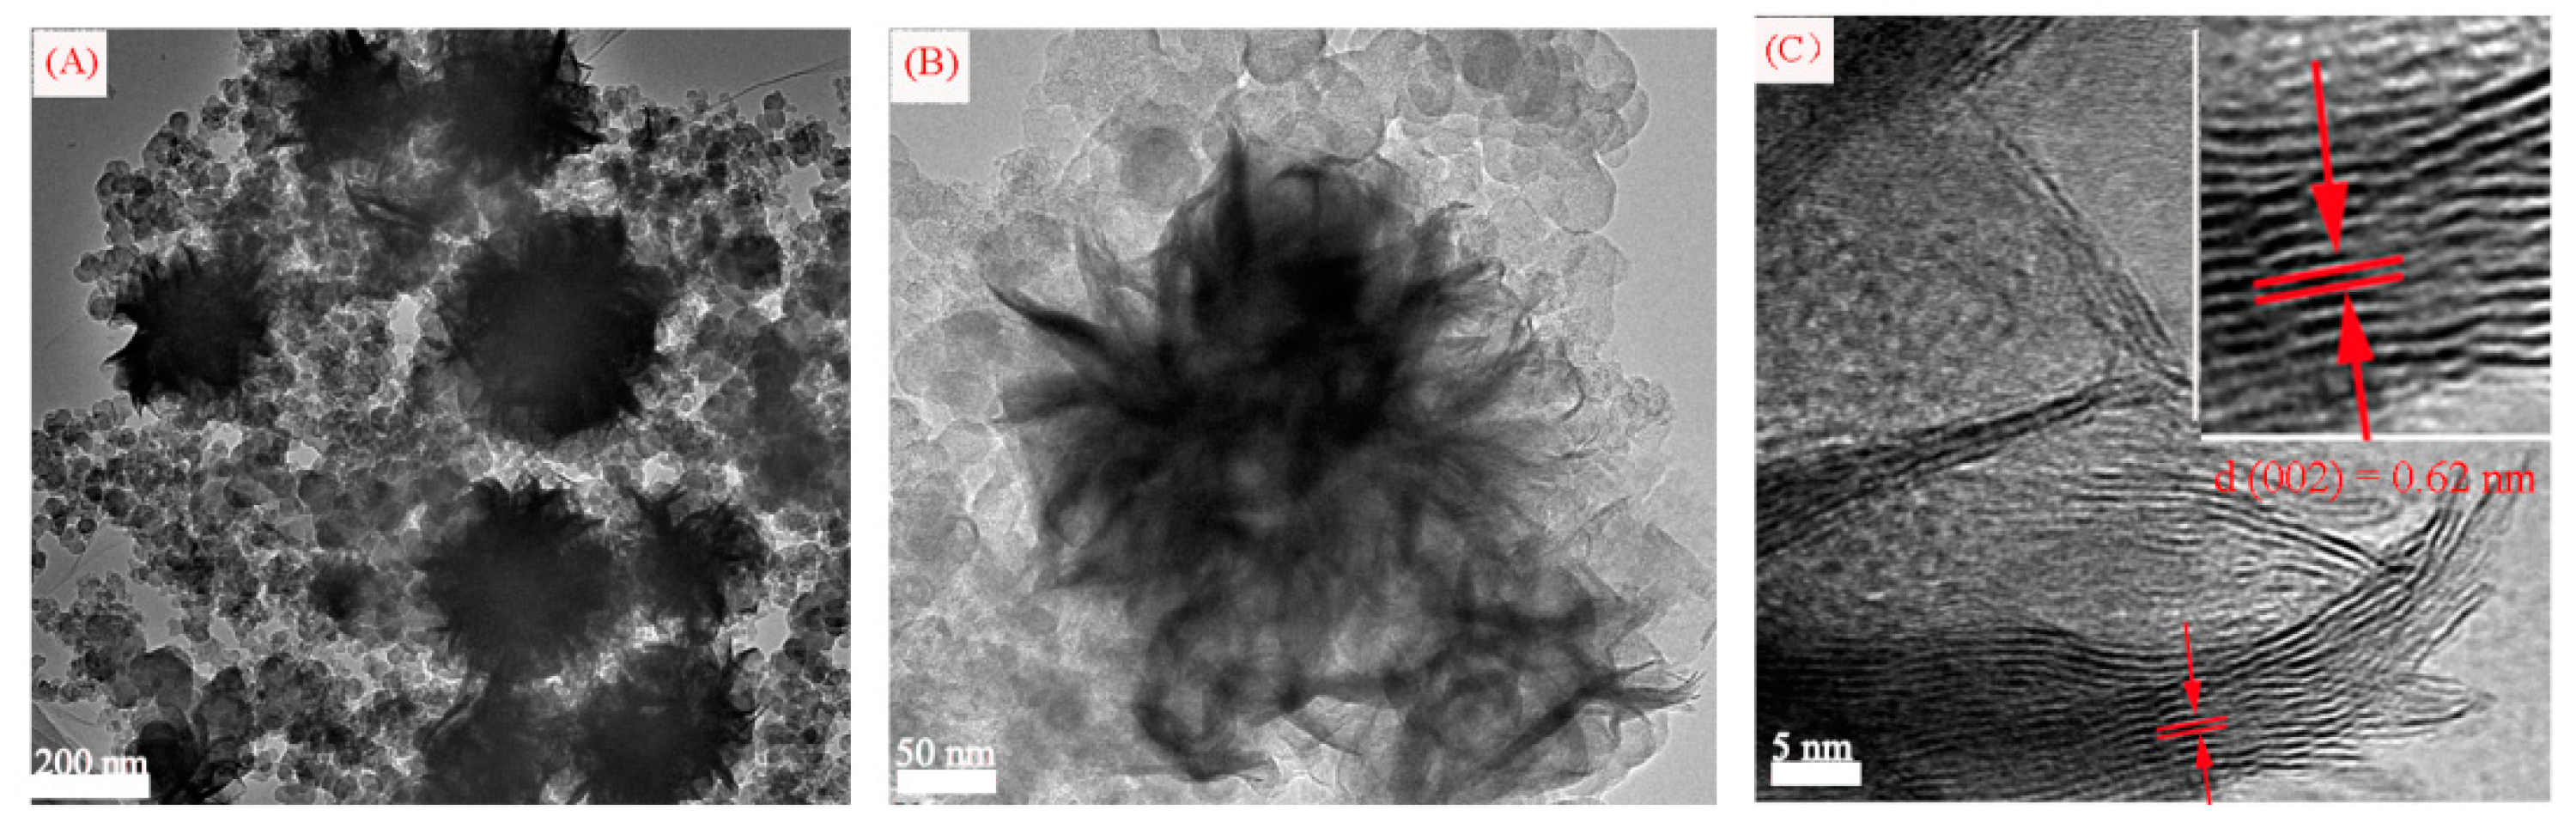
2. TEM image (
Figure 3A) further illustrates that the MoS
2 dispersed with a size distribution of 200 ± 20 nm in diameter, and the MoS
2 reveals flowerball-like shape composed of nanoflakes (
Figure 3B). The HR-TEM picture (
Figure 3C) displays the clear crystal fringes of MoS
2 with a lattice spacing of 0.62 nm on the MoS
2 (002) plane, which is consistent with the result of XRD.
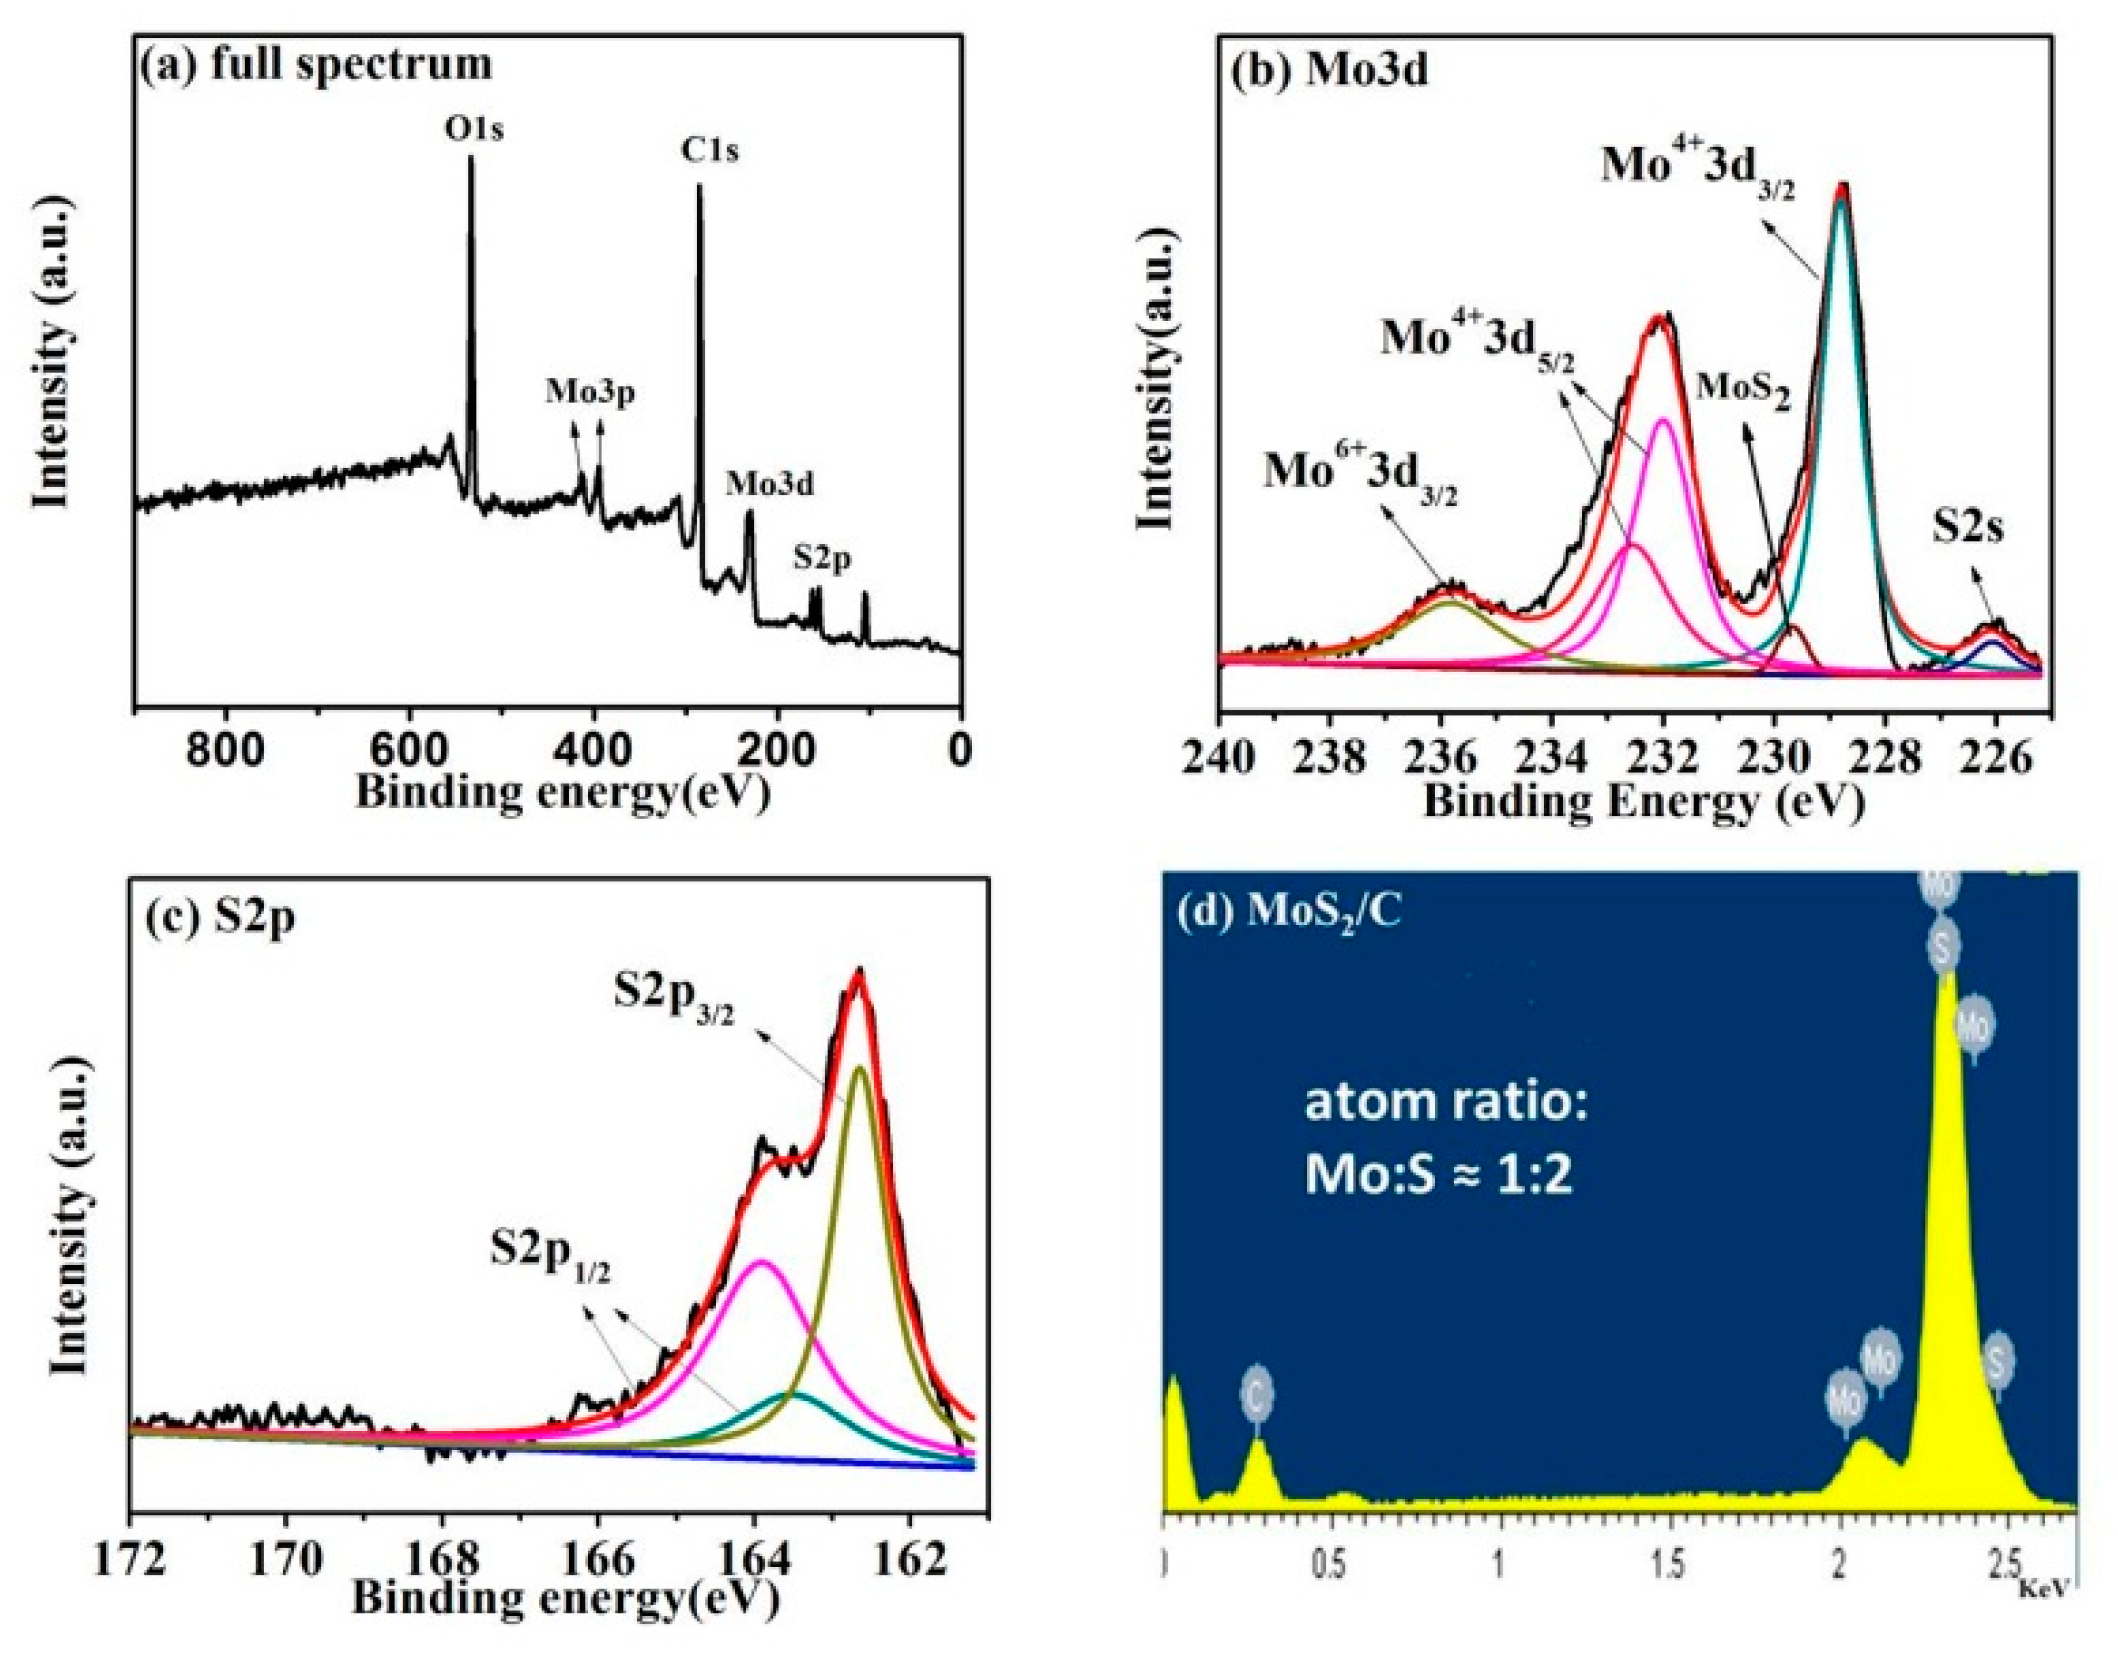
XPS and EDS spectra of MoS
2/C nanocomposites are shown in
Figure 4. The survey scan (
Figure 4a) reveals the signal peaks of Mo3d, Mo3p, S2p, C1s, and O1s, manifesting the existence of Mo, S, and C elements. The existence of O may come from the raw material sodium molybdate dihydrate (Na
2MoO
4·2H
2O). The high-resolution Mo3d spectrum chart (
Figure 4b) can appear as several peaks. Two strong characteristic peaks at 228.8 and 232.0 eV are assigned to Mo3d
3/2 and Mo3d
5/2 [
24], respectively. A relative weak peak appearing at the binding energy of 232.5 eV is also identified to Mo3d
5/2. All these peaks show +4 oxidation state of Mo. Moreover, a weak broad peak at the binding energy of 235.8 eV belongs to +6 oxidation state of Mo [
25], which may come from residual Na
2MoO
4·2H
2O. The results above suggest that Mo in the composite is mainly in the form of + 4. In addition, the weak signal peak at the binding energy of 226.0 eV is the characteristic signal peak of S2s [
23]. The S2p spectrum of MoS
2/C can be showed two peaks at 162.6 eV, 163.9 eV (
Figure 4c), which is assigned to S2p
1/2 and S2p
3/2, respectively. There is also a weak signal peak at the binding energy of 163.6 eV, which also belongs to S2p
1/2. All these data reveal that S exists in -2 oxidation state [
26]. The presence of Mo and S peaks can be clearly observed from the EDS spectrum (
Figure 4d), which indicates that the composite material contains Mo and S elements. It can be seen from EDS that the atomic ratio of Mo/S is almost 1:2, which confirms that the atomic ratio of MoS
2 is 1:2.
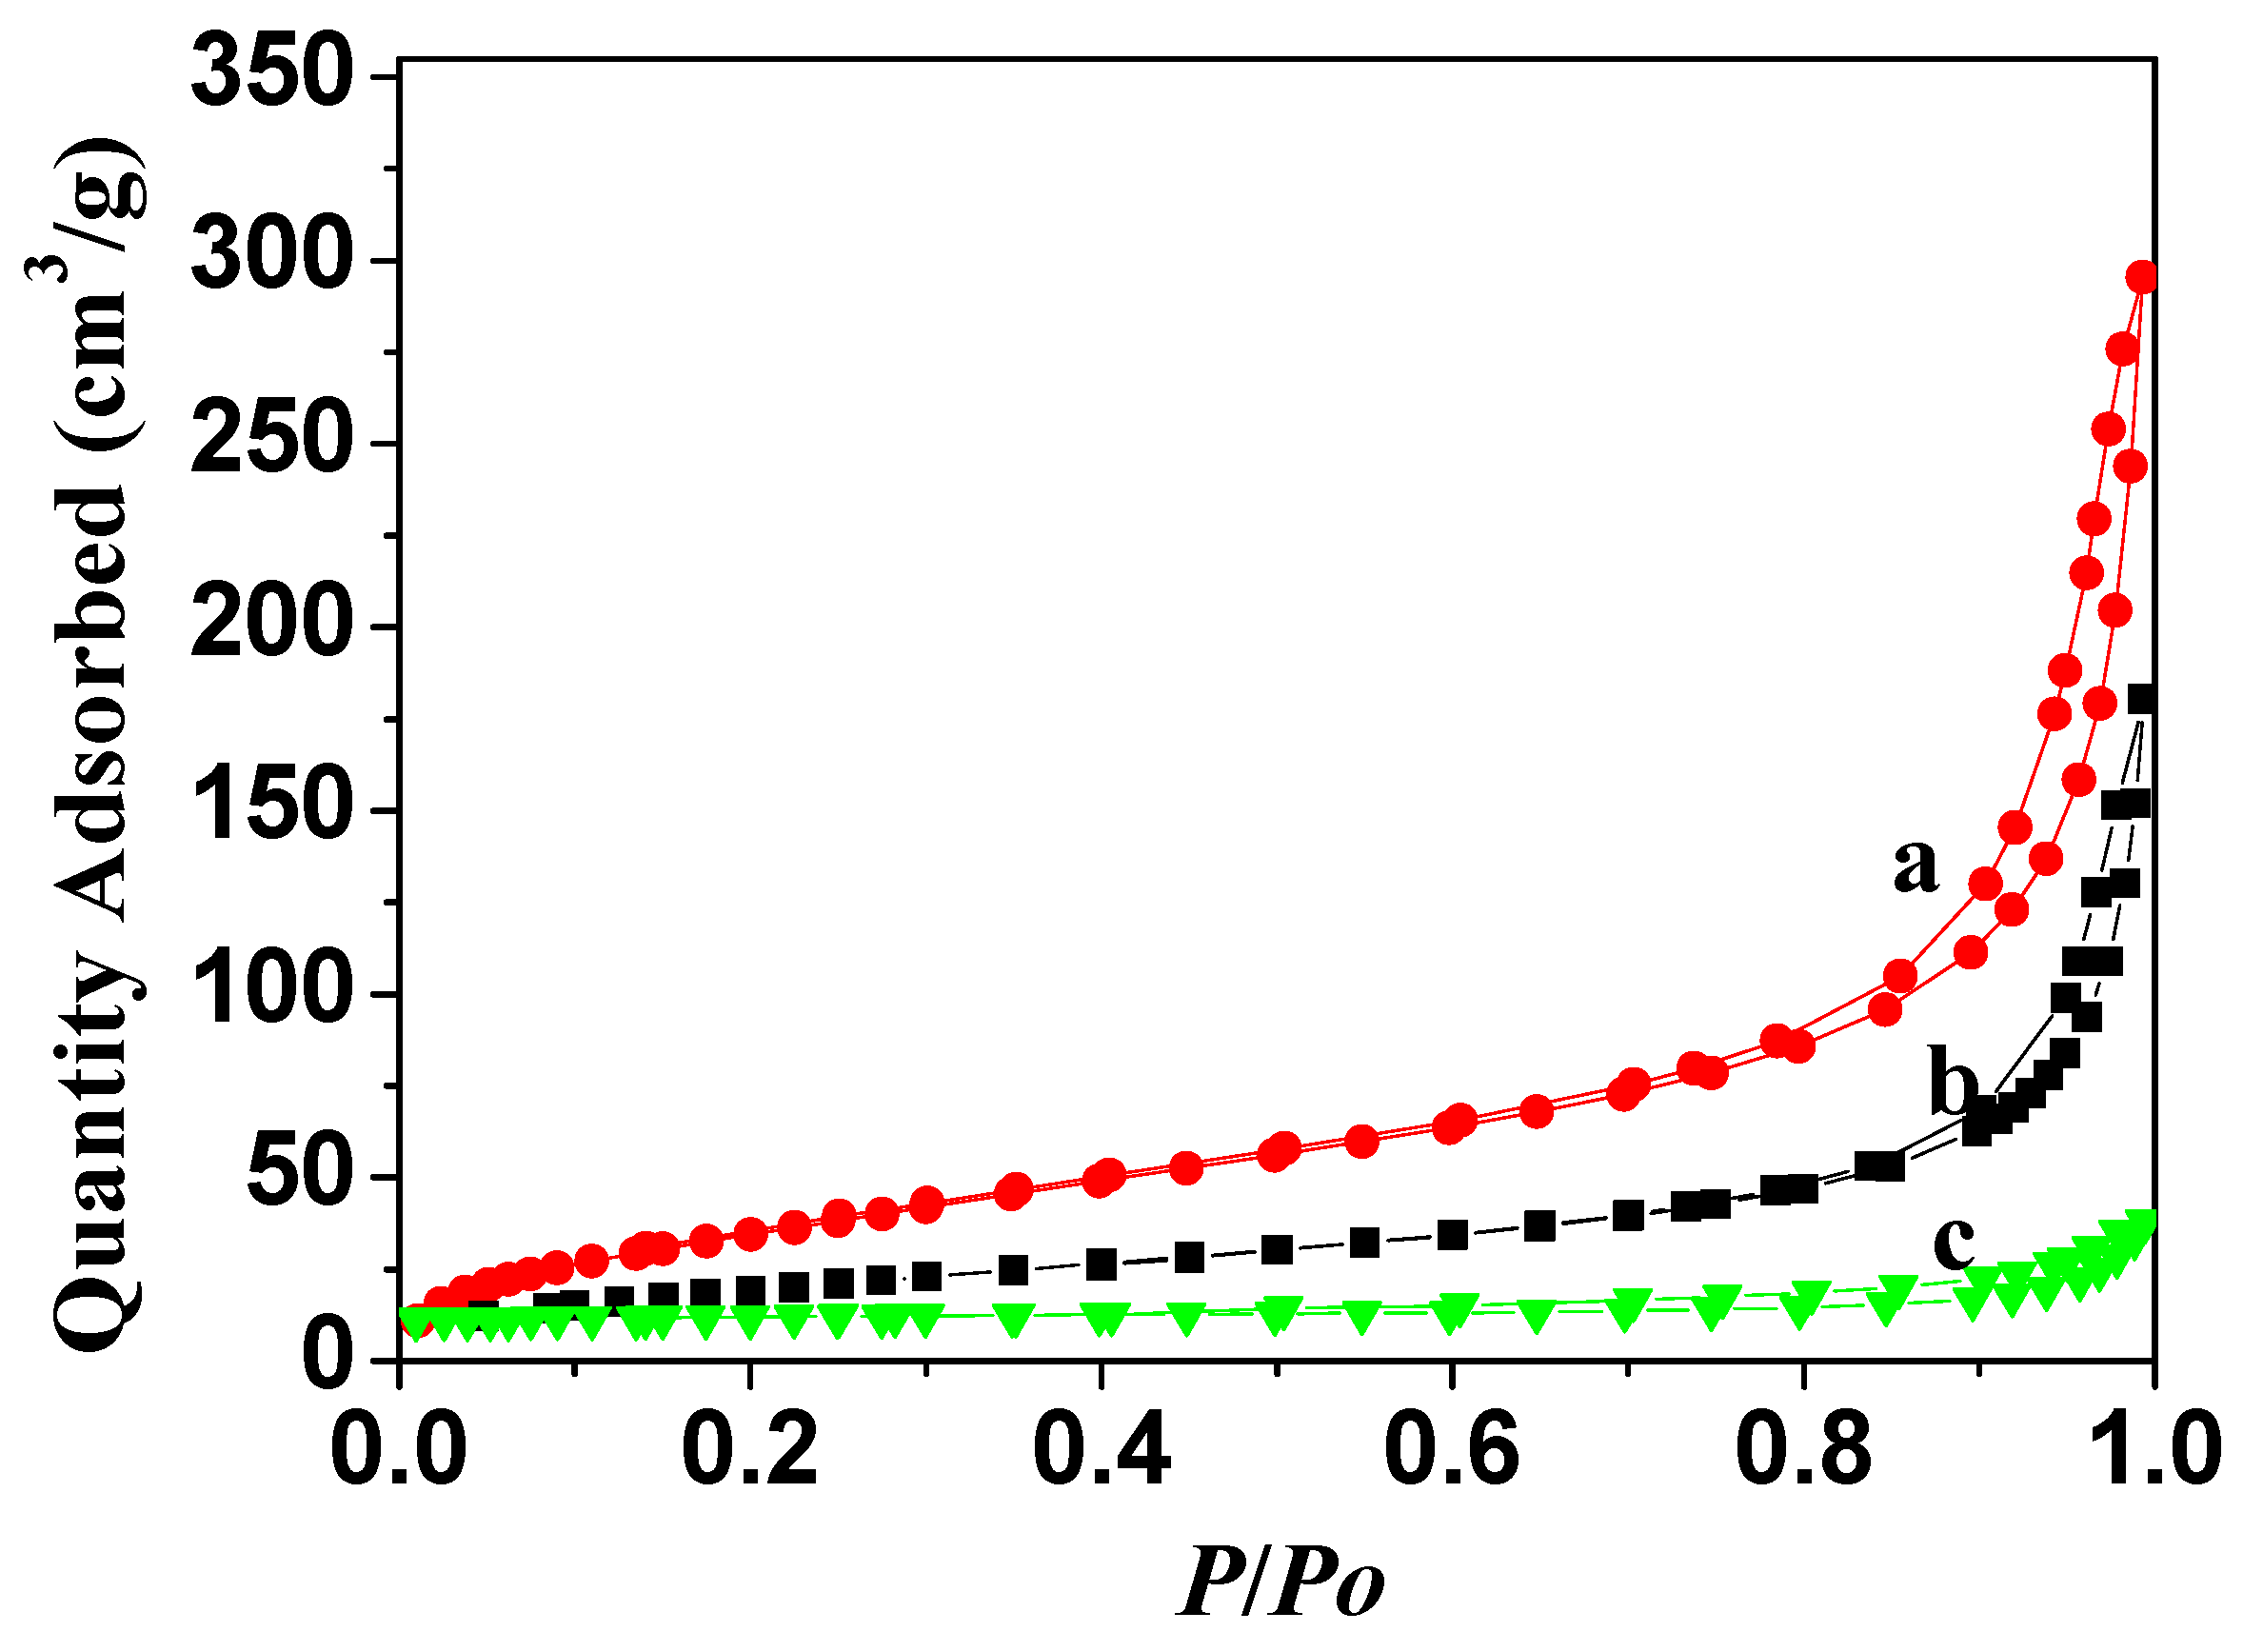
It can be found from N
2-adsorption/desorption isotherms results (
Figure 5) that the synthesized MoS
2/C composite possess higher adsorption capacity than pristine MoS
2. The surface areas of Vulcan C, pure MoS
2 sheets, and MoS
2/C composite measured by Brunauer-Emmett-Teller (BET) are 302.4 m
2 g
−1, 50.8 m
2 g
−1, and 184.5 m
2 g
−1, respectively, indicating that MoS
2 nanosheets are dispersed in Vulcan C, which leads to an increase in the surface area of MoS
2.
The amount of C may have effects on the ORR catalytic performance of the composite. In this experiment, by adjusting the amount of C, the catalytic performances of MoS
2/C composites with different proportion are investigated through CV and LSV techniques in O
2 saturated 0.1 M KOH solution with the above operations to explore the optimal composition of the catalyst.
Figure S1 displays CVs of MoS
2/C-15, MoS
2/C-20, MoS
2/C-25, and MoS
2/C-30. There are strong redox peaks at the potential of 0.77, 0.76, 0.82, and 0.78 V (vs. RHE), respectively. In contrast, there is no information about typical oxidation peaks in CVs recorded in N
2 saturated electrolyte. It should be noted that the oxygen reduction peak current density and onset potential of MoS
2/C-25 composite is the highest. It is necessary to further study the electrochemical kinetic properties of MoS
2/C composites on ORR, LSVs are recorded in O
2 saturated 0.1 M aqueous KOH electrolyte at a scan rate of 10 mV s
−1 with a rotational rate of 1600 rpm.
Figure S2 shows comparative LSVs of MoS
2/C-15, MoS
2/C-20, MoS
2/C-25, and MoS
2/C-30 composites. The onset potential is one of the vital arguments to assess electrocatalytic activity for ORR. The starting potentials of MoS
2/C-15, MoS
2/C-20, MoS
2/C-25, and MoS
2/C-30 are found to be 0.74, 0.78, 0.82, and 0.75 V, respectively. Obviously, the MoS
2/C-25 composite displays the highest onset potential (0.82 V) and half-wave potential (0.71 V) with the increase of limiting current density (5.34 mA cm
−2), suggesting the highest electrocatalytic activity for ORR compared to other MoS
2/C composites.
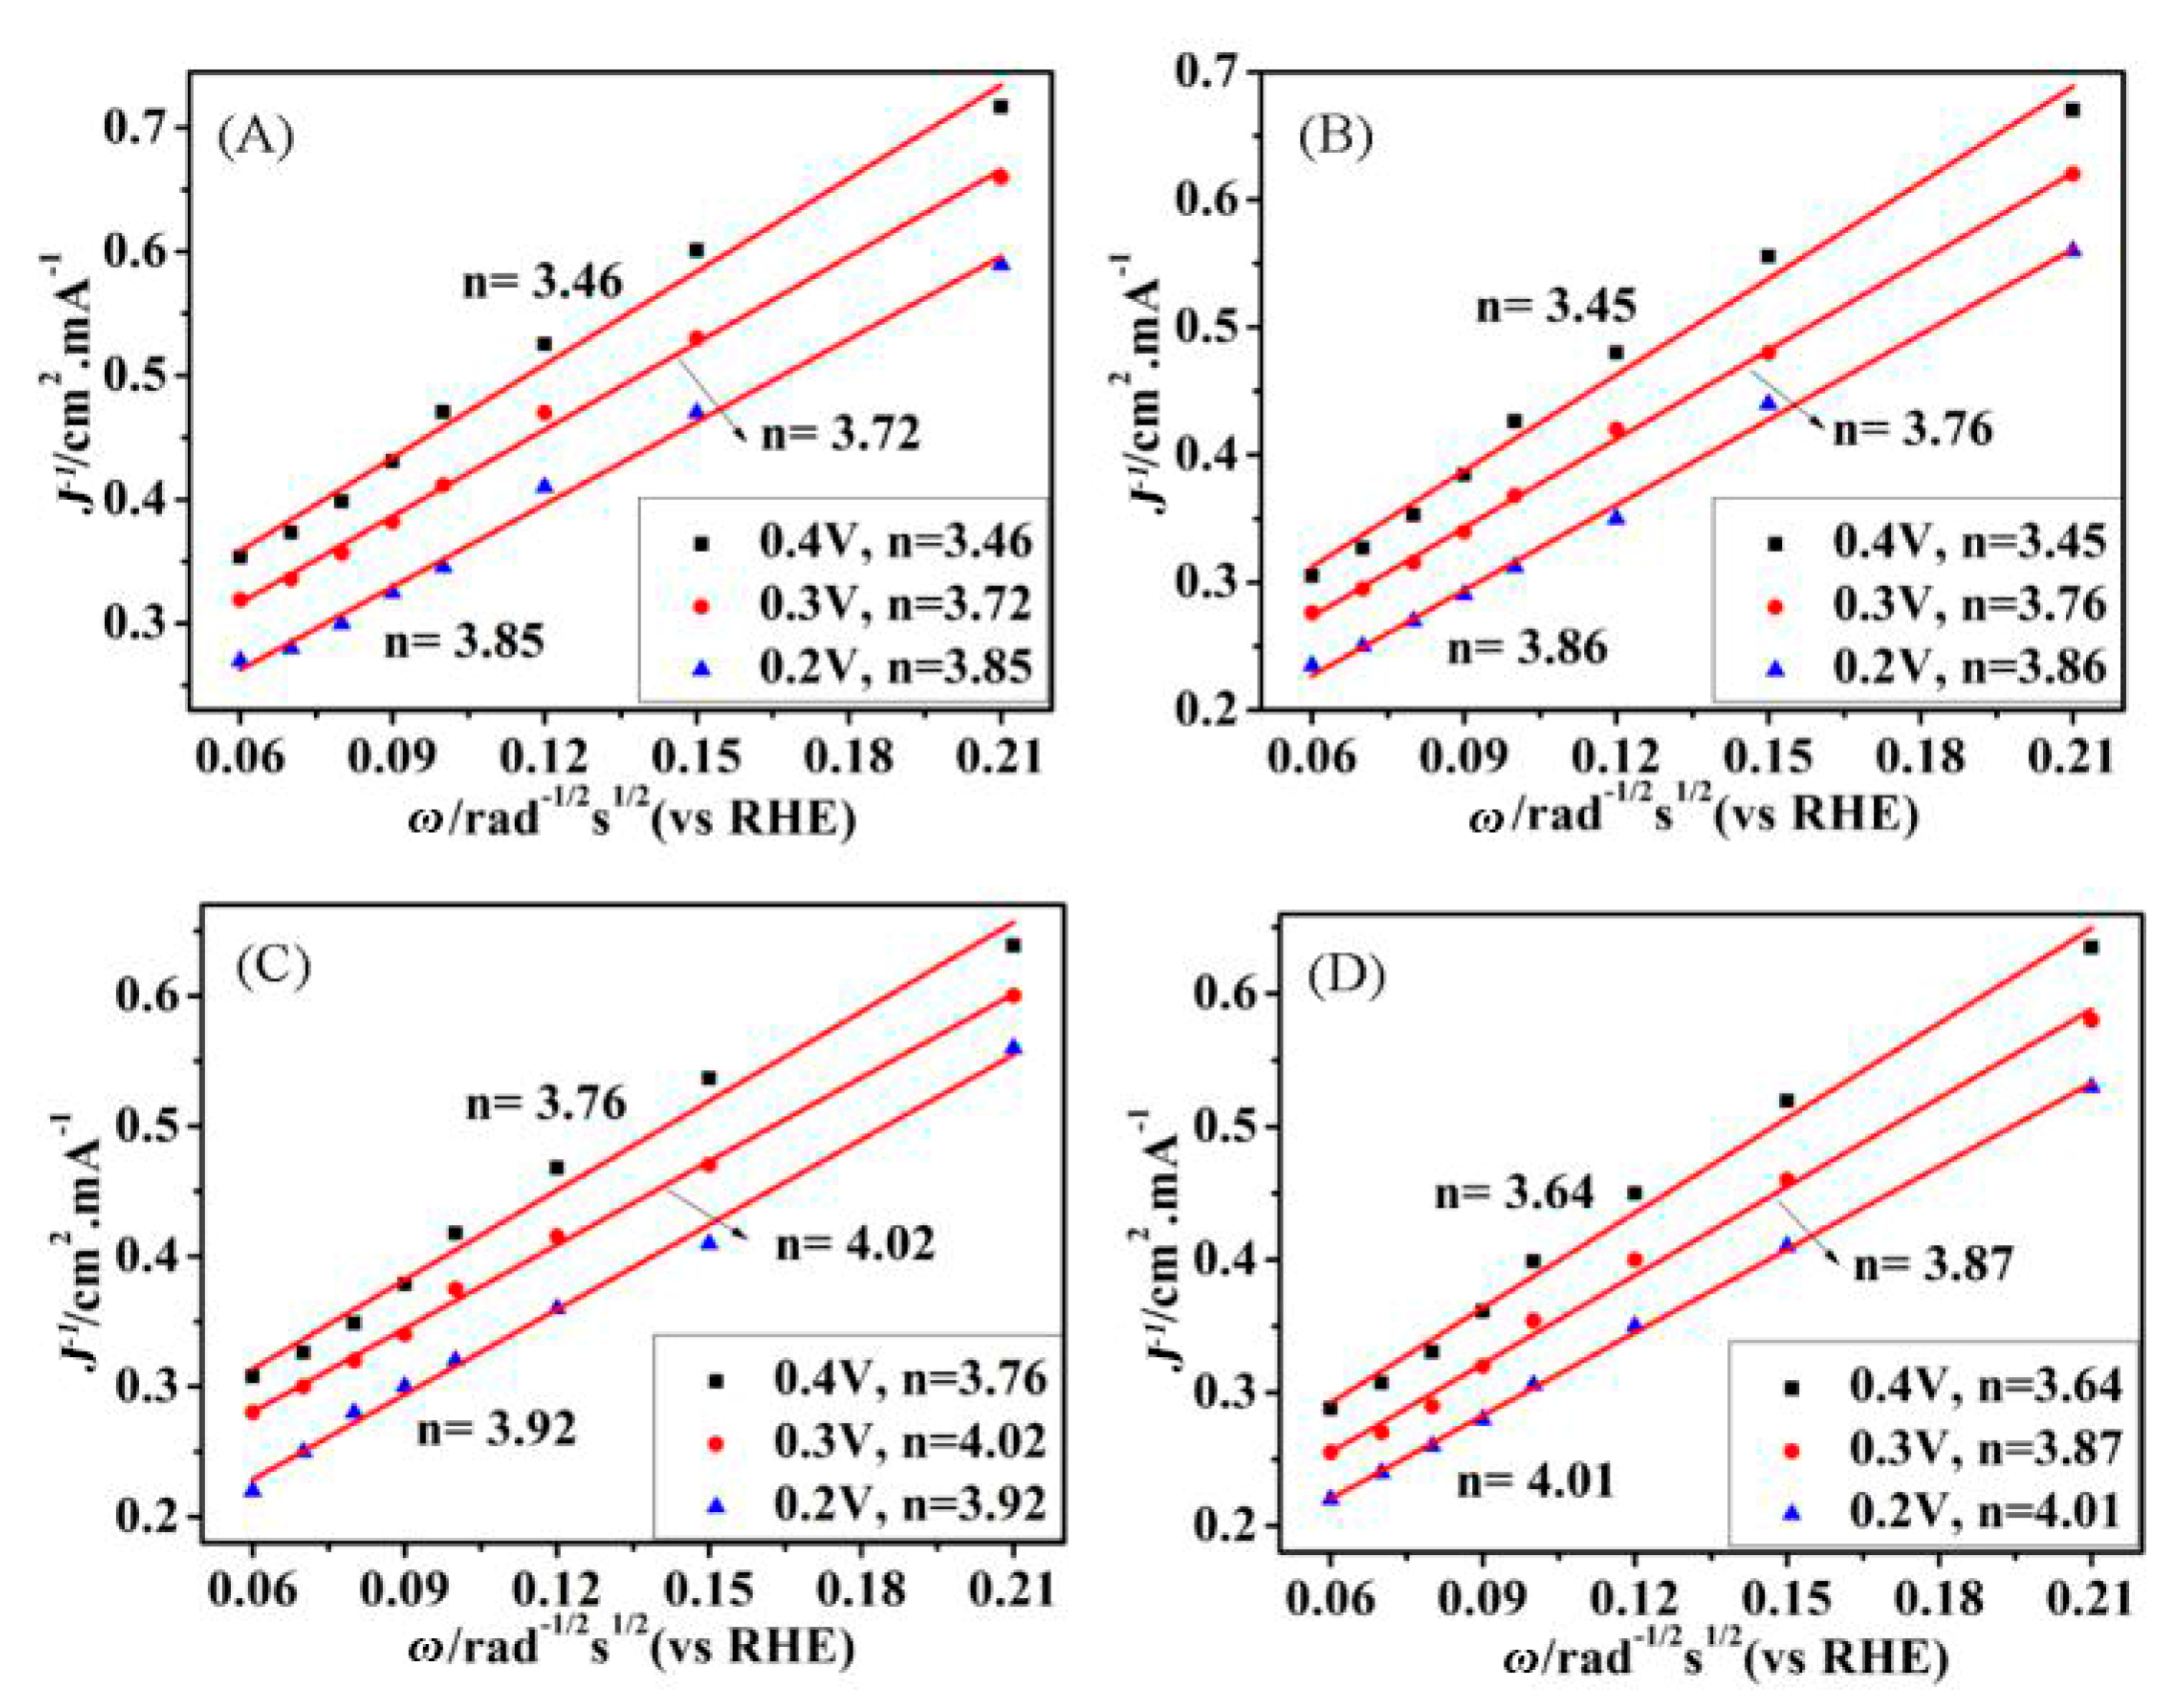
According to linear-sweep voltammetry (LSV), results at different rotational speeds, the Koutecky-Levich diagrams (K-L, j
−1 vs. ω
−1/2) were used to calculate the corresponding number of transferred electrons in ORR (Equations (3) and (4)). The LSV curves of the MoS
2/C-15, MoS
2/C-20, MoS
2/C-25, and MoS
2/C-30 composites at different rotation speeds are shown in
Figure S3, which displays the calculated K-L plots for the four composites at a potential range of 0.4 to 0.2 V (vs. RHE,
Figure 6). By calculating the slope of the K–L curve, the electron transfer number n of MoS
2/C-25 is 3.90 (vs. RHE), indicating that it is higher than MoS
2/C-15 (3.67), MoS
2/C-20 (3.69), and MoS
2/C-30 (3.84). The nearby four electrons transferred per O
2 molecule (n) further supports the excellent performance of flowerball-like MoS
2/C-25.
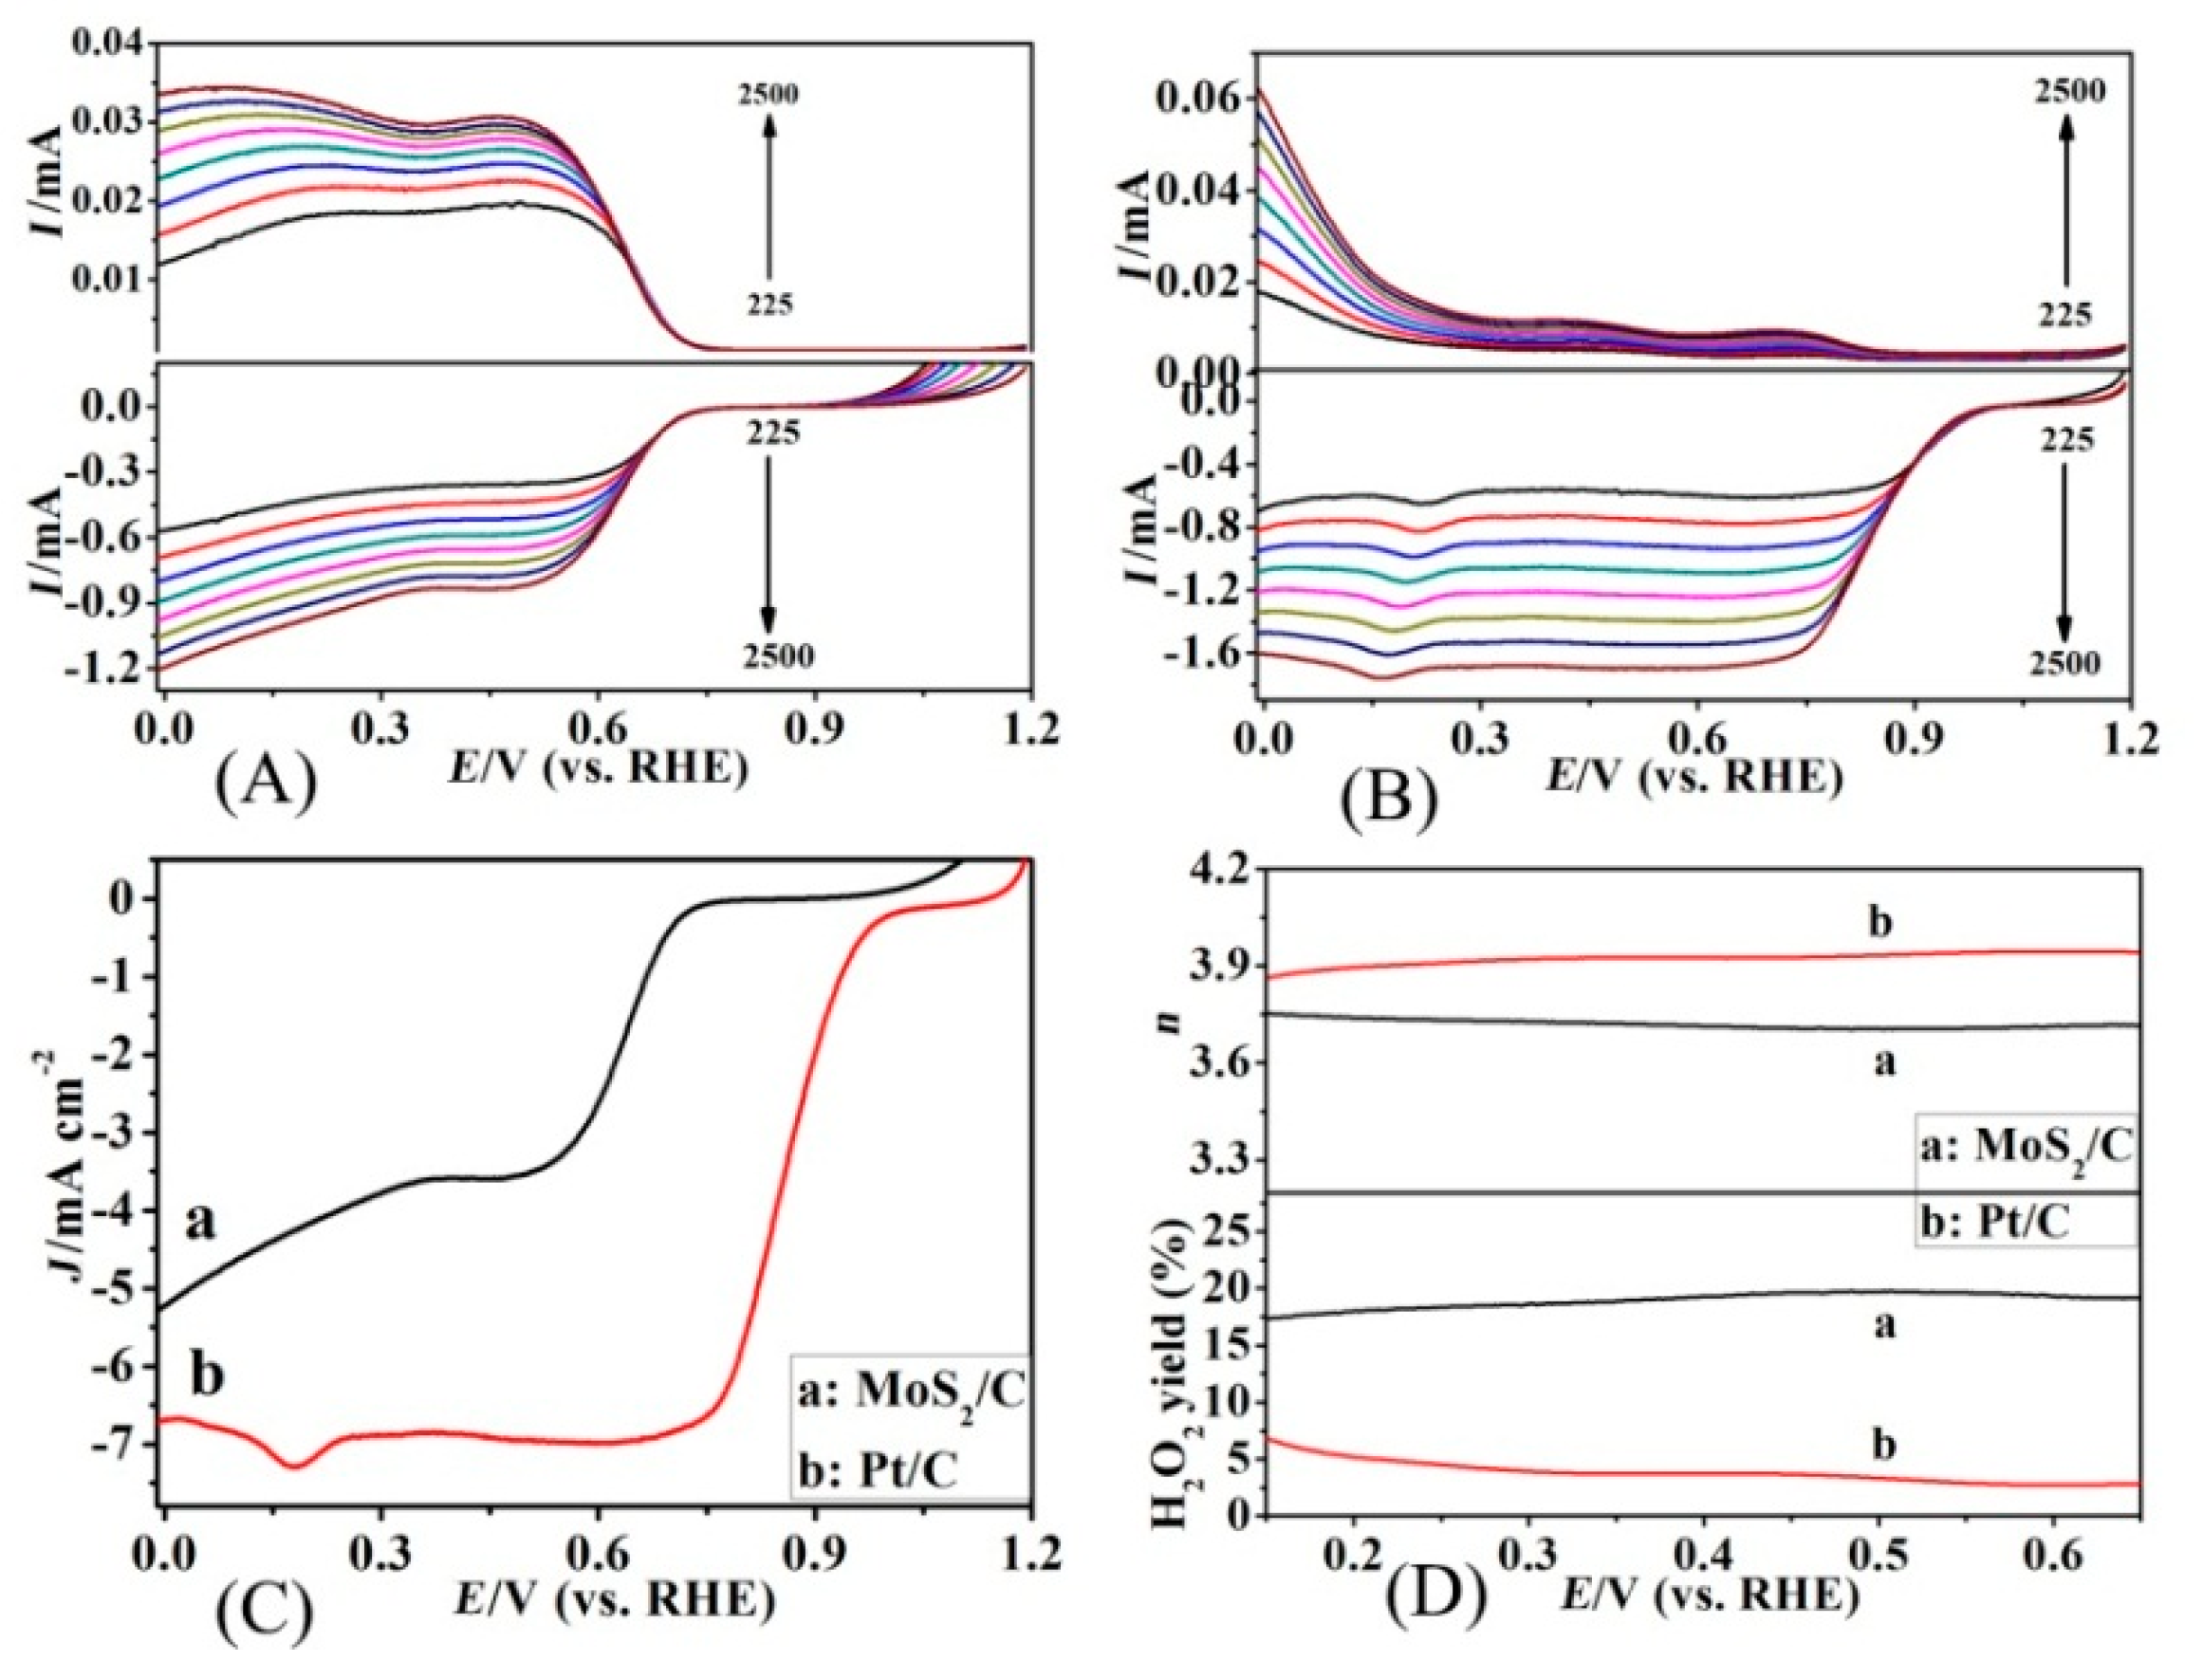
Figure 7 presents RRDE plots of MoS
2/C-25 and commercial Pt/C in 0.1 M KOH solution.
Figure 7A,B are the ring currents (above) and disk current (below) currents of MoS
2/C-25 and commercial Pt/C at different rotating speeds, respectively. Therefore, it can be known that the ring current and disk current of MoS
2/C-25 and commercial Pt/C increase with the increase of speed.
Figure 7C is the polarization curves of MoS
2/C-25 (a) and commercial Pt/C (b) at 1600 rpm. Although MoS
2/C-25 is not as good as commercial Pt/C in terms of initial potential and limiting current density value, the MoS
2/C-25 composite has made great progress in these two aspects compared to other reference data [
23,
24].
Figure 7D reveals the electron transfer number “n” and “HO
2− yield” calculated by the Formulas (3) and (4) curves by the RRDE curves at 1600 rpm. As observed, the HO
2− yield on the MoS
2/C-25 composite is below 20%. Moreover, the number of ascertained electron transfer during ORR process of the MoS
2/C-25 composite is 3.75, which further confirms that the ORR procedure experiences nearly four electron pathways over the composite. For non-noble metal based catalysts, a lower HO
2− yield is advisable because it not only improves ORR efficiency, but also prevents corrosive hydrogen peroxide damaging the catalysts.
To further investigate the potential application of MoS
2/C-25 composite in acidic PEMFCs, the electrocatalytic activity of MoS
2/C-25 for ORR is also judged in 0.1 M HClO
4. According to
Figure S4, in the alkaline solutions, the peak potential of oxygen reduction of MoS
2/C-25 is 0.82 V and the corresponding current density is 0.67 mA cm
−2. It can be seen from
Figure S4B in 0.1M HClO
4 electrolyte solution saturated with oxygen, the peak potential of oxygen reduction of MoS
2/C-25 is 0.81 V, and the corresponding current density is 0.75 mA cm
−2. The CV results show that the MoS
2/C-25 composite also possesses ORR activity in acidic solutions.
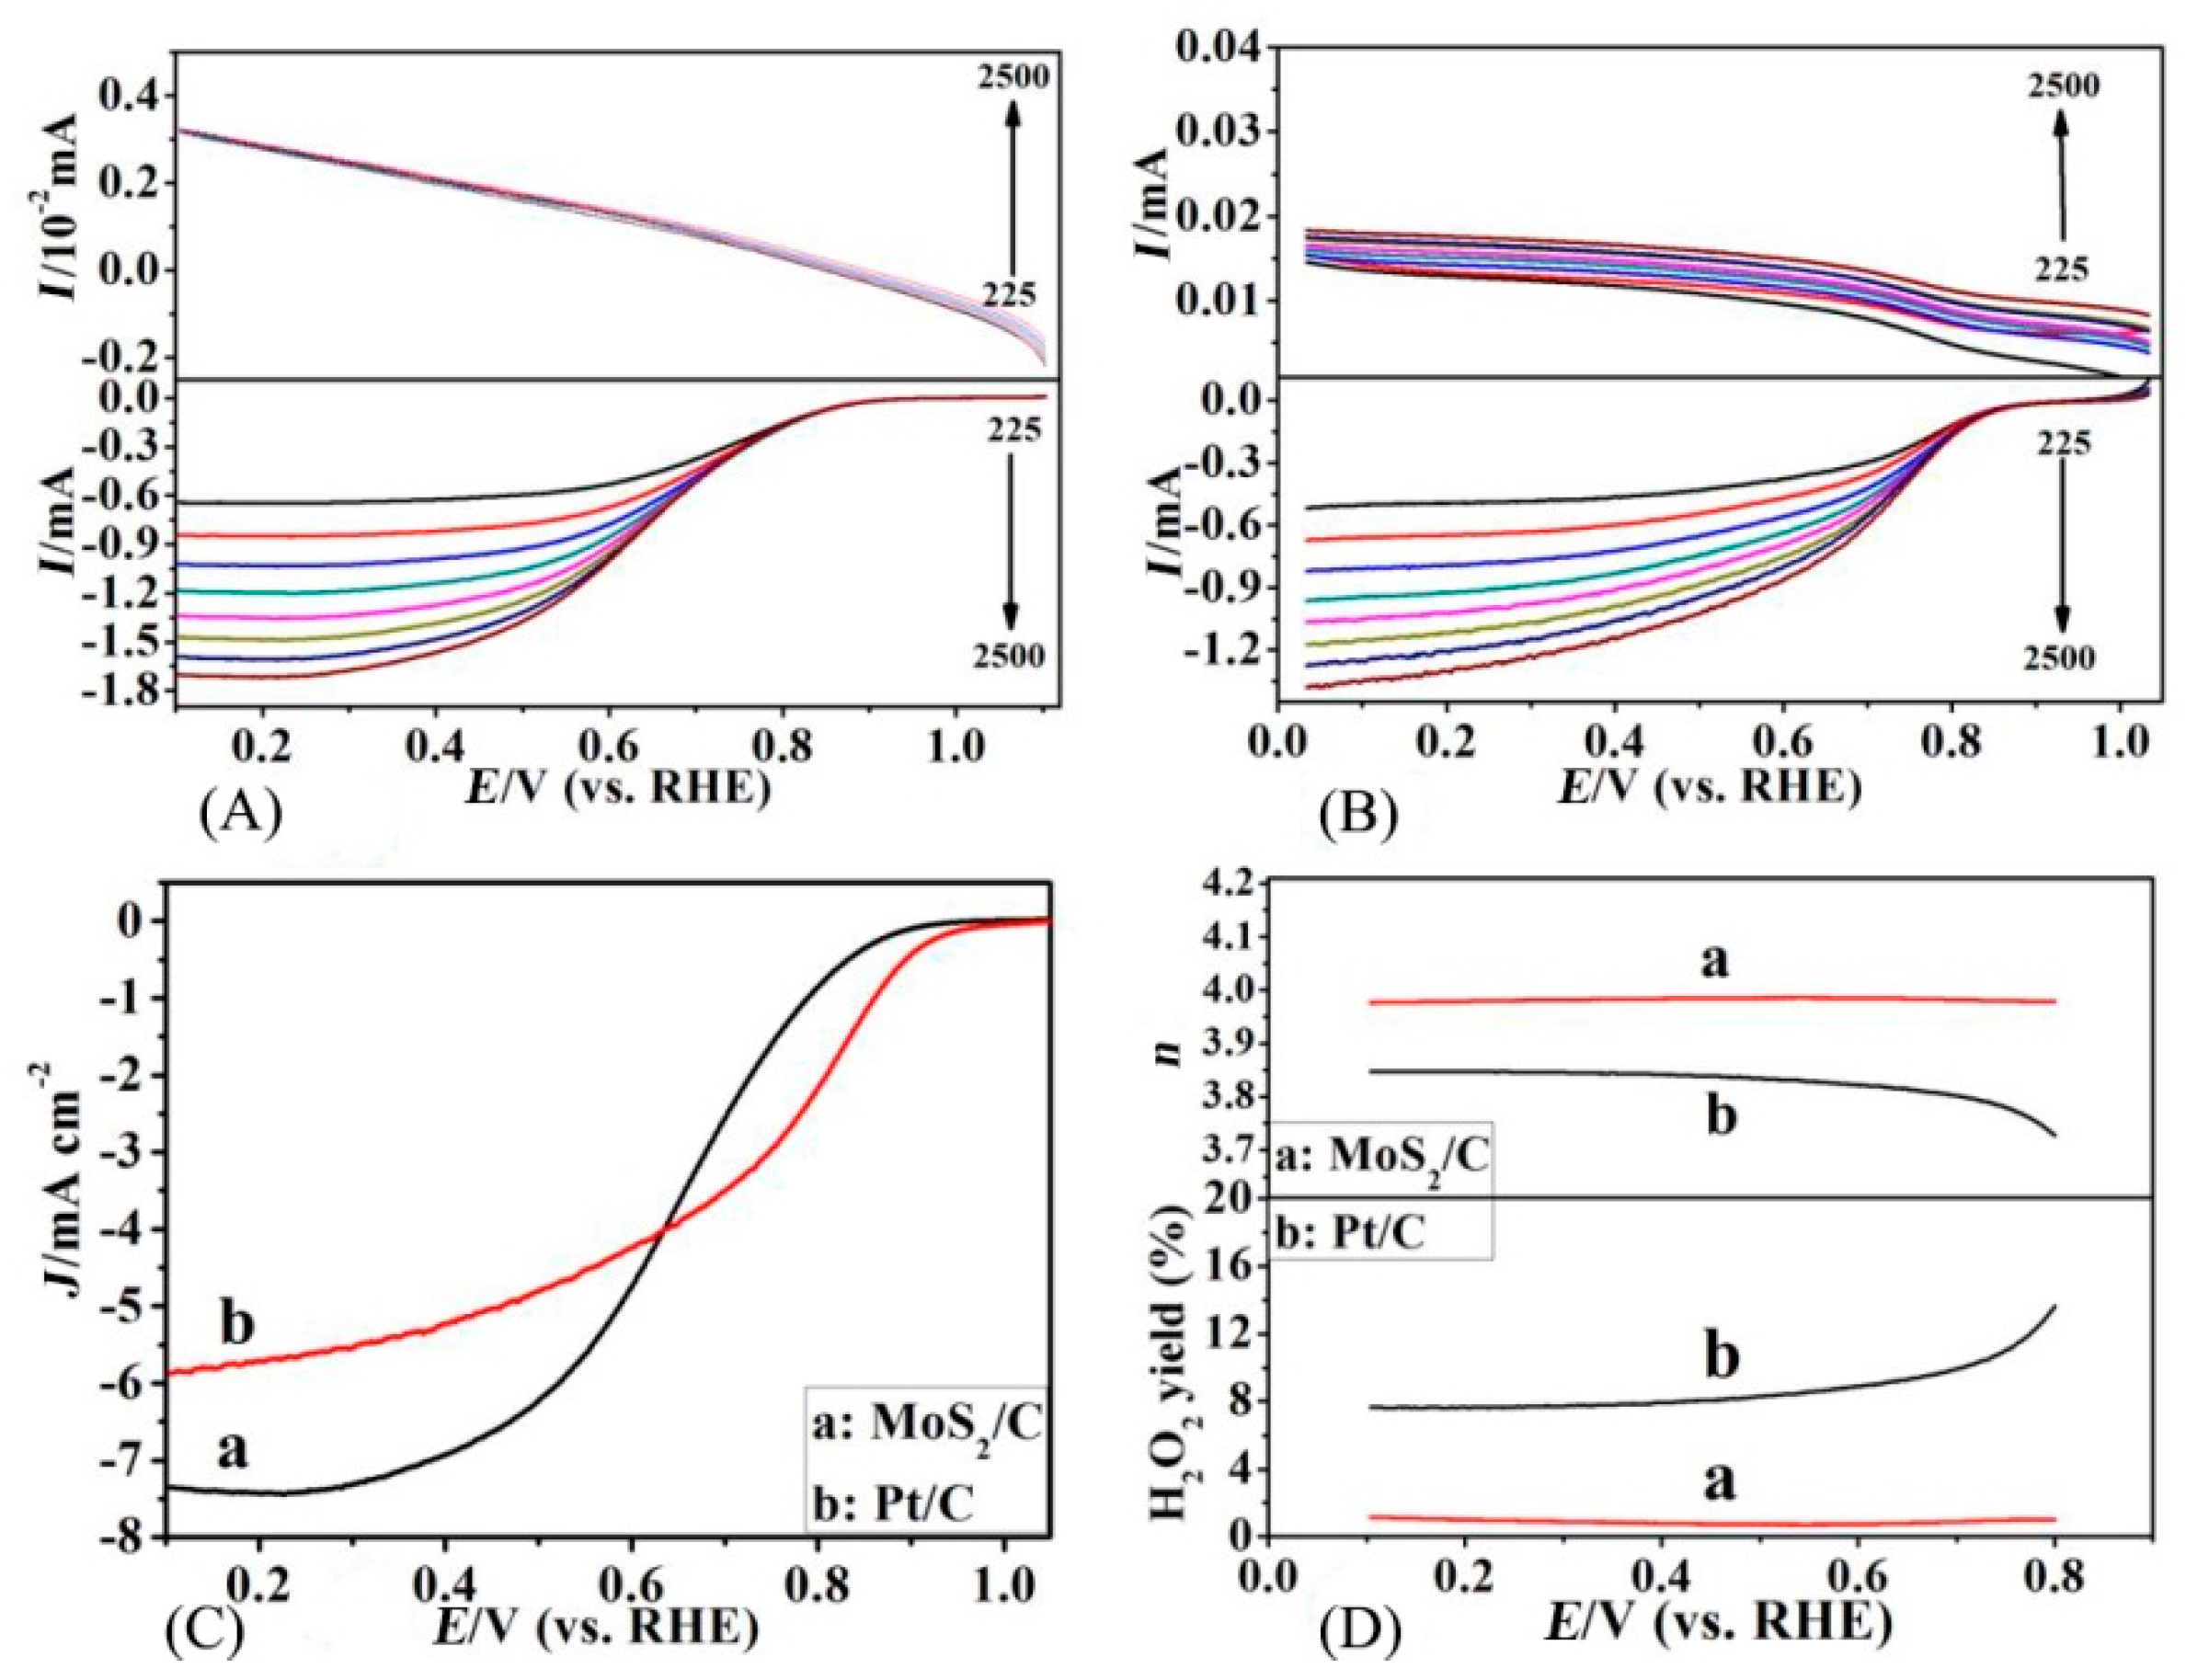
Figure 8 shows the RRDE plots of MoS
2/C-25 and existing Pt/C in 0.1 M HClO
4 solution. From
Figure 8A,B, we can find that the ring currents and disk currents of MoS
2/C-25 and commercial Pt/C both increase with the increase of rotating speed. Accordingly, the polarization curve of MoS
2/C-25 (a) at 1600 rpm in
Figure 8C reveals that the MoS
2/C-25 has an onset potential of 0.90 V (vs. RHE), which is comparable with that of Pt/C (0.93 V vs. RHE) and exhibits a diffusion-limited current (jL) of 7.39 mA cm
−2, indicating that MoS
2/C-25 obtains more current, compared to the current obtained by commercial Pt/C (5.84 mA cm
−2). Importantly, the electron transfer number “n” on the MoS
2/C-25 composite is 3.98, which is higher than that of Pt/C (3.76). The “H
2O
2 yield” on the MoS
2/C-25 composite is close to zero, which indicates that the reduction of O
2 to H
2O in acid medium is via four-electrons pathway over this composite. The above results further indicate that the MoS
2/C-25 composite material performs better than commercial Pt/C catalysts in terms of catalytic activity, selectivity, and stability for ORR in acidic medium.
Furthermore, the as-prepared flowerball-like MoS
2/VC here are also compared with recently reported MoS
2-based graphene [
11,
15], N,S co-doped carbon composites [
27], or carbon nanotubes hybrid materials [
28]: MoS
2/NG, MoS
2/graphene, MoS
2@NSC, and MoS
2-CNT (
Table S1, ESI†). Although the onset potential of the MoS
2/VC (0.82 V vs. RHE) in 0.1 M KOH is lower than that of MoS
2/graphene (0.91 V vs. RHE) and MoS
2@NSC (0.93 V vs. RHE), the limiting current density is higher than that of MoS
2/graphene and MoS
2@NSC, and close to that of MoS
2-CNT, suggesting the enhancement of electrochemical activity of flowerball-like MoS
2/VC in alkaline medium. Moreover, it can be seen from
Table S1 that the synthesized MoS
2/VC exhibits better oxygen reduction catalytic activity in acidic medium than that under alkaline condition. The comparison further proves that flowerball-like MoS
2/VC can be used as an excellent catalyst for ORR under both alkaline and acidic condition. The reason maybe as follows: The flower structure effectively inhibited the stacking of MoS
2 layers. Electrocatalytic ORR active sites of MoS
2 is realized by the presence of abundant Mo edges in the layered structures, which serve as preferred active sites for the adsorption of molecular oxygen and its subsequent reduction to the desired by-products such as water ahydroxyl ions in acid and in alkaline conditions, respectively [
29].
One important factor to enhance electrocatalytic performance is the superior electric conductivity of the composite, which can be proven by Nyquist plots of the electrochemical impedance spectrum (EIS). The EIS curves of MoS
2/C, MoS
2, and VulcanXC-72R in 0.1 M KOH/0.1 M HClO
4 electrolyte are revealed in
Figure S5. In
Figure S5, MoS
2/C, MoS
2, and VulcanXC-72R all exhibit obvious semicircles in the high-frequency region. It is generally believed that the result of the high frequency semicircle diameter is equal to the charge transfer resistance (Rct) [
30]. In the base or acid media, the Rct of MoS
2/C composite is both obviously smaller than that of MoS
2/C or VulcanXC-72R. In addition, the Rct of MoS
2/C composite in acid medium is even smaller than that in alkaline medium. The result indicates that electrons transfer easier in acid medium, which is also reflected in the experimental results of CV and RRDE.
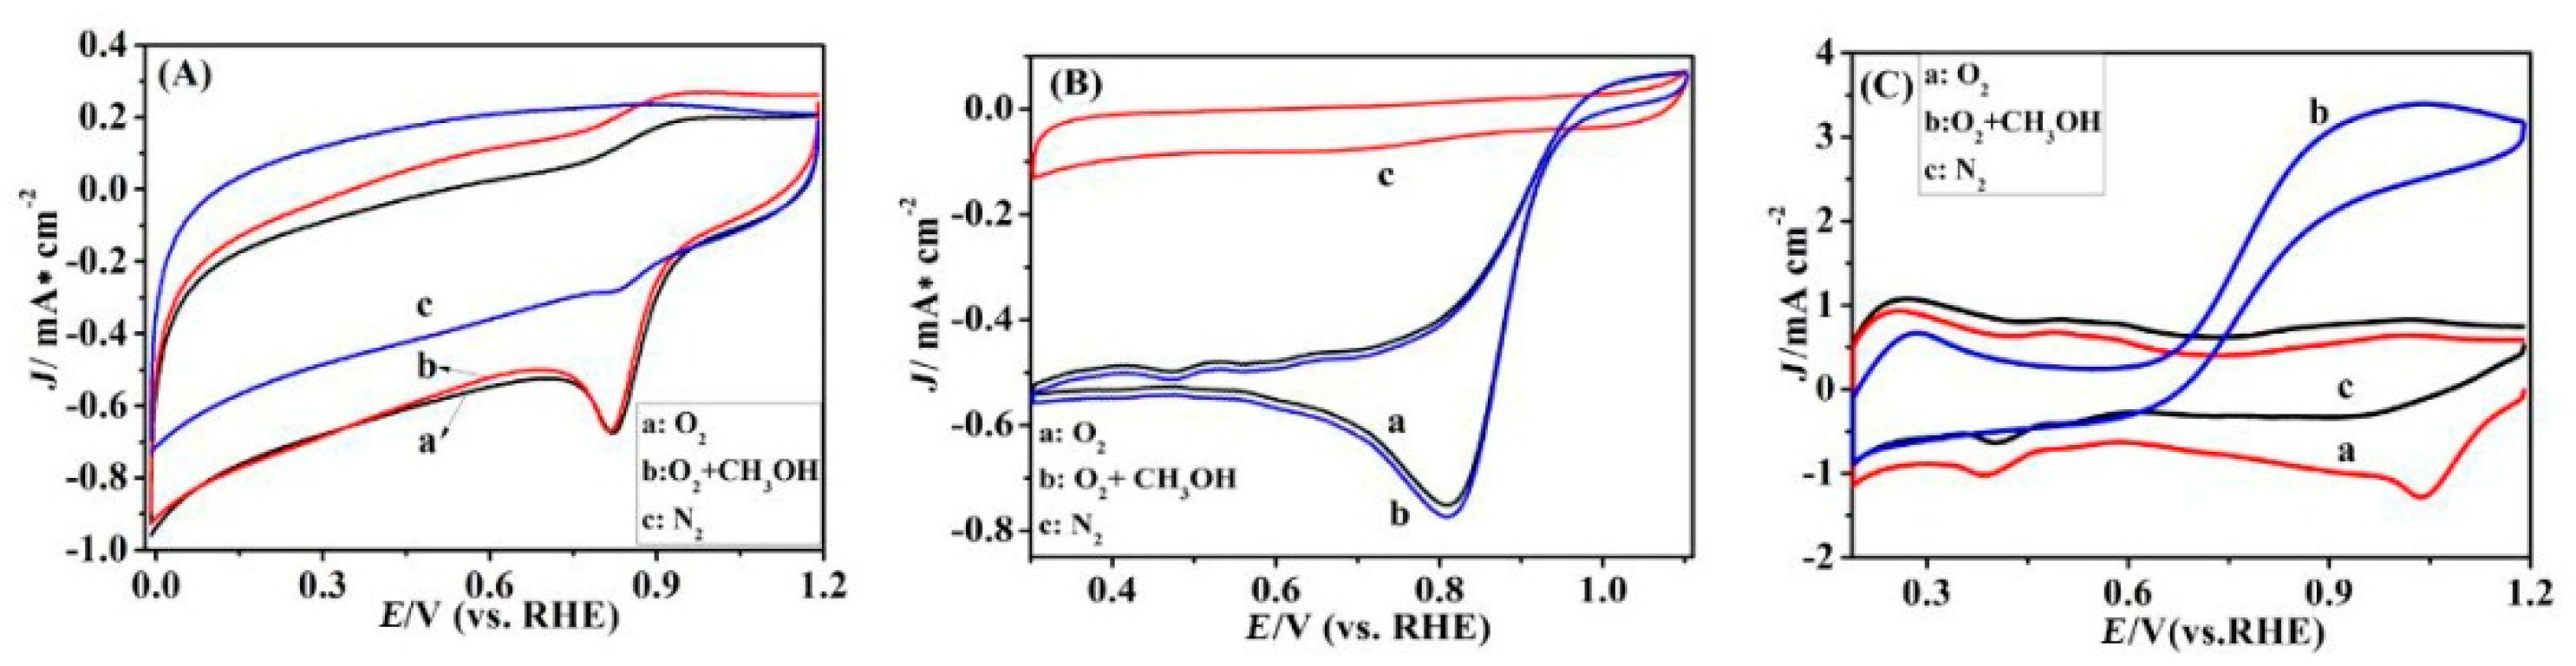
Besides, the ability of tolerance to methanol is also a significant criterion of a superior electrocatalyst for fuel cell. The as-prepared MoS
2/C composite was tested by CV scans in O
2-saturated 0.1 M KOH with 10 vol% methanol (
Figure 9). The value of the oxygen reduction current hardly changes in 0.1 M KOH or 0.1 M HClO
4 solution. This indicates that the MoS
2/C composite exhibits high selectivity for ORR to avoid crossover effect both in base and acid media. By comparison, Pt/C changes significantly after the addition of methanol, which is manifested as a methanol oxidation reaction, indicating that Pt/C is highly sensitive to methanol infiltrated from anode in fuel cells.
The chronoamperometric curves (i-t,
Figure S6a,b) of as-prepared MoS
2/C display a slow attenuation and retain 87 and 80% of original current in 0.1 M KOH or 0.1 M HClO
4 solution after 20,000 s. In contrast, after the experiment was carried out for 20,000 s, the current loss of MoS
2 was 32%, and Pt/C also gradually decreased, and the current loss was about 47%. The result distinctly indicates that the prepared MoS
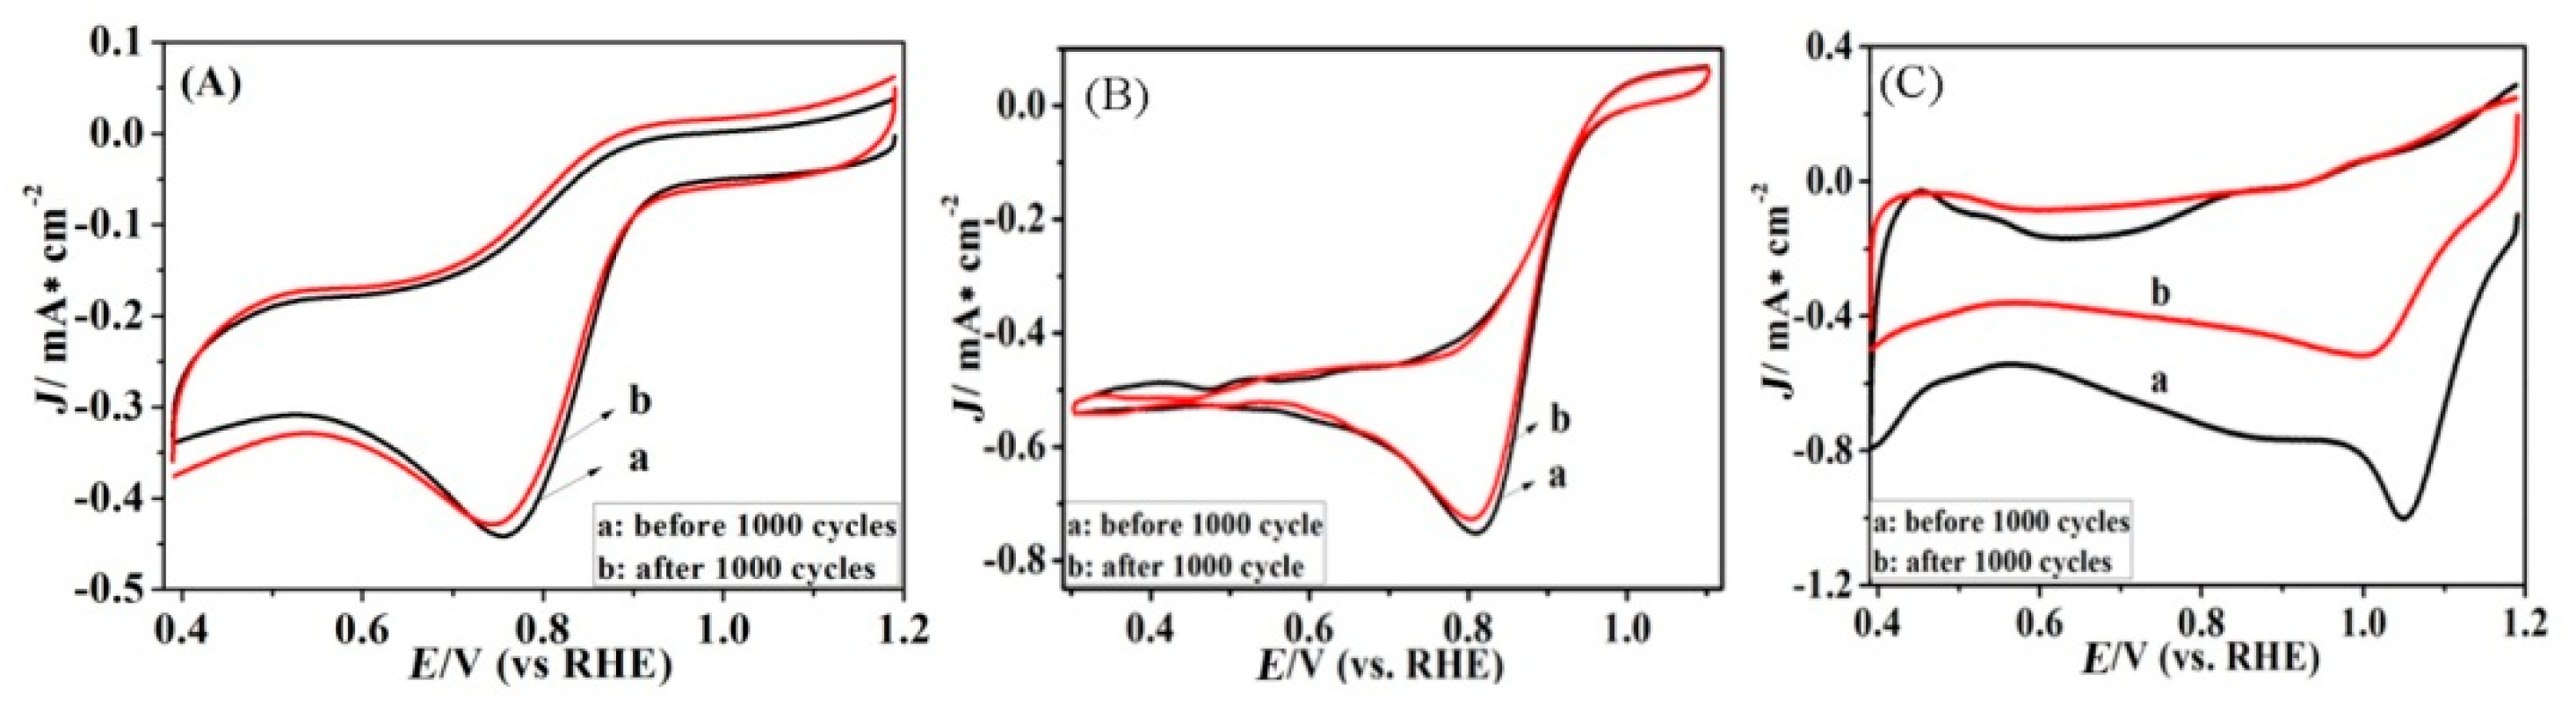
2/C has high durability, which is better than Pt/C catalyst. In addition, after 10,000 cycles from 0.4 to 1.2 V, it can be observed that the ORR peak potential and current density of MoS
2/C in 0.1 M KOH (
Figure 10A) hardly change. The same is true in 0.1 M HClO
4 solution (
Figure 10B). The ORR peak potential of Pt/C (
Figure 10C) has shifted by nearly 50 mV and the current density has been reduced by nearly two times, which further reveal that the MoS
2/C composite possesses higher stability and is better than Pt/C catalyst.
3. Experimental
3.1. Reagents and Chemicals
Sodium molybdate dihydrate (Na2MoO4·2H2O), thiourea (CH4N2S), potassium hydroxide (KOH), perchloric acid (HClO4), methanol, ethanol, and isopropanol were obtained from Sinopharm Chemical Reagent Co., Ltd. Vulcan XC-72R was obtained from Cabot (Boston, MA, USA). Commercial 20% Pt/C catalyst was acquired from Alfa Aesar. Nafion® 117 solution was purchased from Aldrich. All regents were used as received without further purification.
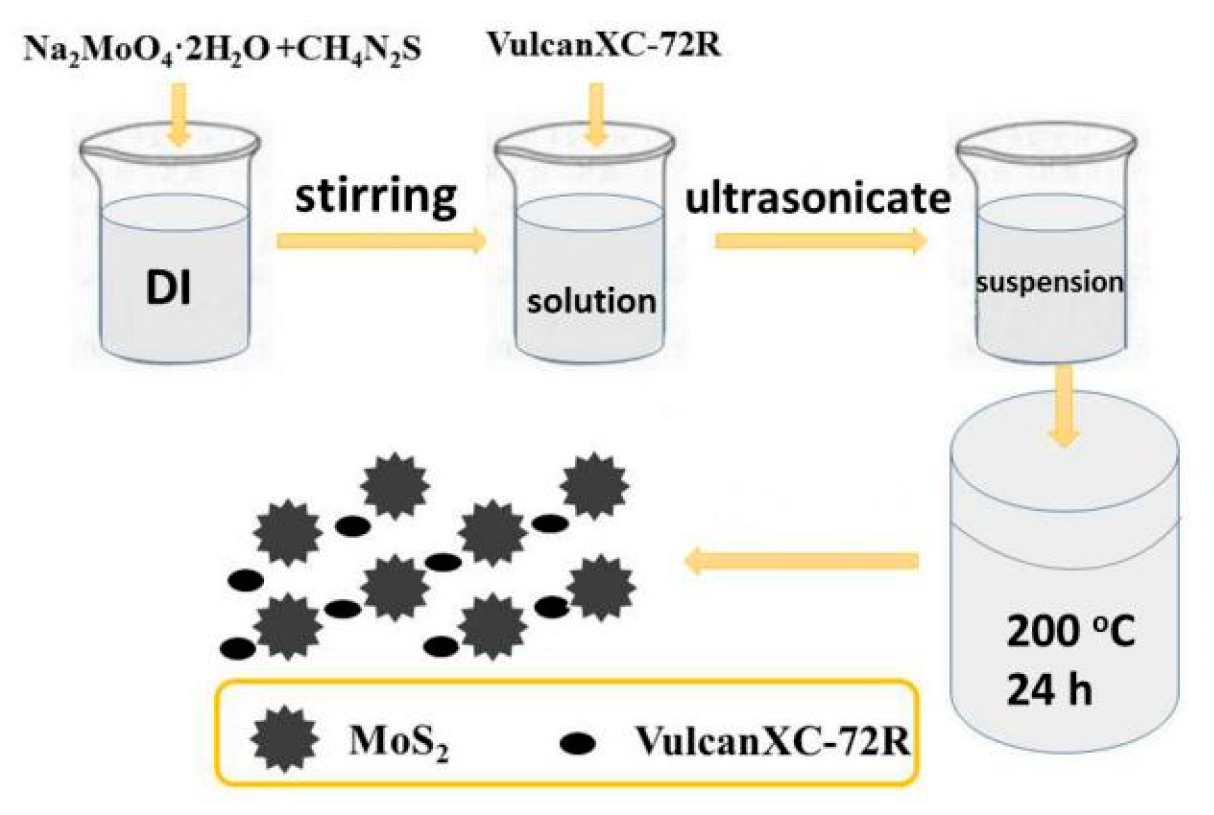
3.2. Synthesis of MoS2/VC Composite
Typical one-plot synthesis of MoS
2/Vulcan XC-72R composite (MoS
2/C) was described in
Scheme 1 (all reagents used in the preparation are of analytical pure grade). As illustrated in
Scheme 1, 1 mmol Na
2MoO
4·2H
2O and 2 mmol CH
4N
2S were added in 35 mL of deionized (DI) water with stirring. Then, 25 mg VC was added into the above solution. The resulted mixture was ultrasonicated for 1 h. Then, it was added into 100 mL Teflon-lined stainless steel autoclave in 200 °C for 24 h. The as-prepared black powder was centrifugal washed with DI water and ethanol. Finally, it dried at 60 °C under vacuum. For comparison, 15, 20, and 30 mg of VC were also considered for synthesis and the obtained samples were denoted as MoS
2/C-15, MoS
2/C-20, and MoS
2/C-30, respectively.
3.3. Physicochemical Characterization
Phase analysis of materials was observed by XRD (X-ray diffractometer, Siemens D5005, Berlin, Germany) in Cu Kα radiation. XPS (X-ray photoelectron spectroscopy, Quantum-2000 Scanning ESCA Microprobe system, Chanhassen, MN, USA) were carried out to analyze the valence state of element, which is tested in the excitation source of Al mono K radiation at the pass energy of 46.95 eV. The scanning electron microscopy (SEM, JEOL 7500F, Hitachi, Tokyo, Japan) and transmission electron microscopy (TEM, Philips TECNAI G2, 200 KV, FEI, Hillsboro, OR, USA) were tested to observe the size and morphology of materials. The Brunner-Emmet-Teller (BET, Coulter Omnisorp 100cx analyzer, Brea, CA, USA) was used to obtain the specific surface area.
3.4. Electrochemical Measurements
In ORR test, the relevant electrochemical characterization was performed on a electrochemical workstation (CHI 660E). Electrode material preparation: The glassy carbon electrode (GCE, 5 mm in diameter, Pine Research Instruments) was served as working electrode; counter electrode is a graphite rods, and reference electrode uses saturated Ag/AgCl (3 M KNO3) with double junction.
All potentials would be referred to RHE. As follows:
Pre-treatment of GCE: The GCE was firstly polished by α-Al2O3 with particle size of 1.0, 0.3, and 0.05 µm, respectively, and then washed with distilled water. Afterwards, it was ultrasonicated with anhydrous ethanol and DI for about 1–2 min, respectively. Cyclic voltammetry was used to scan repeatedly in 0.5 M H2SO4 solution (−0.25 V~1.0 V (vs. Ag/AgCl)) until it reached a stable state. After that, it was washed with DI, and dried slowly with N2.
Pre-treatment of catalyst: 5 mg catalyst was dispersed in a mixed solution (0.3 mL isopropanol (IPA), 0.6 mL DI, 0.1 mL 5% Nafion® 117 solution (Alfa Aesar)). Next, 3.6 μL dispersion solution were coated on the treated GCE, and dried naturally.
Electrochemical test: (1) Cyclic voltammetry (CV) curve: 0.1 M HClO4 (acidic medium) or 0.1 M KOH (alkaline medium) was used as an electrolyte (passing through O2/N2 to saturation (about 45 min)). The treated electrodes were penetrated into the solution, and the scanning range was −1.0~0.2 V (vs. Ag/AgCl) (acidic medium: −0.4~ 0.8 V (vs. Ag/AgCl)). The scanning rate was 100, 80, 50, 30, 20, 10 mV s−1 to obtain CV curves, respectively. (2) Rotating ring disk (RRDE) curve: The rotational speeds were 225, 400, 625, 900, 1225, 1600, 2025, and 2500 rpm, respectively. (3) Continuous CV curves were tested in O2 saturated 0.1 M KOH (or 0.1 M HClO4) solution with scanning intervals ranging from −0.6 to 0.2 V (vs. Ag/AgCl) (acidic medium: 0 to 0.8 V (vs. Ag/AgCl)), scanning speed of 20 mV s−1, and continuous scanning of 10000 cycles. (4) Methanol tolerance test was performed in a mixture solution of 0.1 M KOH (or 0.1 M HClO4) and 10% methanol. The electrochemical impedance (EIS) was conducted in 0.1 M KOH (or 0.1 M HClO4) solution at a fixing current density. The time-current (i–t) curve was performed in O2 saturated 0.1 M KOH (or 0.1 M HClO4) solution for 20,000 s.
The rotating ring-disk electrode technique (RRDE) could be also used to determine electron transfer number (n) and the production of H
2O
2 toward ORR. The correlation formulas is as follows:
In above formulas, ID and IR represent the ring current and the ring current. N represents collection efficiency (0.37).


