
Evaluation of the Activation Procedure on Oxone Efficiency for Synthetic Olive Mill Wastewater Treatment


CIEPQPF—Chemical Engineering Processes and Forest Products Research Center, Department of Chemical Engineering, Faculty of Sciences and Technology, University of Coimbra, Rua Sílvio Lima, 3030-790 Coimbra, Portugal
*
Author to whom correspondence should be addressed.
Catalysts 2022, 12(3), 291; https://0-doi-org.brum.beds.ac.uk/10.3390/catal12030291
Submission received: 29 December 2021
/
Revised: 25 February 2022
/
Accepted: 2 March 2022
/
Published: 4 March 2022
(This article belongs to the Special Issue Photo/Electrocatalysis for Wastewater Treatment)
Abstract
:Wastewater from the olive oil industry is an environmental problem which is growing in the Mediterranean region. Presence of phenolic compounds and high organic matter load are characteristics of this effluent that make it difficult to treat. In this study, the applicability of sulfate radical based advanced oxidation processes (SRbAOPs), using peroxymonosulfate (PMS) as oxidant, was evaluated in the treatment of synthetic olive mill wastewater (OMW). Different procedures for PMS activation were studied such as activation by Fe(II), radiation (visible and UV-A) and ultrasounds. The operation conditions were optimized by testing pH values, Fe(II) and PMS loads. At optimal conditions ([PMS] = 1600 mg/L, [Fe2+] = 700 mg/L and pH = 5) 60 ± 2% COD removal was achieved. This process shows to be selective since complete degradation of 3,4,5-trimetoxybenzoic acid was obtained after 3 min of reaction. The addition of light, PMS/LED/Fe(II) and PMS/UV-A/Fe(II), did not increase the efficiency of organic matter removal, with 56 ± 2% and 58 ± 1% of COD removal, respectively, comparatively to PMS/Fe(II) (60 ± 2%). PMS activated by ultrasounds led to 52 ± 3% and 23 ± 2% removal of phenolic compounds and COD, respectively, after 60 min. Toxicity tests using Lepidium sativum showed that treatment with PMS/UV-A led to a treated sample with mild inhibition of plant growth.
1. Introduction
Over the last 20 years, olive oil production and consumption has been constantly growing with the olive oil industry being one of the largest in the world [1,2]. It should be noted that the Mediterranean region alone produces 97 % of worldwide olive oil, while other European Union (EU) countries produce 80–84% [3]. Consequently, this region is responsible for environmental problems due to the large production of liquid and solid wastes resultant from that industry, namely olive mill wastewater (OMW) and olive pomace (OP). OMW causes a lot of concern due to effects on the environment such as coloring of natural waters, odors, harmful impact on aquatic life, and soil and water pollution [4,5]. However, it is worth mentioning that the EU does not have specific legislation for OMW treatment allowing its Member States to establish their own legislation [3]. OMW are complex effluents due to their high variability associated with different olive cultivation and processing practices, but overall OMW present acid pH (~5) and high chemical oxygen demand (30–318 g/L). Besides, these streams are toxic mainly due to the high content of phenolic compounds (0.5–24 g/L). Thus, this effluent must be properly treated before being released into water environments to avoid environmental damages [3,5,6]. The conventional treatment processes usually based in biological systems are generally not very efficient for such type of wastewater.
Advanced oxidation processes (AOPs) proved to be alternatives to traditional processes (e.g., physical-chemical and biological) for the degradation of organic and inorganic contaminants in aqueous environments. Sometimes AOPs can be combined with traditional processes wherein firstly pollutants are converted into substances exhibiting higher biodegradability and/or lower toxicity which can later be removed by conventional processes [4,7]. During several years, the main studied AOP was the Fenton process in which H2O2 is activated by ferrous ion to produce the hydroxyl radicals (OH•) with potential oxidation (E0) of 2.8 V. In fact, this process operates at room conditions of pressure and temperature while requiring easy to handle reactants. Still recently, sulfate radical based AOPs (SRbAOPs) have been proposed as promising alternatives to circumvent some of the Fenton process limitations. The greater stability and therefore longer half-life time of the sulfate radical (SO4•−, E0 = 2.5–3.1 V), as well as an increased solubility in aqueous solution in comparison to OH•, the fact that hydroxyl radicals react by unselective pathways and the wide pH range of the sulfate radicals are some advantages of using SRbAOPs as alternative to Fenton process [7,8]. Peroxymonosulfate (PMS, HSO5−) and persulfate (PS, S2O82−) are two of the most used oxidants to produce SO4•− with an oxidation potential of 1.8 and 2.01 V, respectively [7,9]. PMS is a triple potassium salt with the chemical formula 2KHSO5·KHSO4·K2SO4, but two of the three sulfur salts are inactive and do not participate in the activation reaction. PMS can be activated to form sulfate radicals in different ways, such as applying transition metals as catalysts, ultrasound (US), radiation, microwave, carbon catalysts, and heat and electron conduction. However, the activation with transition metals is more viable comparatively to heat and UV (Equation (1)) since these last methodologies imply energy expenditure [7,10,11].
The most common transition metal used for PMS activation is Fe(II) and its mechanism can be described by Equations (2)–(4). It should be noted that during the PMS activation, sulfate radicals, sulfur pentoxide radicals (SO5•−), and hydroxyl radicals can be formed [7,10,11].
However, independently of activation way, pH value is a crucial parameter as it affects chemistry of the catalysts as well as of the target contaminants, oxidation potential of the reactive oxygen species, decomposition of oxidant to generate free radicals as well as the formation of the transition metals species and their availability for reaction with oxidant [12,13].
Different AOPs have already been studied both for the real and synthetic OMW. Table 1 presents some examples of such application.
Some researchers have reported that a combination of the transition metal cobalt (Co) and PMS act in an effective manner for organic degradation in wastewater treatment, but its use is not recommended due to its higher toxicity when compared to iron [16,17]. Rodríguez-Chueca et al. [10,16] presented studies about photolytic and catalytic activations of PMS where it was demonstrated that the combination of different forms of activation allows reaching high efficiencies of COD (chemical oxygen demand) and TOC (total organic carbon) removal in winery wastewater treatment.
Thus, the goal of the present work is to evaluate the applicability of SRbAOPs in the treatment of synthetic OMW (composed by phenolic acids). More specifically, different ways of activating the PMS (Fe(II),ultrasound, visible and UV light) will be studied for this effluent, always bearing in mind reaching the best conditions for organic matter removal. To the best of our knowledge, the degradation of synthetic OMW with PMS oxidation and different forms of activation of this oxidant have never been reported before in literature. Domingues et al. [8] recently presented a study where the degradation of a similar synthetic OMW was achieved by PS oxidation using Fe(II). This study will serve as a form of comparison whenever justified to evaluate the performance of PS and PMS in synthetic OMW degradation.
2. Results and Discussion
2.1. Activation Techniques for Sulfate Radical Based Advanced Oxidation Process
In this study different techniques for peroxymonosulfate (PMS) activation were evaluated, first by one electron transfer using Fe(II) as transition metal catalyst and secondly by homolytic cleavage of the peroxide bond of HSO5− by photolysis and sonolysis [16,18]. These techniques for PMS activation were assessed for the treatment of a synthetic olive mill wastewater, composed by a mixture of different phenolic compounds. Table 2 shows the synthetic olive mill wastewater (OMW) characterization based on phenolic compounds, COD and pH.
2.1.1. PMS Activated by Fe(II)
The performance of the sulfate radical based advanced oxidation processes (SRbAOPs) was evaluated using iron (Fe(II)) activated HSO5− by applying iron sulfate as homogeneous catalyst. The results were reported bearing in mind the removal of organic matter and toxicity. The conditions of operation were optimized in terms of the initial pH of the reaction and concentrations of Fe(II) and PMS.
Before optimizing the operating conditions, the need for PMS activation was investigated. For this, an experiment involving the use of PMS (1000 mg/L) at pH 5 during 60 min was tested. Effluent samples were collected after 30 and 60 min of reaction to evaluate the degradation achieved. At these conditions, it was possible to obtain a COD removal of 11 ± 5% after 30 min and 12 ± 4% at the end of 60 min. These low efficiencies reveal the need for PMS activation. Additionally, prolonging the reaction for another 30 min only corresponds to an increase in COD removal of 1%.
In fact, Rodríguez-Chueca et al. [16] reported the need for the activation of HSO5−, namely with different sulfate salts. The highest COD removal (51%) obtained during winery wastewater treatment was achieved when FeSO4 was applied showing the potential of Fe(II) for SRbAOPs activation. Rodríguez-Chueca et al. [10] reported 87% of COD removal in the treatment of synthetic winery wastewater by activating PMS with Fe(II) upon a reaction length reaching 180 min. Hence, the need for the activation of HSO5− is clear as well as the potential of Fe(II) for this purpose.
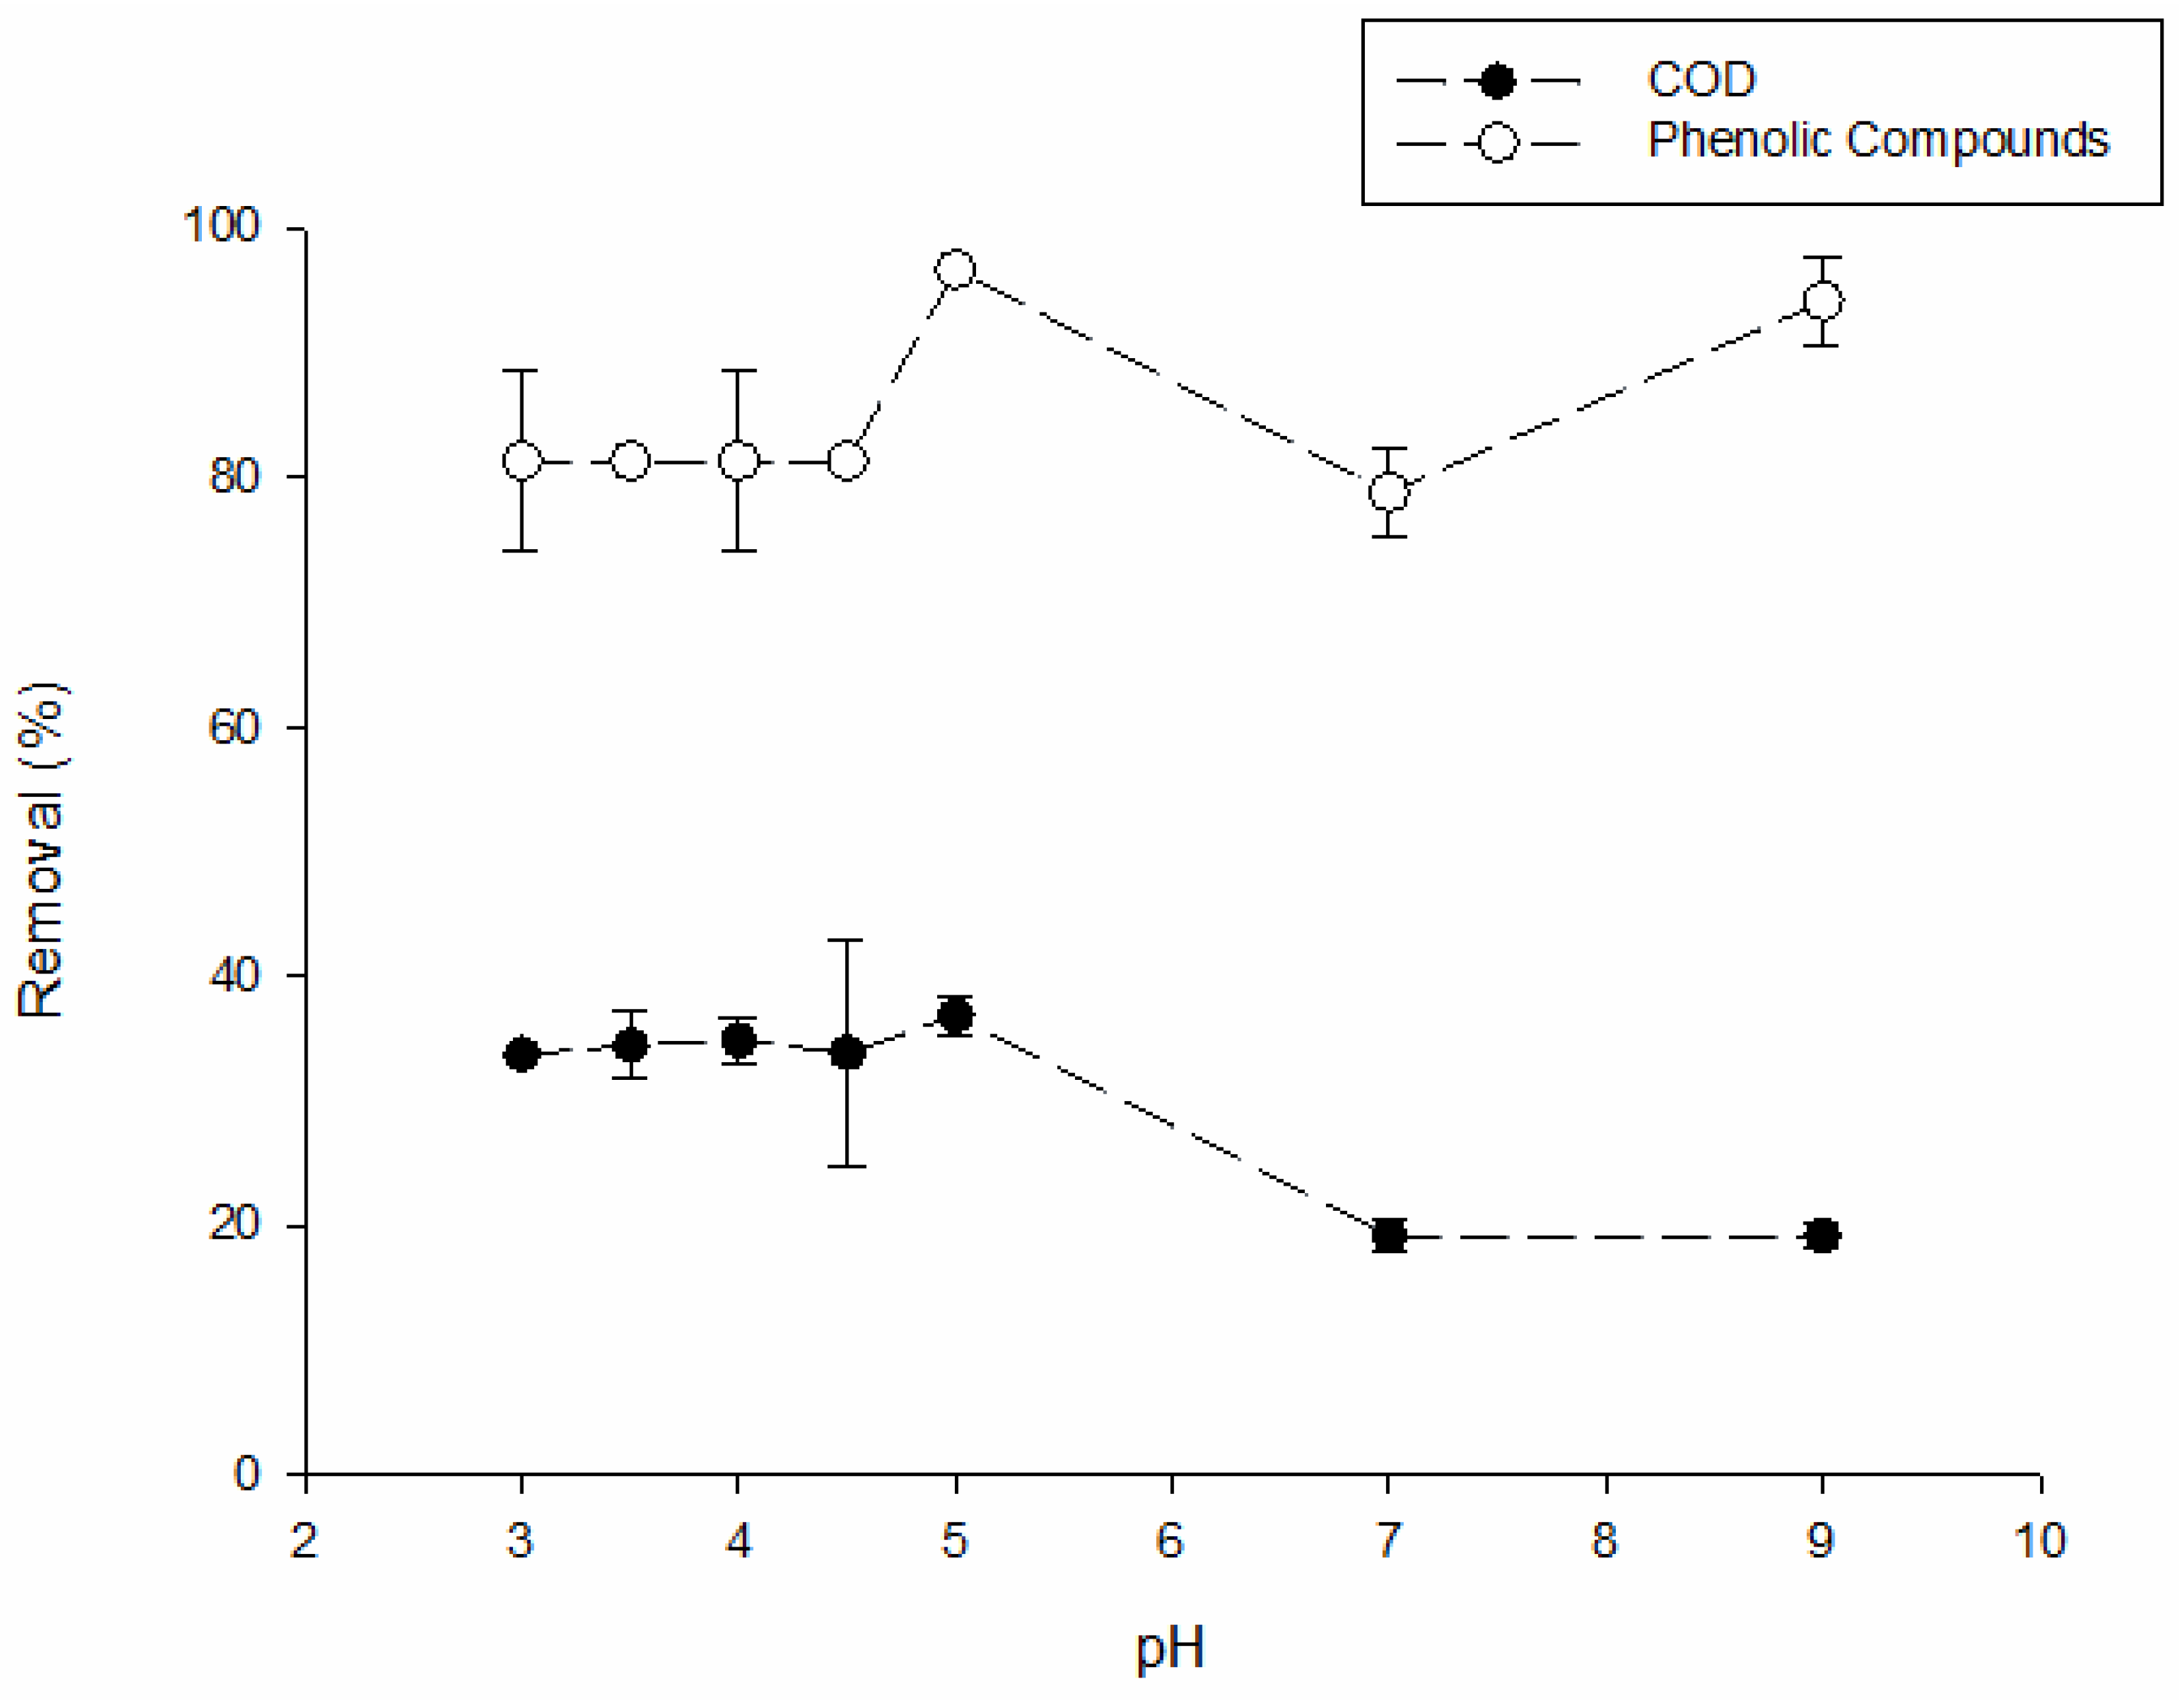
In a first phase, the effect of the solution initial pH in PMS/Fe(II) was studied because this is a critical parameter for iron-based activation systems as it affects the decomposition of oxidants (PMS in this case) as well as the structural form of iron species and target contaminants. pH tests were carried out with fixed concentrations of Fe(II) and PMS concentration, 300 mg/L and 1000 mg/L, respectively. Figure 1 represents the initial pH influence on COD and phenolic compound removal after 30 min of reaction in range of 3–9.
By analyzing Figure 1, an initial pH value of 5 is more favorable for the removal of both phenolic compounds (97%) and COD (37 ± 1%). However, tests with pH below 5 show COD removals very close to the results achieved with pH 5. However, the same was not verified for the phenolic compounds. Unlike what was demonstrated by Domingues et al. [8] in the studies of persulfate activation ([Fe2+] = 300 mg/L, [PS] = 600 mg/L), the phenolic compounds removal is affected by pH value.
In fact, for homogeneous systems when Fe2+ and Fe3+ is present, the degradation process is favored by acidic conditions. But extremely acidic conditions (pH < 2.5) would result in the formation of ferreous complexes which can reduce the availability of Fe2+ and subsequently hinder the activation performance [9]. It was also reported that at a pH value lower than 5, hydrogen ion (H+) scavenges sulfate and hydroxyl radicals [13]. The low removal of COD at alkaline conditions can be caused by the formation of hydroxyl radicals which, although having an oxidation potential similar to sulfate radicals, present a shorter life span [8]. Bearing in mind phenolic compounds and COD removal, pH 5 was selected as the optimal value for the following experiments. This value is near the one reported by Rodríguez-Chueca et al. [10] who reached an optimal pH value of 4.5. Comparing with the previous study of Domingues et al. [8] for PS, pH 5 was also more favorable for persulfate activation.
In these tests, it was also verified that, during the reaction, regardless the initial value, the medium pH decreased (for values between 2 and 3) which may explain the slight differences found for the degradation achieved by the different initial pH values studied. This fact was also reported by Domingues et al. [8] and justified by Fan et al. [19] due to the reaction of the sulfate radical with OH− and the consequent formation of H+. It is very important to optimize the PMS and catalyst load to achieve an optimal ratio for maximum production of sulfate radical. Otherwise, excessive amounts of PMS and transition metals can act as scavenger for sulfate radical [13]. This is also a key point when OPEX is considered since the operating costs of this treatment process are specially related to PMS and Fe(II) loads applied.
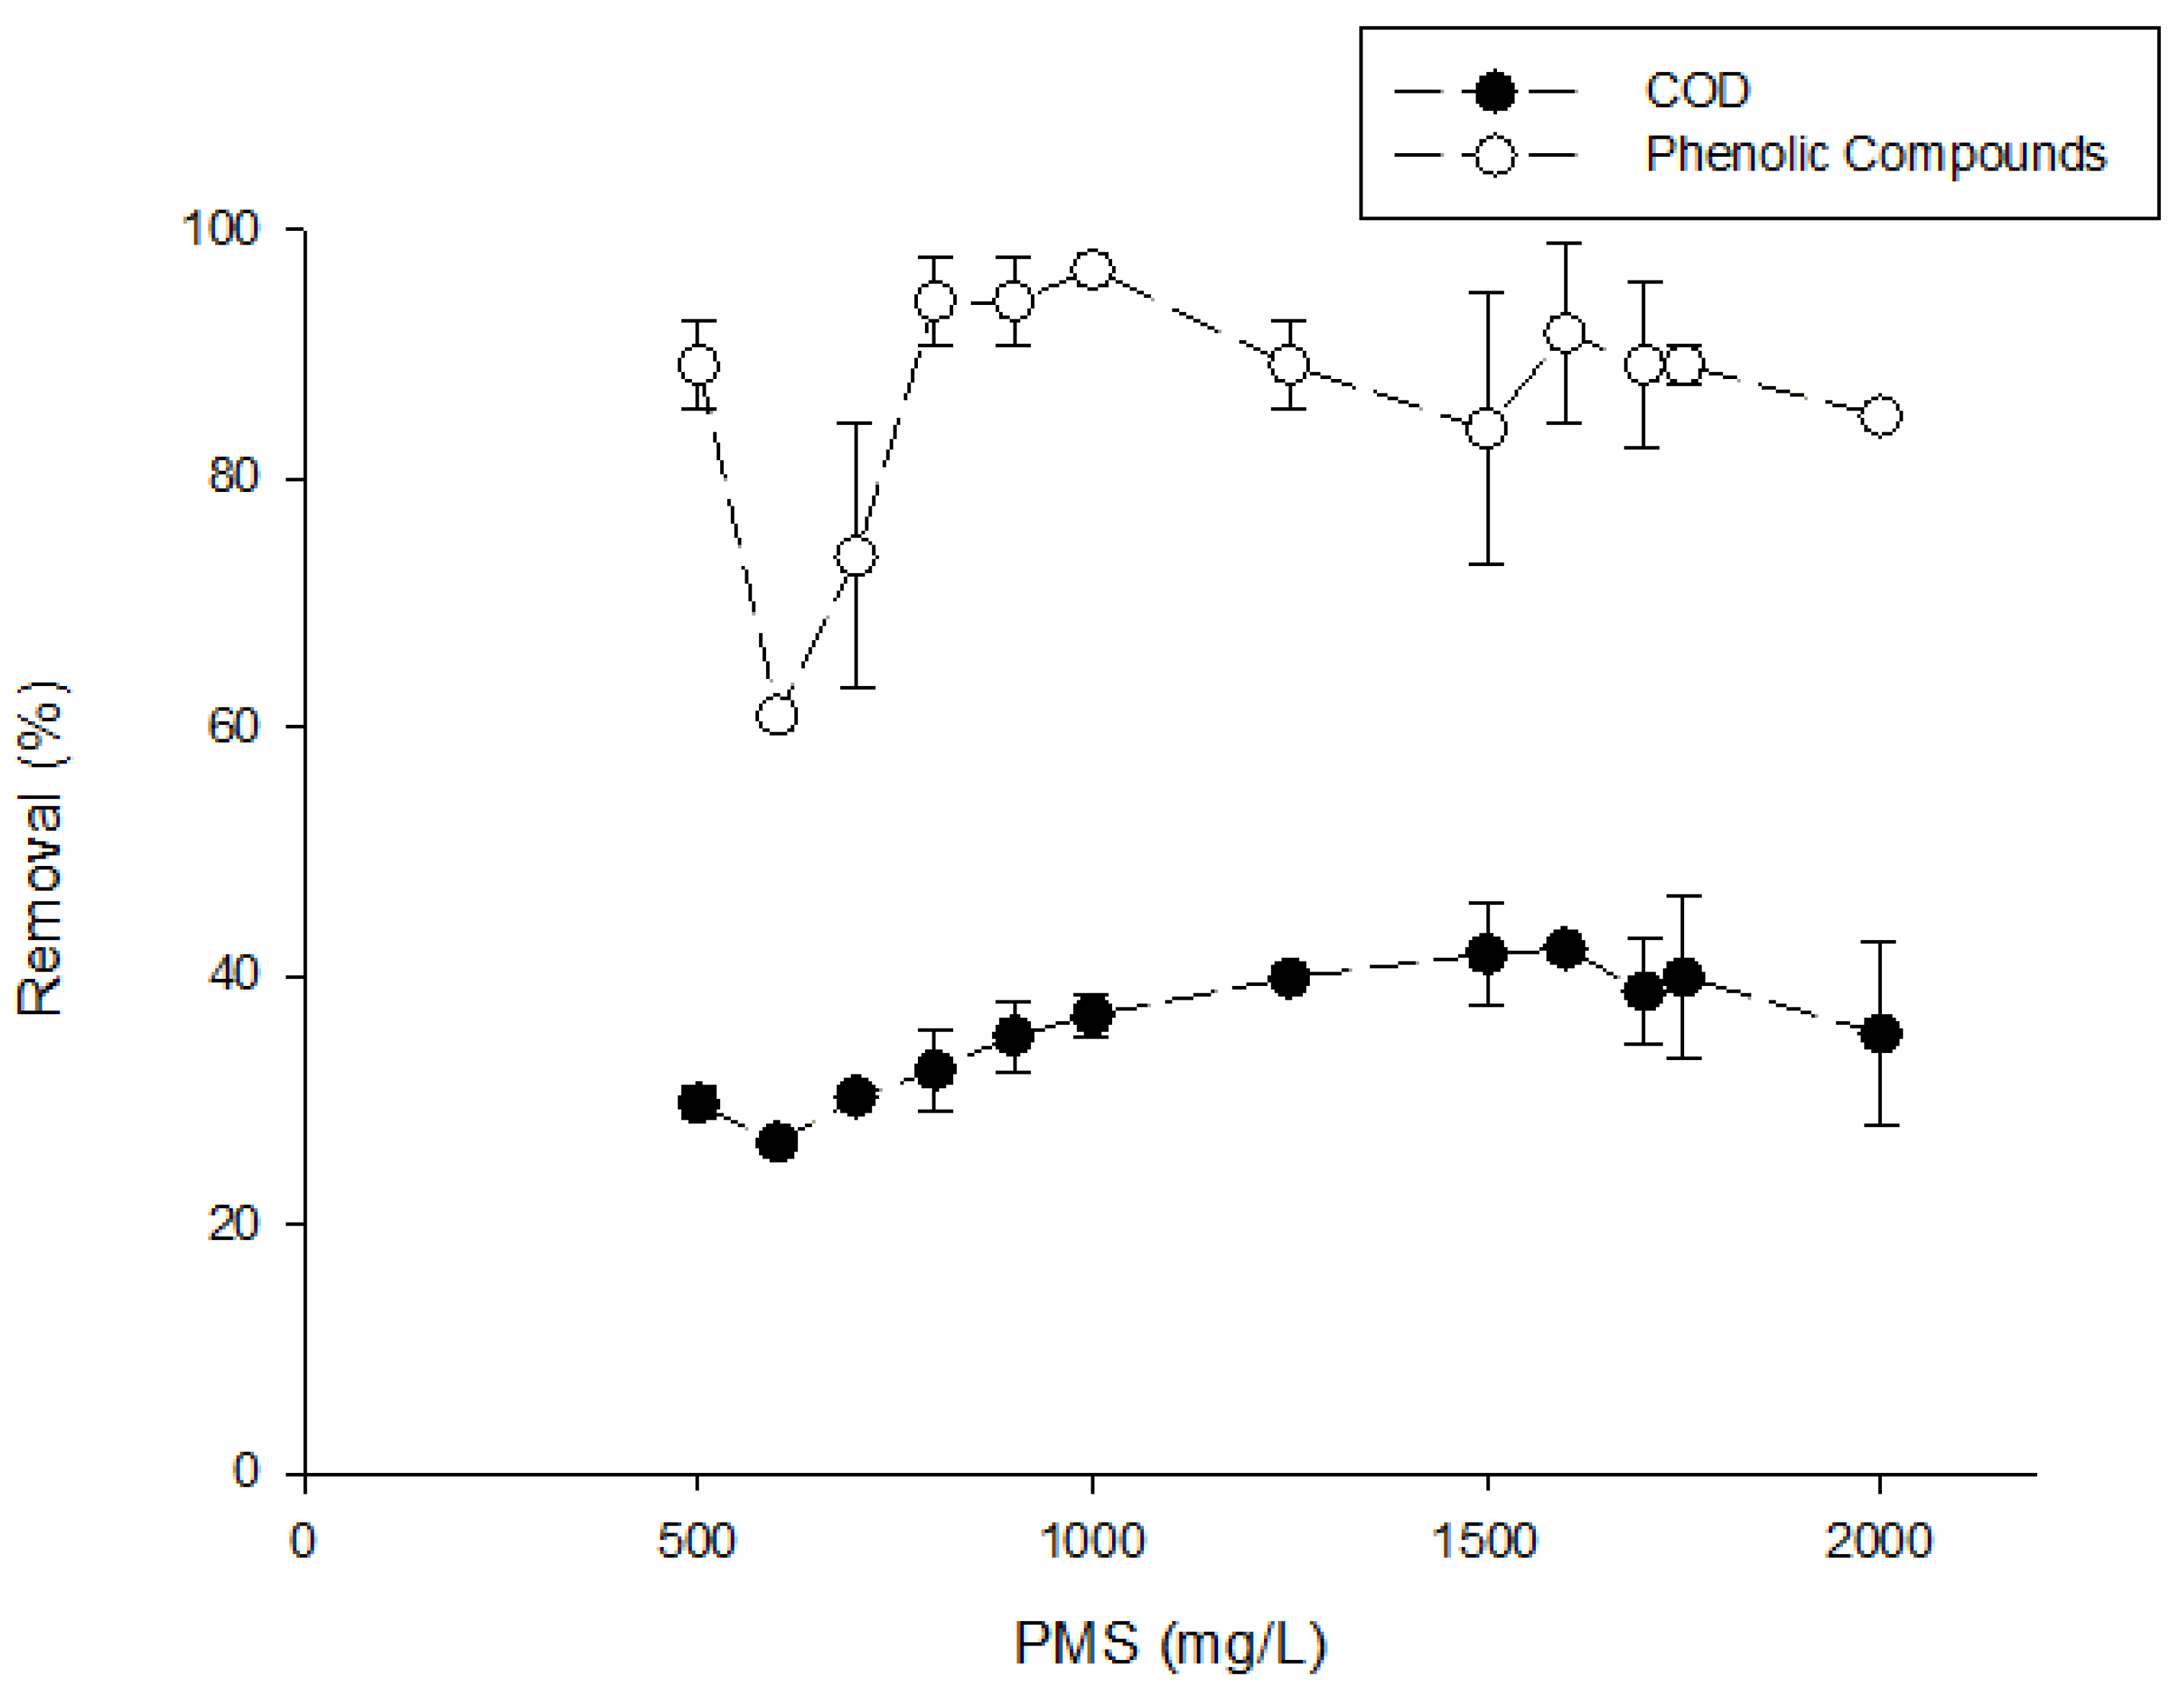
In the PMS concentration effect tests, the initial concentration of Fe(II) and value pH were kept constant and equal to 300 mg/L and 5, respectively. The PMS load was analyzed within the range of 500–2000 mg/L. Figure 2 shows the PMS load influence in COD and phenolic compounds removal after 30 min of reaction.
Through Figure 2 analysis, it was observed that a PMS concentration of 1600 mg/L led to a maximum COD removal of 42%. From 600 to 1600 mg/L there was an increase in the COD removal efficiency, and from this point onwards the removal efficiency decreased again probably due to scavenging effect. As it can be seen for the phenolic compounds removal curve, the maximum removal was obtained for a PMS concentration of 1000 mg/L (97) but COD degradation is only 37± 2%. Thus, since for 1600 mg/L the phenolic content removal is still 92 ± 7% while COD abatement is maximum, this PMS load was selected to proceed.
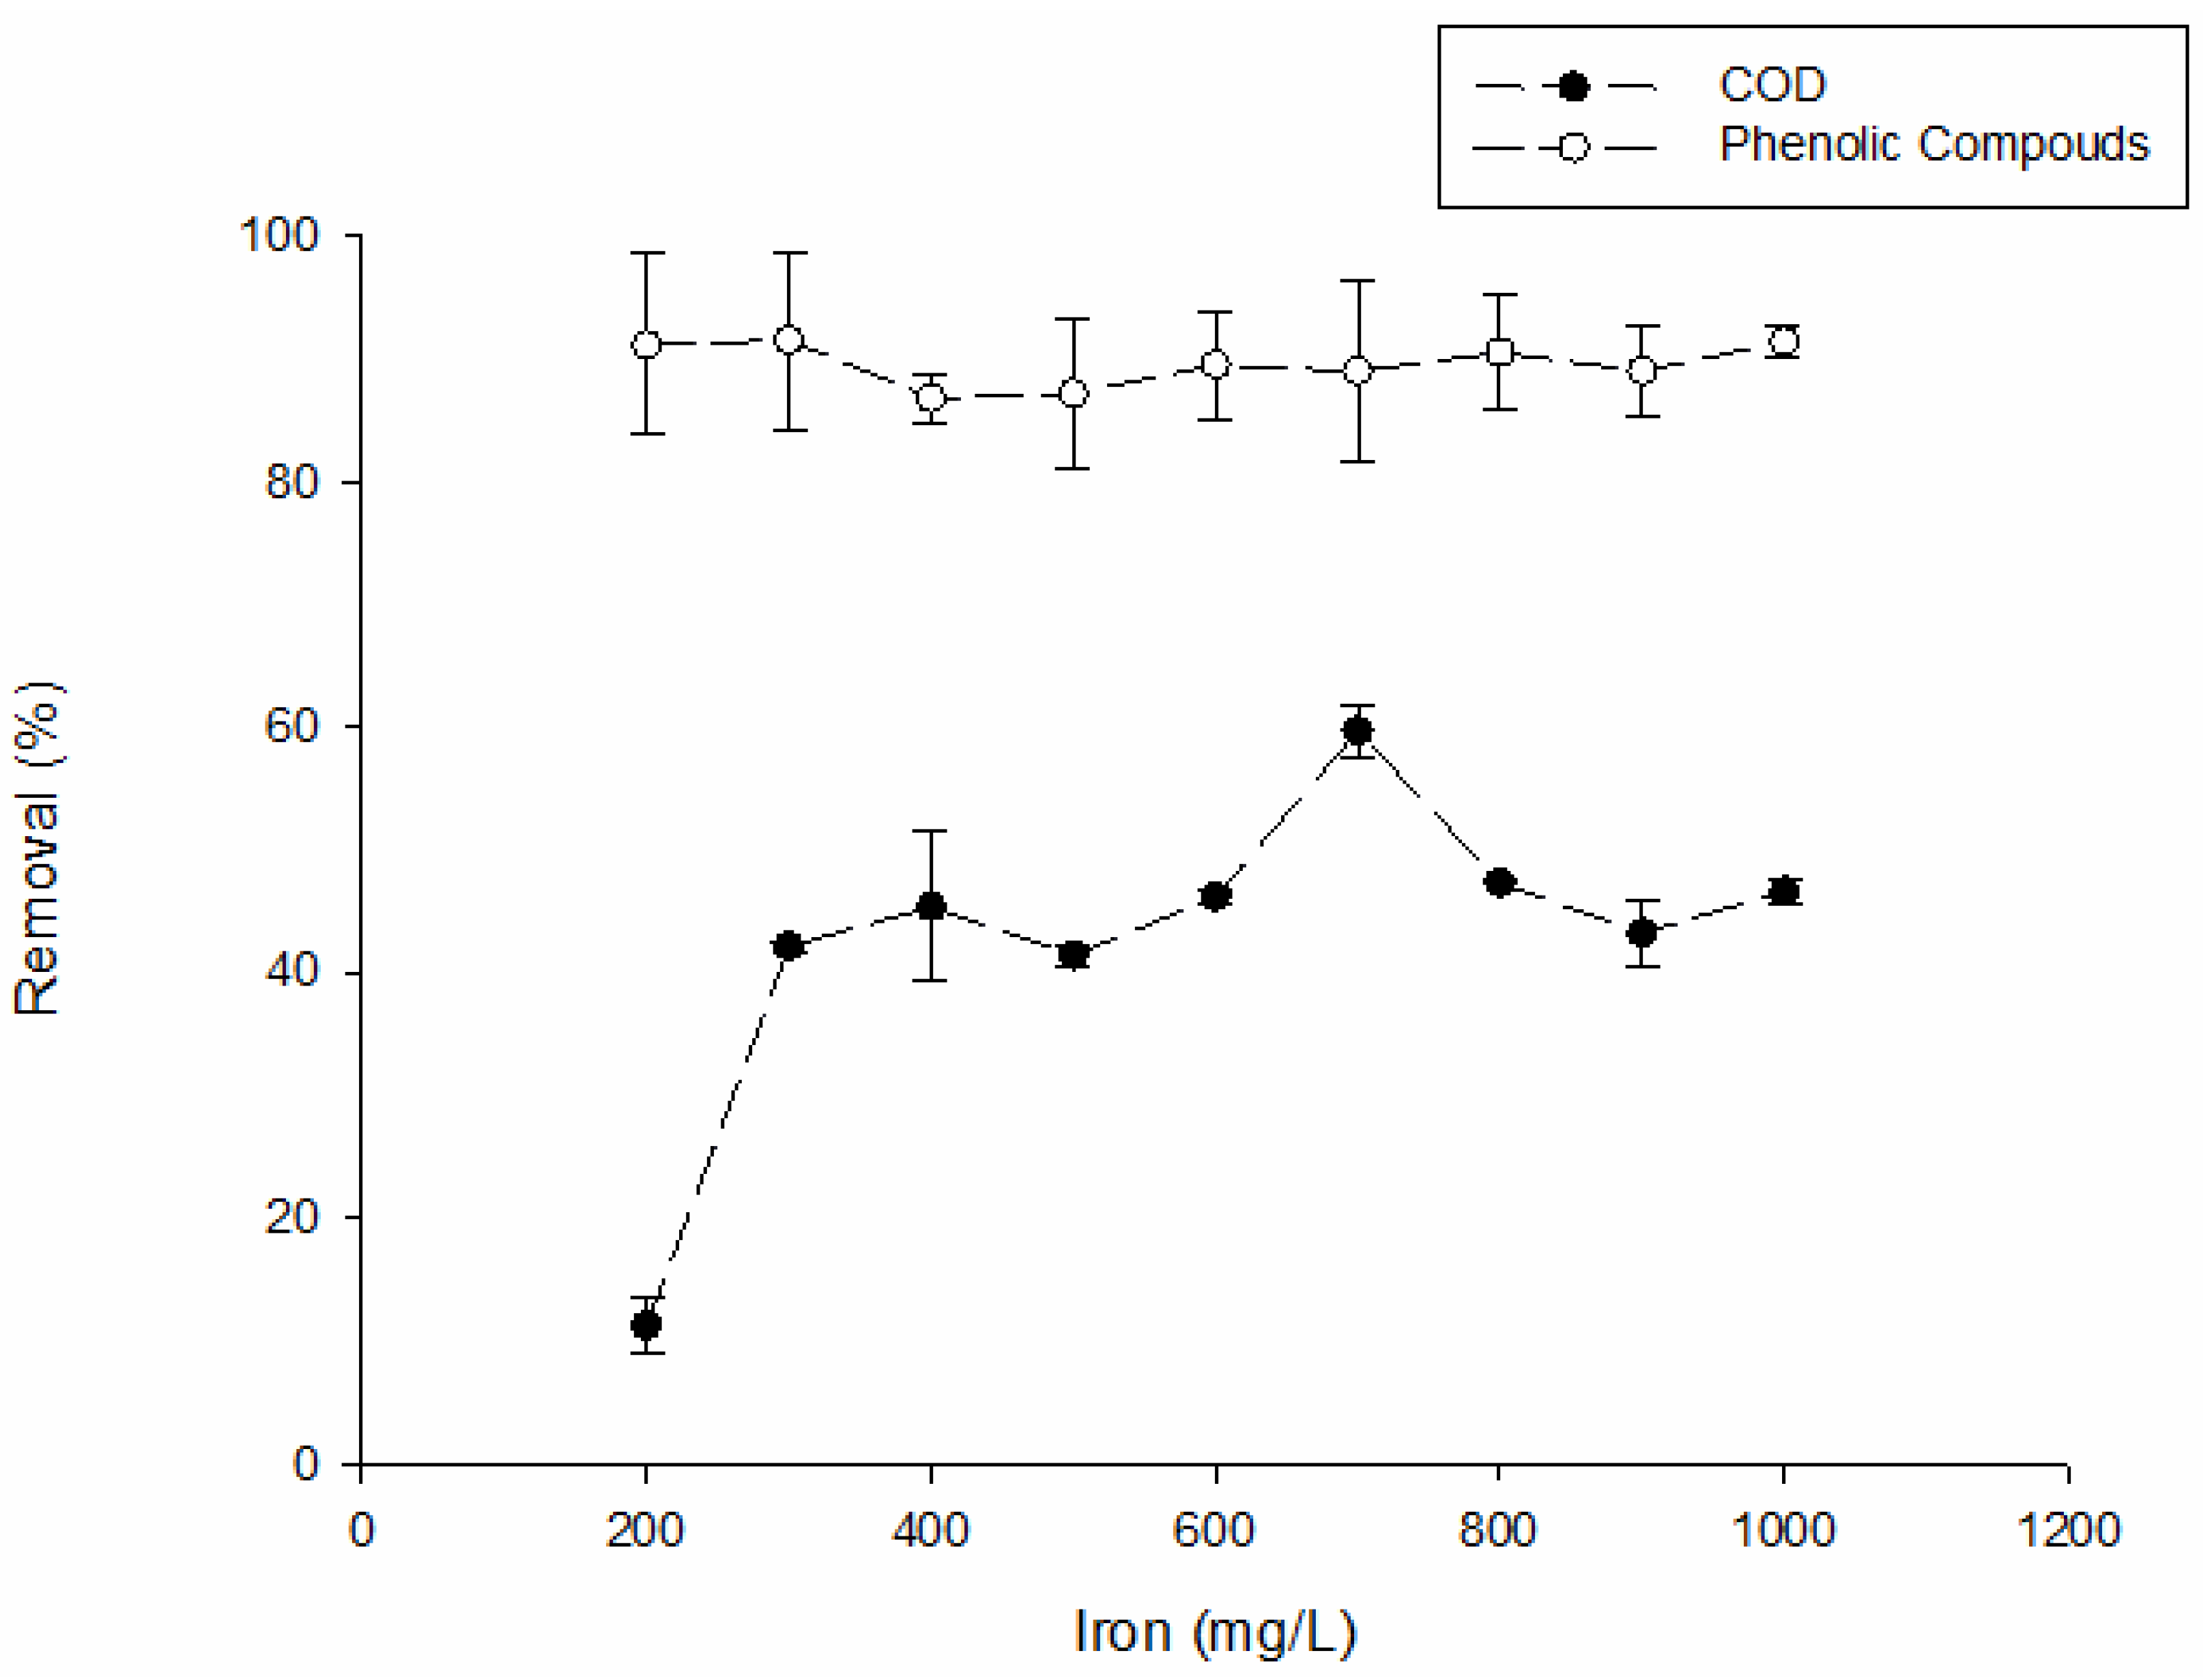
After finding the optimal concentration of PMS at pH 5, the ideal Fe(II) concentration was studied. For this study, the iron load was analyzed within the range of 200–1000 mg/L. The results of COD and phenolic compounds removal are represented in Figure 3.
Figure 3 shows that the optimal concentration of Fe(II) is 700 mg/L leading to a COD removal of 60 ± 2%. Regarding the phenolic compounds, the removal value oscillated between 86 and 92%. The molar ratio for PMS and Fe(II) leading to the best degradation results in this study is 2:3. According to Ghanbari et al. [13] ratios of 1:1 and 3:1 were frequently observed in the literature for PMS/transition metal. Comparing the optimal conditions obtained by Domingues et al. [8] for the degradation of the same phenolic mixture using PS ([PS] = 600 mg/L, pH = 5 and [Fe2+] = 300 mg/L) with the same loads but applying as oxidant the PMS (Figure 1), it is seen that whereas for the PS there was a removal of 39% and 63% in COD and phenolic content, for the same conditions. PMS led to 27% and 61% removal for COD and phenolic compounds, respectively. This is expected since PS has a higher oxidation potential than PMS [7]. Contrarily, Sayed et al. [20] studied photocatalytic degradation of ciprofloxacin (CIP) by poly(vinyl alcohol) (PVA)-assisted TiO2/Ti film along with H2O2, PS, and PMS under solar light irradiation with [H2O2]0 = [PS]0 = [PMS]0 = 0.5 mM and pH = 6.2. The PMS proved to be the most efficient in the degradation of CIP. Still, in the current research, at the optimal conditions, ([PMS] = 1600 mg/L and [Fe2+] = 700 mg/L, PMS system led to higher COD and phenolic compounds removal than PS.
2.1.2. PMS Light Activation
PMS light activation was evaluated using two strategies: applying visible and UV light. Regarding visible light, LED lamps were applied. Studies were carried out with PMS/LED and the combination with Fe(II) (PMS/LED/Fe(II)). Once again, the activation ability was analyzed in terms of the results obtained regarding organic matter removal. For this, in a first phase PMS was activated by visible LED lamps using the optimal PMS concentration and pH ([PMS] = 1600 mg/L and pH = 5) and, in a second phase the same reaction was performed using also Fe(II) ([PMS] = 1600 mg/L, [Fe2+] = 700 mg/L and pH = 5). Samples were collected after 30 and 60 min of reaction to evaluate the effect of the reaction time. The results for 30 min can be seen in Table 3. The further increment in the reaction time until 60 min had no significant effect on the degradation efficiency. Thus, lower reaction times may be applied which will reduce the volume of the reactor at the full scale.
It is verified that adding Fe(II) to the combination PMS/LED leads to a large increase in the COD and phenolic compounds removal, 45% and 60% in 30 min respectively. However, there is no increase in COD removal using the combination of PMS/LED/Fe(II) compared to PMS/Fe(II). Thus, it seems that the activation using iron is more effective than photolysis using visible light. This can be justified by the fact that visible LED radiation cannot directly activate PS or PMS. On the other hand, visible LED light can stimulate some iron catalysts in order to promote activation performance [9]. Rodriguez-Chueca et al. [10] reported the removal of 62.5% of COD of a synthetic winery wastewater using solar radiation and 10 mM of PMS at pH 4.5 after 180 min. They stated a COD removal close to the one obtained in this study for PMS/LED after 30 min using PMS and solar radiation with 1 mM and 50 mM of PMS at pH 4.5 during the same time. Likewise, Sayed et al. [20] reported about 98.3% of degradation of ciprofloxacin by poly(vinyl alcohol) (PVA)-assisted TiO2/Ti film with PMS (0.5 mM) using a pH of 6.3 during 60 min under solar light irradiation. However, one should bear in mind that the sun spectrum is not only composed of visible radiation. The presence of other types of radiation (such as UV) may have helped in the process.
To evaluate the PMS activation by ultraviolet radiation (UV-A), the operation conditions were optimized in terms of reaction time and pH. For the study of the reaction time, a starting pH value of 3 and 1600 mg/L of PMS were applied. Figure 4 represents the effect of time in COD and phenolic compounds removal.
From Figure 4 it can be observed that after 60 min of reaction it was possible to achieve a removal of 67 ± 3 % and 22 ± 1%, for phenolic compounds and COD, respectively. PMS is proven to be photosensitive and the introduction of UV can directly lead to the photolysis of oxidants to generate radicals through Equation (1). It should be noted that the radiation wavelength may have an influence on the activation process [9]. Kaur et al. [21] has employed UV-C (200–280 nm) and UV-A (315–400 nm) to activate PS for ceftriaxone oxidation. With UV-A, the authors attained 72% of ceftriaxone degradation after 2 h, while complete ceftriaxone degradation was achieved after 15 min with UV-C. In the present study, UV-A (366 nm) presented better results when compared with visible light (380–770 nm). For 30 min of reaction, there was a COD and phenolic compounds removal of 15 ± 10% and 43 ± 2%, respectively, using UV-A. However, when PMS is activated by visible light, only 11 ± 2% and 38 ± 3% of COD and phenolic compounds were removed. This was due to decreased radiation energy in visible light, associated with higher wavelengths [22].
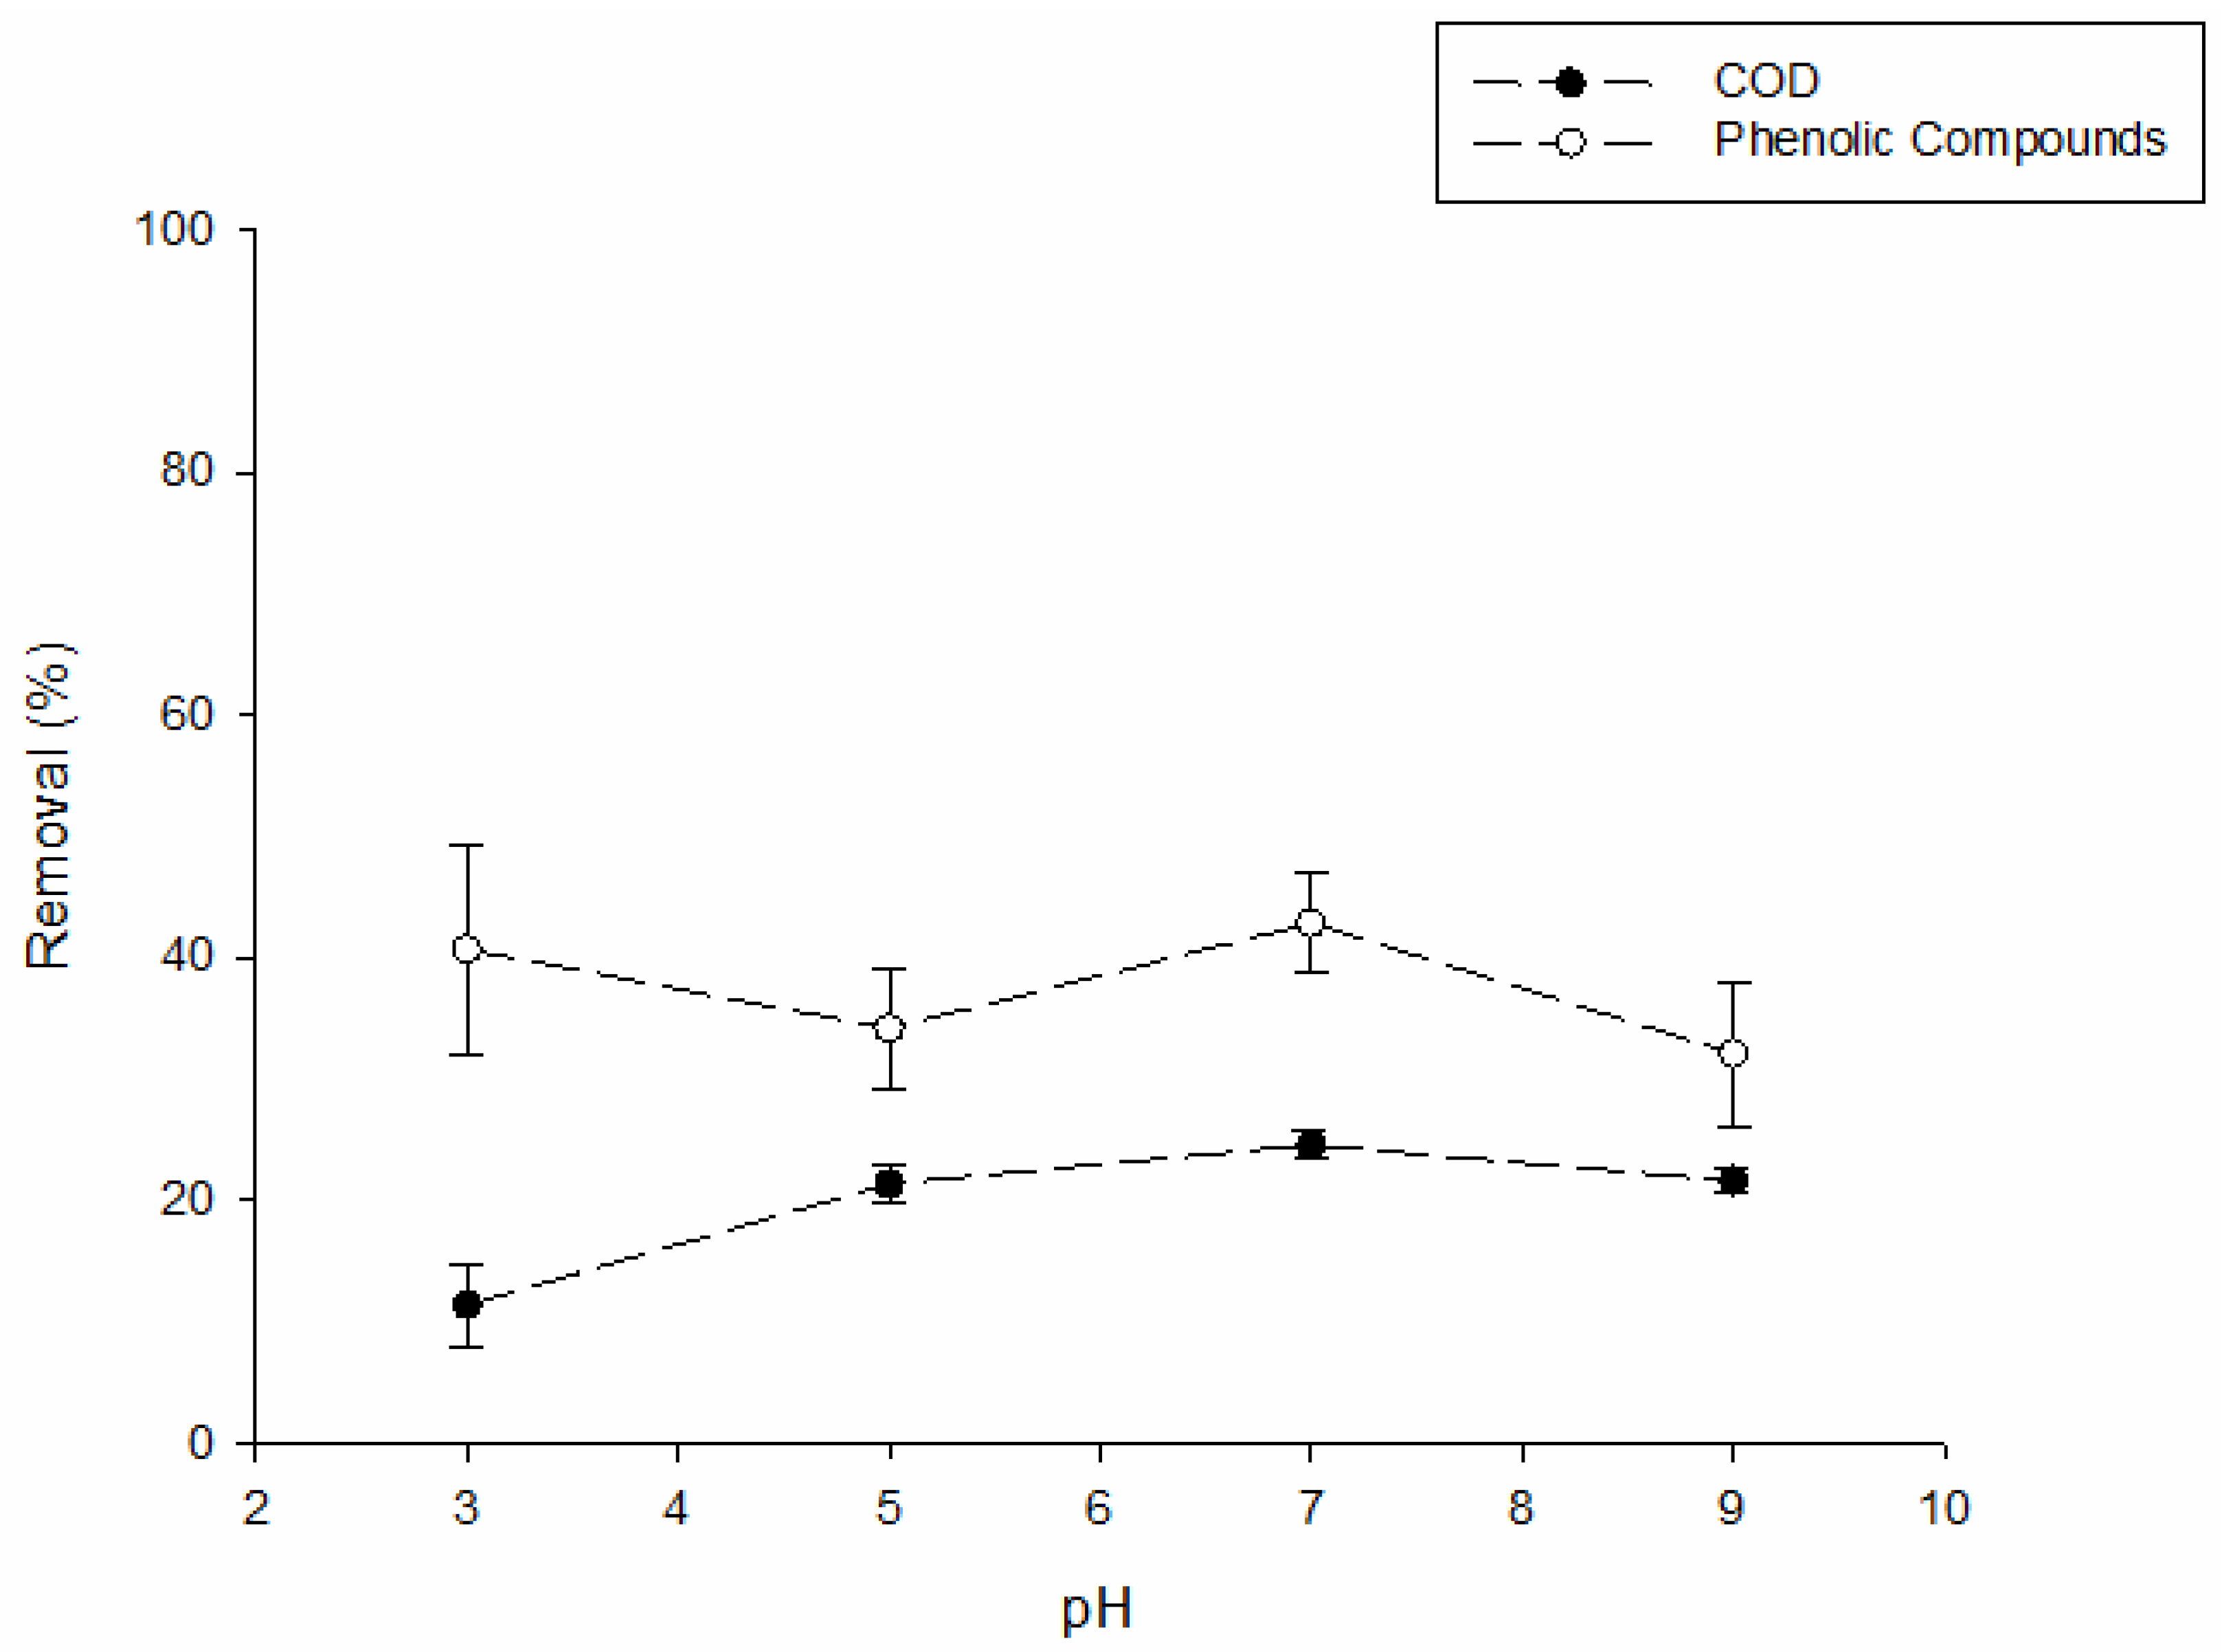
Figure 5 shows the effect of the initial pH on PMS activated by UV-A on COD and phenolic compounds removal after 15 min of reaction. From Figure 5 it is concluded that the most favorable pH for this process is 7.
In the present study, it is verified that adding Fe(II) to the combination PMS/UV-A/Fe(II) leads to a COD and phenolic compounds removal of 58 ± 1% and 85 ± 1%, respectively. This degradation is similar to the one obtained by PMS/Fe(II) alone, again showing that the activation using Fe(II) as catalyst is more effective than using light-driven activation. From Figure 5 it is concluded that the most favorable pH for this process is 7.
Guan et al. [23] studied the degradation of benzoic acid with UV (254 nm)/PMS, demonstrating a greater degradation at the pH range of 8–11. The authors demonstrated that the rate of PMS photolysis into HO• and SO•4− increased with pH. This fact can also be explained by the conversion of SO•4− to HO• at higher pH. Amor et al. [24] reported the removal of 96% of COD using 25 mM of PS at pH 7 during 240 min with UV-C as activation form for treatment of winery wastewater. Rodriguez-Chueca et al. [16] reported about 80% COD removal using 2.5 mM of PMS, 1 mM of Co (II) at pH 6.5 during 120 min with UV-A LED (70 W/m2) for winery wastewater.
2.1.3. Ultrasound Activation
Ultrasound produces cavitation phenomena that comprises the nucleation, growth, and collapse of bubbles in a liquid, with the collapsing bubbles possessing high temperature and pressure. Under this condition, free radicals can be produced in solution (Equation (5)). Ultrasound (US) can activate oxidants such as hydrogen peroxide, persulfate, and more recently, studies showed activation with PMS [13].
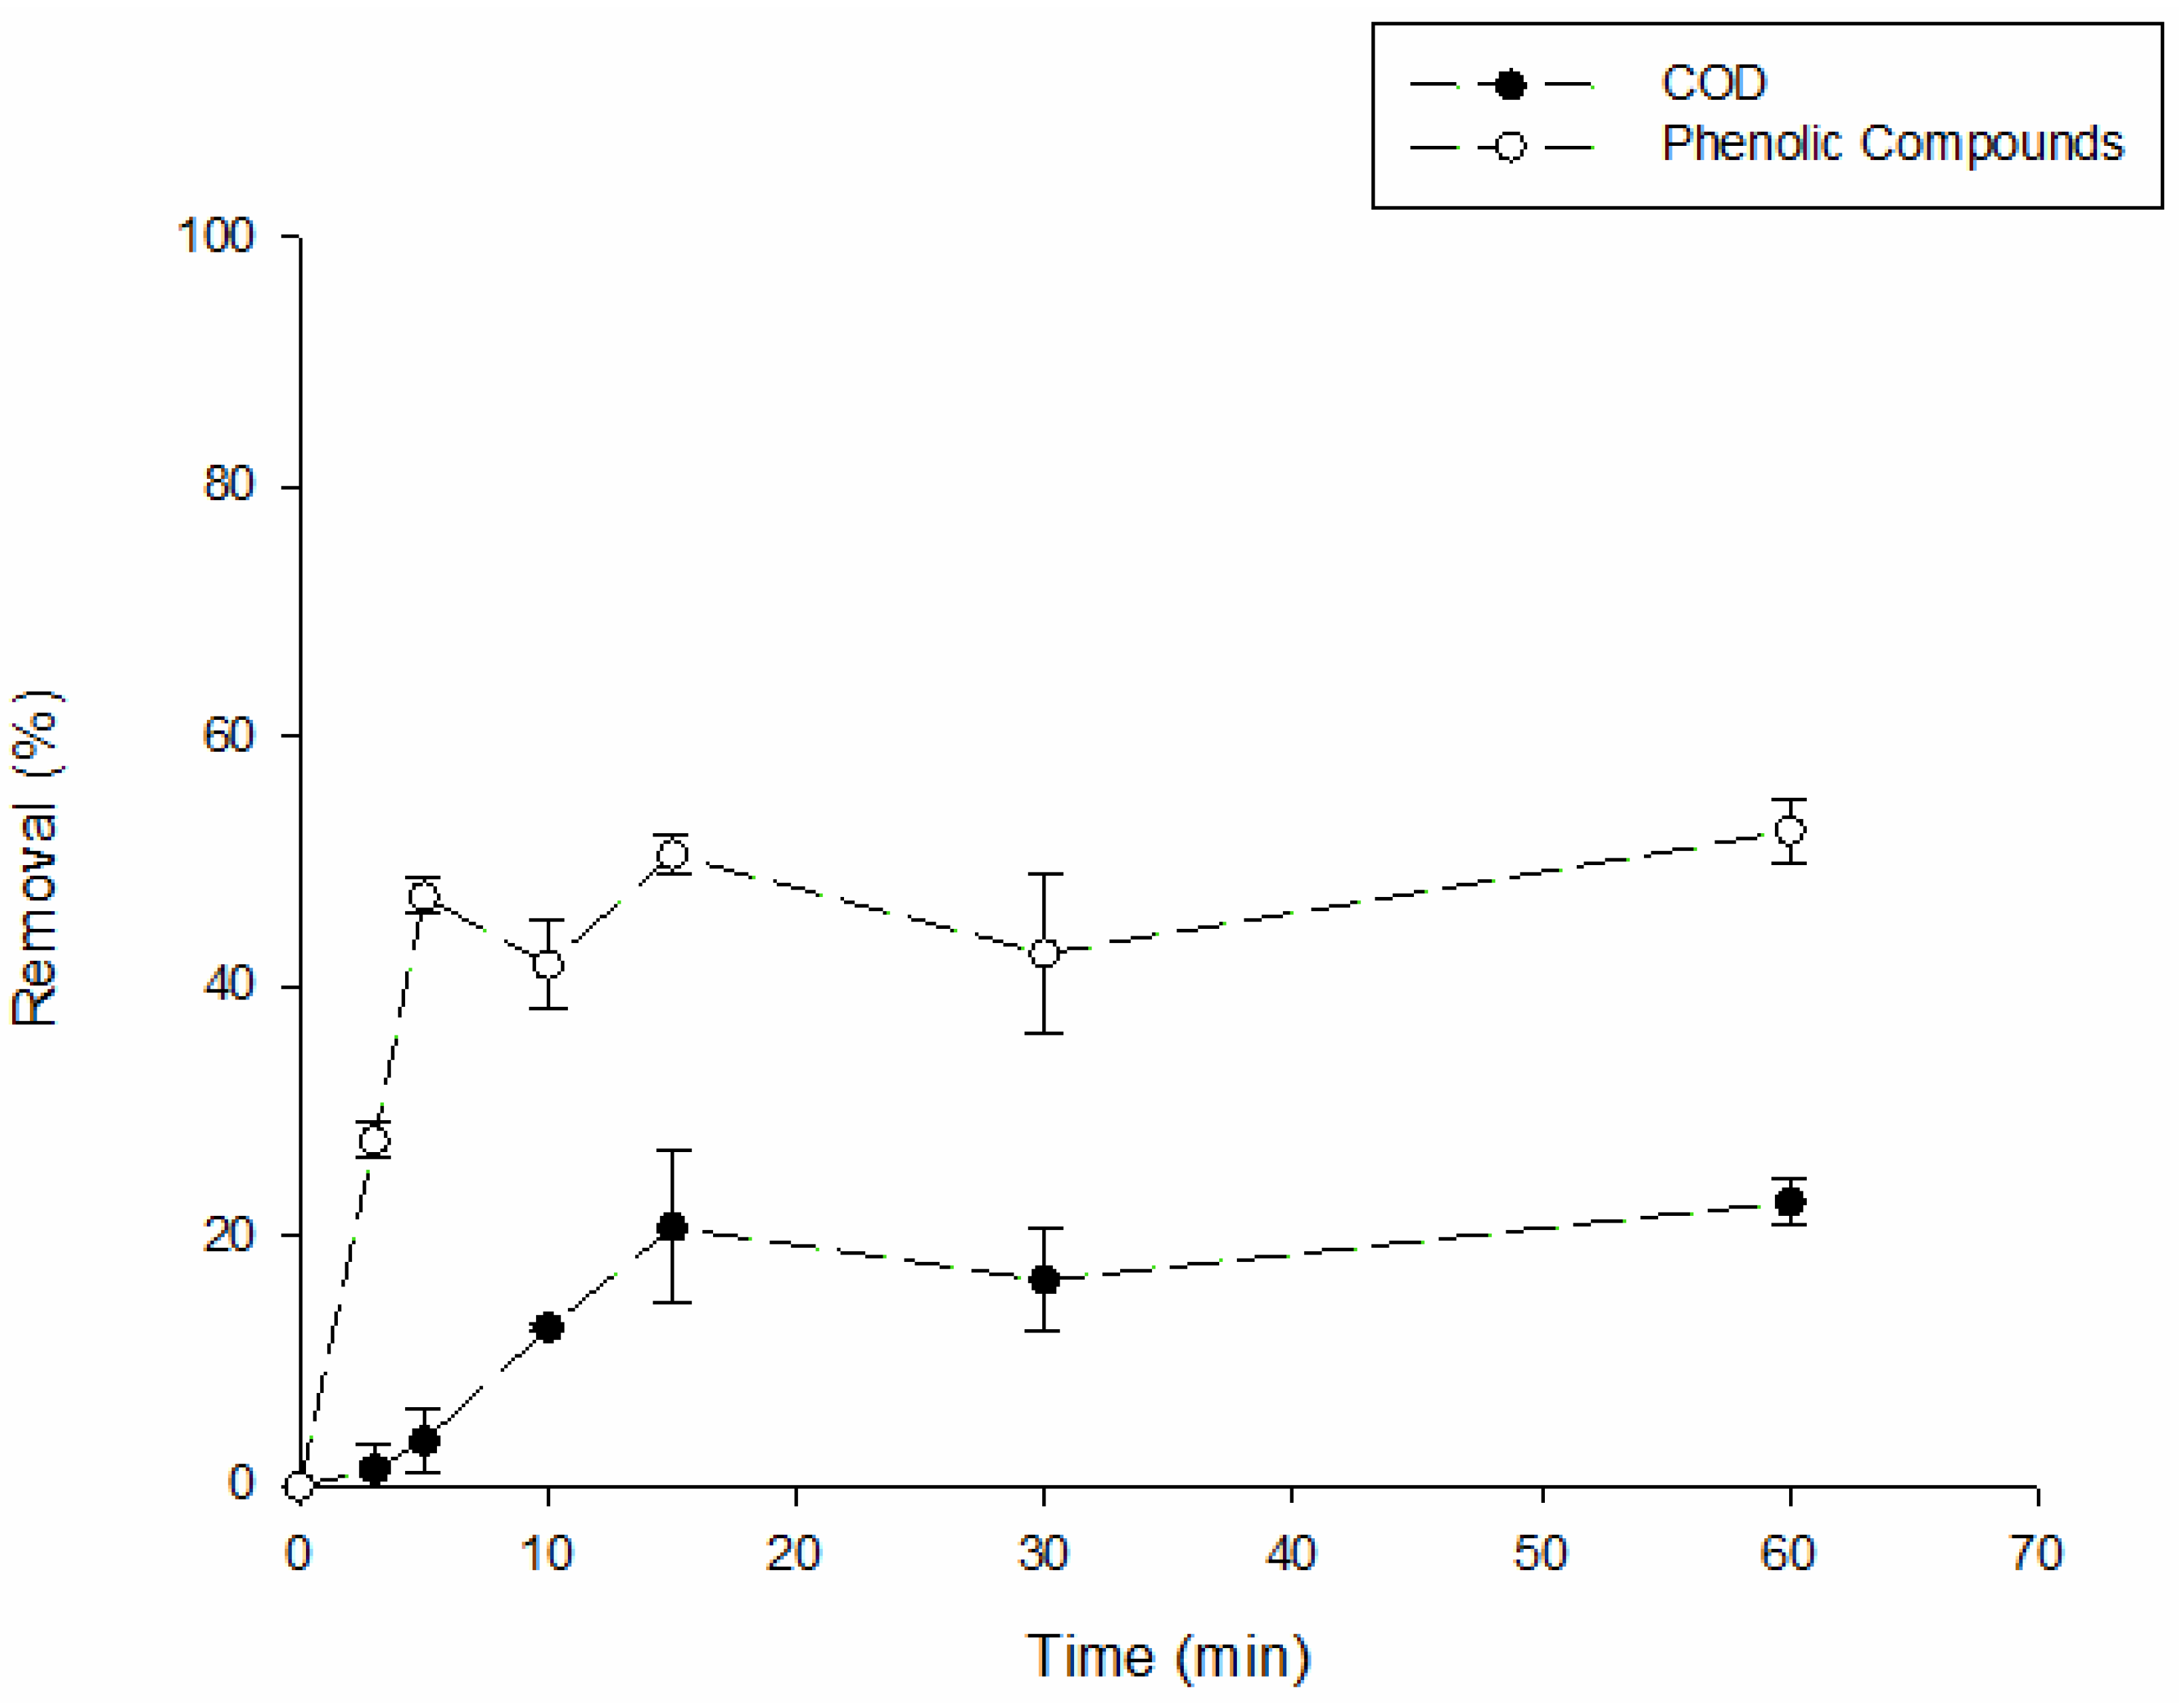
To evaluate the PMS activation by ultrasound (US) the conditions of operation were optimized in terms of time and initial pH. For the study of the reaction time, a starting pH value of 3 and 1600 mg/L of PMS were used. Figure 6 represents the effect of time in COD and phenolic compounds removal.
By analyzing Figure 6, it seems that the 15 min mark was favorable both for removal of phenolic compounds (51 ± 2%) and COD (21 ± 6%). Although for 60 min there is a removal of 53 ± 3% and 23 ± 2% for phenolic compounds and COD respectively, a difference in about 2% does not compensate for the energy costs associated with a higher reaction time. The removal increase along time can be justified by increasing in reaction medium temperature by growth and collapse of bubbles with high temperature and pressure [13]. In fact, the reaction temperature was raised from 20 to 52 °C in 60 min.
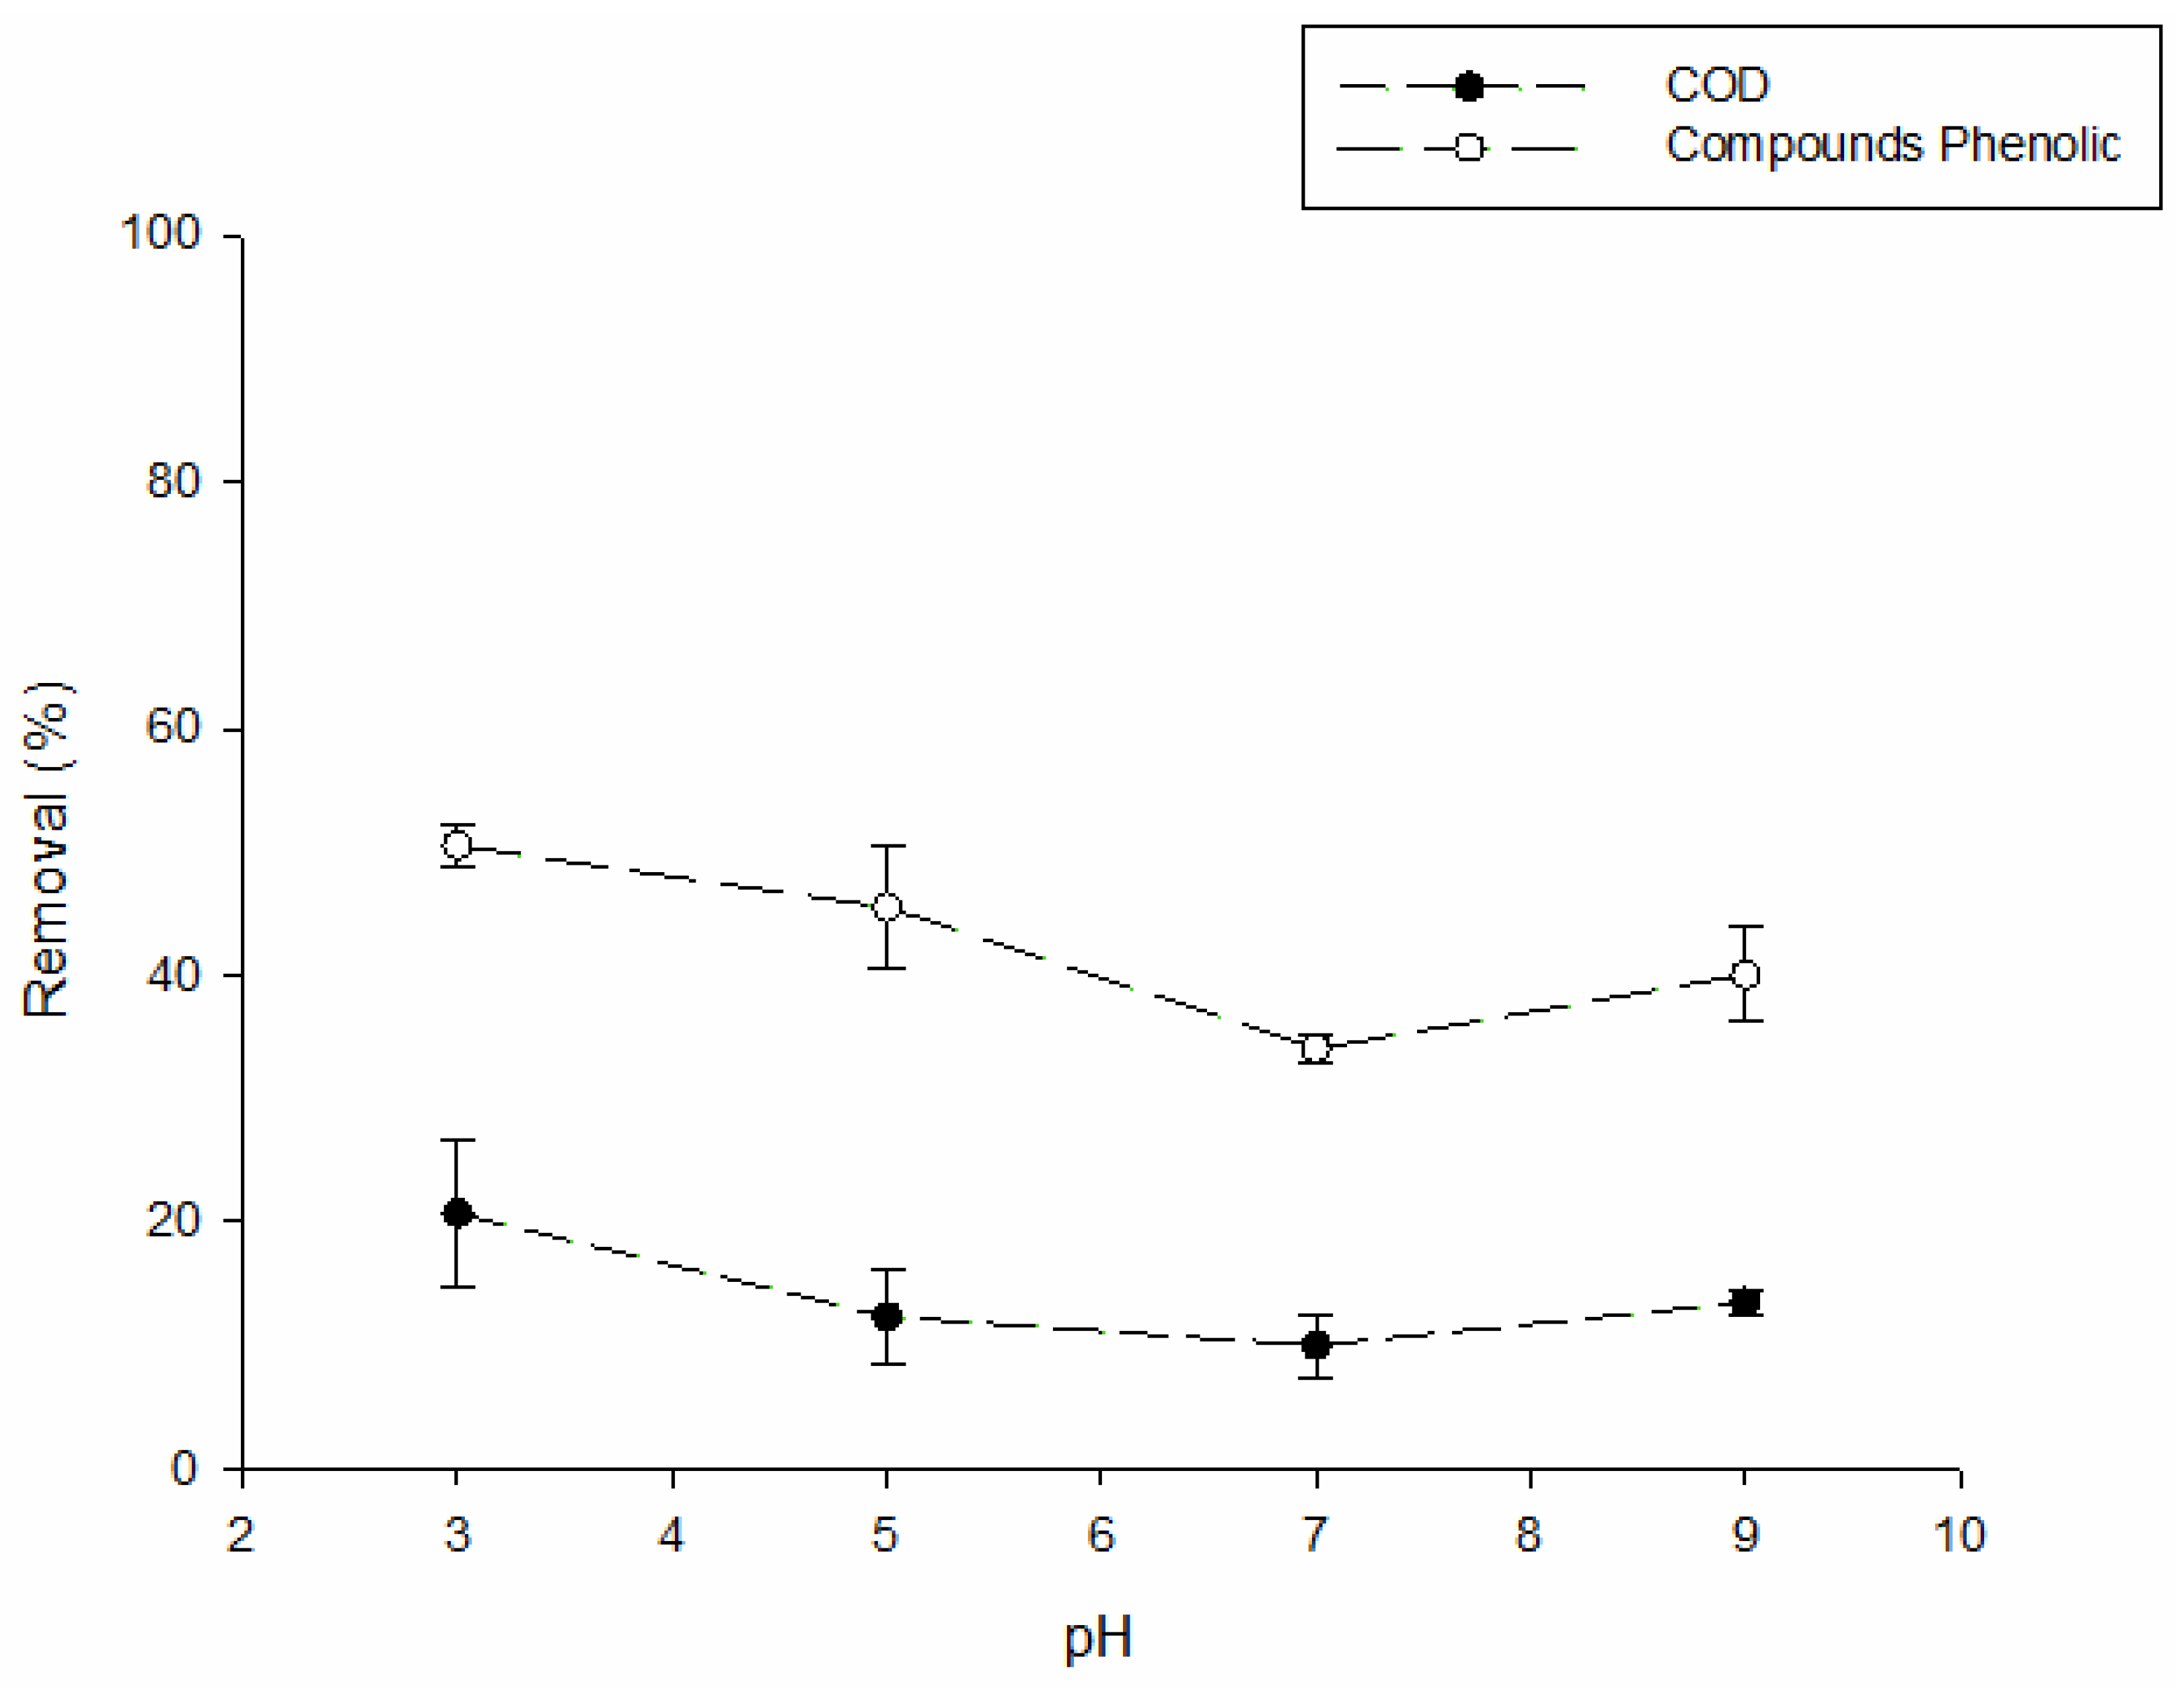
Figure 7 shows the effect of the initial pH on PMS activated by ultrasounds on COD and phenolic compounds removal after 15 min of reaction. From this Figure it is concluded that the most favorable pH for this process is 3.
Panahi et al. [25] reported the removal of 74.5% COD using 500 mg/L of PS at pH 3 during 60 min with an intensity of 130 kHz in treatment of dairy wastewater. These authors also reported that the efficiency was increased by decreasing the pH value, as also reported in this study (Figure 7). In the present study, the load of PMS has been increased to 3600 mg/L for the reaction of 60 min, in which it was obtained 24 ± 1% and 54 ± 1% COD and phenolic compounds removal, respectively. Thus, it was verified once again that the increase in PMS load did not lead to an increase in the removal of organic matter probably due to some scavenging effect. Comparing the PMS activation with Fe(II) and ultrasound (PMS/US), the PMS/Fe(II) combination is more efficient. However, Su et al. [26] concluded that US/PMS is more effective than Co2+/PMS for removing amoxicillin. Ghanbari et al. [13] further reinforced that, although efficiency of US is considerable in PMS activation, scale-up of reactor and economic aspects are the main problems of sonochemical processes that limit the use of US in large scale.
2.2. Global Comparison of the Different PMS Activation Strategies
Table 4 presents a comparison of the different strategies tested for activating PMS. The process that allows a higher COD and phenolic compounds removal is PMS/Fe(II).
Each treatment operating cost per kg/L of COD removed was also estimated. This value was based on the amount of FeSO4 and PMS applied (the price was obtained from industrial sources) as well as the energy costs whenever light or ultrasounds were applied. Clearly PMS/Fe(II) is again the most favorable process bearing in mind the operating costs.
Regarding the optimal pH to start the reaction, in the case of the activation of PMS with Fe(II) the optimal pH for starting the reaction is 5. In the study with UV-A the optimal pH is 7, and for the study with ultrasounds the more favorable value of pH is 3. The use of pH 3 is interesting since this is the natural value of the synthetic effluent, and the pH change would not be necessary in this case. This demonstrates how pH is a crucial parameter in PMS processes and its dependence on the form of activation used.
2.3. Toxicity Assessment
To evaluate the effect of the treatment on the wastewater toxicity, the treated samples were compared with the initial effluent. For the toxicity assessment with Lepidium. sativum, samples with the highest COD and phenolic compounds removal were analyzed. The results of these experiments are presented in Table 5.
From the analysis of Table 5, it can be observed that the samples of the effluent treated have higher GI than the raw effluent. In this scenario, in accordance with Trautmann and Krasny et al. [27], the sample treated with a Fe(II) concentration of 700 mg/L showed a strong inhibition towards plant growth, and the sample with a Fe(II) load of 1000 mg/L demonstrated a severe inhibition. Although Fe(II) is necessary for various processes in plant growth, large amounts of Fe(II) can inhibit plant growth [28]. Comparing the toxicity results for the conditions studied by Domingues et al. [8] for PS ([PS] = 600 mg/L, [Fe2+] = 300 mg/L and pH = 5) with the same conditions for PMS ([PMS] = 600 mg/L, [Fe2+] = 300 mg/L and pH = 5), the GI obtained by Domingues et al. [8] was of 33.10 ± 6.90%, whereas for this study the GI value obtained was of 29.50 ± 3.10%. This allows us to say that PS and PMS treatments both lead to similar toxicity results. The treatment with ultrasound and UV-A radiation led to a mild inhibition of plant growth. It is also noteworthy that adding Fe(II) reduces the GI when compared with the same combination without Fe(II).
In addition, under the optimal operating conditions, the treated OMW is still highly toxic for A. fischeri. For the raw OMW, after 15 min of contact with the solution, the light activity of the bacteria was inhibited by 64.16 ± 0.45% and, after 30 min, by 66.04 ± 0.26%. Activation of PMS by ultrasound, LED and UV-A completely inhibited bacterial activity after 15 min. For the sample with optimal conditions for PMS activation with Fe(II) ([PMS] = 1600 mg/L, [Fe2+] = 700 mg/L and pH = 5), the luminescent activity of the bacteria was inhibited by 94.82 ± 0.24% after 15 min and, after 30 min, inhibition of 99.14 ± 0.03% was observed. With the increase in Fe(II) load ([PMS] = 1600 mg/L, [Fe2+] = 1000 mg/L and pH = 5), luminescent activity of the bacteria was inhibited by 98.72 ± 0.37% after 15 min and 99.59 ± 0.14% after 30 min, which again reinforces the toxic effect when the Fe(II) load increases. Domingues et al. [8] treated OMW with iron-activated persulfate, reaching 69.16 ± 3.20% inhibition after 30 min, for optimal conditions ([PS] = 600 mg/L, [Fe2+] = 300 mg/L and pH = 5).
The performance of the process under the optimal conditions ([PMS] = 1600 mg/L, [Fe2+] = 700 mg/L and pH = 5) was further analyzed considering the individual degradation of each of the five phenolic compounds present in the synthetic OMW. It was verified that the SRbAOPs can fully degrade the 3,4,5-trimethoxybenzoic compound in 3 min. Such behavior may be due to the higher selectivity of sulfate radicals towards certain organic compounds when compared to that of the hydroxyl radicals, as mentioned by Domingues et al. [8].
Comparing the degradation of this 3,4,5-trimethoxybenzoic acid using PS and PMS for optimal conditions of iron activated persulfate in study of Domingues et al. [8] ([PS] = 600 mg/L, [Fe2+] = 300 mg/L and pH = 5), 10 min were necessary to achieve full degradation of 3,4,5-trimethoxybenzoic, and 30 min when PMS ([PMS] = 600 mg/L, [Fe2+] = 300 mg/L and pH = 5) was used. This can be justified once again by the higher oxidation potential of PS.
Based on the HPLC results, additional peaks besides those from the initial compounds of the synthetic OMW were found. Based on the database of the equipment used, these peaks correspond to hydroquinone and 2-phenyhydroquinone compounds. As it was justified by Santos et al. [29] and Enguita and Leitão et al. [30], the presence of these compounds can justify the fact that the toxicity of wastewater does not decrease with the treatment, although there is a reduction in the organic content.
3. Materials and Methods
3.1. Synthetic Olive Mill Wastewater (OMW)
The solution of synthetic OMW is constituted by five phenolic compounds dissolved in ultrapure water with a concentration of 100 mg/L. Trans-cinnamic acid, 3,4-Dihydroxybenzoic, 4-Hydroxybenzoic, 3,4,5-Trimethoxybenzoic, and 3,4-Dimethoxybenzoic are phenolic acids acquired in Sigma-Aldrich (Velp Scientifica, Taufkirchen, Germany). These phenolic acids are known to be part of OMW composition [8,31].
3.2. Sulfate Radical Based Advanced Oxidation Process Experiments
3.2.1. Activation Using Fe(II)
The SRbAOPs experiments with Fe(II) used Sulfate Heptahydrate (Fe2SO4·7H2O, PanReac AppliChem, Barcelona, Spain) as iron source. These assays were carried out in a 500 mL spherical glass reactor. In the reactor was added 250 mL of synthetic OMW with iron (II). For faster and more homogeneous mixing a certain volume of a PMS concentrated solution (30 g/L) was added to the reactor in order to reach the desired concentration and start the reaction. The reaction medium was subjected to a magnetic stirring of 500 rpm. The pH adjustment was performed by pouring drops of H2SO4 (6 M) and NaOH (3 M) solutions. To stop the reaction, after 30 min, the pH value is changed to 7, with subsequent centrifugation of the solution at 4000 rpm for 5 min and filtration through a 0.45 µm cellulose acetate filter.
3.2.2. Light Activation
PMS light activation was carried out using visible LED lamps (LED Strip light: model 2129, ADEO SERVICES, Ronchin, France) and UV radiation (MODEL UVGL-58, MINERALIGHT LAMP; UVP, Inc., Upland, CA, USA). The experiments with LED were performed in a 1000 ml spherical glass reactor (Figure 8). The LED strip lights (10 W) covered the reactor wall. The reaction medium was subjected to magnetic stirring of 300–500 rpm, with the reaction starting when a PMS solution is added, and LED lamps turned on. For PMS activation by ultraviolet radiation a UV-A lamp of 366 nm was used. The experiments were performed in a stirred reactor covered by a reflective surface. The lamp was set parallel to the reactor surface. In this study, the reactional medium was also subjected to magnetic stirring, with the reaction starting when a PMS solution was added, and the lamp was turned on. The reaction ended when the lamp was turned off. The simultaneous activation of PMS using visible/UV radiation with Fe(II) was evaluated. In that case, the reaction started and was terminated in the same way as in Section 3.2.1; however, in this case, the lamps were also turned on.
3.2.3. Ultrasounds (US)
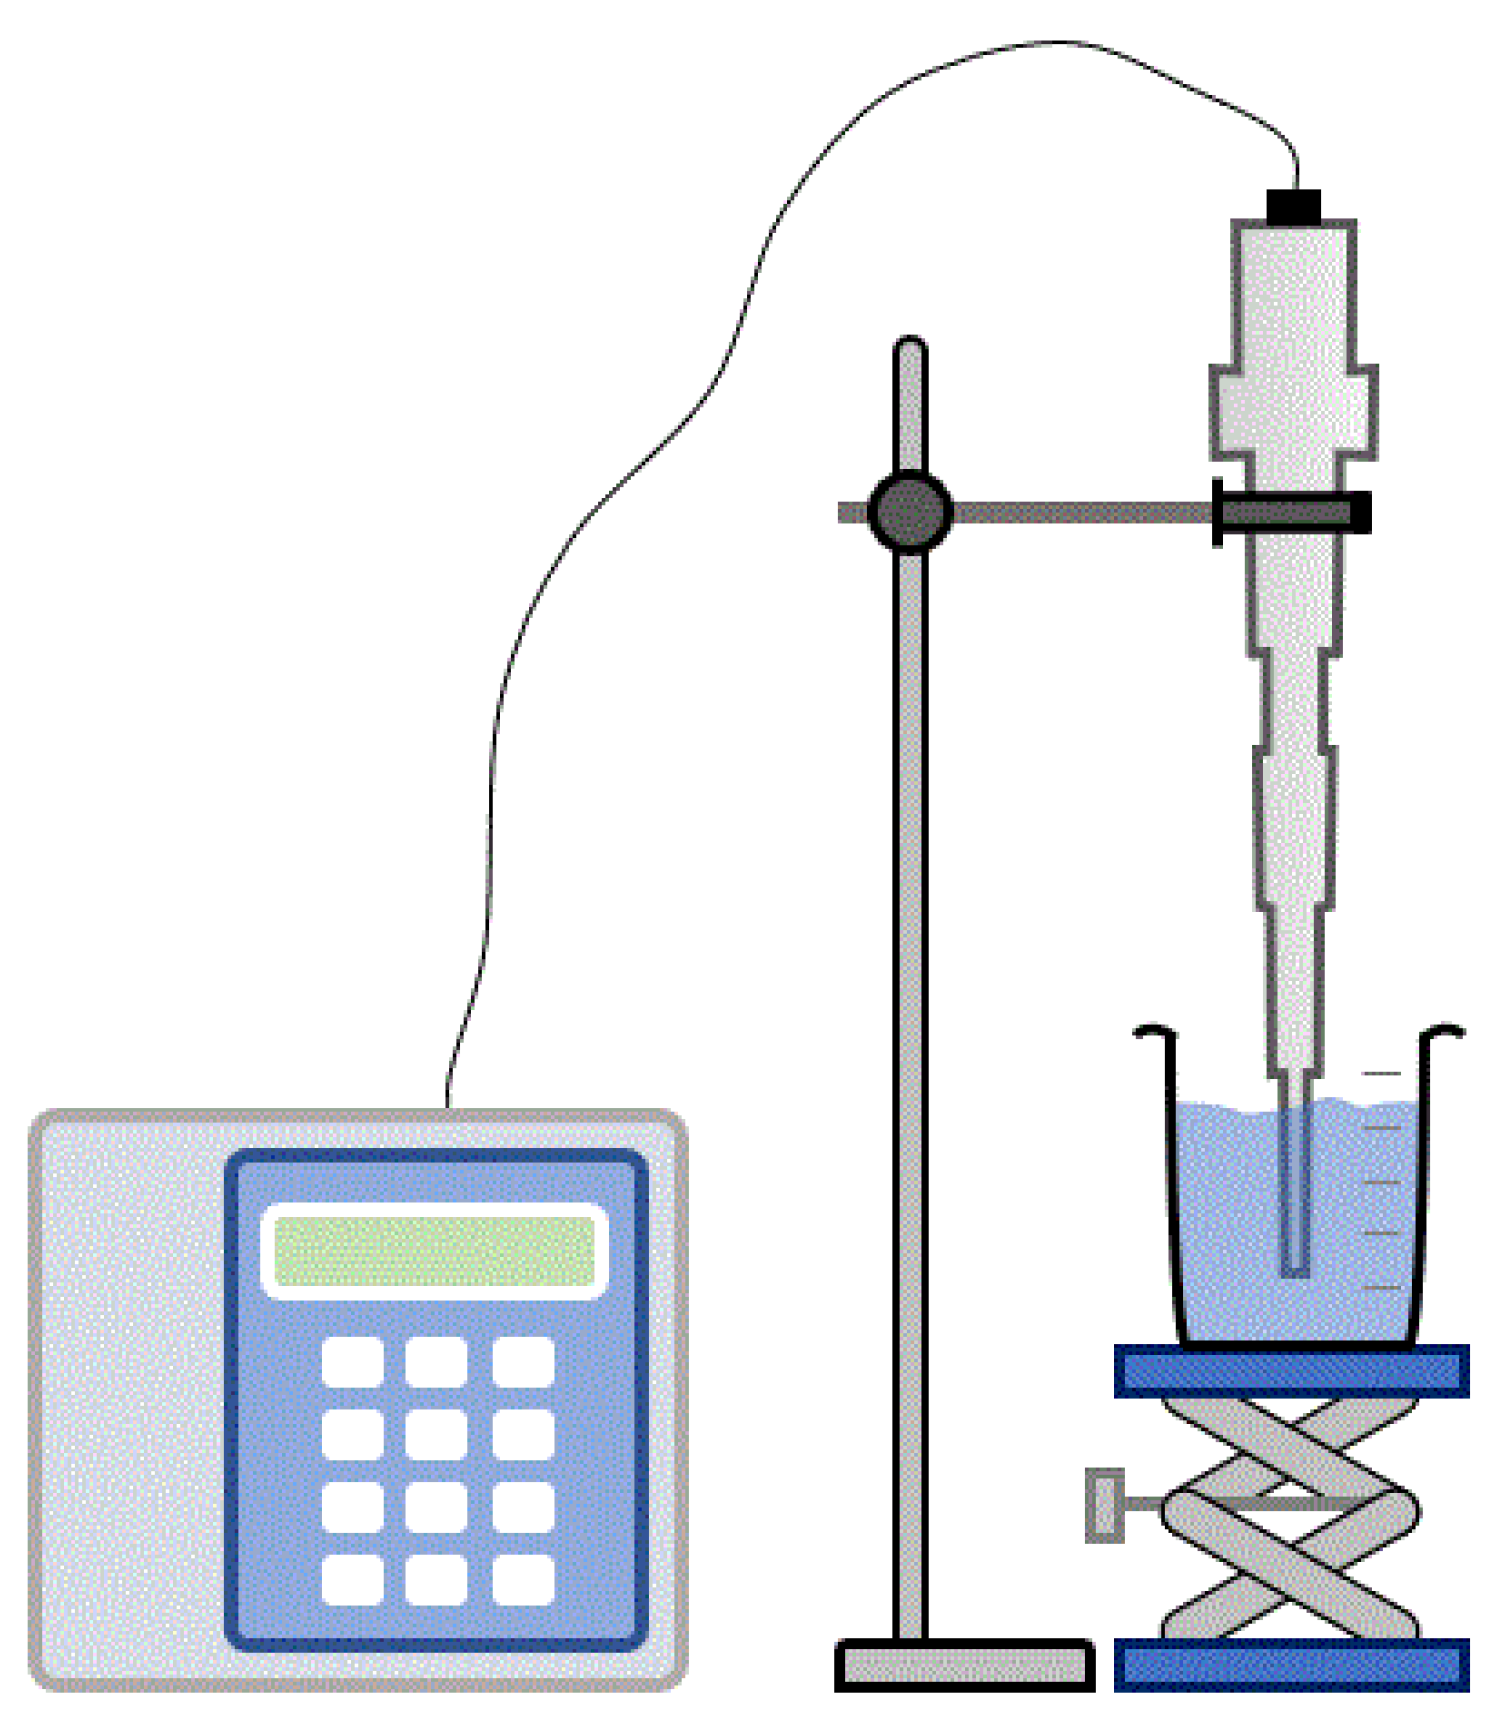
The experiments for PMS activation by ultrasounds were performed in a sonicator (SONICS, vibra cell, Newtown, CT, USA) of 20 Hz and with a power of 500 watts with 40% of continuous pulse. Figure 9 shows the strategy adopted for the experiments performed with sonicator. The reaction started when the sonicator was inserted in the reactional medium with PMS and ended upon turning it off.
3.3. Analytical Techniques
The chemical oxygen demand (COD) was analyzed using the 5220D method [32]. In this method, the samples of treated OMW were diluted with a factor of 10. Afterwards, 2.5 mL of the diluted solution was introduced into the digestion vessels after adding 1.5 mL digestion solution and 3.5 mL acid solution. The vessels were introduced in an ECO 25 (Velp Scientifica, Taufkirchen, Germany) digester at 150 °C for 2 h. After the cooling process, the absorbance of the samples at 420 nm was read in the Multiparameter Photometer with COD (Hanna, HI83399, Póvoa do Varzim, Portugal). The samples were analyzed in triplicate. In all assays performed, a blank COD measurement for control sample (with water, [Fe2+] = 700 mg/L, [PMS] = 1600 mg/L and pH = 5, at 0 and after at 30 min) was performed and the value discounted (~1.1 mg O2/L) in the remaining reading tests with synthetic olive mill effluent.
The phenolic content present was obtained by applying the Folin–Ciocalteau method [33]. This method consists of adding 20 µL of the treated OMW in cuvettes, 1.58 mL of distilled water, 100 µL of the Folin–Ciocalteau (Panreac, Barcelona, Spain), and 300 µL of a saturated solution of sodium carbonate (Na2CO3). The cuvettes were placed for 2 h in the dark, and then, the absorbance of the samples was read in the T60 UV/VIS (PG Instruments, Leicestershire, UK) spectrophotometer at 765 nm. The samples were analyzed in duplicate.
HPLC (BECKMAN SYSTEM GOLD) was applied according to the method described by Domingues et al. [31] to evaluate the degradation of the phenolic acids present in OMW and evaluate the possible appearance of intermediate phenolics. The analyses were carried out a C18 (SiliaChrom) at 40 °C. The mobile phase had a flow rate of 0.5 mL/min with a mixture of methanol and acidified water (50/50) with 1% of the orthophosphoric acid. To read the results, the compounds identification occurred at 255 nm.
3.4. Toxicity Assessment
To assess the toxicity of raw (initial phenolic mixture) and treated OWM, the samples effect on two species, Aliivibrio fischeri bacteria, and Lepidium sativum was analyzed, as described by Domingues et al. [34] and Baird et al. [32]. The toxicity assessment with L. sativum and A. fischeri bacteria light inhibition tests were only applied for the best treatment conditions.
A. fischeri (LCK480—Dr. Lange) luminescent inhibition tests were performed in comparison with a blank, in which bacteria were placed in a 2% NaCl solution, their ideal media. The light inhibition provoked by the contact with untreated and treated wastewater was analyzed after 15 and 30 min of incubation (Dr Lange, LUMIStherm), using LUMIStox 300 (Lange) luminometer.
As for toxic tests with L. sativum, 10 seeds were placed in Petri dishes over a filter, properly separated. Then, the filters with seeds were wet with 5 mL of raw or treated OMW. A blank with distilled water was also prepared. Finally, the Petri dishes were placed in an oven (P Selecta) at 27 °C for 48 h. These tests were performed in duplicate. With the obtained results, it was possible to determine the germination index (GI), according to Trautmann and Krasny et al. [27]. To determine GI, Equations (6)–(8) were applied, where and correspond to the average germination of the sample and blank and and correspond to the average radical length of the sample and blank, respectively.
4. Conclusions
This study was conducted to evaluate different ways of activating PMS for synthetic olive mill wastewater (OMW) treatment. The results showed that the optimal conditions for PMS activation by Fe(II) are 1600 mg/L of PMS, 700 mg/L of Fe(II) at pH 5. These conditions allowed for 60 ± 2% of COD removal. Combination of Fe(II) with other forms of activation of PMS such as LED (PMS/LED/Fe(II) and UV-A (PMS/UV-A/Fe(II)) did not lead to significant increase in the removal of organic matter compared to using PMS/Fe(II).
SRbAOPs is a selective and fast process, since it was able to degrade 100% of the compound with more substituents (3,4,5-Trimethoxybenzoic) of the synthetic olive mill wastewater in 3 min for optimal conditions ([PMS) = 1600 mg/L, [Fe2+] = 700 mg/L and pH = 5.
The treated effluents lead to higher GI values for L. sativum compared to raw effluent whichever the treatment applied. PMS/UV-A is the more favorable combination leading to a sample with mild inhibition of plant growth
The OMW treated in the optimal operating conditions ([PMS] = 1600 mg/L, [Fe2+] = 700 mg/L and pH = 5) regarding COD removal presented higher toxicity towards A. fischeri than the raw effluent, possibly tied to the formation of by-products such as hydroquinone and 2-phenyhydroquinone. The increase of Fe(II) load showed to be detrimental to both L. sativum growth and A. fischeri luminescence inhibition. Thus, further optimization is required for this process or even its integration with further treatments in order to reach an effluent amenable for disposal.
Author Contributions
Conceptualization, T.V. and E.D.; methodology, E.D. and R.C.M.; investigation, T.V. and E.D.; data curation, T.V. and E.D.; writing—original draft preparation, T.V.; writing—review and editing, E.D., J.G. and R.C.M.; supervision, R.C.M.; funding acquisition, R.C.M. All authors have read and agreed to the published version of the manuscript.
Funding
This research was funded by the European Union through the European Fund for Regional Development (FEDER) within the framework COMPETE2020 by the financial support of the project POCI-01-0247-FEDER-033193 (SERENA—Development of a sludge free Fenton integrated treatment methodology for olive mill wastewaters: a water recovery) and project PhotoSupCatal – Development of supported catalytic systems for wastewater treatment by photo-assisted processes (POCI-01-0247-FEDER-047545). Eva Domingues acknowledges FCT (Fundação para a Ciência e Tecnologia, Portugal) for the PhD Grant (SFRH/BD/144096/2019). João Gomes gratefully acknowledges Foundation for Science and Technology e FCT (Portugal) by the financial support (CEECIND/01207/2018). Thanks are due to FCT/MCTES for the financial support to CIEPQPF (UIDB/00102/2020).
Conflicts of Interest
The authors declare no conflict of interest.
References
- International Olive Council (IOC). Available online: www.internationaloliveoil.org/what-we-do/economic-affairs-promotion-unit/ (accessed on 13 November 2021).
- Espadas-Aldana, G.; Vialle, C.; Belaud, J.P.; Vaca-Garcia, C.; Sablayrolles, C. Analysis and trends for Life Cycle Assessment of olive oil production. Sustain. Prod. Consum. 2019, 19, 216–230. [Google Scholar] [CrossRef] [Green Version]
- Paraskeva, P.; Diamadopoulos, E. Technologies for olive mill wastewater (OMW) treatment: A review. J. Chem. Technol. Biotechnol. Int. Res. Process Environ. Clean Technol. 2006, 81, 1475–1485. [Google Scholar] [CrossRef]
- Kilic, M.Y.; Abdelraheem, W.H.; He, X.; Kestioglu, K.; Dionysiou, D.D. Photochemical treatment of tyrosol, a model phenolic compound present in olive mill wastewater, by hydroxyl and sulfate radical-based advanced oxidation processes (AOPs). J. Hazard. Mater. 2019, 367, 734–742. [Google Scholar] [CrossRef]
- Görmez, F.; Görmez, Ö.; Yabalak, E.; Gözmen, B. Application of the central composite design to mineralization of olive mill wastewater by the electro/Fe II/persulfate oxidation method. SN Appl. Sci. 2020, 2, 178. [Google Scholar] [CrossRef] [Green Version]
- Domingues, E.; Fernandes, E.; Gomes, J.; Castro-Silva, S.; Martins, R.C. Olive oil extraction industry wastewater treatment by coagulation and Fenton’s process. J. Water Process Eng. 2021, 39, 101818. [Google Scholar] [CrossRef]
- Manos, D.; Miserli, K.; Konstantinou, I. Perovskite and Spinel Catalysts for Sulfate Radical-Based Advanced Oxidation of Organic Pollutants in Water and Wastewater Systems. Catalysts 2020, 10, 1299. [Google Scholar] [CrossRef]
- Domingues, E.; Silva, M.J.; Vaz, T.; Gomes, J.; Martins, R.C. Persulfate Process Activated by Homogeneous and Heterogeneous Catalysts for Synthetic Olive Mill Wastewater Treatment. Water 2021, 13, 3010. [Google Scholar] [CrossRef]
- Xiao, S.; Cheng, M.; Zhong, H.; Liu, Z.; Liu, Y.; Yang, X.; Liang, Q. Iron-mediated activation of persulfate and peroxymonosulfate in both homogeneous and heterogeneous ways: A review. Chem. Eng. J. 2020, 384, 123265. [Google Scholar] [CrossRef]
- Rodríguez-Chueca, J.; Amor, C.; Mota, J.; Lucas, M.S.; Peres, J.A. Oxidation of winery wastewater by sulphate radicals: Catalytic and solar photocatalytic activations. Environ. Sci. Pollut. Res. 2017, 24, 22414–22426. [Google Scholar] [CrossRef]
- Su, S.; Guo, W.; Leng, Y.; Yi, C.; Ma, Z. Heterogeneous activation of Oxone by CoxFe3− xO4 nanocatalysts for degradation of rhodamine B. J. Hazard. Mater. 2013, 244, 736–742. [Google Scholar] [CrossRef]
- Iqbal, J.; Shah, N.S.; Sayed, M.; Khan, J.A.; Muhammad, N.; Khan, Z.U.H.; Naseem, M.; Howari, F.M.; Nazzal, Y.; Niazi, N.K.; et al. Synthesis of nitrogen-doped Ceria nanoparticles in deep eutectic solvent for the degradation of sulfamethaxazole under solar irradiation and additional antibacterial activities. Chem. Eng. J. 2020, 394, 124869. [Google Scholar] [CrossRef]
- Ghanbari, F.; Moradi, M. Application of peroxymonosulfate and its activation methods for degradation of environmental organic pollutants: Review. Chem. Eng. J. 2017, 310, 41–62. [Google Scholar] [CrossRef]
- Esteves, B.M.; Rodrigues, C.S.; Madeira, L.M. Synthetic olive mill wastewater treatment by Fenton’s process in batch and continuous reactors operation. Environ. Sci. Pollut. Res. 2018, 25, 34826–34838. [Google Scholar] [CrossRef] [PubMed]
- Martins, R.C.; Ramos, C.M.; Henriques, L.R.; Quinta-Ferreira, R.M. Olive mill effluent depuration by ozonation and Fenton processes enhanced by iron wastes. Water Sci. Technol. 2016, 73, 1136–1144. [Google Scholar] [CrossRef] [PubMed]
- Rodríguez-Chueca, J.; Amor, C.; Silva, T.; Dionysiou, D.D.; Puma, G.L.; Lucas, M.S.; Peres, J.A. Treatment of winery wastewater by sulfate radicals: HSO5−/transition metal/UV-A LEDs. Chem. Eng. J. 2017, 310, 473–483. [Google Scholar] [CrossRef] [Green Version]
- Qi, F.; Chu, W.; Xu, B. Catalytic degradation of caffeine in aqueous solutions by cobalt-MCM41 activation of peroxymonosulfate. Appl. Catal. B Environ. 2013, 134, 324–332. [Google Scholar] [CrossRef]
- Amor, C.; Fernandes, J.R.; Lucas, M.S.; Peres, J.A. Hydroxyl and sulfate radical advanced oxidation processes: Application to an agro-industrial wastewater. Environ. Technol. Innov. 2021, 21, 101183. [Google Scholar] [CrossRef]
- Fan, Z.; Zhang, Q.; Li, M.; Sang, W.; Qiu, Y.; Xie, C. Activation of persulfate by manganese oxide–modified sludge–derived biochar to degrade Orange G in aqueous solution. Environ. Pollut. Bioavailab. 2019, 31, 70–79. [Google Scholar] [CrossRef] [Green Version]
- Sayed, M.; Khan, J.A.; Shah, L.A.; Shah, N.S.; Shah, F.; Khan, H.M.; Zhang, P.; Arandiyan, H. Solar light responsive poly (vinyl alcohol)-assisted hydrothermal synthesis of immobilized TiO2/Ti film with the addition of peroxymonosulfate for photocatalytic degradation of ciprofloxacin in aqueous media: A mechanistic approach. J. Phys. Chem. C 2018, 122, 406–421. [Google Scholar] [CrossRef]
- Kaur, B.; Kuntus, L.; Tikker, P.; Kattel, E.; Trapido, M.; Dulova, N. Photo-induced oxidation of ceftriaxone by persulfate in the presence of iron oxides. Sci. Total Environ. 2019, 676, 165–175. [Google Scholar] [CrossRef]
- Ryer, A. What is Light? In Light Measurement Handbook, 2nd ed.; International Light Inc.: Peabody, MA, USA, 1998; pp. 5–8. [Google Scholar]
- Guan, Y.H.; Ma, J.; Li, X.C.; Fang, J.Y.; Chen, L.W. Influence of pH on the formation of sulfate and hydroxyl radicals in the UV/peroxymonosulfate system. Environ. Sci. Technol. 2011, 45, 9308–9314. [Google Scholar] [CrossRef] [PubMed]
- Amor, C.; Rodriguez-Chueca, J.; Fernandes, J.L.; Dominguez, J.R.; Lucas, M.S.; Peres, J.A. Winery wastewater treatment by sulphate radical based-advanced oxidation processes (SR-AOP): Thermally vs UV-assisted persulphate activation. Process Saf. Environ. Prot. 2019, 122, 94–101. [Google Scholar] [CrossRef]
- Panahi, A.H.; Meshkinian, A.; Ashrafi, S.D.; Khan, M.; Naghizadeh, A.; Abi, G.; Kamanim, H. Survey of sono-activated persulfate process for treatment of real dairy wastewater. Int. J. Environ. Sci. Technol. 2020, 17, 93–98. [Google Scholar] [CrossRef]
- Su, S.; Guo, W.; Yi, C.; Leng, Y.; Ma, Z. Degradation of amoxicillin in aqueous solution using sulphate radicals under ultrasound irradiation. Ultrason. Sonochem. 2012, 19, 469–474. [Google Scholar] [CrossRef]
- Trautmann, N.M.; Krasny, M.E. Composting in the Classroom—Scientific Inquiry for High School Students; Cornell Waste Management Institute, Cornell Center for the Environment: Ithaca, NY, USA, 2017. [Google Scholar]
- Zhang, Y.; Zheng, G.H.; Liu, P.; Song, J.M.; Di Xu, G.; Cai, M.Z. Morphological and physiological responses of root tip cells to Fe2+ toxicity in rice. Acta Physiol. Plant. 2011, 33, 683–689. [Google Scholar] [CrossRef]
- Santos, A.; Yustos, P.; Quintanilla, A.; Rodríguez, J.J. Evolution of Toxicity upon Wet Catalytic Oxidation of Phenol. J. Environ. Sci. Technol. 2004, 38, 133–138. [Google Scholar] [CrossRef]
- Enguita, F.; Leitão, A.L. Hydroquinone: Environmental Pollution, Toxicity and Microbial Answers. Biomed. Res. Int. 2013, 2013, 542168. [Google Scholar] [CrossRef] [Green Version]
- Domingues, E.; Rodriguez, F.; Gomes, J.; Quina, M.J.; Castro-Silva, S.; Martins, R.C. Screening of low–cost materials as heterogeneous catalysts for olive mill wastewater Fenton’s peroxidation. Energy Rep. 2020, 6, 161–167. [Google Scholar] [CrossRef]
- Baird, R.B.; Eaton, A.D.; Rice, E.W. Standard Methods for the Examination of Water and Wastewater, 23rd ed.; American Public Health Association: Washington, DC, USA, 2017. [Google Scholar]
- Lamuela-Raventós, R.M. Folin–Ciocalteu method for the measurement of total phenolic content and antioxidant capacity. In Measurement of Antioxidant Activity & Capacity: Recent Trends and Applications; Apak, R., Capanoglu, E., Shahidi, F., Eds.; Wiley: Hoboken, NJ, USA, 2017. [Google Scholar]
- Domingues, E.; Assunção, N.; Gomes, J.; Lopes, D.V.; Frade, J.R.; Quina, M.J.; Quinta–Ferreira, R.M.; Martins, R.C. Catalytic Efficiency of Red Mud for the Degradation of Olive Mill Wastewater through Heterogeneous Fenton’s Process. Water 2019, 11, 1183. [Google Scholar] [CrossRef] [Green Version]
Figure 1.
Initial pH influence on phenolic compounds and COD removal ([Fe2+] = 300 mg/L, [PMS] = 1000 mg/L after 30 min of reaction).
Figure 1.
Initial pH influence on phenolic compounds and COD removal ([Fe2+] = 300 mg/L, [PMS] = 1000 mg/L after 30 min of reaction).

Figure 2.
PMS load influence on COD and phenolic compounds removal ([Fe2+] = 300 mg/L, pH = 5 after 30 min of reaction).
Figure 2.
PMS load influence on COD and phenolic compounds removal ([Fe2+] = 300 mg/L, pH = 5 after 30 min of reaction).

Figure 3.
Iron load influence on COD and phenolic compounds removal ([PMS] = 1600 mg/L, pH = 5 after 30 min of reaction).
Figure 3.
Iron load influence on COD and phenolic compounds removal ([PMS] = 1600 mg/L, pH = 5 after 30 min of reaction).

Figure 4.
Time influence on COD and phenolic compounds removal during PMS activation by UV-A light (pH = 3 and [PMS] = 1600 mg/L).
Figure 4.
Time influence on COD and phenolic compounds removal during PMS activation by UV-A light (pH = 3 and [PMS] = 1600 mg/L).

Figure 5.
Initial pH influence on COD and phenolic compounds removal during PMS activation by UV-A light (1600 mg/L of PMS after 15 min of reaction).
Figure 5.
Initial pH influence on COD and phenolic compounds removal during PMS activation by UV-A light (1600 mg/L of PMS after 15 min of reaction).

Figure 6.
Time influence on COD and phenolic compounds removal in study PMS activated by US (pH = 3 and [PMS] = 1600 mg/L).
Figure 6.
Time influence on COD and phenolic compounds removal in study PMS activated by US (pH = 3 and [PMS] = 1600 mg/L).

Figure 7.
Initial pH influence on COD and phenolic compounds removal in study PMS activated by US (1600 mg/L of PMS after 15 min of reaction).
Figure 7.
Initial pH influence on COD and phenolic compounds removal in study PMS activated by US (1600 mg/L of PMS after 15 min of reaction).

Figure 8.
Reactor used in the experiments with LED light.

Figure 9.
Scheme of the reactor used for the study of PMS activation by ultrasounds.


Table 1.
Examples of AOPs and SRbAOPs on OMW treatment.
| AOPs | OMW Type | Optimal Conditions | Results | Reference |
|---|---|---|---|---|
| Persulfate (PS) | Synthetic OMW: COD = 800 ± 64 mg/L, phenolic compounds = 300 ± 24, TOC = 284 ± 23 mg/L | [Fe2+] = 300 mg/L, [PS] = 600 mg/L and pH = 5 during 30 min | 39%, 63% and 37% COD, phenolic compounds and TOC removal respectively | [8] |
| Fenton | Real olive oil mill wastewater (OOMW): COD = 50.4 g/L | [Fe2+] = 2 g/L, [H2O2] = 4 g/L, and pH = 3 during 60 min | 45% COD removal | [6] |
| Fenton | Synthetic OMW: TOC = 321.4 mg/L, total phenol = 361.9 mg/L | [Fe2+] = 100 mg/L [H2O2] = 2 g/L, and pH = 5 during 300 min | >56%, >99% TOC and total phenol removal, respectively | [14] |
| Ozonation | Synthetic OMW: COD = 1211 ± 18 mg/L, total phenolic = 457 ± 36 mg/L | [iron shavings] = 1 g/L, 20 g O3/Nm3, pH = 3 during 120 min | 61 %, 98 % COD and total phenolic respectively | [15] |
Table 2.
Synthetic OMW (Trans-cinnamic acid, 3,4-Dihydroxybenzoic, 4-Hydroxybenzoic, 3,4,5-Trimethoxybenzoic, and 3,4-Dimethoxybenzoic)characterization.
Table 2.
Synthetic OMW (Trans-cinnamic acid, 3,4-Dihydroxybenzoic, 4-Hydroxybenzoic, 3,4,5-Trimethoxybenzoic, and 3,4-Dimethoxybenzoic)characterization.
| Parameter | Phenolic Compounds (mg/L) | COD (mg O2/L) | pH |
|---|---|---|---|
| Value | 248–309 | 869–1063 | 3.09 ± 0.10 |
Table 3.
PMS activated by LED influence on COD and phenolic compounds removal in 30 min for PMS/LED ([PMS] = 1600 mg/L and pH = 5), combination with Fe(II) (PMS/LED/ Fe(II); [PMS] = 1600 mg/L, [Fe2+] = 700 mg/L and pH = 5) and PMS/Fe(II) ([PMS] = 1600 mg/L, [Fe2+] = 700 mg/L and pH = 5).
Table 3.
PMS activated by LED influence on COD and phenolic compounds removal in 30 min for PMS/LED ([PMS] = 1600 mg/L and pH = 5), combination with Fe(II) (PMS/LED/ Fe(II); [PMS] = 1600 mg/L, [Fe2+] = 700 mg/L and pH = 5) and PMS/Fe(II) ([PMS] = 1600 mg/L, [Fe2+] = 700 mg/L and pH = 5).
| COD Removal (%) | Phenolic Compounds Removal (%) | |
|---|---|---|
| PMS/LED | 11 ± 2 | 38 ± 3 |
| PMS/LED/ Fe(II) | 56 ± 3 | 98 |
| PMS/Fe(II) | 60 ± 2 | 89 ± 7 |
Table 4.
Different ways for PMS activation and associated operating costs.
| Conditions | COD Removal (%) | Phenolic Compounds Removal (%) | Cost of Process €/kg/LCOD Removed | |
|---|---|---|---|---|
| PMS/Fe(II) | [Fe2+] = 700 mg/L [PMS] = 1600 mg/L pH = 5 t = 30 min CODremoved = 638 mg O2/L | 60 ± 2 | 89 ± 7 | 0.30 |
| PMS/LED | [PMS] = 1600 mg/L pH = 5 t = 30 min P = 10 W CODremoved = 117 mg O2/L | 11 ± 2 | 38 ± 3 | 6.00 |
| PMS/UV-A | [PMS] = 1600 mg/L pH = 7 t = 15 min P= 30 W CODremoved= 266 mg O2/L | 25 ± 1 | 43 ± 4 | 3.90 |
| PMS/US | [PMS] = 1600 mg/L pH = 3 t = 15 min P = 500 W CODremoved= 223 mg O2/L | 21 ± 6 | 51 ± 2 | 78.5 |
Note: 0.25 €/kg FeSO4 [6] per 1 m3 effluent treated; 2.64 €/10 tonnes of PMS (according to industrial sources); 0.14 €/kWh in Portugal.
Table 5.
Germination index (GI) results for L. sativum for different experiments.
| Condition | Synthetic Effluent | PMS/Fe(II) | PMS/LED | PMS/LED/Fe(II) | PMS/US | PMS/UV-A | PMS/UV-A/Fe(II) |
|---|---|---|---|---|---|---|---|
| GI (%) | 27.8 ± 7.9 | 55.3 ± 21.2 * | 55.5 ± 7.9 | 51.2 ± 2.2 | 63.9 ± 3.9 | 66.7 ± 15.7 | 61.1 ± 7.9 |
| GI (%) | 27.8 ± 7.9 | 30.6 ± 11.8 ** | - | - | - | - | - |
* Germination index results for L. sativum for: [PMS] = 1600 mg/L, [Fe2+] = 700 mg/L and pH = 5. ** Influence of the Fe(II) load [PMS] = 1600 mg/L, [Fe2+] = 1000 mg/L and pH = 5.
Publisher’s Note: MDPI stays neutral with regard to jurisdictional claims in published maps and institutional affiliations. |
© 2022 by the authors. Licensee MDPI, Basel, Switzerland. This article is an open access article distributed under the terms and conditions of the Creative Commons Attribution (CC BY) license (https://creativecommons.org/licenses/by/4.0/).
Share and Cite
MDPI and ACS Style
Vaz, T.; Domingues, E.; Gomes, J.; Martins, R.C. Evaluation of the Activation Procedure on Oxone Efficiency for Synthetic Olive Mill Wastewater Treatment. Catalysts 2022, 12, 291. https://0-doi-org.brum.beds.ac.uk/10.3390/catal12030291
AMA Style
Vaz T, Domingues E, Gomes J, Martins RC. Evaluation of the Activation Procedure on Oxone Efficiency for Synthetic Olive Mill Wastewater Treatment. Catalysts. 2022; 12(3):291. https://0-doi-org.brum.beds.ac.uk/10.3390/catal12030291
Chicago/Turabian StyleVaz, Telma, Eva Domingues, João Gomes, and Rui C. Martins. 2022. "Evaluation of the Activation Procedure on Oxone Efficiency for Synthetic Olive Mill Wastewater Treatment" Catalysts 12, no. 3: 291. https://0-doi-org.brum.beds.ac.uk/10.3390/catal12030291
Note that from the first issue of 2016, this journal uses article numbers instead of page numbers. See further details here.