
Deposition of Size-Selected Gold Nanoclusters onto Strontium Titanate Crystals for Water Splitting under Visible Light


Department of Physics, Zhejiang University of Science and Technology, 318, Liuhe Road, Xihu District, Hangzhou 310023, China
Catalysts 2022, 12(4), 367; https://0-doi-org.brum.beds.ac.uk/10.3390/catal12040367
Submission received: 16 February 2022
/
Revised: 19 March 2022
/
Accepted: 21 March 2022
/
Published: 23 March 2022
(This article belongs to the Topic Catalysis for Sustainable Chemistry and Energy)
Abstract
:Using a modulated pulse power magnetron sputtering (MPP-MSP) coupled with a quadrupole mass spectrometer (Q-MS), intensive size-selected gold nanoclusters (Aun) ranging from n = 5 to 40 in size are synthesized and soft landed onto a strontium titanate (STO) crystal surface as a co-catalyst for photocatalytic water splitting. The photocatalytic reactivity of the Aun/STO is investigated by measuring the photocurrent density of the sample under visible light radiation. It is found that the Aun co-catalysts enable the visible light response of the Aun/STO photocatalyst. The photocurrent density is sensitively dependent on the size of the Aun on the STO, and Au16 exhibits its maximum photocurrent under visible light. The underlying physics of the size-specific photocurrent are explained in terms of the size-dependent electron affinity of Aun.
1. Introduction
Photocatalytic reactions have attracted a tremendous amount of attention because they open up a possible way to solve energy and environmental problems [1,2,3,4]. Thousands of catalysts have been found or synthesized to optimize photocatalytic efficiency. Due to the size-specific properties of nanostructures, which are usually composed of several to hundreds of atoms, they have been frequently used in various supporting roles as co-catalysts for photocatalytic water splitting and pollutant decomposition [5,6,7]. Because of the physical and chemical stability and possible local plasma resonance effect of noble metal nanoparticles, NP/semiconductor systems are utilized to generate an efficient photocatalytic response under visible light radiation [8,9]. Meanwhile, by manipulating the size of the nanoparticles or nanoclusters, the catalytic reactivity can be adjusted to some extent [10,11]. Therefore, the fabrication of size-selected noble metal nanoclusters is critical for optimizing photocatalytic water splitting efficiency.
In our previous report, gold nanoparticles (NPs) with a mean diameter of 3–8 nm were self-assembled on a strontium titanate (STO) crystal via a thermal vaporization method, and the photocatalytic water splitting efficiency of NP/STO was investigated in a photochemical cell under visible light radiation [11]. It was demonstrated that applying NPs on an STO activates the visible light response and that the photocatalytic reaction efficiency is dependent on the size of the NPs [11]. The combined incident photo-current efficiency (IPCE) and extinction spectra study revealed that the local plasma resonance of the gold NPs is the underlying mechanism for the visible light response of the NP/STO. However, the photocatalytic water splitting efficiency of finer nanoclusters/semiconductor system remains unclear.
In this research, gold nanoclusters (NCs) are synthesized in the gas phase via a modulated pulse power magnetron sputtering (MPP-MSP) system coupled with a condensation cell. High-power pulses enable the sputtered materials to have a higher density, which, in turn, enhances the population of the NCs [12]. Using a quadrupole mass spectrometer (Q-MS), the size of the NCs is selected, and the NPs are soft landed on a strontium titanate crystal (STO, (110)) biased with a retarding potential. Scanning electron microscopic (SEM) observations indicate that no obvious fragmentation occurs in the gold NCs (Aun) during deposition and that the Aun are immobilized on STO within approximately 1 h. The photo-electrochemical (PEC) measurements suggest that the photocurrent density relies on the size of the Aun and that Au16/STO exhibits the highest photocatalytic activity under visible light radiation.
2. Materials and Methods
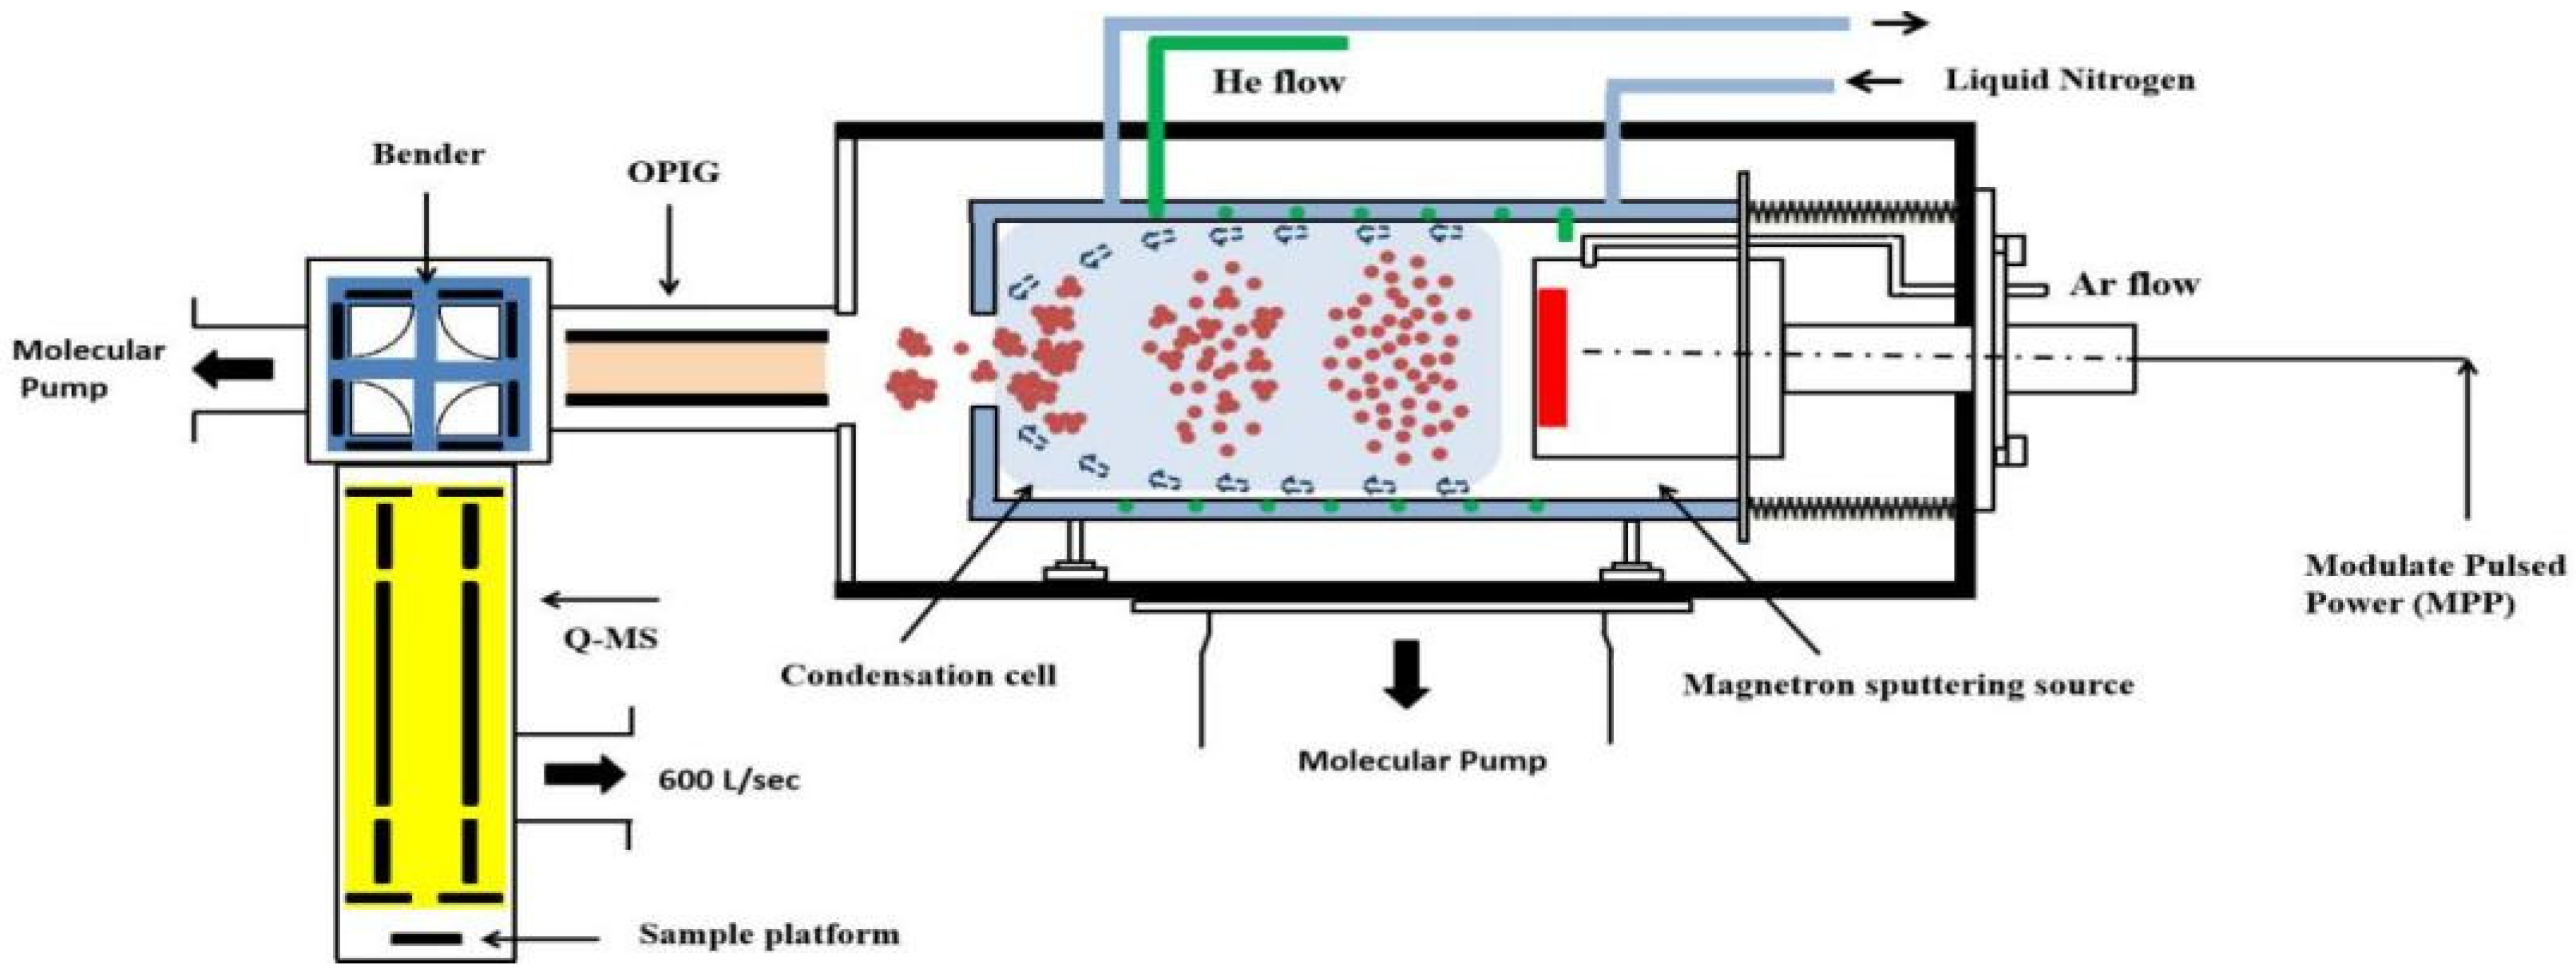
The apparatus is composed of four components: a modulated pulsed-power (MPP) magnetron sputtering device, an octopole ion guide (OPIG) and a quadrupole mass spectrometer, and a sample platform placed 1.0 cm below the Q-MS, as shown in Figure 1. A 99.9% purity gold target with a diameter of 5 cm (Good Fellow Co., Inc., Shanghai, China) is mounted on the sputtering anode, which is powered by an MPP. Pulsed power within the typical peak voltage range of (−500)–(−300 V) and a discharge current range of 0.7–1.5 A and repetition rate (f) of 10–160 Hz can be produced, leading to a peak power (Pp) range of 90–2000 W. The chamber is vacuumed by two pumps and cooled by liquid nitrogen flows in a jacket surrounding the chamber. Argon and helium gases are introduced to the chamber, and their flow rates are monitored and modulated to maximize the current of the Aun.
After sputtering, the sputtered materials, including the Au atoms, anions, and cations, are condensed in the condensation cell and guided by the OPIG to an ion bender, where the charged species are deflected to the Q-MS. The sizes and intensities of the nanoclusters are recorded by the Q-MS. It should be mentioned that there is a movable shield mounted between the sample platform and the outlet of the Q-MS to ensure that no clusters are deposited on the STO before deposition starts. The size-selected gold nanoclusters are then deposited on a 1.0 cm 1.0 cm strontium titanate (STO, MTI Co., Inc., Richmond, CA, USA) mounted on the sample platform. It should be mentioned that the STO is pre-washed with BHF solution (3 mL HF, 7 mL NH4F, and 10 mL deionized water) before use. In order to prevent the fragmentation of the NCs on the STO during landing, a retarding bias of around −1.5 V is applied to the STO. The outlet diameter of the Q-MS is 0.3 cm, leading to an estimated apparent deposition area of cm2 on the STO.
After deposition, the Aun/STO is then immediately transferred to a scanning electron microscopy (ZEISS SUPRA 55 SAPPHIRE, Carl Zeiss, Shanghai, China) under vacuum conditions for morphological measurements. The size of the Aun is measured, and the histogram is produced by a Igor Pro 8.0 (WaveMetrics, Portland, OR, USA) program.
For the photo-electrochemical (PEC) experiment, a photo-electro cell made of Pyrex (homemade) glass is utilized. Measurements are performed in a three-electrode system: Aun/STO is used a as photoanode, a platinum wire is used as a cathode, and Ag/AgCl is used as a reference. A more detailed description of the photo-electro cell, such as a description of the apparent area of the Aun/STO exposed to radiation, can be found in our previous report [11]. It should be mentioned that the experiment is performed in an aqueous solution with Na2SO4 at a concentration of 0.02 M. A magnetic stirrer is used to reduce the charge accumulation in the solution. Pulsed visible light ( > 400 nm) is generated by placing an AM 1.5 filter in front of a 300 W Xe lamp (Asahi Spectra. MX-303, Torrance, CA, USA). During the PEC experiment, the potential–current curve is recorded by a potentialstat (Princeton Applied Research, Beijing, Cihna, versaSTAT 3) under a scan rate of 10 mV/s.
3. Results and Discussion
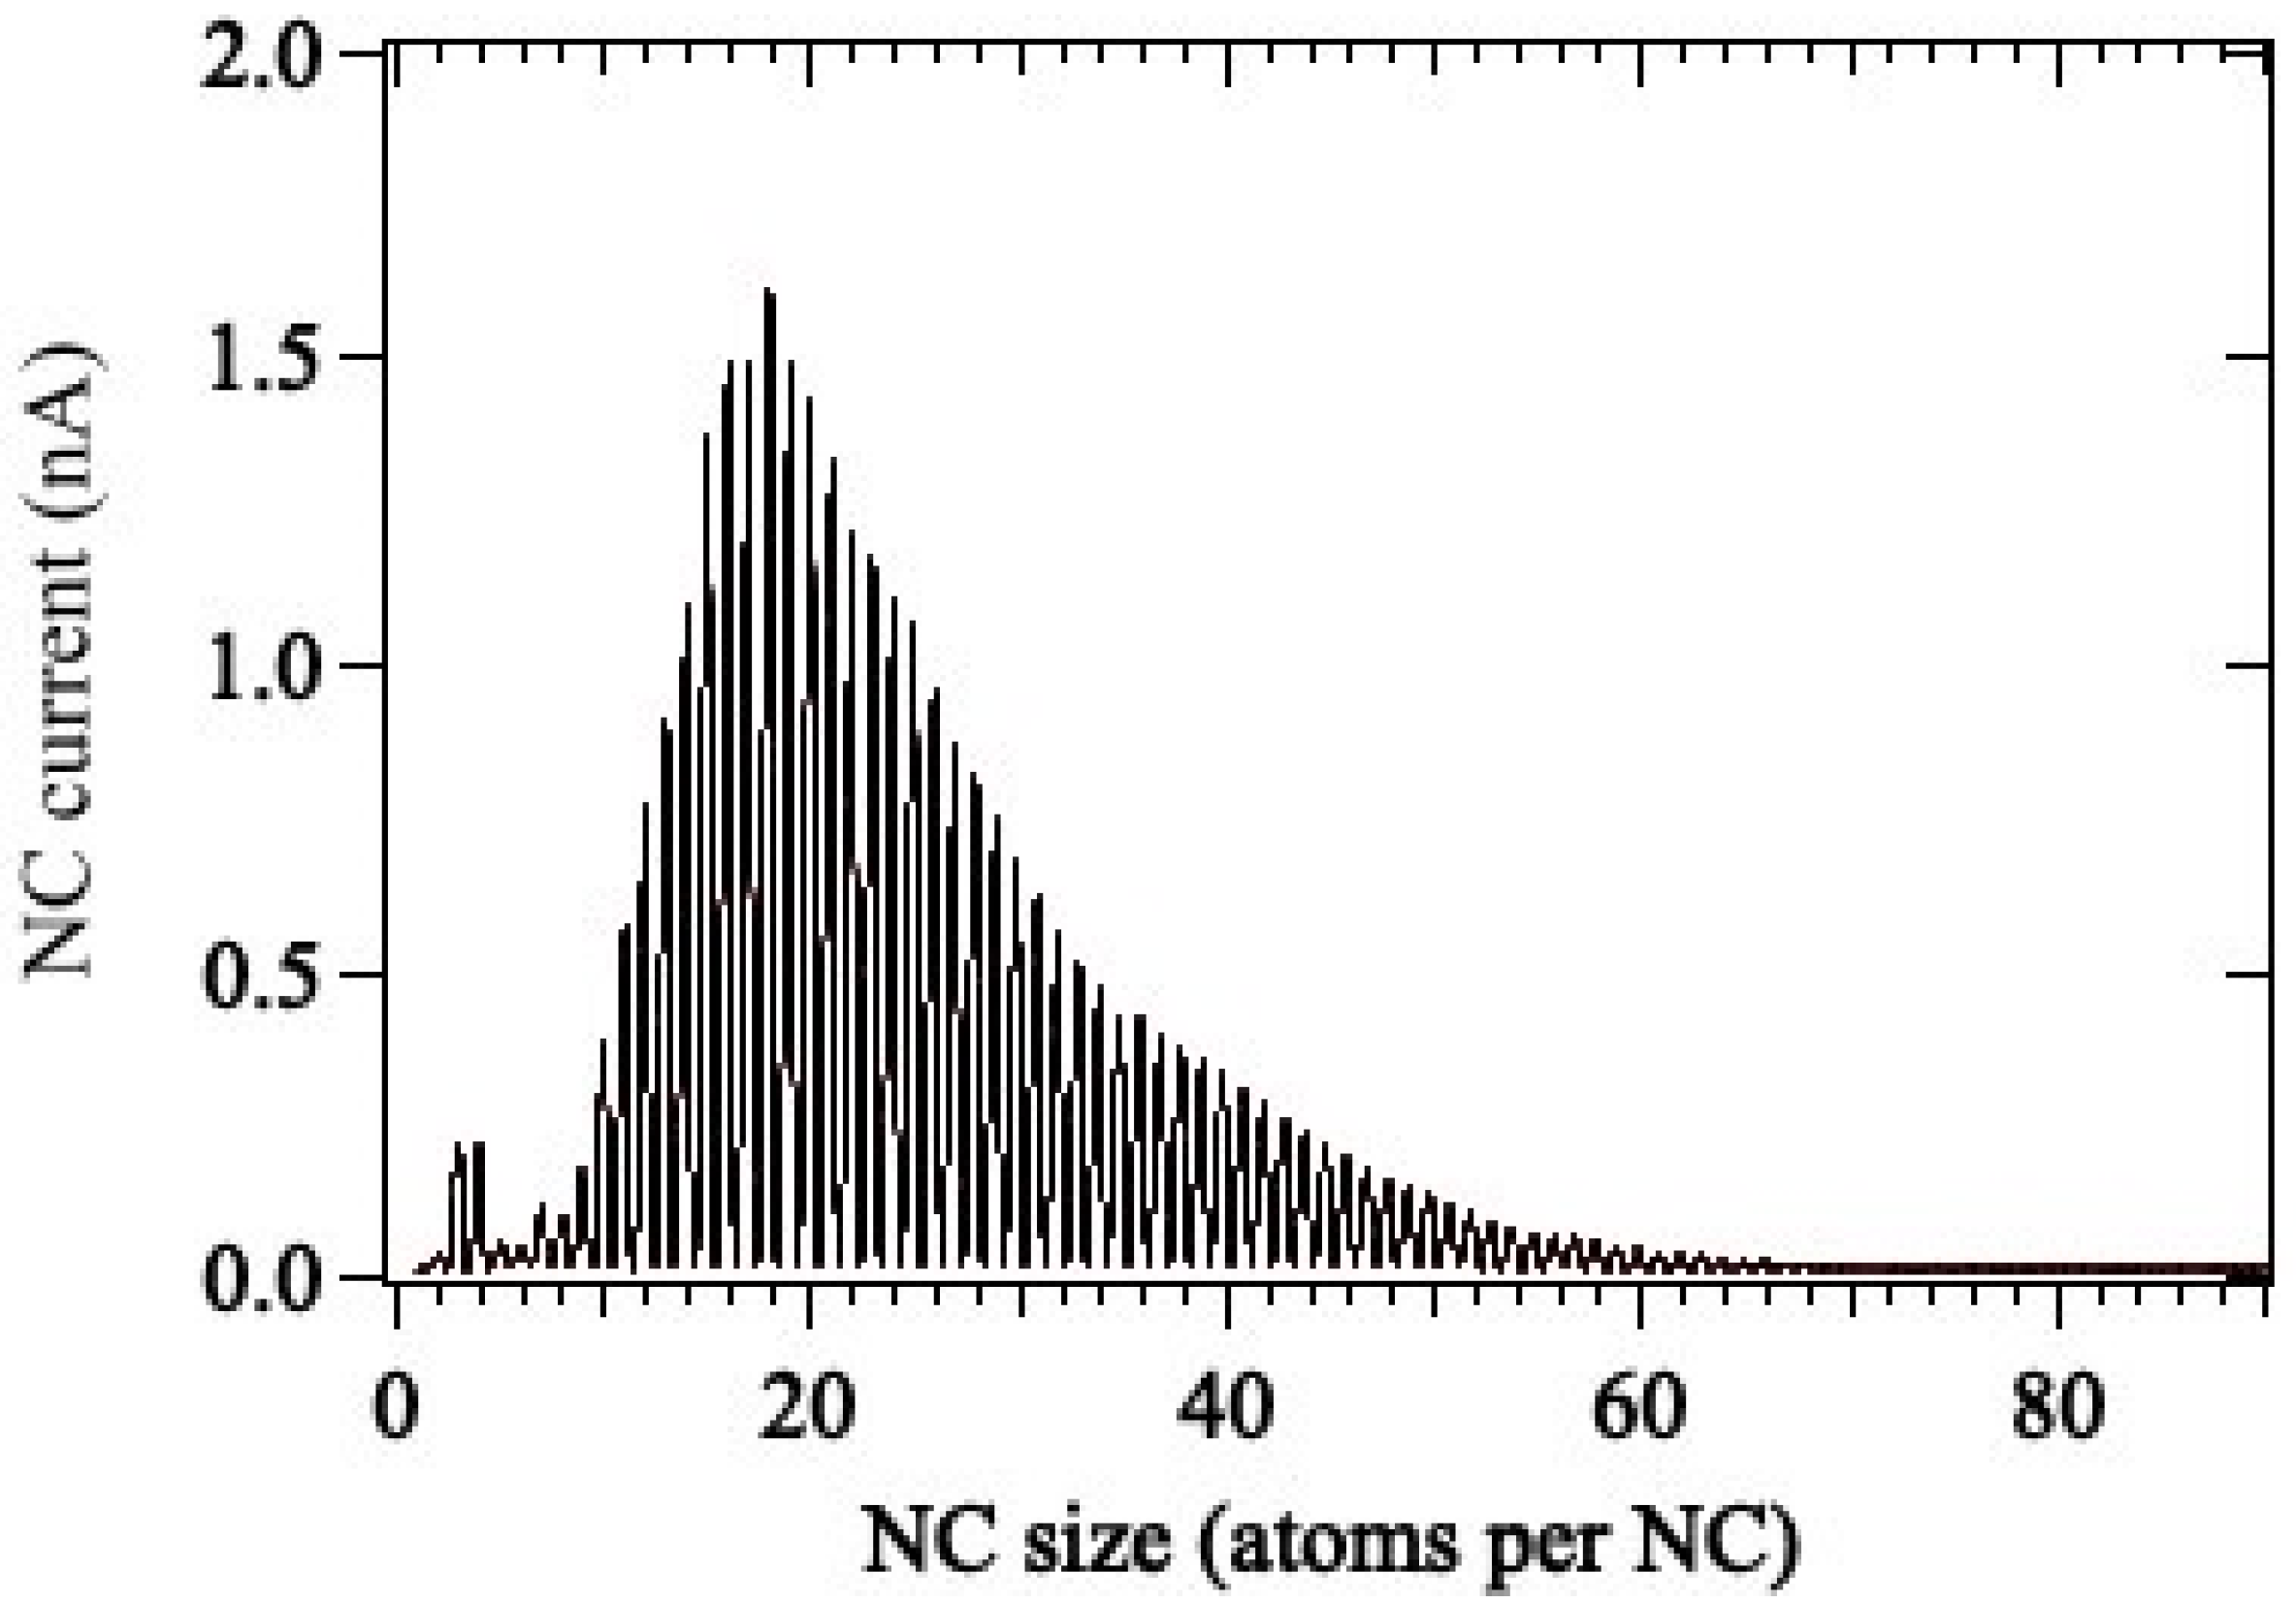
In the condensation cell after sputtering, the sputtered materials, which include gold atoms, anions, and cations, are cooled down by collisions with helium, which is used as a buffer gas. In this case, gold clusters (neutral, negatively, and positively charged) of various sizes are self-assembled in the gas phase. After that, the clusters are guided by an OPIG to an ion deflector, and the charged species are then deflected to a quadrupole mass spectrometer (Q-MS), where the size distribution of the gold clusters is analyzed and displayed in terms of a mass spectrum. Figure 2 shows a typical mass spectrum of gold nanocluster anions Aun, in which the NCs, ranging in size from n = 1 to 65, are clearly visible. It should be mentioned that the size distribution of the Aun can be manipulated by controlling sputtering conditions, such as the Ar and He flow rates, peak power, and repetition rate. The intensity of the Au18 reaches 1.6 nA, which is obviously higher than it is in other reported results [13,14]. The reason for the high intensity of the NCs can be attributed to the high density of sputtered materials under large amounts of pulsed power, and the NC formation mechanism has been discussed via an extended Smoluchowski model published in our previous publications [15].
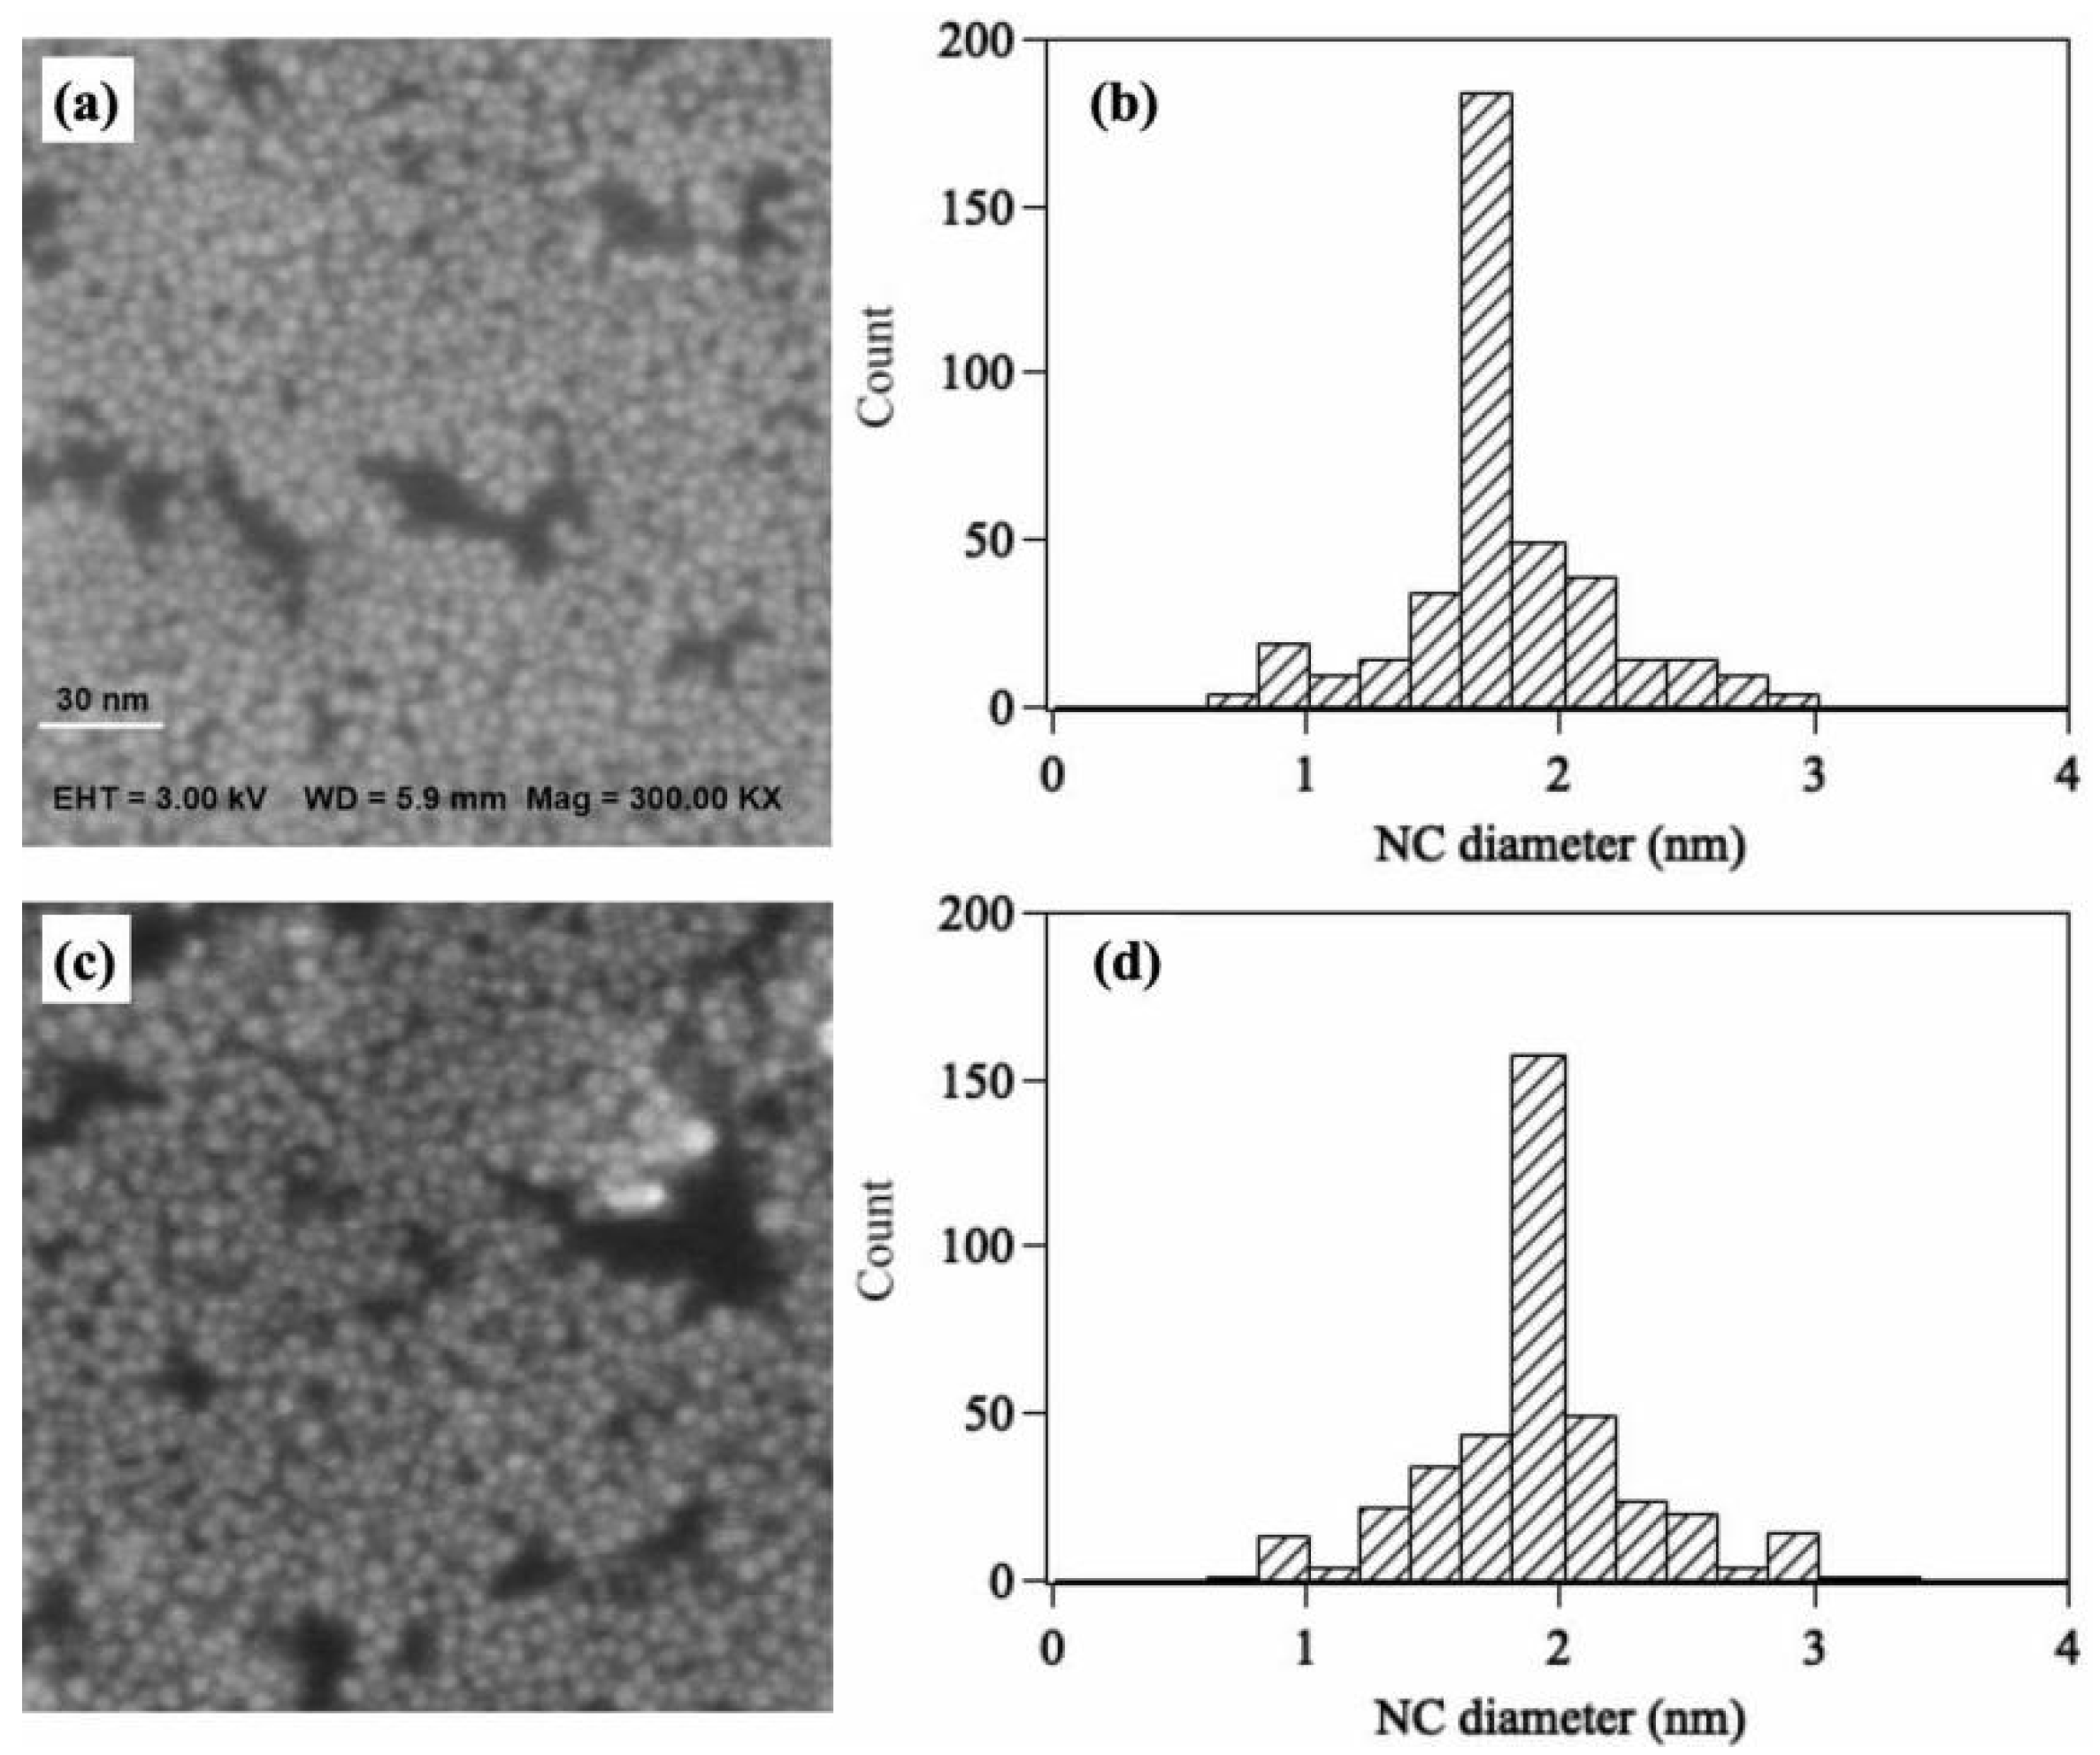
After the mass spectrum is acquired, the Q-MS parameters are properly set so that gold clusters that are of a specific size are allowed to pass through the outlet of the Q-MS. When the deposition process starts, the shields are opened, and the selected gold clusters are deposited on a strontium titanate crystal (STO) that has been placed on the sample platform. In order to reduce the collision energy of the , a retarding potential of −1.5 V is applied to the STO. The deposition population of the NCs can be estimated by the total number of the charges detected. For example, we deposited Au20 at the current 0.4 nA for 120 s, which means Aun are deposited on the STO, leading to a population density of around cm−2. Figure 3a shows a scanning electron microscopic image of the Au20/STO. It can be seen that almost a single Au20 layer is present on the STO, and no obvious NC overlapping can be seen in Figure 3a. By measuring the diameter of the NCs shown in Figure 3a, the diameter distribution of the NCs is presented in Figure 3b. The presence of other sizes indicates that a minor portion of the NCs are deformed or coalesced to form lager NCs during deposition. Most of the deposited Au20 are observed to be around 1.8 nm in size when observed in the SEM scan. For comparison, we also present the SEM image for Au30/STO and the corresponding size distribution as shown in Figure 3b,d, respectively. The observation from Figure 3 indicates that most of the NCs are kept intact and immobilized onto the STO during deposition and during the SEM observation time period.
After deposition, the Au20/STO sample is immediately transferred to the photo-electro cell for the PEC experiment. For comparison, we first tested the photo response for a bare STO under visible light radiation, and the result is shown in Figure 4a. No obvious photocurrent was detected within the potential range from −0.6 V to 0.4 V, indicating that the bare STO does not contribute to the photocatalytic reaction for water splitting under visible light radiation. However, for the sample of Au20/STO, a pulsed photocurrent density (j) with a magnitude of up to around 20 µA/cm2 can be observed at bias of 0.4 V. This result clearly demonstrates that the application of Au20 dramatically improves the photo response of the STO under visible light radiation. It should be noted that the photocurrent density presented in Figure 4 is comparable to the value reported in a gold nanoparticle (NP, 3–8 nm sized)/STO system with more Au NPs than the amount of Au20/STO used in this report [11]. The comparative study between the photocurrent in Au20/STO and Au NP/STO suggests that the size of the NCs plays a critical role in enhancing the photo response of the Au20/STO.
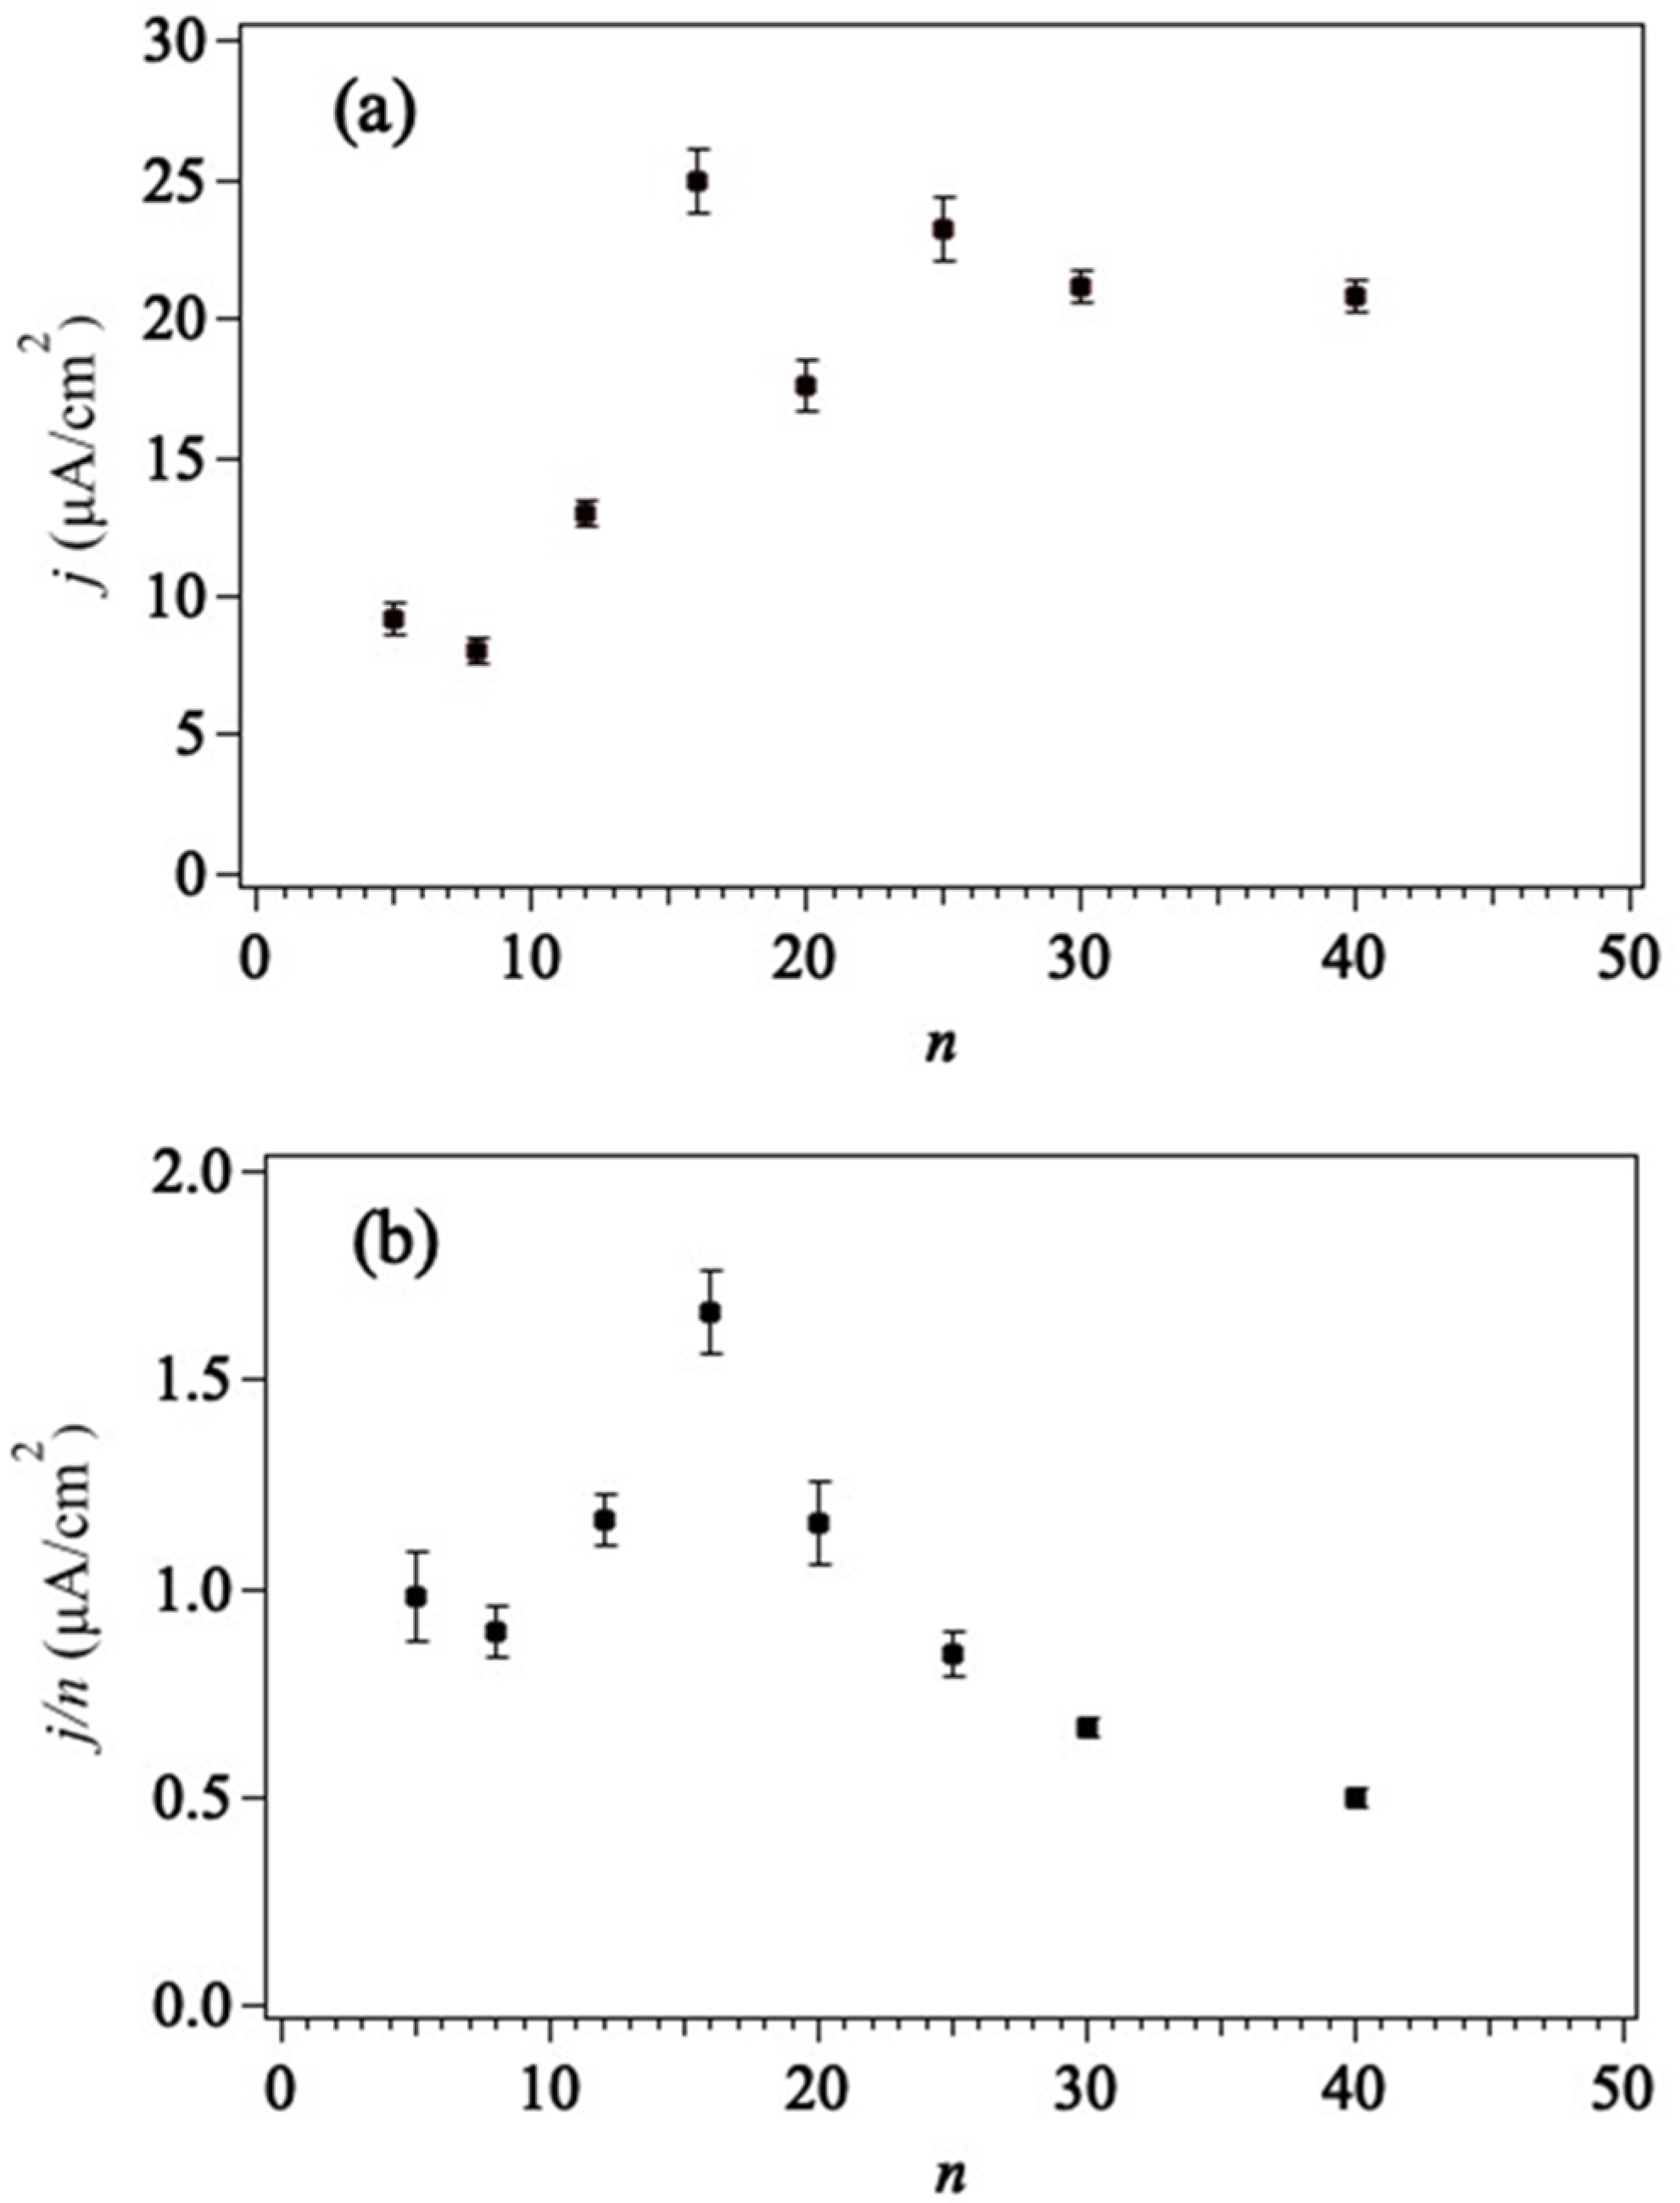
In order to further understand the size effect on the photo response of the Au20/STO, we varied the size of the Aun while keeping the deposition amount of NCs on the STO. It should be mentioned that for each Aun sample size, we fabricated several Aun/STO photocatalysts and performed PEC experiments for each sample five times and took the average of the photocurrent at a bias of 0.4 V vs. the Ag/AgCl reference. Figure 5a shows the size-dependent behavior of the photocurrent density (j) with the size of the Aun at the potential bias of 0.4 V vs. the Ag/AgCl reference. The error bars representing the photocurrent density were calculated by taking the difference between the maximum measured value and the average value. It can be seen that when n is small, the photocurrent density (j) is relatively low. However, when n increases from n = 5 to 16, the photocurrent density apparently increases from 8 A/cm2 to 25 A/cm2. In this research, the maximum photocurrent density was reached when n = 16, indicating that Au16 has the greatest photo response at the deposition amount of NCs under visible light radiation. As n further increases from 16 to 40, the photocurrent density shows a slight decreasing tendency, as shown in Figure 5a. The error bars in Figure 5 were created by taking the absolute uncertainties of the PEC measurements for each size of Au20.
The photocurrent density for the atoms in Aun, i.e., the ratio of the photocurrent density and n (j/n), is a good indicator to determine the efficiency of the /STO photocatalyst. Figure 5b shows the dependent manner of j/n and n, in which a local maximum value can be seen at n = 16. The j/n errors are calculated using the percentage uncertainty of j in Figure 5a. The results presented in Figure 5 clearly indicate that the size effect on the photo response of the Aun/STO photocatalyst and gold 16-mer are the most efficient NCs for photocatalytic reactions under visible light.
Because photocatalytic water splitting evolves with the electron excitation processes from the valence band to the conduction band in the semiconductor followed by the electron transfer from the semiconductor’s conduction band to the NC co-catalyst, and, finally, the charge transfer from the NCs to the hydrogen ions in the aqueous solution, the electron affinity (EA) of the NC co-catalyst could play an important role. For small coinage metal NCs, there is an odd–even EA oscillation [16,17,18]. Although there are not enough data points, a similar odd–even tendency in the oscillation behavior could likely occur, as shown in Figure 5a, i.e., the photocurrent density for Au5/STO is greater than that of Au8/STO, and Au16/STO exhibits the highest j value. For larger n values, the oscillation behavior becomes less obvious, which is also generally consistent with the experimental findings for the EA of Aun. Surely, other factors, such as local plasma resonance, which is commonly observed for noble metal clusters, may also contribute to the observations shown in Figure 5.
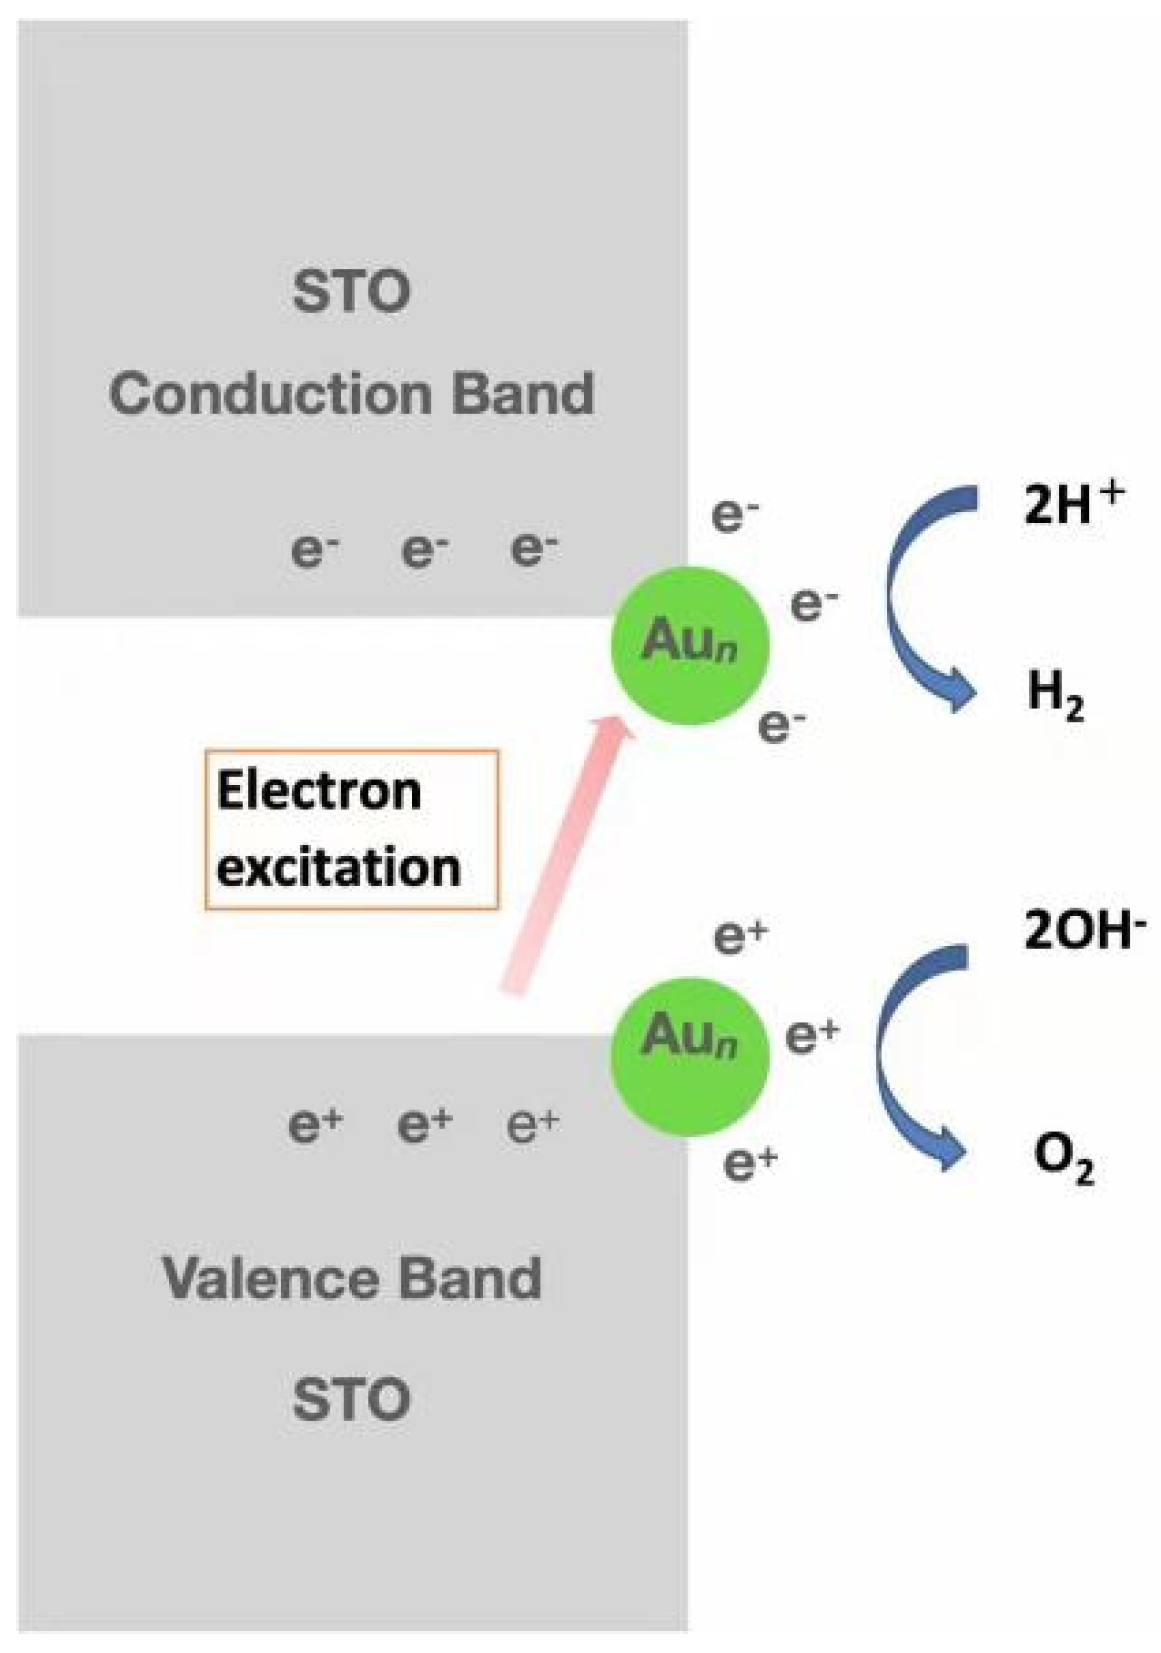
Finally, we present the photocatalyst water splitting process for Aun/STO photocatalyst as follows (see the illustrative sketch in Figure 6): The application of size-selected Aun may modify the energy band structure of the Aun/STO interface, which leads to the visible light response of the Aun/STO photocatalyst. Two schemes may occur: (1) direct electron excitation from valence band (VB) to gold NCs for water reduction, leaving holes in VB; (2) holes transfer from VB to gold NCs for water oxidization (see Figure 6). The transfer rate of electrons depends on the electron affinity of the Au20n: odd–even oscillation of the photocurrent density is observed due to the odd–even oscillation of the EA of the Aun for n is less than 20. Due to the high EA in Au16 in the small cluster range, Au16/STO exhibited the highest photocurrent density. As n further increases to 40, the EA for gold NCs does not show any obvious variation, and, therefore, no dramatic changes in the photocurrent density are detected for .
4. Conclusions
Size-selected gold NCs (Aun) were deposited as co-catalysts on a strontium titanate crystal, and the photocatalytic water splitting efficiency of the Aun/STO photocatalyst was investigated. It was found that the application of the Aun co-catalyst enables the STO to undergo a visible light response, which can be attributed to the reconstructed band structure of the Aun/STO interface. The photocurrent density of the photocatalyst depends on the size of the Aun, and Au16/STO exhibits the highest photocurrent. The size-dependent tendency of the photocurrent density is similar to the size-dependent electron affinity of the Aun, indicating that the EA of the Aun plays a key role: the electron transfer rate from STO to Au16 is accelerated due to the maximum EA of Au16.
Funding
This research received no external funding.
Data Availability Statement
Data sharing is not applicable to this article.
Acknowledgments
The author thanks Gaoxiang Ye from Zhejiang University for the useful discussions on the SEM images.
Conflicts of Interest
The author declares no conflict of interest.
References
- Fujishima, A.; Honda, K. Electrochemical Photocatalysis of Water at a Semiconductor Electrode. Nature 1972, 238, 37–38. [Google Scholar] [CrossRef] [PubMed]
- Kogo, A.; Sakai, N.; Tatsuma, T. Photocatalysis of Au25-modified TiO2 under Visible and Near Infrared Light. Electrochem. Commun. 2010, 12, 996–999. [Google Scholar] [CrossRef]
- Yoo, S.M.; Rawal, S.B.; Lee, J.E.; Kim, J.; Ryu, H.Y. Size-Dependent of Plasmonic Au Nanoparticles in Photocatalytic Behavior of Au/TiO2 and Au@SiO2/TiO2. Appl. Catal. A-Gen. 2015, 499, 47–54. [Google Scholar] [CrossRef]
- Wen, B.; Jiang, Y.H.; Liao, H.G.; Roeffaers, B.J.; Lai, F.L.; Huang, H.W.; Tang, Z.C. Visualizing Light-Induced Dynamic Structural Transformation of Au Clusters-Based Photocatalyst via in situ TEM. Nano Res. 2021, 14, 2805–2809. [Google Scholar]
- Wallace, W.T.; Whetten, R.L. Coadsorption of CO and O2 on Selected Gold Clusters: Evidence for Efficient Room Temperature CO2 Generation. J. Am. Chem. Soc. 2002, 124, 7499–7505. [Google Scholar] [CrossRef] [PubMed]
- Berr, M.J.; Schweinberger, F.F.; Dobliger, M.; Sanwald, K.E.; Wolff, C.; Breimeirer, J.; Crampton, A.S.; Ridge, C.J.; Tschurl, M.; Heiz, U.; et al. Subnanometer Cluster Catalysts on Semiconductor Nanocrystal Films for Atomic Scale Insight into Photocatalysis. Nano Lett. 2012, 12, 5903–5906. [Google Scholar] [CrossRef] [PubMed]
- Fang, M.; Tan, X.L.; Liu, Z.X.; Hu, B.W.; Wang, X.K. Recent Progress on Metal-Enhanced Photocatalysis: A Review on the Mechanism. Research 2021, 2021, 9794329. [Google Scholar] [CrossRef] [PubMed]
- Awazu, K.; Fujishima, M.; Rockstuhl, C.; Tominaga, J.; Murakami, H.; Ohki, Y.; Yoshida, N.; Watanabe, T. A Plasmonic Photocatalyst Consisting of Silver Nanoparticles Embedded in Titanium Dioxide. J. Am. Chem. Soc. 2008, 130, 1676–1680. [Google Scholar] [CrossRef] [PubMed]
- Li, J.T.; Cushing, S.K.; Meng, F.K.; Senty, T.R.; Bristow, A.D.; Wu, N.Q. Plasmon-Induced Resonance Energy Transfer for Solar Energy Conversion. Nat. Photonics 2015, 9, 601–607. [Google Scholar] [CrossRef]
- Schweinberger, F.F.; Berr, M.J.; Dobliger, M.; Wolff, C.; Sanwald, K.E.; Crampton, A.S.; Ridge, C.J.; Jackel, F.; Feldman, J.; Tschurl, M.; et al. Cluster Size Effects in the Photocatalytic Hydrogen Evolution Reaction. J. Am. Chem. Soc. 2013, 135, 13262–13265. [Google Scholar] [CrossRef] [PubMed]
- Zhang, C.H.; Feng, Y.X. Self-Assembled Gold Nanoparticles on Strontium Titanate for Efficient Photocatalytic Water Oxidization and Visible light Response. Mater. Res. Express 2015, 2, 1–6. [Google Scholar] [CrossRef]
- Lin, J.L.; Sproul, W.D.; Moore, J.J.; Wu, Z.L.; Lee, S.; Chistyakov, R.; Abraham, B. Recent Advances in Modulated Pulsed Power Magnetron Sputtering for Surface Engineering. JOM 2011, 63, 48–58. [Google Scholar] [CrossRef]
- Palmer, R.E.; Pratontep, S.; Boyen, H.G. Nanostructured Surfaces from Size-Selected Clusters. Nat. Mater. 2003, 2, 443–448. [Google Scholar] [CrossRef] [PubMed]
- Pratontep, S.; Carroll, S.J.; Xirouchaki, C.; Streun, M.; Palmer, R.E. Size-Selected Cluster Beam Source Based on Radio Frequency Magnetron Plasma Sputtering and Gas Condensation. Rev. Sci. Instrum. 2005, 76, 045103. [Google Scholar] [CrossRef]
- Zhang, C.H.; Feng, Y.X.; Tsunoyama, H.; Nakajima, A. Extended Smoluchowski Model for the Formation of Size-Selected Silver Nanoclusters Generated via Modulated Pulsed Power Magnetron Sputtering. J. Phys. Chem. C 2016, 120, 5667–5672. [Google Scholar] [CrossRef]
- Taylor, K.J.; Pettiette-Hall, C.L.; Cheshnovsky, O.; Smalley, R.E. Ultra-Violet Photoelectric Spectra of Coinage Metal Clusters. J. Chem. Phys. 1992, 96, 3319–3329. [Google Scholar] [CrossRef]
- Mao, H.P.; Wang, H.Y.; Ni, Y.; Xu, G.L.; Ma, M.Z.; Zhu, Z.H.; Tang, Y.J. Geometry and Electronic Properties of Aun (n = 2–9) Clusters. Acta Phys. Sin. 2004, 53, 1766–1771. [Google Scholar]
- Beltran, M.R.; Suarez-Raspopov, R.; Gonzalez, G. Structural Evolution Study of 1-2 nm Gold Clusters. Eur. Phys. J. D 2011, 65, 411–420. [Google Scholar] [CrossRef]
Figure 1.
The set-up of the apparatus. A sputtering source, a condensation cell, an OPIG, an ion bender, and a Q-MS are indicated.
Figure 1.
The set-up of the apparatus. A sputtering source, a condensation cell, an OPIG, an ion bender, and a Q-MS are indicated.

Figure 2.
Mass spectrum of Aun anions under conditions with a He flow rate = 200 sccm, Ar flow rate = 200 sccm, peak power = 600 W, and repetition rate = 60 Hz.
Figure 2.
Mass spectrum of Aun anions under conditions with a He flow rate = 200 sccm, Ar flow rate = 200 sccm, peak power = 600 W, and repetition rate = 60 Hz.

Figure 3.
Scanning electron microscopic image of (a) Au20/STO and (c) Au30/STO with a deposition current of 0.4 nA for 120 s and a retarding potential of −1.5 V on STO. (b,d) are corresponding size distributions of deposited gold NCs for (a,c), respectively.
Figure 3.
Scanning electron microscopic image of (a) Au20/STO and (c) Au30/STO with a deposition current of 0.4 nA for 120 s and a retarding potential of −1.5 V on STO. (b,d) are corresponding size distributions of deposited gold NCs for (a,c), respectively.

Figure 4.
Photocurrent density (j): potential curves for (a) bare STO and (b) /STO under visible light radiation ( nm).
Figure 4.
Photocurrent density (j): potential curves for (a) bare STO and (b) /STO under visible light radiation ( nm).

Figure 5.
Dependent behavior of (a) the photocurrent density (j) and (b) photocurrent density per atom (j/n) for Aun/STO at a bias of 0.4 V vs. Ag/AgCl reference under visible light radiation ( nm).
Figure 5.
Dependent behavior of (a) the photocurrent density (j) and (b) photocurrent density per atom (j/n) for Aun/STO at a bias of 0.4 V vs. Ag/AgCl reference under visible light radiation ( nm).

Figure 6.
Illustrative sketch of the charge transfer and water splitting processes on Aun/STO.

Publisher’s Note: MDPI stays neutral with regard to jurisdictional claims in published maps and institutional affiliations. |
© 2022 by the author. Licensee MDPI, Basel, Switzerland. This article is an open access article distributed under the terms and conditions of the Creative Commons Attribution (CC BY) license (https://creativecommons.org/licenses/by/4.0/).
Share and Cite
MDPI and ACS Style
Zhang, C. Deposition of Size-Selected Gold Nanoclusters onto Strontium Titanate Crystals for Water Splitting under Visible Light. Catalysts 2022, 12, 367. https://0-doi-org.brum.beds.ac.uk/10.3390/catal12040367
AMA Style
Zhang C. Deposition of Size-Selected Gold Nanoclusters onto Strontium Titanate Crystals for Water Splitting under Visible Light. Catalysts. 2022; 12(4):367. https://0-doi-org.brum.beds.ac.uk/10.3390/catal12040367
Chicago/Turabian StyleZhang, Chuhang. 2022. "Deposition of Size-Selected Gold Nanoclusters onto Strontium Titanate Crystals for Water Splitting under Visible Light" Catalysts 12, no. 4: 367. https://0-doi-org.brum.beds.ac.uk/10.3390/catal12040367
Note that from the first issue of 2016, this journal uses article numbers instead of page numbers. See further details here.