Article

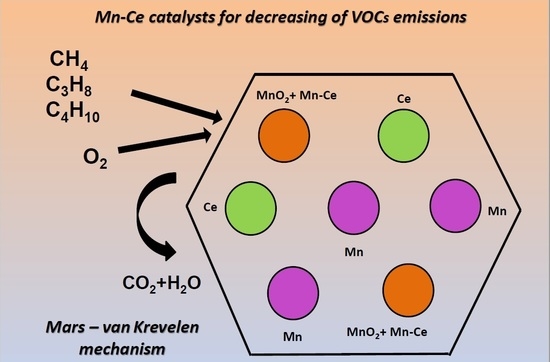
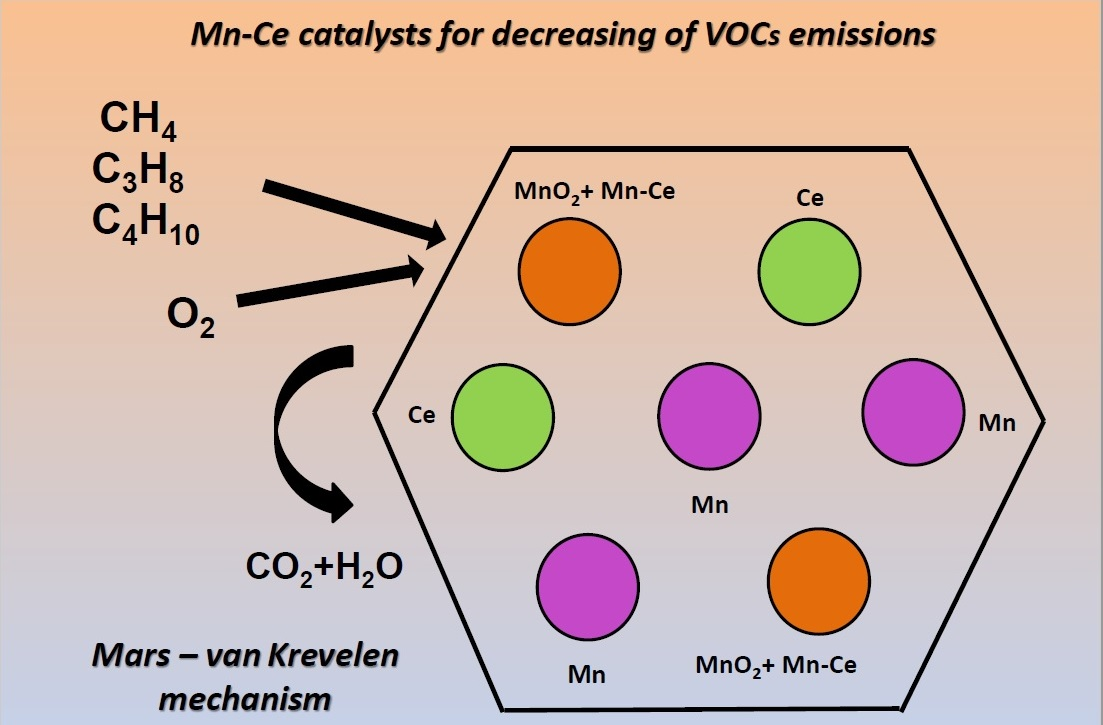
Reaction Kinetics and Mechanism of VOCs Combustion on Mn-Ce-SBA-15

1
Institute of General and Inorganic Chemistry, Bulgarian Academy of Sciences, 1113 Sofia, Bulgaria
2
Laboratoire Lorrain de Chimie Moleculaire L2CM, UMR7053, Faculté des Sciences et Technologies, Université de Lorraine/CNRS, CEDEX, F-54506 Vandoeuvre-lès-Nancy, France
3
Institut de Science des Matériaux de Mulhouse, Université de Haute Alsace (UHA)/CNRS, IS2M, UMR 7361, CEDEX, F-68100 Mulhouse, France
4
Université de Strasbourg, F-67000 Strasbourg, France
5
Institute of Catalysis, Bulgarian Academy of Sciences, 1113 Sofia, Bulgaria
6
Institute of Optical Materials and Technologies “Acad. Jordan Malinowski”, Bulgarian Academy of Sciences, 1113 Sofia, Bulgaria
*
Author to whom correspondence should be addressed.
Submission received: 24 March 2022 / Revised: 20 May 2022 / Accepted: 23 May 2022 / Published: 26 May 2022

Abstract

:
A propane combustion catalyst based on Mn and Ce and supported by SBA-15 was prepared by the “two-solvents” method aiming at the possible application in catalytic converters for abatement of alkanes in waste (exhaust) gases. The catalyst characterization was carried out by SAXS, N2-physisorption, XRD, TEM, XPS, EPR and H2-TPR methods. The catalysts’ performance was evaluated by tests on the combustion of methane, propane and butane. The reaction kinetics investigation showed that the reaction orders towards propane and oxygen were 0.7 and 0.1, respectively. The negative reaction order towards the water (−0.3) shows an inhibiting effect on the water molecules. Based on the data from the instrumental methods, catalytic experiments and mathematic modeling of the reaction kinetics, one may conclude that the Mars–van Krevelen type of mechanism is the most probable for the reaction of complete propane oxidation over single Mn and bi-component Mn-Ce catalysts. The fine dispersion of manganese and cerium oxide and their strong interaction inside the channels of the SBA-15 molecular sieve leads to the formation of difficult to reduce oxide phases and consequently, to lower catalytic activity compared to the mono-component manganese oxide catalyst. It was confirmed that the meso-structure was not modified during the catalytic reaction, thus it can prevent the agglomeration of the oxide particles.

Graphical Abstract

1. Introduction

During the last several decades, automobile exhausts have become one of the main pollution sources, causing many serious environmental problems, such as stratospheric ozone layer depletion, greenhouse effect, acidic rain and photo-induced chemical smog [1,2]. In most catalytic combustion applications, natural gas is used as fuel. Natural gas is mainly composed of methane (about 90%) but it also contains some other hydrocarbons, mainly ethane (about 10%) and propane (about 1–3%) depending on the region [3]. In order to meet the environmental protection demands, the decrease in alkane emissions by catalytic combustion was extensively investigated. Palladium and platinum-supported catalysts are the most active ones in the combustion reaction, however, the main drawback is their deactivation at high temperatures (above 500 °C). Thus, the research efforts of scientists are directed to the development of alternative catalysts, and among all the studied metal oxides the most active single metal oxides are those of Cu, Co, Mn and Ni [4]. Manganese and cobalt-containing catalysts are not very expensive and show high activity in VOC’s complete oxidation [5]. The benefits of the manganese oxide-based catalysts are connected with the ability of manganese to form oxides with different oxidation states and their high oxygen storage capacities (OSC) [6,7]. Pure manganese oxides deactivate during the oxidation process as a result of poisoning [8]. In order to overcome these disadvantages of the manganese-based catalysts and to improve their properties, they must be modified with other oxides. One such oxide is CeO2. Cerium oxide was used as an oxygen storage medium and thermal stabilizer and its oxygen storage capacity is associated with the fast Ce4+/Ce3+ redox process, making the oxygen available for the oxidation reaction. On the other hand, ceria is enhancing the dispersion of supported metals and stabilizes the oxide support toward thermal sintering [9,10]. Various carriers with a highly developed surface are used for catalyst preparation in order to stabilize the oxide particles, thus the porosity of support is modifying the catalytic properties by affecting the particle dispersion and reducibility of metal species.
According to the literature data, the addition of Ce to Mn facilitated the reduction of the manganese oxide phases and as a result, increases the activity in the complete oxidation of VOC [11,12,13,14,15]. In our previous studies, it was established that cerium modified the catalytic behavior of cobalt and manganese in n-hexane [16,17], ethyl acetate [17] and CO oxidation. The catalytic properties in these reactions depended on the sequence of the active components’ introductions. The choice of support is of great importance in order to ensure the greater catalytic performance of the catalyst. SBA-15 is a widely used support among the mesoporous silicas due to its regular hexagonal array of pores with a uniform diameter, and also its very high specific surface area and high pore volume. Further, SBA-15 is inert and stable at a relatively high temperature. In our previous investigation [18], we found that the Co–Mn catalyst supported by SBA-15 demonstrates a remarkable resistance towards agglomeration and this fact is attributed to the mesoporous structure.
Taking into account the literature data and our previous results, our expectation was that the combination of manganese and cerium with porous support would lead to a stable and active catalyst for VOC oxidation. To the best of our knowledge, there are no reports regarding the simultaneous modification of SBA-15 with both cerium and manganese oxides.
The present paper is focused on mixed Mn-Ce oxide catalysts for the combustion of different VOC. The work is focused on the investigation of the structural and catalytic properties of a number of mono-component manganese and bi-component Mn-Ce catalyst samples supported by SBA-15. The selected reagents are methane, propane and butane. The specified volatile organic compounds are chosen because methane is the second most abundant greenhouse gas manifesting a global warming potential ca. 20 times greater than CO2, propane and butane, which are the main components of liquefied petroleum gas (LPG) Therefore, the study of the Mn-Ce-SBA-15 catalysts is of importance for further development as an active phase for application in catalytic converters for abatement of exhaust gases from LPG motor engines.

2. Results and Discussion

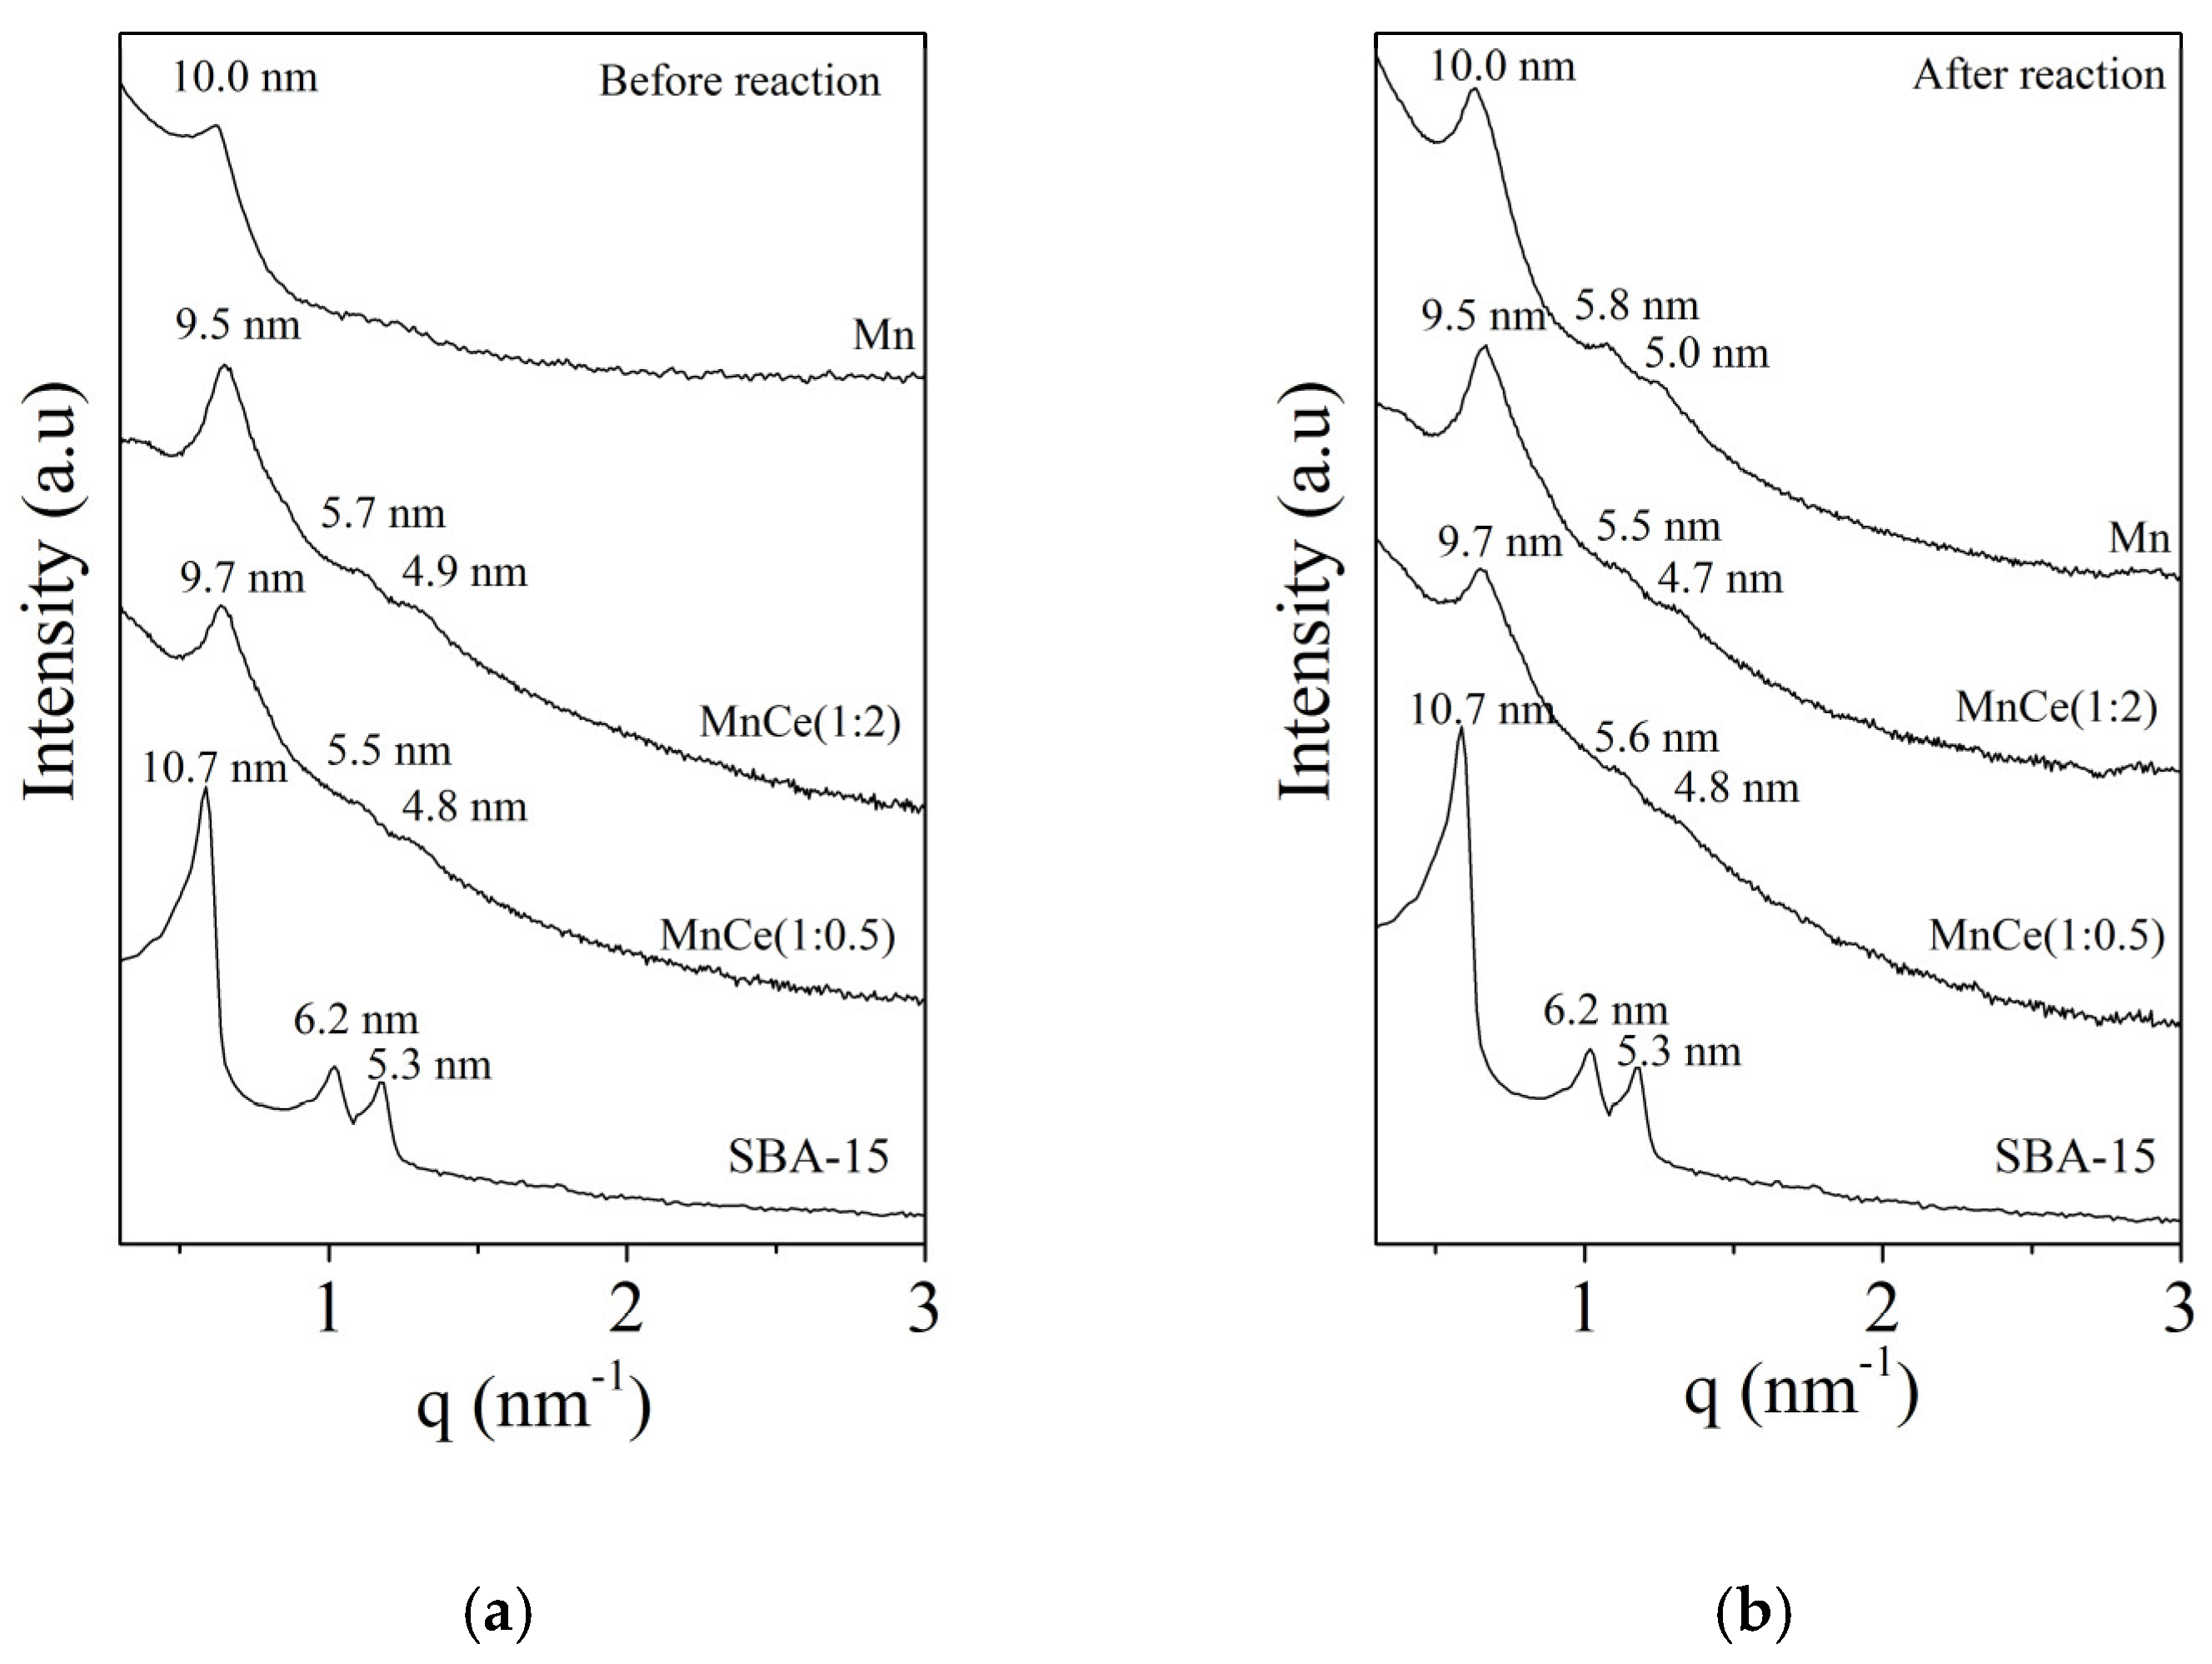
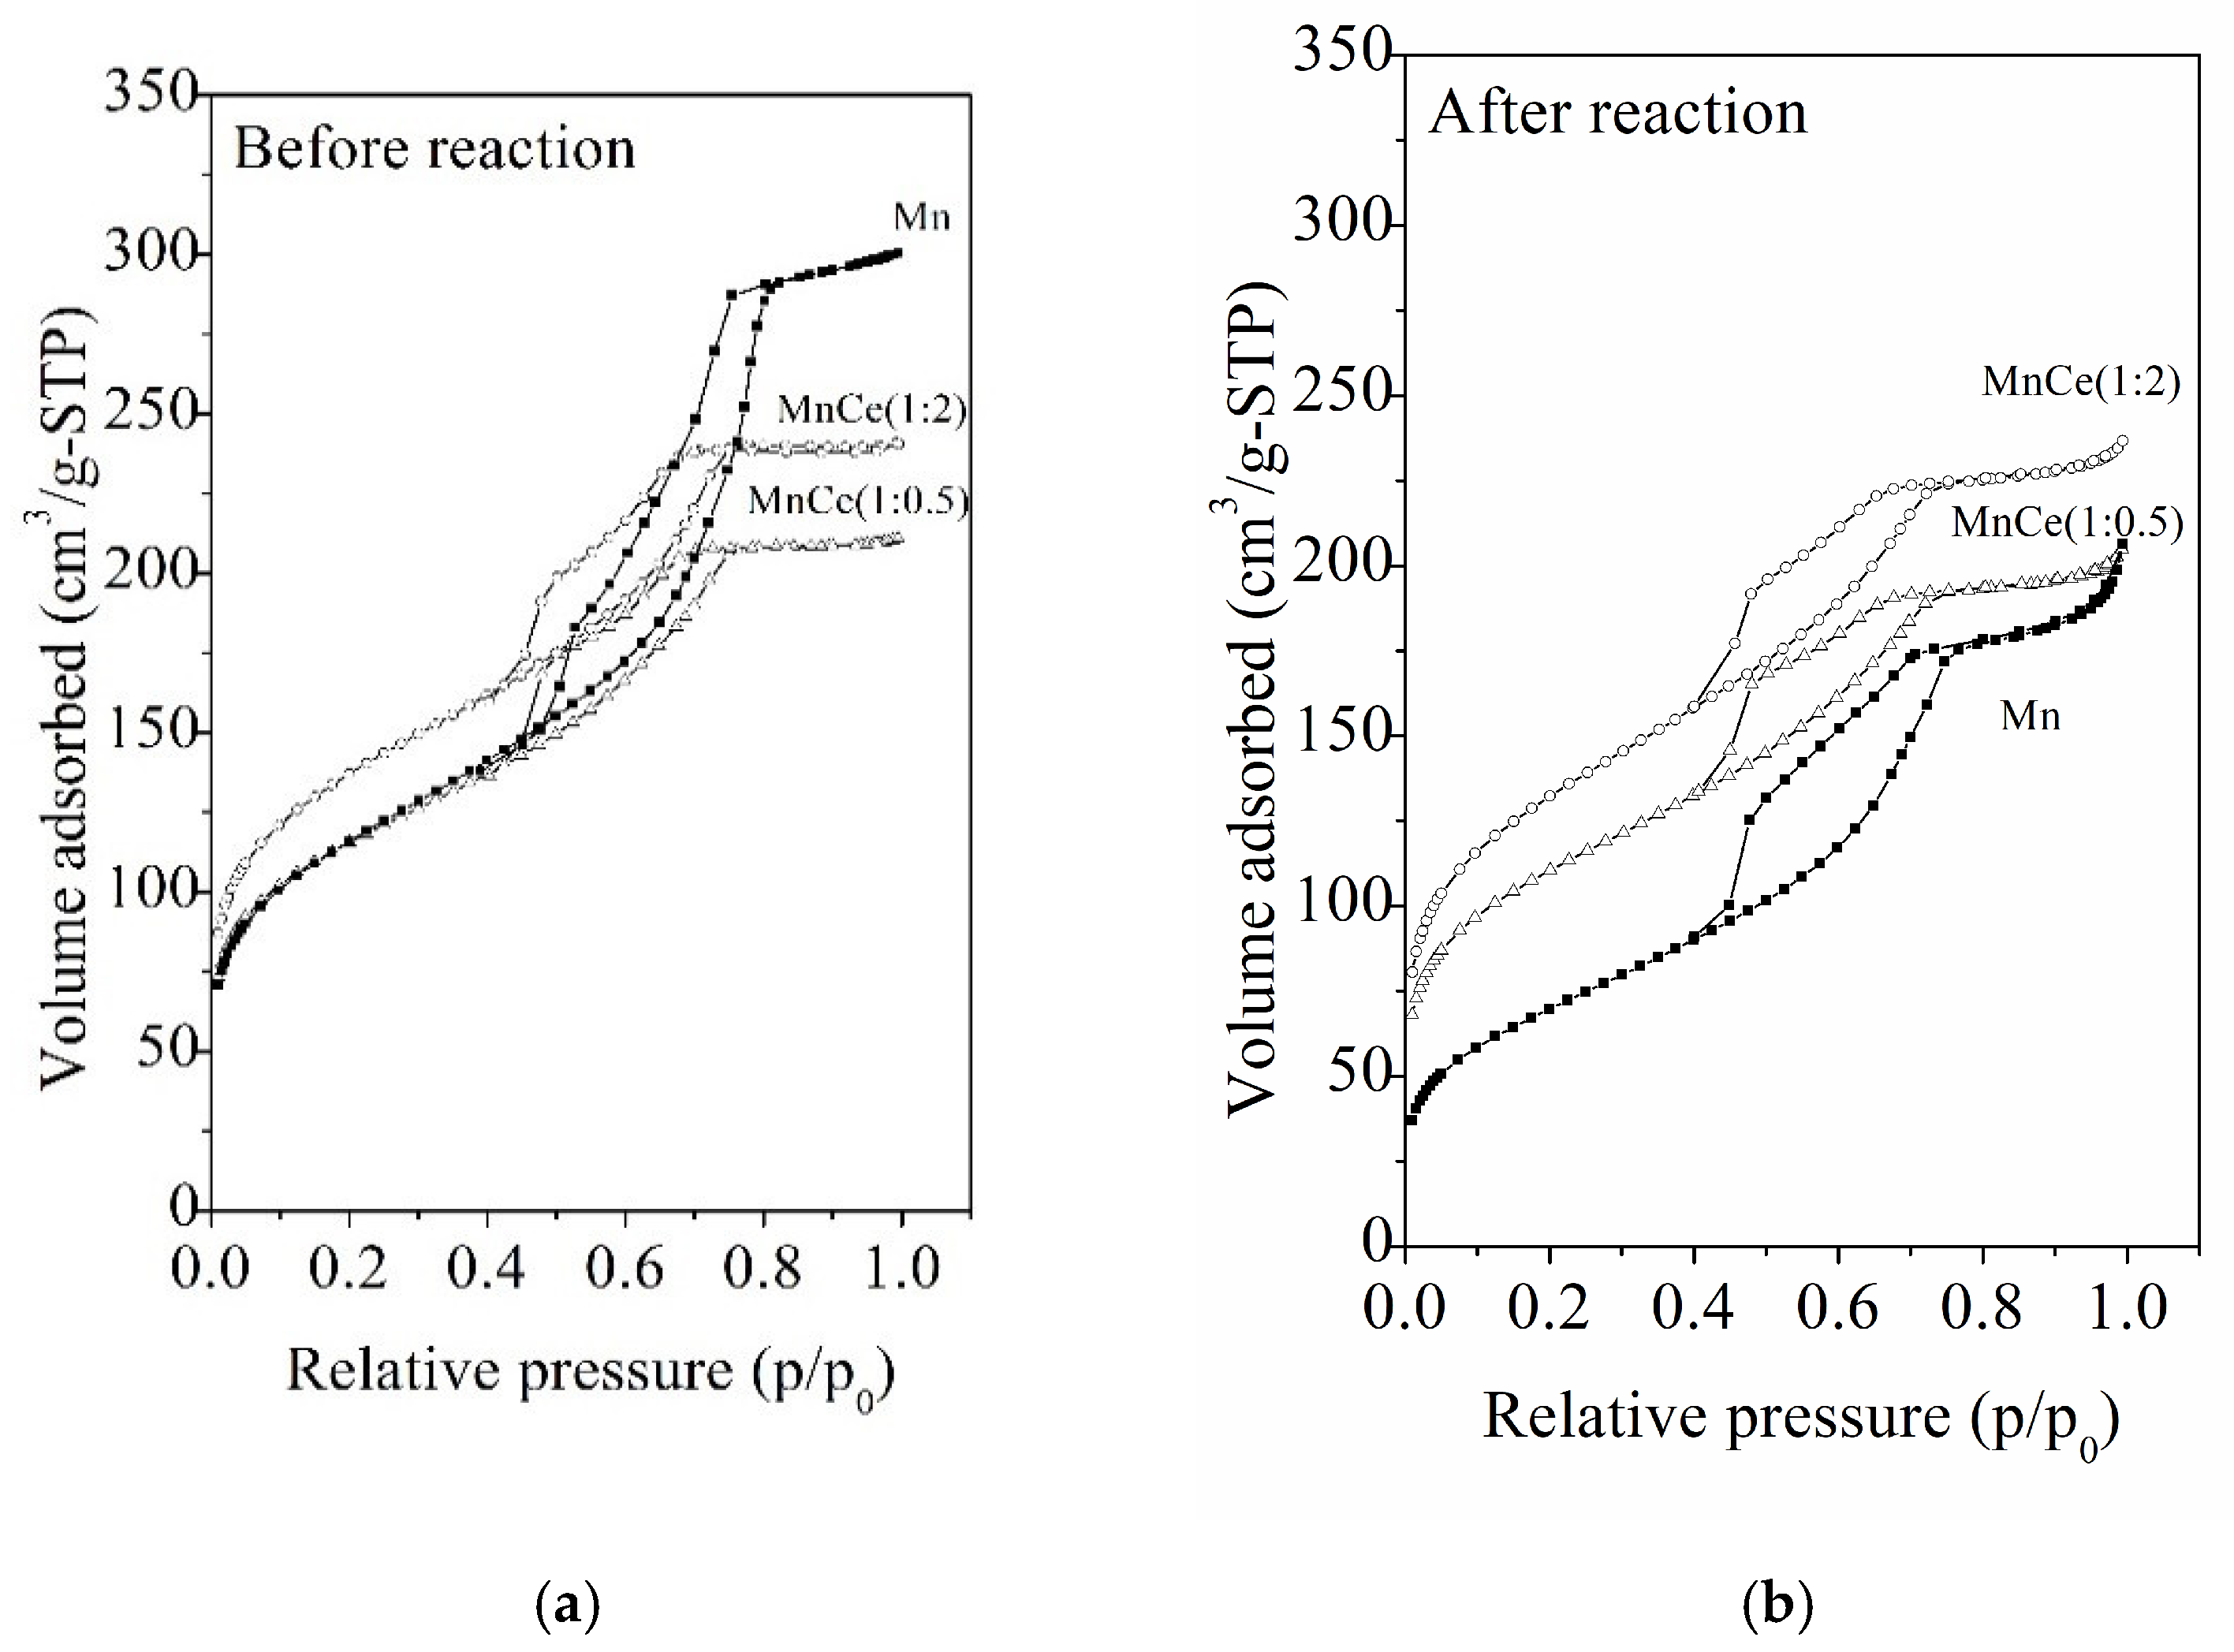
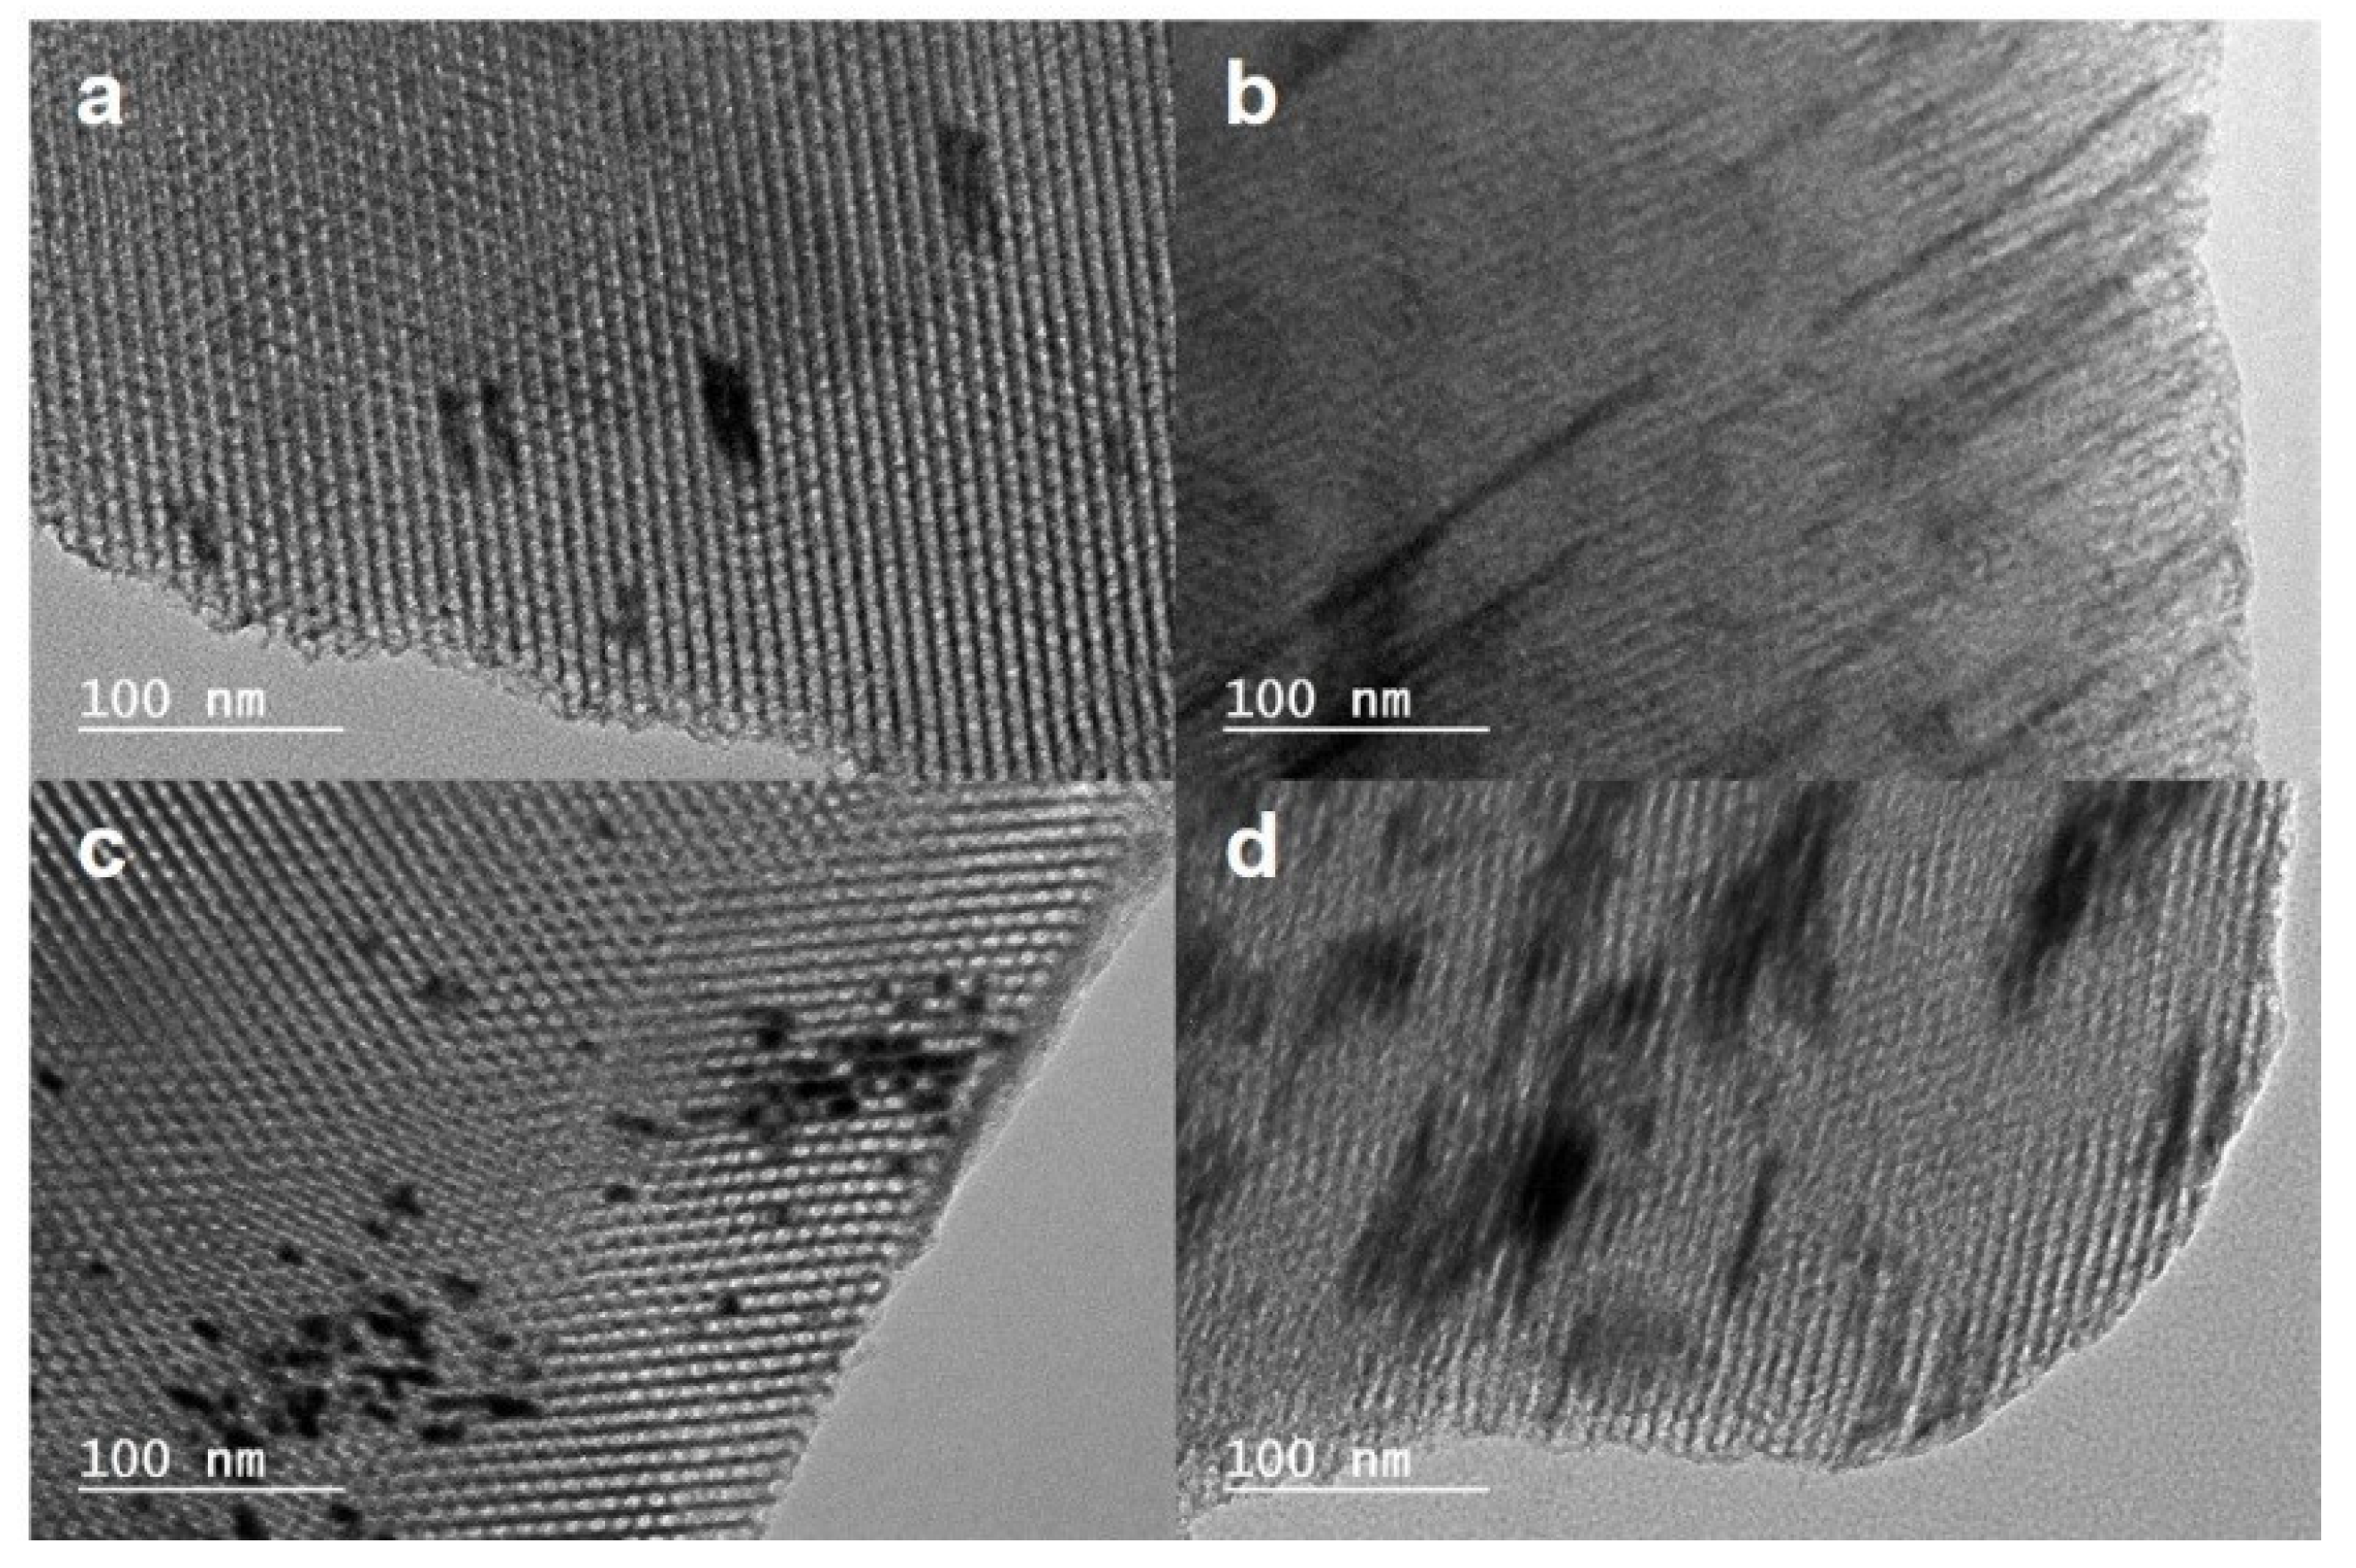
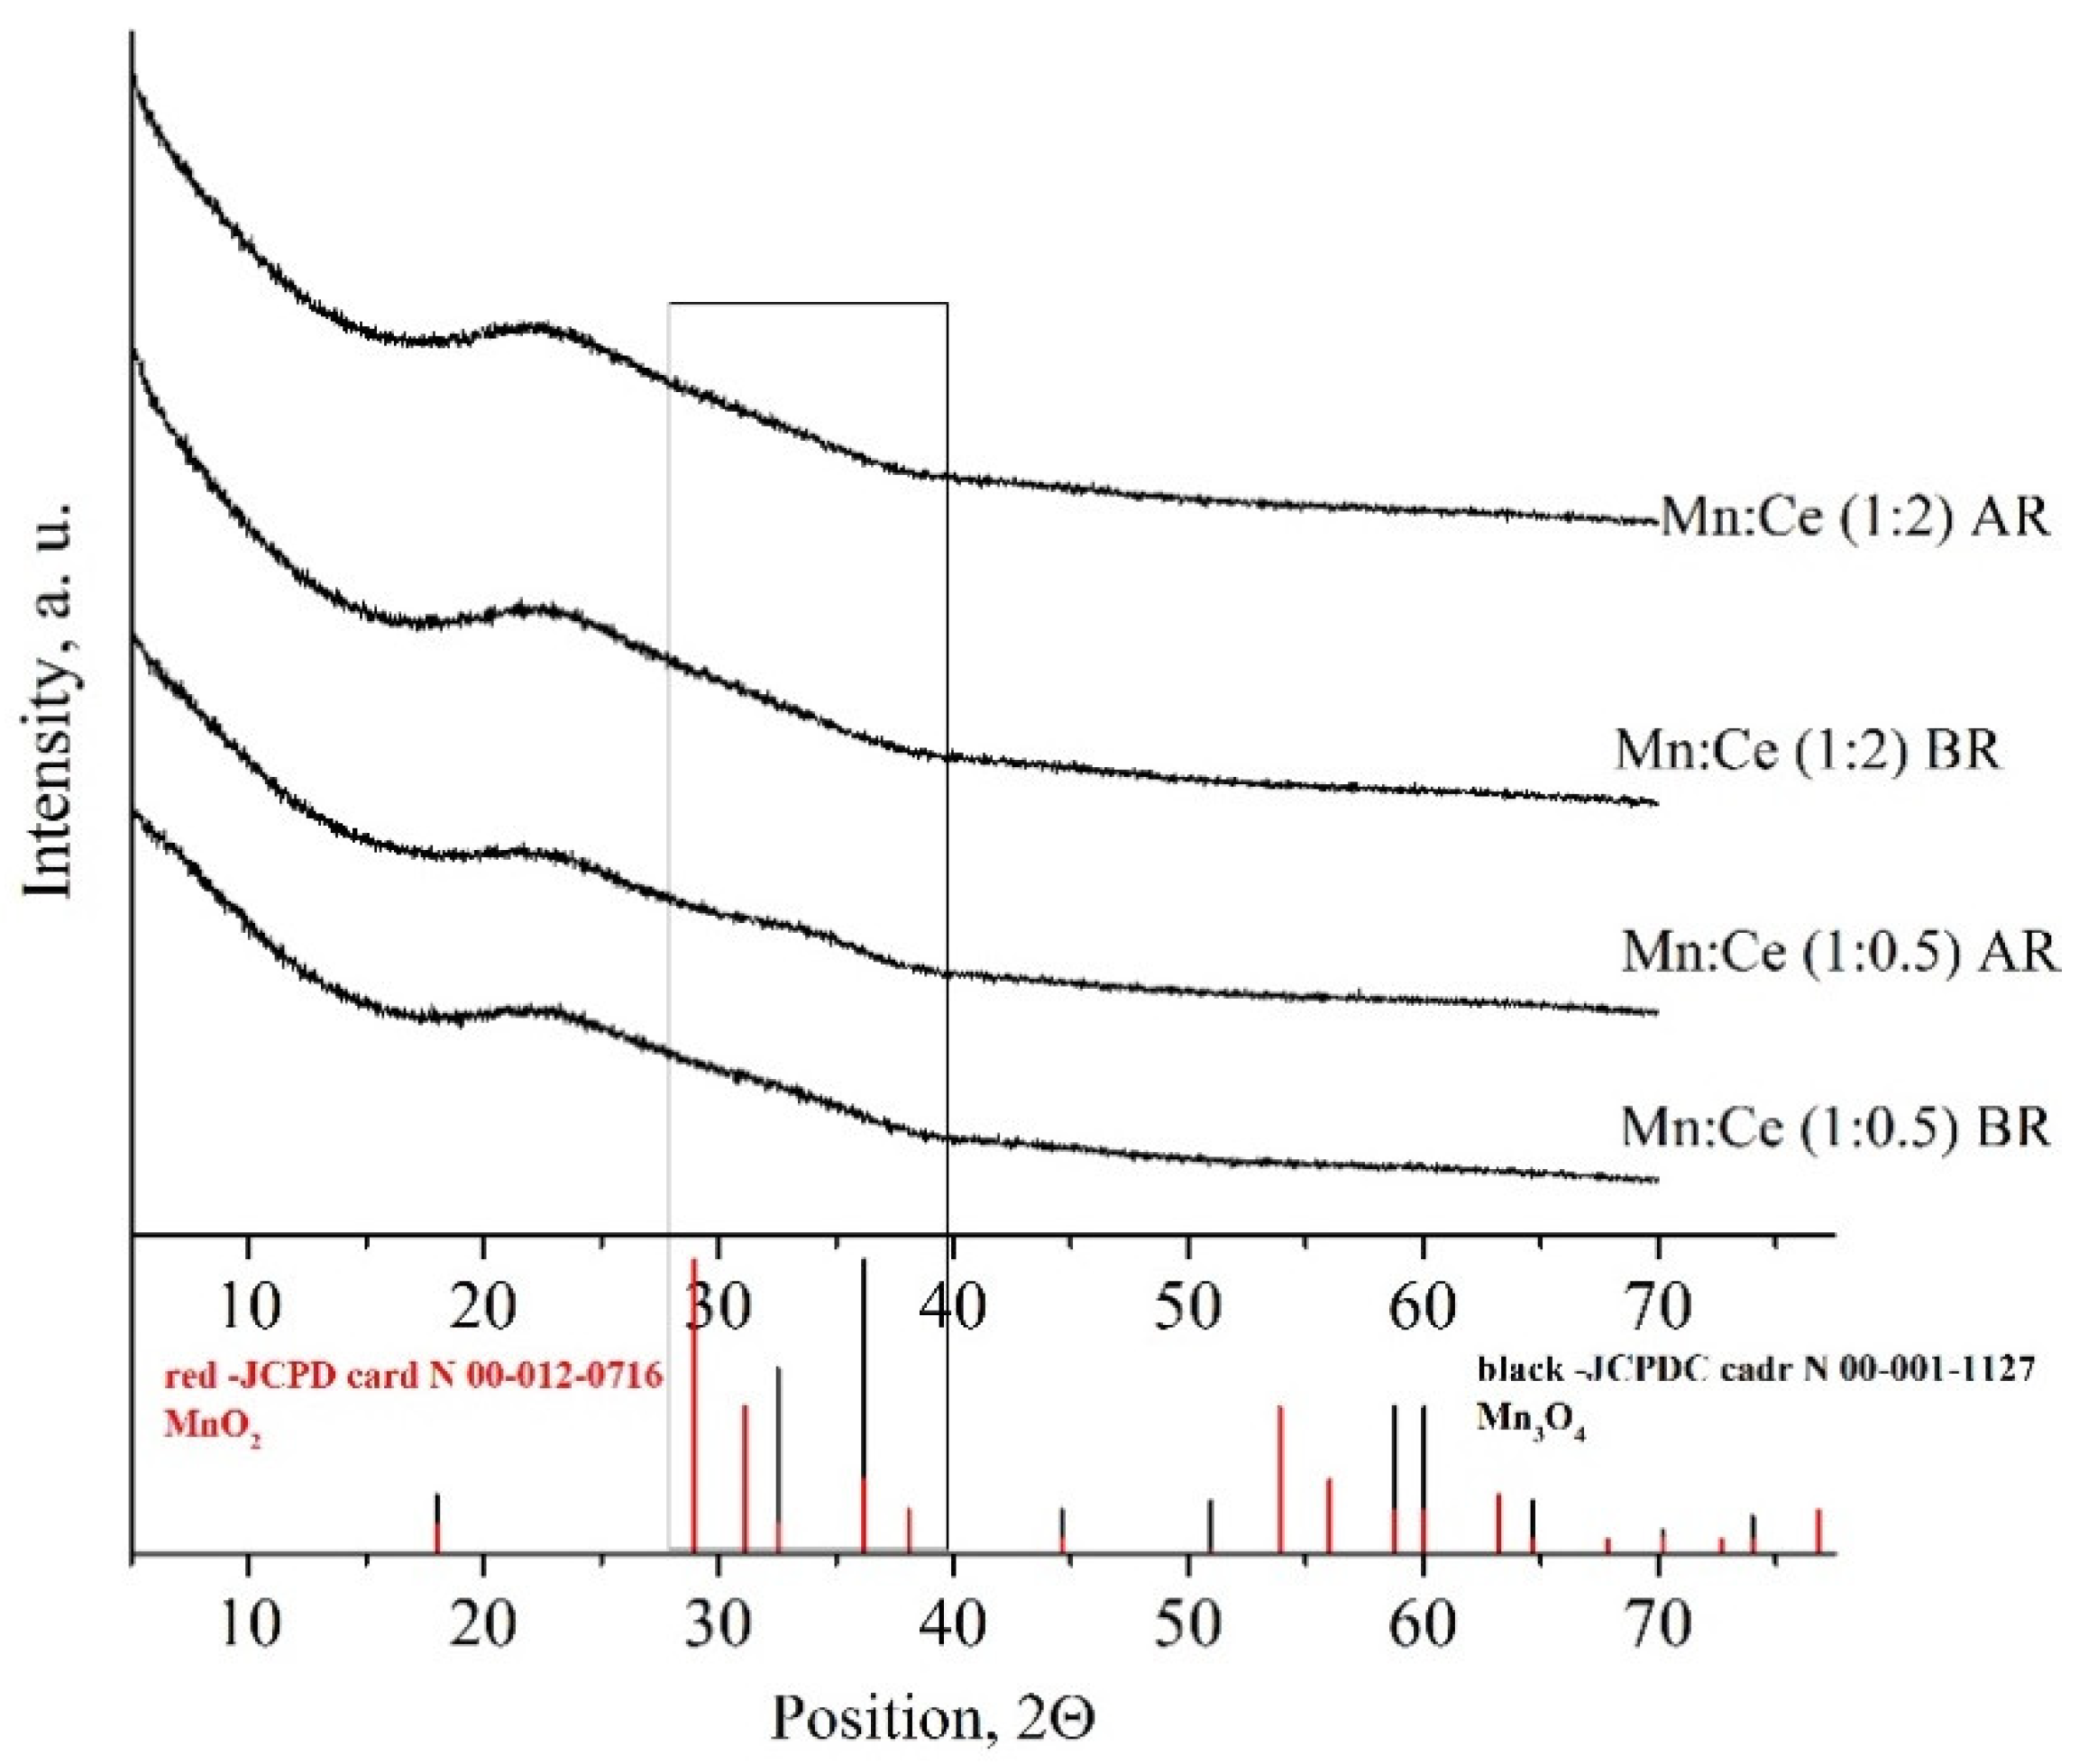
2.1. Characterization of the Mesoporous Catalysts before and after Reaction

Before the catalytic reaction, the SAXS pattern of the bare SBA-15 exhibits three peaks at 10.7, 6.2 and 5.3 nm (Figure 1), characteristic of the (100), (110) and (200) reflections of the hexagonal mesopore arrangement. Upon the addition of cerium and/or manganese precursors, the hexagonal mesostructure is preserved.
However, we can observe a slight shift towards the higher q value of the position of the (100) reflection (Figure 1). For example, d100 is located at 9.7 nm instead of 10.7 nm for the MnCe (1:0.5) sample. This implies shrinkage of the mesopore size during the calcination step at 500 °C, which is performed to decompose the Ce and/or Mn precursors. It should also be highlighted that the intensity of the reflection lines decreases in the presence of cerium and/or manganese, indicating a filling up of the SBA-15 mesopore with the Ce and/or Mn species [19]. After the VOCs combustions, no major change in the features of the catalysts’ SAXS pattern is observed (Figure 1). Thus, we can conclude that the mesostructure is not being modified during the catalytic reaction.
Whatever the catalyst sample is, a type IV isotherm, characteristic of mesoporous materials according to the IUPAC classification [20] is obtained by nitrogen adsorption–desorption analysis before and after the VOCs combustions (Figure 2). The isotherms are also type 1 due to the presence of the micropores that interconnect the mesopores. By contrast, the shape of the desorption branch of the isotherm suggests the presence of two types of mesopore (Figure 2). For the SBA-15 materials containing Mn and Mn:Ce, the hysteresis curves, observed during the desorption step, are type H1 at high p/p° that is consistent with the cylindrical mesopores of the SBA-15 support and are type H3 at lower p/p° pressure indicating partial pore blocking. The composite shape of the hysteresis could be explained by a partial filling of the mesopores by the Mn and Mn:Ce species.
The specific surface area, the mesopore volume and the diameter of the bare SBA-15 are 982 m²/g, 0.99 cm3/g and 9.0 nm, respectively (Table 1).
Before the reaction, after the introduction and the decomposition of the Ce and/or Mn precursors a decrease in the specific surface area and in the total pore volume is observed but no significant modification of the adsorption branch of the isotherm is observed (Figure 2). Meantime, the mesopore size distribution represents two components and this is in agreement with the observed hysteresis curves (Table 1). For the catalyst prepared in the absence of cerium (Mn-SBA-15), the maximum observed at 8.0 nm before the reaction can be attributed to the mesopores containing Mn, whereas the second component observed at 10.1 nm could be due to empty mesopores. After the reaction shrinkage of both types of mesopores, reflected in a decrease in both size values, which can be observed in Table 1. However, the latter is more pronounced for the clogged mesopores than for the filled-up ones. It can thus be assumed that the manganese oxide consolidates the meso-structure. In the presence of cerium, two components in the mesopore size distribution are observed and none of them corresponds to the diameter of the parent SBA-15. Upon comparing with the Mn-SBA-15 sample, the value at around 7–8 nm can be attributed to mesopores filled only by Mn species, whereas the lower diameter can be related to mesopores filled by both Mn and Ce. It should be also observed that after reaction and considering the error in the measurement, no significant variation is seen in the values of the mesopore diameters for the MnCe-SBA-15. This supports the hypothesis that for these bi-component materials, no mesopore clogging occurs and that the presence of these oxide species prevents the shrinkage of the meso-structure during the combustion of the VOCs.
The sample MnCe (1:0.5) was analyzed by TEM coupled with EDX spectroscopy before and after the reaction. The TEM confirmed the hexagonal packing of cylindrical mesopores observed by SAXS for the MnCe (1:0.5) material before and after the reaction (Figure 3). The partial filling of the mesopores is confirmed by the presence of black particles that appear to be filaments along the cylindrical mesopores.
The EDX elemental mappings indicate clearly that black particles (in white on the TEM images of Figure 4a,d taken in dark field mode) contain Mn and Ce elements (Figure 4b,c,e,f).
The analysis of studied fresh catalyst samples performed by high-resolution TEM identified (201) reflexes corresponding to d = 4.23 Å crystal planes of MnO2 (COD #96-900-1168) in the MnCe sample (1:0.5) and (311) reflexes correspond to d = 2.06 Å crystal planes of MnO2 (COD #96-900-1168) in the MnCe sample (1:2) (Figure 5).

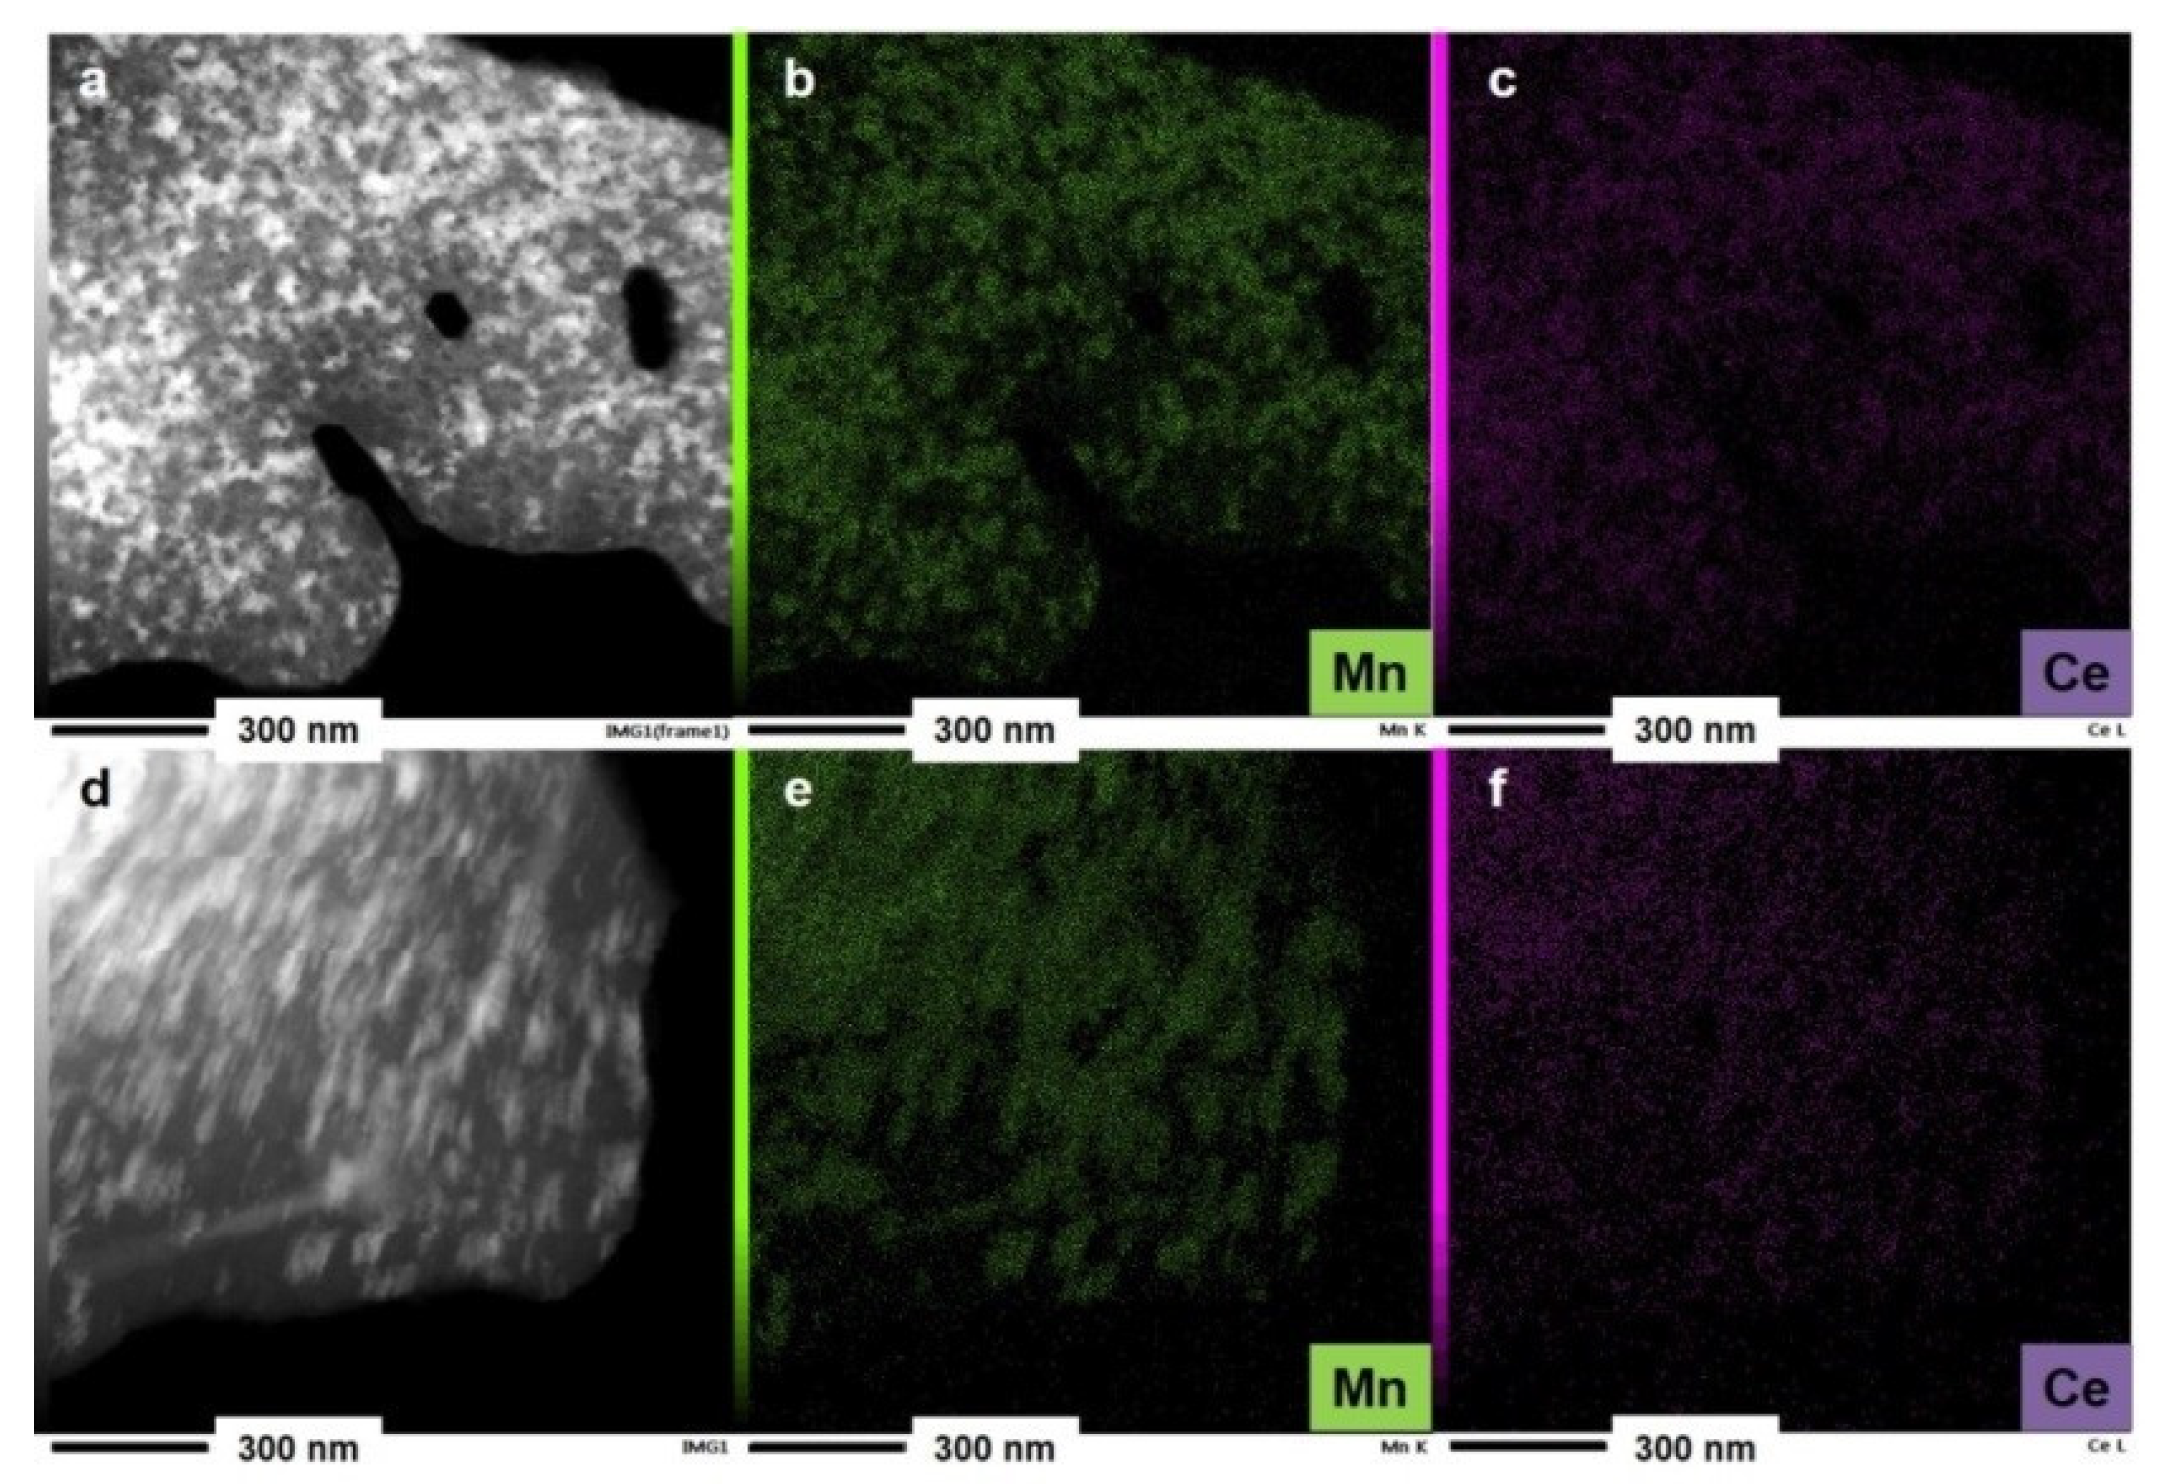
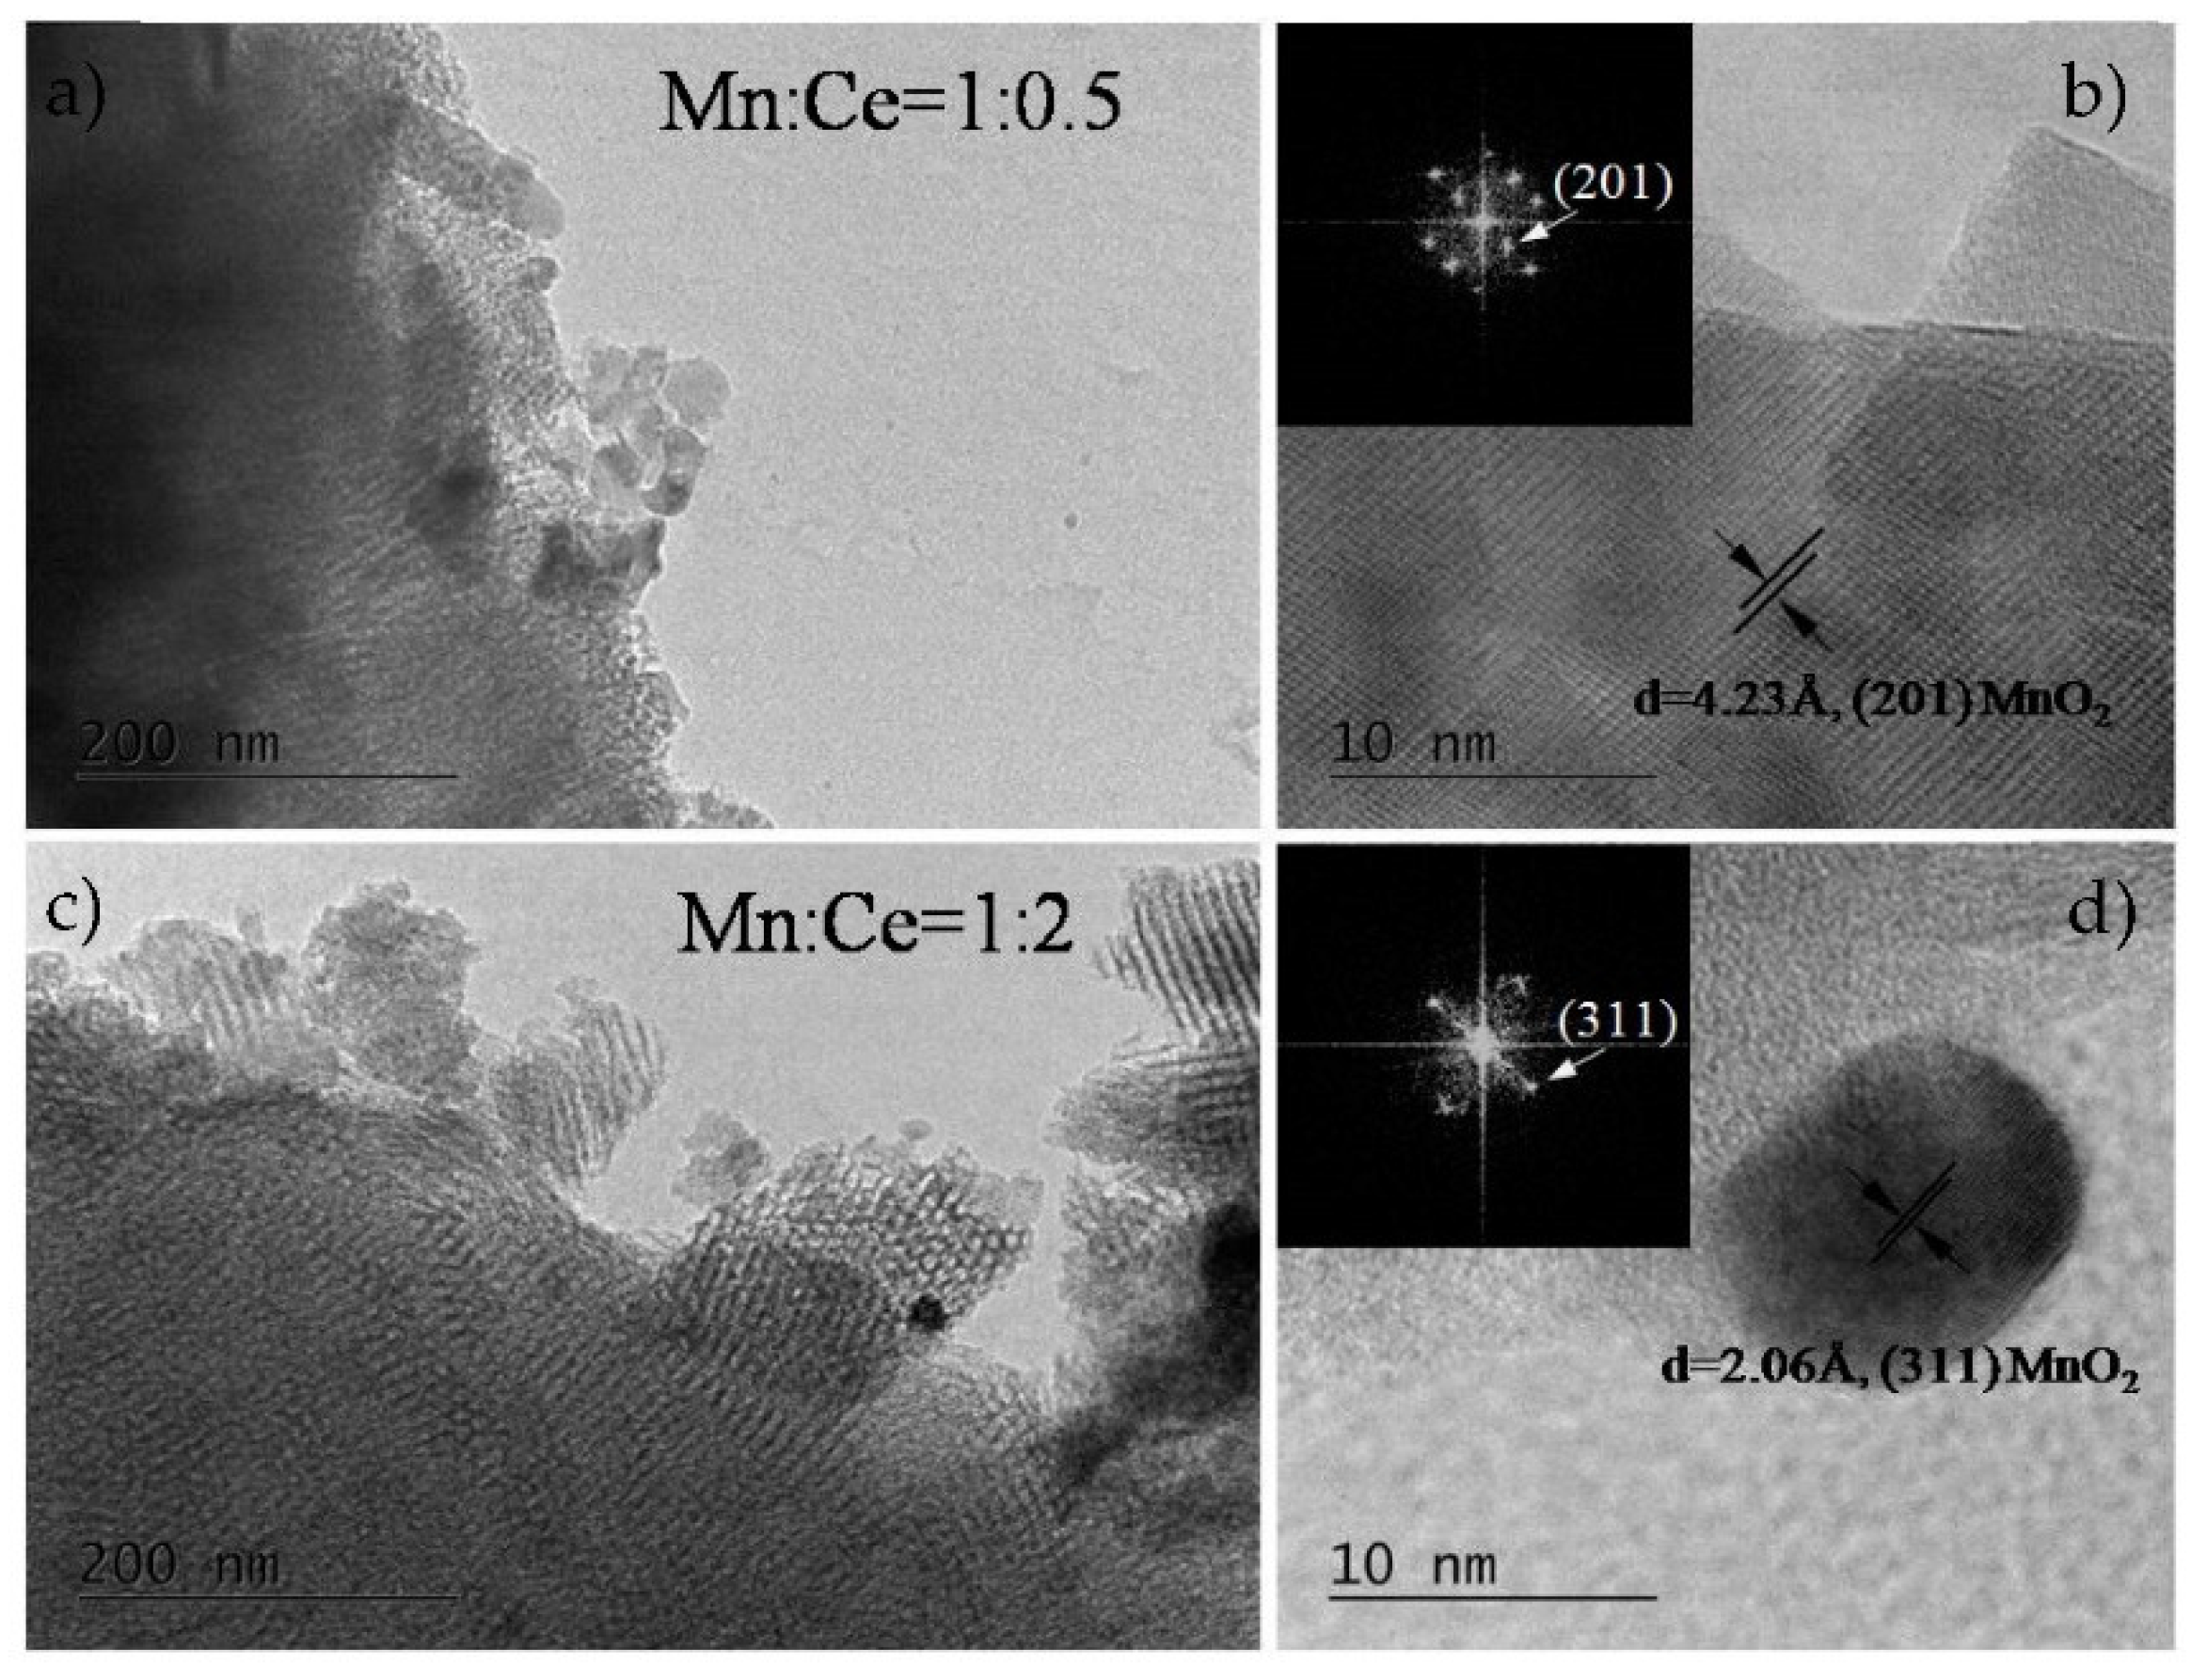
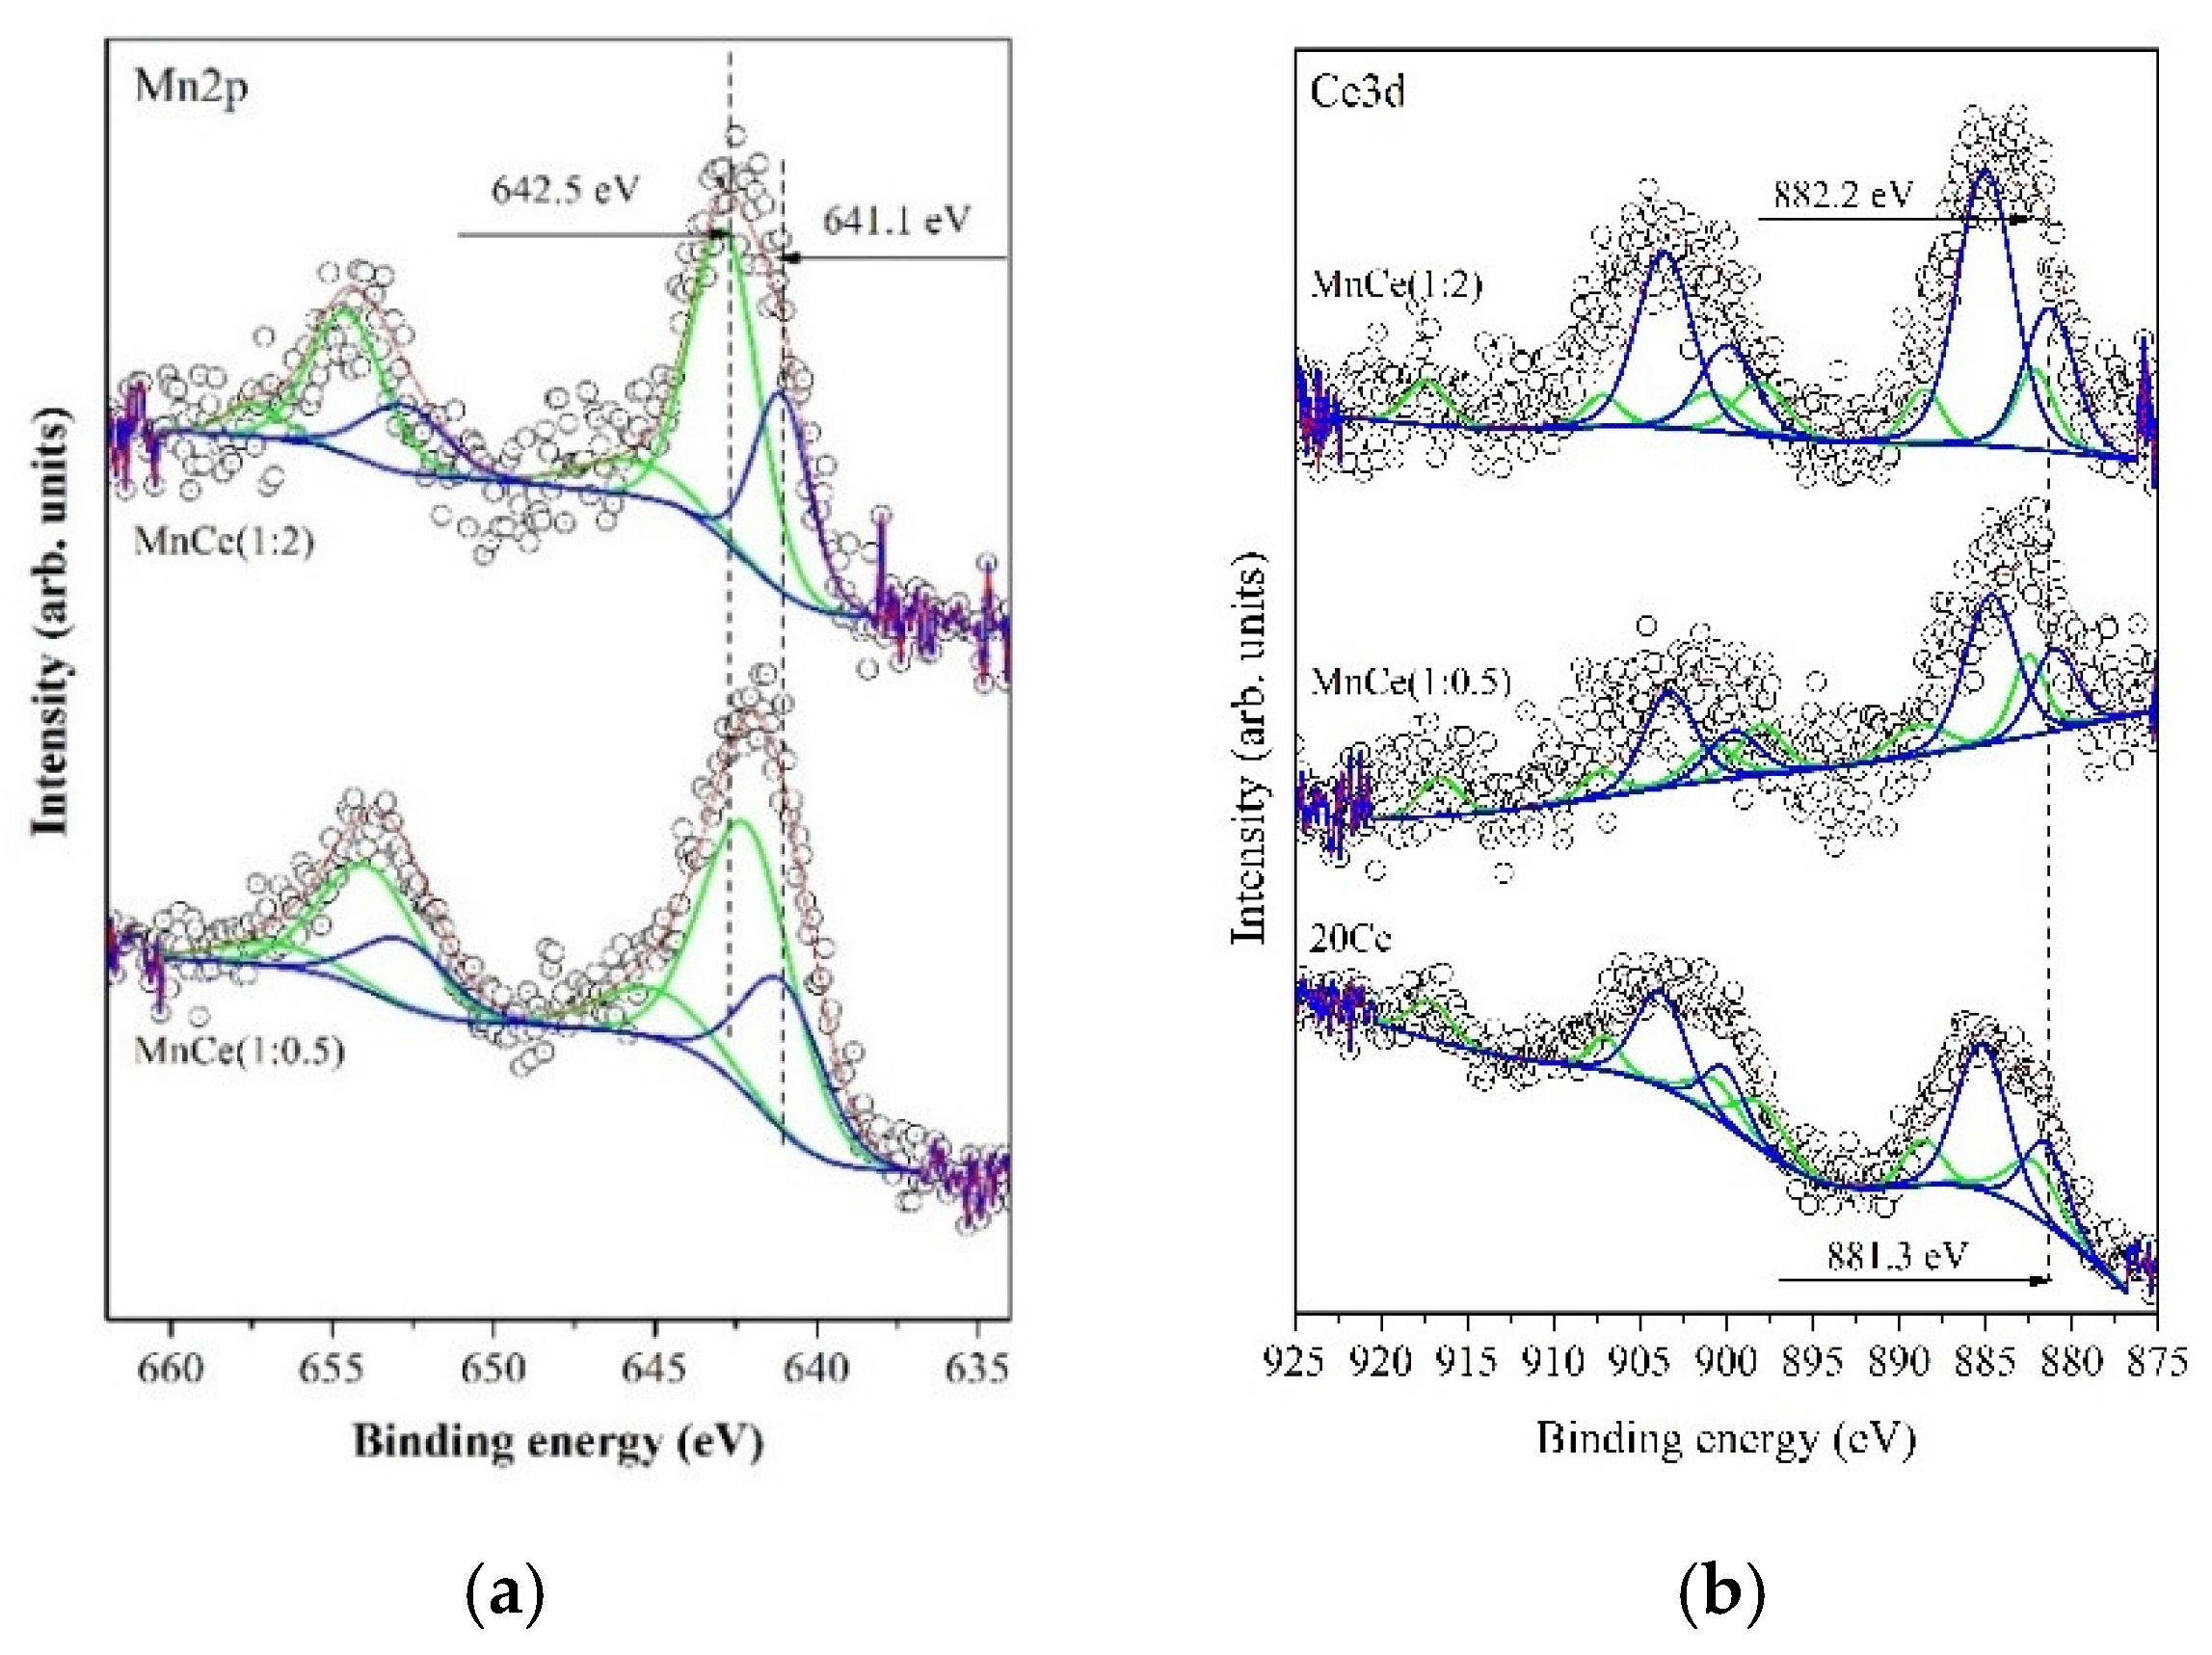
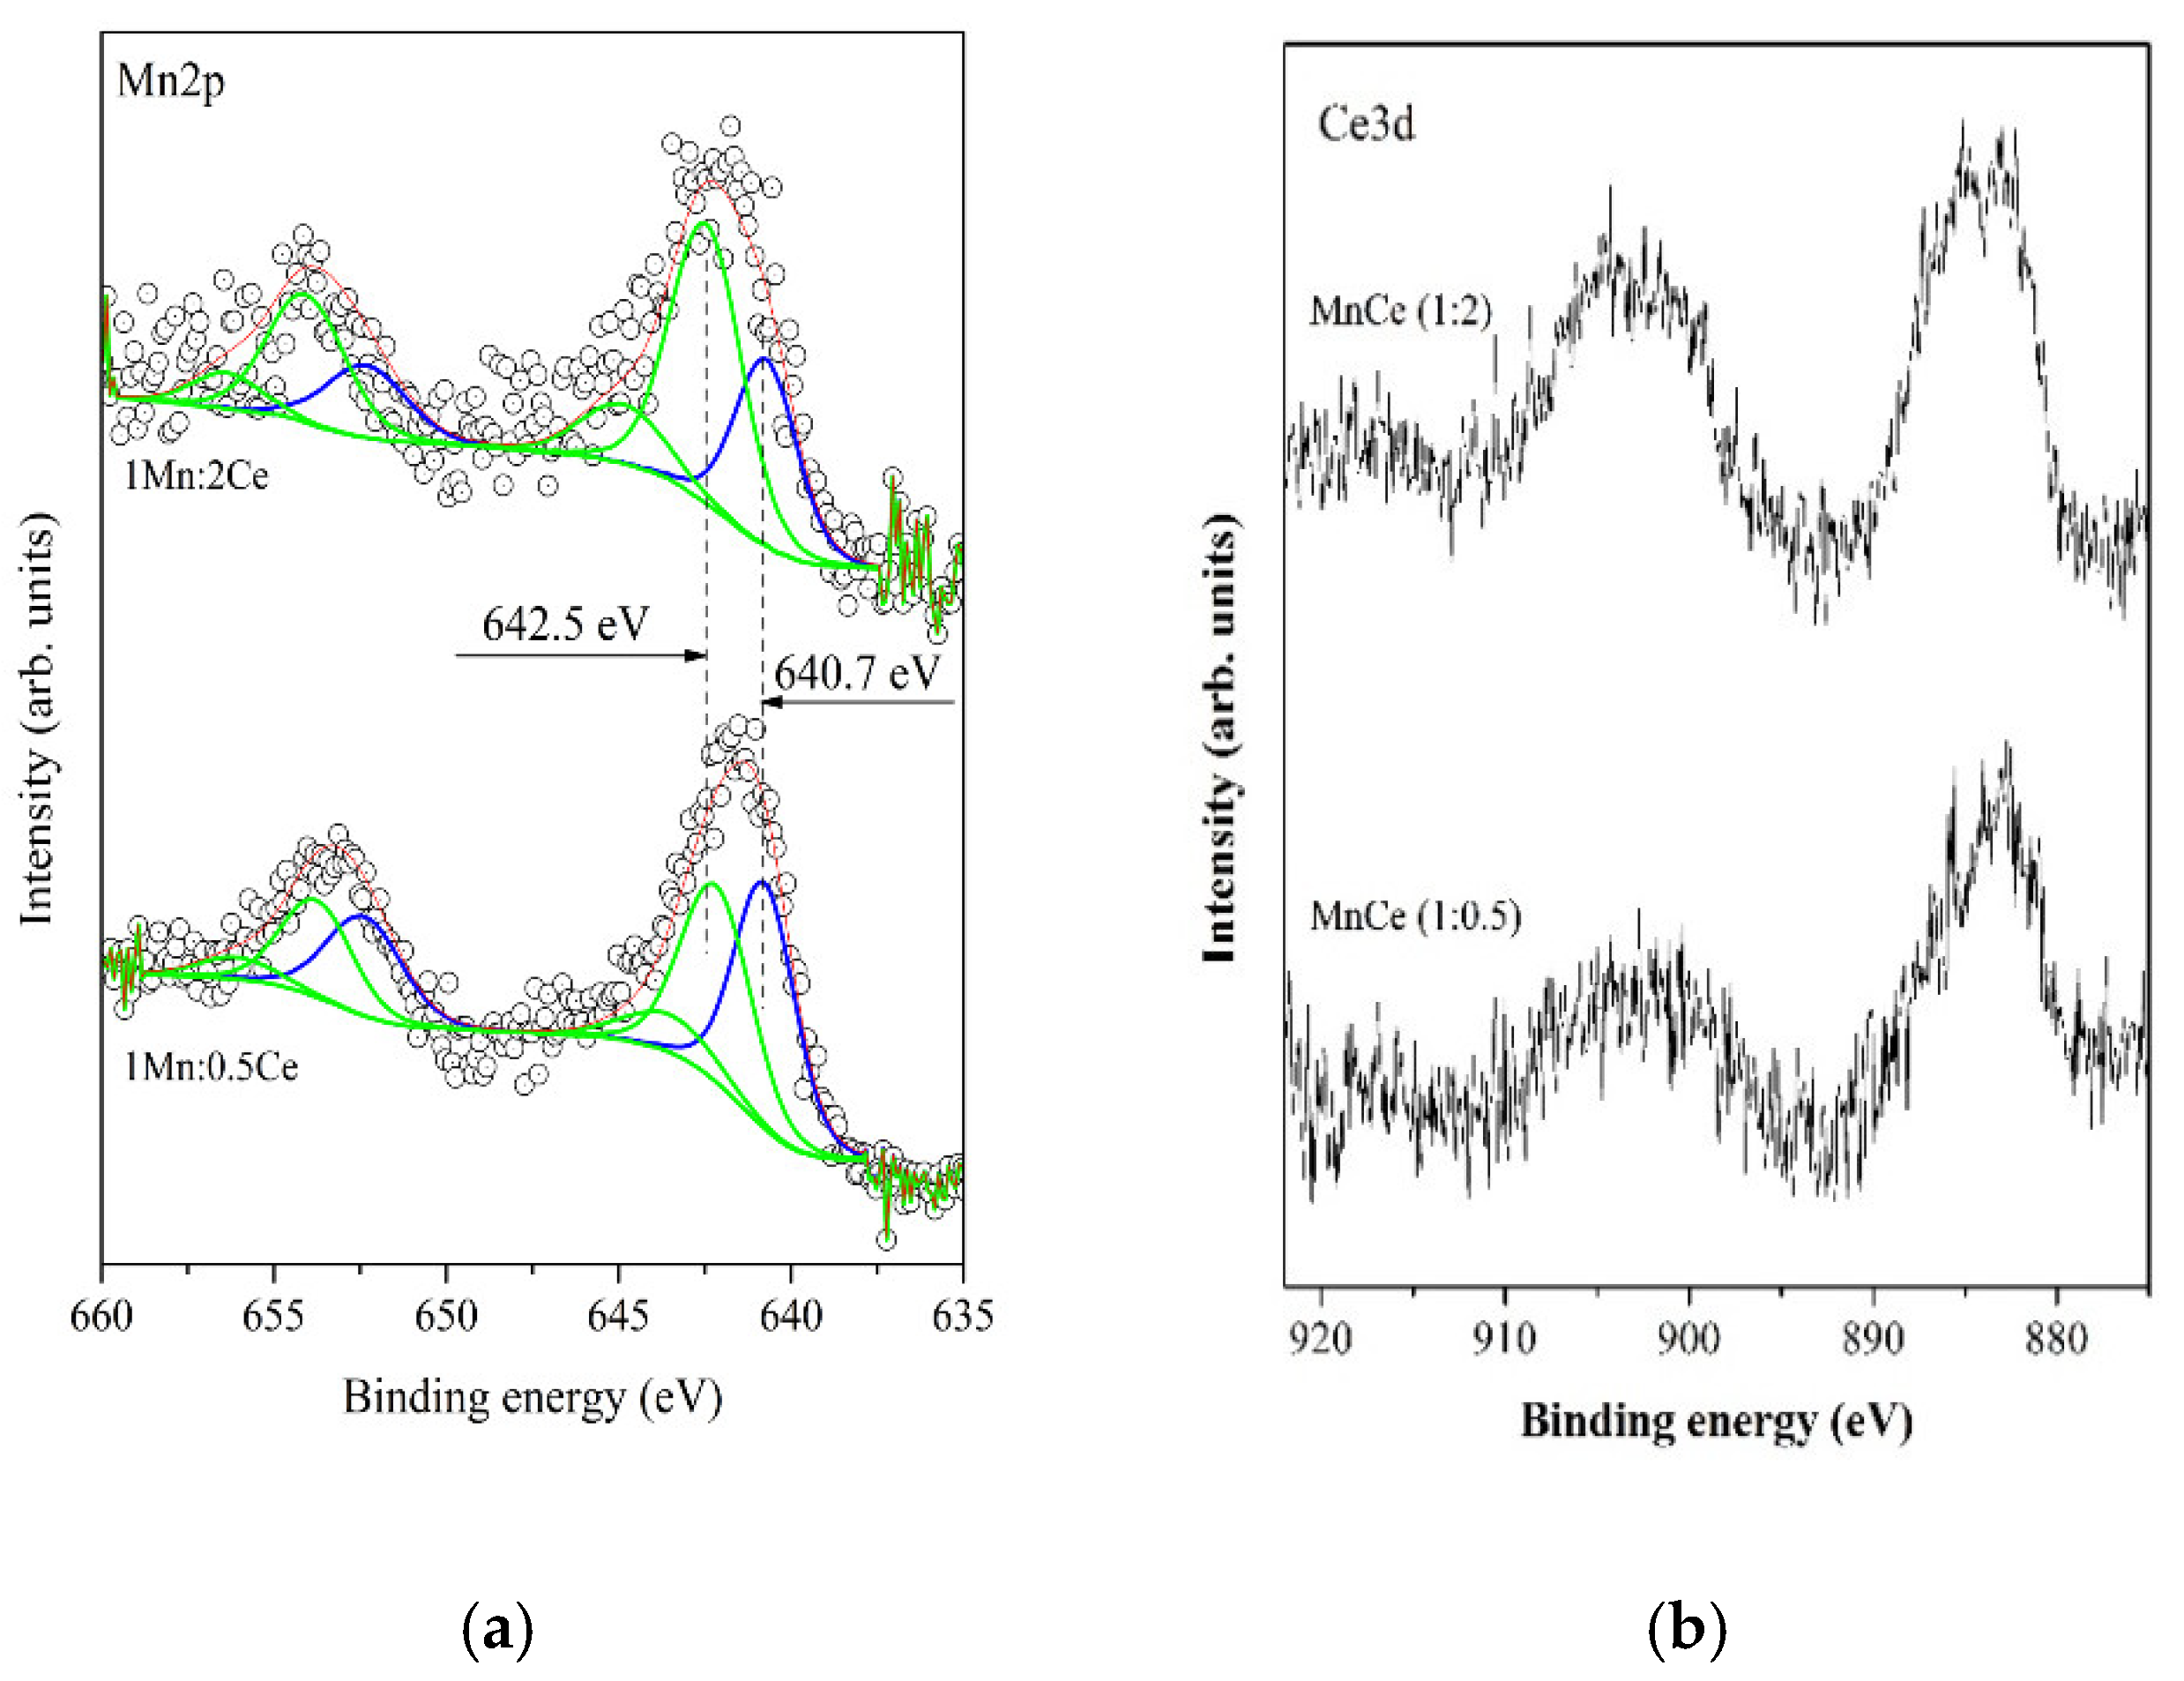
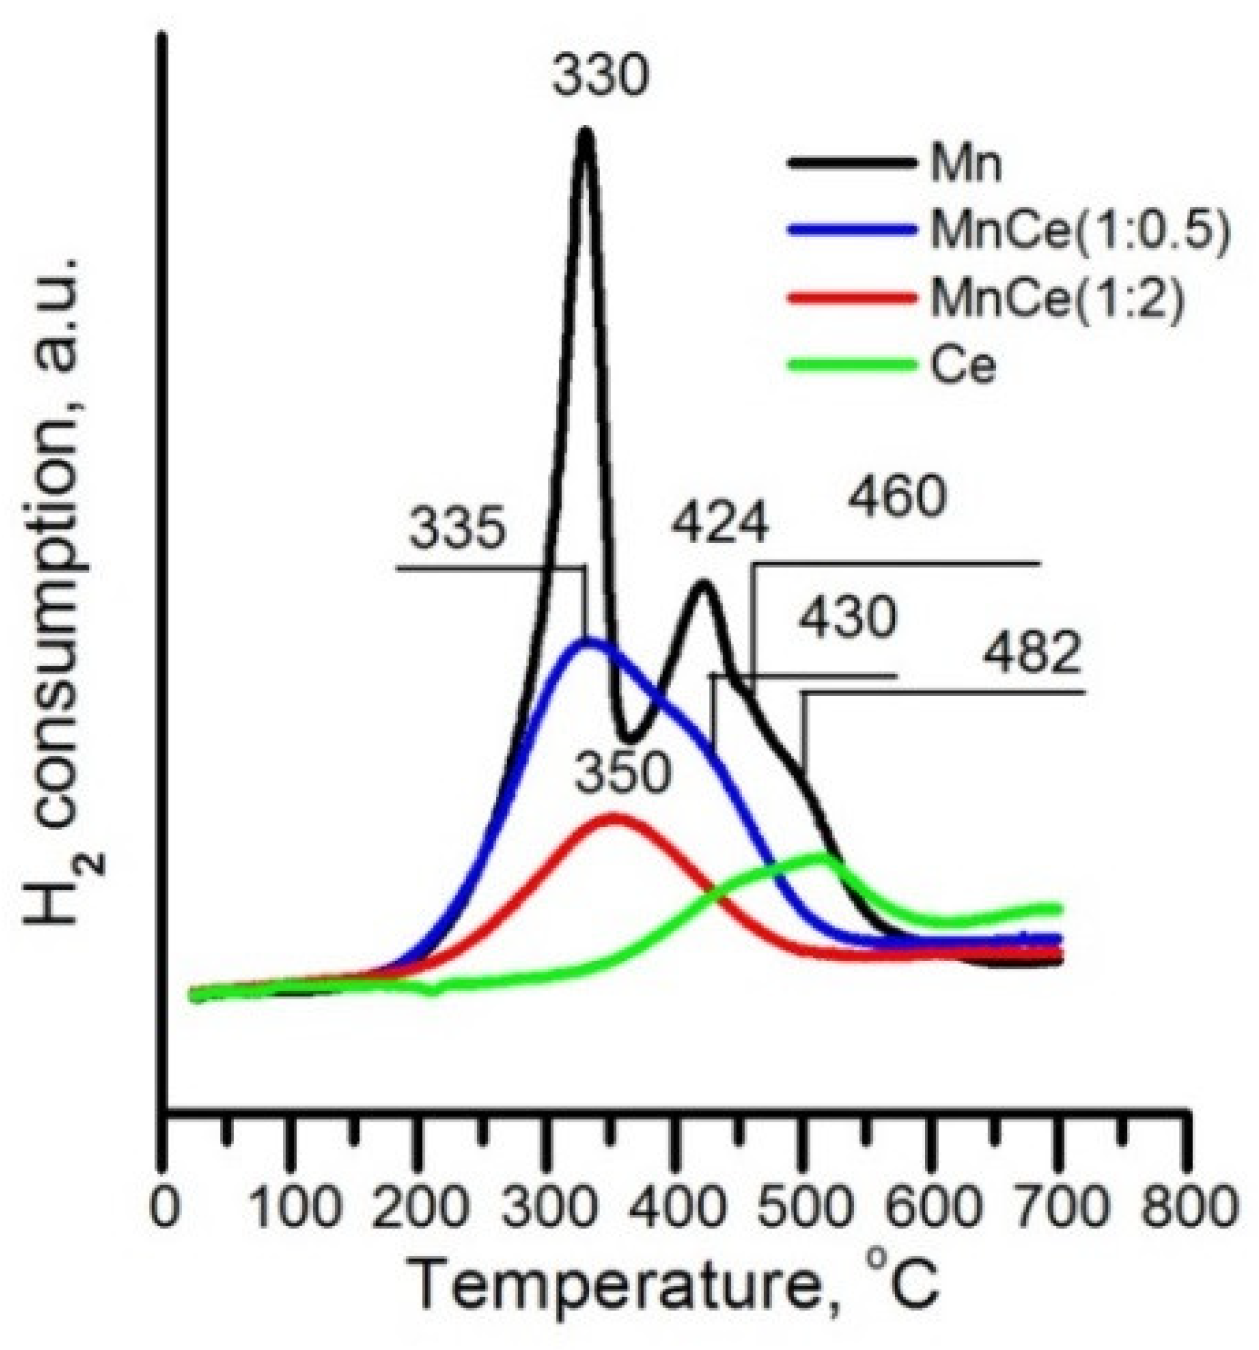
2.2. Characterization of the Supported Metal Oxide Species before and after Reaction

The XRD patterns, recorded using the MnCe (1:0.5) and MnCe (1:2) samples before and after the reaction, are similar and they do not show any crystalline phases of either magnesium oxides or cerium oxide, which indicates fine dispersion of the oxides present on the surface. However, some two-component broad signals from 15 to 37° 2θ are observed in the case of the first component, commonly attributed to amorphous silica. It is noteworthy that the baseline from 37 to 70° 2θ is not flat and one low intensity and broad wave is also distinguishable at 41°–49° 2θ, which has a broad signal at 27°–37° 2θ corresponding to the regions of the major diffraction peaks of the Mn3O4 crystalline phase (Figure 6). They probably indicate the starting crystallization of Mn3O4. In view of the fact that HRTEM indicates the formation of MnO2, it is very likely that both Mn3O4 and MnO2 are present on the surface. Based on a previous study of the Mn:Co-SBA-15 catalyst sample, which reported the crystallization of a solid solution CoxMn3-xO4 by insertion of Co into the Mn3O4 phase [21], it could be assumed that the Mn-Ce solid started to form. The lack of the XRD patterns for manganese oxides and CeO2 could be taken as evidence for the formation of finely divided MnOx and CeO2. The formation of a solid solution between MnOx and CeO2 of where the replacement of Ce4+ (0.97Å) by Mnx+ (Mn4+ = 0.53Å; Mn3+ = 0.65Å; Mn2+ = 0.83Å) structure similarity of both CeO2 and MnOx [13]. Qi and Yang [22] established that the mean crystallite size of ceria decreases with increasing Mn content, indicating that Mn atoms incorporated into CeO2 inhibit the crystal growth of ceria. The XRD data of the monocomponent Mn-SBA-15 sample were presented in our previous paper [18] where it was shown that both MnO2 Pyrolusite (card N° 01-071-4824) and Mn2O3 Bixbyite (Card N° 00-041-1442) phases coexist on the surface.
The oxidation states of Mn and Ce on the surface are examined by XPS. Figure 7 shows an example curve fitting of Mn2p (left-hand side) and Ce3d (right-hand side) core levels of investigated samples before the catalytic activity test.
The Mn2p peaks are recorded within the energy range 636–658 eV comprising both Mn2p3/2 and Mn2p1/2 core levels. Both Mn3+ and Mn4+ oxidation states with BE of 640.4 eV and 642.0 eV, respectively, are visible for all measured samples (left-hand side of Figure 7). The small satellite structure with BE of ca. 644.0 eV also proves the presence of Mn4+ ions on the surface, according to the curve fitting procedure [23].
If we examine the results represented in Table 2, the following features could be observed: Mn4+ predominates on the surface in all samples except the single component one where the Mn3+ ions are the main surface species; the manganese concentration on the surface is decreased after Ce modification for both studied samples; Mn3+/Mn4+ ratio decreases after the Ce addition; after the reaction, the surface concentration of manganese decreases in the case of the mono-component catalyst, and it is also maintained for the bi-component Mn-Ce catalysts.
In the case of the sample with the higher cerium content, the Mn3+/Mn4+ ratio is preserved after the reaction. According to the literature data, the catalytic activity for manganese oxide catalysts is increased when the pair Mn4+–Mn3+ exists in the structure of the oxide [24]. Therefore, it could be expected that the MnCe (1:2) catalyst sample would show stable activity during the time on stream.
In the case of ceria, the presence of the peak with a binding energy of about 916–917 eV corresponds to Ce4+ in CeO2 [25]. Binding energies and FWHM of the corresponding curve-fitting peaks for Ce-containing samples and for standard spectra of Ce3+ and Ce4+ are presented in Tables S1 and S2 from the Supplementary Materials. Based on its intensity we can suppose the existence of a mixture of Ce3+ and Ce4+-ions on the surface of the samples. As is shown in Figure 7 and Figure 8 (right-hand side), ten sub-peaks were used for the curve fitting procedure of the Ce3d spectra for samples denoted as MnCe (1:0.5), MnCe (1:2) and Ce mono-component sample. Four of the peaks in the intervals 881–881.5 eV, 884.7–885.2 eV, 899.6–900.1 eV and 903.3–903.8 eV are corresponding to Ce3+, whereas the other six peaks in the intervals 882.14–882.48 eV, 888.54–888.88 eV, 900.62–900.88 eV (double peak), 907.07–907 = 87 eV and satellite about 917 eV are representing a Ce4+ oxidation state [26]. The obtained ratio between fitted peak areas of Ce3+ and Ce4+ for cerium-containing samples is presented in Table 2.
The peak at about 916–917 eV, which is specific for Ce4+, is barely visible in the XPS spectrum of the Mn:Ce (1:2) sample. Nevertheless, we provided the curve-fitting procedure based on the standard Ce3+ and Ce4+ spectra. The obtained ratio is about Ce3+/Ce4+ = 45/55. The Ce3d spectra after the reaction are not deconvoluted because of the lack of the peak at 916–917 eV.
The powdered EPR spectra of all samples, measured at low temperatures, are shown in Figure 9.
There is not any difference between the spectra recorded at different temperatures. The EPR spectra of all samples are well resolved and showed six intensive hyperfine lines centered at g = 2.0132 due to the interaction of electron spin of manganese ions with its own nuclear spin I = 5/2. The average value of the hyperfine coupling constant (A) of approximately 9.9 mT was determined. According to the literature data [27,28], the observed parameter values are attributed to typical isolated Mn2+ ions. The presence of Mn2+ ions is probably a result of the existence of Mn3O4 (XRD data shown above, indicating the starting crystallization of Mn3O4). It is well known that Mn in Mn3O4 is present in two oxidation states +2 and +3. The Mn2+ ions can be concentrated somewhere in the solid material at defect sites with a non-cubic symmetry at Ce4+ sites and on the surface of the samples [28]. It is known that Mn4+ could also show similar types of EPR spectra, but the parameters g factor and hyperfine coupling constant A have lower values. In addition to +2 and +4 oxidation states, Mn can also be present in the +3 oxidation state. Unfortunately, Mn3+ ions can be detected with EPR only at very low temperatures and at a high frequency (e.g., W-band) because of their large zero-field splitting. There are no differences between the shape of the EPR spectra of the samples with various ratios of MnCe and fresh and spent catalysts with the intensity exclusion. The values of the intensity are summarized in Table 3.
As a whole, it is observed that there is a higher intensity of Mn2+ in the MnCe (1:2) samples than that of the MnCe (1:0.5). It is very likely that the higher Ce concentration promotes the presence of Mn in a low oxidation state. The difference is very small in the fresh samples and better noticeable in the spent catalysts, where the EPR signals intensity is changed by a factor of 1.7.
Upon comparing fresh and spent samples with the same MnCe ratio, it is observed that there is a significant difference in the behavior of both catalyst samples. The EPR intensity of the spectra of MnCe (1:2) after the catalytic reaction increases slightly, whereas the intensity of 1:0.5 samples after the reaction is decreased by a factor of 1.6. The observed changes in EPR signals are probably owing to changes in the concentration of the Mn2+ ions during the reaction, and therefore, due to the existence of the Mn3+/Mn2+ redox couple in the ceria matrix. The absence of signal due to the Ce3+ ions shows that cerium is most probably in a 4+ oxidation state. X-ray photoelectron spectroscopy showed the presence of Ce3+ on the surface, but EPR did not confirm this, which could be due to the very rapid reduction of Ce4+ under the X-rays, as a result of the fine dispersion of cerium oxide.
The H2/TPR study was performed to study the reduction behavior of the prepared catalysts (Figure 10).
The heating temperature was limited to 700 °C, close to the temperature range used for the catalytic activity tests. The TPR profile of the manganese sample exhibits peaks at 330 °C and 424 °C and shoulders at 460 °C and 483 °C. Taking into account that according to XRD data MnO2 and Mn2O3 are formed on the surface, we can attribute the hydrogen consumption at 330 °C and 424 °C to the reduction of MnO2 and the other two to the reduction of Mn2O3 [29,30]. Table 4 represents the peak areas for Mn-SBA-15 and MnCe (1:0.5) catalysts.
According to the above-mentioned authors, if hydrogen consumption at the first two peaks is for the reduction of pure β-MnO2, the area ratio of the lower temperature peak to the higher one should be about 2, indicating the reduction process of MnO2 to Mn3O4, then to MnO. In our case, this ratio is 2.6 indicating the reduction of the additional oxide phase. This phase could be finely divided into Mn2O3. The presence of a more crystalline Mn2O3 phase is probably responsible for the higher reduction peaks. The reduction of Mn2O3 in hydrogen is influenced by the preparation procedure and the more crystalline Mn2O3 is reduced at higher temperatures [31].
The wide peak centered at 520 °C in the TPR profile of the monocomponent cerium sample is ascribed to the reduction of surface oxygen situated in a tetrahedral coordination site bound to one Ce4+ ion [16].
After the addition of Ce, the TPR profiles are changed and this is more pronounced for the MnCe (1:2) catalyst. It is not simple to assign these peaks to different MnOx species or to specific reduction steps for the Mn-Ce catalyst because the reduction of ceria takes place concurrently. According to Delimaris and Ioanides [32], Mn promotes the reduction of ceria, and a reduction of Ce4+ to Ce3+ occurs along with the reduction of the manganese ions. Wan et al. [33] stated that in the case of mixed Mn-Ce oxide catalysts the reduction temperature of MnO2 (Mn2O3) and Mn3O4 decreases or increases, and this is dependent on the Ce/Mn ratio. When a Ce/Mn ratio is greater than one the reduction maxima are shifted to lower reduction temperatures and at a ratio less than one to higher reduction temperatures. In our cases, for the sample with a Ce/Mn ratio less than one (MnCe (1:0.5)), we observe an overlap of the peaks and a very slight shift to higher reduction temperatures, while for the MnCe (1:2) sample there is only one very wide peak with a maximum at 350 °C. As shown above, the oxides are located mainly in the channels of the mesoporous silicate. It is very likely that the ratio Ce/Mn is not uniform throughout the sample. In some parts, it is greater than one and in others it is less, which is the reason for very wide reduction peaks, indicating the presence of oxide particles in different environments and of different sizes. The total amount of H2 consumption decreases in the order Mn-SBA-15 > MnCe (1:0.5) > MnCe (1:2) indicating decreasing the reducible oxygen species amounts.

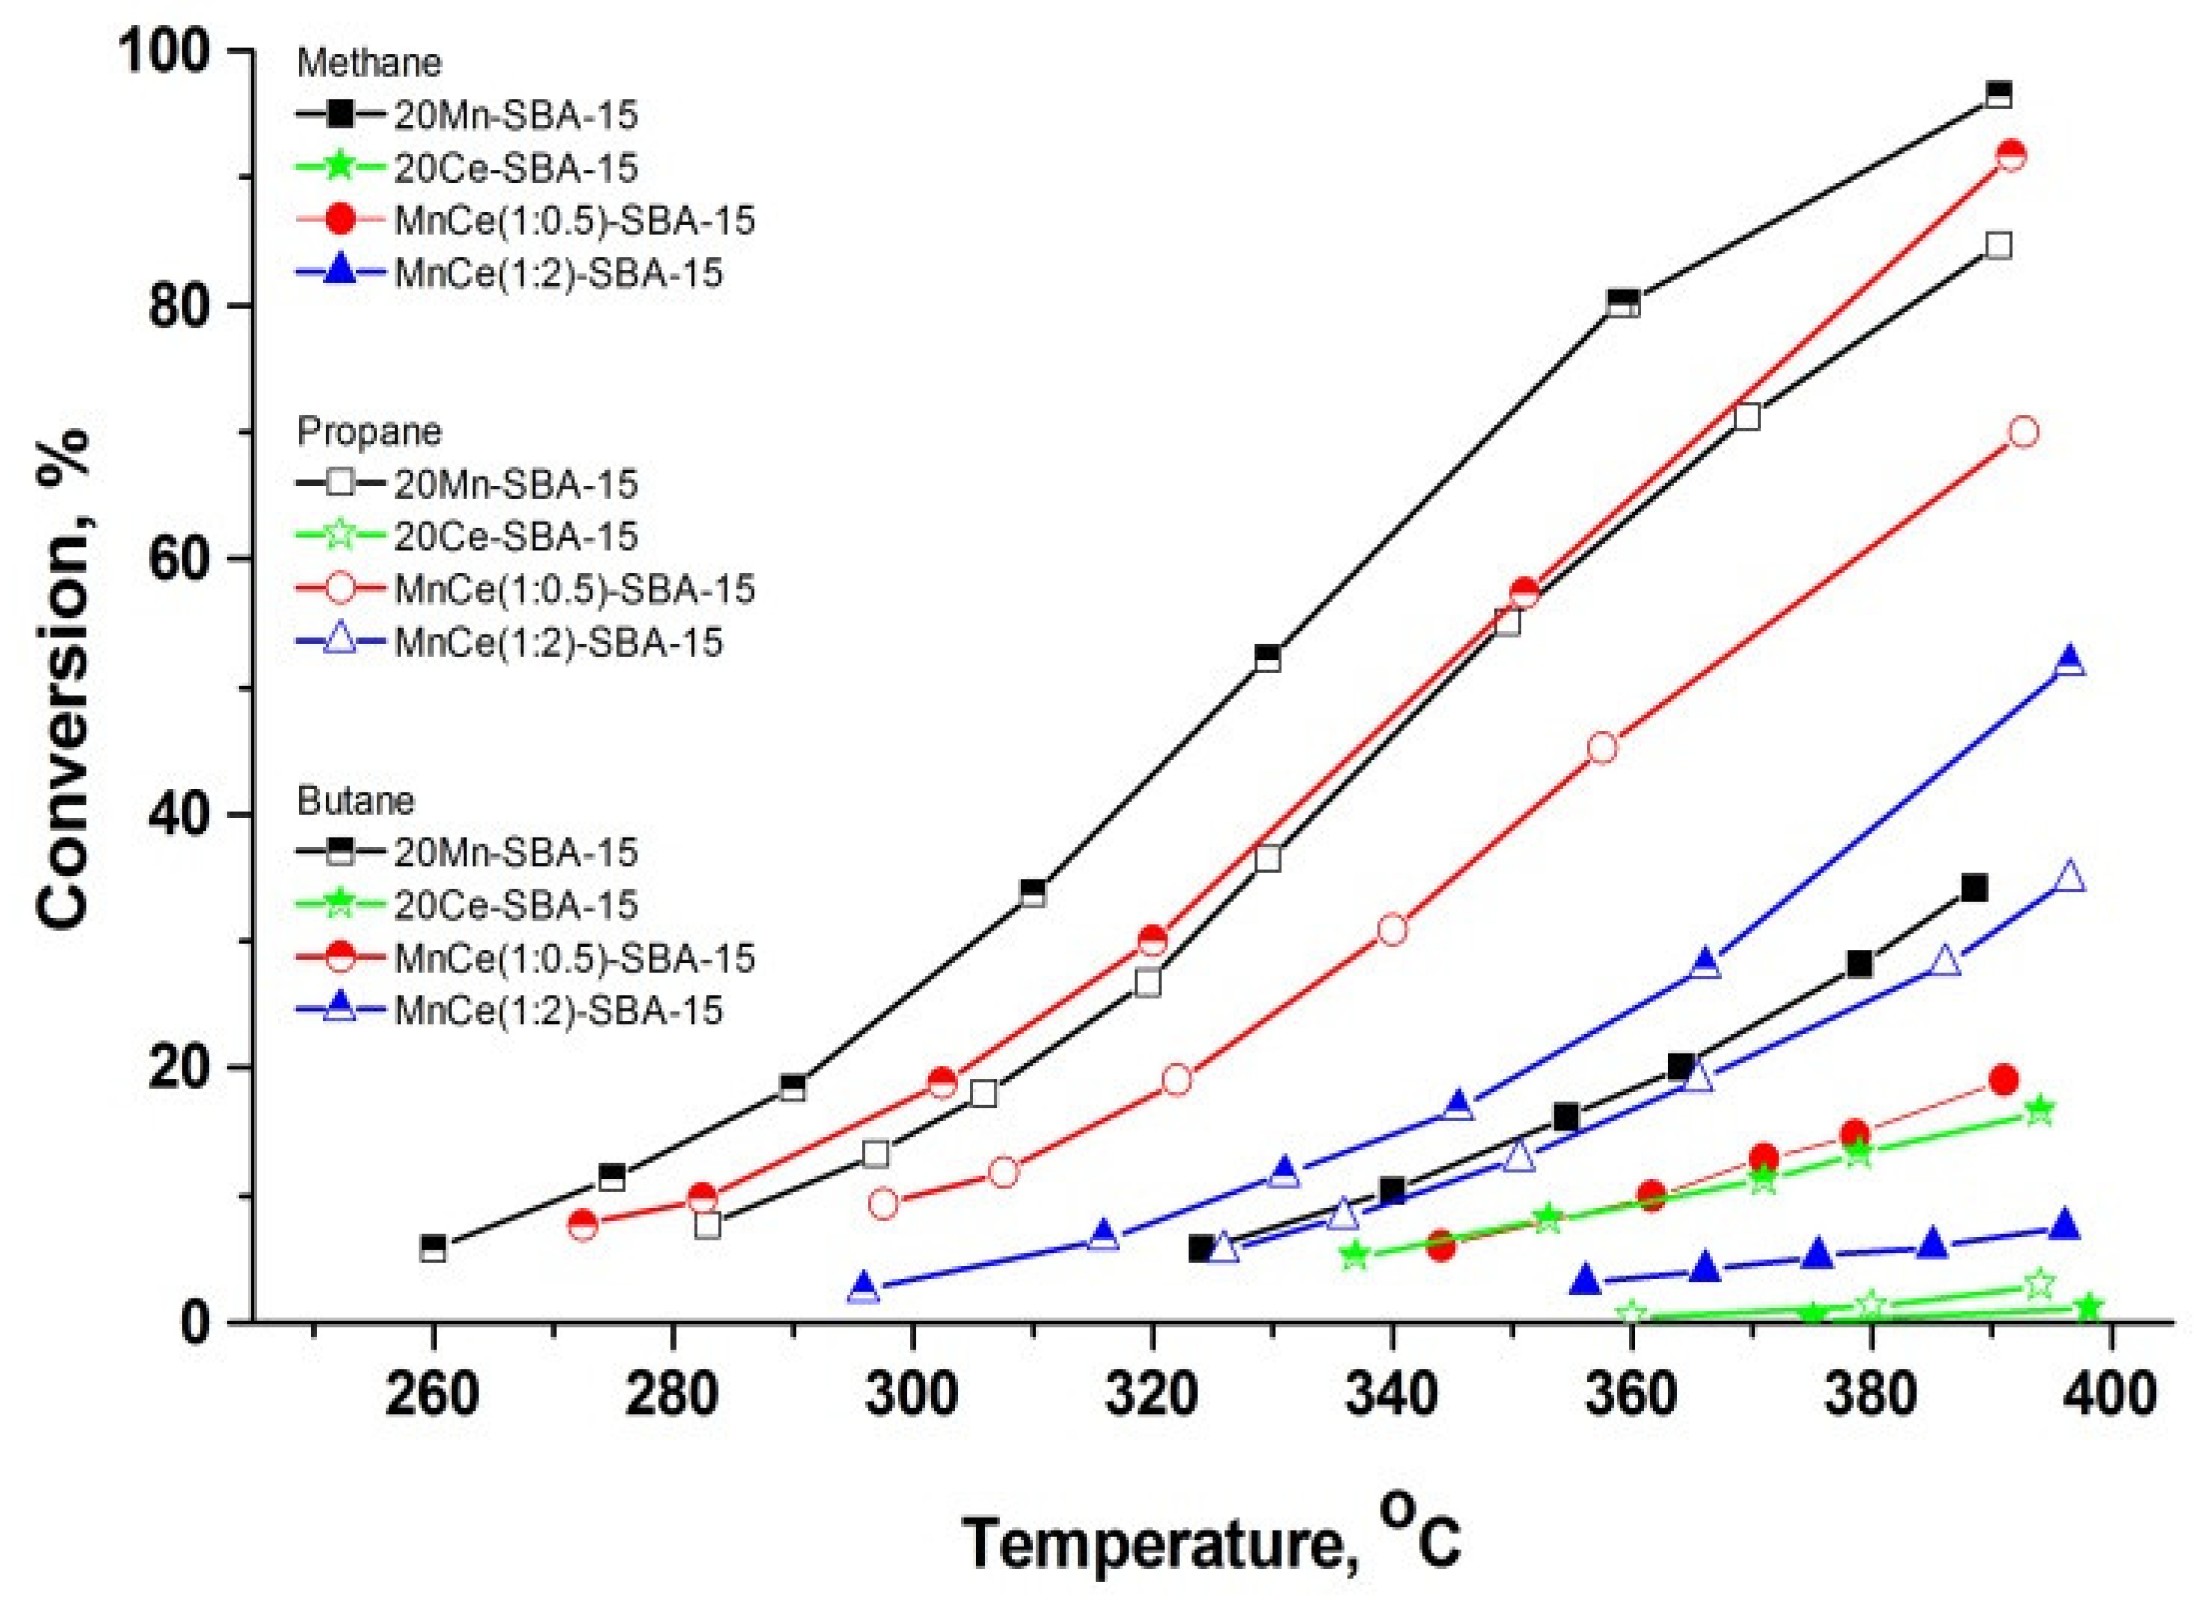
2.3. Catalytic Activity Tests

The obtained results from the catalytic activity tests for complete oxidation of methane, propane and butane under testing conditions and reached stationary activities are shown in Figure 11. For comparison, the data for the mono-component Ce-SBA-15 sample are given.
Obviously, the lowest values for T50 were observed in the case of butane (T50 = 326 °C) on the mono-component Mn-SBA-15 sample. It should be specified that in the case of methane and temperatures below 450 °C, the conversion degree of 50% was measurable for the Mn-20 sample only: T50 = 407 °C (Table 5).
The comparative analysis of the ratios between the calculated rate constants [34] is showing that the addition of Ce leads to a decrease in the activity, which is 1.5–2 times at the Mn/Ce ratio of 1:0.5, and six times lower when this ratio is 1:2. Further, the addition of cerium shows the strongest effect during the methane combustion (2.1 times) and the weakest one—in the case of n-butane (1.5 times).
The analysis of the behavior of the studied catalyst samples was enriched by an investigation of the kinetics and mechanism of the reaction of propane complete oxidation. For collecting the required data for the calculation of the kinetics parameters, the inlet concentrations of the reactants were varied. The kinetic parameters were calculated by applying the method, reported by Duprat [35], with details about the calculation procedure being published previously [23,36,37]. The determination of the kinetics parameters is performed by direct integration of the reaction rate using data from the light-off curves. The fitting of the kinetics parameters to experimentally measured rates was carried out by applying an integrated computer program for simultaneously solving the material balance in an isothermal plug flow type of reactor and numerical nonlinear optimization procedure. The residual squared sum (RSS) between the experimental data and the model predictions is minimized (it is the optimization criterion) and the square of the correlation coefficient (R2) was calculated and it was used as a measure of the model consistency.
The calculated kinetics parameters (pre-exponential factor, activation energy, heat of adsorption and reaction order) are represented in Table 6, Table 7 and Table 8. As it can be seen that some of the models show a remarkable difference within the margin of the standard errors of the measurements (+/−1.5%).
The power–law kinetic model (PWL) was used as a first approximation for further selection among the chosen mechanistic models (Table 6).
The range of the values for the reaction orders with respect to propane (0.67–0.70) and oxygen (0.09–0.13) are obviously not close to unity, which is the requirement to include the consideration of the Eley–Rideal-type of mechanism as a probable one (propane or oxygen should be reacting directly from the gas phase). The low values for the observed reaction order towards the oxygen (ranged at 0.1) lead to the conclusion that the role of the chemisorption is significant and therefore models assuming dissociative oxygen adsorption should be included in the list of probable mechanisms. The negative reaction order towards the water vapor shows an inhibition effect and it is almost one and the same for the three samples (−0.25–0.28). It should be pointed out that the impact of the water vapor formed during the reaction (and the oxygen consumption) is taken into account during the integration of the reaction rate alongside the catalytic bed.
Based on the well-known publication on the Mars and van Krevelen type of mechanism [38], the present reaction of catalytic oxidation of propane accompanied by desorption of products can be represented comprising the following steps:
reduced   catalyst + O 2   r o x   oxidized   catalyst
C 3 H 8 + oxidized   catalyst   r r e d   reduced   catalyst + CO 2 ,   ads + H 2 O ads
CO 2 ,   ads ,   H 2 O ads   r d e s   CO 2 ,   gas + H 2 O gas
In order to account for the inhibiting effect of the water vapor (which is produced both by the reaction or additionally added to the gas feed), the Mars–van Krevelen model should be modified by an additional term in the denominator, in order to take into account for the adsorption of water [39]. Based on the present study, the model of Mars–van Krevelen (MVK-1&2-SDP, Table 7) predicts that the water molecules compete with the propane molecules for both the oxidized and reduced adsorption sites; the effect of slow desorption of the products is also included. In parallel to the suggested mechanistic MVK-model, we include for consideration the mechanism of Langmuir–Hinshelwood, in which the propane and oxygen react in their adsorbed forms and the oxygen from the catalyst does not participate in the oxidation process. The proposed LH models are the following: LH-DS-D-1&2, (Table 6), where the adsorption of propane and oxygen proceeds on different types of sites (DS), the adsorption of oxygen is dissociative (D) and the water molecules compete both with the propane and oxygen molecules for the corresponding type of adsorption sites (Table 6 and Table 7) for both LH and MVK models.
It should be pointed out that the thermodynamic consistency of the equilibrium adsorption constants for propane, oxygen and water were additionally justified by comparing the values for the entropy and enthalpy of adsorption, obtained after the fitting procedure and the guidelines, defined by the studies of Boudard [40,41,42]. The calculated values of the enthalpies are constrained by the criteria, given by [42].
Using the criteria for lowest values for RSS (squared sum of the residuals between the experimentally measured and model-predicted conversions), the kinetics calculations for propane show that the MVK model is definitely more consistent with the experimental results than the LH model. According to the Mars–van Krevelen mechanism the VOCs are oxidized by the solid, i.e., the oxygen species introduced in the organic molecule come from the lattice. Therefore, the catalytic behavior can be correlated with lattice oxygen mobility, which is associated with catalyst reducibility. According to some authors [43,44], another fact that directly shows the high mobility of lattice oxygen is the high Mn3+/Mn4+ ratio. As can be seen, it is highest in the monocomponent manganese sample and decreases after the addition of Ce. Within the present study, the most active catalyst, monometallic manganese, is reduced at the lowest temperature and is distinguished by the highest Mn3+/Mn4+ ratio. As can be seen, the addition of Ce leads to a decrease in catalytic activity when compared to the monometallic manganese catalyst, regardless of whether the reducibility of the samples improves or worsens. This effect could be attributed to the decrease in the manganese concentration on the surface (as can be seen from XPS data), the decrease in the reducible oxygen species and to the fact that in bi-component catalysts, the oxide particles are situated inside the channels and are less accessible to the reagents. A similar phenomenon was observed with Co–Mn catalysts obtained by the same “two-solvent” method [45] and Co–Ce catalysts [46]. According to the TEM images, the oxide particles are located in the channels of the mesoporous structure and there is a strong interaction between manganese oxide and cerium oxide. Once again, it is confirmed that the “two-solvent” preparation method permits the localization of the oxide particles in the channels of mesoporous oxide. Within the bicomponent catalysts, the surface ratio Mn3+/Mn4+ is maintained and as noted above, the presence of the pair Mn3+/Mn4+ is essential for ensuring a high catalytic activity. According to literature data, the catalytic activity of Mn-containing catalysts in the combustion reactions increased when the pair Mn4+–Mn3+ existed on the structure of the oxide [24]. The characterization of the catalysts by different physicochemical methods after the reaction revealed insignificant changes in the mesoporous structure and morphology, oxide particle size and oxide phases. Therefore one may suppose that the mesoporous structure prevents the agglomeration of the oxide particles during the reaction.

3. Materials and Methods

3.1. Catalysis Preparation

The SBA-15 was synthesized by a sol–gel route as was already described in [18]. Both single component manganese, cerium and bi-component samples were synthesized according to the “two-solvents” method [45].
The preparation of Mn and Ce modified SBA-15 material was carried out by suspending in dry hexane, used as hydrophobic solvent, followed by dissolving of a desired amount of metal nitrate in distilled water, the quantity being the one corresponding to the pore volume of SBA-15 determined by N2 adsorption. The prepared aqueous solution containing the metal precursors was added dropwise to the suspension. The gel was aged for 2 h under vigorous stirring and the solid phase was recovered by filtration and dried up in air and then it was calcined for 3 h at 500 °C in air atmosphere.
The samples were denoted by Mn-SBA-15, Ce-SBA-15, MnCe (1:0.5) and MnCe (1:2), where the number represents the Mn and Ce number of moles.

3.2. Catalyst Characterization

Small-angle X-ray scattering (SAXS) data were collected on a “SAXSess mc²” instrument (Anton Paar, Graz, Austria) equipped with a line-collimation system. The instrument is attached to an ID 3003 laboratory X-Ray generator (General Electric, Boston, MA, USA) with a sealed X-ray tube (PANalytical, Malvern, UK, λ Cu, Kα = 0.1542 nm) and operating at 50 mA and 40 kV. The catalyst samples were introduced into a “Special Glass” capillary for liquids and liquid crystals (Φ = 1.5 mm and 2.0 mm for micellar solutions and liquid crystals, respectively), or between two sheets of Kapton® for materials, followed by placing inside an evacuated sample chamber and exposed to X-ray beam. Scattering of X-ray beam was registered by a CCD detector (Princeton Instruments, 2084 × 2084 pixels array with 24 × 24 µm² pixel size) at distance from the investigated sample of 309 mm. The 2D image was obtained by using of SAXSQuant software (Anton Paar, Graz, Austria) into one-dimensional scattering intensities I(q) in regard to the magnitude of the scattering vector q = (4π/λ) sin(θ), where 2θ refers to the total scattering function angle. Due to the translucent beam-stop allowing the measurement of an attenuated primary beam at q = 0, all the measured intensities can be calibrated by normalizing the attenuated primary intensity. Data were corrected for the background scattering from the cell and for slit-smearing effects by a de-smearing procedure from SAXSQuant software, using the Lake method.
Nitrogen adsorption–desorption isotherms were recorded at temperatures of −196 °C within a wide relative pressure (p/p0) range varying from 0.010 to 0.995 with a volumetric adsorption analyzer TRISTAR 3000 (Micromeritics). Before each measurement, the samples were de-gassed under vacuum (pressure of 0.13 mBar) at 25 °C for 16 h. The specific surface areas of the samples were estimated by the Brunauer–Emmett–Teller (BET) method [47]. The pore diameter and the pore size distribution were determined using data from the adsorption branch of the corresponding isotherm using the BJH (Barret–Joyner–Halenda) method [48].
Wide angles X-ray diffraction patterns were obtained on a BRUKER D8 ADVANCE A25 operating with Cu Kα radiation (Kα = 0.15418 nm) and equipped with the LynxEye XE-T high-resolution energy-dispersive 1D detector. The XRD powder patterns were registered at 25 °C within the range 3 < 2θ < 70, step = 0.018° 2θ. The phase identification was performed by the X’PertHighscore software (PANalytical) and the PDF-4+ 2020 database from the International Centre for Diffraction Data (ICDD). Transmission Electron Microscopy (TEM) images and chemical analyses of the samples were carried out using a JEOL ARM200-CFEG microscope working at 200 kV. The EDX analyses and chemical mappings were carried out using a JEOL Centurio detector.
The high-resolution transmission electron microscopy (HRTEM) studies were performed on a JEOL 2100 instrument at an accelerating voltage of 200 kV.
X-ray photoelectron spectroscopy (XPS) was performed by using ESCALAB MkII (VG Scientific, Waltham, MA, USA) and the processing of the measured spectra was described in [18].
Temperature-programmed reduction (TPR) is described in [18]. Because of partial reduction of ceria during the XPS measurements occurring as a function of irradiation, the XP spectra are collected immediately after turning on the X-rays to avoid any X-ray-induced artifacts.
The EPR spectra were recorded on JEOL JES-FA 100 EPR spectrometer operating in X-band with standard TE011 cylindrical resonator. The Varied Temperature Controller ES-DVT4 was used to permit detection of EPR spectra at various temperatures (123–423 K).

3.3. Catalytic Activity

The reaction kinetics tests were carried out in a continuous-flow quartz-glass type of reactor under the following testing condition: catalyst bed volume of 0.7 cm3 (0.5 cm3 catalyst and 0.2 cm3 quartz—glass with the same particle size), irregular shaped particles with diameter of 0.45 ± 0.15 mm, reactor diameter of 6.0 mm. The gaseous hourly space velocity (GHSVSTP) was fixed at 150,000 h–1. The reaction temperature fluctuation was kept at deviation: +/–1 °C at the most. For comparative activity tests, the inlet concentrations of reactants were fixed as follows: alkane (methane, propane and butane) feed concentrations: 0.01 vol.%, feed oxygen on level of 16 vol., no additional water vapor is added. In order to obtain data for reaction kinetics calculations of the inlet concentrations of reactants were varied as follows: propane feed concentrations: 0.04, 0.028 and 0.075 vol.%, feed oxygen on levels of 1.2, 5.0 and 20.0 vol.%, additional water vapor on levels of 0, 1.1 and 2.1 vol.%. All feed gas mixtures were balanced to 100% with nitrogen (4.0). The standard deviation values (+/−1.5%) of the experimental points were calculated on the basis of six consecutive measurements. The reproducibility and the corresponding confidence intervals for the measured conversion degrees were the subject of preliminary tests, which consisted in repeating the experimental runs under similar but not identical conditions within separate runs. The reported results are based on the average values for the conversion degrees within two parallel measurements.
The gas analysis was performed using the mass-spectrometer of the CATLAB (Hiden Analytical LTD, CATLAB SOFTWARE, Version: 1.12.0, Warrington, UK) system, an online gas analyzers of CO/CO2/O2 (Maihak-Sick Mod. S 710,V.1.31, Hamburg, Germany) and THC-FID (total hydrocarbon content, Horiba, Kyoto, Japan).

4. Conclusions

A series of mono-component Mn and bi-component Mn-Ce catalysts supported by SBA-15 were synthesized using the “two-solvents” method. The investigation with instrumental methods shows that the mesostructure is not modified during the catalytic reaction. The introduction of Mn and MnCe leads to the partial filling of the mesopores. It was assumed that the manganese oxides consolidate the meso-structure in the mono-component Mn catalyst, while in bicomponent materials, no mesopore clogging occurs, which leads to the prevention of the shrinkage of the meso-structure during the catalytic combustion of VOCs.
The fine dispersion of manganese and cerium oxide and their strong interactions in the channels of the SBA-15 molecular sieve, lead to the formation of difficult to reduce oxide phases and consequently, to lower catalytic activity compared to the mono-component manganese oxide catalyst. The other reason for the lower catalytic activity of Mn-Ce catalysts compared to the mono-component manganese one is a decrease in the accessible manganese species on the surface. Despite the lower catalytic activity of bicomponent catalysts, their advantage is that the surface ratio of Mn3+/Mn4+ is maintained and the mesoporous structure prevents agglomeration, which leads to the successful development of a new and stable catalyst for decreasing greenhouse gas emissions.
Based on the data from the instrumental methods, catalytic experiments and mathematic modeling of the reaction kinetics, one may conclude that the Mars–van Krevelen type of mechanism is the most probable for the reaction of complete propane oxidation over single Mn and bi-component Mn-Ce catalysts.

Supplementary Materials

The following supporting information can be downloaded at: https://0-www-mdpi-com.brum.beds.ac.uk/article/10.3390/catal12060583/s1, Table S1: Binding energies and FWHM of corresponding’s curve-fitting peaks based on standard spectra of Ce3+ and Ce4+.; Table S2: Binding energies, FWHM and splitting of corresponding’s curve-fitting peaks of standard spectra of Ce3+ and Ce4+.

Author Contributions

S.T., J.-L.B., B.L., A.N. and R.V.: results analysis, writing—original draft preparation, conceptualization and discussion; A.N. and R.V.: catalytic test, experiments and analysis; H.K. performed and discussed XPS analysis; Y.K. performed and discussed EPR analysis; L.M., B.L., J.-L.B., L.V. and D.K.: BET, SAXS, XRD, TEM, HRTEM measurements and analysis; K.T. H2-TPR measurements; A.D.: sample synthesis; S.T., J.-L.B., A.N. and R.V.: supervision and project administration. All authors contributed to the discussion of the manuscript. All authors have read and agreed to the published version of the manuscript.

Funding

The authors express their gratitude to the National Science Fund of Bulgaria for the financial support under the Contract KΠ-06-H49/4.

Data Availability Statement

The data presented in this study are available on request from the corresponding author.

Acknowledgments

Research equipment of Distributed Research Infrastructure INFRAMAT, part of the Bulgarian National Roadmap for Research Infrastructures, supported by the Bulgarian Ministry of Education and Science was used in this investigation.

Conflicts of Interest

The authors declare no conflict of interest.

References

  1. Atkinson, R.; Arey, J. Atmospheric degradation of volatile organic compounds. Chem. Rev. 2003, 103, 4605–4638. [Google Scholar] [CrossRef]
  2. Okal, J.; Zawadzki, M. Catalytic combustion of butane on Ru/γ–Al2O3 catalysts. Appl. Catal. B 2009, 89, 22–32. [Google Scholar] [CrossRef]
  3. Demoulin, O.; Baptiste, L.C.; Navez, M.; Ruiz, P. Combustion of methane, ethane and propane and of mixtures of methane with ethane or propane on Pd/γ-Al2O3 catalysts. Appl. Catal. A Gen. 2008, 344, 1–9. [Google Scholar] [CrossRef]
  4. Spivey, J.J.; Bond, G.C.; Webb, G. Complete catalytic oxidation of volatile organics. Catalysis 1989, 8, 157–203. [Google Scholar]
  5. Baldi, M.; Finocchio, E.; Milella, F.; Busca, G. Catalytic combustion of C3 hydrocarbons and oxygenates over Mn3O4. Appl. Catal. B Environ. 1998, 16, 43–51. [Google Scholar] [CrossRef]
  6. Huang, H.X.; Feng, Q.; Leung, D.Y.C. Low temperature catalytic oxidation of volatile organic compounds: A review. Catal. Sci. Technol. 2015, 5, 2649–2669. [Google Scholar] [CrossRef]
  7. Chang, J.Y.F.; McCarty, G. Novel oxygen storage components for advanced catalysts for emission control in natural gas fueled vehicles. Catal. Today 1996, 30, 163–170. [Google Scholar] [CrossRef]
  8. Jin, R.; Liu, Y.; Wang, Y.; Cen, W.; Wu, Z.; Wang, H.; Weng, X. The role of cerium in the improved SO2 tolerance for NO reduction with NH3 over Mn-Ce/TiO2 catalyst at low temperature. Appl. Catal. B 2014, 148–149, 582–588. [Google Scholar] [CrossRef]
  9. Wang, H.F.; Kavanagh, R.; Guo, Y.L.; Guo, Y.; Lu, G.Z.; Hu, P. Origin of extraordinarily high catalytic activity of Co3O4 and its morphological chemistry for CO oxidation at low temperature. J. Catal. 2012, 296, 110–119. [Google Scholar] [CrossRef]
  10. Abbasi, Z.; Haghighi, M.; Fatehifar, E.; Saedy, S. Synthesis and physicochemical characterizations of nanostructured Pt/Al2O3–CeO2 catalysts for total oxidation of VOCs. J. Hazard. Mater. 2011, 186, 1445–1454. [Google Scholar] [CrossRef]
  11. Esteban, C.-L.; Miguel Andrés, P.M.; Jorge, S.; Horacio, T. Cerium, manganese and cerium/manganese ceramic monolithic catalysts. Study of VOCs and PM removal. J. Rare Earths 2016, 34, 675–682. [Google Scholar] [CrossRef]
  12. Feng, S.; Jiadong, J.; Gao, B. Synergistic mechanism of Cu-Mn-Ce oxides in mesoporous ceramic base catalyst for VOCs microwave catalytic combustion. Chem. Eng. J. 2022, 429, 132302. [Google Scholar] [CrossRef]
  13. Venkataswamy, P.; Jampaiah, D.; Lin, F.; Alxneit, I.; Reddy, B.M. Structural properties of alumina supported Ce–Mn solid solutions and their markedly enhanced catalytic activity for CO oxidation. Appl. Surf. Sci. 2015, 349, 299–309. [Google Scholar] [CrossRef]
  14. Liu, J.; Wang, T.; Shi, N.; Yang, J.; Serageldin, M.A.; Pan, W.-P. Enhancing the interaction between Mn and Ce oxides supported on fly ash with organic acid ligands interface modification for effective VOC removal: A combined experimental and DFT + U study. Fuel 2022, 313, 123043. [Google Scholar] [CrossRef]
  15. Luo, Y.; Lin, D.; Zheng, Y.; Feng, X.; Chen, Q.; Zhang, K.; Wang, X.; Jiang, L. MnO2 nanoparticles encapsuled in spheres of Ce-Mn solid solution: Efficient catalyst and good water tolerance for low-temperature toluene oxidation. Appl. Surf. Sci. 2020, 504, 144481. [Google Scholar] [CrossRef]
  16. Todorova, S.; Kadinov, G.; Tenchev, K.; Caballero, A.; Holgado, J.P.; Pereniguez, R. Co3O4 + CeO2/SiO2 catalysts for n-hexane and CO oxidation. Catal. Lett. 2009, 155, 129–149. [Google Scholar] [CrossRef]
  17. Todorova, S.; Naydenov, A.; Kolev, H.; Tenchev, K.; Ivanov, G.; Kadinov, G. Effect of Co and Ce on silica supported manganese catalysts in the reactions of complete oxidation of n-hexane and ethyl acetate. J. Mater. Sci. 2011, 46, 7152–7159. [Google Scholar] [CrossRef]
  18. Todorova, S.; Blin, J.L.; Naydenov, A.; Lebeau, B.; Kolev, H.; Gaudin, P.; Dotzeva, A.; Velinova, R.; Filkova, D.; Ivanova, I.; et al. Co3O4-MnOx oxides supported on SBA-15 for CO and VOCs oxidation. Catal. Today 2020, 357, 602–612. [Google Scholar] [CrossRef]
  19. Zhu, S.; Zhou, Z.; Zhang, D.; Wang, H. Synthesis of mesoporous amorphous MnO2 from SBA-15 via surface modification and ultrasonic waves. Micropor. Mesopor. Mat. 2006, 95, 257–264. [Google Scholar] [CrossRef]
  20. Thommes, M.; Kaneko, K.; Neimark, A.V.; Olivier, J.P.; Rodriguez-Reinoso, F.; Rouquerol, J.; Sing, K.S.W. Physisorption of Gases, with Special Reference to the Evaluation of Surface Area and Pore Size Distribution (IUPAC Technical Report). Pure Appl. Chem. 2015, 87, 1051–1069. [Google Scholar] [CrossRef] [Green Version]
  21. Todorova, S.; Blin, J.L.; Naydenov, A.; Lebeau, B.; Karashanova, D.; Kolev, H.; Gaudin, P.; Velinova, R.; Vidal, L.; Michelin, L.; et al. Co-Mn oxides supported on hierarchical macro-mesoporous silica for CO and VOCs oxidation. Catal. Today 2021, 361, 94–101. [Google Scholar] [CrossRef]
  22. Qi, G.; Yang, R.T. Characterization and FTIR Studies of MnOx-CeO2 Catalyst for low-temperature selective catalytic reduction of NO with NH3. J. Phys. Chem. B 2004, 108, 15738–15747. [Google Scholar] [CrossRef]
  23. Todorova, S.; Naydenov, A.; Kolev, H.; Holgado, J.P.; Ivanov, G.; Kadinov, G.; Caballero, A. Mechanism of complete n-hexane oxidation on silica supported cobalt and manganese catalysts. Appl. Catal. A Gen. 2012, 413–414, 43–51. [Google Scholar] [CrossRef]
  24. Figueroa, S.J.A.; Requejo, F.G.; Lede, E.J.; Lamaita, L.; Peluso, M.A.; Sambeth, J. XANES study of electronic and structural nature of Mn-sites in manganese oxides with catalytic properties. Catal. Today 2005, 107–108, 849–855. [Google Scholar] [CrossRef]
  25. Larachi, F.; Pierre, J.; Adnot, A.; Bernis, A. Ce 3d XPS study of composite CexMn1−xO2−y wet oxidation catalysts. Appl. Surf. Sci. 2002, 195, 236–250. [Google Scholar] [CrossRef]
  26. Matolín, V.; Cabala, M.; Cháb, V.; Matolínová, I.; Prince, K.C.; Škoda, M.; Šutara, F.; Skála, T.; Veltruská, K. A resonant photoelectron spectroscopy study of Sn (Ox) doped CeO2 catalysts. Surf. Interface Anal. 2008, 40, 225–230. [Google Scholar] [CrossRef]
  27. Kumar, G.S.; Palanichamy, M.; Hartmann, M.; Murugesan, V. A new route for the synthesis of manganese incorporated SBA-15. Micropor. Mesopor. Mat. 2008, 112, 53–60. [Google Scholar] [CrossRef]
  28. Jia, L.; Shen, M.; Hao, J.; Rao, T.; Wang, J. Dynamic oxygen storage and release over Mn0.1Ce0.9Ox and Mn0.1Ce0.6Zr0.3Ox complex compounds andstructural characterization. J. Alloys Compd. 2008, 454, 321–326. [Google Scholar] [CrossRef]
  29. Peng, Y.; Chang, H.; Dai, Y.; Li, J. Structural and surface effect of MnO2 for low temperature selective catalytic reduction of NO with NH3. Proc. Environ. Sci. 2013, 18, 384–390. [Google Scholar] [CrossRef] [Green Version]
  30. Kapteijn, F.; Singoredjo, L.; Andreini, A.; Moulijn, J. Activity and selectivity of pure manganese oxides in the selective catalytic reduction of nitric oxide with ammonia. Appl. Catal. B 1994, 3, 173–189. [Google Scholar] [CrossRef]
  31. Stobbe, E.R.; de Boer, B.A.; Geus, J. The reduction and oxidation behaviour of manganese oxides. Catal. Today 1999, 47, 161–167. [Google Scholar] [CrossRef]
  32. Delimaris, D.; Ioannides, T. VOC oxidation over MnOx–CeO2 catalysts prepared by a combustion method. Appl. Catal. B 2008, 84, 303–312. [Google Scholar] [CrossRef]
  33. Wan, J.; Tao, F.; Shi, Y.; Shi, Z.; Liu, Y.; Wu, G.; Kan, J.; Zhou, R. Designed preparation of nano rod shaped CeO2-MnOx catalysts with different Ce/Mn ratios and its highly efficient catalytic performance for chlorobenzene complete oxidation: New insights into structure-activity correlations. Chem. Eng. J. 2022, 433, 133788. [Google Scholar] [CrossRef]
  34. Markos, J.; Brunovska, A.; Ilavsky, J. Modelling of catalytic reactors with catalyst deactivation IV. Parameter estimation of the rate equations of heterogeneous catalyst deactivation. Chem. Papers 1987, 41, 375–393. [Google Scholar]
  35. Duprat, F. Light-off curve of catalytic reaction and kinetics. Chem. Engin. Sci. 2002, 57, 901–911. [Google Scholar] [CrossRef]
  36. Markova-Velichkova, M.; Lazarova, T.; Tumbalev, V.; Ivanov, G.; Kovacheva, D.; Stefanov, P.; Naydenov, A. Complete oxidation of hydrocarbons on YFeO3 and LaFeO3 catalysts. Chem. Engin. J. 2013, 231, 236–244. [Google Scholar] [CrossRef]
  37. Stefanov, P.; Todorova, S.; Naydenov, A.; Tzaneva, B.; Kolev, H.; Atanasova, G.; Stoyanova, D.; Karakirova, Y.; Aleksieva, K. On the development of active and stable Pd–Co/γ-Al2O3 catalyst for complete oxidation of methane. Chem. Engin. J. 2015, 266, 329–338. [Google Scholar] [CrossRef]
  38. Mars, P.; van Krevelen, D.W. Oxidations carried out by means of vanadium oxide catalysts. Spec. Suppl. Chem. Engin. Sci. 1954, 3, 41–59. [Google Scholar] [CrossRef]
  39. Hurtado, P.; Ordóñez, S.; Sastre, H.; Dıez, F.V. Development of a kinetic model for the oxidation of methane over Pd/Al2O3 at dry and wet conditions. Appl. Catal. B-Environ. 2004, 51, 229–238. [Google Scholar] [CrossRef]
  40. Boudart, M. Two-step catalytic reactions. AIChE J. 1972, 18, 465–478. [Google Scholar] [CrossRef]
  41. Toops, T.J.; Walters, A.B.; Vannice, M.A. Methane combustion over La2O3-based catalysts and γ-Al2O3. Appl. Catal. Gen. A 2002, 233, 125–140. [Google Scholar] [CrossRef]
  42. Vannice, M.A.; Hyun, S.H.; Kalpakci, S.H.; Liauh, W.C. Entropies of adsorption in heterogeneous catalytic reactions. J. Catal. 1979, 56, 358–362. [Google Scholar] [CrossRef]
  43. Hou, J.; Li, Y.; Liu, L.; Ren, L.; Zhao, X. Effect of giant oxygen vacancy defects on the catalytic oxidation of OMS-2 nanorods. J. Mater. Chem. A 2013, 1, 6736–6741. [Google Scholar] [CrossRef]
  44. Lin, T.; Lin Yu, L.; Sun, M.; Cheng, G.; Lan, B.; Fu, Z. Mesoporous α-MnO2 microspheres with high specific surface area: Controlled synthesis and catalytic activities. Chem. Eng. J. 2016, 286, 114–121. [Google Scholar] [CrossRef]
  45. Imperor-Clerc, M.; Bazin, D.; Appay, M.-D.; Beaunier, P.; Davidson, A. Crystallization of β-MnO2 nanowires in the pores of SBA-15 silicas: In situ investigation using synchrotron radiation. Chem. Mater. 2004, 16, 1813–1821. [Google Scholar] [CrossRef]
  46. Blin, J.-L.; Michelin, L.; Lebeau, B.; Naydenov, A.; Velinova, R.; Kolev, H.; Gaudin, P.; Vidal, L.; Dotzeva, A.; Tenchev, K.; et al. Co–Ce Oxides Supported on SBA-15 for VOCs Oxidation. Catalysts 2021, 11, 366. [Google Scholar] [CrossRef]
  47. Brunauer, S.; Emmet, P.H.; Teller, E. Adsorption of gases in multimolecular layers. J. Am. Chem. Soc. 1938, 60, 309–331. [Google Scholar] [CrossRef]
  48. Barrett, E.P.; Joyner, L.G.; Halenda, P.P. The determination of pore volume and area distributions in porous substances. I. Com-537 putations from nitrogen isotherms. J. Am. Soc. 1951, 73, 373–380. [Google Scholar] [CrossRef]
Figure 1. SAXS pattern of the catalysts before (a) and after (b) the VOC combustion.
Catalysts 12 00583 g001
Figure 2. Nitrogen adsorption–desorption isotherms of the catalysts before (a) and after (b) the VOC combustion.
Catalysts 12 00583 g002
Figure 3. TEM images of MnCe (1:0.5) material before (a,b) and after (c,d) reaction.
Catalysts 12 00583 g003
Figure 4. TEM images (dark field mode) and related EDX Mn, Ce elemental mappings of MnCe (1:0.5) before (ac) and after (df) reaction.
Catalysts 12 00583 g004
Figure 5. Bright field (BF) TEM (a,c) images at magnification 40,000× and HRTEM (b,d) images at magnification 600,000× of MnCe (1:0.5) and MnCe (1:2) catalysts, respectively.
Catalysts 12 00583 g005
Figure 6. XRD patterns of MeCe (1:2) and MnCe (1:0.5) materials before and after reaction, and XRD peaks of Mn3O4 (JCPDS card N 00-001-1127) and MnO2 (card N 00-012-0716).
Catalysts 12 00583 g006
Figure 7. Fitted Mn2p (a) and Ce3d (b) photoelectron peaks of the Ce and Mn-Ce samples before reaction.
Catalysts 12 00583 g007
Figure 8. Fitted Mn2p (a) and Ce3d (b) photoelectron peaks of the Ce and Mn-Ce samples after reaction.
Catalysts 12 00583 g008
Figure 9. EPR spectra at 123 K of: (a) MnCe(1:0.5)—fresh; (b) MnCe(1:0.5)—after catalytic test; (c) MnCe(1:2)—fresh; (d) MnCe(1:2)—after catalytic test.
Catalysts 12 00583 g009
Figure 10. TPR spectra of single- and bi-component catalysts.
Catalysts 12 00583 g010
Figure 11. Temperature dependence of methane, propane and butane combustion.
Catalysts 12 00583 g011
Table 1. d-spacing values, specific surface area (SBET), total pore volume (Vp) and pore diameter (ø) of the catalysts before (BR) and after (AR) reaction (propane oxidation).
Sample d-Spacing (nm)SBET (m²/g)Vp * (cm3/g)ø ** (nm)
SBA-15 10.79820.999.0
Mn-SBA-15Before reaction10.04180.468.0–10.1
After reaction10.02530.256.2–7.4
Mn-Ce (1:0.5)Before reaction9.74190.335.4–7.9
After reaction9.73850.305.0–7.5
Mn-Ce (1:2)Before reaction9.54750.324.8–7.7
After reaction9.54610.364.8–7.1
* Single point values. ** Values obtained from BJH method applied to the adsorption branch of the isotherm.
Table 2. Surface atomic concentrations (at.%) of O 1s, Si 2s, Mn2p and Ce3d.
Sample\ElementO 1s, %Si 2s, %Mn2p, %Ce3d, %
Mn/SBA 15 [11]
before reaction62.7343.3 (Mn3+/Mn4+ = 1.5)
Mn3+Mn4+
1.981.32
after reaction62.33361.67 (Mn3+/Mn4+ = 0.40)
0.481.19
Ce/SBA 15
before reaction64.0735.04 0.88
Ce3+/Ce4+ = 1.5
after reaction----
MnCe (1:0.5)
before reaction64.4334.161.16 (Mn3+/Mn4+ = 0.41)0.25
Ce3+/Ce4+ = 1.6
Mn3+Mn4+
0.340.82
after reaction63.6434.861.25 (Mn3+/Mn4+ = 0.87)0.24
Ce3+
Mn3+Mn4+
0.580.67
MnCe (1:2)
before reaction63.95%35.03%0.65 (Mn3+/Mn4+ = 0.44)0.37
Ce3+/Ce4+ = 2.5
Mn3+Mn4+
0.200.45
after reaction62.8636.090.72 (Mn3+/Mn4+ = 0.47)0.33
Ce3+
Mn3+Mn4+
0.230.49
Table 3. Values of the intensities of the EPR spectra of the studied catalysts.
SampleIntensity, a. u.
MnCe (1:0.5)—fresh2028
MnCe (1:2)—fresh2050
MnCe (1:0.5)—after catalysis1269
MnCe (1:2)—after catalysis2119
Table 4. Peak areas after deconvolution of TPR spectra.
SamplePeak
Position, °C
Area
%
Total H2 Consumption, mmol/g
Mn-SBA-1533046.54.6
42413.7
46017.9
48221.9
MnCe (1:0.5)33570.93.5
43029.1
MnCe (1:2)3501002.9
Table 5. Light-off temperatures (T50) of methane, propane and butane combustion in air (GHSVSTP = 150,000 h–1) and ratios between calculated rate constants.
MethanePropaneButane
T50
Mn-20407343326
MnCe (1:0.5)468364342
MnCe (1:2)550417396
Rate Constants
kMn/kMn-Ce
390 °C
kMn/kMn-Ce
350 °C
kMn/kMn-Ce
340 °C
MnCe (1:0.5)2.11.61.5
MnCe (1:2)6.26.06.1
Table 6. Kinetics parameters based on power–law model.
PWL
r = k C v o c m C o x n C w a t e r p
Catalyst:Eakom (C3H8) n (O2) p (H2O) RSSR2
Mn-2089.02.78 × 1070.700.09−0.274.30.99
MnCe (1:0.5)90.32.12 × 1070.670.12−0.252.30.99
MnCe (1:2)102.34.72 × 1070.700.13−0.282.01.00
Eai, kJ/mol; koi, mol·s−1·m−3; koi,pwl, mol·s−1-[1-(m+n+p)]; Eai, kJ/mol; (R2)—squared correlation coefficient.
Table 7. Reaction rate expressions and kinetics parameters for applied LH model.
LH-DS-D-1&2: Water Compete with Oxygen and Propane
r = k K v o c C v o c K o x 1 / 2 C o x 1 / 2 ( 1   +   K v o c C v o c   +   K w a t e r v o c C w a t e r ) ( 1   +   K o x 1 / 2 C o x 1 / 2   +   K w a t e r o x C w a t e r )
Catalyst:Eako −ΔHoxko.ox −ΔHvocko.voc −ΔHwater-oxko.water-ox −ΔHwater-redko.water-redRSSR2
Mn-2013.52.19 × 10163.94.16 × 10674.24.78 × 10−651.53.33 × 10−3149.51.68 × 10123.21.00
MnCe (1:0.5)16.53.77 × 10159.92.91 × 10684.89.58 × 10−749.44.19 × 10−3152.72.24 × 10121.11.00
MnCe (1:2)28.65.98 × 10279.18.43 × 10782.54.30 × 10−693.99.47 × 10−7117.71.33 × 1091.01.00
Eai, kJ/mol; ΔHi, kJ/mol; koi, atm−1; k = ko. exp(−Ea/RT); Ki(voc.ox) = ko.(voc.ox). exp(−ΔHi.voc.ox/RT); −ΔHi = EdesEads, (R2)—squared correlation coefficient.
Table 8. Reaction rate expressions and kinetics parameters for applied MVK model.
MVK-1&2-SDP, (Water Adsorbs on Oxidized and Reduced Sites, Slow Desorption of Products)
r = k r e d k o x C v o c C o x γ k r e d C v o c ( 1   +   K w a t e r v o c . C w a t e r v o c )   +   k o x C o x ( 1   +   K w a t e r o x . C w a t e r o x )   +   ( k r e d k o x / k d e s ) C v o c C o x , γ = 5
Catalyst:Ea.oxko.oxEa.redko.reductionEa.desko.des −ΔHwater.oxko.water. ox −ΔHwater.redko.water. redRSSR2
Mn-20124.64.80 × 10972.91.07 × 10−563.08.62 × 10−461.59.13 × 10−570.91.99 × 10−56.01.00
MnCe (1:0.5)122.15.14 × 10969.81.01 × 10−562.48.54 × 10−463.79.10 × 10−563.93.71 × 10−55.50.99
MnCe (1:2)128.34.00 × 109116.93.93 × 10−959.22.40 × 10−359.28.99 × 10−5119.45.05 × 10−67.31.00
Eai, kJ/mol; ΔHi, kJ/mol; koi, m3/mol; k = ko. exp(−Ea/RT); Ki(voc,ox) = ko(voc,ox). exp(−ΔHi,voc,ox/RT); −ΔHi = EdesEads, (R2)—squared correlation coefficient.
Publisher’s Note: MDPI stays neutral with regard to jurisdictional claims in published maps and institutional affiliations.

