
Quality or Quantity? How Structural Parameters Affect Catalytic Activity of Iron Oxides for CO Oxidation

 , , , , , and
Abstract
:1. Introduction
2. Results
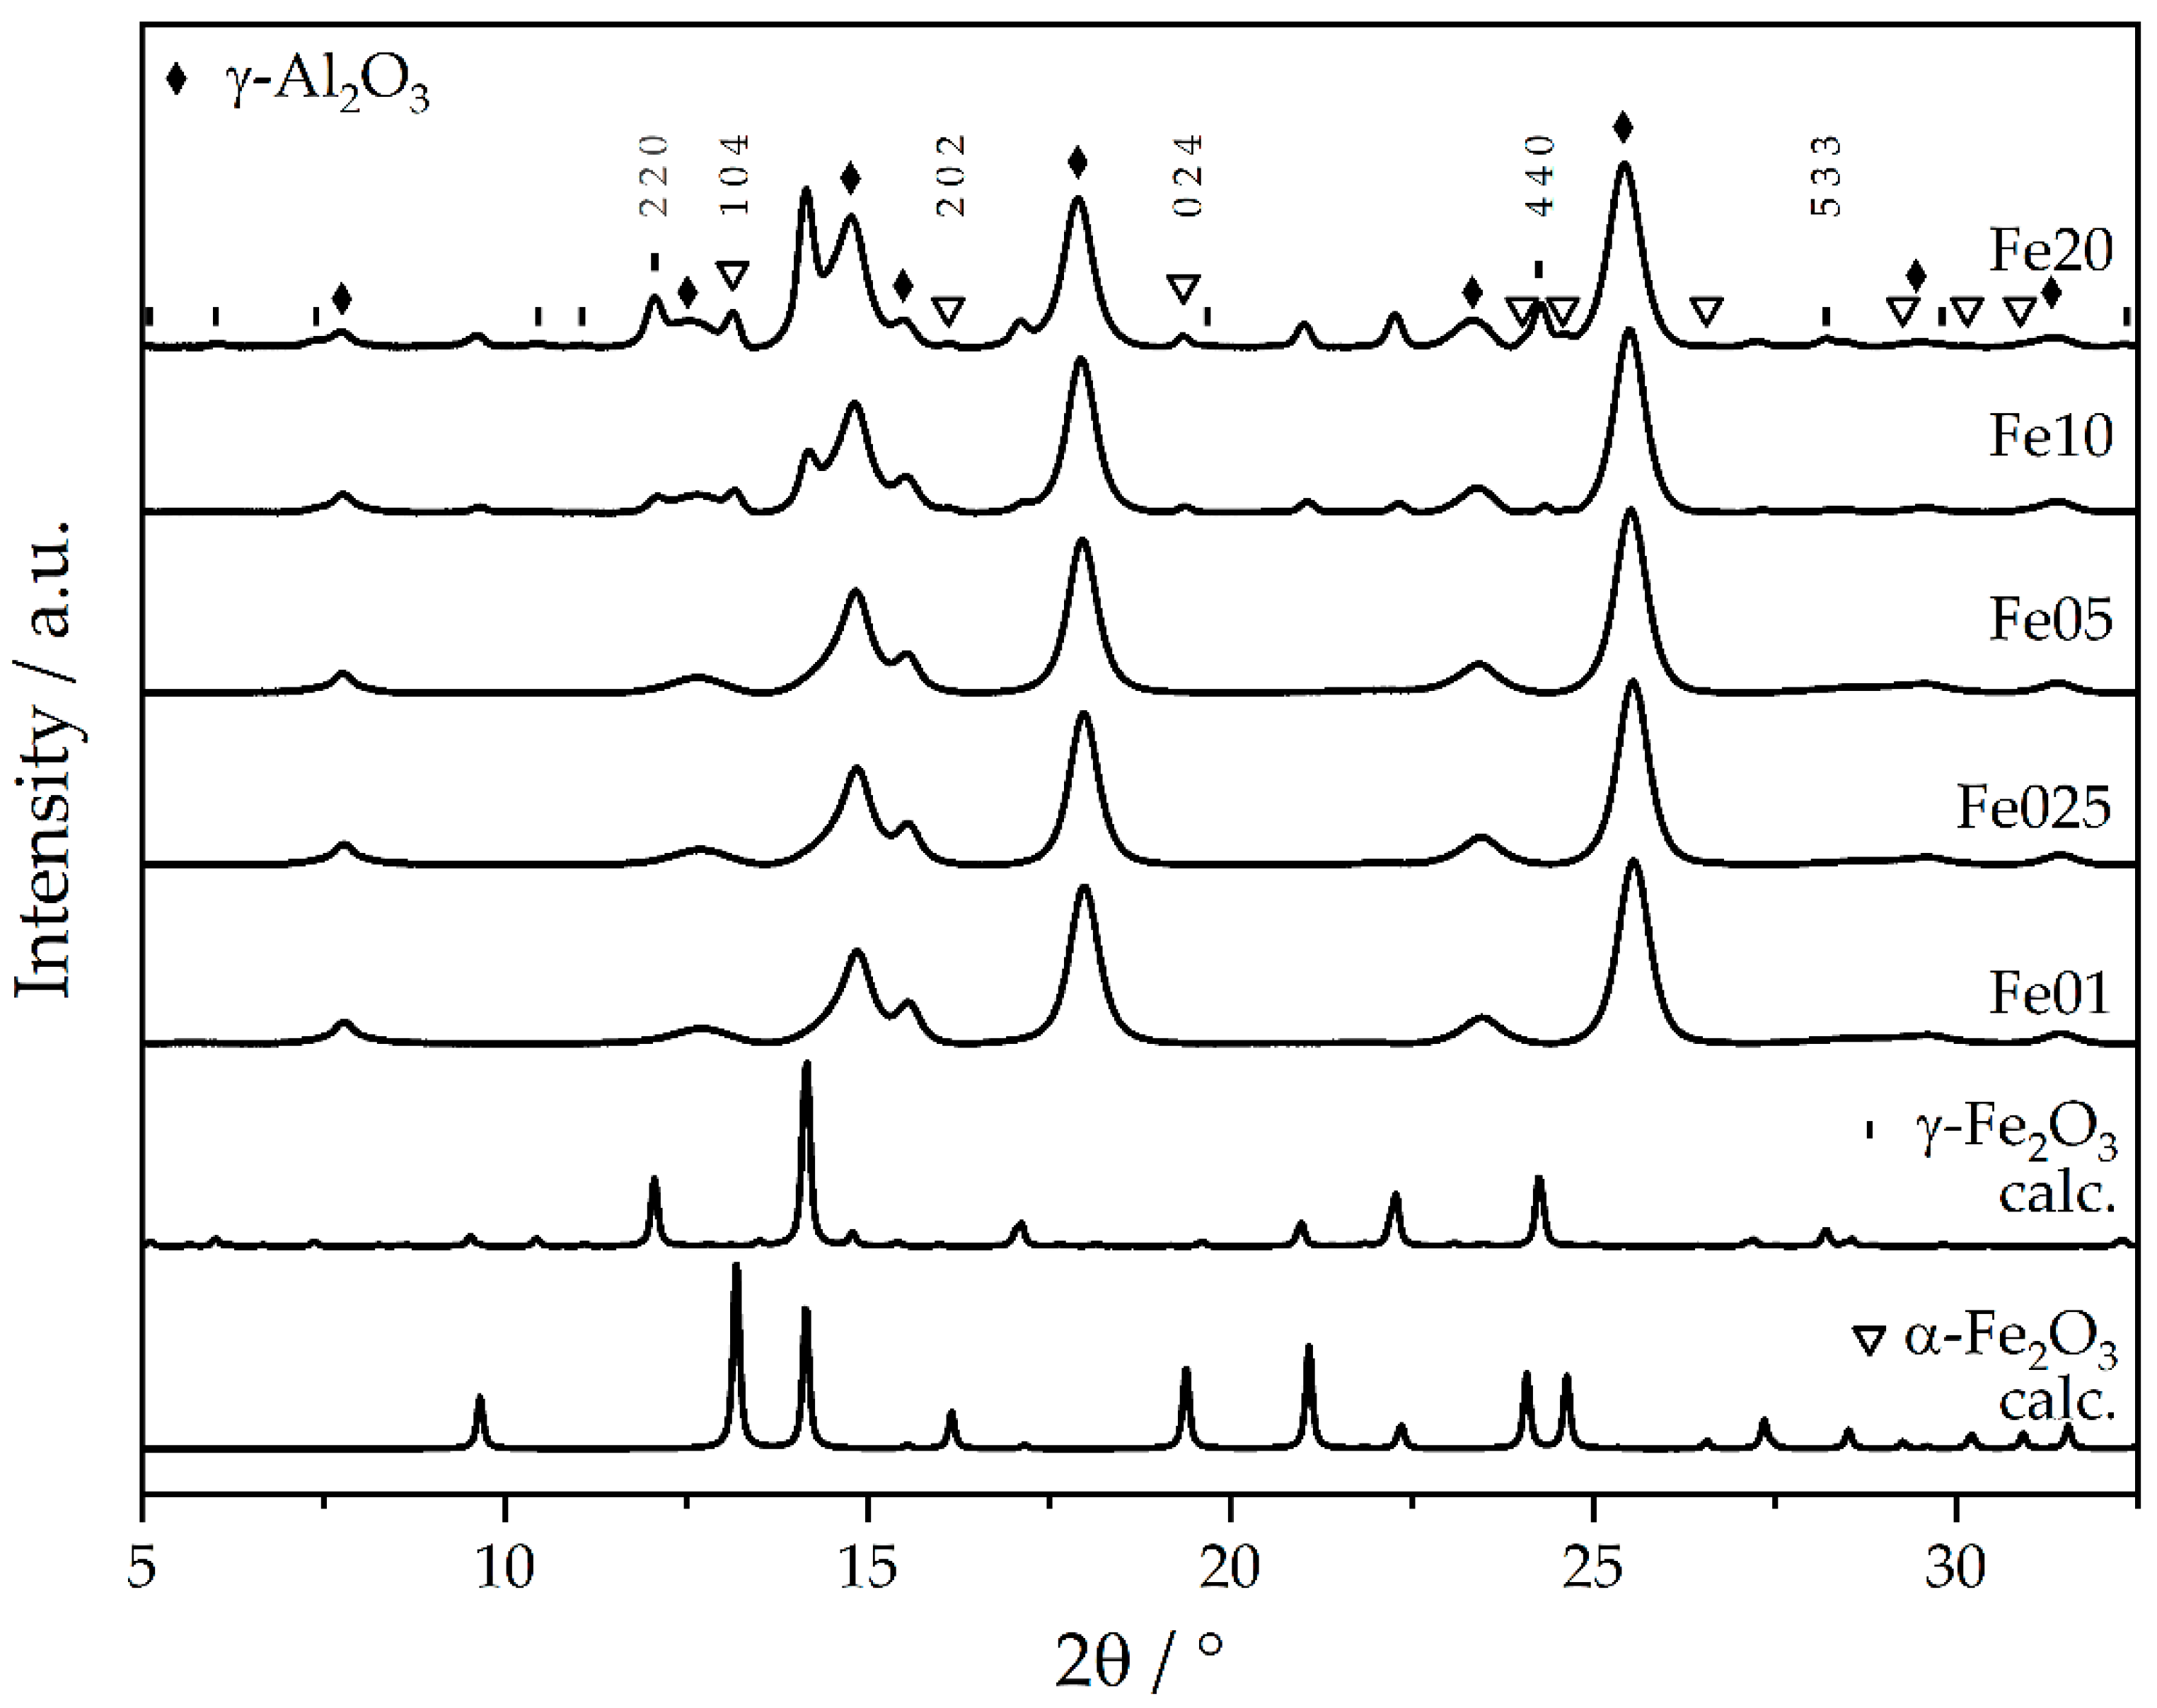
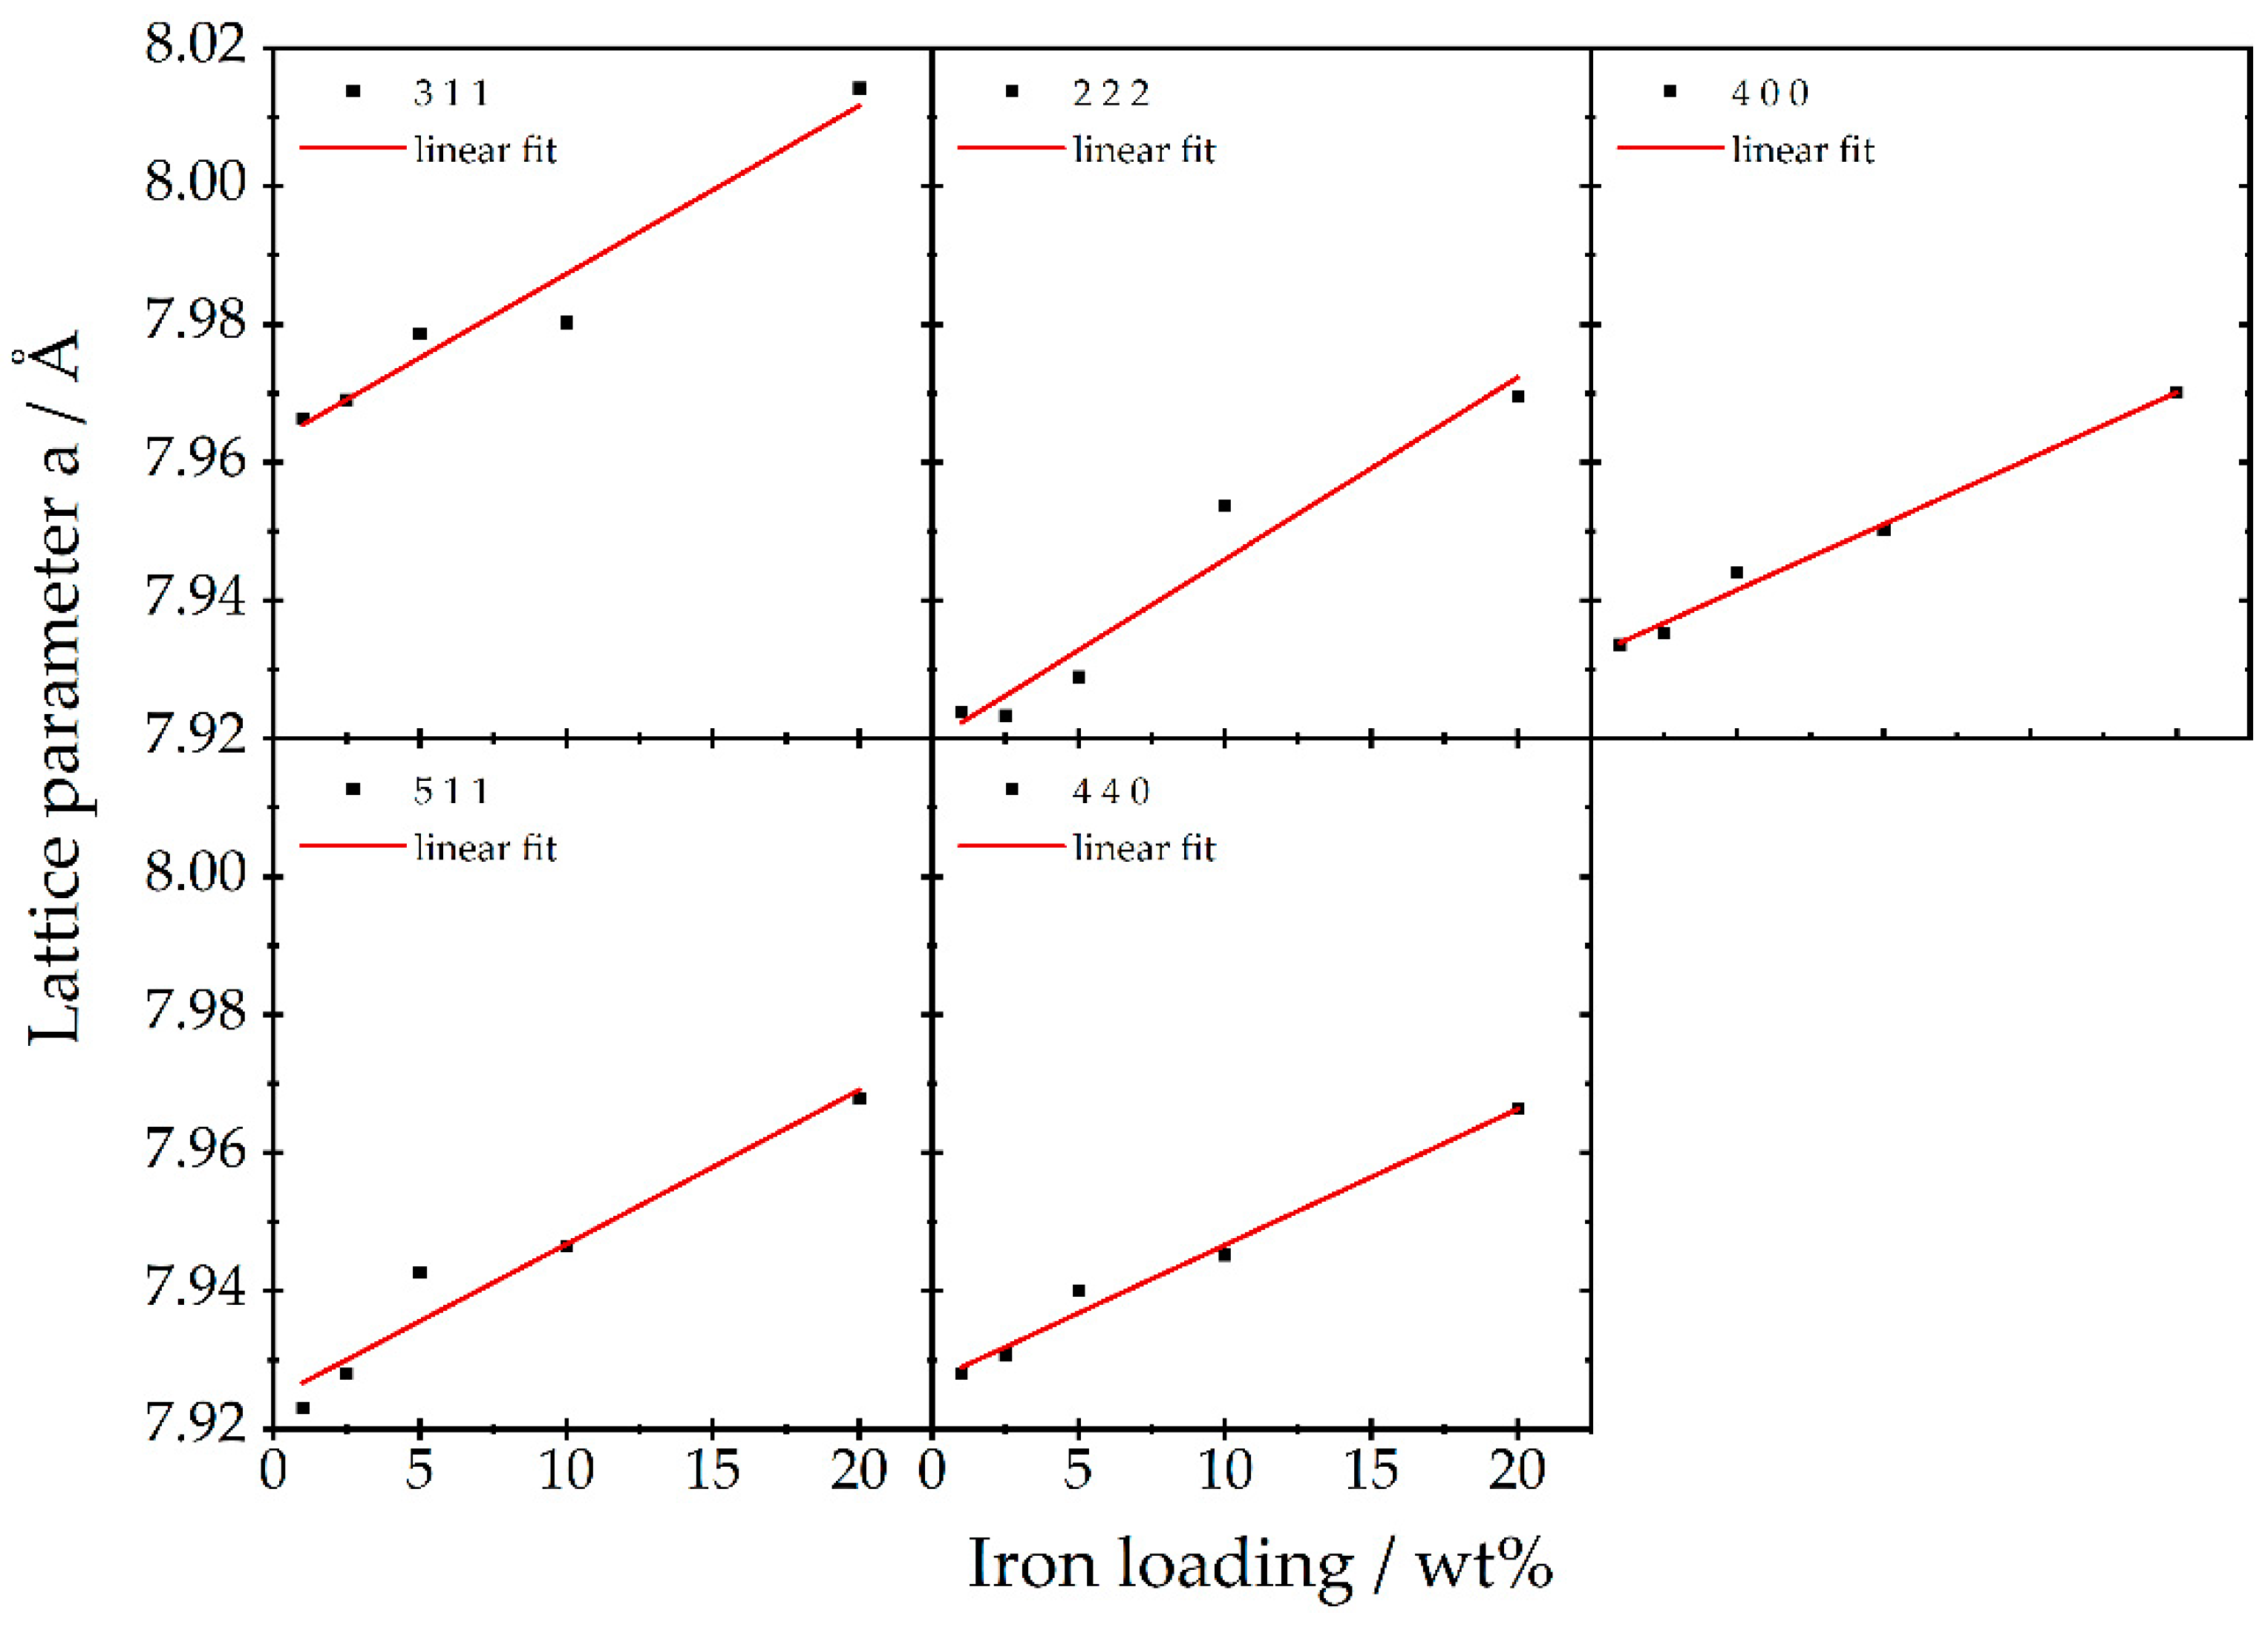
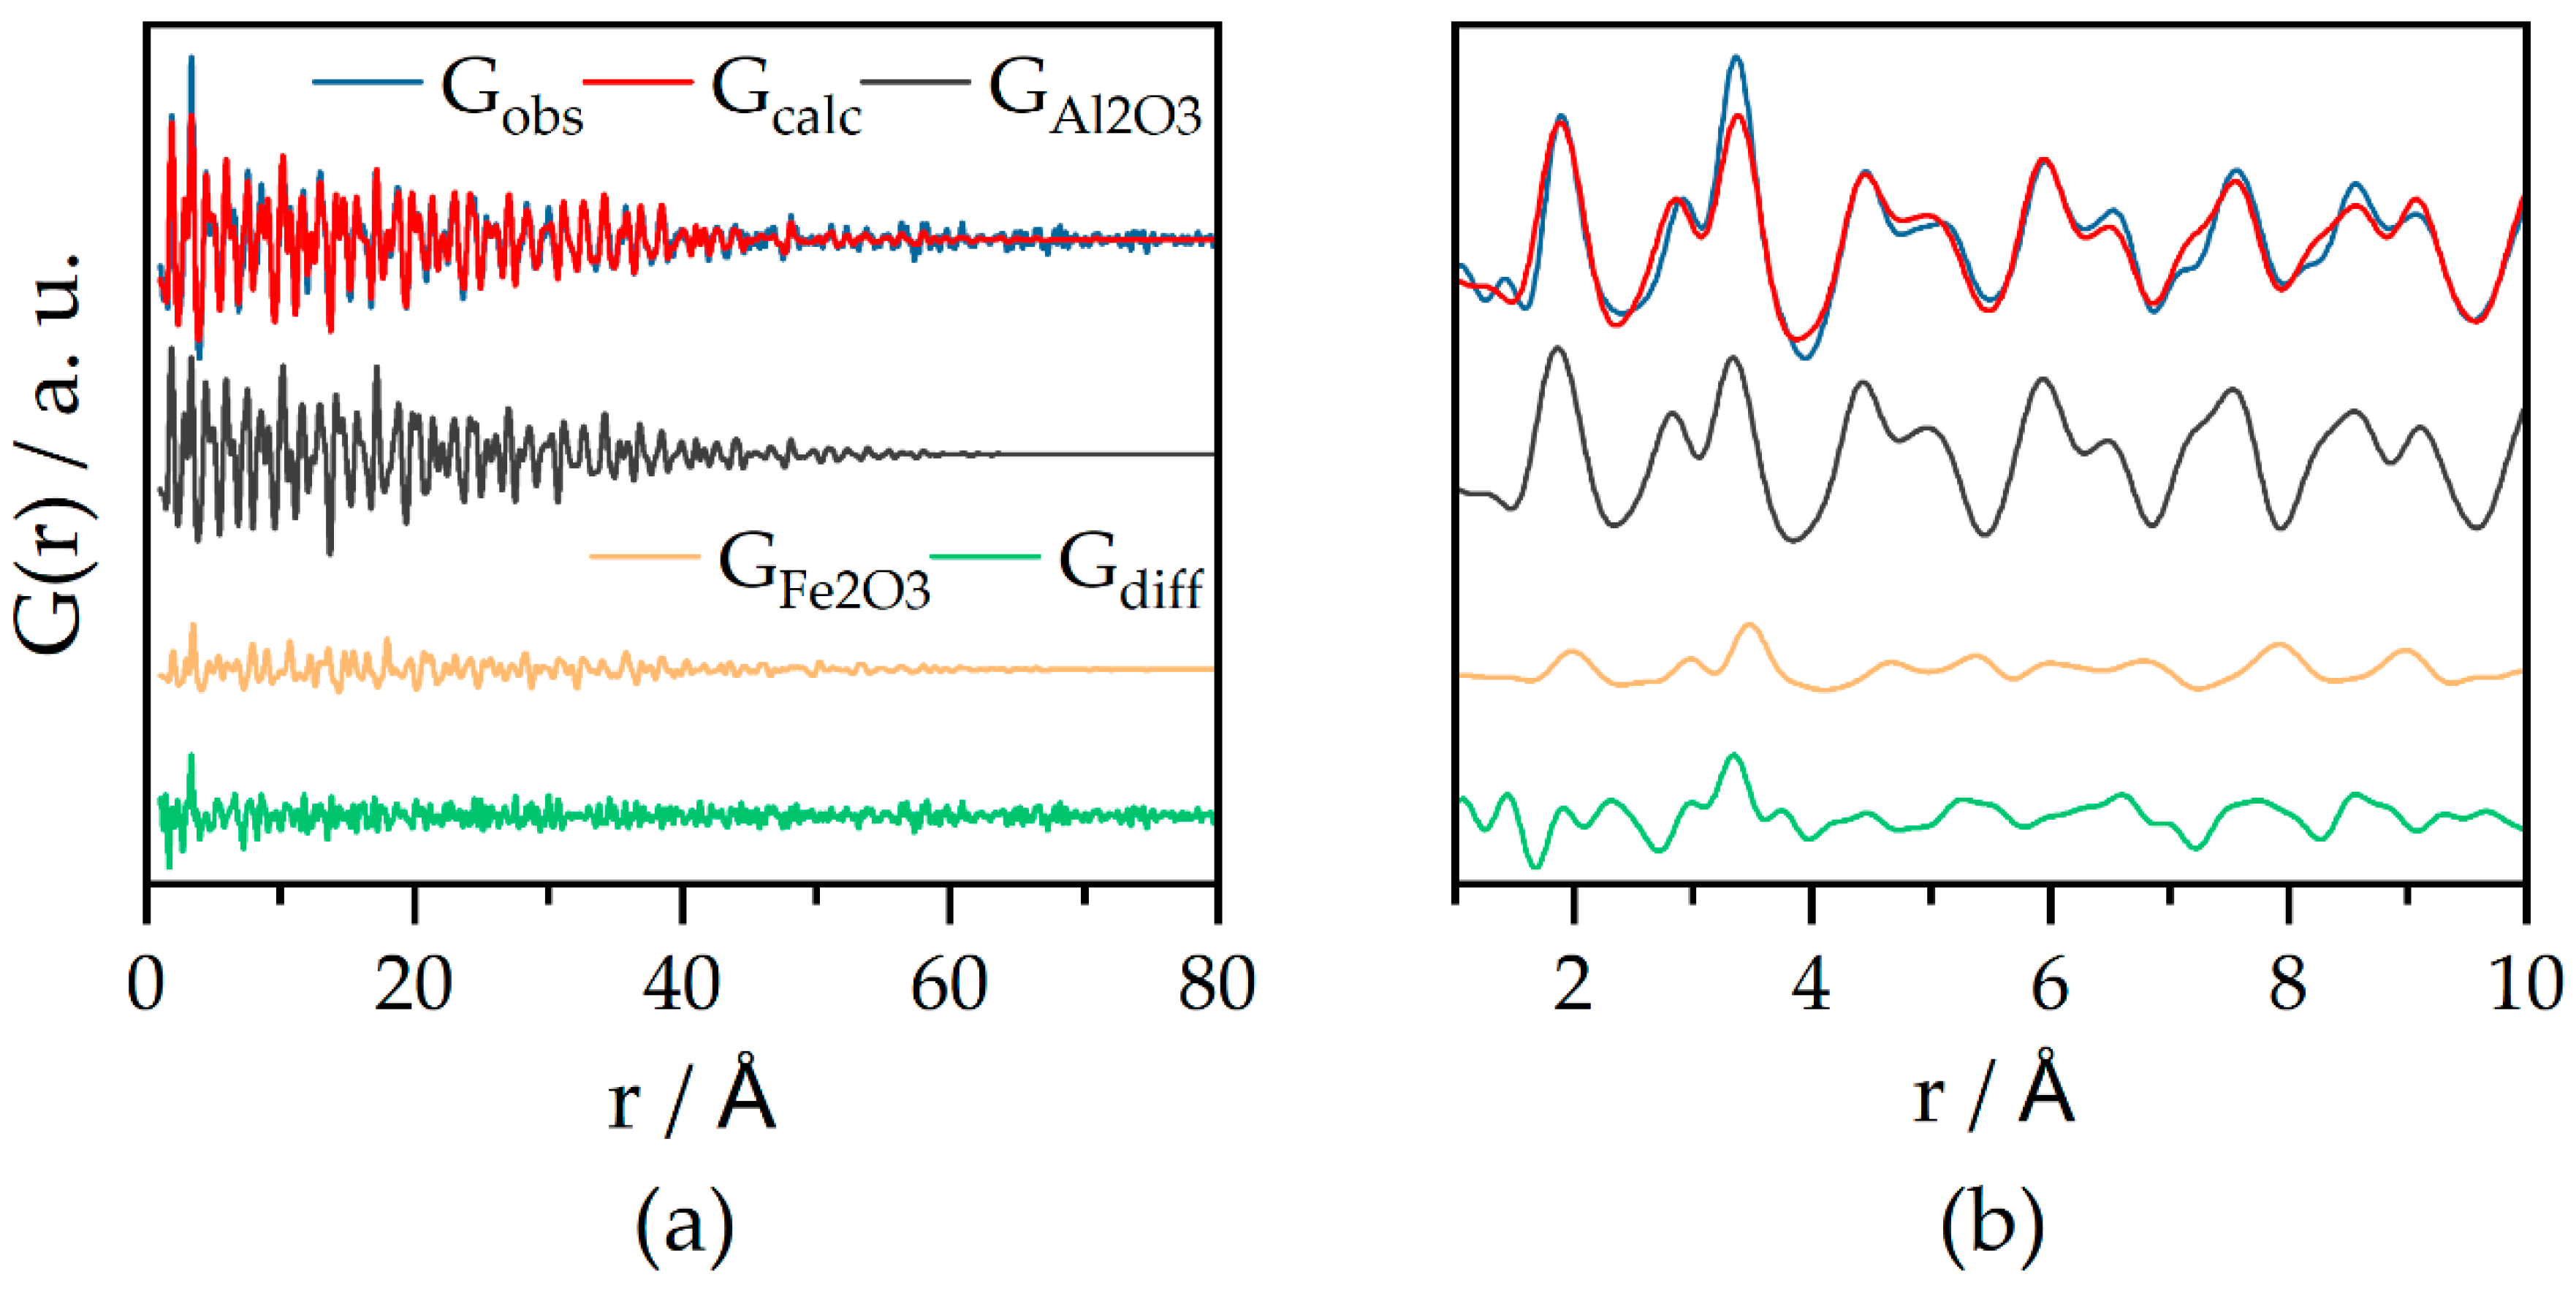
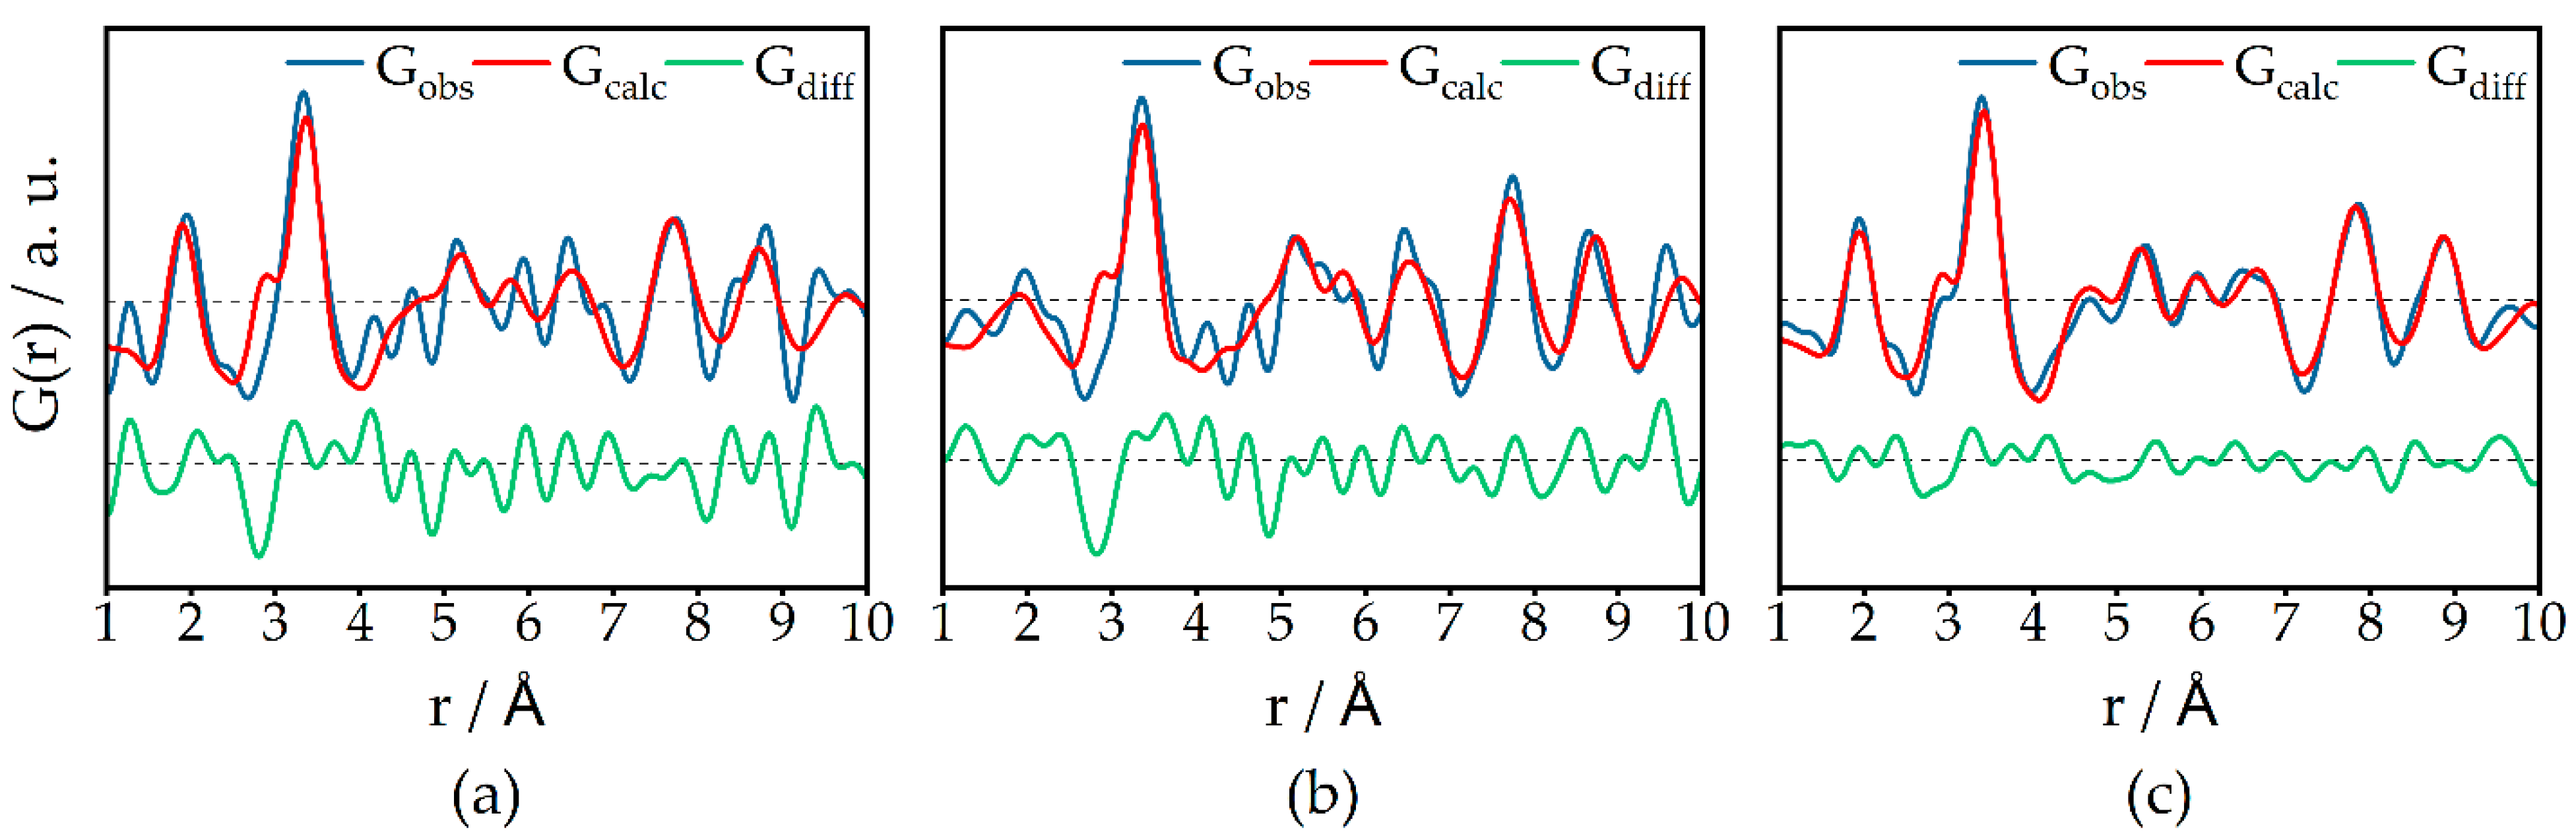
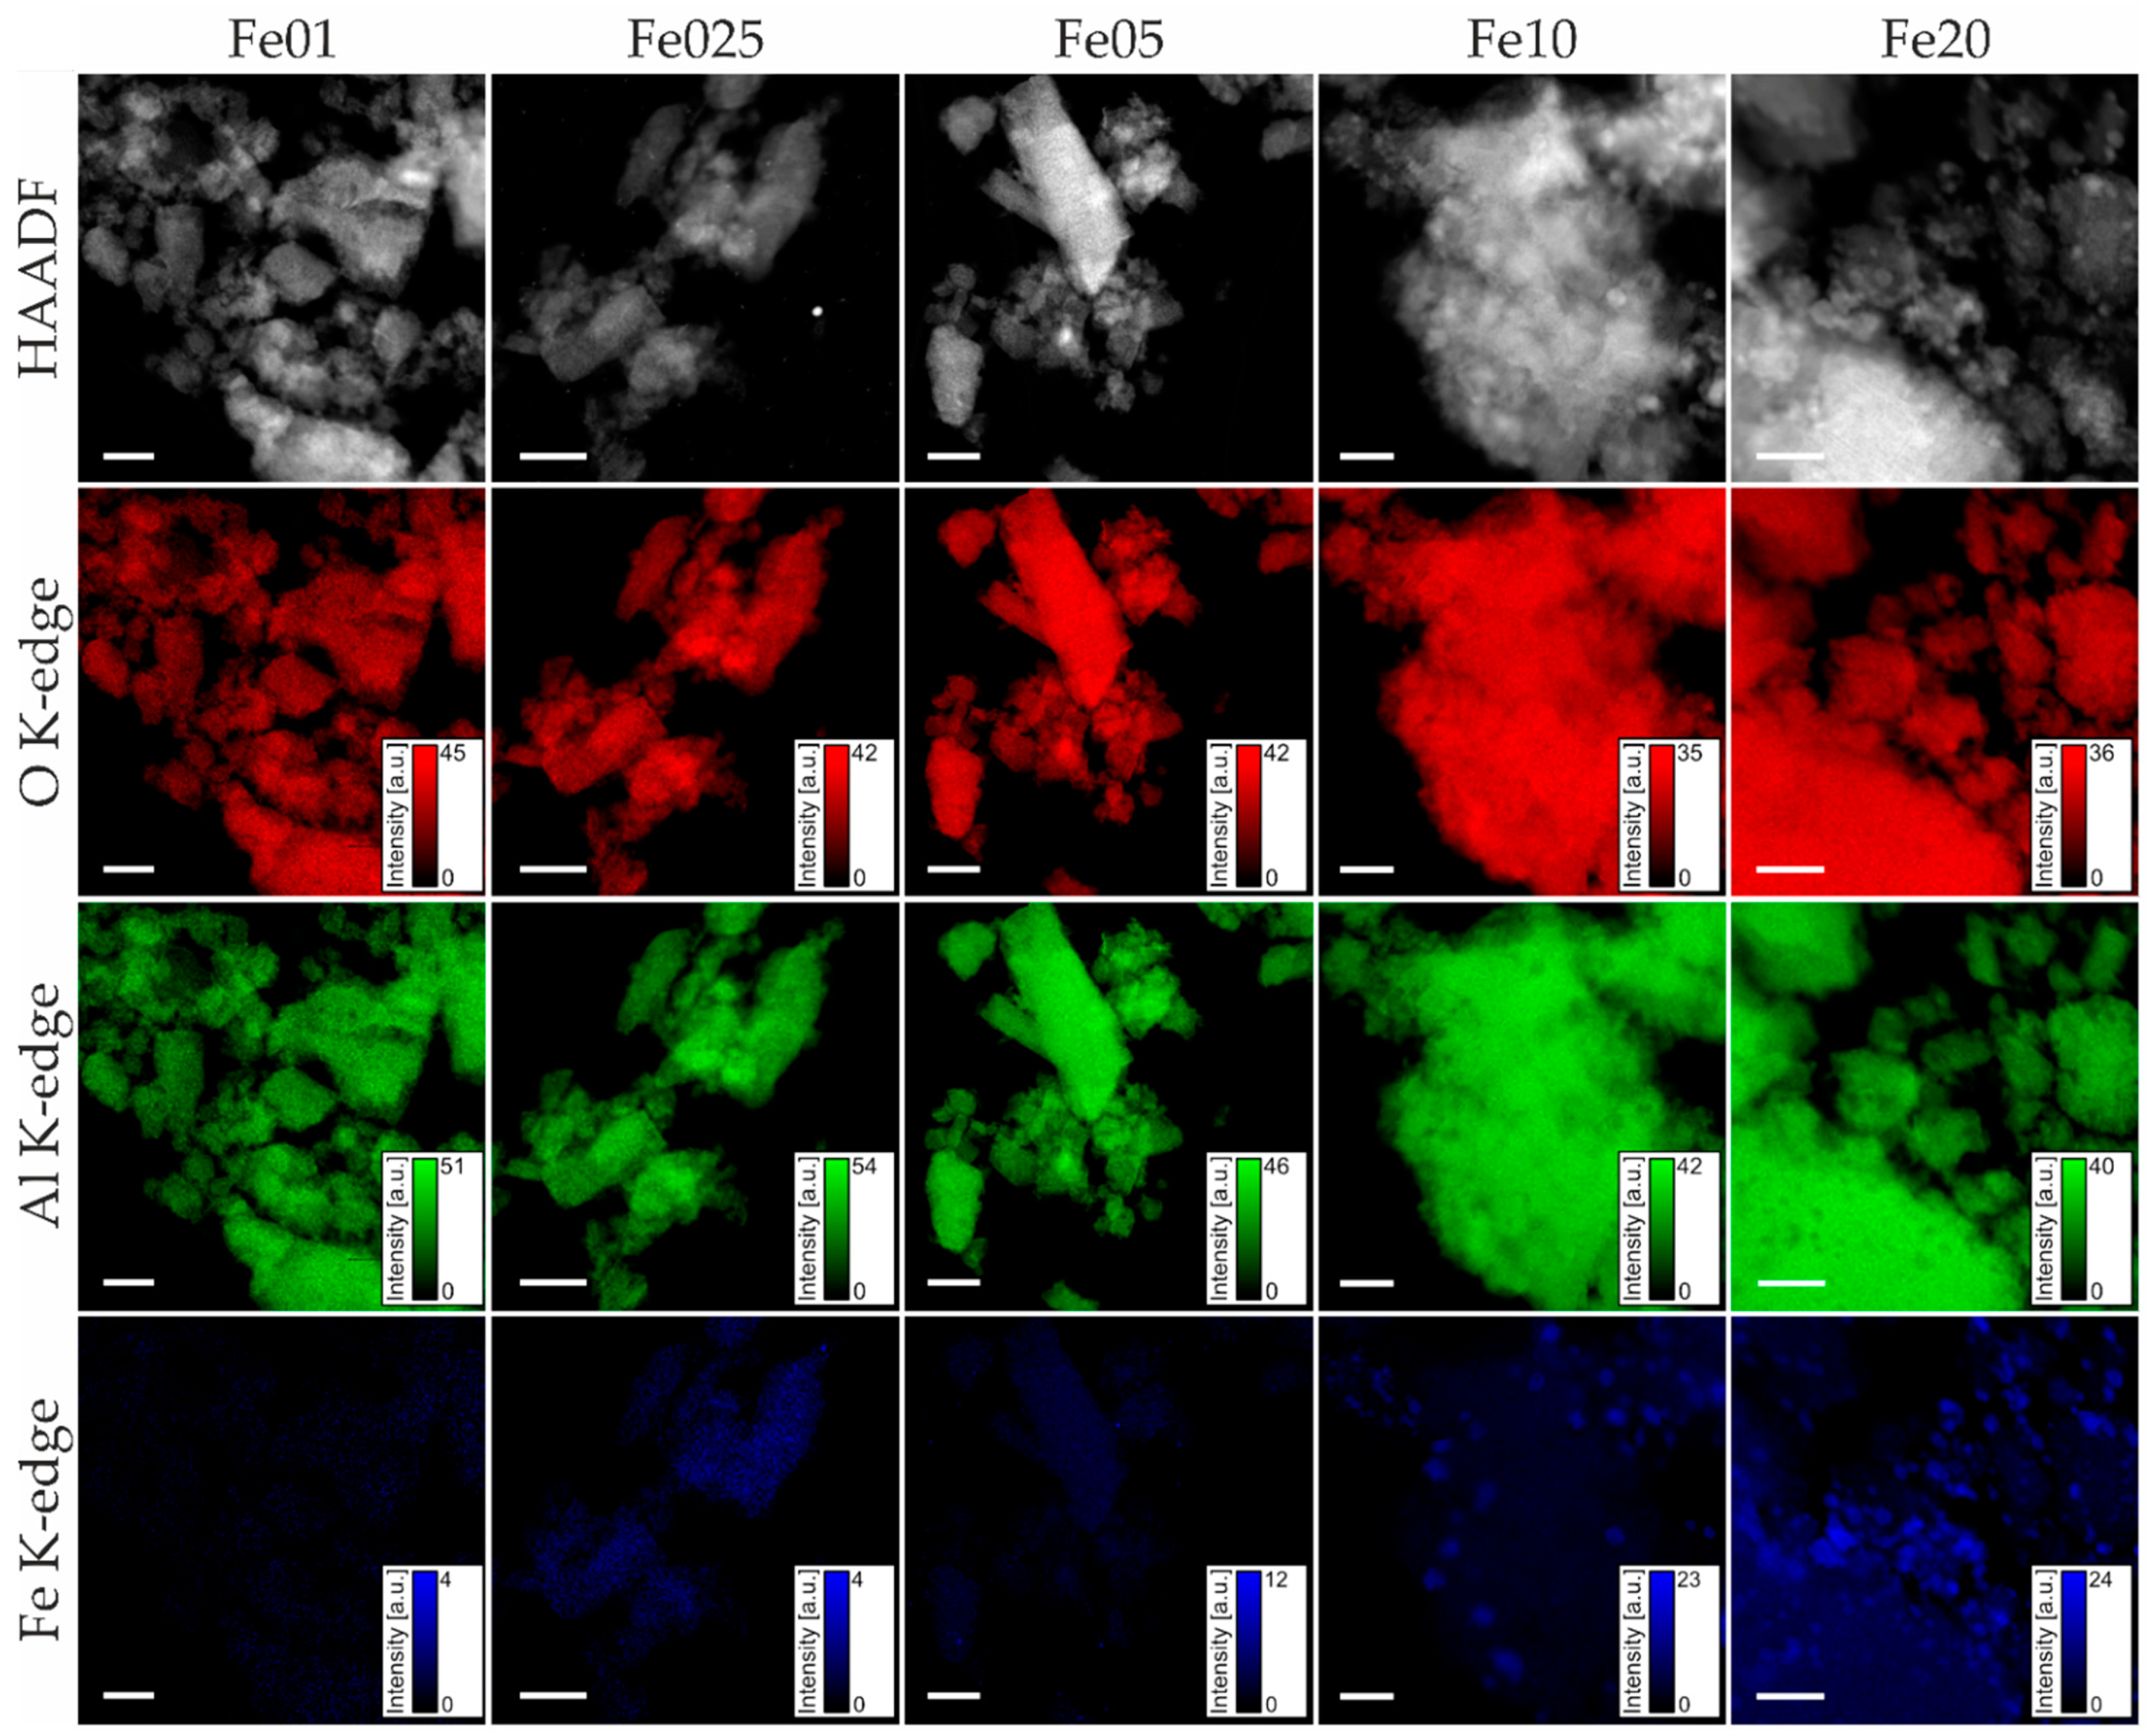
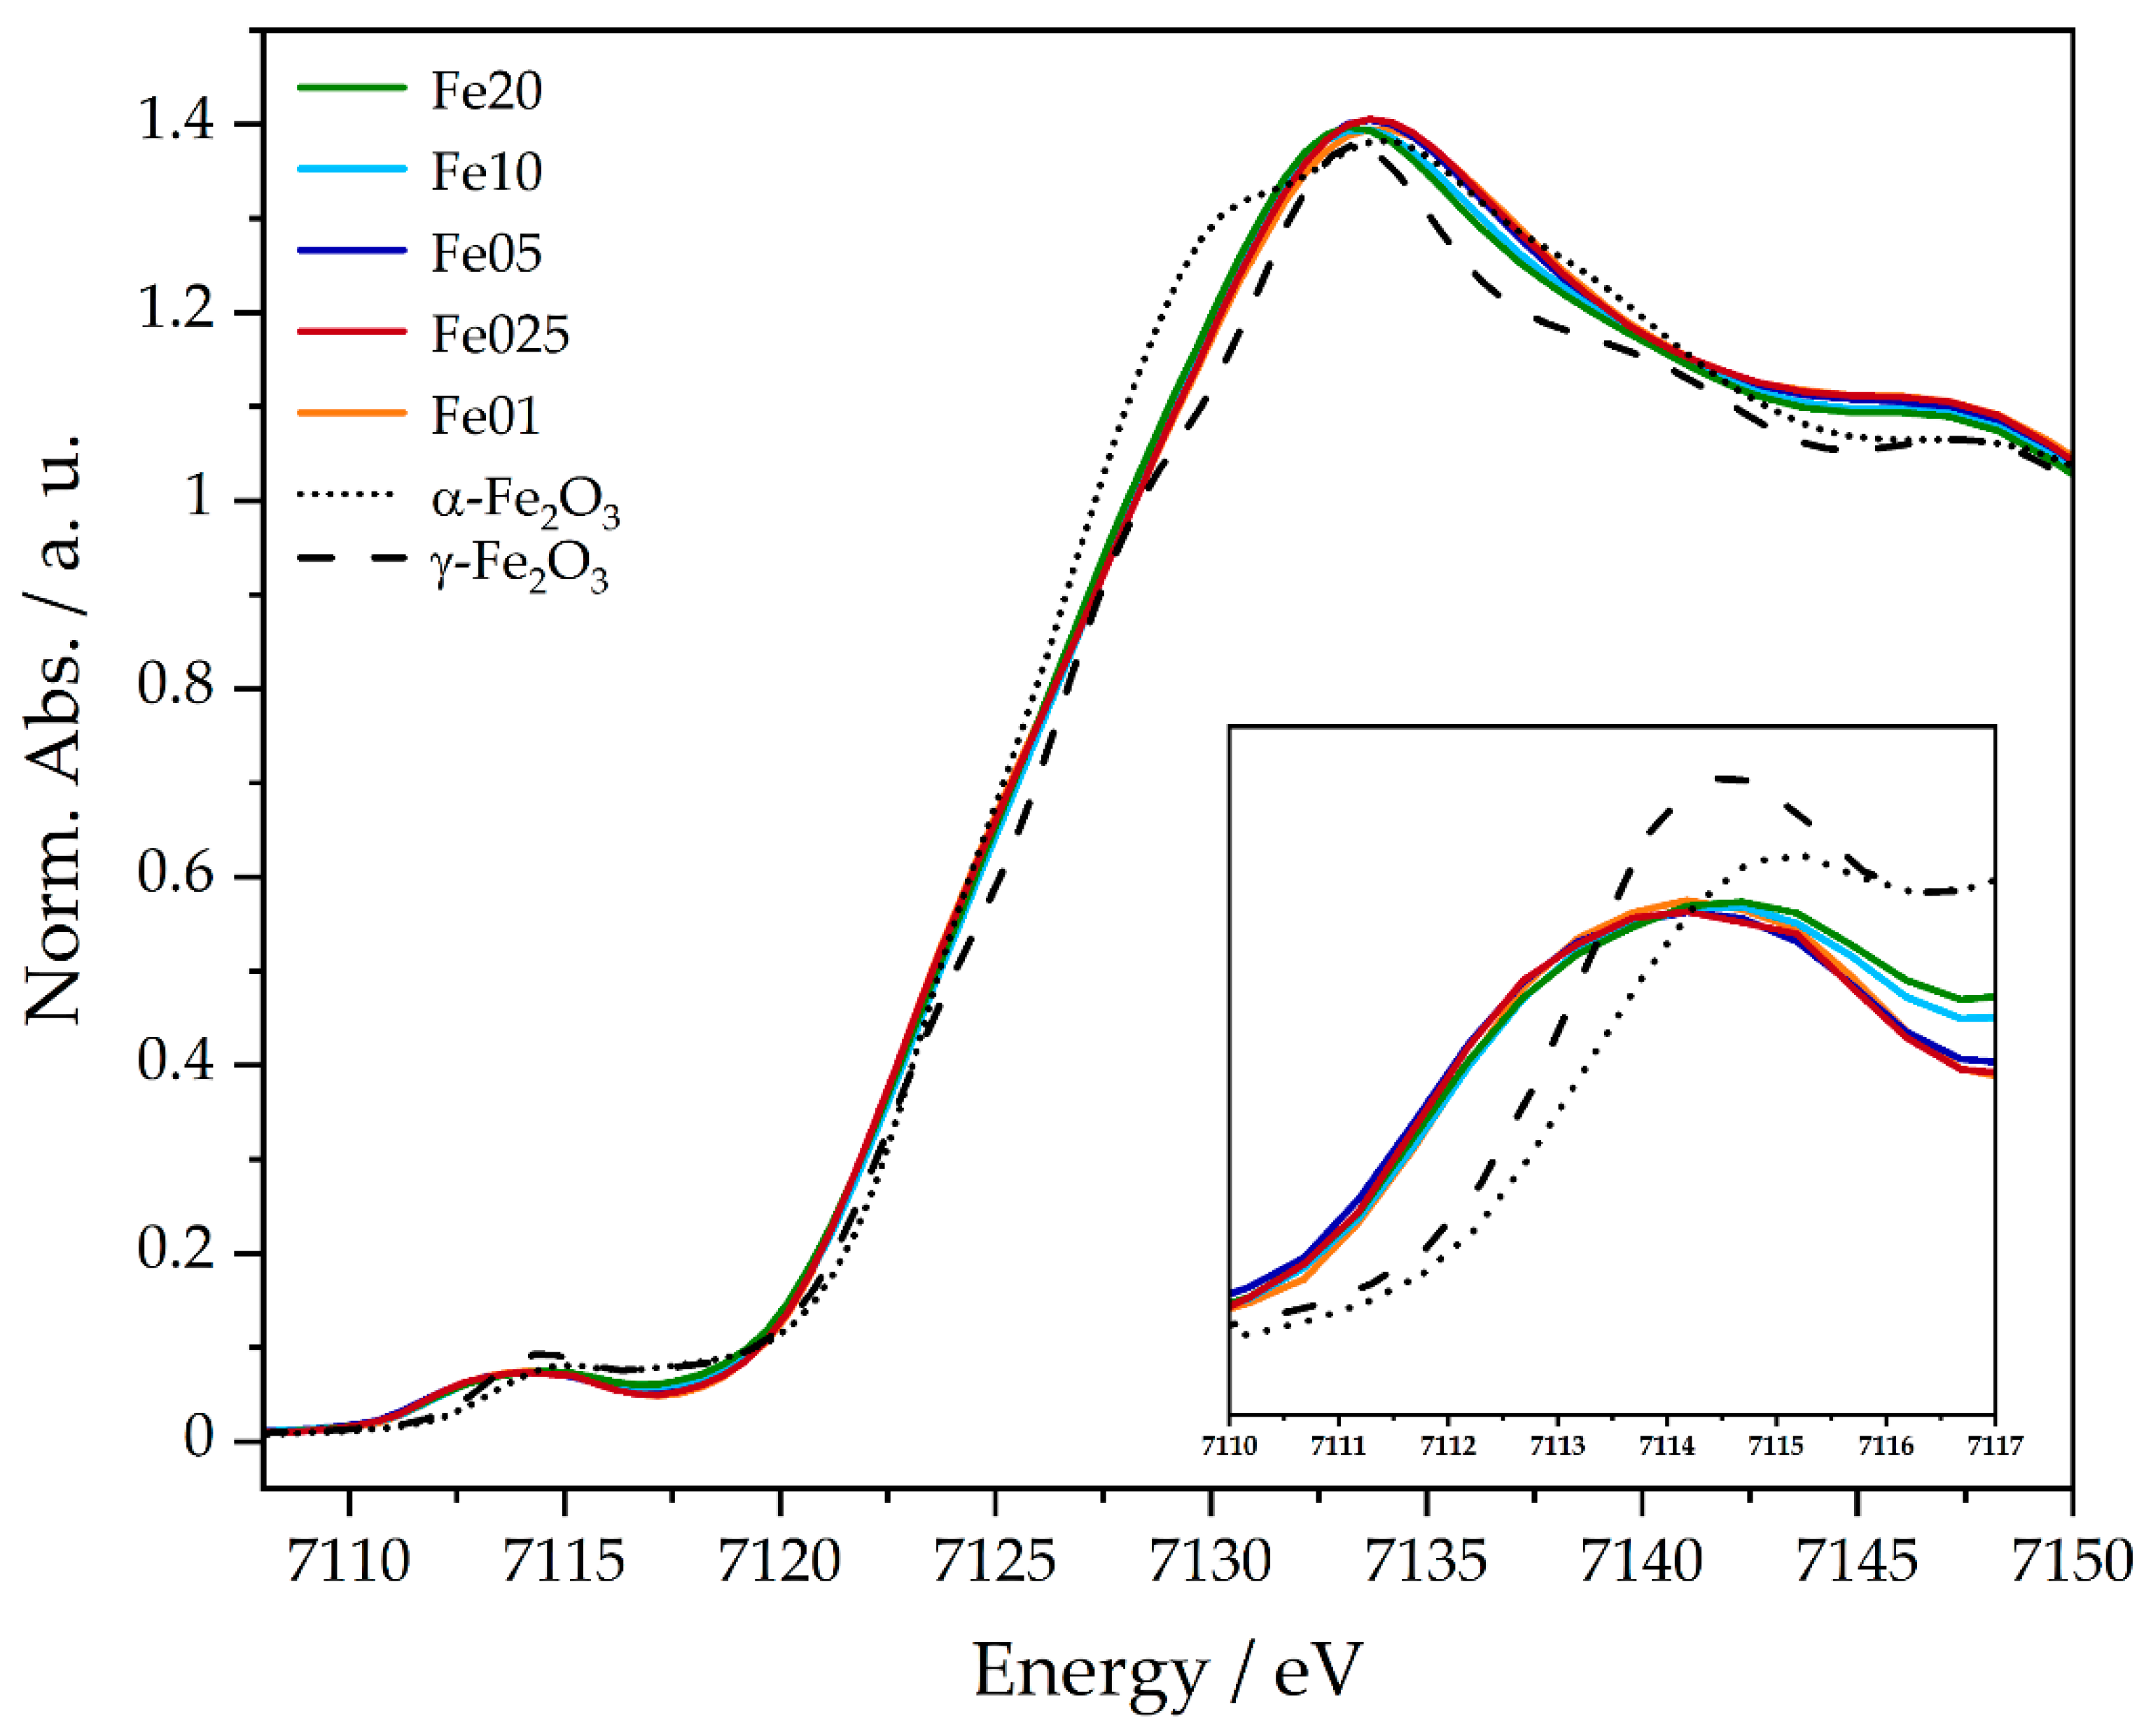
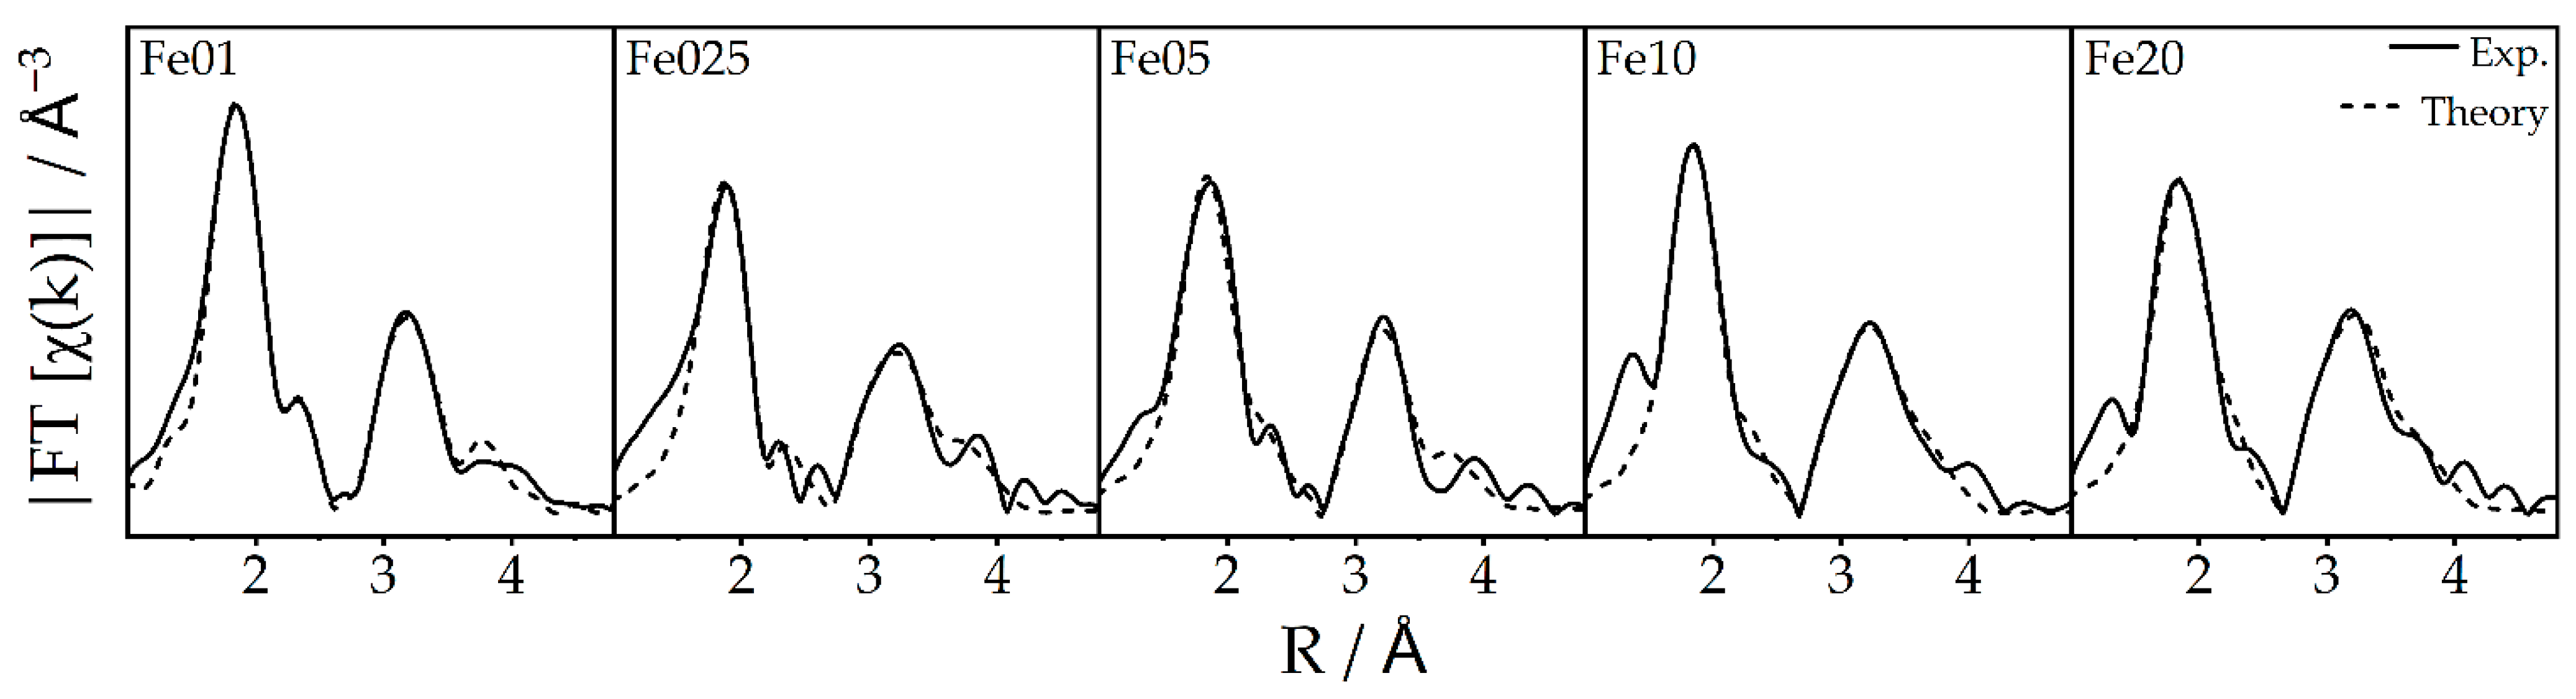
2.1. Structural Characterization
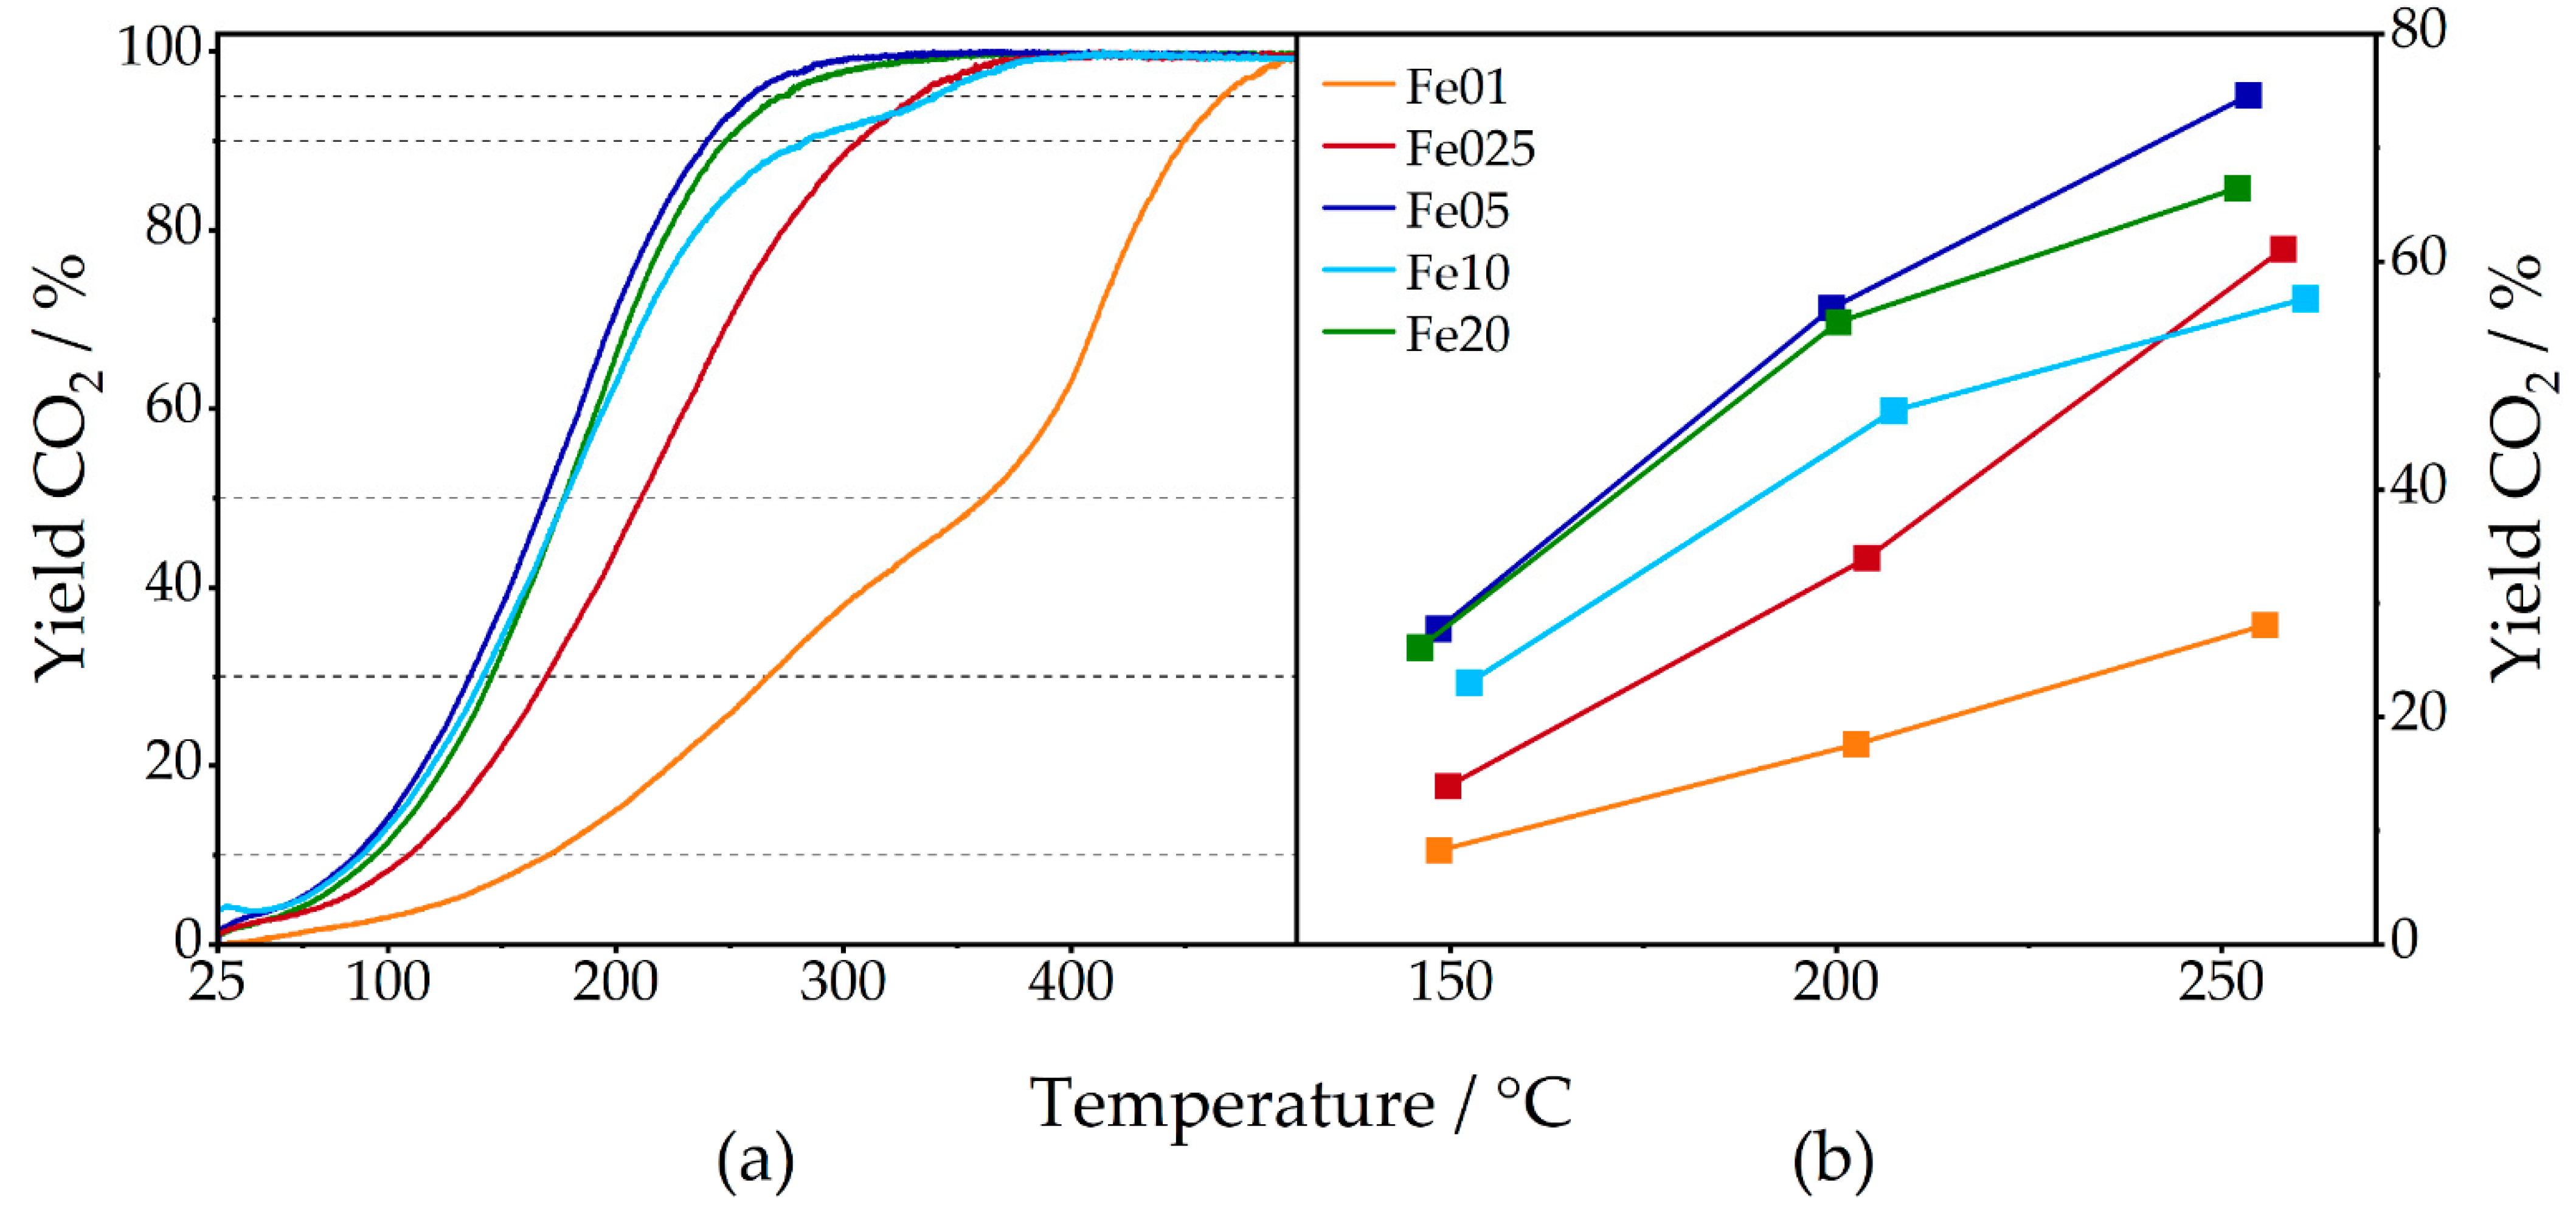
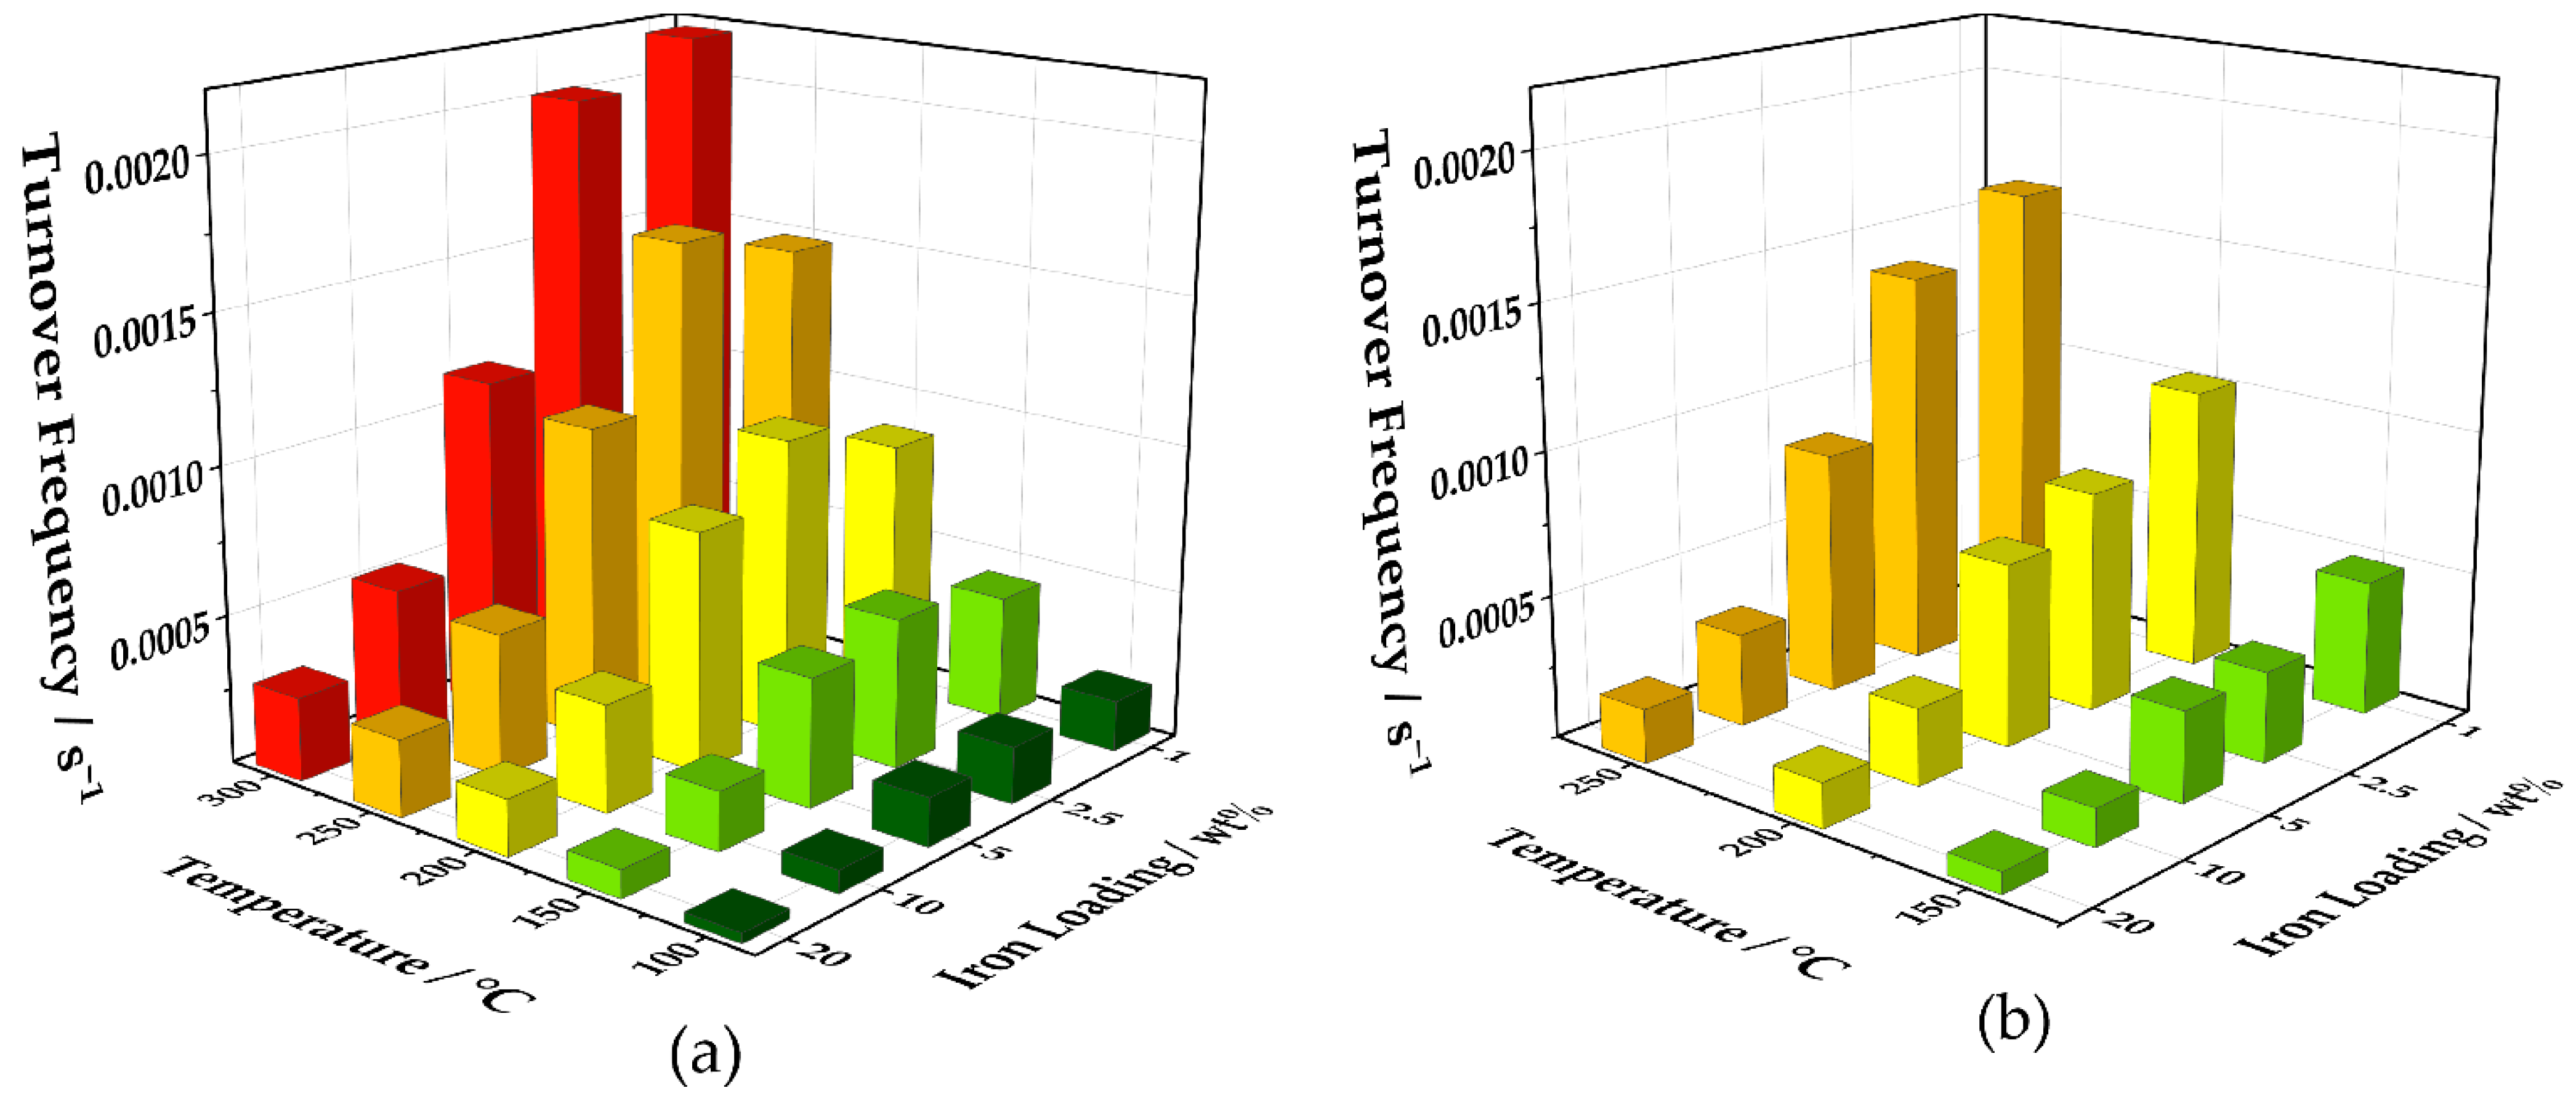
2.2. Catalytic Activity
3. Summary and Conclusions
4. Experimental Methodology
4.1. Preparation of γ-Al2O3
4.2. Preparation of Catalysts Fe01 to Fe20
4.3. Catalytic Experiments
4.4. Analytics
Supplementary Materials
Author Contributions
Funding
Data Availability Statement
Acknowledgments
Conflicts of Interest
References
- World Health Organization (WHO-Team: Air Quality and Health). Air Pollution Data Portal; Geneva, Switzerland, 2022. Available online: https://www.who.int/data/gho/data/themes/air-pollution/who-air-quality-database (accessed on 16 June 2022).
- Stabile, L.; Massimo, A.; Rizza, V.; D’Apuzzo, M.; Evangelisti, A.; Scungio, M.; Frattolillo, A.; Cortellessa, G.; Buonanno, G. A novel approach to evaluate the lung cancer risk of airborne particles emitted in a city. Sci. Total Environ. 2019, 656, 1032–1042. [Google Scholar] [CrossRef] [PubMed]
- Yim, S.H.L.; Lee, G.L.; Lee, I.H.; Allroggen, F.; Ashok, A.; Caiazzo, F.; Eastham, S.D.; Malina, R.; Barrett, S.R.H. Global, regional and local health impacts of civil aviation emissions. Environ. Res. Lett. 2015, 10, 34001. [Google Scholar] [CrossRef] [Green Version]
- Royal College of Physicians. Every Breath We Take: The Lifelong Impact of Air Pollution. Report of a Working Party; RCP: London, UK, 2016. [Google Scholar]
- Jing, H.-Y.; Wen, T.; Fan, C.-M.; Gao, G.-Q.; Zhong, S.-L.; Xu, A.-W. Efficient adsorption/photodegradation of organic pollutants from aqueous systems using Cu2O nanocrystals as a novel integrated photocatalytic adsorbent. J. Mater. Chem. A 2014, 2, 14563. [Google Scholar] [CrossRef]
- Carbajo, J.; Bahamonde, A.; Faraldos, M. Photocatalyst performance in wastewater treatment applications: Towards the role of TiO2 properties. Mol. Catal. 2017, 434, 167–174. [Google Scholar] [CrossRef]
- Yahya, N.; Aziz, F.; Jamaludin, N.A.; Mutalib, M.A.; Ismail, A.F.; Salleh, W.N.W.; Jaafar, J.; Yusof, N.; Ludin, N.A. A review of integrated photocatalyst adsorbents for wastewater treatment. J. Environ. Chem. Eng. 2018, 6, 7411–7425. [Google Scholar] [CrossRef]
- van Setten, B.A.A.L.; Makkee, M.; Moulijn, J.A. Science and technology of catalytic diesel particulate filters. Catal. Rev. 2001, 43, 489–564. [Google Scholar] [CrossRef]
- Fino, D. Diesel emission control: Catalytic filters for particulate removal. Sci. Technol. Adv. Mater. 2007, 8, 93–100. [Google Scholar] [CrossRef]
- Balle, P.; Geiger, B.; Klukowski, D.; Pignatelli, M.; Wohnrau, S.; Menzel, M.; Zirkwa, I.; Brunklaus, G.; Kureti, S. Study of the selective catalytic reduction of NOx on an efficient Fe/HBEA zeolite catalyst for heavy duty diesel engines. Appl. Catal. B Environ. 2009, 91, 587–595. [Google Scholar] [CrossRef]
- Forzatti, P.; Lietti, L.; Nova, I.; Tronconi, E. Diesel NOx aftertreatment catalytic technologies: Analogies in LNT and SCR catalytic chemistry. Catal. Today 2010, 151, 202–211. [Google Scholar] [CrossRef]
- Kompio, P.G.; Brückner, A.; Hipler, F.; Auer, G.; Löffler, E.; Grünert, W. A new view on the relations between tungsten and vanadium in V2O5/WO3/TiO2 catalysts for the selective reduction of NO with NH3. J. Catal. 2012, 286, 237–247. [Google Scholar] [CrossRef]
- Goldbach, M.; Roppertz, A.; Langenfeld, P.; Wackerhagen, M.; Füger, S.; Kureti, S. Urea Decomposition in Selective Catalytic Reduction on V2O5/WO3/TiO2 Catalyst in Diesel Exhaust. Chem. Eng. Technol. 2017, 40, 2035–2043. [Google Scholar] [CrossRef]
- Twigg, M.V. Catalytic control of emissions from cars. Catal. Today 2011, 163, 33–41. [Google Scholar] [CrossRef]
- Wang, J.; Chen, H.; Hu, Z.; Yao, M.; Li, Y. A Review on the Pd-Based Three-Way Catalyst. Catal. Rev. 2015, 57, 79–144. [Google Scholar] [CrossRef]
- Lambert, C.K. Current state of the art and future needs for automotive exhaust catalysis. Nat. Catal. 2019, 2, 554–557. [Google Scholar] [CrossRef]
- Rood, S.; Eslava, S.; Manigrasso, A.; Bannister, C. Recent advances in gasoline three-way catalyst formulation: A review. Proc. Inst. Mech. Eng. D J. Automot. Eng. 2020, 234, 936–949. [Google Scholar] [CrossRef]
- Jasiński, D.; Meredith, J.; Kirwan, K. The life cycle impact for platinum group metals and lithium to 2070 via surplus cost potential. Int. J. Life Cycle Assess. 2018, 23, 773–786. [Google Scholar] [CrossRef] [Green Version]
- Glaister, B.J.; Mudd, G.M. The environmental costs of platinum–PGM mining and sustainability: Is the glass half-full or half-empty? Miner. Eng. 2010, 23, 438–450. [Google Scholar] [CrossRef]
- Glisenti, A.; Pacella, M.; Guiotto, M.; Natile, M.M.; Canu, P. Largely Cu-doped LaCo1−CuO3 perovskites for TWC: Toward new PGM-free catalysts. Appl. Catal. B Environ. 2016, 180, 94–105. [Google Scholar] [CrossRef]
- Pacella, M.; Garbujo, A.; Fabro, J.; Guiotto, M.; Xin, Q.; Natile, M.M.; Canu, P.; Cool, P.; Glisenti, A. PGM-free CuO/LaCoO3 nanocomposites: New opportunities for TWC application. Appl. Catal. B Environ. 2018, 227, 446–458. [Google Scholar] [CrossRef]
- Heck, R.M.; Farrauto, R.J.; Gulati, S.T. Catalytic Air Pollution Control: Commercial Technology, 2nd ed.; Wiley-Interscience: New York, NY, USA, 2002; ISBN 0471436240. [Google Scholar]
- Royer, S.; Duprez, D. Catalytic Oxidation of Carbon Monoxide over Transition Metal Oxides. ChemCatChem 2011, 3, 24–65. [Google Scholar] [CrossRef]
- Yi, Y.; Zhang, P.; Qin, Z.; Yu, C.; Li, W.; Qin, Q.; Li, B.; Fan, M.; Liang, X.; Dong, L. Low temperature CO oxidation catalysed by flower-like Ni–Co–O: How physicochemical properties influence catalytic performance. RSC Adv. 2018, 8, 7110–7122. [Google Scholar] [CrossRef] [PubMed] [Green Version]
- Cao, J.-L.; Wang, Y.; Yu, X.-L.; Wang, S.-R.; Wu, S.-H.; Yuan, Z.-Y. Mesoporous CuO–Fe2O3 composite catalysts for low-temperature carbon monoxide oxidation. Appl. Catal. B Environ. 2008, 79, 26–34. [Google Scholar] [CrossRef]
- Cui, Y.; Xu, L.; Chen, M.; Lv, C.; Lian, X.; Wu, C.; Yang, B.; Miao, Z.; Wang, F.; Hu, X. CO Oxidation over Metal Oxide (La2O3, Fe2O3, PrO2, Sm2O3, and MnO2) Doped CuO-Based Catalysts Supported on Mesoporous Ce0.8Zr0.2O2 with Intensified Low-Temperature Activity. Catalysts 2019, 9, 724. [Google Scholar] [CrossRef] [Green Version]
- Yao, Y.-F.Y. The oxidation of hydrocarbons and CO over metal oxides: III. Co3O4. J. Catal. 1974, 33, 108–122. [Google Scholar] [CrossRef]
- Yao, Y.-F.Y. A study of high temperature treated supported metal oxide catalysts. J. Catal. 1977, 46, 388–401. [Google Scholar] [CrossRef]
- Ye, J.; Liu, C. Cu3(BTC)2: CO oxidation over MOF based catalysts. Chem. Commun. 2011, 47, 2167–2169. [Google Scholar] [CrossRef]
- Kummer, J.T. Oxidation of CO and C2H4 by Base Metal Catalysts Prepared on Honeycomb Supports. In Catalysts for the Control of Automotive Pollutants; McEvoy, J.E., Ed.; American Chemical Society: Washington, DC, USA, 1975; pp. 178–192. ISBN 0-8412-0219-2. [Google Scholar]
- Hofer, L.J.E.; Gussey, P.; Anderson, R.B. Specificity of catalysts for the oxidation of carbon monoxide-ethylene mixtures. J. Catal. 1964, 3, 451–460. [Google Scholar] [CrossRef]
- Yao, Y.-F.Y. The oxidation of CO and C2H4 over metal oxides V. SO2 effects. J. Catal. 1975, 39, 104–114. [Google Scholar] [CrossRef]
- Walker, J.S.; Straguzzi, G.I.; Manogue, W.H.; Schuit, G.C.A. Carbon monoxide and propene oxidation by iron oxides for auto-emission control. J. Catal. 1988, 110, 298–309. [Google Scholar] [CrossRef]
- Li, P.; Miser, D.E.; Rabiei, S.; Yadav, R.T.; Hajaligol, M.R. The removal of carbon monoxide by iron oxide nanoparticles. Appl. Catal. B Environ. 2003, 43, 151–162. [Google Scholar] [CrossRef]
- Lin, H.-Y.; Chen, Y.-W.; Wang, W.-J. Preparation of nanosized iron oxide and its application in low temperature CO oxidation. J. Nanopart. Res. 2005, 7, 249–263. [Google Scholar] [CrossRef]
- Szegedi, A.; Hegedus, M.; Margitfalvi, J.L.; Kiricsi, I. Low temperature CO oxidation over iron-containing MCM-41 catalysts. Chem. Commun. 2005, 11, 1441–1443. [Google Scholar] [CrossRef] [PubMed]
- Carriazo, J.G.; Centeno, M.A.; Odriozola, J.A.; Moreno, S.; Molina, R. Effect of Fe and Ce on Al-pillared bentonite and their performance in catalytic oxidation reactions. Appl. Catal. A Gen. 2007, 317, 120–128. [Google Scholar] [CrossRef]
- Abdel Halim, K.S.; Khedr, M.H.; Nasr, M.I.; El-Mansy, A.M. Factors affecting CO oxidation over nanosized Fe2O3. Mater. Res. Bull. 2007, 42, 731–741. [Google Scholar] [CrossRef]
- Kandalam, A.K.; Chatterjee, B.; Khanna, S.N.; Rao, B.K.; Jena, P.; Reddy, B.V. Oxidation of CO on Fe2O3 model surfaces. Surf. Sci. 2007, 601, 4873–4880. [Google Scholar] [CrossRef]
- Wagloehner, S.; Reichert, D.; Leon-Sorzano, D.; Balle, P.; Geiger, B.; Kureti, S. Kinetic modeling of the oxidation of CO on Fe2O3 catalyst in excess of O2. J. Catal. 2008, 260, 305–314. [Google Scholar] [CrossRef]
- Laguna, O.H.; Centeno, M.A.; Boutonnet, M.; Odriozola, J.A. Fe-doped ceria solids synthesized by the microemulsion method for CO oxidation reactions. Appl. Catal. B Environ. 2011, 106, 621–629. [Google Scholar] [CrossRef] [Green Version]
- Boubnov, A.; Roppertz, A.; Kundrat, M.D.; Mangold, S.; Reznik, B.; Jacob, C.R.; Kureti, S.; Grunwaldt, J.-D. Towards advanced structural analysis of iron oxide clusters on the surface of γ-Al2O3 using EXAFS. Appl. Surf. Sci. 2016, 386, 234–246. [Google Scholar] [CrossRef]
- Schoch, R.; Huang, H.; Schünemann, V.; Bauer, M. A new iron-based carbon monoxide oxidation catalyst: Structure-activity correlation. Chemphyschem 2014, 15, 3768–3775. [Google Scholar] [CrossRef]
- Billinge, S.J.L.; Levin, I. The problem with determining atomic structure at the nanoscale. Science 2007, 316, 561–565. [Google Scholar] [CrossRef] [Green Version]
- Chupas, P.J.; Chapman, K.W.; Chen, H.; Grey, C.P. Application of high-energy X-rays and Pair-Distribution-Function analysis to nano-scale structural studies in catalysis. Catal. Today 2009, 145, 213–219. [Google Scholar] [CrossRef]
- Prinz, N.; Schwensow, L.; Wendholt, S.; Jentys, A.; Bauer, M.; Kleist, W.; Zobel, M. Hard X-ray-based techniques for structural investigations of CO2 methanation catalysts prepared by MOF decomposition. Nanoscale 2020, 12, 15800–15813. [Google Scholar] [CrossRef]
- Blake, R.L.; Hessevick, R.E. Refinement of the hematite structure. Am. Mineral. 1966, 51, 123–129. [Google Scholar]
- Greaves, C. A powder neutron diffraction investigation of vacancy ordering and covalence in γ-Fe2O3. J. Solid State Chem. 1983, 49, 325–333. [Google Scholar] [CrossRef]
- Gutiérrez, G.; Taga, A.; Johansson, B. Theoretical structure determination of γ−Al2O3. Phys. Rev. B 2001, 65, 012101. [Google Scholar] [CrossRef]
- Smrcok, L.; Langer, V.; Krestan, J. Gamma-alumina: A single-crystal X-ray diffraction study. Acta Crystallogr. Sect. C Cryst. Struct. Commun. 2006, 62, i83–i84. [Google Scholar] [CrossRef]
- Bolt, P.H.; Habraken, F.; Geus, J.W. Formation of Nickel, Cobalt, Copper, and Iron Aluminates fromα- andγ-Alumina-Supported Oxides: A Comparative Study. J. Solid State Chem. 1998, 135, 59–69. [Google Scholar] [CrossRef] [Green Version]
- Paglia, G.; Božin, E.S.; Billinge, S.J.L. Fine-Scale Nanostructure in γ-Al2O3. Chem. Mater. 2006, 18, 3242–3248. [Google Scholar] [CrossRef]
- Kündig, W.; Bömmel, H.; Constabaris, G.; Lindquist, R.H. Some Properties of Supported Small α−Fe2O3 Particles Determined with the Mössbauer Effect. Phys. Rev. 1966, 142, 327–333. [Google Scholar] [CrossRef]
- Pérez-Ramírez, J.; Groen, J.C.; Brückner, A.; Kumar, M.; Bentrup, U.; Debbagh, M.N.; Villaescusa, L. Evolution of isomorphously substituted iron zeolites during activation: Comparison of Fe-beta and Fe-ZSM-5. J. Catal. 2005, 232, 318–334. [Google Scholar] [CrossRef]
- Pérez-Ramírez, J.; Gallardo-Llamas, A. Framework composition effects on the performance of steam-activated FeMFI zeolites in the N2O-mediated propane oxidative dehydrogenation to propylene. J. Phys. Chem. B 2005, 109, 20529–20538. [Google Scholar] [CrossRef]
- Hensen, E.; Zhu, Q.; Hendrix, M.; Overweg, A.R.; Kooyman, P.J.; Sychev, M.V.; van Santen, R.A. Effect of high-temperature treatment on Fe/ZSM-5 prepared by chemical vapor deposition of FeCl3I. Physicochemical characterization. J. Catal. 2004, 221, 560–574. [Google Scholar] [CrossRef]
- Schwidder, M.; Kumar, M.S.; Klementiev, K.; Pohl, M.; Brückner, A.; Grünert, W. Selective reduction of NO with Fe-ZSM-5 catalysts of low Fe contentI. Relations between active site structure and catalytic performance. J. Catal. 2005, 231, 314–330. [Google Scholar] [CrossRef]
- Kumar, M.S.; Schwidder, M.; Grünert, W.; Brückner, A. On the nature of different iron sites and their catalytic role in Fe-ZSM-5 DeNOx catalysts: New insights by a combined EPR and UV/VIS spectroscopic approach. J. Catal. 2004, 227, 384–397. [Google Scholar] [CrossRef]
- Pérez-Ramírez, J.; Kumar, M.S.; Brückner, A. Reduction of N2O with CO over FeMFI zeolites: Influence of the preparation method on the iron species and catalytic behavior. J. Catal. 2004, 223, 13–27. [Google Scholar] [CrossRef]
- Janas, J.; Gurgul, J.; Socha, R.P.; Shishido, T.; Che, M.; Dzwigaj, S. Selective catalytic reduction of NO by ethanol: Speciation of iron and “structure–properties” relationship in FeSiBEA zeolite. Appl. Catal. B Environ. 2009, 91, 113–122. [Google Scholar] [CrossRef]
- Supplit, R.; Hüsing, N.; Bertagnolli, H.; Bauer, M.; Kessler, V.; Seisenbaeva, G.A.; Bernstorff, S.; Gross, S. Synthesis and characterization of orthorhombic, 2d-centered rectangular and lamellar iron oxide doped silica films. J. Mater. Chem. 2006, 16, 4443–4453. [Google Scholar] [CrossRef]
- Bauer, M.; Gastl, C. X-ray absorption in homogeneous catalysis research: The iron-catalyzed Michael addition reaction by XAS, RIXS and multi-dimensional spectroscopy. Phys. Chem. Chem. Phys. 2010, 12, 5575–5584. [Google Scholar] [CrossRef]
- Dehe, D.; Wang, L.; Müller, M.K.; Dörr, G.; Zhou, Z.; Klupp-Taylor, R.N.; Sun, Y.; Ernst, S.; Hartmann, M.; Bauer, M.; et al. A Rhodium Triphenylphosphine Catalyst for Alkene Hydrogenation Supported on Neat Superparamagnetic Iron Oxide Nanoparticles. ChemCatChem 2015, 7, 127–136. [Google Scholar] [CrossRef]
- Schoch, R.; Bauer, M. Pollution Control Meets Sustainability: Structure-Activity Studies on New Iron Oxide-Based CO Oxidation Catalysts. ChemSusChem 2016, 9, 1996–2004. [Google Scholar] [CrossRef]
- Cheng, K.; Zhao, S.; Ren, J.; Li, H.; Chen, Y. CO2 Self-Poisoning and Its Mitigation in CuO Catalyzed CO Oxidation: Determining and Speeding up the Rate-Determining Step. Catalysts 2021, 11, 654. [Google Scholar] [CrossRef]
- Heiney, P. Datasqueeze; University of Philadelphia: Philadelphia, PA, USA, 2018. [Google Scholar]
- Gunnlaugsson, H.P. Spreadsheet based analysis of Mössbauer spectra. Hyperfine Interact. 2016, 237, 79. [Google Scholar] [CrossRef]
- WinNormos; WissEl GmbH: Ortenberg, Germany, 2008.
- Origin 2020b; Origin Lab Corporation: Northampton, MA, USA, 2020.
- Pennycook, S.J.; Nellist, P.D. (Eds.) Scanning Transmission Electron Microscopy: Imaging and Analysis; Springer Science + Business Media LLC.: New York, NY, USA, 2011; ISBN 9781441972002. [Google Scholar]
- Tanaka, N. Scanning Transmission Electron Microscopy of Nanomaterials: Basics of Imaging and Analysis; Imperial College Press: London, UK, 2015; ISBN 9781848167896. [Google Scholar]
- Newville, M.; Līviņš, P.; Yacoby, S.Y.; Rehr, J.J.; Stern, E.A. Near-edge x-ray-absorption fine structure of Pb: A comparison of theory and experiment. Phys. Rev. B 1993, 47, 14126–14131. [Google Scholar] [CrossRef]
- Ertel, T.S.; Bertagnolli, H.; Hückmann, S.; Kolb, U.; Peter, D. XAFS Spectroscopy of Liquid and Amorphous Systems: Presentation and Verification of a Newly Developed Program Package. Appl. Spectrosc. 1992, 46, 690–698. [Google Scholar] [CrossRef]
- Binsted, N. EXCURV98—The Manual, CLRC Daresbury Lab. Program. In High-Performance Computing; Daresbury Laboratory: Halton, GB, USA, 1998. [Google Scholar]
- Filik, J.; Ashton, A.W.; Chang, P.C.Y.; Chater, P.A.; Day, S.J.; Drakopoulos, M.; Gerring, M.W.; Hart, M.L.; Magdysyuk, O.V.; Michalik, S.; et al. Processing two-dimensional X-ray diffraction and small-angle scattering data in DAWN 2. J. Appl. Crystallogr. 2017, 50, 959–966. [Google Scholar] [CrossRef] [Green Version]
- Thomae, S.L.J.; Prinz, N.; Hartmann, T.; Teck, M.; Correll, S.; Zobel, M. Pushing data quality for laboratory pair distribution function experiments. Rev. Sci. Instrum. 2019, 90, 43905. [Google Scholar] [CrossRef]
- Yang, X.; Juhas, P.; Farrow, C.L.; Billinge, S.J.L. xPDFsuite: An End-to-End Software Solution for High Throughput Pair Distribution Function Transformation, Visualization and Analysis. 2014. Available online: https://arxiv.org/pdf/1402.3163 (accessed on 16 June 2022).
- Juhás, P.; Farrow, C.L.; Yang, X.; Knox, K.R.; Billinge, S.J.L. Complex modeling: A strategy and software program for combining multiple information sources to solve ill posed structure and nanostructure inverse problems. Acta Crystallogr. Sect. A Found. Adv. 2015, 71, 562–568. [Google Scholar] [CrossRef]
- Jeong, I.-K.; Heffner, R.H.; Graf, M.J.; Billinge, S.J.L. Lattice dynamics and correlated atomic motion from the atomic pair distribution function. Phys. Rev. B 2003, 67, 104301. [Google Scholar] [CrossRef] [Green Version]
- Shmakov, A.N.; Kryukova, G.N.; Tsybulya, S.V.; Chuvilin, A.L.; Solovyeva, L.P. Vacancy Ordering in γ-Fe2O3: Synchrotron X-ray Powder Diffraction and High-Resolution Electron Microscopy Studies. J. Appl. Crystallogr. 1995, 28, 141–145. [Google Scholar] [CrossRef] [Green Version]
- Macrae, C.F.; Sovago, I.; Cottrell, S.J.; Galek, P.T.A.; McCabe, P.; Pidcock, E.; Platings, M.; Shields, G.P.; Stevens, J.S.; Towler, M.; et al. Mercury 4.0: From visualization to analysis, design and prediction. J. Appl. Crystallogr. 2020, 53, 226–235. [Google Scholar] [CrossRef] [Green Version]


| Sample | BET Surface [m2/g] |
|---|---|
| γ-Al2O3 | 169 |
| Fe01 | 155 |
| Fe025 | 164 |
| Fe05 | 167 |
| Fe10 | 152 |
| Fe20 | 121 |
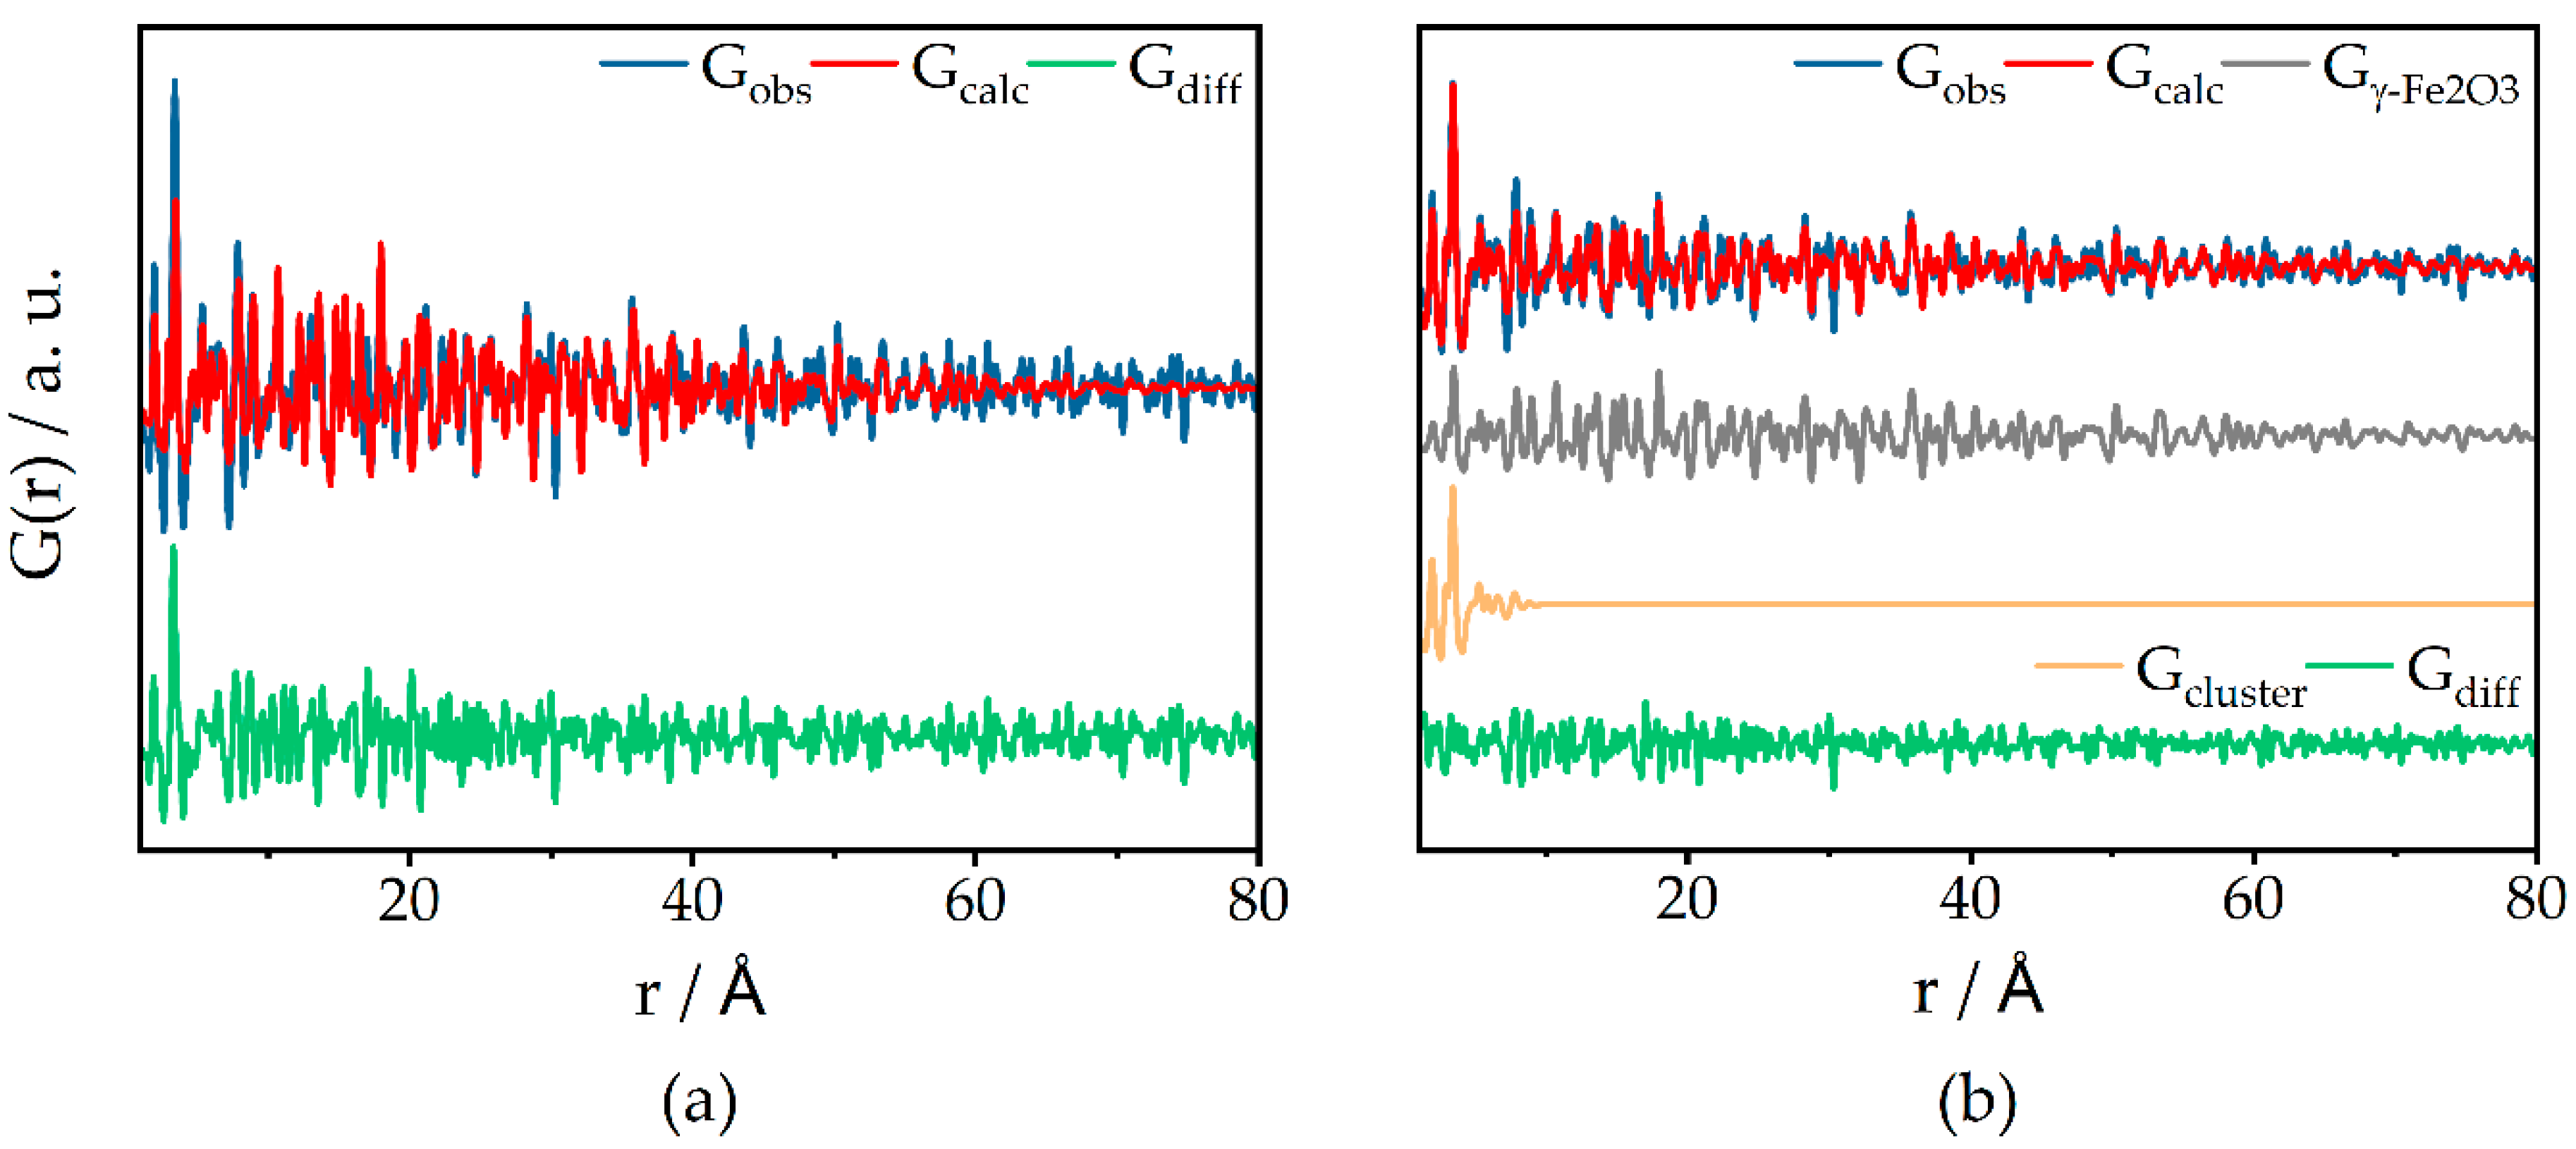
| Refined Value | Fe05 | Fe10 | Fe20 |
|---|---|---|---|
| a(γ-Al2O3) [Å] | 7.935 | 7.949 | 7.962 |
| a(γ-Fe2O3) [Å] | 8.025 | 8.062 | 8.327 |
| Spherical particle size (Fe2O3) [nm] | 2.2 | 2.9 | 8.5 |
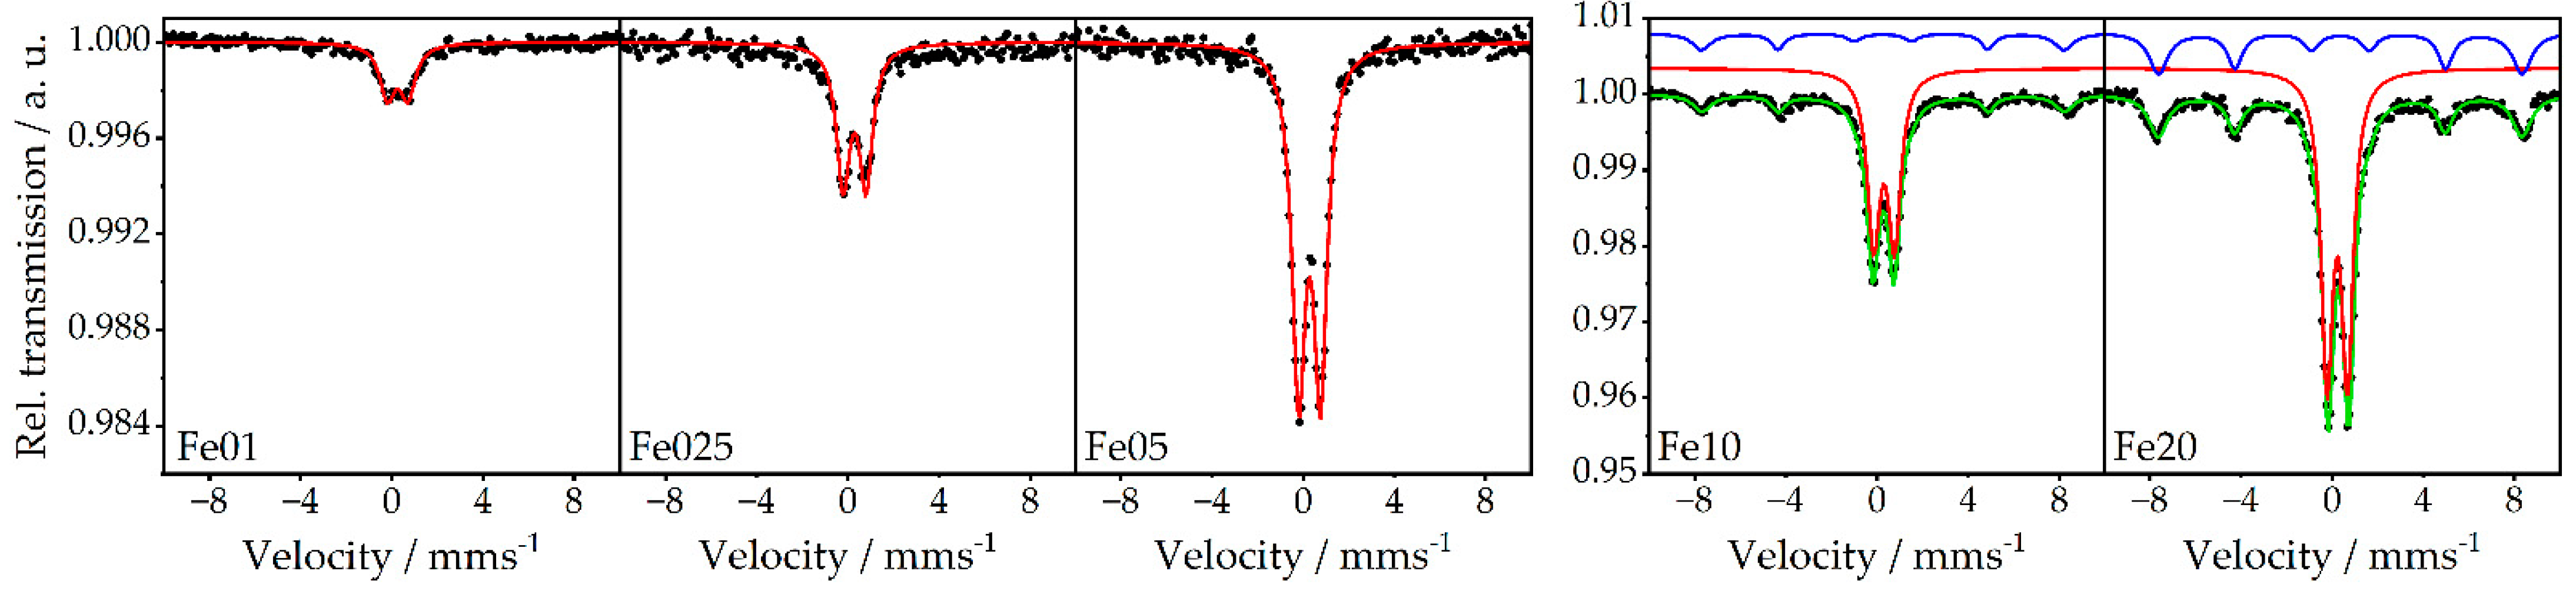
| Sample | δ [mm/s] | ΔEQ [mm/s] | Γ [mm/s] | Bhf [T] | |
|---|---|---|---|---|---|
| Fe01 | 0.26 | 0.90 | 0.80 | ||
| Fe025 | 0.29 | 1.01 | 0.70 | ||
| Fe05 | 0.28 | 0.96 | 0.70 | ||
| Fe10 | doublet | 0.28 | 0.92 | 0.66 | |
| sextet | 0.28 | 0 | 0.74/0.69/1.0 | 49.3 | |
| Fe20 | doublet | 0.27 | 0.90 | 0.61 | |
| sextet | 0.35 | 0 | 0.79/0.78/1.0 | 49.5 |
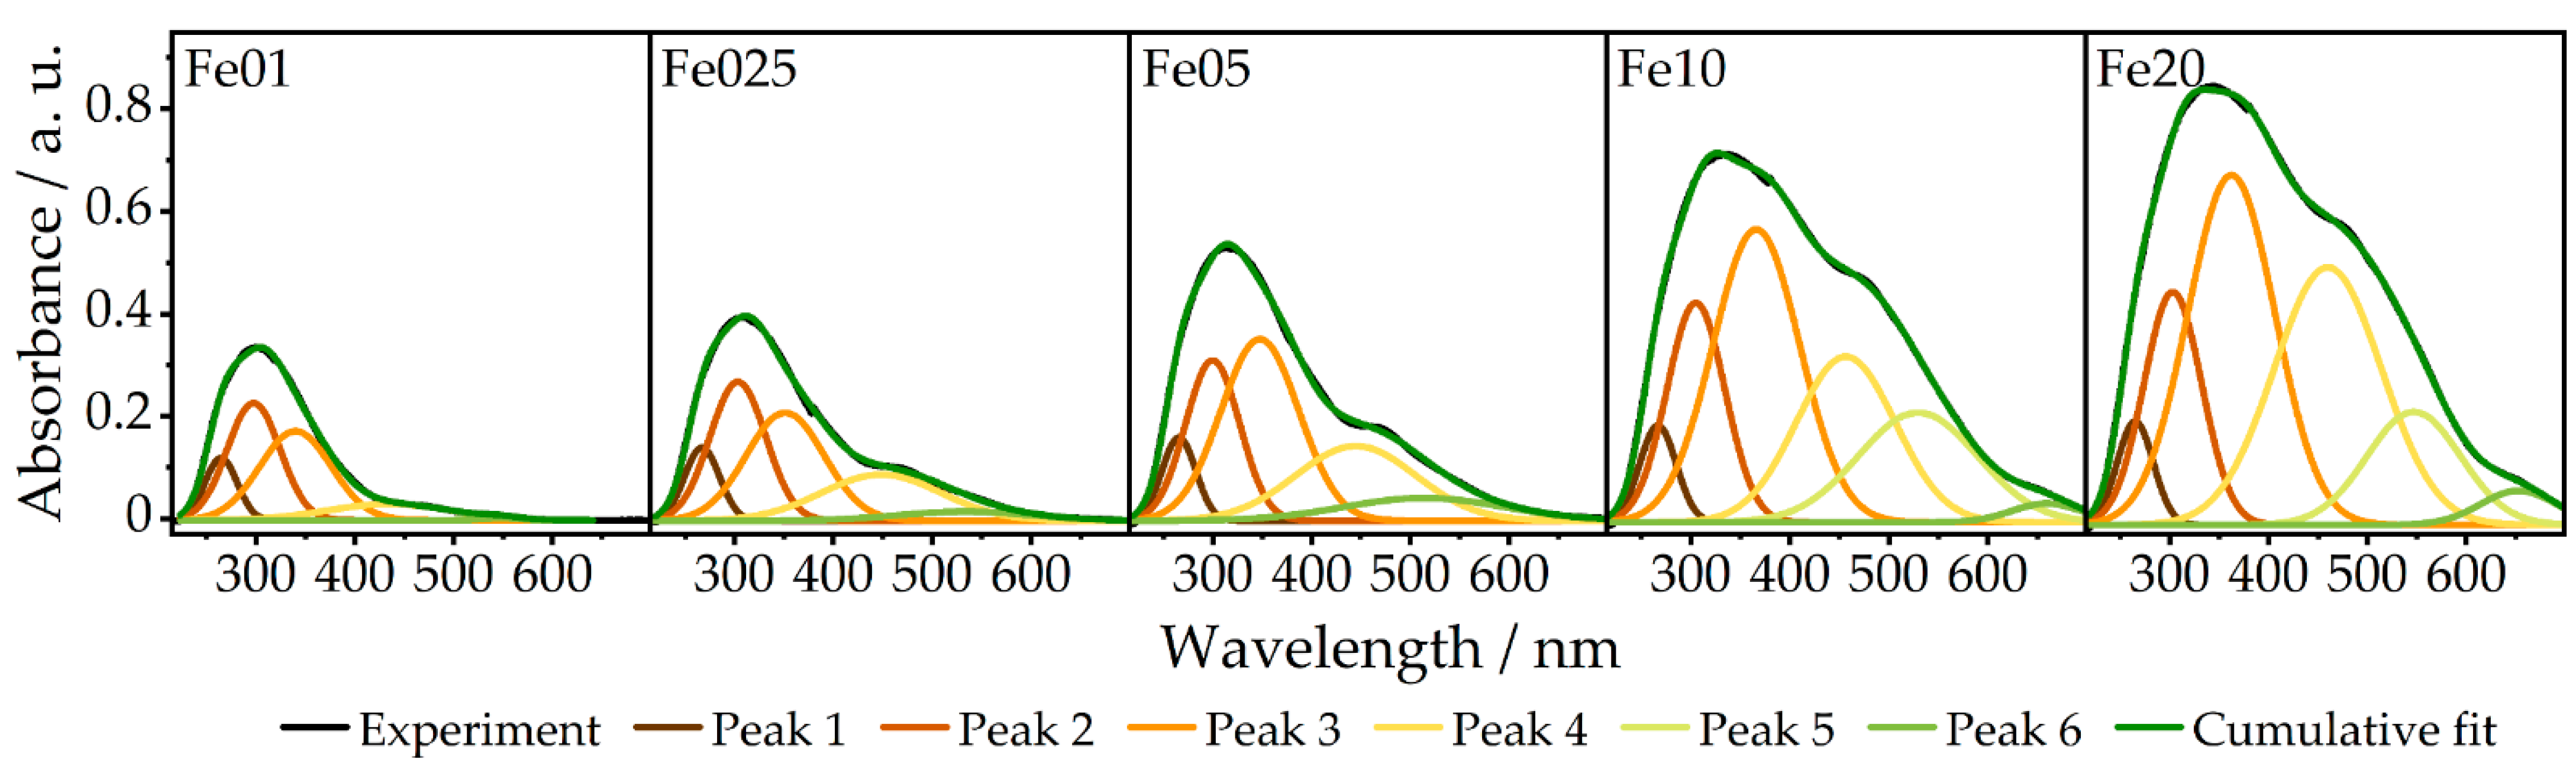
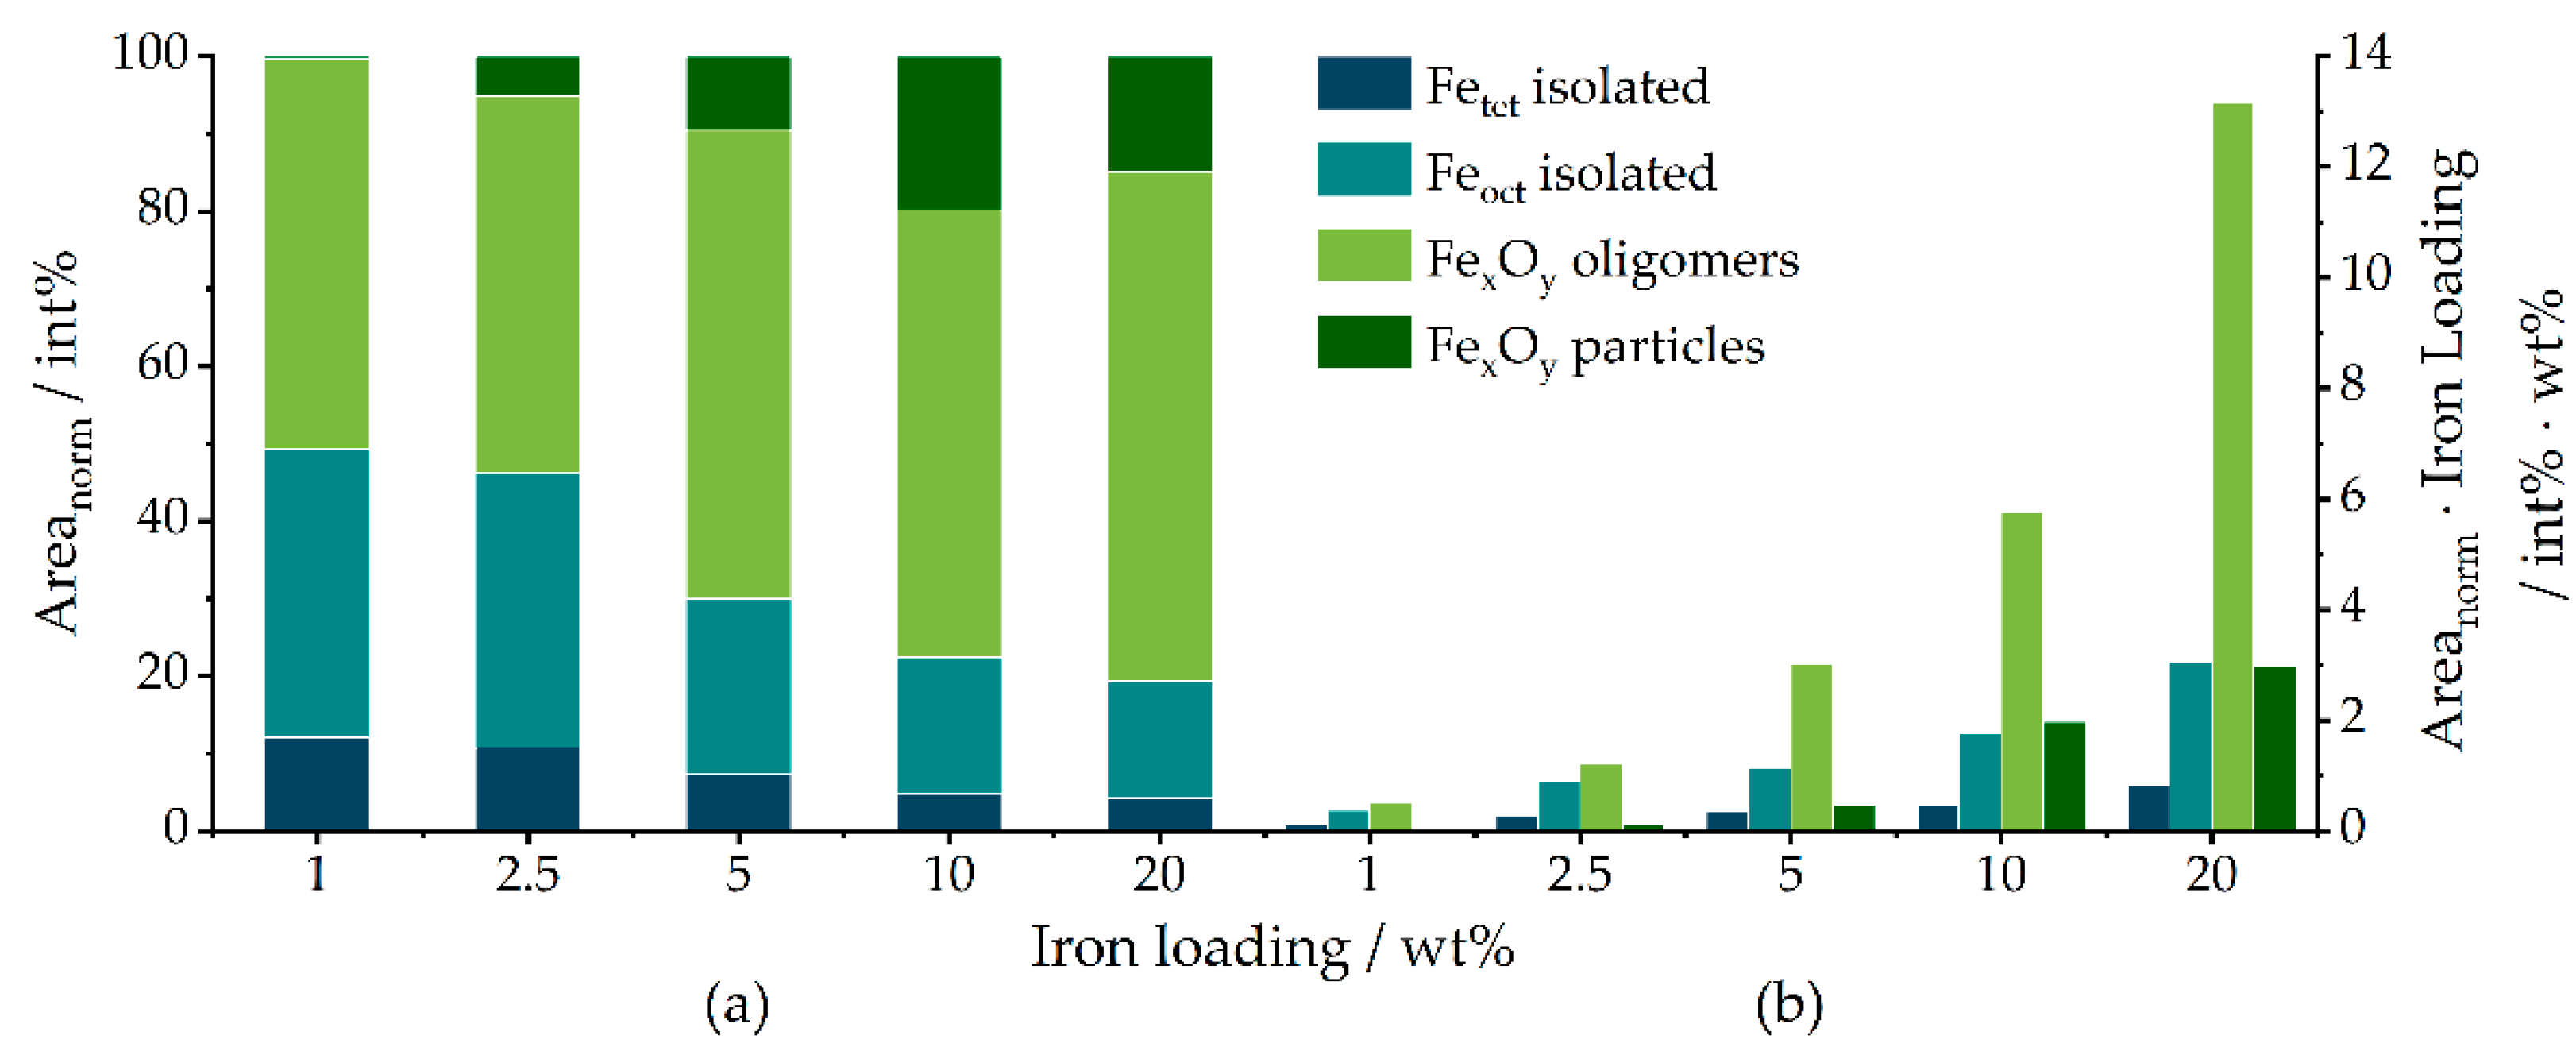
| Catalyst | Fetet [%] | Feoct [%] | FexOy Olig. [%] | FexOy Particles [%] |
|---|---|---|---|---|
| Fe01 | 12.0 | 37.3 | 50.3 | 0.44 |
| Fe025 | 10.8 | 35.4 | 48.6 | 5.15 |
| Fe05 | 7.30 | 22.7 | 60.5 | 9.52 |
| Fe10 | 4.87 | 17.6 | 57.7 | 19.8 |
| Fe20 | 4.20 | 15.2 | 65.7 | 14.9 |
| Catalyst | Abs-Bs | N (Bs) | R (Abs-Bs) [Å] | σ [Å−1] | |
|---|---|---|---|---|---|
| Fe01 | Fe–O | 4.8 ± 0.24 | 1.944 ± 0.019 | 0.089 ± 0.008 | R = 28.29% |
| Fe–O | 1.1 ± 0.05 | 2.157 ± 0.021 | 0.045 ± 0.004 | Ef = 3.655 eV | |
| Fe–Fe | 1.0 ± 0.10 | 3.059 ± 0.030 | 0.112 ± 0.011 | Afac = 0.9477 | |
| Fe–Al | 8.1 ± 0.81 | 3.426 ± 0.034 | 0.112 ± 0.011 | ||
| Fe–Fe | 5.0 ± 0.50 | 3.439 ± 0.034 | 0.112 ± 0.011 | ||
| Fe025 | Fe–O | 4.6 ± 0.23 | 1.944 ± 0.019 | 0.095 ± 0.009 | R = 38.80% |
| Fe–O | 1.6 ± 0.08 | 2.169 ± 0.021 | 0.087 ± 0.008 | Ef = 3.137 eV | |
| Fe–Fe | 1.1 ± 0.11 | 3.047 ± 0.030 | 0.107 ± 0.010 | Afac = 0.9072 | |
| Fe–Al | 7.9 ± 0.79 | 3.455 ± 0.034 | 0.112 ± 0.011 | ||
| Fe–Fe | 5.6 ± 0.56 | 3.463 ± 0.034 | 0.112 ± 0.011 | ||
| Fe05 | Fe–O | 3.6 ± 0.18 | 1.911 ± 0.019 | 0.087 ± 0.008 | R = 34.13% |
| Fe–O | 3.1 ± 0.15 | 2.076 ± 0.020 | 0.112 ± 0.011 | Ef = 4.013 eV | |
| Fe–Fe | 0.8 ± 0.08 | 3.063 ± 0.030 | 0.105 ± 0.010 | Afac = 0.8896 | |
| Fe–Al | 7.4 ± 0.74 | 3.397 ± 0.033 | 0.112 ± 0.011 | ||
| Fe–Fe | 4.7 ± 0.47 | 3.414 ± 0.034 | 0.112 ± 0.011 | ||
| Fe10 | Fe–O | 3.4 ± 0.17 | 1.907 ± 0.019 | 0.081 ± 0.008 | R = 33.88% |
| Fe–O | 3.0 ± 0.15 | 2.065 ± 0.020 | 0.112 ± 0.011 | Ef = 2.925 eV | |
| Fe–Fe | 0.5 ± 0.05 | 2.983 ± 0.029 | 0.092 ± 0.009 | Afac = 0.8896 | |
| Fe–Al | 6.2 ± 0.62 | 3.354 ± 0.033 | 0.112 ± 0.011 | ||
| Fe–Fe | 4.0 ± 0.40 | 3.403 ± 0.034 | 0.112 ± 0.011 | ||
| Fe20 | Fe–O | 2.5 ± 0.12 | 1.898 ± 0.018 | 0.077 ± 0.007 | R = 33.35% |
| Fe–O | 3.9 ± 0.19 | 2.025 ± 0.020 | 0.110 ± 0.011 | Ef = 4.384 eV | |
| Fe–Fe | 0.5 ± 0.05 | 2.962 ± 0.029 | 0.081 ± 0.008 | Afac = 0.8217 | |
| Fe–Al | 9.0 ± 0.90 | 3.360 ± 0.033 | 0.112 ± 0.011 | ||
| Fe–Fe | 5.7 ± 0.57 | 3.394 ± 0.033 | 0.112 ± 0.011 | ||
| α-Fe2O3 | Fe–O | 3.2 ± 0.16 | 1.961 ± 0.019 | 0.081 ± 0.008 | R = 27.77% |
| Fe–O | 3.3 ± 0.16 | 2.134 ± 0.021 | 0.110 ± 0.011 | Ef = 2.584 eV | |
| Fe–Fe | 6.3 ± 0.31 | 2.983 ± 0.029 | 0.112 ± 0.011 | Afac = 0.9735 | |
| Fe–Fe | 2.9 ± 0.29 | 3.317 ± 0.033 | 0.112 ± 0.011 | ||
| Fe–Fe | 1.2 ± 0.12 | 3.706 ± 0.037 | 0.063 ± 0.006 | ||
| γ-Fe2O3 | Fe–O | 0.7 ± 0.03 | 1.868 ± 0.018 | 0.032 ± 0.003 | R = 24.68% |
| Fe–O | 4.8 ± 0.14 | 2.003 ± 0.020 | 0.105 ± 0.010 | Ef = 3.112 eV | |
| Fe–Fe | 4.4 ± 0.44 | 3.019 ± 0.030 | 0.112 ± 0.011 | Afac = 0.8219 | |
| Fe–Fe | 2.1 ± 0.21 | 3.467 ± 0.034 | 0.087 ± 0.008 | ||
| Fe–Fe | 3.6 ± 0.36 | 5.128 ± 0.051 | 0.112 ± 0.011 |
| Catalyst | TLight-off [°C] (10%) | T30 [°C] | T50 [°C] | T90 [°C] | T95 [°C] |
|---|---|---|---|---|---|
| Fe01 | 170 | 267 | 362 | 449 | 467 |
| Fe025 | 109 | 169 | 211 | 307 | 332 |
| Fe05 | 86 | 136 | 169 | 240 | 259 |
| Fe10 | 88 | 142 | 177 | 283 | 340 |
| Fe20 | 94 | 146 | 177 | 248 | 272 |
| Catalyst | Weight Loading [wt%] | m (Fe) [mg] | n (Fe(acac)3) [mmol] | m (γ-Al2O3) [g] |
|---|---|---|---|---|
| Fe01 | 1 | 20 | 0.358 | 1.98 |
| Fe025 | 2.5 | 50 | 0.895 | 1.95 |
| Fe05 | 5 | 100 | 1.79 | 1.90 |
| Fe10 | 10 | 200 | 3.58 | 1.80 |
| Fe20 | 20 | 400 | 7.16 | 1.60 |
| Energy [eV] | Step Size | Time per Point [s] |
|---|---|---|
| 6962–7062 | 5 eV | 0.2 |
| 7062–7092 | 3 eV | 0.2 |
| 7092–7142 | 0.5 eV | 0.2 |
| 7142–8112 | 0.5 Å−1 | 0.2 |
Publisher’s Note: MDPI stays neutral with regard to jurisdictional claims in published maps and institutional affiliations. |
© 2022 by the authors. Licensee MDPI, Basel, Switzerland. This article is an open access article distributed under the terms and conditions of the Creative Commons Attribution (CC BY) license (https://creativecommons.org/licenses/by/4.0/).
Share and Cite
Schlicher, S.; Prinz, N.; Bürger, J.; Omlor, A.; Singer, C.; Zobel, M.; Schoch, R.; Lindner, J.K.N.; Schünemann, V.; Kureti, S.; et al. Quality or Quantity? How Structural Parameters Affect Catalytic Activity of Iron Oxides for CO Oxidation. Catalysts 2022, 12, 675. https://0-doi-org.brum.beds.ac.uk/10.3390/catal12060675
Schlicher S, Prinz N, Bürger J, Omlor A, Singer C, Zobel M, Schoch R, Lindner JKN, Schünemann V, Kureti S, et al. Quality or Quantity? How Structural Parameters Affect Catalytic Activity of Iron Oxides for CO Oxidation. Catalysts. 2022; 12(6):675. https://0-doi-org.brum.beds.ac.uk/10.3390/catal12060675
Chicago/Turabian StyleSchlicher, Steffen, Nils Prinz, Julius Bürger, Andreas Omlor, Christian Singer, Mirijam Zobel, Roland Schoch, Jörg K. N. Lindner, Volker Schünemann, Sven Kureti, and et al. 2022. "Quality or Quantity? How Structural Parameters Affect Catalytic Activity of Iron Oxides for CO Oxidation" Catalysts 12, no. 6: 675. https://0-doi-org.brum.beds.ac.uk/10.3390/catal12060675