Article

2D Graphene Sheets as a Sensing Material for the Electroanalysis of Zileuton

1
Department of Chemistry, School of Advanced Sciences, KLE Technological University, Vidyanagar, Hubballi 580 031, Karnataka, India
2
Department of Chemistry, K.L.E. Institute of Technology, Hubballi 580 027, Karnataka, India
3
Idaho National Laboratory, Idaho Falls, ID 83415, USA
*
Authors to whom correspondence should be addressed.
Submission received: 7 July 2022 / Revised: 28 July 2022 / Accepted: 2 August 2022 / Published: 6 August 2022

Abstract

:
Zileuton (ZLT) is an active oral inhibitor of enzyme 5-lipoxygenase, and long-term intake and overdose of ZLT cause adverse effects, leading to critical conditions in patients. This is a well-recognized issue that necessitates a better approach for ZLT sensing. Given the increasing interest in ZLT sensing and the limitations of previous techniques, there is a need for a highly sensitive, robust, and fast operation method that is inexpensive and easy to use. Thus, for the sensitive detection and determination of ZLT, an electrochemical sensor based on graphene was fabricated. Graphene has excellent properties, such as high surface area, low toxicity, conductivity, and electroactive conjugation with biomolecules, making it suitable for sensing. The electrocatalytic property of graphene promotes the redox-coupled reaction of ZLT. Electrochemical investigation of the modifier was carried out by cyclic voltammetry (CV) and electrochemical impedance spectroscopy (EIS). An optimization and analysis of the influence of different parameters on the electrochemical behavior of ZLT were carried out using the CV approach. The scan rate study aided in exploring the physicochemical properties of the electrode process, and two electrons with two protons were found to be involved in the electrooxidation of ZLT. The fabricated sensor showed a wide range of linearity with ZLT, from 0.3 µM to 100.0 µM, and the detection limit was evaluated as 0.03 µM under optimized conditions. The analysis of spiked urine samples, with good recovery values for percent RSD, provided support for the efficiency and applicability of the developed electrode.

Graphical Abstract

1. Introduction

Zileuton (ZLT) is an aromatic heterocyclic compound that belongs to the 1-benzothiophene class of organic compounds. ZLT is chemically known as (±)-1-(1-Benzo[b]thien-2-ylethyl)-l-hydroxyurea (Figure 1) and was formerly known as A-64077. It was the first drug approved for human use, acting as an active oral inhibitor of the enzyme 5-lipoxygenase [1], and was used to treat chronic asthma.
Leukotrienes are metabolic by-products of arachidonic acid in different kinds of cells. Leukotrienes act as lipid mediators capable of producing bronchoconstriction, bronchial hyper-responsiveness, and airway inflammation in asthma. ZLT is a potent and selective inhibitor of 5-lipoxygenase, an enzyme involved in the arachidonic acid metabolic pathway that constrains the production of cysteinyl LTs and LTB4. As a result, ZLT represents therapeutic options for asthma treatment [2,3].
When taken orally, ZLT is absorbed with a mean time to peak blood serum concentration of 1.7 h and an apparent volume of distribution of 4.9 µg/mL. The most severe side effects are increased liver enzymes, white blood cell count change, and neuropsychiatric events, such as sleeping disorders and behavioral changes, in patients prescribed ZLT [4,5]. Furthermore, efficient trace level monitoring of ZLT must be developed to track the minimal level of permissible plasma concentration that aids in the control of unwanted overdose effects.
Electrochemical approaches have recently been widely explored in pharmacy, food, textiles, ecology, agriculture, and healthcare [6,7,8,9,10,11,12,13,14]. Electrochemical analysis has several benefits, including high sensitivity and selectivity, user-friendliness, comparative inexpensiveness, and fast analysis times [15,16,17]. The use of bare electrodes has several disadvantages, including inadequate electron transport, electrode fouling, etc. Modifier intercalation is critical for resolving difficulties associated with bare electrodes. Nanocrystals, nanomaterials, and dyes are often-used modifiers that reduce the excess potential required for efficient electron propagation, increasing electrode selectivity and sensitivity [18,19,20,21]. Carbon paste electrodes have attracted much attention as working electrodes and have been used as viral sensors on account of their simple and rapid manufacturing method. They offer a wide range of potential with low background current [21]. As a result, this investigation used a carbon paste electrode as the working electrode for the analyte determination.
Graphene belongs to the monolayer carbon atom family; with a honeycomb structure, it is completely packed in a 2D network with the thickness of an atom. In graphite-based materials, it is a fundamental structural block [22,23]. Due to multiple features, such as large surface area, strong conductance, high intrinsic mobility, thermal conductivity, and optical transmittance, it is the most actively investigated carbon allotrope in basic science, technology, and engineering [24]. Nanomaterials made of graphene include graphene oxide (GO), reduced graphene oxide (rGO), and graphene quantum dots (GQDs), all of which are used in nanodevices [25]. Graphene nanomaterials are widely used in the production of biosensors for monitoring food and environmental conservation, biomedical symptoms, and ecological complications [26,27,28,29,30]; they also have energy applications [31]. Due to their high surface area, conductivity, optical properties, and unparalleled ability to establish bonds with biomolecules, graphene nanomaterials offer a significant advantage in creating electrochemical sensors and biosensors. Modifications can be easily achieved by interactions with high-density biomolecules via non-covalent or covalent bonds. They can be employed in in vivo biosensing owing to their low toxicity and biodocility [32].
No previous study has demonstrated graphene as a sensor material for ZLT determination, as is reported here. In addition, since the developed sensor is fast, inexpensive, and easy to fabricate, this constitutes a well-controlled electrochemical study of ZLT. The findings described herein regarding the physicochemical parameters of the electrode process have not previously been reported. This work aimed to develop an electrochemical sensor with good selectivity and sensitivity to detect traces of ZLT and to use the fabricated sensor to analyze ZLT in real samples to understand the applicability of the electrode in real-time applications.

2. Results and Discussion

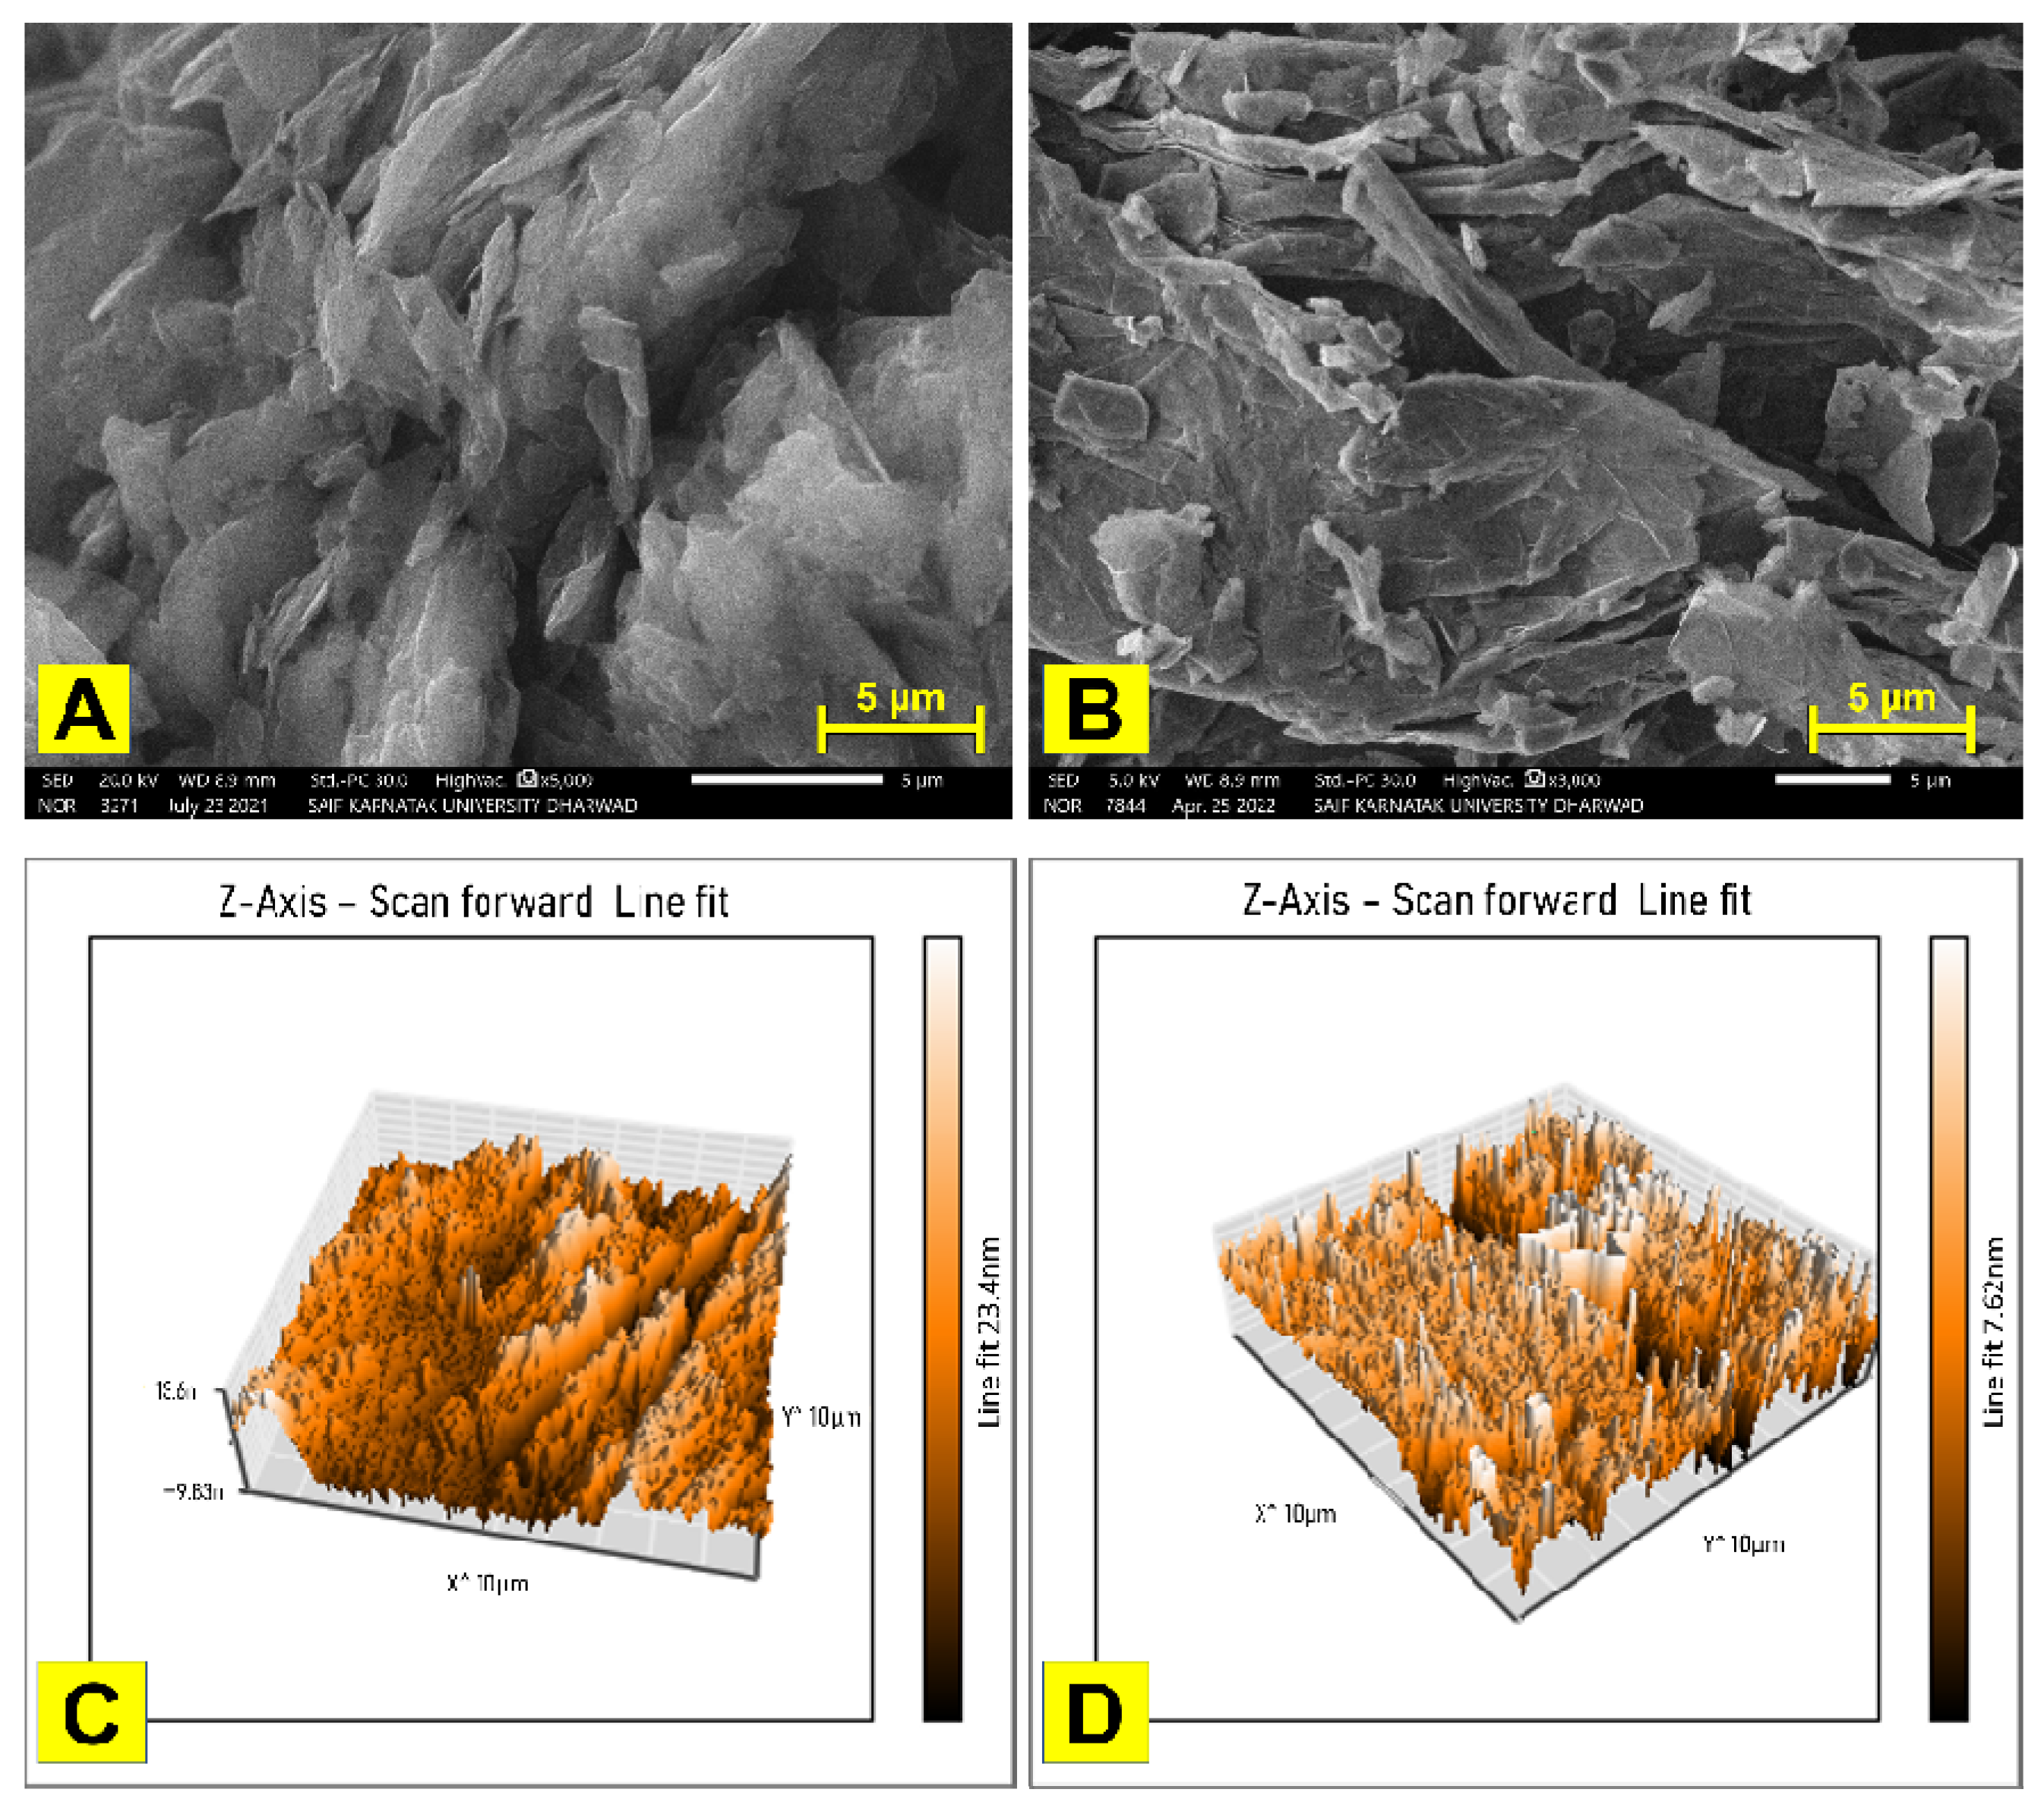
2.1. Characterization of the Sensing Material

The sensing material is vital in electrochemical analysis, as it conjugates with the analyte under the influence of potential, which leads to the production of signals. Thus, the surface morphologies of sensing materials need to be examined in order to evaluate the surface properties which would be helpful in electroanalysis. Here, the surface analysis was performed using SEM; the SEM images of the carbon matrix and graphene-modified carbon matrix are displayed in Figure 2A,B and show the difference in morphology after graphene modification. The carbon matrix can be seen to have a homogenous and uniform distribution of flake structures, while in the modified matrix, graphene flakes are of uniform size and uniformly distributed. Exfoliation of the graphene sheets can be seen. Moreover, the sheets are thin and randomly linked together. This leads to an increase in the surface area of the electrode, exposing and therefore helping it to sense trace levels of ZLT.
The AFM technique was used to examine the topography of the sensing material. The AFM images of bare CPE and G/CPE are shown in Figure 2C,D. The average surface roughness (Ra) was determined and was found to be 224.34 pm and 1495.9 pm for the CPE and G/CPE, respectively. The details of other surface characteristics are given in the Supplementary Materials, Table S1. The Ra value supports the effective surface modification of the electrode.

2.2. Electrochemical Characterization of the Fabricated Electrodes

The surface properties play a critical role in the functional performance of the material in the analytical setting. Moreover, the total surface area of the electrode will not be involved in the analyte sensing. Thus, the electroactive surface area (A°) of the working electrode was determined as that reported in the literature, using K3[Fe(CN)6] as the target solution in KCl electrolyte (0.1 M), and A° was calculated using the Randles–Sevcik Equation (1) [33]. The A° value was 0.040 cm2 and 0.064 cm2 for CPE and G/CPE, respectively.
Ip = (2.69 × 10⁵) n3/2Dₒ1/2C*A°ν1/2
In Equation (1), n represents the number of electrons transferred during the electrochemical reaction of 1.0 mM concentrated (C*) K3[Fe(CN)6]. The CV was recorded at different scan rates (ν) within the range of 0.1 Vs−1 to 0.35 Vs−1 in the fixed potential window, and respective peak currents (Ip) were evaluated. The K3[Fe(CN)6] system has a fixed diffusion coefficient (Dₒ) value of 7.6 × 10⁻⁶ cm2·s−1.
Electrochemical Impedance Spectroscopy (EIS) was employed in the investigation as an electrode characterization method in order to understand the electrode–analyte solution interface properties. By employing 0.01 mM ZLT in PBS (pH 6.0), EIS was recorded in the 1 Hz to 105 Hz (0.005 V amplitude) frequency range at the anodic peak potential (Epa) of ZLT. A Nyquist plot is presented in the Supplementary Materials, Figure S1, and the plot is fitted with a Randles equivalent circuit. The circuit contains the solution resistance (Rs), charge transfer resistance (Rct), and capacitance of the double layer (Cdl), as shown in the inset of Supplementary Figure S1. The Rct value for CPE was 158.3 × 10³ Ω, which was reduced to 91.92 × 10³Ω for G/CPE. Since low resistance was observed in G/CPE, this indicates the easy and fast transfer of charges at the electrode (G/CPE)–solution (ZLT) interface, with higher conductivity. At the same time, CPE exhibited a sluggish and poor charge transfer.

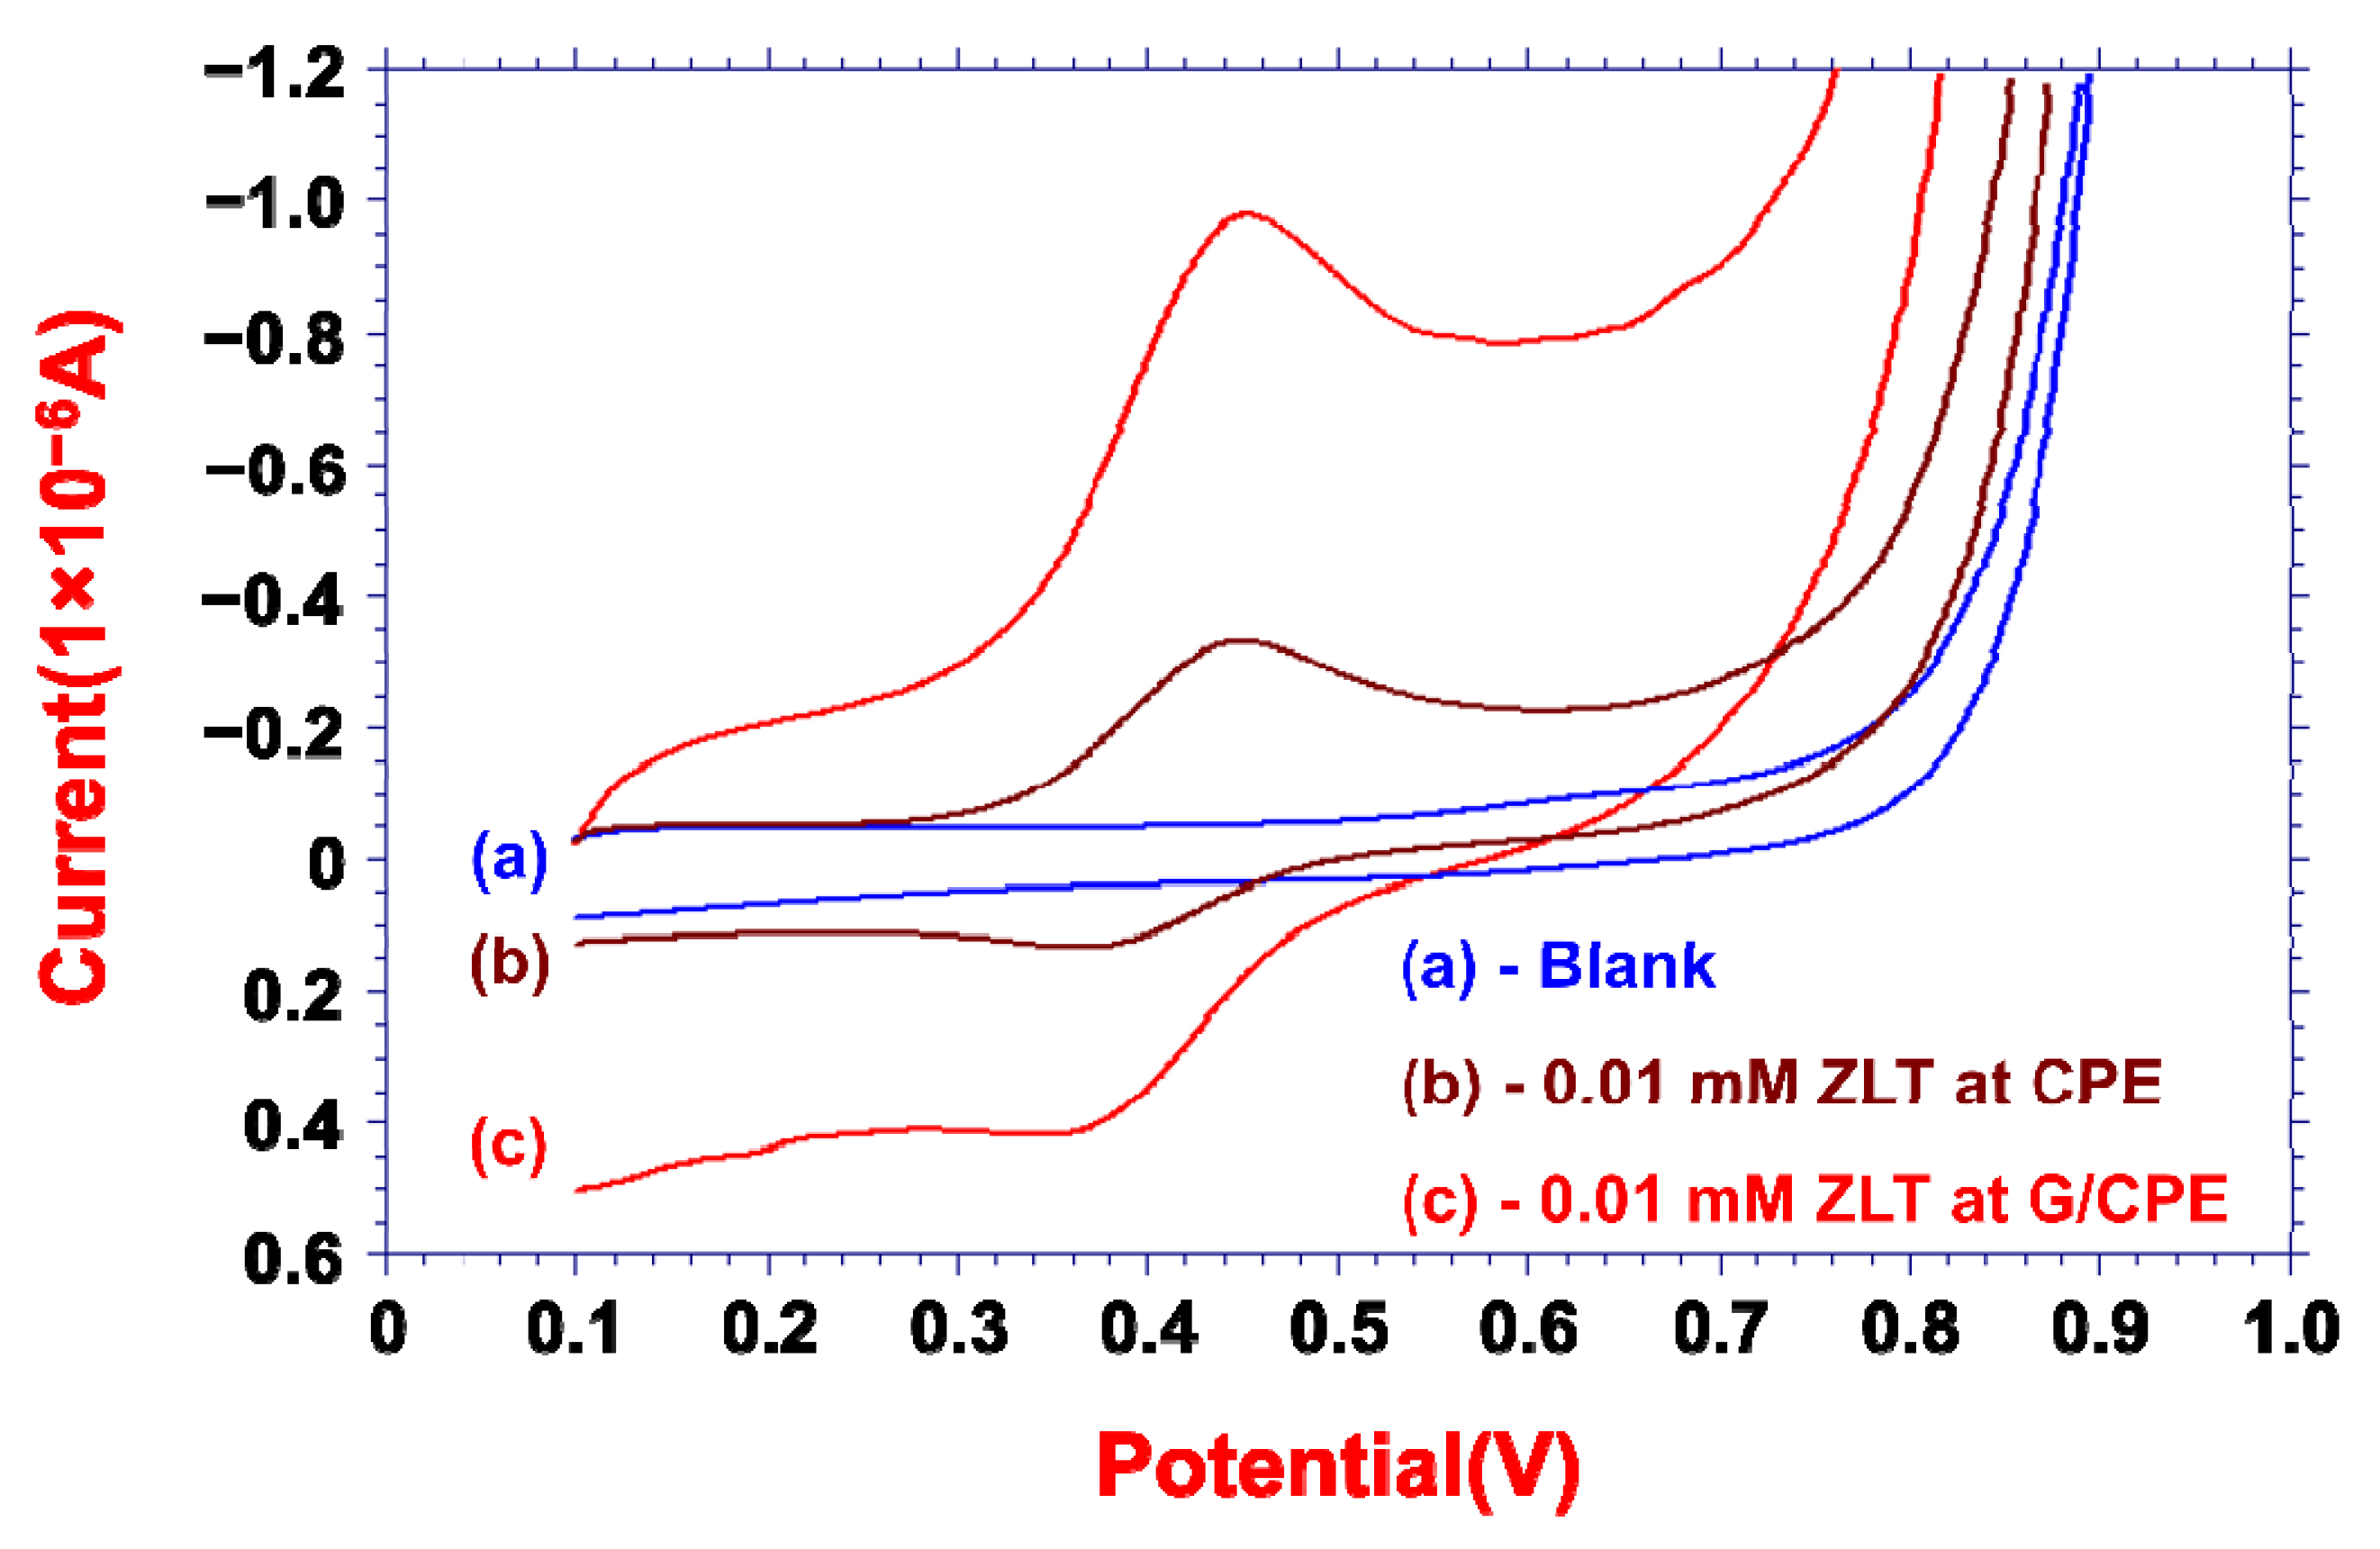
2.3. Cyclic Voltammetric Investigation of ZLT

The electrochemical behavior of the ZLT (0.01 mM) was investigated using the CV technique as it allows the study of analyte redox properties under applied potentials. The voltammograms for both bare and modified CPE are presented in Figure 3. For the buffer solution, no peaks were observed, while the analyte solution yielded two peaks. The forward scan displayed one peak with an anodic current (Ipa) of 0.34 µA at a potential (Epa) of 0.4494 V, and another peak was detected in the reverse scan with a cathodic current (Ipc) of 0.13 µA at a potential (Epc) of 0.3634 V for bare CPE. Similarly, for G/CPE, one peak was observed in the forward scan with an Ipa of 0.99 µA at an Epa of 0.4484 V, and in the reverse scan, a peak was recorded at an Epc of 0.3665 V with an Ipc of 0.42 µA. Even though the voltammogram displayed two peaks, the current ratio was deflected from the unity, suggesting quasi-reversibility. The voltammogram showed that the peak current at the G/CPE was three-fold higher than the bare CPE, indicating the sensing analyte’s effective modification and the easy transfer of electrons. Thus, a newly fabricated and modified electrode was optimized and employed in the remaining investigations.

2.4. Impact of the Immersion Time
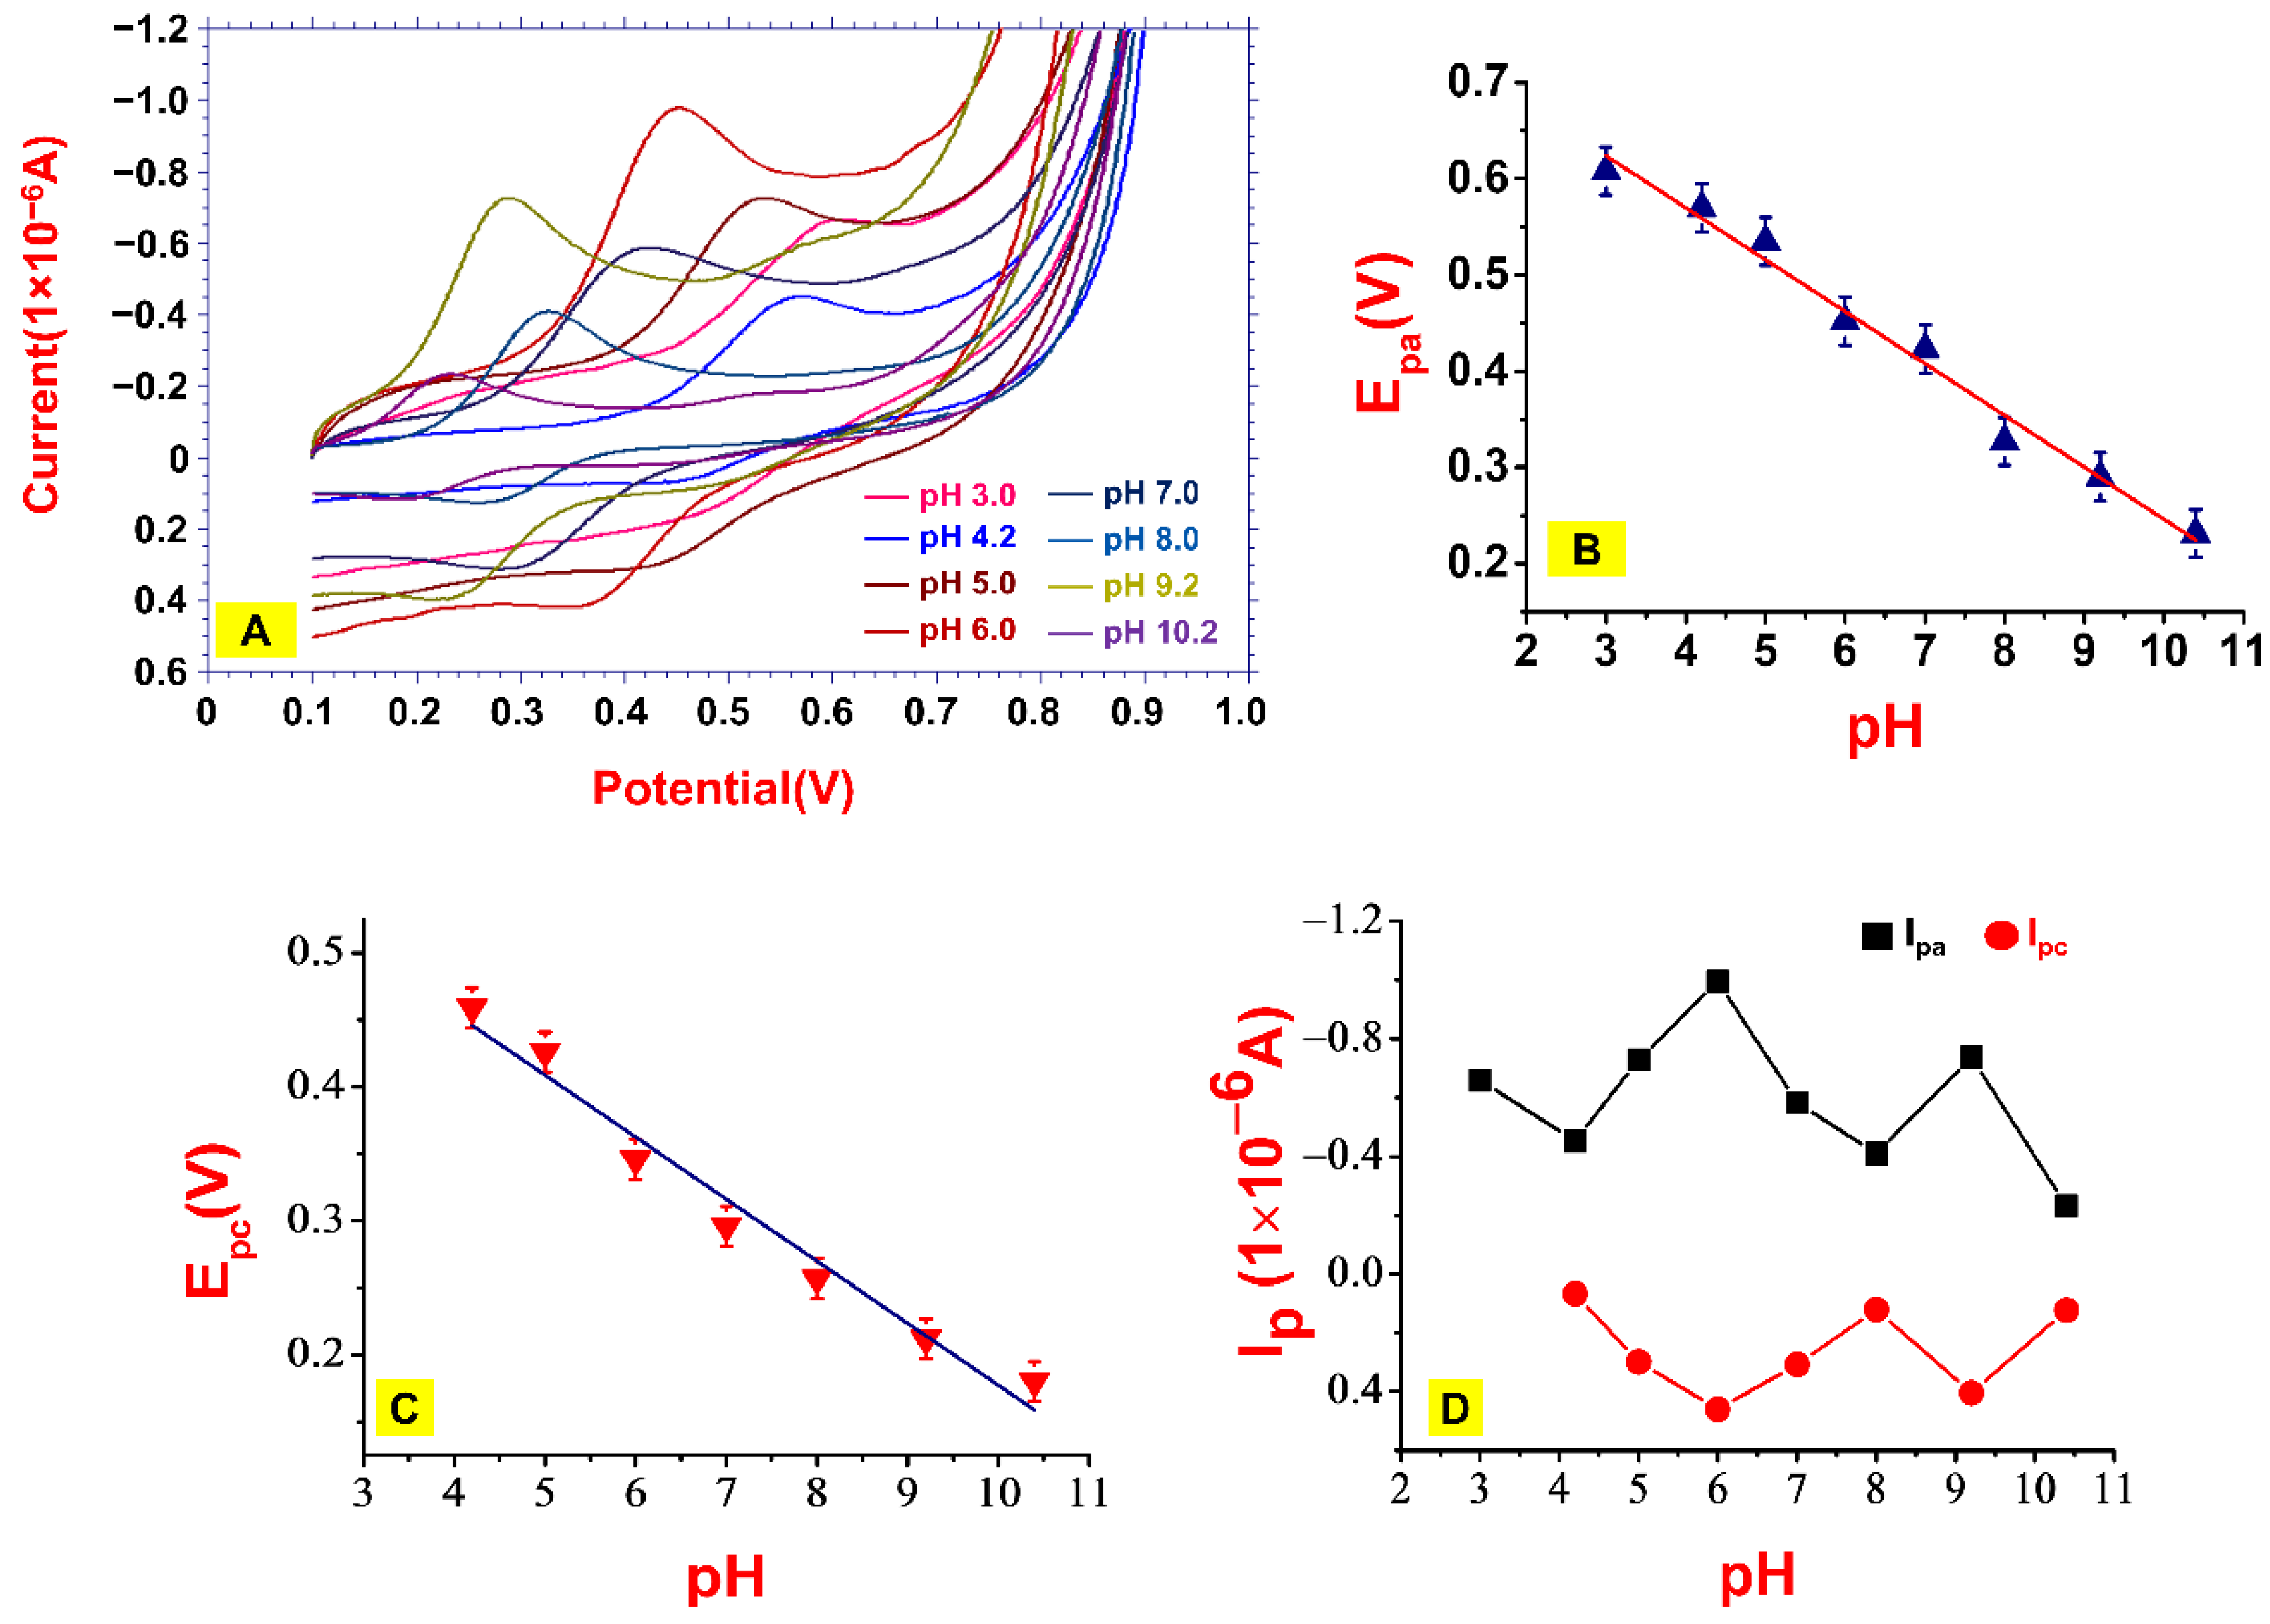
In the absence of applied voltage, analytes migrate from the bulk solution to the electrode surface due to a diffusion gradient. This conveys that the electrode–solution interface has a significant role in the electroanalysis, as the analyte concentration in the electrode vicinity can influence the electrochemical parameter. Consequently, the influence of vicinity concentration was examined in the present study by recording voltammograms at various time intervals and named immersion times (timm). The impact of timm was evaluated in the time range of 0–100 s, and analyte saturation was seen to be accomplished at 0 s, since it yielded the highest peak current (Supplementary Materials, Figure S2). This optimized timm was selected in the further investigations.

2.5. Effect of PBS

The impact of supporting electrolytes was explored in a pH range of 3.0 to 10.4 of 0.2 M PBS using the CV technique (Figure 4A). The recorded voltammograms suggested that the redox-coupled reaction of ZLT was pH-dependent, and the electrochemical response was at a maximum at pH 6.0. The shift in peak potential as pH changed from lower to higher values was observed in a plot of Ep vs. pH (Figure 4B,C), which revealed the proton-coupled electrode process [17]. The dependence of peak potential on pH was explored, and the regression relationship between them was achieved. The obtained equations are as follows: Epa = 0.7847 − 0.053 pH; R2 = 0.99 and Epc = 0.6275 − 0.045 pH; R2 = 0.97. The Epa and Epc vs. pH slopes were compared with the Nernstian value and found to be nearer to it, revealing the involvement of an equal number of electrons and protons [34]. The electrochemical behavior and transfer of electrons were more prominent at pH 6.0, as the ZLT response was highest (Figure 4D).

2.6. Impact of Scan Rate Variation

Scan rate (v) is an essential variable in a voltammetric analysis since it assists in determining the physicochemical parameters of the electrode process. The influence of scan rate on the electrochemical behavior of ZLT was investigated using the CV technique. In this investigation, the scan rate varied from 0.01 to 0.35 Vs−1; the recorded voltammograms are displayed in the Supplementary Materials, Figure S3. The magnitudes of Ipa and Ipc were enhanced with increased scan rate (SI Figure S3A), indicating a linear relationship between them, and a slight positive shift in peak potential favored quasi-reversibility. The dependence of Ipa and Ipc on (ν) was plotted, and the obtained graphs are presented in the Supplementary Materials, Figure S3. The regression coefficient value (R2 = 0.95 for Ip vs. ν and 0.99 for Ip vs. ν1/2) suggested the diffusion process in the electrode mechanism [35].
Further, the linear relationship between log (Ipa) and log(Ipc) vs. the log(ν) was studied (Supplementary Figure S3C), and the regression equation obtained was as follows: log(Ipa) = 0.5314 log(v) − 0.4228; R2 = 0.99 and log(Ipc) = 0.6135 log(ν) + 0.1053; R2 = 0.98. The slopes of the plots were closer to 0.5, indicating that the mechanism path was governed by diffusion control [36].
The correlation between Epa and Epc with log(ν) (Supplementary Figure S3D) was determined to evaluate various physicochemical parameters of the electrode mechanism. The regression equation obtained was: Epa = 0.4638 − 0.022 log(ν); R2 = 0.96 and Epc = 0.3070 − 0.051 log(ν); R2 = 0.98.
The numbers of electrons involved in the electrooxidation (ECOx) and electroreduction (ECRed) processes were determined by comparing the slope values of regression equations with Laviron’s Equations (2) and (3) [37,38]. The number of electrons was two in both the ECOx and ECRed processes. The charge transfer coefficient (α) lay between 0.30 and 0.70 for a quasi-reversible process and was determined to be 0.34 for the forward reaction and 0.56 for the reverse reaction. The heterogeneous rate constant (ks) was calculated using Equation (4) [39] and was found to be 7.12 s−1. The rate of the process for the forward scan (kf) and backward scan (kb) was also evaluated using Equations (5) and (6) [33]; the values of kf and kb were 2.25 cm·s−1 and 5.02 cm·s−1.
Epa = E° + (RT/(1 − α)nF)·ln((1 − α)nF/RTks) + (RT/(1 − α)nF)·lnν
Epc = E° + (RT/αnF)·ln(RTks/αnF) − (RT/αnF)·lnν
log(ks) = α·log(1 − α) + (1 − α)·logα − log(RT/nF) − (1 − α)[αnFΔEp/2.303RT]
kf = ks·e(−αnF(E − E°)/RT)
kb = ks·e [(1 − α)nF(E − E°)/RT]
Ip = (2.99 × 10⁵)·n·(αna)1/2·A·D1/2·C*·ν1/2
The diffusion coefficients for the ECox reaction (Do) and the ECRed reaction (DR) were evaluated using the slopes of the Ipa and Ipc vs. ν1/2 plots, along with Equation (7) [40,41]. The values of DO and DR were found to be 1.39 × 10⁻¹⁰ cm2·s−1 and 3.81 × 10⁻¹² cm2·s−1, respectively.

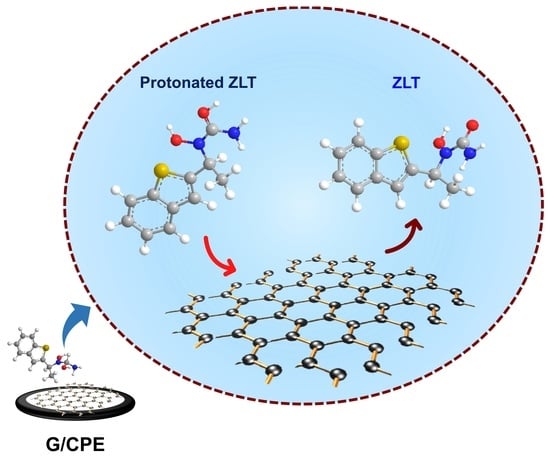
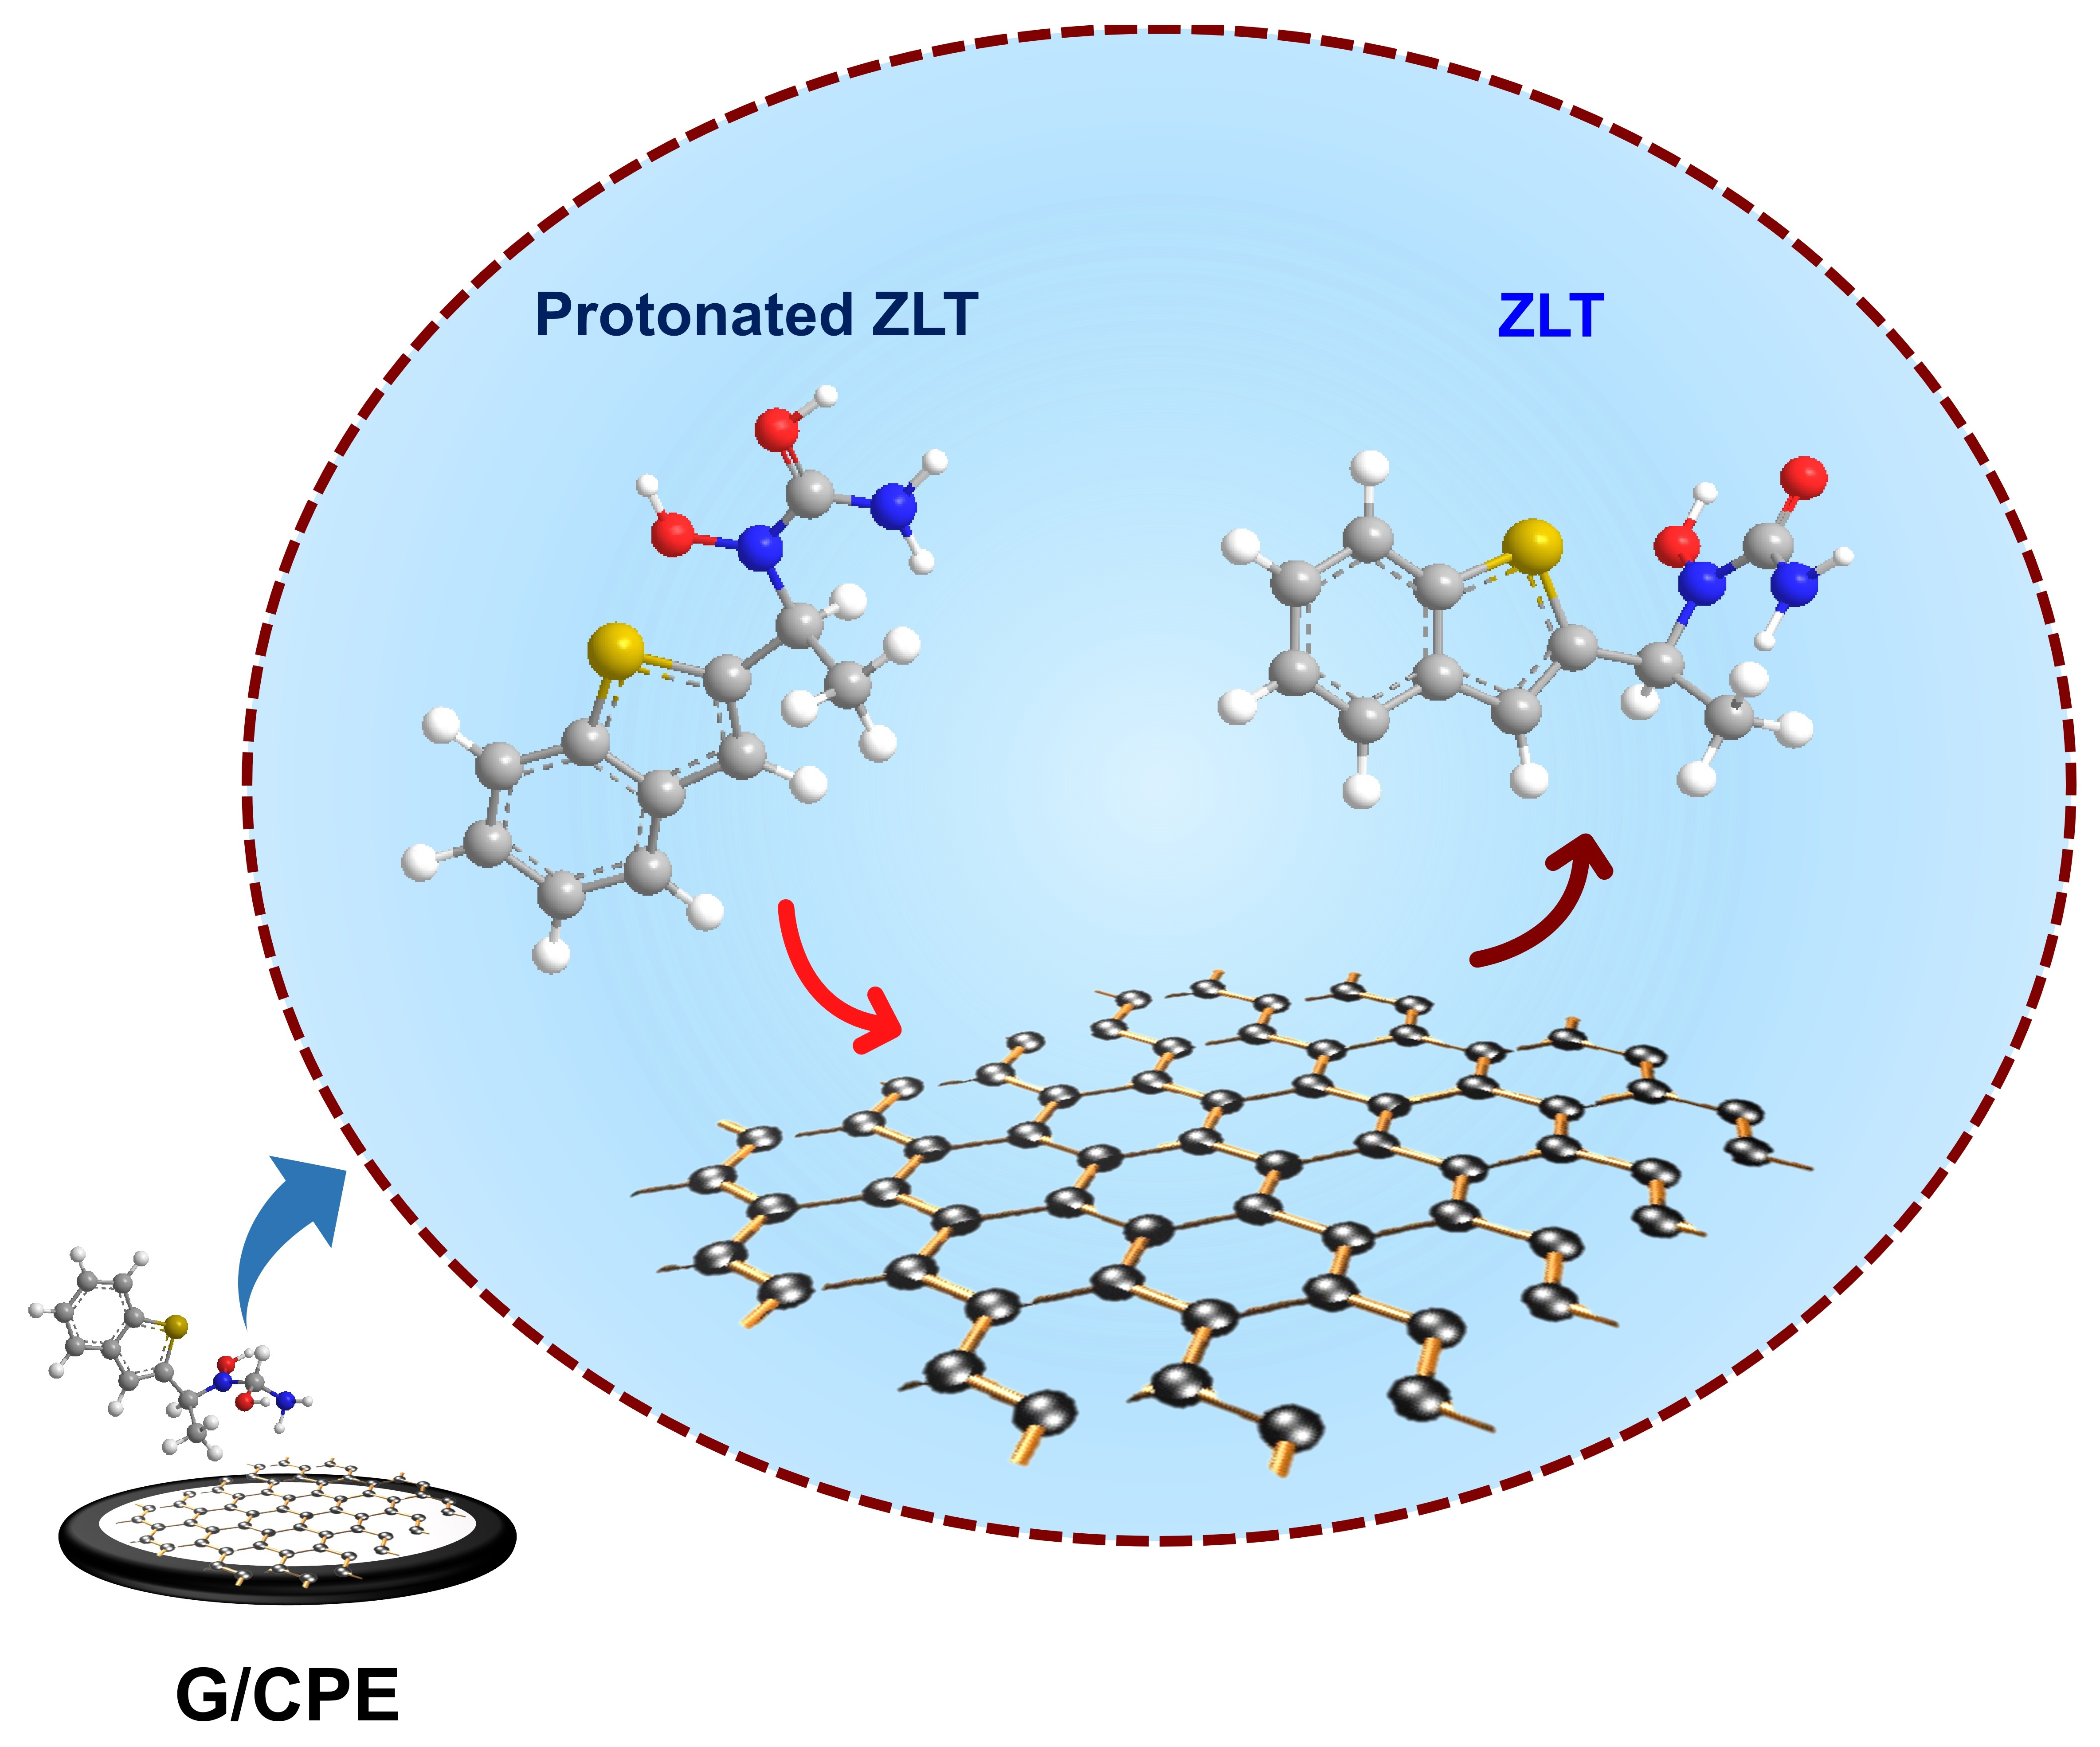
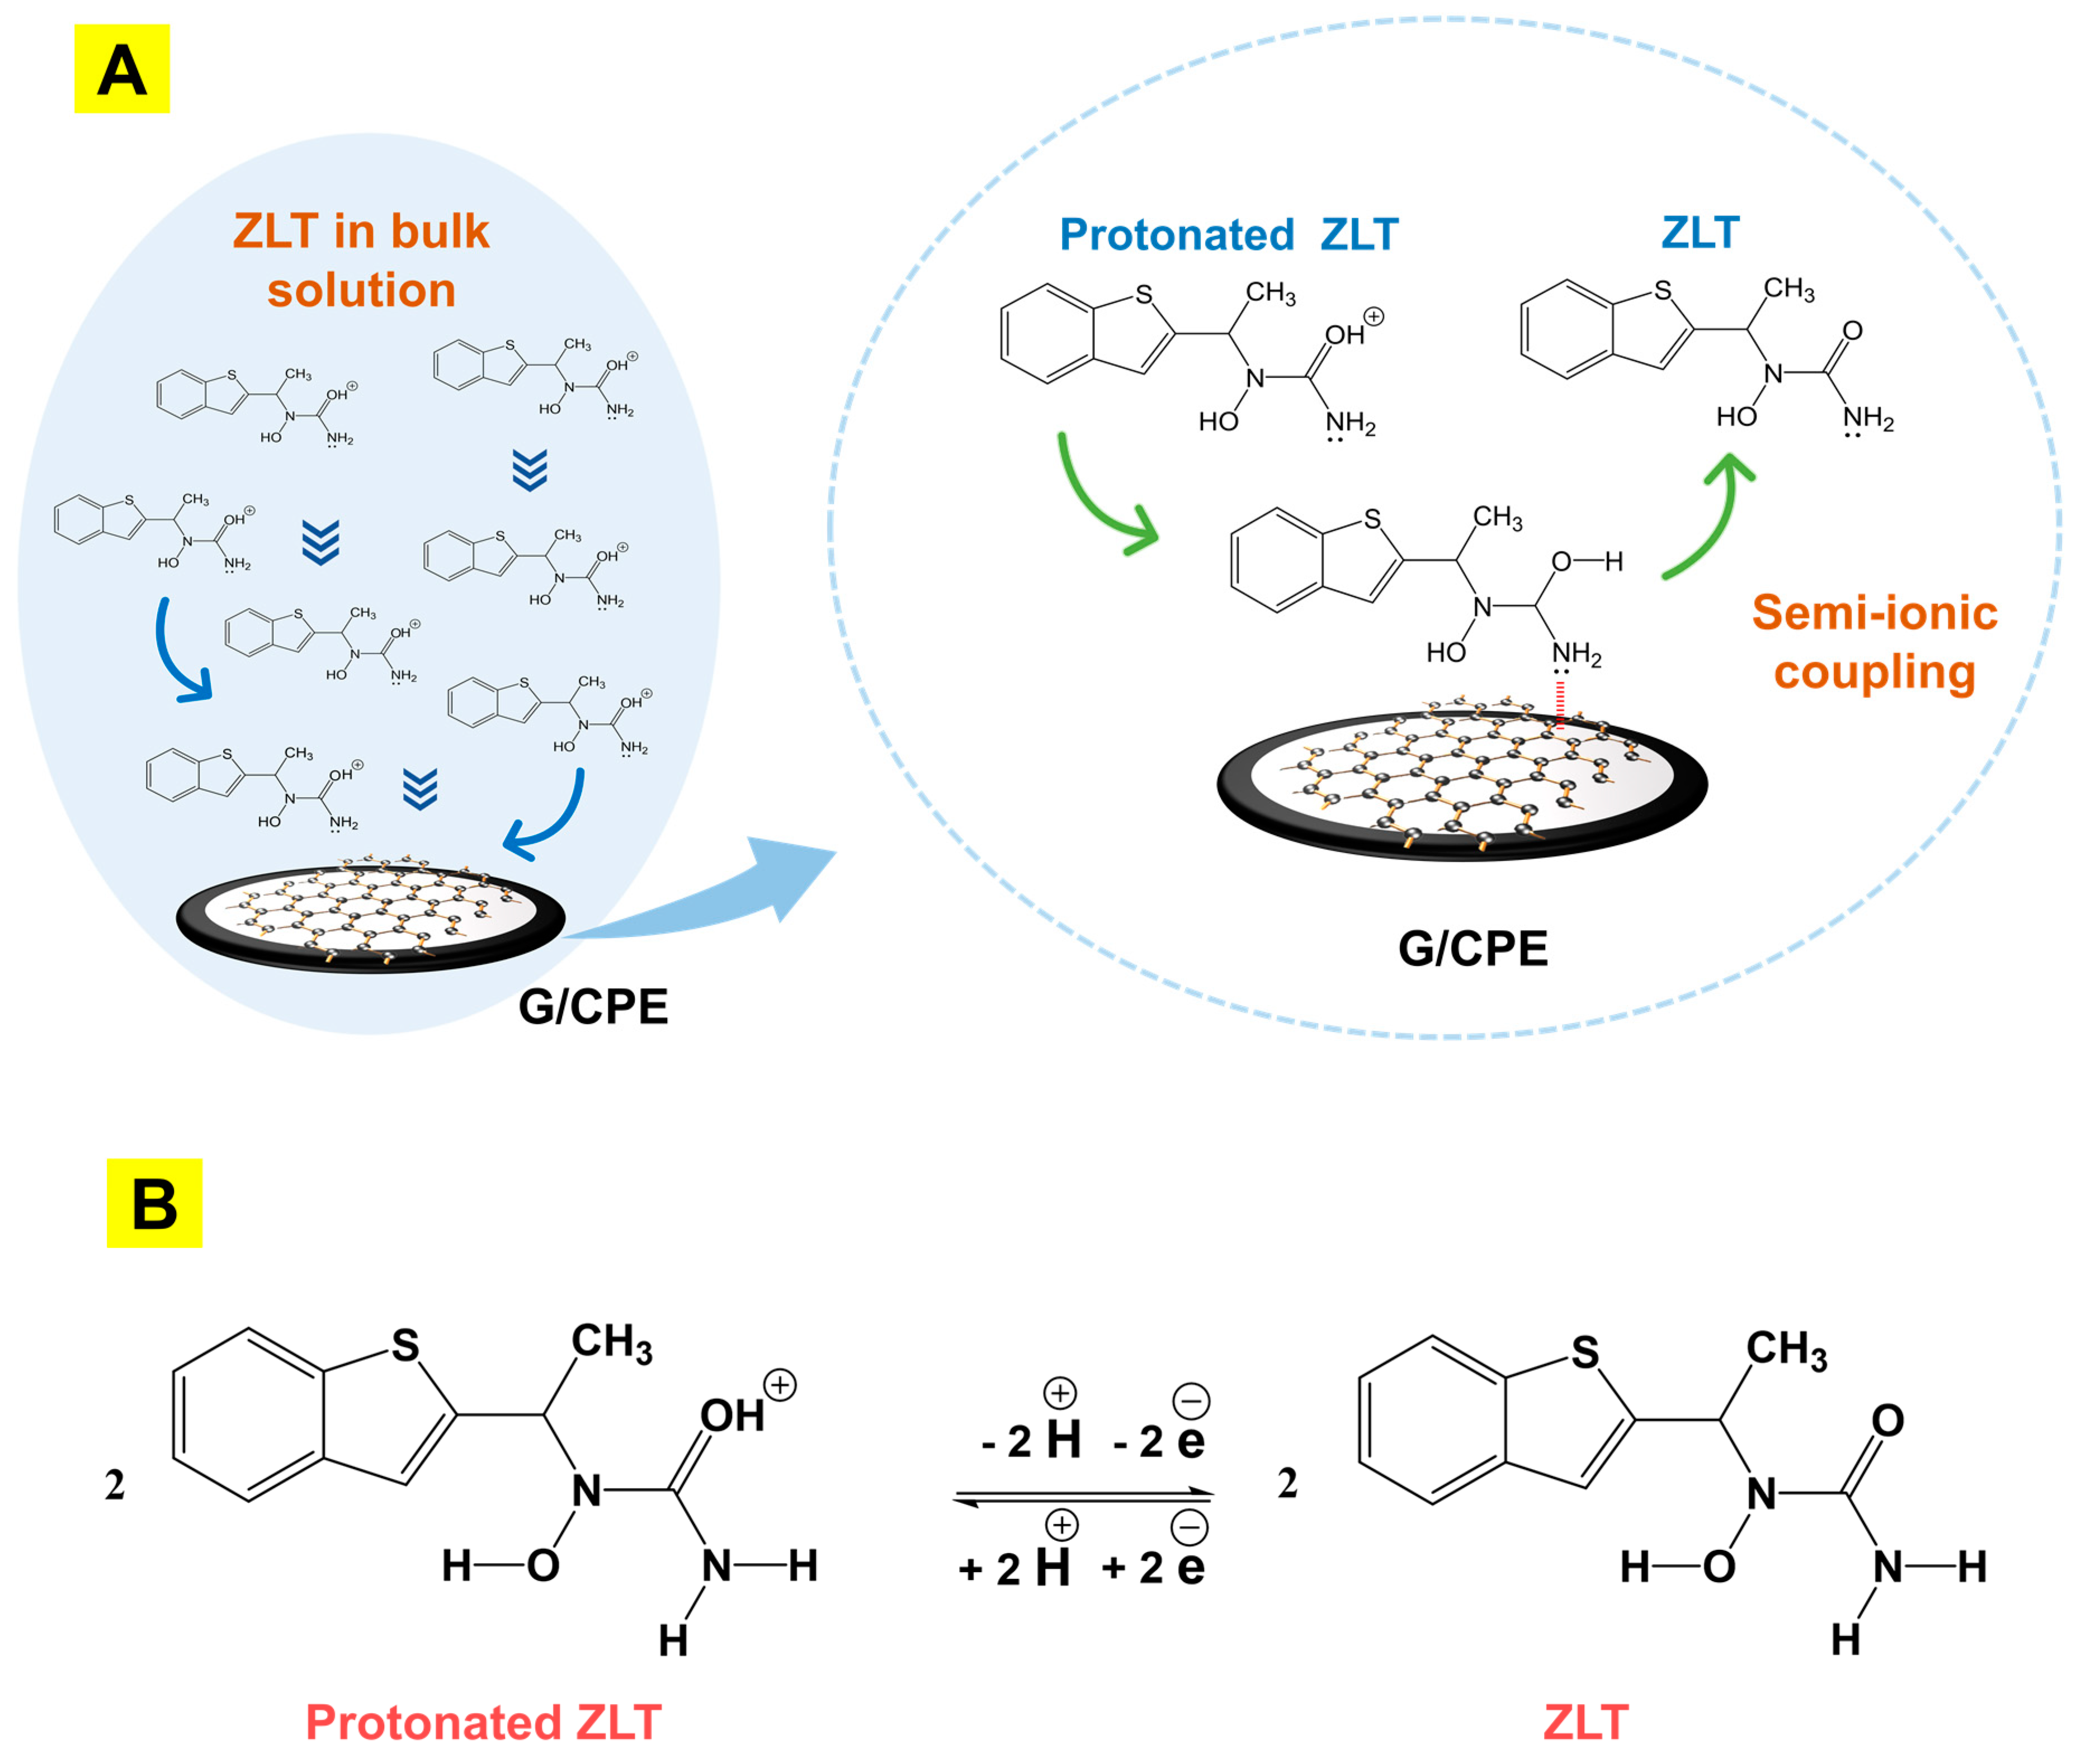
2.7. The Probable Electrochemical Sensing and Reaction Mechanism

2.7.1. Electrode Sensing Mechanism

From the scan rate influence study, it was noticed that the surface mediate mechanism of the redox-coupled quasi-reversible mechanism was governed by diffusion. Inducement of G/CPE in the test solution developed a concentration gradient for ZLT, leading to the diffusion of ZLT towards the electrode surface. The concentration of ZLT around the electrode further migrated towards the surface under the influence of the applied potential, leading to the electrode reaction.
Nanotechnology frequently employs graphene nanomaterials because of their optical, mechanical, physical, and chemical properties. In graphene, the carbon atoms are arranged in a honeycomb structure, leading to a large surface area. The hexagonal rings of graphene are formed with sp2 hybridization and thus show metallic characteristics [42]. Consequently, the surface could expose the adsorbing or conjugating sites for the electron-donating functional group/molecule. ZLT has two electron-donating groups, hydroxyl (-OH) and amine (-NH2) groups. The amine group is a robust electron-donating group that forms a semi-ionic bond with the sp2 hybridized carbon (-N:---C=C-) [39]. This intermolecular interaction seizes the analyte in the subsurface; this momentary coupling of ZLT and graphene assists the electrode reaction (Scheme 1A).

2.7.2. Probable Electrochemical Reaction Mechanism

In ZLT, the carbonyl group tends to be protonated, which suggests that the protonated form of ZLT could be prominent in an acidic medium [43]. The protonated carbonyl group undergoes oxidation and reduction under the influence of applied potential. The CV behavior of ZLT shows one peak in the forward scan and another in the reverse scan defining the redox-coupled reaction for the G/CPE. However, the peak difference between Epa and Epc, suggesting the quasi-reversible electrode process and its other criteria, was confirmed by the study of scan rates. Furthermore, the number of electrons was two and two for electrooxidation and electroreduction, respectively. Therefore, using these data, we can determine the number of protons involved in the mechanism by employing the Nernst Equation (8) [44].
Ep = E° + (0.0591/n) log [(ox)a/(R)b] − (0.0591 · m/n) pH
The terminal part of the above equation correlates with the slope of Ep vs. pH; comparing and substituting known parameters in the above equation, the calculated protons were found to be two and two. Based on the above findings, the probable reaction mechanism for the quasi-reversible process is presented in Scheme 1B.

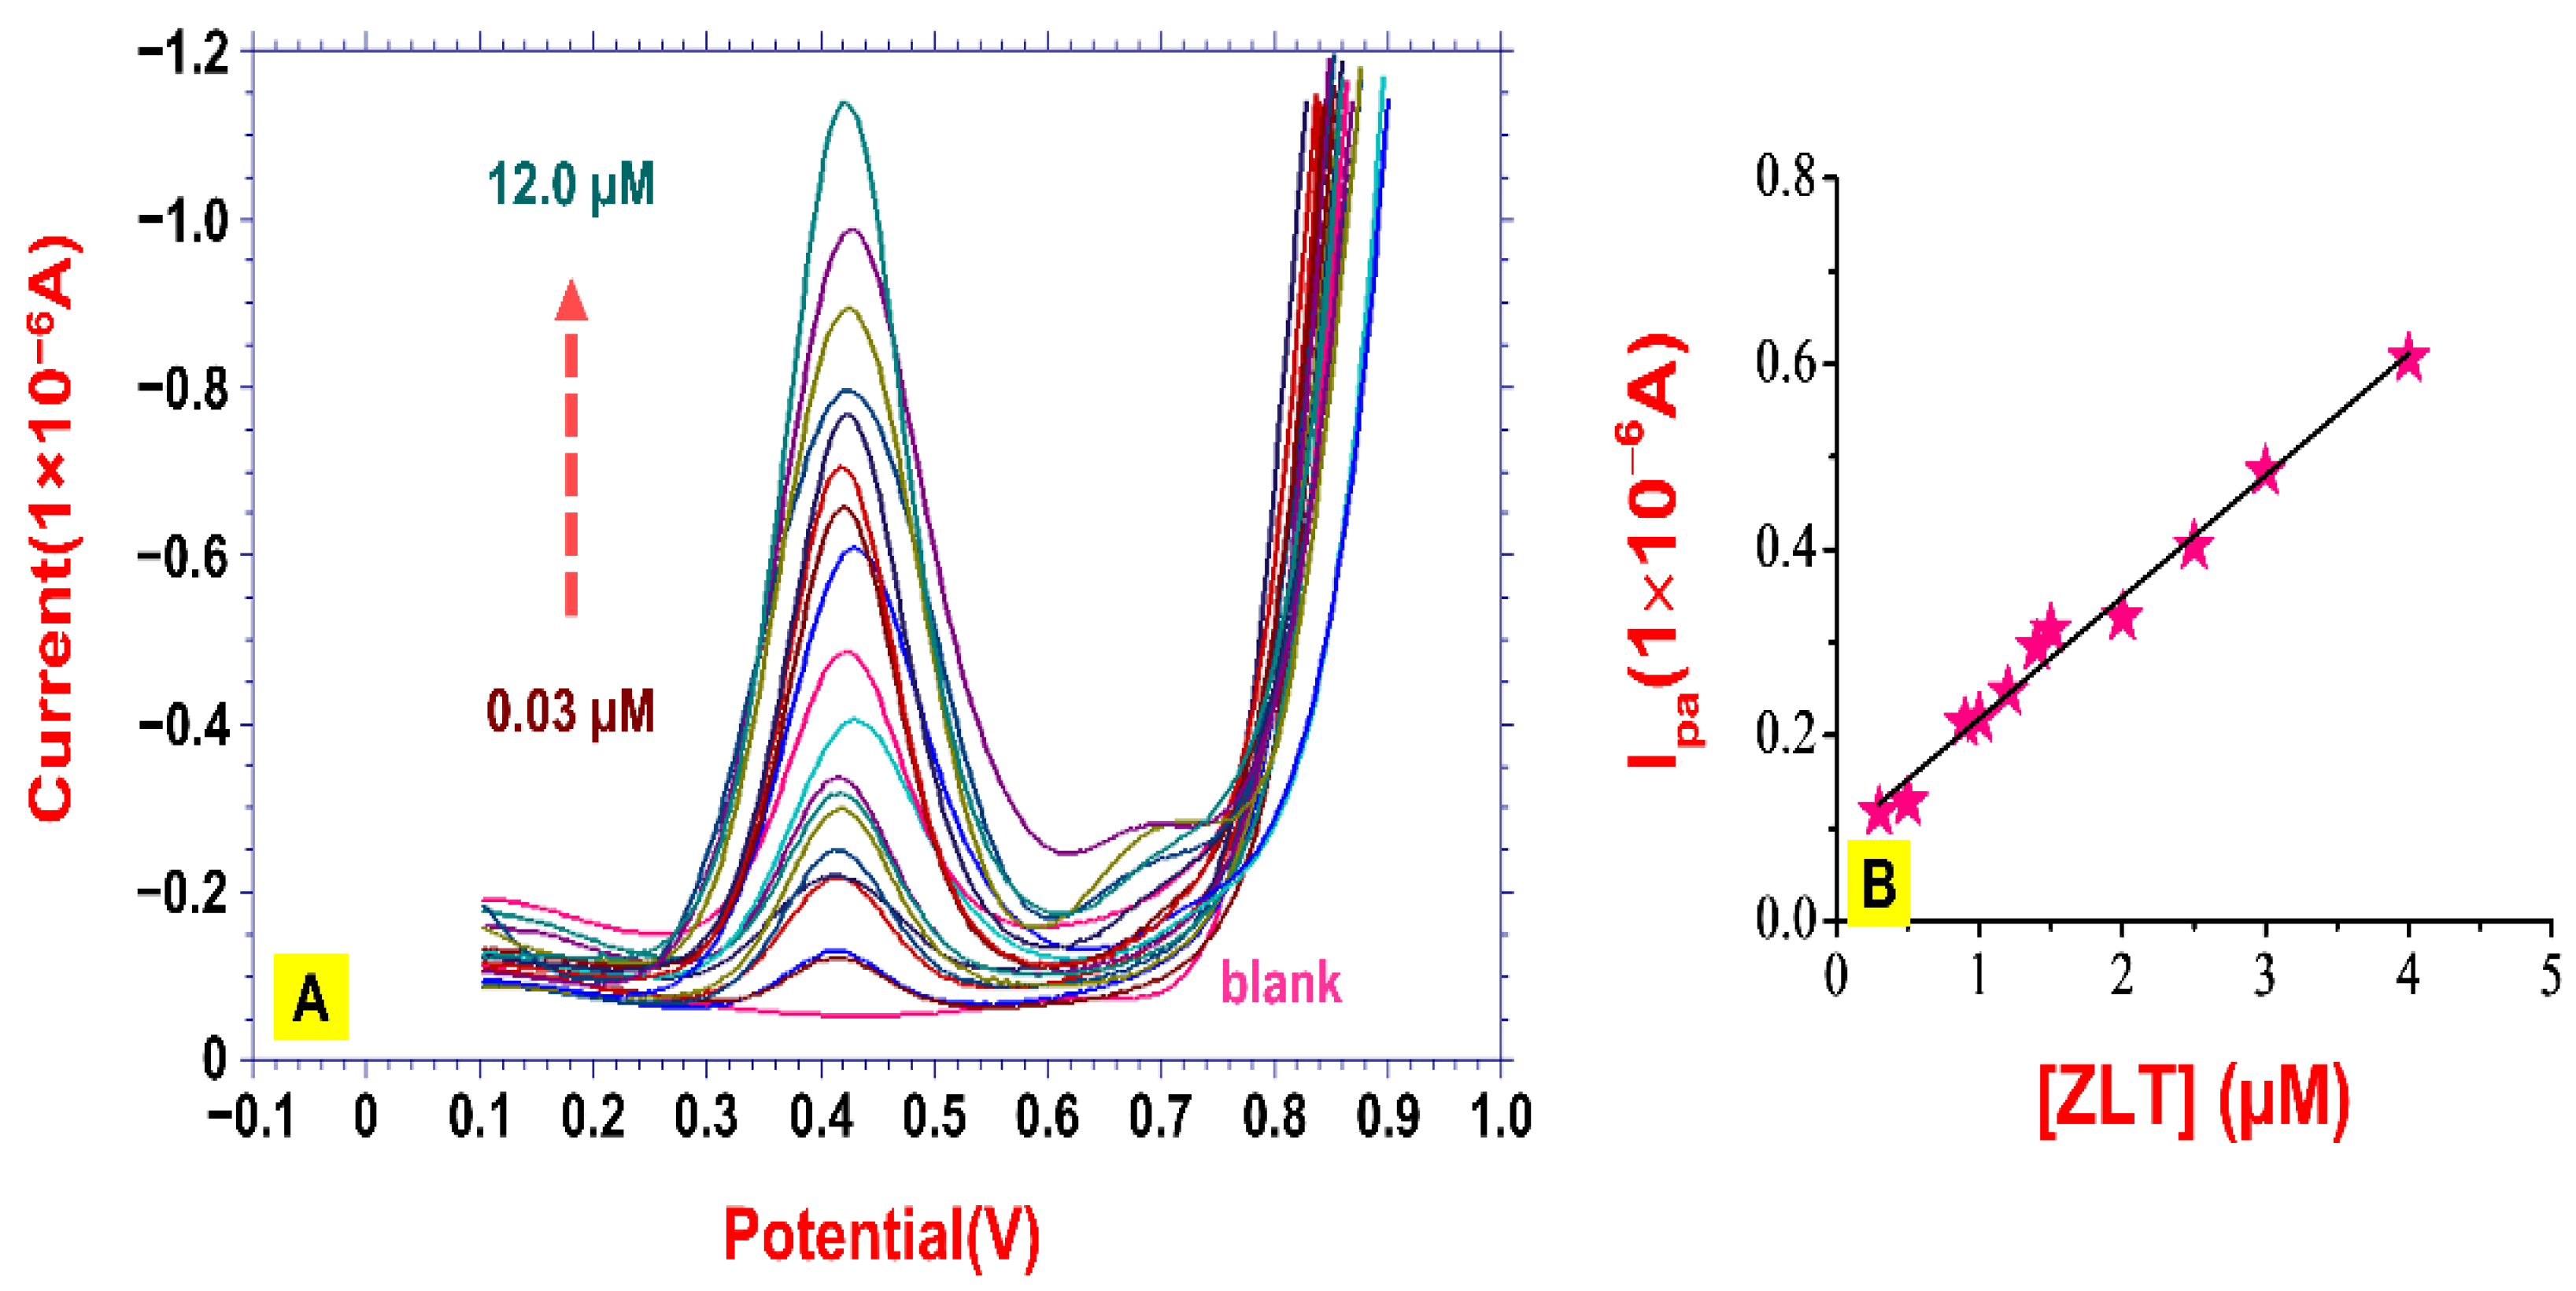
2.8. Quantification of ZLT

To check the sensitivity of the developed electrode, a low concentration level of ZLT was investigated. The sensing of ZLT was carried out for various concentration levels ranging from 0.3 µM to 112.0 µM. SWV is known for its sensitivity; thus, it was employed to quantify ZLT; the obtained voltammograms are shown in Figure 5A. Linearity between peak current and concentration was noticed (Figure 5B) and confirmed from the linear equation, as Ipa = 0.131 (ZLT) + 0.0869; R2 = 0.99.
Using this equation, the limits of detection (LD) and quantification (LQ) were determined and found to be 0.03 µM and 0.12 µM, respectively. The linearity of the developed electrode was confined to the range from 0.3 µM to 100.0 µM. The detailed characteristics of the quantification study are given in the Supplementary Materials, Table S2. The novelty of the sensing electrode was justified by comparing the LD with earlier reported methods [45,46,47] and electrodes [48,49] (Table 1).

2.9. ZLT Determination in Spiked Urine Samples

The G/CPE was employed to sense ZLT in spiked urine samples to determine the potential for real-time application. This investigation supported the validation of the efficiency of the sensing material with respect to the detection of ZLT. The formulated urine samples were spiked with different concentrations of ZLT and analyzed using the standard addition method. The obtained results were then used to find the percentage recovery, RSD, and percentage of RSD by contrast with the pure sample response. The detailed data are given in Table 2. The recovery rate was found to be 88.41 to 93.20%, with 2.67% RSD.

2.10. Study of Interference

Excipients are additives used in tablet formulations to improve a drug’s bulkiness, disintegration, dissolution rate, and bioavailability. Moreover, many of them are electroactive and so could deflect the electrochemical behavior of ZLT. In the present study, the impacts of cellulose (1.0 mM), citric acid (1.0 mM), dextrose (1.0 mM), glycine (1.0 mM), starch (1.0 mM), and titanium oxide (1.0 mM) were analyzed to test the efficiency of the developed electrode for the qualitative analysis of ZLT (0.01 mM). Cellulose and starch are mainly used in tablet formulations as binders; starch is also inserted as a filler and diluent. Glycine is used as an emulsifier, while dextrose and titanium oxide are employed as coating agents, and dextrose is mixed as a disintegrant. Citric acid is used as an antioxidant in formulations. Hence, the interference of these molecules with ZLT response in the selected window was investigated. A graphical representation of the percentage of signal change versus excipients (Supplementary Materials, Figure S4A) reveals that the tested excipients did not interfere with ZLT, signifying the efficiency and selectivity of the developed electrode.
Similarly, the effects of different metal ions were tested; since human beings contain trace levels of metal ions as micronutrients, there could be a chance of interference due to complex formation. Thus, common metal salt solutions with a concentration of 1.0 mM were added and tested for interference. The obtained results (Supplementary Figure S4B) show that the deflection in the peak potential was within ±5%, indicating that the metal ions did not interfere in the analysis to a greater extent, which supports the selectivity of the electrode. The details of the interference study are given in Table 3. The main result of the investigations is that the percent signal change shows the uninterrupted ZLT responses about their detection potential. This indicates that the prepared electrode is qualitatively selective with respect to ZLT.

2.11. Stability of the Electrode

The determination of the stability of the electrode material in the sensing process was necessary to evaluate its capacity and capability for electrochemical analysis. The repeatability and reproducibility of the G/CPE were tested by observing its response to ZLT within the set time. The electrode matrix was stored in an air-tight container for two weeks, then used to fabricate the electrode, and ZLT (0.01 mM) response was recorded. The voltammograms were compared with the previously obtained response and a 98% retention of the original peak and potential was found. This demonstrates the repeatability of the sensing material.
Similarly, the response for ZLT (0.01 mM) was recorded within a day with a set time interval. The voltammograms displayed a similar behavior with the same current magnitude at the desired potential, with 2.14% of RSD (three replicates). This indicates the high reproducibility of the electrode. The details about the stability are presented in Table 4.

3. Materials and Methods

3.1. Used Chemicals

ZLT (ZLT, ≥98%) was procured from Sigma-Aldrich for the analysis. ZLT working standard solutions were prepared in ethanol of HPLC grade (assay ≥ 95%). A series of phosphate-buffered solutions (PBSs) were prepared for electrochemical investigation within a pH range from 3.0 to 9.2, with an ionic strength (I) of 0.2 M. AR-grade phosphate buffers were used as electrolytes. H3PO4 (≥98%), Na2HPO4 (≥97%), Na3PO4 (≥98%), and KH2PO4 (≥99.5%) were employed as phosphate buffer components. Carbon paste was prepared from graphite powder with purity ≥99.5% and paraffin oil. Every reagent used in this study was of AR grade (purity ≥ 98.5%), and double-distilled water was utilized for the electrochemical investigations.

3.2. Equipment and Instruments Used

An electrochemical study used a potentiostat model D630 (CHI business, Omaha, NE 68164, USA) with a three-electrode assembly installed in a voltammetric cell. The WE was a graphene-revised CPE (G/CPE) with a bare electrode as the CPE. In this study, the silver chloride electrode was the functional electrode or reference electrode (RE) for measuring potential changes. A counter-electrode platinum wire was utilized to complete the circuit (CE). A pH meter (model pH-1100) from the HORIBA company, Japan, was used to check the pH of the produced PBS. The material was characterized using a scanning electron microscope (JSM-IT500, JEOL) and an atomic force microscope (AFM) (Nanosurf AG-easy Scan AFM, Liestal, Switzerland).

3.3. Construction of the Working Sensor

In a mortar, 7.0 g of graphite powder with 3.0 mL of paraffin oil (mineral oil) were mixed to make a carbon paste. A smooth paste was obtained by mixing the ingredients homogeneously, after which it was placed in a polytetrafluoroethylene (PTFE) tube fixed with copper wire at one end. For the modified sensor preparation, 0.05 g of graphene was mixed in a mortar with 6.95 g of graphite powder, and 3.0 mL of paraffin oil was blended into the mixture until it became homogeneous. Once the mixture became homogeneous, it was packed in the PTFE tube and taken as G/CPE. In order to achieve a working electrode, to get an even surface and remove the carbon paste excessively adhered on the surface of the electrode, the electrode was smoothened. The electrode was then cleaned with double-distilled water and wiped out for the elimination of particles stuck on the outer surface of the electrode. An electrolyte of pH 6.0 (PBS) was used to actuate the surface of the electrode. Twenty segments were scanned at a scan rate of 0.5 Vs−1, followed by two segment scans at 0.1 Vs−1 within a fixed potential window of 0.10 V to 0.90 V. After each analysis, the electrode surface was regenerated by removing the packed sensor matrix. Then, the hollow PTFE tube was cleaned with ethanol and then with double-distilled water. The matrix was then packed again to obtain a new sensor surface.

3.4. Method of Analysis

The ZLT working standard solution was prepared with a 1.0 mM concentration by dissolving a required quantity of ZLT in ethanol. The activated electrode was placed into the experimental cell with 9.9 mL PBS (pH 6.0) and 0.1 mL of 1.0 mM ZLT. With the predetermined parameters, CVs were perceived and recorded at 0.1 Vs−1. The influence of several parameters on ZLT electrochemical behavior was studied by CV and SWV. All experimental analyses were performed at 25 (±2) °C.

3.5. Test Solution for Real Sample and Interference Analysis

We evaluated the efficiency of the electrode developed in this work by performing a urine sample analysis. The drug-free samples collected for the investigation were stored in cold conditions for further aliquot preparation. An electrochemical study was performed using the standard addition method by spiking ZLT at different concentrations.
To assure the selectivity of the modified sensor for detecting ZLT, it was necessary to examine the effects of excipients and metal ions. This experimental investigation used common excipients, such as cellulose, citric acid, dextrose, glycine, starch, and titanium dioxide powder. To obtain 1.0 mM of excipient test solution, an appropriate amount of excipient was dissolved in double-distilled water and sonicated for 10 min. In the experimental cell, a required amount of excipient solution was added along with the ZLT standard solution to study the electrode’s specificity/selectivity. A similar methodology was applied to study metal ion interference with the selective analysis of ZLT. The SWV method was employed for this experimentation, and voltammograms were recorded in the potential window of 0.1 V to 0.9 V.

4. Conclusions

The carbon-based nanomaterial graphene was successfully intercalated in a carbon matrix to fabricate a sensing electrode. SEM and AFM analysis examined the surface characterization. The SEM image displayed the layered, exfoliated, and interlinked structure of G/CPE, while the AFM study revealed the surface roughness of CPE (100.12 pm2) and G/CPE (100.89 pm2). Electrochemical methods, such as CV and EIS studies, were carried out to optimize the electrode for ZLT sensing.
The electroanalysis of ZLT (0.01 mM) was carried out using different voltammetric techniques, such as CV and SWV. A scan rate investigation suggested the quasi-reversible reaction mechanism of ZLT, with two protons and two electrons in the electrooxidation reaction and one proton and one electron in the electroreduction reaction mechanism. G/CPE showed a wide range of linearity with ZLT from 0.3 µM to 100.0 µM, and the limit of detection was evaluated to be 0.03 µM. The spiked urine sample analysis showed good recovery values, with percent RSD indicating the efficiency and applicability of the developed electrode. The developed electrode demonstrated good selectivity, stability, sensitivity, and capability for the detection of ZLT.

Supplementary Materials

The following supporting information can be downloaded at: https://0-www-mdpi-com.brum.beds.ac.uk/article/10.3390/catal12080867/s1, Figure S1: Nyquist plots for CPE and G/CPE in 0.01 mM ZLT, Figure S2: Influence of immersion time on the electrochemical behavior of ZLT, Figure S3: Impact of scan rate on the electrochemical behavior of 0.01mM ZLT at timm of 0s in pH 6.0 (A) CV responses of 0.1 mM ZLT at different scan rates in pH 6.0 at G/CPE; Inset (a) Dependency and relationship of Ipa and Ipc with ν (B) Dependency and relationship of Ipa and Ipc with ν1/2; (C) Plot of log Ipa and log Ipc versus log v; (D) Plot of Epa and Epc versus log v, Figure S4: Study of influence and interference of (A) Excipients; (C) Metal ions; % signal change of ZLT under the influence of (B) Excipients; (D) Metal ions, Table S1: AFM characteristics of CPE and G/CPE, Table S2: Characteristics of the plot of peak current versus concentration.

Author Contributions

Conceptualization, Y.M.S., M.M.S., S.J.M., S.D., K.M. and N.P.S.; methodology, Y.M.S., M.M.S. and S.J.M.; formal analysis, Y.M.S., M.M.S. and S.J.M., investigation, Y.M.S., M.M.S., S.J.M., S.D., K.M. and N.P.S.; resources, N.P.S.; data curation, Y.M.S., M.M.S., S.J.M. and N.P.S.; writing—original draft preparation, Y.M.S., M.M.S., S.J.M., K.M. and N.P.S.; writing—review and editing, Y.M.S., M.M.S., S.J.M., K.M. and N.P.S.; supervision, K.M. and N.P.S. All authors have read and agreed to the published version of the manuscript.

Funding

This research received no external funding.

Institutional Review Board Statement

The institutional approval number is: INL/JOU-22-68025.

Informed Consent Statement

Not applicable.

Data Availability Statement

Not applicable.

Acknowledgments

Yogesh M. Shanbhag, Mahesh M. Shanbhag, Shweta J. Malode, S. Dhanalakshmi and Nagaraj P. Shetti thank KLE Technological University, Hubballi, Karnataka for providing infrastructure and support to carry out the research work. Kunal Mondal gratefully acknowledges the Department of Energy and Environment Science and Technology at the Idaho National Laboratory, USA, for their support.

Conflicts of Interest

The authors declare no conflict of interest.

References

  1. Gener, P.; Montero, S.; Xandri-Monje, H.; Díaz-Riascos, Z.V.; Rafael, D.; Andrade, F.; Martínez-Trucharte, F.; González, P.; Seras-Franzoso, J.; Manzano, A. Zileuton™ loaded in polymer micelles effectively reduce breast cancer circulating tumor cells and intratumoral cancer stem cells. Nanomed. Nanotechnol. Biol. Med. 2020, 24, 102106. [Google Scholar] [CrossRef]
  2. Muthukrishnan, P.T.; Nouraie, M.; Parikh, A.; Holguin, F. Zileuton use and phenotypic features in asthma. Pulm. Pharmacol. Ther. 2020, 60, 101872. [Google Scholar] [CrossRef]
  3. Dahlin, A.; Qiu, W.; Litonjua, A.A.; Lima, J.J.; Tamari, M.; Kubo, M.; Irvin, C.G.; Peters, S.P.; Wu, A.C.; Weiss, S.T. The phosphatidylinositide 3-kinase (PI3K) signaling pathway is a determinant of zileuton response in adults with asthma. Pharm. J. 2018, 18, 665–677. [Google Scholar] [CrossRef]
  4. Goode, J.-V.R.; Small, R.E. Leukotriene modifiers. J. Am. Pharm. Assoc. (1996) 1998, 38, 48–57. [Google Scholar] [CrossRef]
  5. Berger, W.; De Chandt, M.; Cairns, C. Zileuton: Clinical implications of 5-Lipoxygenase inhibition in severe airway disease. Int. J. Clin. Pract. 2007, 61, 663–676. [Google Scholar] [CrossRef]
  6. Bansod, B.; Kumar, T.; Thakur, R.; Rana, S.; Singh, I. A review on various electrochemical techniques for heavy metal ions detection with different sensing platforms. Biosens. Bioelectron. 2017, 94, 443–455. [Google Scholar] [CrossRef]
  7. Maduraiveeran, G.; Sasidharan, M.; Ganesan, V. Electrochemical sensor and biosensor platforms based on advanced nanomaterials for biological and biomedical applications. Biosens. Bioelectron. 2018, 103, 113–129. [Google Scholar] [CrossRef]
  8. Krishnan, R.G.; Saraswathyamma, B. Disposable electrochemical sensor for coumarin induced milk toxicity in raw milk samples. Measurement 2021, 170, 108709. [Google Scholar] [CrossRef]
  9. Padmanaban, A.; Murugadoss, G.; Venkatesh, N.; Hazra, S.; Kumar, M.R.; Tamilselvi, R.; Sakthivel, P. Electrochemical determination of harmful catechol and rapid decolorization of textile dyes using ceria and tin doped ZnO nanoparticles. J. Environ. Chem. Eng. 2021, 9, 105976. [Google Scholar] [CrossRef]
  10. Alizadeh, M.; Demir, E.; Aydogdu, N.; Zare, N.; Karimi, F.; Kandomal, S.M.; Rokni, H.; Ghasemi, Y. Recent advantages in electrochemical monitoring for the analysis of amaranth and carminic acid food colors. Food Chem. Toxicol. 2022, 163, 112929. [Google Scholar] [CrossRef]
  11. Tümay, S.O.; Şenocak, A.; Sarı, E.; Şanko, V.; Durmuş, M.; Demirbas, E. A new perspective for electrochemical determination of parathion and chlorantraniliprole pesticides via carbon nanotube-based thiophene-ferrocene appended hybrid nanosensor. Sens. Actuators B Chem. 2021, 345, 130344. [Google Scholar] [CrossRef]
  12. Killedar, L.; Ilager, D.; Malode, S.J.; Shetti, N.P. Fast and facile electrochemical detection and determination of fungicide carbendazim at titanium dioxide designed carbon-based sensor. Mater. Chem. Phys. 2022, 285, 126131. [Google Scholar] [CrossRef]
  13. Shanbhag, M.M.; Shetti, N.P.; Kalanur, S.S.; Pollet, B.G.; Nadagouda, M.N.; Aminabhavi, T.M. Hafnium doped tungsten oxide intercalated carbon matrix for electrochemical detection of perfluorooctanoic acid. Chem. Eng. J. 2022, 434, 134700. [Google Scholar] [CrossRef]
  14. Zhang, W.; Tian, Z.; Yang, S.; Rich, J.; Zhao, S.; Klingeborn, M.; Huang, P.-H.; Li, Z.; Stout, A.; Murphy, Q. Electrochemical micro-aptasensors for exosome detection based on hybridization chain reaction amplification. Microsyst. Nanoeng. 2021, 7, 63. [Google Scholar] [CrossRef]
  15. Gao, M.; Pan, S.-Y.; Chen, W.-C.; Chiang, P.-C. A cross-disciplinary overview of naturally derived materials for electrochemical energy storage. Mater. Today Energy 2018, 7, 58–79. [Google Scholar] [CrossRef]
  16. Killedar, L.S.; Shanbhag, M.M.; Shetti, N.P.; Malode, S.J.; Veerapur, R.S.; Reddy, K.R. Novel graphene-nanoclay hybrid electrodes for electrochemical determination of theophylline. Microchem. J. 2021, 165, 106115. [Google Scholar] [CrossRef]
  17. Manasa, G.; Mascarenhas, R.J.; Bhakta, A.K.; Mekhalif, Z. Nano-graphene-platelet/Brilliant-green composite coated carbon paste electrode interface for electrocatalytic oxidation of flavanone Hesperidin. Microchem. J. 2021, 160, 105768. [Google Scholar] [CrossRef]
  18. Malode, S.J.; Keerthi, P.K.; Shetti, N.P.; Kulkarni, R.M. Electroanalysis of carbendazim using MWCNT/Ca-ZnO modified electrode. Electroanalysis 2020, 32, 1590–1599. [Google Scholar] [CrossRef]
  19. Yan, D.; Lou, Y.; Yang, Y.; Chen, Z.; Cai, Y.; Guo, Z.; Zhan, H.; Chen, B. Dye-modified metal–organic framework as a recyclable luminescent sensor for nicotine determination in urine solution and living cell. ACS Appl. Mater. Interfaces 2019, 11, 47253–47258. [Google Scholar] [CrossRef]
  20. Shanbhag, M.M.; Ilager, D.; Mahapatra, S.; Shetti, N.P.; Chandra, P. Amberlite XAD-4 based electrochemical sensor for diclofenac detection in urine and commercial tablets. Mater. Chem. Phys. 2021, 273, 125044. [Google Scholar] [CrossRef]
  21. Kumar, S.; Bukkitgar, S.D.; Singh, S.; Singh, V.; Reddy, K.R.; Shetti, N.P.; Venkata Reddy, C.; Sadhu, V.; Naveen, S. Electrochemical sensors and biosensors based on graphene functionalized with metal oxide nanostructures for healthcare applications. ChemistrySelect 2019, 4, 5322–5337. [Google Scholar] [CrossRef]
  22. Geim, A.K.; Novoselov, K.S. The rise of graphene. In Nanoscience and Technology: A Collection of Reviews from Nature Journals; World Scientific: Singapore, 2010; pp. 11–19. [Google Scholar]
  23. Yu, X.; Zhang, W.; Zhang, P.; Su, Z. Fabrication technologies and sensing applications of graphene-based composite films: Advances and challenges. Biosens. Bioelectron. 2017, 89, 72–84. [Google Scholar] [CrossRef] [PubMed]
  24. Zhu, Y.; Murali, S.; Cai, W.; Li, X.; Suk, J.W.; Potts, J.R.; Ruoff, R.S. Graphene and graphene oxide: Synthesis, properties, and applications. Adv. Mater. 2010, 22, 3906–3924. [Google Scholar] [CrossRef] [PubMed]
  25. Heerema, S.J.; Dekker, C. Graphene nanodevices for DNA sequencing. Nat. Nanotechnol. 2016, 11, 127–136. [Google Scholar] [CrossRef]
  26. Song, H.; Zhang, X.; Liu, Y.; Su, Z. Developing Graphene-Based Nanohybrids for Electrochemical Sensing. Chem. Rec. 2019, 19, 534–549. [Google Scholar] [CrossRef]
  27. Lin, D.; Su, Z.; Wei, G. Three-dimensional porous reduced graphene oxide decorated with MoS2 quantum dots for electrochemical determination of hydrogen peroxide. Mater. Today Chem. 2018, 7, 76–83. [Google Scholar] [CrossRef]
  28. Bobrinetskiy, I.I.; Knezevic, N.Z. Graphene-based biosensors for on-site detection of contaminants in food. Anal. Methods 2018, 10, 5061–5070. [Google Scholar] [CrossRef]
  29. Novikov, S.; Lebedeva, N.; Satrapinski, A.; Walden, J.; Davydov, V.; Lebedev, A. Graphene based sensor for environmental monitoring of NO2. Sens. Actuators B Chem. 2016, 236, 1054–1060. [Google Scholar] [CrossRef]
  30. Kashif, M.; Jaafar, E.; Bhadja, P.; Low, F.W.; Sahari, S.K.; Hussain, S.; Loong, F.K.; Ahmad, A.; AlGarni, T.S.; Shafa, M. Effect of potassium permanganate on morphological, structural and electro-optical properties of graphene oxide thin films. Arab. J. Chem. 2021, 14, 102953. [Google Scholar] [CrossRef]
  31. Kashif, M.; Jafaar, E.; Sahari, S.K.; Low, F.W.; Hoa, N.D.; Ahmad, A.; Abbas, A.; Ngaini, Z.; Shafa, M.; Qurashi, A. Organic sensitization of graphene oxide and reduced graphene oxide thin films for photovoltaic applications. Int. J. Energy Res. 2021, 45, 9657–9666. [Google Scholar] [CrossRef]
  32. Shetti, N.P.; Malode, S.J.; Nayak, D.S.; Bagihalli, G.B.; Reddy, K.R.; Ravindranadh, K.; Reddy, C.V. A novel biosensor based on graphene oxide-nanoclay hybrid electrode for the detection of Theophylline for healthcare applications. Microchem. J. 2019, 149, 103985. [Google Scholar] [CrossRef]
  33. Bard, A.; Faulkner, L.; Leddy, J.; Zoski, C. Electrochemical Methods: Fundamentals and Applications; Wiley: New York, NY, USA, 1980; Volume 2, p. 231. [Google Scholar]
  34. Killedar, L.S.; Shanbhag, M.M.; Malode, S.J.; Bagihalli, G.B.; Mahapatra, S.; Mascarenhas, R.J.; Shetti, N.P.; Chandra, P. Ultra-sensitive detection of tizanidine in commercial tablets and urine samples using zinc oxide coated glassy carbon electrode. Microchem. J. 2022, 172, 106956. [Google Scholar] [CrossRef]
  35. Westbroek, P.; Priniotakis, G.; Kiekens, P. Analytical Electrochemistry in Textiles; Elsevier: Amsterdam, The Netherlands, 2005. [Google Scholar]
  36. Mazzara, F.; Patella, B.; Aiello, G.; O’Riordan, A.; Torino, C.; Vilasi, A.; Inguanta, R. Electrochemical detection of uric acid and ascorbic acid using r-GO/NPs based sensors. Electrochim. Acta 2021, 388, 138652. [Google Scholar] [CrossRef]
  37. Arvand, M.; Ardaki, M.S.; Zanjanchi, M.A. A new sensing platform based on electrospun copper oxide/ionic liquid nanocomposite for selective determination of risperidone. RSC Adv. 2015, 5, 40578–40587. [Google Scholar] [CrossRef]
  38. Yin, T.; Li, H.; Su, L.; Liu, S.; Yuan, C.; Fu, D. The catalytic effect of TiO2 nanosheets on extracellular electron transfer of Shewanella loihica PV-4. Phys. Chem. Chem. Phys. 2016, 18, 29871–29878. [Google Scholar] [CrossRef]
  39. D’Souza, O.J.; Mascarenhas, R.J.; Satpati, A.K.; Basavaraja, B.M. A novel ZnO/reduced graphene oxide and Prussian blue modified carbon paste electrode for the sensitive determination of Rutin. Sci. China Chem. 2019, 62, 262–270. [Google Scholar] [CrossRef]
  40. Mabbott, G.A. An introduction to cyclic voltammetry. J. Chem. Educ. 1983, 60, 697. [Google Scholar] [CrossRef]
  41. Elgrishi, N.; Rountree, K.J.; McCarthy, B.D.; Rountree, E.S.; Eisenhart, T.T.; Dempsey, J.L. A practical beginner’s guide to cyclic voltammetry. J. Chem. Educ. 2018, 95, 197–206. [Google Scholar] [CrossRef]
  42. Junkermeier, C.E.; Solenov, D.; Reinecke, T.L. Adsorption of NH2 on Graphene in the Presence of Defects and Adsorbates. J. Phys. Chem. C 2013, 117, 2793–2798. [Google Scholar] [CrossRef]
  43. Remko, M.; Lyne, P.D.; Richards, W.G. Molecular structure and gas-phase reactivity of zileuton and its N-dehydroxylated metabolite: Two-layered ONIOM calculations. Phys. Chem. Chem. Phys. 2000, 2, 2511–2514. [Google Scholar] [CrossRef]
  44. Shanbhag, M.M.; Shetti, N.P.; Kalanur, S.S.; Pollet, B.G.; Upadhyaya, K.P.; Ayachit, N.H.; Aminabhavi, T.M. Hf-Doped Tungsten Oxide Nanorods as Electrode Materials for Electrochemical Detection of Paracetamol and Salbutamol. ACS Appl. Nano Mater. 2021, 5, 1263–1275. [Google Scholar] [CrossRef]
  45. Ganorkar, S.B.; Shirkhedkar, A.A. Novel HPTLC and UV-AUC analyses: For simple, economical, and rapid determination of Zileuton racemate. Arab. J. Chem. 2017, 10, 360–367. [Google Scholar] [CrossRef]
  46. Ganorkar, S.B.; Dhumal, D.M.; Shirkhedkar, A.A. Development and validation of simple RP-HPLC-PDA analytical protocol for zileuton assisted with Design of Experiments for robustness determination. Arab. J. Chem. 2017, 10, 273–282. [Google Scholar] [CrossRef]
  47. Pian, P.; Labovitz, E.; Hoffman, K.; Clavijo, C.F.; Lynn, R.R.; Galinkin, J.L.; Vinks, A.A.; Malik, P.; Christians, U. Quantification of the 5-lipoxygenase inhibitor zileuton in human plasma using high performance liquid chromatography–tandem mass spectrometry. J. Chromatogr. B 2013, 937, 79–83. [Google Scholar] [CrossRef] [PubMed]
  48. Baezzat, M.R.; Banavand, F.; Fasihi, F. Highly sensitive determination of zileuton using TiO2 nanoparticles and the ionic liquid 1-hexylpyridinium hexafluorophosphate nanocomposite sensor. Ionics 2019, 25, 1835–1844. [Google Scholar] [CrossRef]
  49. Baezzat, M.R.; Bagheri, M.; Abdollahi, E. Molecularly imprinted polymer based sensor for measuring of zileuton: Evaluation as a modifier for carbon paste electrode in electrochemically recognition. Mater. Today Commun. 2019, 19, 23–31. [Google Scholar] [CrossRef]
Figure 1. Molecular structure of ZLT.
Catalysts 12 00867 g001
Figure 2. SEM images of (A) the carbon matrix and (B) the graphene-modified carbon matrix. (C) AFM image of bare CPE. (D) AFM image of G/CPE.
Catalysts 12 00867 g002
Figure 3. Cyclic voltammetric responses for 0.01 mM ZLT solution at CPE and G/CPE in PBS of pH 6.0.
Catalysts 12 00867 g003
Figure 4. Impact of electrolyte solution. (A) Cyclic voltammograms of 0.01 mM ZLT at different pH levels (0.2 M PBS). Effect of pH on (B) Epa, (C) Epc, and (D) peak currents (Ipa and Ipc).
Catalysts 12 00867 g004
Scheme 1. (A) Probable electrochemical conjugation of ZLT with G/CPE. (B) Electrochemical reaction mechanism at the electrode.
Catalysts 12 00867 sch001
Figure 5. Influence of concentration of ZLT. (A) SWV responses of ZLT at different concentrations. (B) Plot of Ipa versus concentration of ZLT.
Catalysts 12 00867 g005
Table 1. A comparison of the proposed method with previously reported methods.
Methods/Sensors UtilizedLD (M)Reference
Determination of ZLTUV-AUC analysis1.8 × 10−6[45]
Amperometry technique—TiO2/CILE1.8 × 10−6[48]
RP-HPLC9.2 × 10−7[46]
DPV technique—MIP/CPE8.0 × 10−7[49]
HPLTC1.0 × 10−7[45]
HPLC–MS1. 8 × 10⁻⁸[47]
DPV technique—TiO2/CILE8.3 × 10−9[48]
SWV technique—G/CPE3.3 × 10−8Present work
Table 2. Finding of spiked urine sample analysis.
Drug SpikedUrine SamplesSpiked
(10−6 M)
Detected *
(10−6 M)
% RecoveryRSD% RSD
ZLTSample 11.00.93293.200.0262.61
Sample 25.04.57991.580.0272.66
Sample 38.07.07388.410.0282.75
* Average of five determinations.
Table 3. Findings about the influence of interferents on the electrochemical response of 0.01 mM ZLT.
InterferentDetected Epa (V)Standard Epa (V)Change in % Epa
Excipients
Cellulose0.4120.424−2.830
Citric acid0.4200.424−0.943
Dextrose0.4200.424−0.943
Glycine0.4160.424−1.887
Starch0.4160.424−1.887
TiO20.4320.4241.887
Metal Ions
CuSO40.4200.424−0.943
FeSO40.4160.424−1.887
KCl0.4200.424−0.943
KNO30.4280.4240.943
MgCl20.4280.4240.943
NaCl0.4280.4240.943
(ZLT) = 1 × 10⁻⁵ M, (Excipient) = 1 × 10⁻³ M, (Metal Ions) = 1 × 10⁻³ M
Table 4. Details about the stability of the electrode.
Repeatability
CV ResponsesDetected Response (µA)Original Response (µA)Response
Retention %
RSD% RSD
At 1st day0.9830.983100.000.01831.83
At 7th day0.9650.98398.170.01871.87
At 14th day0.9470.98396.340.01901.90
% Retention: 96.34–100.0; Average % retention: 98.16; % RSD: 1.86
Reproducibility
At 0 h0.9830.983100.000.02192.19
After 12 h1.0250.983104.270.02102.10
After 24 h0.9960.983101.320.02162.16
% Retention:100.0–104.27; Average % retention: 101.89; % RSD: 2.14
Publisher’s Note: MDPI stays neutral with regard to jurisdictional claims in published maps and institutional affiliations.

