
Catalytic Hydrodeoxygenation of Vanillin, a Bio-Oil Model Compound over Renewable Ni/Biochar Catalyst


1
School of Chemical Engineering, University of Birmingham, Edgbaston, Birmingham B15 2TT, UK
2
Department of Chemical and Biological Engineering, the University of Sheffield, Sheffield S1 3JD, UK
*
Author to whom correspondence should be addressed.
Catalysts 2023, 13(1), 171; https://0-doi-org.brum.beds.ac.uk/10.3390/catal13010171
Submission received: 13 December 2022
/
Revised: 31 December 2022
/
Accepted: 4 January 2023
/
Published: 11 January 2023
(This article belongs to the Topic Catalysis for Sustainable Chemistry and Energy)
Abstract
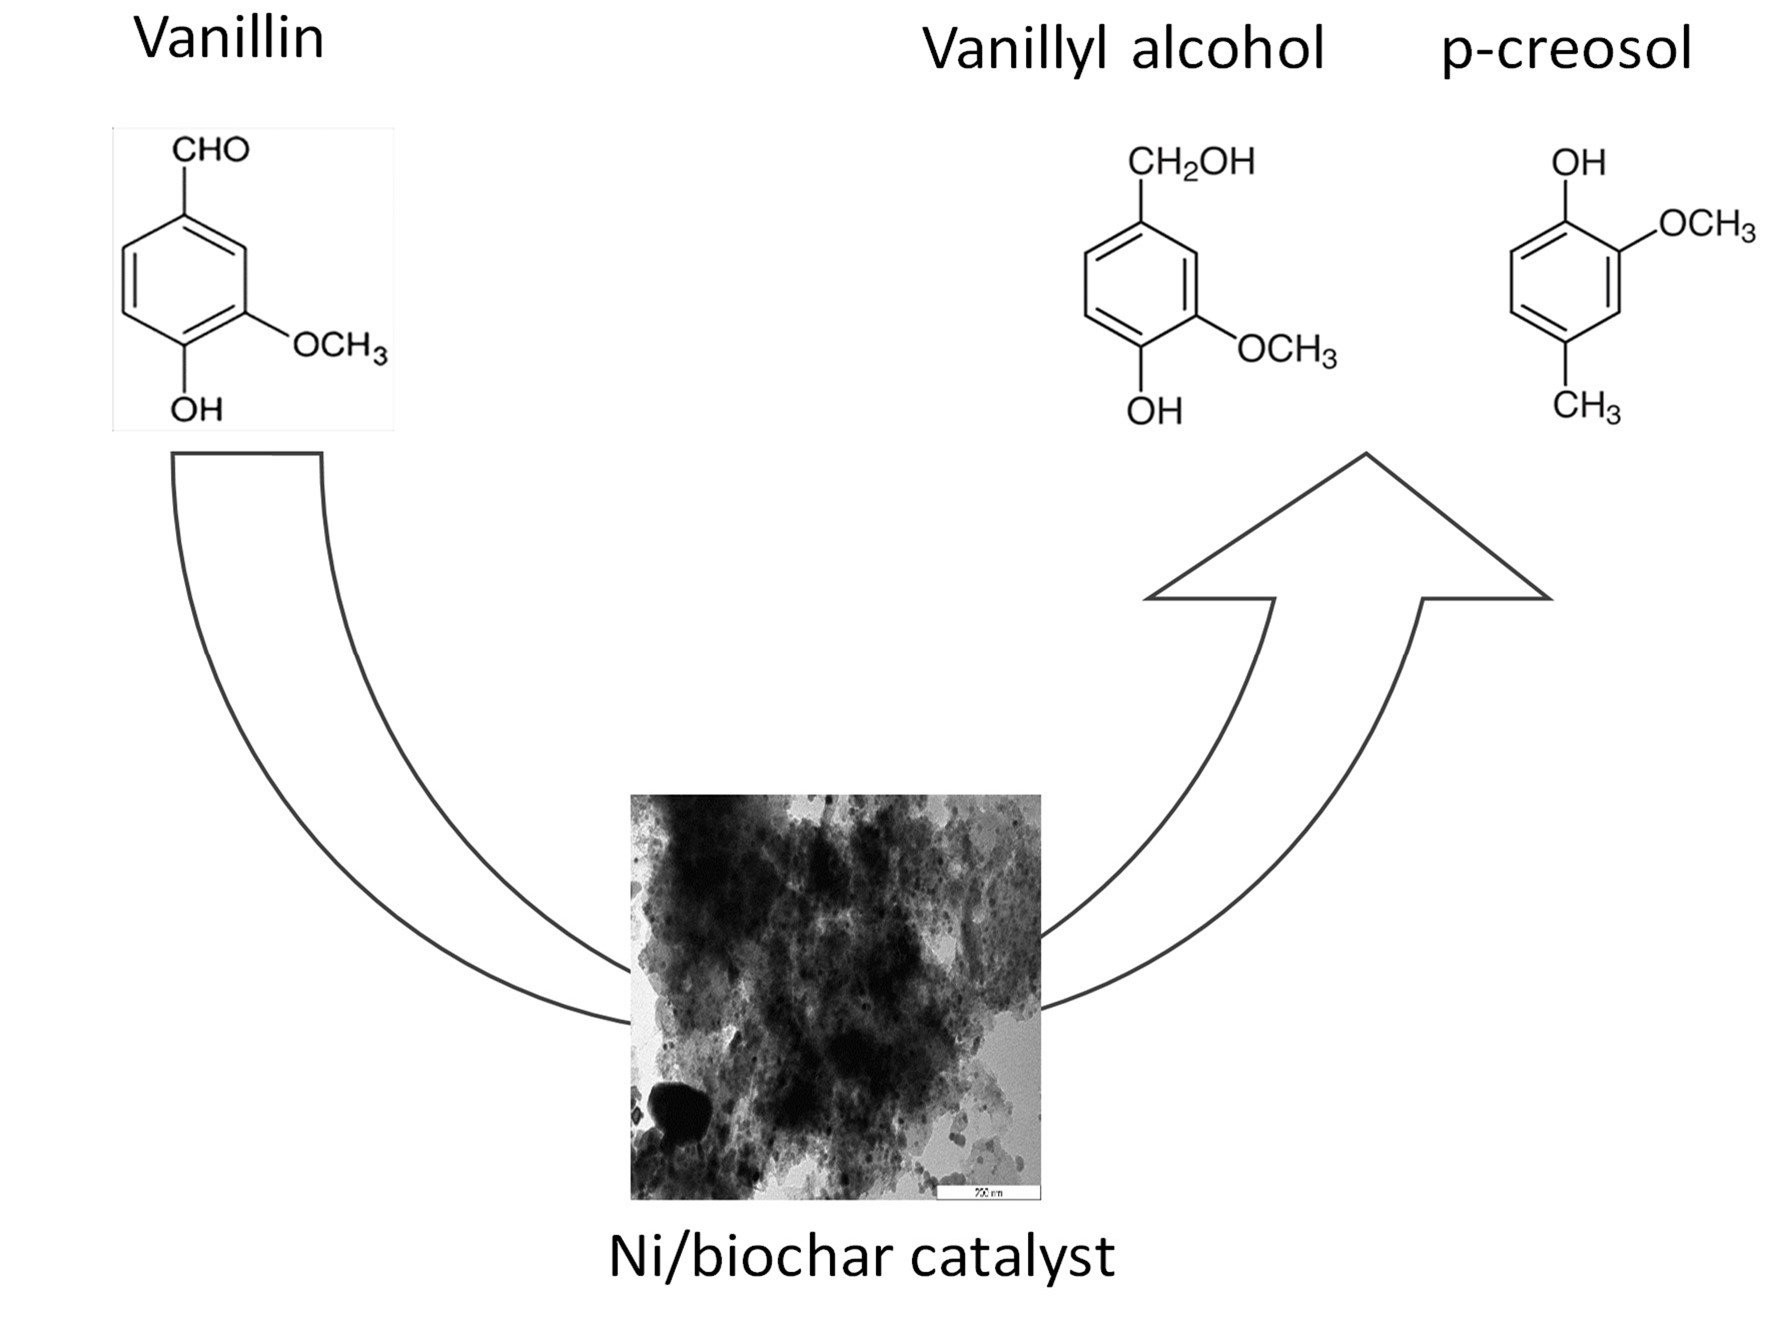
:This study aims to examine the hydrodeoxygenation (HDO) of vanillin, an oxygenated phenolic compound present in bio-oil, into creosol. Biochar residue generated when wood is slowly pyrolyzed is utilized as a catalyst support. To improve biochar’s physicochemical properties, H2SO4 (sulfuric acid) and KOH (potassium hydroxide) are used as chemical activators. By means of a wet impregnation method with nickel salt, an Ni/biochar catalyst was prepared and utilized in the HDO of vanillin using a 100 mL Parr reactor, catalyst loading 0.4–0.8 g, temperature 100 °C to 150 °C, hydrogen (H2) pressures of 30 to 50 bar, and a stirring rate of 1000 rpm. The prepared catalysts were characterized with the nitrogen-sorption isotherm technique, carbon dioxide temperature-programmed desorption (CO2-TPD), scanning electron microscopy (SEM) coupled with energy dispersed X-ray analysis (EDX), X-ray diffraction (XRD), and Fourier-transform infrared spectroscopy (FTIR). Based on chemical treatment, Ni/biochar (KOH) pore sizes were found to be dominated by mesopores, with a surface area increase of 64.7% and a volume increase of 65.3%, while Ni/biochar (H2SO4) was mostly microporous and mesoporous, with an area increase of 372.3% and a volume increase of 256.8% in comparison to Ni/biochar (74.84 m2g−1 and 0.095 cm3g−1). Vanillin conversion of up to 97% with 91.17% selectivity to p-creosol was obtained over Ni/biochar catalyst; in addition to being highly selective and active for p-creosol, a plausible fuel, the catalyst was stable after four cycles. Chemical treatments of the biochar support resulted in improved physicochemical properties, leading to improved catalytic performance in terms of vanillin conversion and p-creosol yield in the order Ni/biochar (H2SO4) > Ni/biochar (KOH) > Ni/biochar.

1. Introduction
Bio-oil and its derivative model compounds are being studied for hydrodeoxygenation (HDO) due to the urgent need to mitigate climate change by developing alternative fuels such as p-creosol for transportation purposes. HDO technology is one of the most effective ways to upgrade bio-oils to make sure they can be used as substitute fuels in the future. As real bio-oil and lignin-based feeds are unstable and complex, several model substrates have been used to study hydrogenation and deoxygenation of phenolic compounds, including anisole, guaiacol, vanillin and m-cresol, to gain a mechanistic understanding of the reactions [1,2]. Vanillin contains three oxygen functional groups, comprising an aldehyde, ether, and hydroxyl in its structure, which makes it difficult to be completely deoxygenated and a good demonstrative model of oxygenate compounds present in bio-oil [3,4,5,6]. Biochar serves as a catalyst carrier in this study for converting vanillin, an oxygenated phenolic compound found in bio-oil, into creosol via HDO. As an upgrade technique, HDO involves the reduction of oxygen content in bio-oil oxygenates, removed in the form of water, carbon dioxide, and carbon monoxide, resulting in a better hydrogen/carbon ratio (H/C) and physicochemical characteristics.
It is well known that pyrolysis can be used to convert biomass into bio-oil, biochar, and gaseous products [7]. In particular, biochar is one of the products of thermo-catalytic reforming, together with liquid bio-oil and gases [6]. Several environmental applications have been found for the biochar residue material, including carbon capture and storage, as an adsorbent for wastewater treatment, and for soil amendment [8,9]. Some of the advantages of using biochar as a catalyst include its renewable nature, ease of preparation, and the ease with which it can be tailored to obtain specific properties such as high surface area and porosity via physical and chemical modifications [10]. This highlights the need to further explore the potential of biochar in heterogeneous catalysis. As a carbon-rich material, biochar can be used as a cheap and renewable catalyst or catalyst support for bio-oil upgrade or conversion into fuels and chemicals. Additionally, its use has been reported as a catalyst carrier in the upgrade of bio-oil itself, the conversion of syngas, and the transesterification for biodiesel production [11,12]. Biochar contains mainly carbon, and the yield of biochar from pyrolysis depends on the biomass, heating rate, particle size, reaction time, purging gas, catalyst used, flow rate and the type of reactor used [13]. This material is suitable for catalyst support due to its high surface area and porosity, among other physicochemical characteristics [14]. Moreover, several pre and post treatments can also alter the properties of biochar support to meet certain desirable physicochemical properties, such as chemical activation and acidic site implantation [15,16]. Treatment of biochar with an acid (H2SO4) or alkali (KOH) can potentially improve its sorption capacity by chemically altering and increasing its surface area and pore distribution. In 2018, Sajjadi et al. published a comprehensive review on the chemical activation of biochar, including H2SO4 and KOH, which had a beneficial effect on the physicochemical properties, functionalities, and applications of biochar [17]. It is believed that KOH reacts with active O-containing species in biochar, which is the main reaction in which KOH is converted to K2CO3, resulting in large quantities of gaseous products that increase the specific surface area and porosity of the biochar [18]. Likewise, a specific reaction mechanism of H2SO4 with a carbon source can also explain the improved pore volume and mesoporosity of biochar. Furthermore, by means of FTIR analysis, it has been found that the biochar surface possesses functional groups such as a phenolic group, C-O-C, and -COOH [19]. These surface functional groups are known to improve the interaction of reactants with biochar surfaces during reactions. Additionally, functional groups on the surface of biochar could improve the dispersion of active sites by improving the interaction between the active metal and the support, allowing the active metal to be more readily accessed by the substrate and hydrogen during HDO.
Vanillin HDO over noble metal catalysts such as Pd, Au, and Ru supported on biochars has been reported in the literature [5]. The economic considerations of the overall process are significantly impacted by the cost of noble metal: even though about 92% selectivity toward p-creosol was achieved at complete vanillin conversion after 3 h, the commercialization of noble metal catalysts for HDO is difficult because of their high cost. Furthermore, the following catalysts have been screened for HDO of vanillin: Pd/C, PdRh/Al2O3, Pd/Al2O3, Pt/C, Pt/SiO2, and Rh/Al2O3, finding that the bimetallic PdRh/Al2O3 catalyst consumed the lowest amount of hydrogen, and exhibited significantly high (99%) selectivity toward creosol [3,4]. The costs of catalyst carriers contribute substantially to the overall cost of HDO, in addition to the noble metals. The use of Ni/C catalyst for the HDO reaction of m-cresol as a bio-oil model compound has been reported, resulting in toluene and methylcyclohexane, as well as a variety of other non-HDO products [20]. Additionally, the results of an Ni-Co-P/HAP (hydroxyapatite) catalyst for in situ HDO of vanillin showed excellent catalytic activity, resulting in 97.86% conversion and 93.97% selectivity toward 2-methoxy-4-methylphenol [21]. In this study, a low-cost HDO catalyst was developed using nickel salt and biochar residue from the pyrolysis of biomass. The pyrolysis of biomass produces bio-oil and biochar as a residue. In this context, recycling biochar as a catalyst carrier for the HDO of bio-oil or its model compound will improve the overall economy of the process by means of circular economy [6]. By using renewable biochar as a catalyst carrier, and non-noble metals like nickel as active materials, the HDO process for bio-oil upgrade becomes more sustainable and cost-effective. Non-noble metals such as nickel, molybdenum, cobalt, copper, etc., make up the second group of HDO catalysts for bio-oil model compounds [22,23,24]. These non-precious metals demonstrate good activity as catalysts for upgrading bio-oil and its model compounds, and to achieve comparable selectivity and activity, they require higher metal loadings, usually by 10–15%, compared to their noble metal counterparts [25,26,27]. In contrast to noble metal catalysts, these catalysts have low activity and selectivity, but because of their lower cost and ease of design, they can be readily commercialized.
As opposed to eliminating all three oxygen atoms from vanillin HDO, the focus is on producing p-creosol, which has been reported to be a potential fuel. As a second test, HDO of vanillin to p-creosol is used to evaluate the concept of using biomass-derived catalyst support. Compared to previous studies, where either activated carbon or alumina were used as a catalyst support with either noble metal or bimetallic catalysts, this study seeks to increase the economic value of biochar by incorporating it in HDO process catalytic applications to increase the overall economics of upgrading bio-oil. The catalyst activity is also significantly affected by the choice of catalytic supports. Catalysts with carbon-based carriers have also been reported to perform better by modifying their physicochemical properties chemically or physically [28]. Therefore, in this study, chemical activation is employed to improve pore structure, surface area, and other physicochemical properties of biochar derived from thermocatalytic reforming (TCR) by treating it with sulfuric acid and potassium hydroxide (KOH). Improving the surface area and internal pore structure of the biochar will enhance mass transport and Ni metal dispersion, improving catalytic performance [28,29]. Hence, the objective of this study is to develop a robust and low-cost catalyst for HDO of vanillin, a bio-oil model compound, into p-creosol, as a potential fuel, using nickel-impregnated biochar derived from the pyrolysis of biomass. Therefore, among the novel aspects of this study are the development of HDO catalysts based on biochars obtained from TCR, as well as chemical activation of biochar for improvements in mass transfer, metal dispersion and mesoporous properties, and consequently the process optimization was systematically investigated.
2. Results and Discussion
2.1. Catalyst Characterization
Physicochemical Properties of the Prepared Catalysts
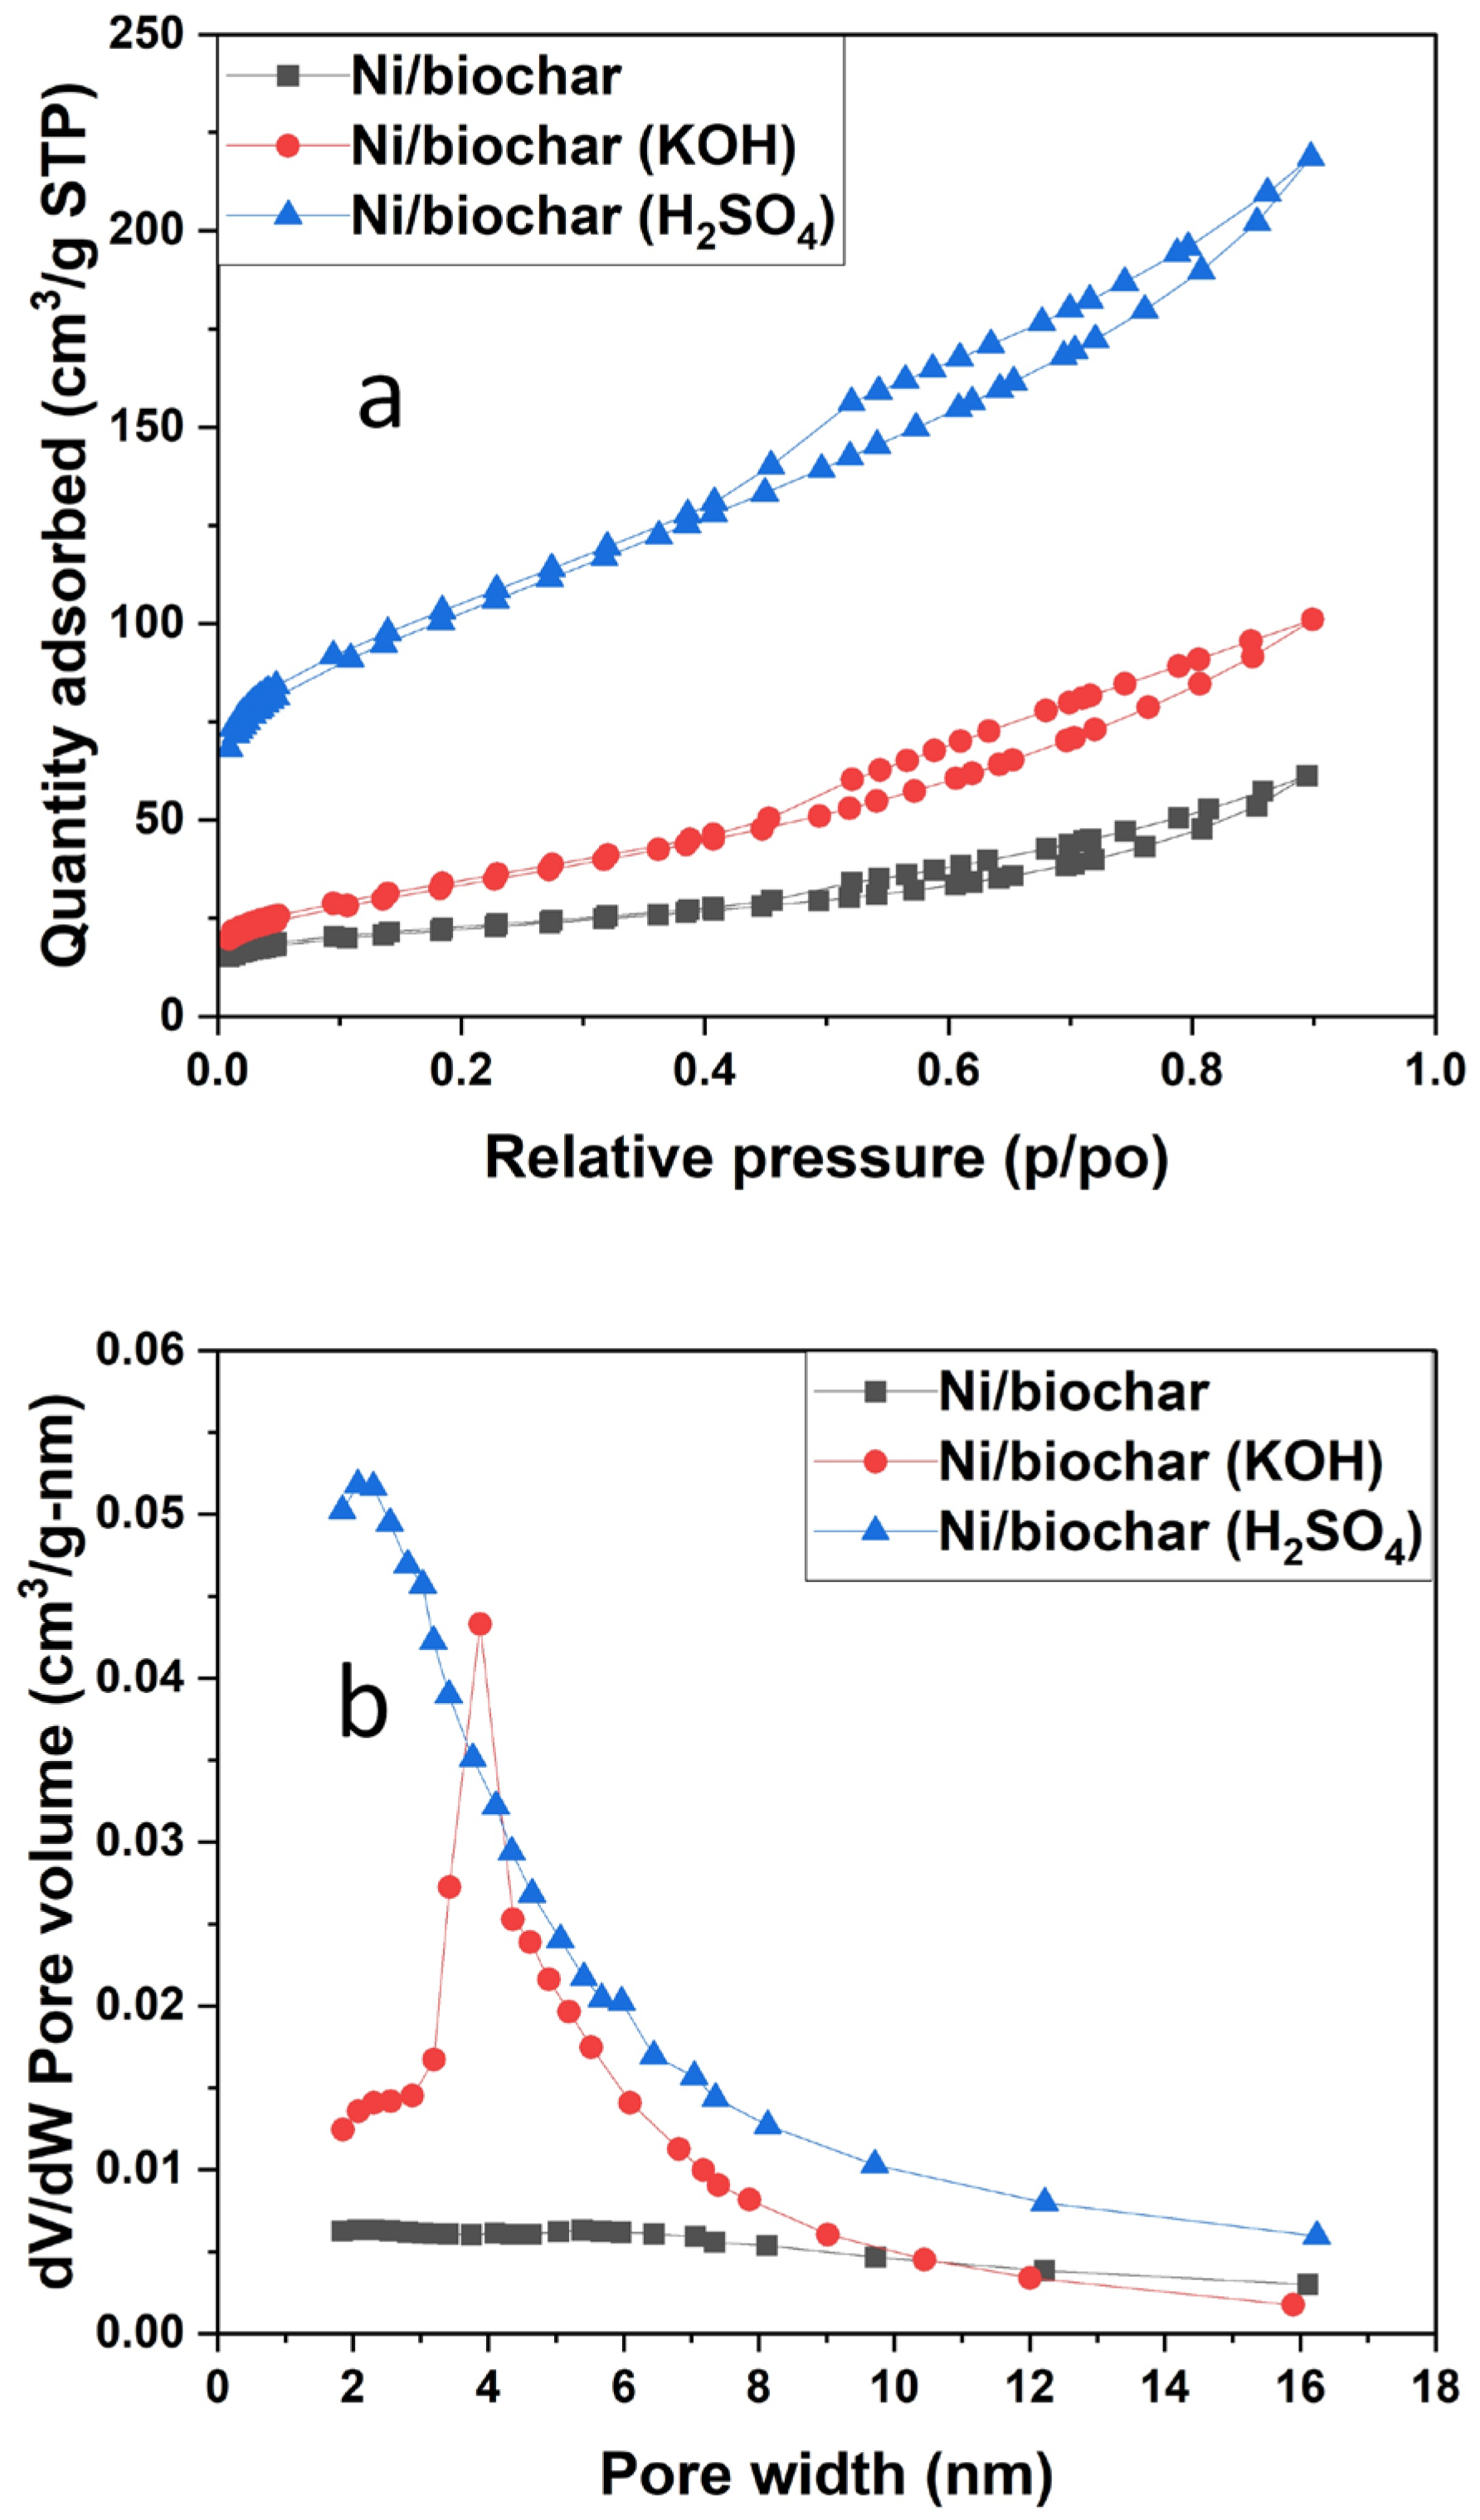
Table 1 shows the surface area calculated using the BET equation and the pore volume estimated using BJH equation for the prepared Ni/biochar, Ni/biochar (KOH) and Ni/biochar (H2SO4) catalysts, while their nitrogen-sorption isotherms and pore size distributions are shown in Figure 1. In all cases, the adsorption–desorption hysteresis patterns indicate that they are Type IV isotherms, which is consistent with the presence of mesoporous structures—2 nm to 50 nm (Figure 1a). Chemical treatment created more mesoporous structures in the biochar, resulting in an increase in gas uptake as a function of relative pressure (P/P0). However, the hysteresis loops were similar in shape but occurred at different positions in terms of relative pressure, size, and volume due to the increase in the pore size of the biochar caused by the chemical treatment. Consequently, the H3 hysteresis loops are thought to be associated with aggregates of plate-like particles that form slit-like pores [30]. It can be observed that both the surface area and the pore volume of the catalyst increased significantly for the chemically treated biochar support in relation to the untreated biochar (Table 1). For the chemical activation of biochar with KOH, the surface area and pore volumes increased by 64.8% and 65.3%, respectively, compared to that of Ni/biochar (74.84 m2g−1 and 0.095 cm3g−1). Meanwhile, acid treatment with H2SO4 resulted in a 372.3% increase in surface area and a 256.8% increase in pore volume relative to Ni/biochar. However, in Figure 1b, it can be observed that the mesopores of the chemically treated biochar improved compared to the Ni/biochar. The Ni/biochar (H2SO4) developed narrower mesopores compared to those found in Ni/biochar (KOH). This suggests that chemical treatment has the potential to create mesopores (i.e., pores with sizes of 2 to 50 nm) within the biochar as a result of leaching, dehydration and oxidation [31,32]. This enhanced mesoporous structure of the biochar following chemical treatment explains the increases in surface area and pore volume, with surface area and pore volume decreasing in the following order: Ni/biochar (H2SO4) > Ni/biochar (KOH) > Ni/biochar. This is also consistent with findings reported in the literature regarding chemical activation [33,34]. ICP-OES analyses revealed that the actual Ni metal content in the prepared catalysts ranges from 14.7 to 15.3%.
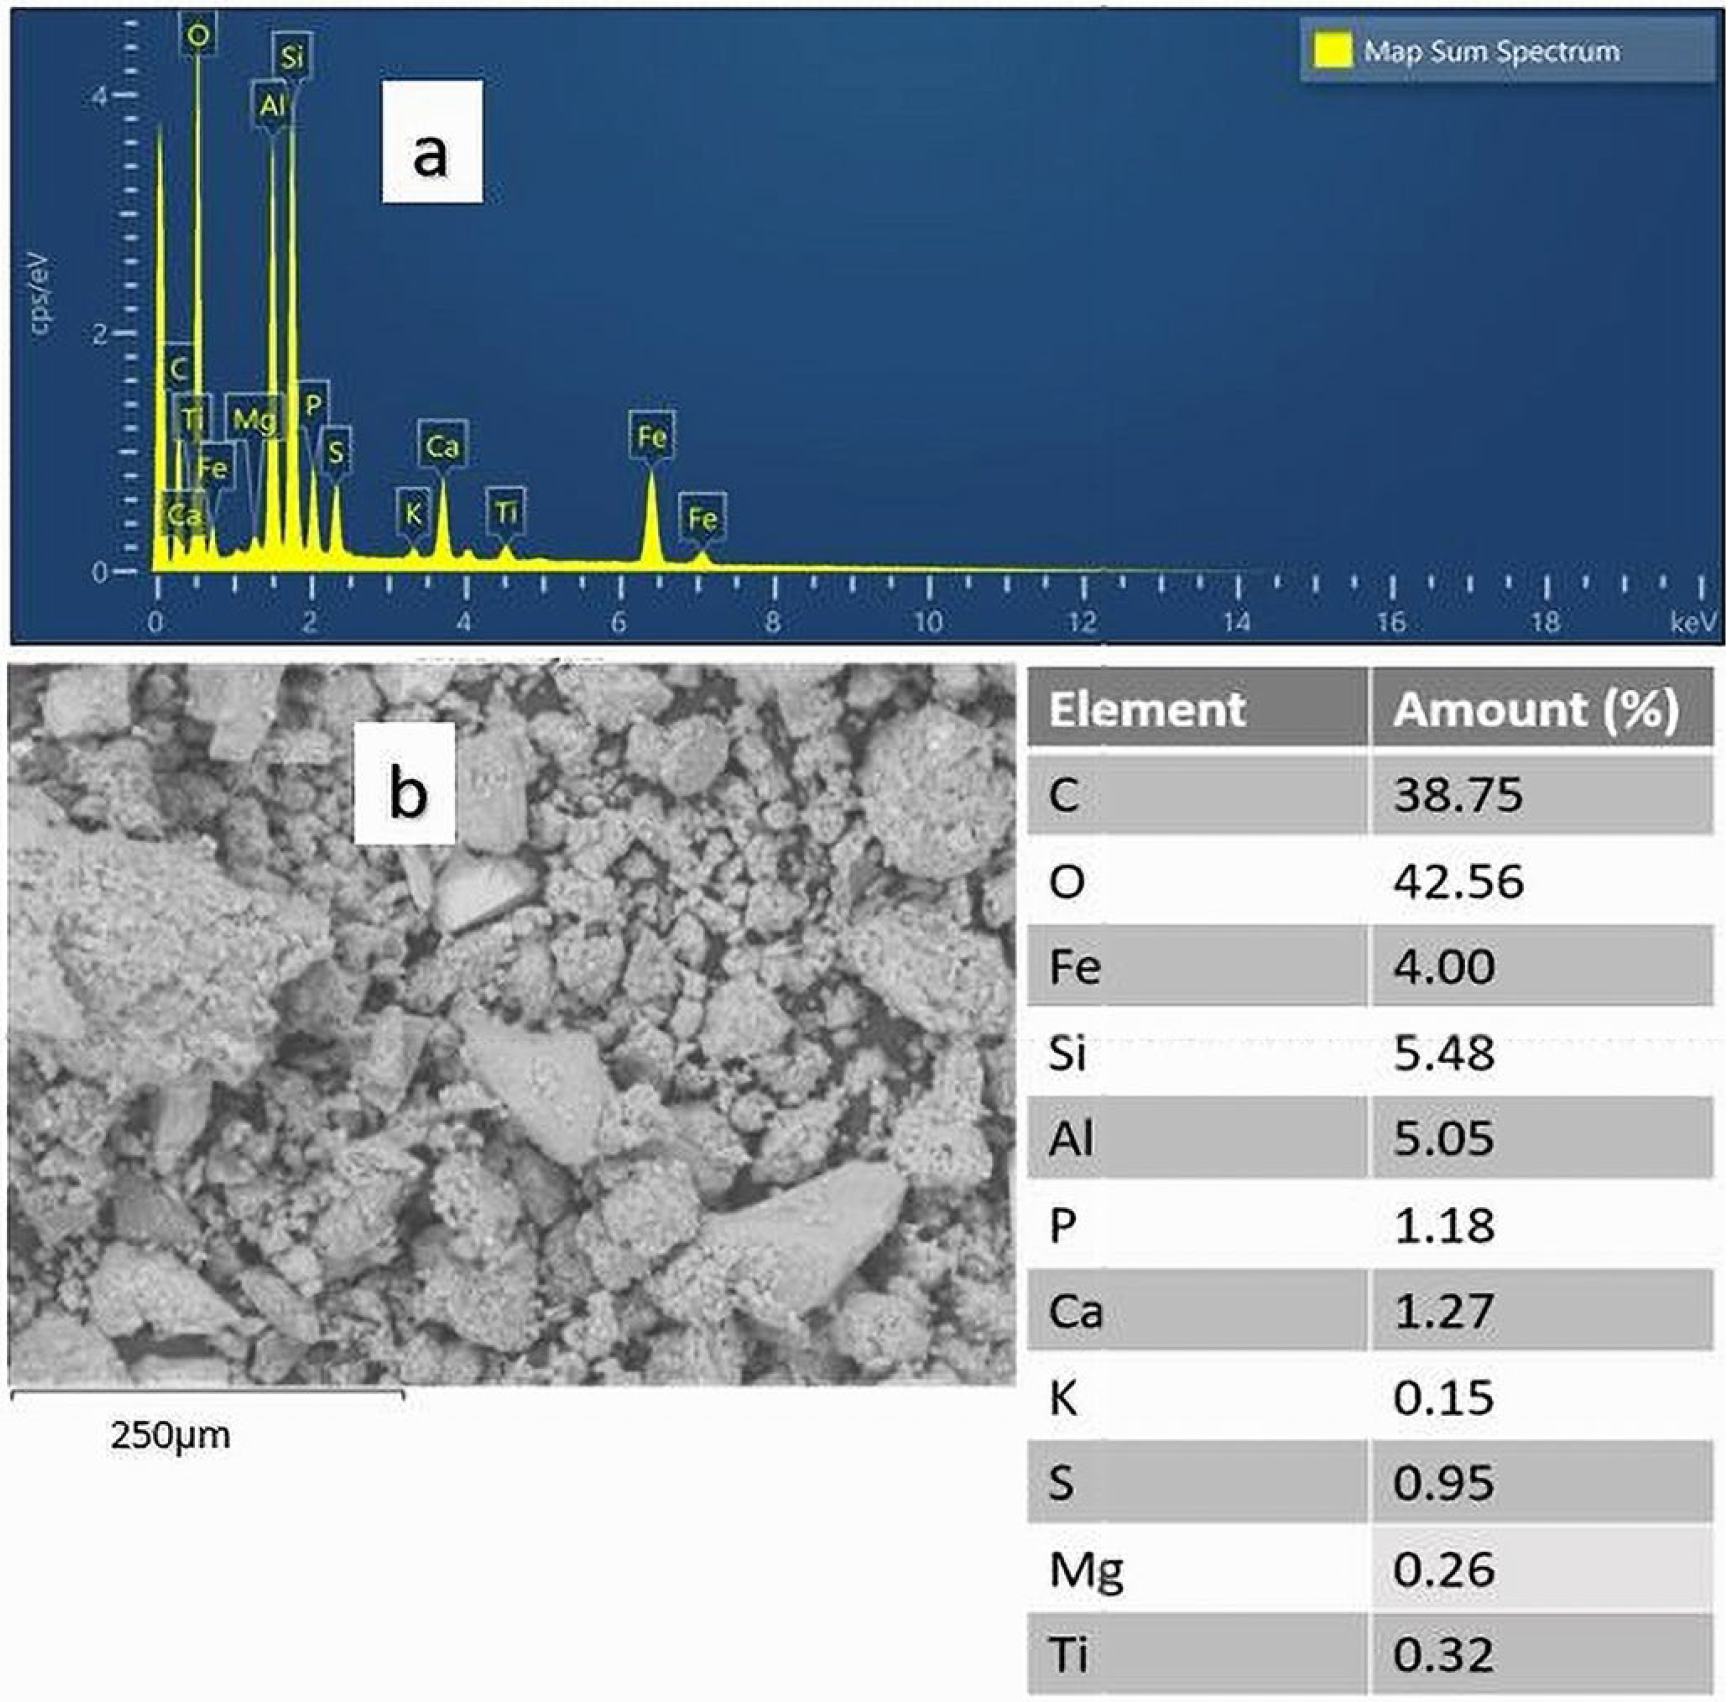
The SEM photomicrograph of the biochar is shown in Figure 2. The surface topology and morphology reveal that the raw biochar is composed of agglomerated particles with irregular shapes and sizes and rough surfaces (Figure 2a). Based on the EDX elemental analysis, it is clear the raw biochar contains the following elements: Al, Si, Fe, K, Ca, Mg, Ti, S, and P, which may have originated from the source or parent biomass (Figure 2b). Furthermore, elemental mapping by EDX indicated that the biochar was composed of uniformly distributed oxygen (42.6%) and carbon (38.8%), occurring as a result of charring caused by the pyrolysis of the biomass. It has been reported in the literature that some of the oxygen atoms in biochar belong to existing functional groups or are part of functional groups arising from the pyrolysis bio-oil originating from the source biomass [35].
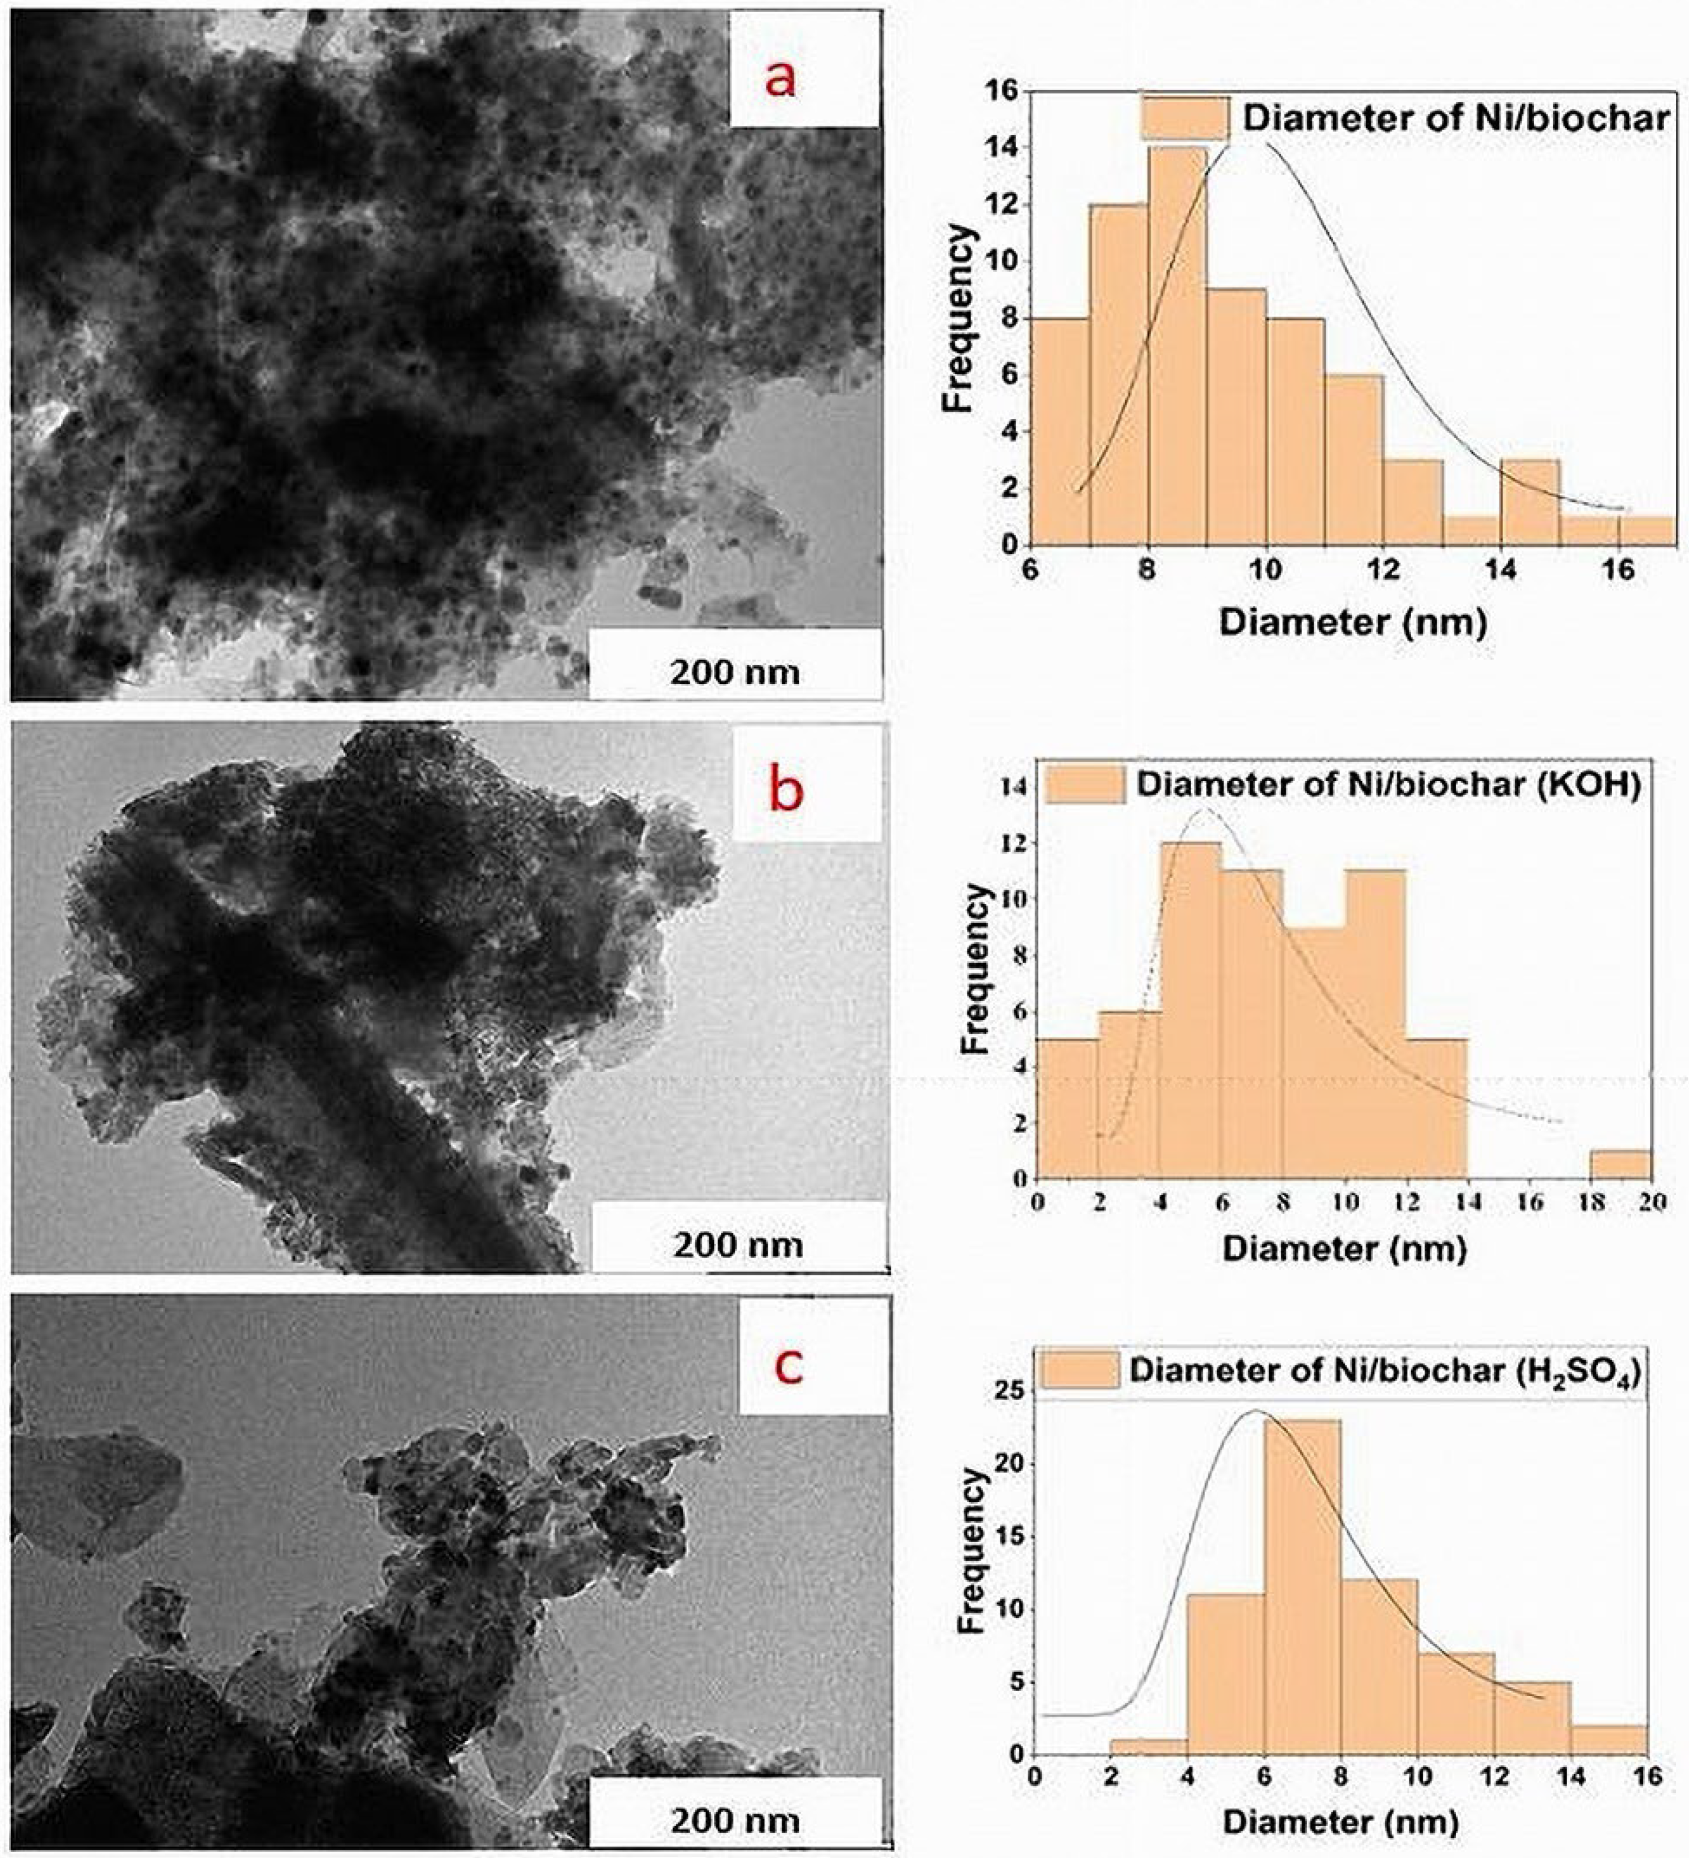
The TEM images and grain size distribution of the Ni nanoparticles are shown in Figure 3. It is worth noting that the area covered with the shadows of particles over a light background corresponds to clusters of Ni nanoparticles dispersed on the biochar surface. The grain size of Ni nanoparticles on the Ni/biochar, determined on the basis of image analysis performed using image J software, is mostly between 6 and 11 nm, whereas that of Ni/biochar (KOH) is between 4 and 12 nm and that of Ni/biochar (H2SO4) is between 4 and 10 nm. Overall, the average Ni grain sizes on the surfaces of the catalysts are 7.5 nm (Ni/biochar), 9.5 nm (Ni/biochar (KOH)) and 8.5 nm (Ni/biochar (H2SO4)). The Ni metal nanoparticles are aggregated (Figure 3). While chemically treating biochar with KOH and H2SO4 increases its mesoporosity and surface area, there was no significant enhancement in the dispersion of active Ni metal relative to Ni/biochar.
Metals are mostly present in their oxide form, which is confirmed by the XRD analysis of the biochar (Figure 4). Notably, the following trace elements were detected: Si (5.48%), Al (5.05%), Fe (4.0%), Ca (1.27%), and P (1.18%), along with others (K, S, Mg, and Ti) with concentrations lower than 1%, which were well distributed on the surface of the biochar (Figure S1a–k). This demonstrates the heterogeneous nature of the biochar surface. Interestingly, it has been reported in the literature that oxides of Ti, Al, and Si provide excellent catalytic support to Ni and Cu for HDO reactions [34,36,37,38]; thus, despite their minor occurrence on the surface of the biochar, they could contribute to the performance of the prepared Ni/biochar catalysts. The dispersion of these elements on the surface of the biochar can be found in the Supplementary Materials Figure S1.
Figure 4 shows the XRD diffraction patterns of the fresh and used catalysts. The sharpness of most of the peaks in the XRD patterns indicates that the biochars and their corresponding catalysts possess good crystallinity. The broad diffraction peak at 2θ = 25.7° indicates the presence of graphite (002), which is an amorphous carbon with irregular structure [35]. The pyrolysis of biomass into biochar and bio-oil results in the formation of graphite. Compared to raw biochar and biochar (KOH), the acid-treated biochar (biochar (H2SO4)) exhibited an amplified intensity in some peaks, such as CaCO3, CaO and Al2O3 (Figure 4a). The other peaks that can be identified in the XRD patterns include SiO2, occurring at 2θ = 21.33° and 27.07 [36], and CaO, CaCO3, Ca (OH)2 and Al2O3, appearing at 2θ = 38.92°, 46.13°, 50.54° and 68.61°, respectively [37,38].
In addition to the peaks of the biochar supports, both fresh and used catalysts exhibited the characteristic peaks of NiO at 2θ values of 37°, 44.5° and 64.5° (Figure 4b,c) [39]. The presence of oxidized NiO nanoparticles on the surface of the biochar indicates that the impregnated nickel (ii) nitrate hexahydrate decomposed during calcination. Interestingly, in the XRD patterns before and after the reaction experiments, the peak positions and intensities of the catalysts did not change (Figure 4b,c), which indicates that no phase transformation or deactivation occurred as a result of the HDO of vanillin over the course of the reaction time.
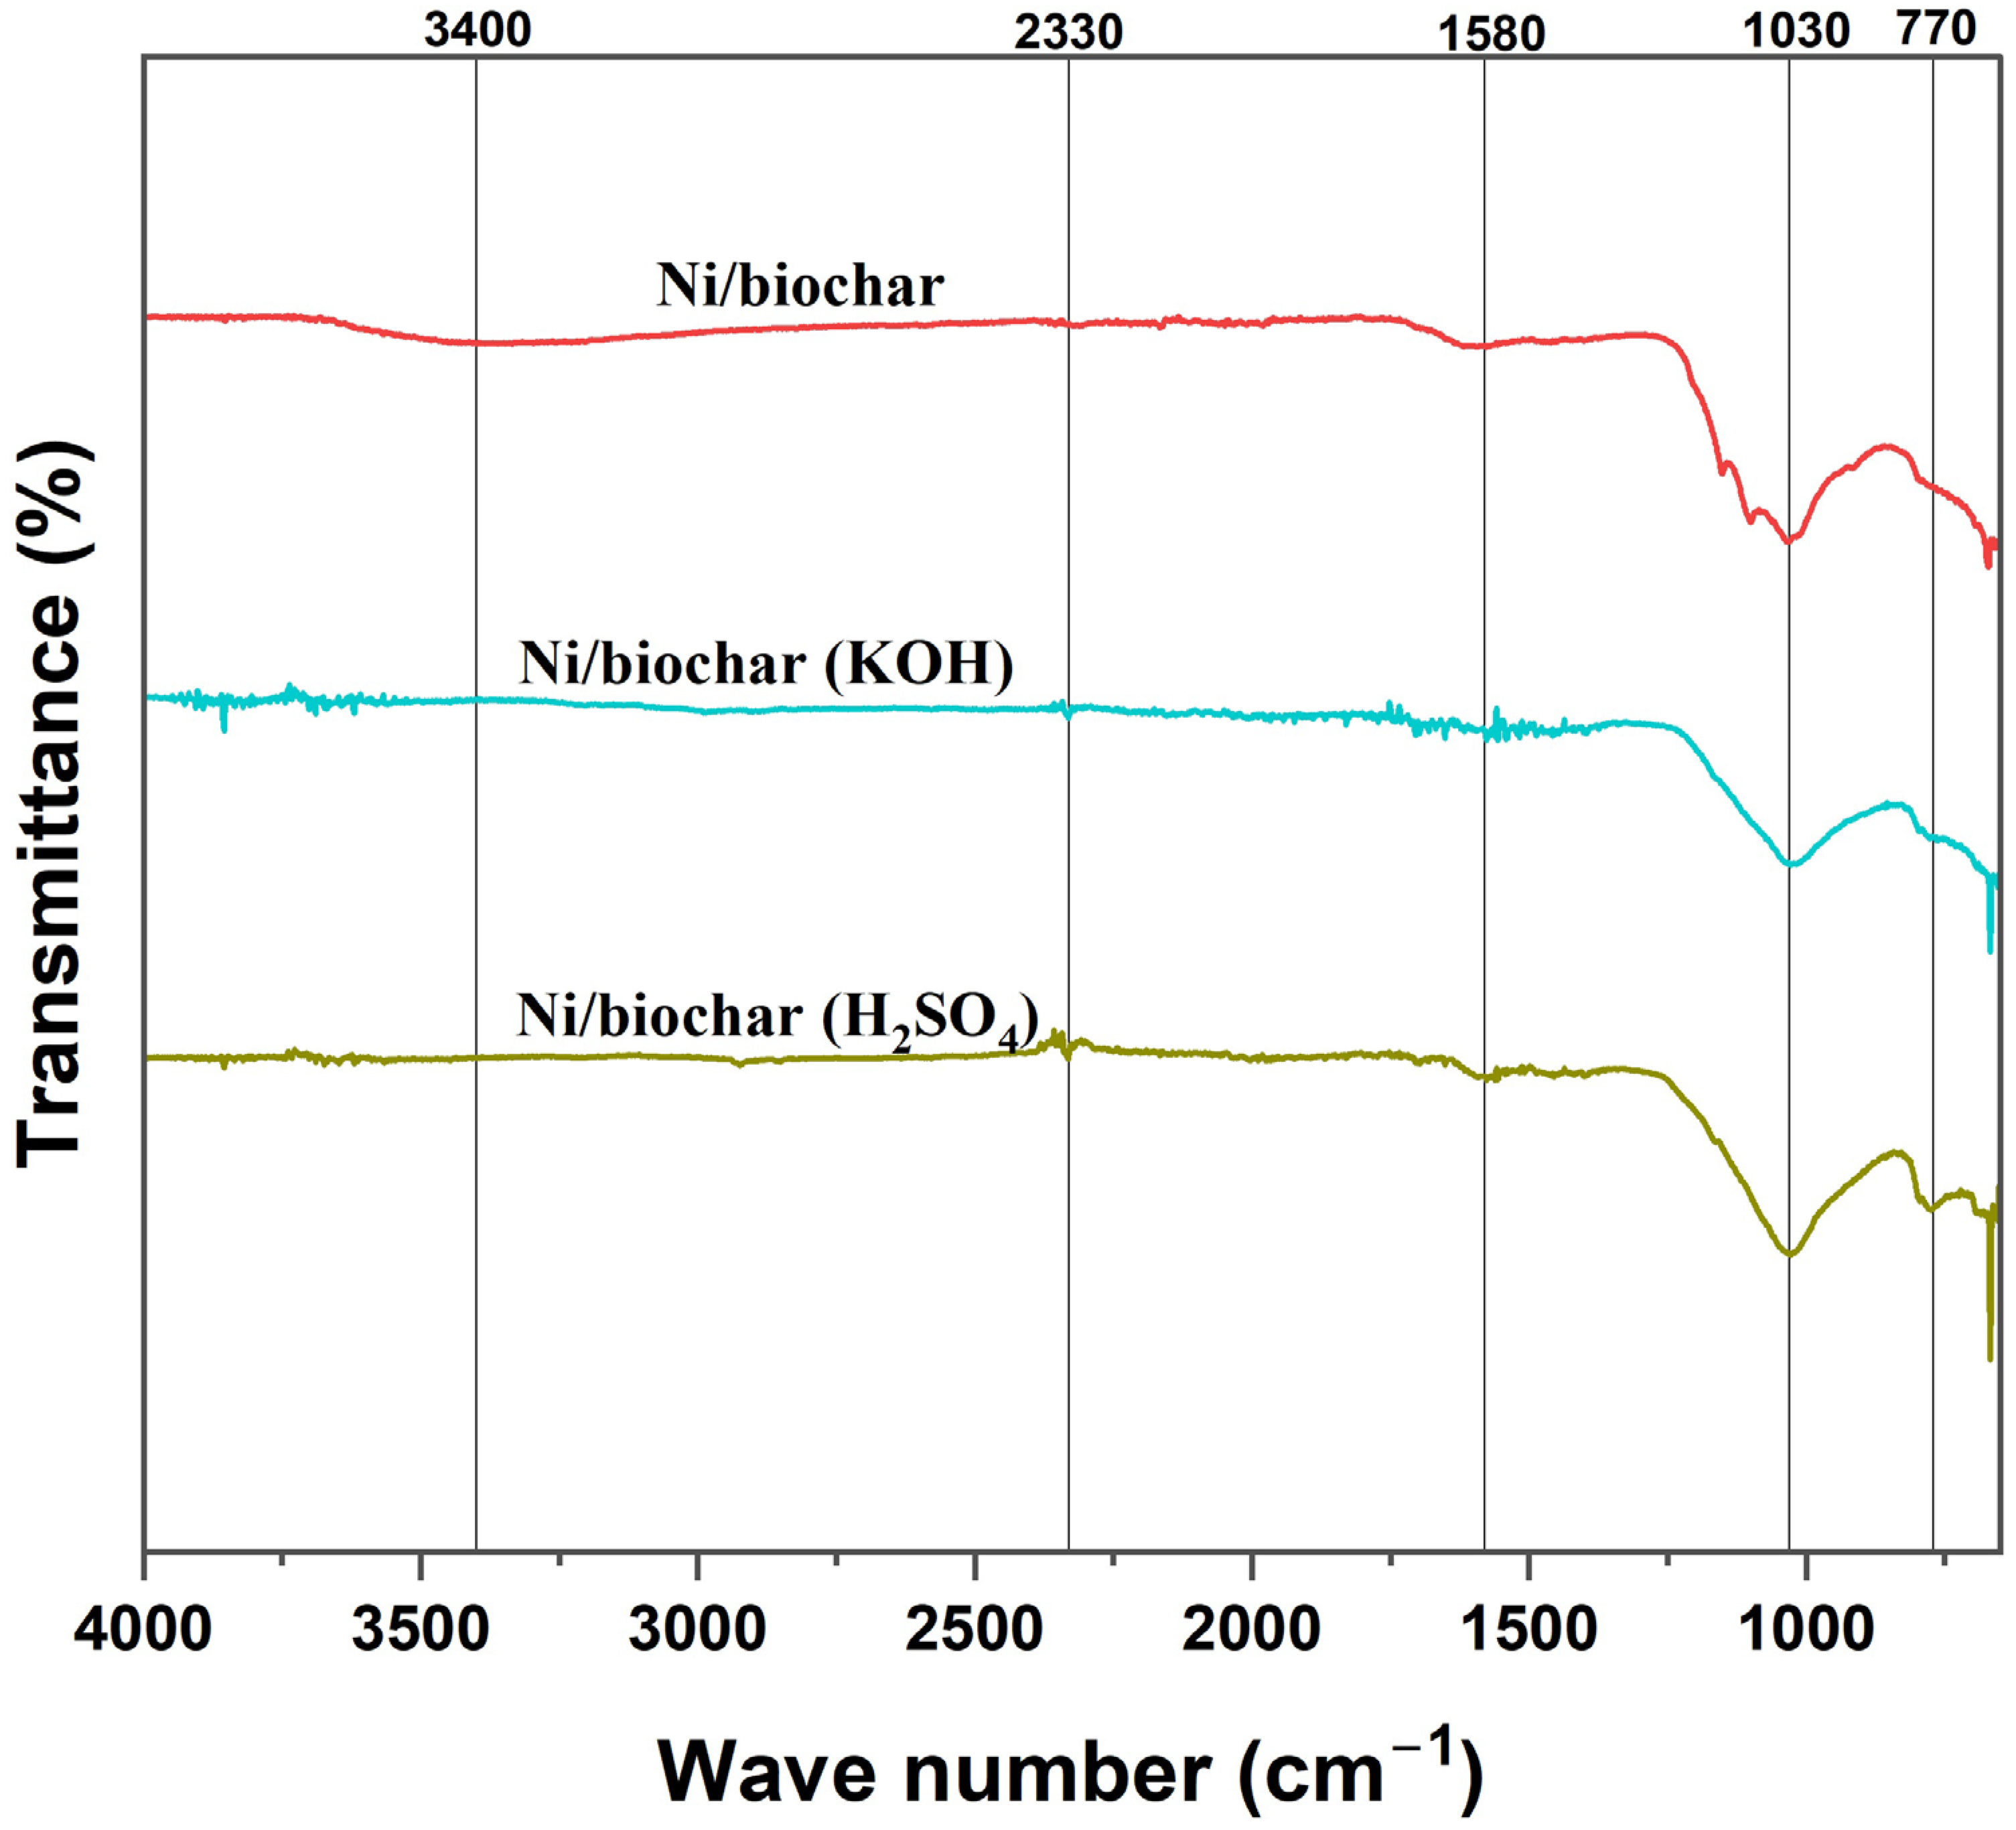
Figure 5 shows the FTIR spectra of the prepared Ni catalysts supported on biochar, biochar (KOH), and biochar (H2SO4). The results reveal the presence of several matching functional groups, such as a phenolic OH-group at 3400 cm−1 [40], carboxylic acids, -COOH, at 2330 cm−1 [41], -C-O stretching in cellulose at 1030 cm−1 [42], and C=C vibration for aromatic groups at 1580 cm−1 [40]. A decrease in the intensity of the –OH functional group peak and a slight decrease in the C=C vibration peak for aromatic groups can be observed in the spectrum of Ni/biochar (KOH) and Ni/biochar (H2SO4), indicating that some of the surface functionalities of the biochar support may have been lost as a result of acidic and basic treatments.
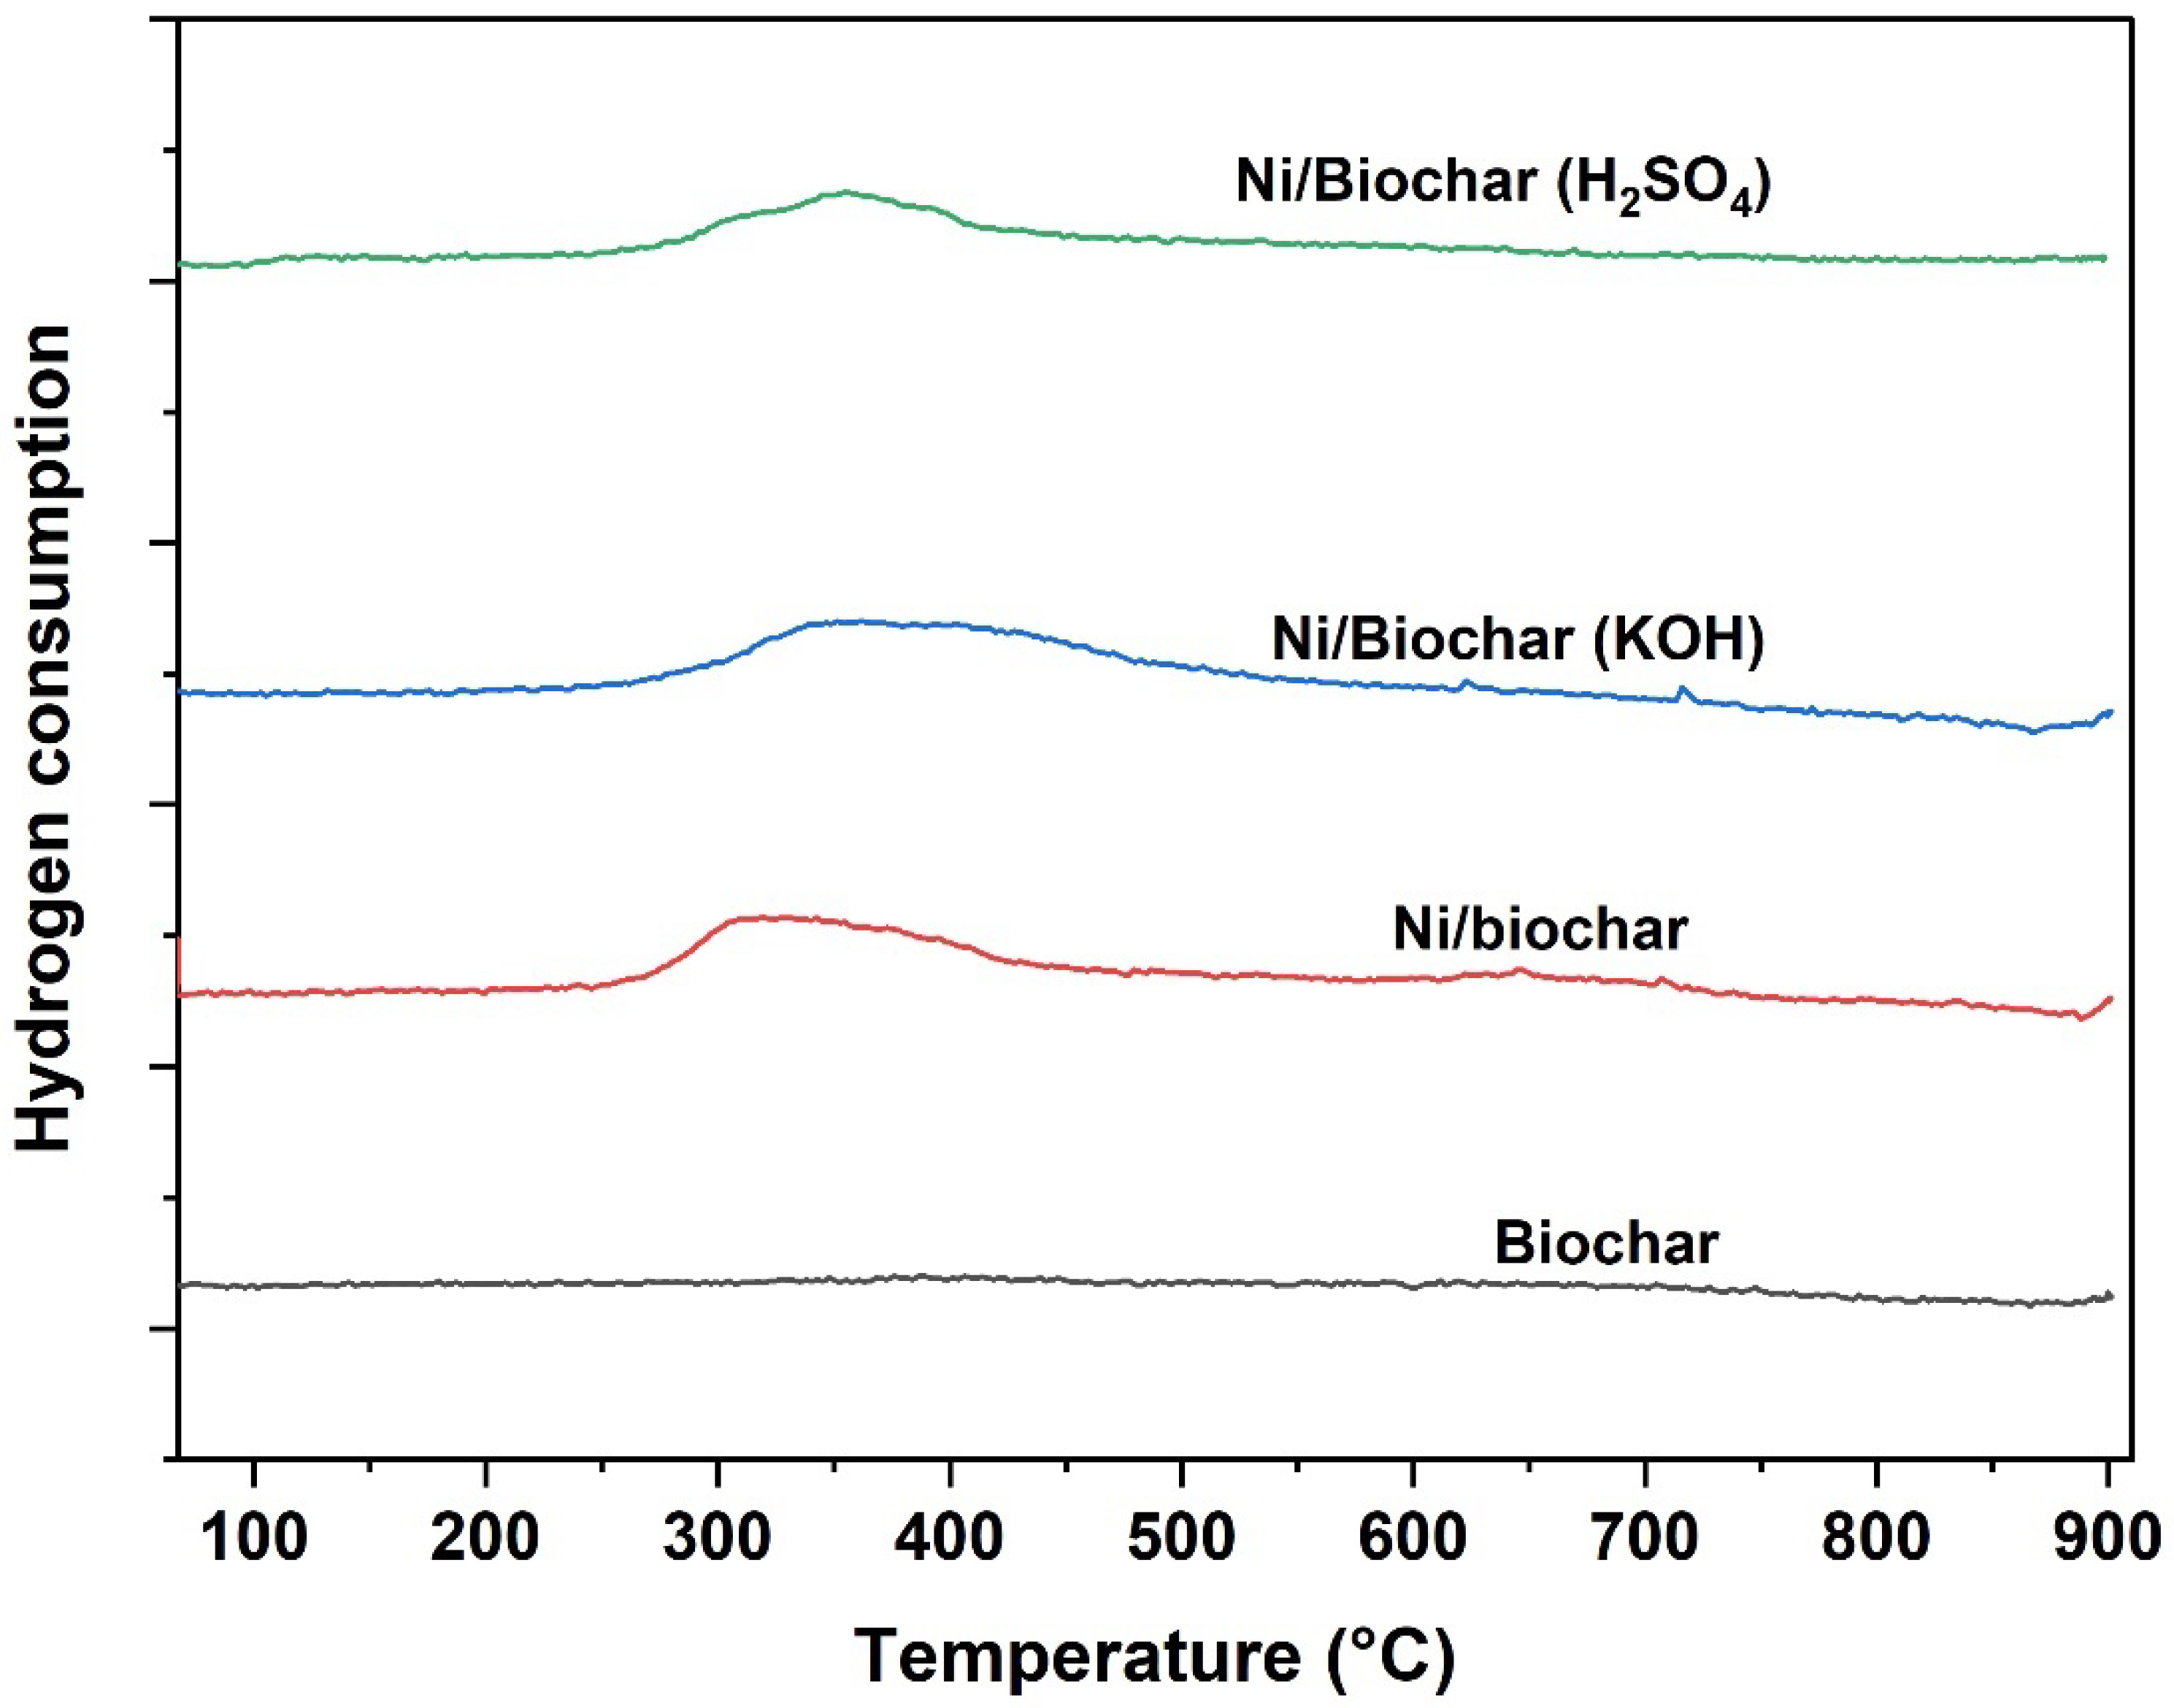
A study of the surface chemistry of the prepared catalyst was performed, particularly the reduction of the impregnated Ni metal and its oxides (NiO) in the catalyst. Temperature-programmed reduction (TPR) was carried out using hydrogen gas as a reducing agent, while CO2-TPD was also performed. Figure 6 shows the H2-TPR profiles of the raw biochar support and the 15 wt% Ni/biochar, 15 wt% Ni/biochar (KOH) and 15 wt% Ni/biochar (H2SO4) catalysts. No reduction peak can be observed in the raw biochar, confirming that the metal oxides found in the biochar as revealed by EDX and XRD remained in their oxide states even at high temperatures under constant hydrogen flow; thus, they were able to contribute to the reaction as catalysts. However, a reduction peak can be observed for the Ni-supported catalysts Ni/biochar, Ni/biochar (KOH), and Ni/biochar (H2SO4) at temperatures between 300 °C and 450 °C.
The reduction peaks occurred at 350 °C for both 15 wt% Ni/biochar and 15 wt% Ni/biochar (H2SO4), and at 400 °C for 15 wt% Ni/biochar (KOH). Previous studies have reported that nickel oxide (NiO) can be reduced to metallic nickel in hydrogen at 400 °C to ensure the conversion of all nickel oxides to the metallic nickel [43,44,45]. The results of this study show, however, that total reduction of nickel oxide precursors takes place slightly beyond 400 °C for all precursors. The 350 to 400 °C reduction temperature observed in the prepared catalyst represents weak to moderate Ni–support interaction. These reduction temperatures represent a reduction in NiO, which is not present in the raw biochar itself. Consequently, the Ni–support interaction is stronger for 15 wt% Ni/biochar (KOH) than for 15 wt% Ni/biochar or 15 wt% Ni/biochar (H2SO4).
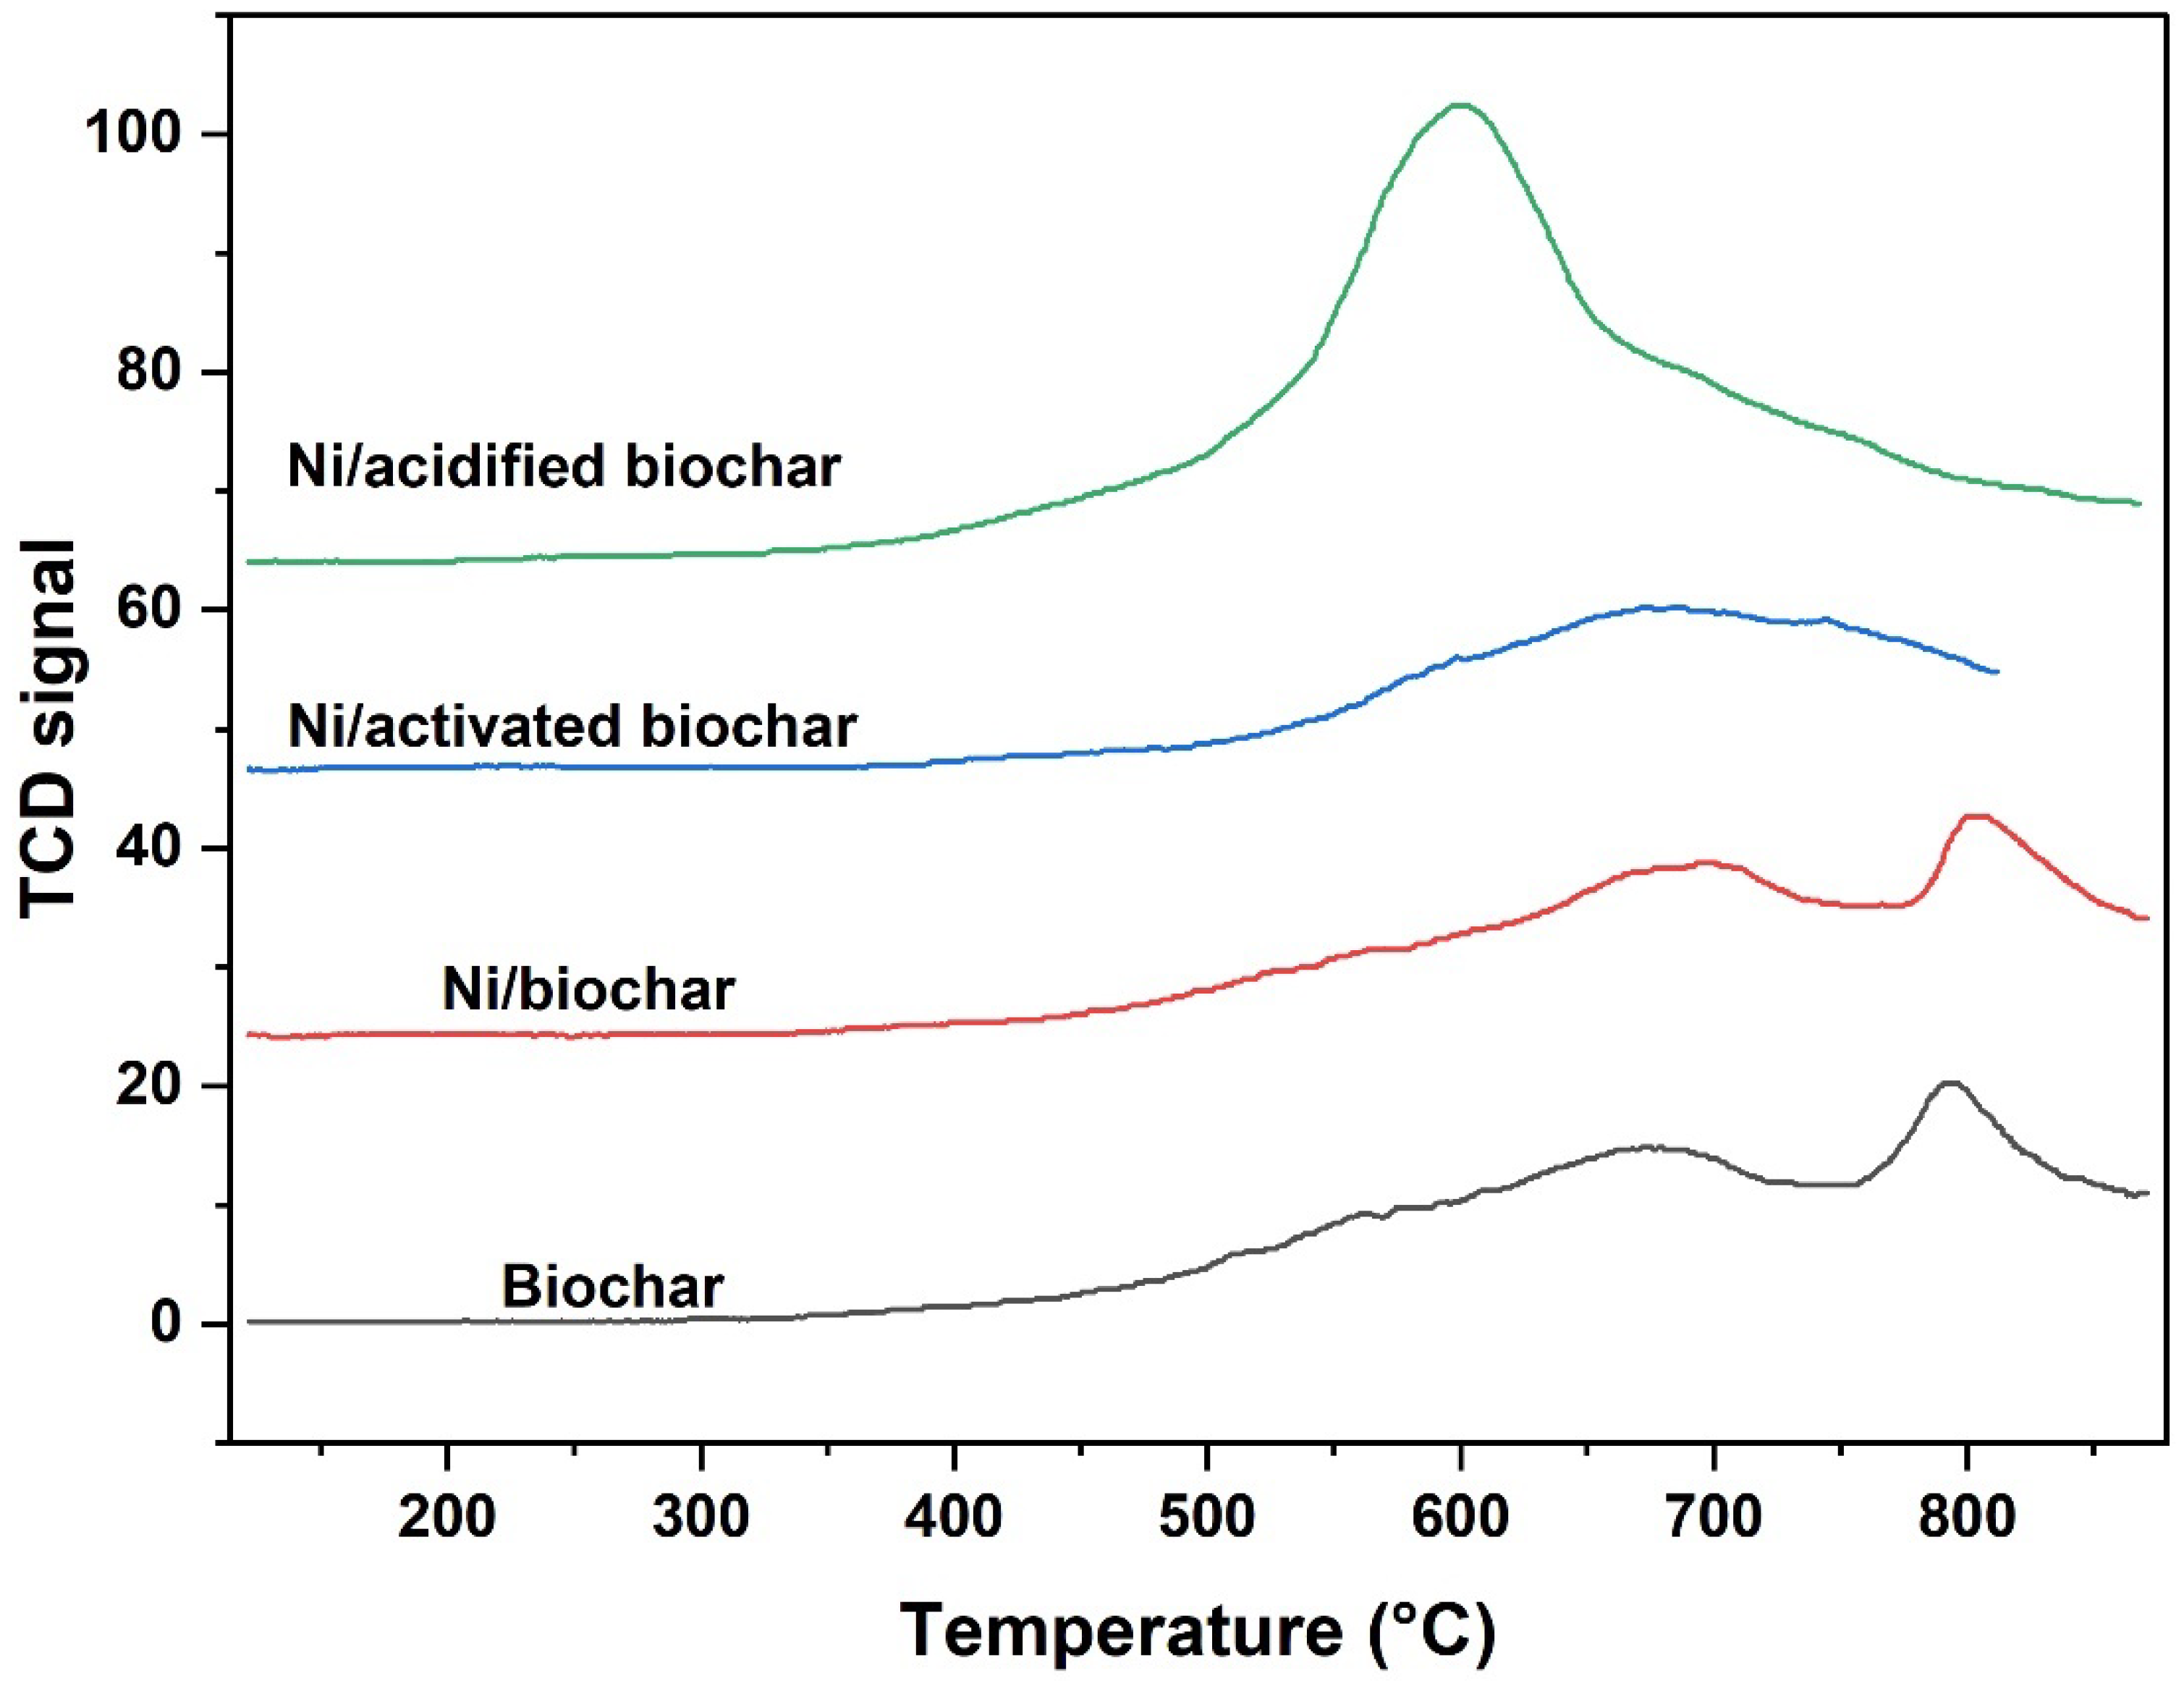
The surface interactions between the adsorbed molecules and the biochar surface can be determined using the TPD method. Biochar’s acidic–basic properties may play a critical role during vanillin HDO, since it activates oxygenated compounds on the surface of the support. Additionally, adsorption of reactants is fundamentally affected by the acidity or basicity of the biochar surface [17]. The CO2-TPD profiles of the biochar and the prepared catalysts are shown in Figure 7. Two basic sites can be observed on the TPD profile of the biochar and the prepared Ni/biochar. The first broad peak occurred at about 675 °C, representing moderately basic sites, while the second peak at 790 °C is assigned to the strong basic sites of the biochar support itself. Upon impregnation with Ni to produce the Ni/biochar catalyst, a shift can be observed, with the first peak appearing at 700 °C and the second peak at 800 °C. Meanwhile, the chemically treated biochar catalysts possess only a single peak, with the peak for the Ni/biochar (KOH) appearing at 675 ° C, and that for the Ni/biochar (H2SO4) appearing at 575 °C. The results suggest that the surface interaction with the components can be summarized as follows: Ni/biochar > biochar > Ni/biochar (KOH) > Ni/biochar (H2SO4). The basic sites are a result of the interaction between O− and CO2 [46]. Figure 7 shows a significant increase in the basic sites in Ni/activated biochar and Ni/acidified biochar when compared to those in the biochar. The increase in basic sites contributes to the high reactivity observed in Ni/biochar (KOH) and Ni/biochar (H2SO4).
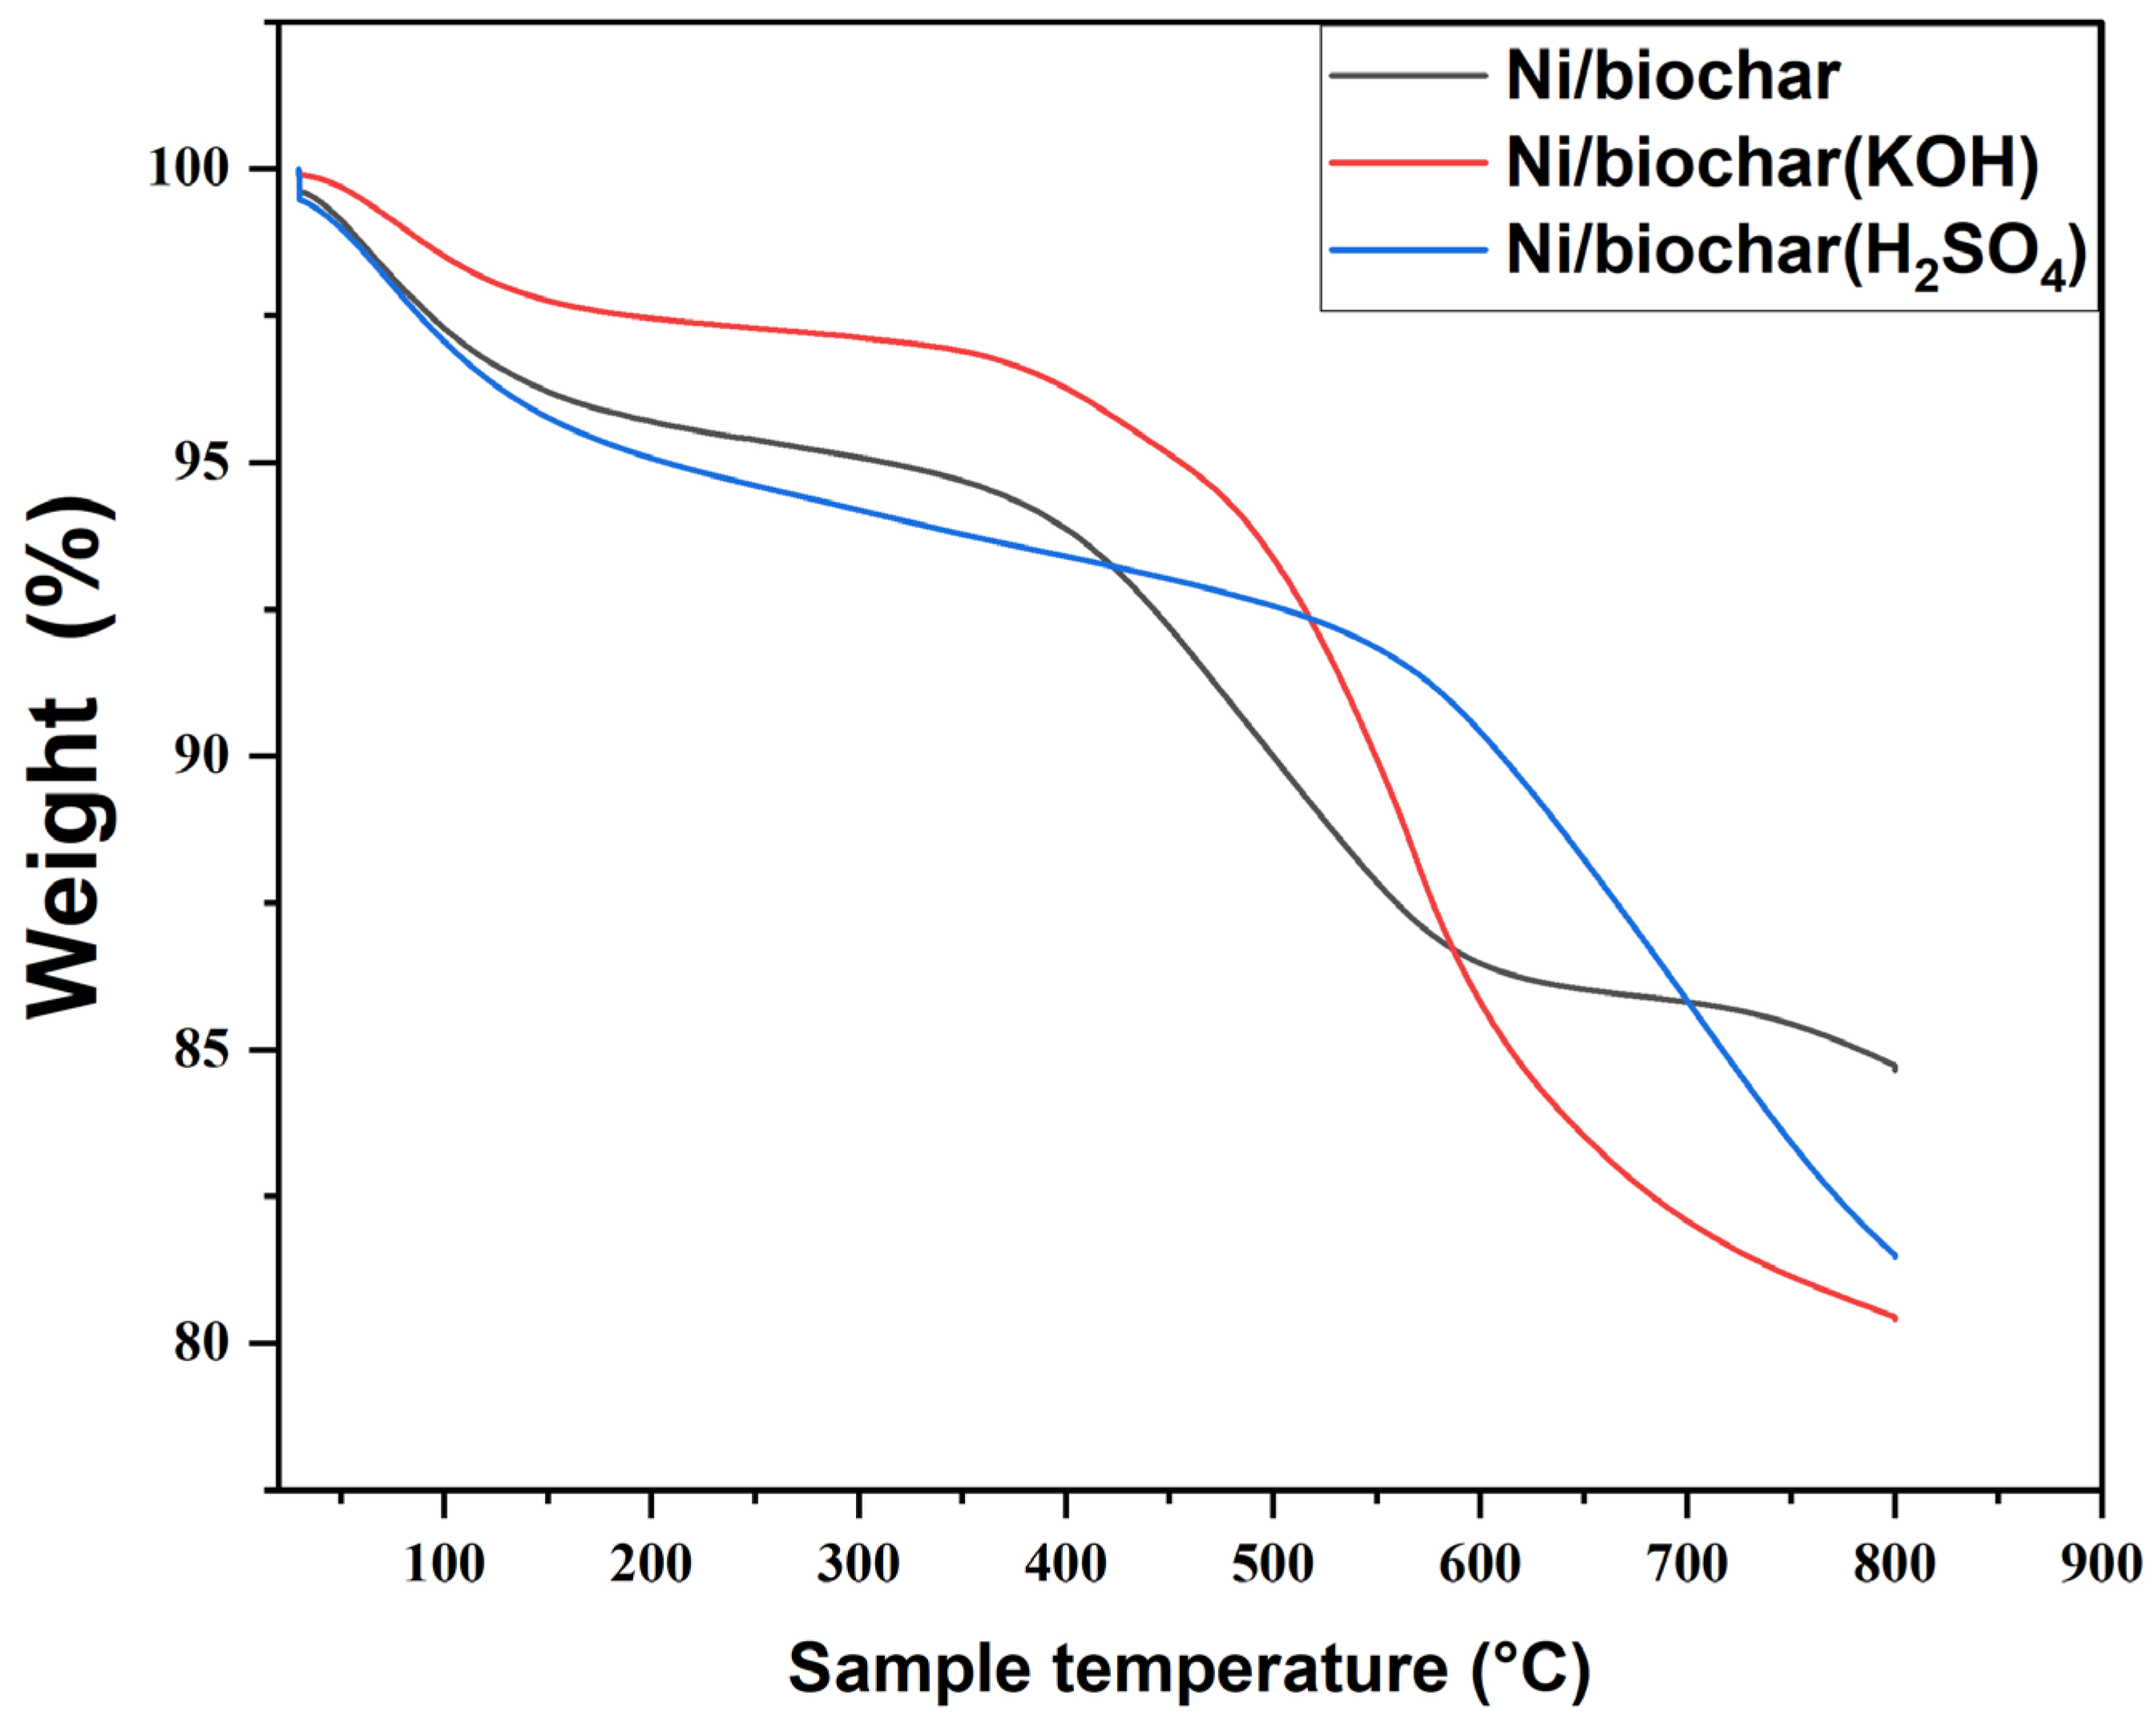
The thermal stability of the prepared catalysts was studied with the aid of TGA. The response of the catalysts to temperature can be seen in the TGA results displayed in Figure 8. The first thermal peak occurred at around 100 °C, with initial weight losses of about 2.5% (Ni/biochar (KOH) and 5% (Ni/biochar and Ni/biochar (H2SO4) being observed in the temperature range of 25 °C to 200 °C, which may be attributable to moisture loss, some light volatile compounds, and bound solvent evaporation [47]. This includes phenolic OH-groups and carboxylic acids, -COOH, as identified in the FTIR analysis shown in Figure 5.
For the Ni/biochar, significant weight loss of about 12% occurred between 200 °C and 650 °C, due to the decomposition of hemicellulose and cellulose, and from 650 °C to 800 °C, weight loss occurred as a result of the thermal decomposition of lignin [48]. The presence of cellulose on the biochar surface could be observed from the FTIR analysis, and the decomposition from 200 °C to 650 °C is consistent with this observation. Compared to Ni/biochar, the weight loss of the chemically treated counterpart during the second stage occurred in the temperature range between 200 °C and 800 °C, indicating that the occurrence of thermal peaks had shifted to a higher temperature. This could be attributed to the thermal decomposition of lignin, cellulose, and hemicellulose compounds on the biochar [47]. Within the studied temperature range of 25 °C to 800 °C, the total weight loss values corresponded to 15% (Ni/biochar), 18% (Ni/biocharH2SO4) and 20% (Ni/biochar (KOH), which is in the same order as their thermal stability. The additional drop in weight loss can be attributed to the enhanced mesoporosity of the chemically treated biochar, which allows the diffusion of gas in the interior of the biochar during the TGA test. Therefore, due to its excellent proven thermal stability, low cost, and good resistance to acidic and basic media, biochar offers many advantages as a support material for HDO catalysts.
2.2. Catalyst Activity
2.2.1. Conversion of Vanillin
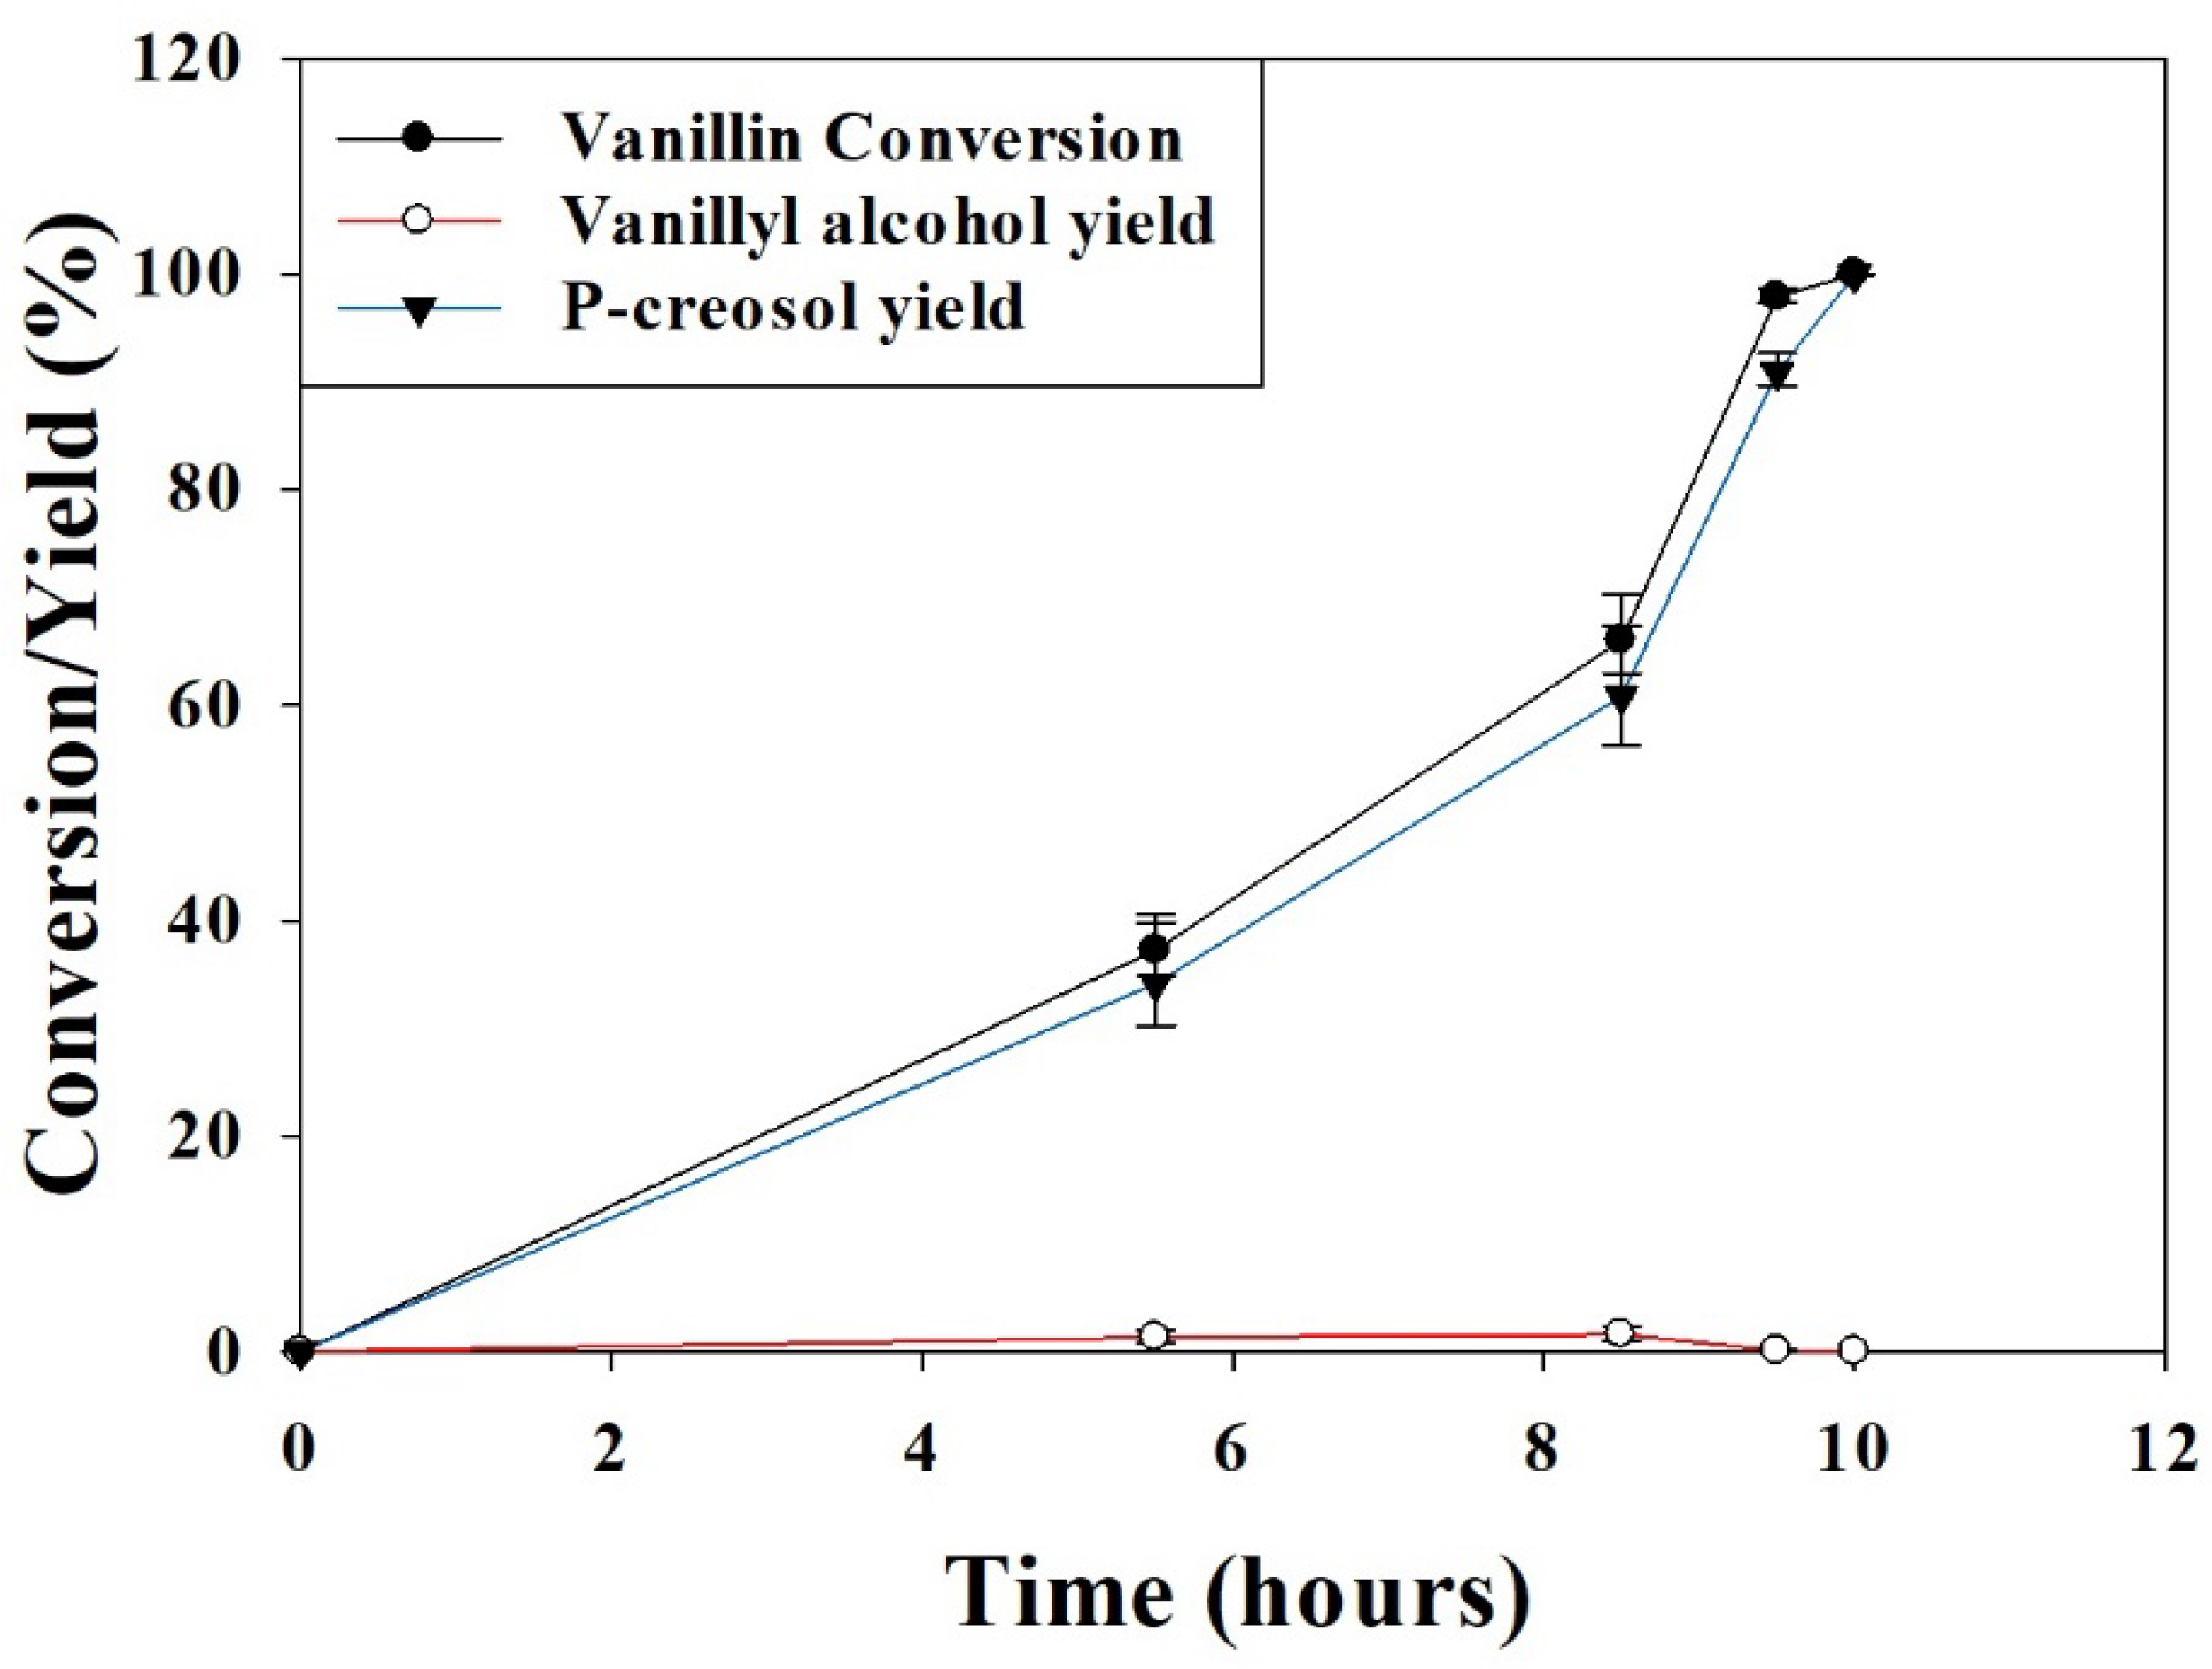
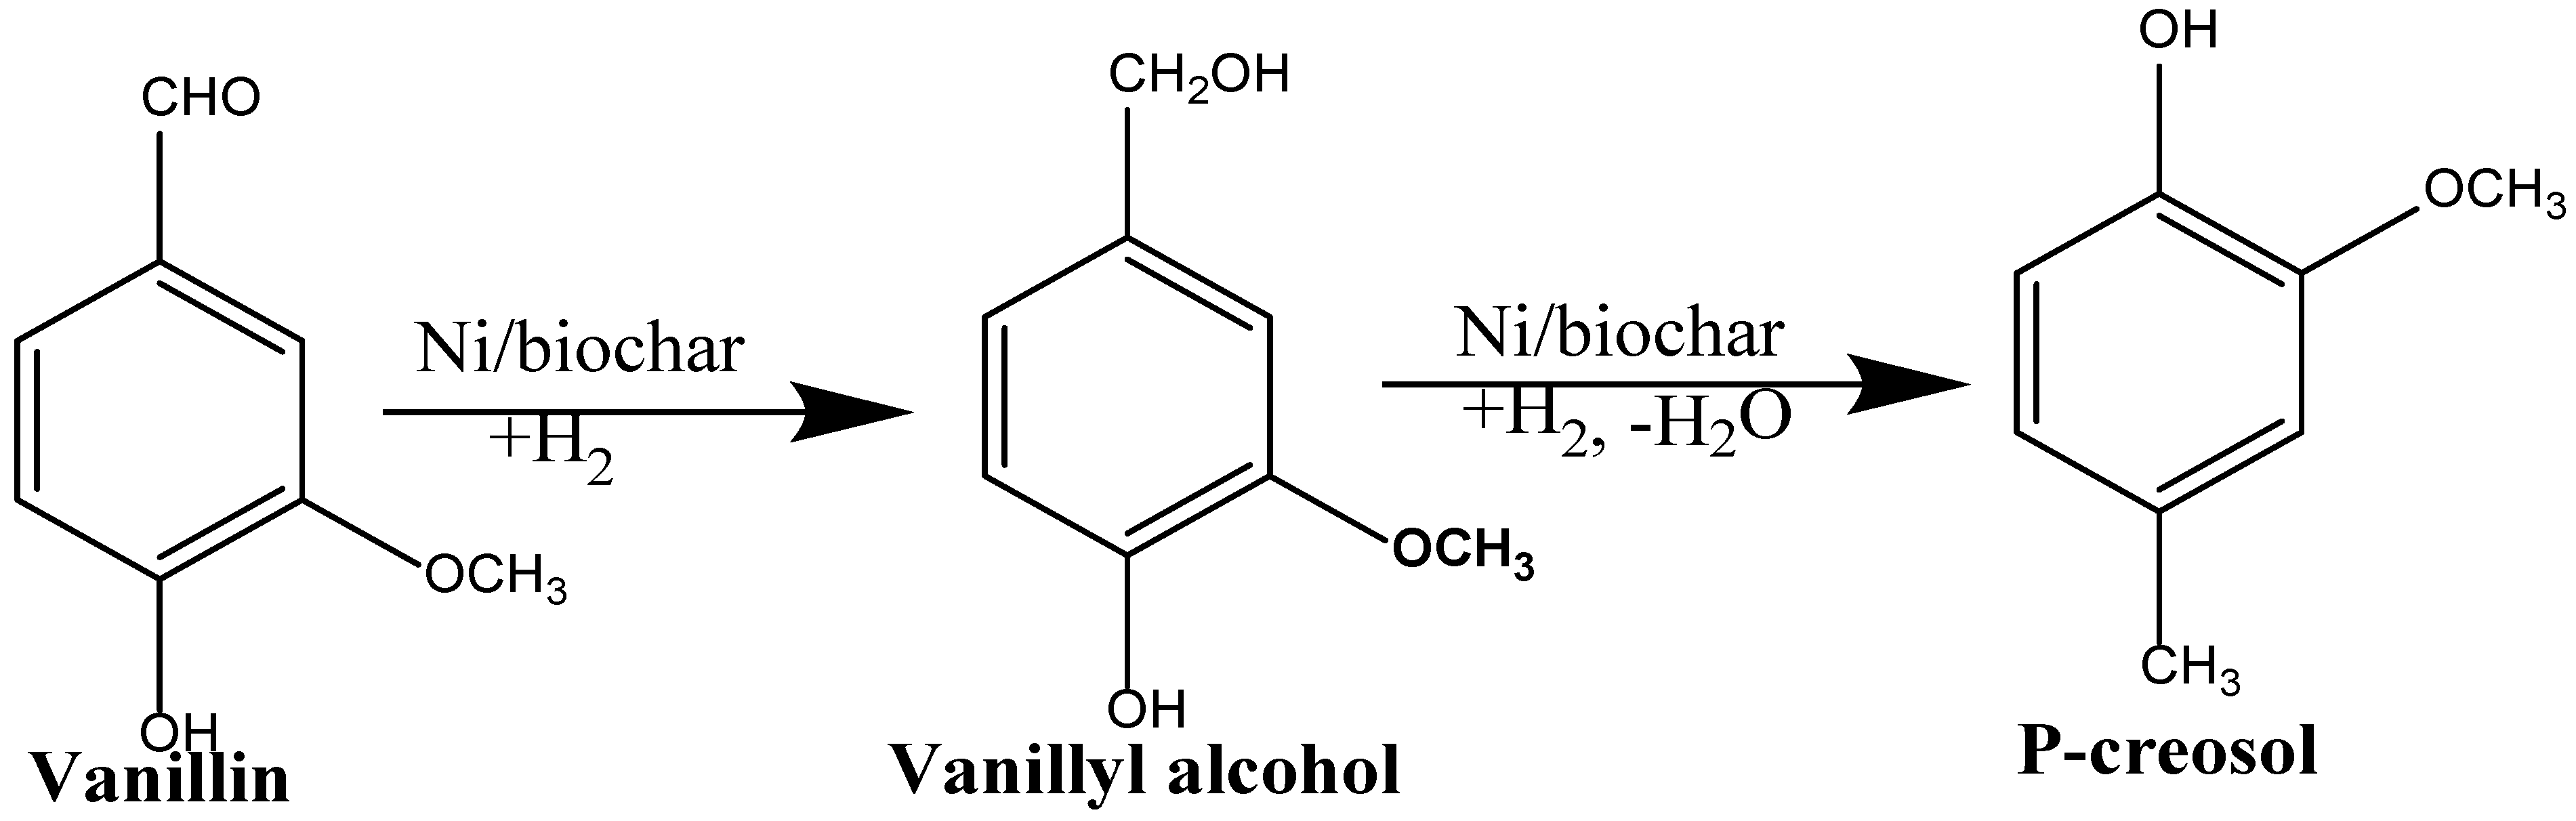
The HDO of vanillin can result in two products, vanillyl alcohol and p-creosol. It is possible to achieve catalytic HDO via successive transformations of organic compounds containing oxygen. In this case, the conversion of vanillin into p-creosol during HDO can be achieved through: (a) intermediate hydrogenation to vanillyl alcohol and additional hydrogenolysis; and/or (b) straight hydrogenolysis of the C=O bond [49,50]. There have been a variety of reaction pathways reported in the literature for vanillin HDO over different catalysts in the past [5,51,52,53]. This study identified p-creosol as the final product of the HDO of vanillin over Ni/biochar catalysts in 2-propanol solvents. p-creosol is formed in a two-step reaction first involving the hydrogenation of vanillin to vanillyl alcohol, and then the further hydrodeoxygenation of this intermediate, as shown in reaction Scheme 1. Figure 9 shows the conversion and yields of vanillyl alcohol and p-creosol as a function of reaction time. With HDO approaching completion at 10 h, it is evident that vanillin conversion increases to 100%, p-creosol yields increase as well, and vanillyl alcohol yields decline negligibly. At 10 h, the hydrogenolysis of vanillyl alcohol, including the cleavage of the C-O bond and the formation of a new C-H bond, had resulted in an almost total conversion to p-creosol. This observation clearly confirms that vanillyl alcohol was the intermediate product and p-creosol was the final product (Scheme 1). The Ni metal facilitates the hydrogenation of C=C and C=O bonds, and the basic sites promote the cleavage of the C–O bond to form a deoxygenated product.
2.2.2. Effect of Temperature on the HDO of Vanillin
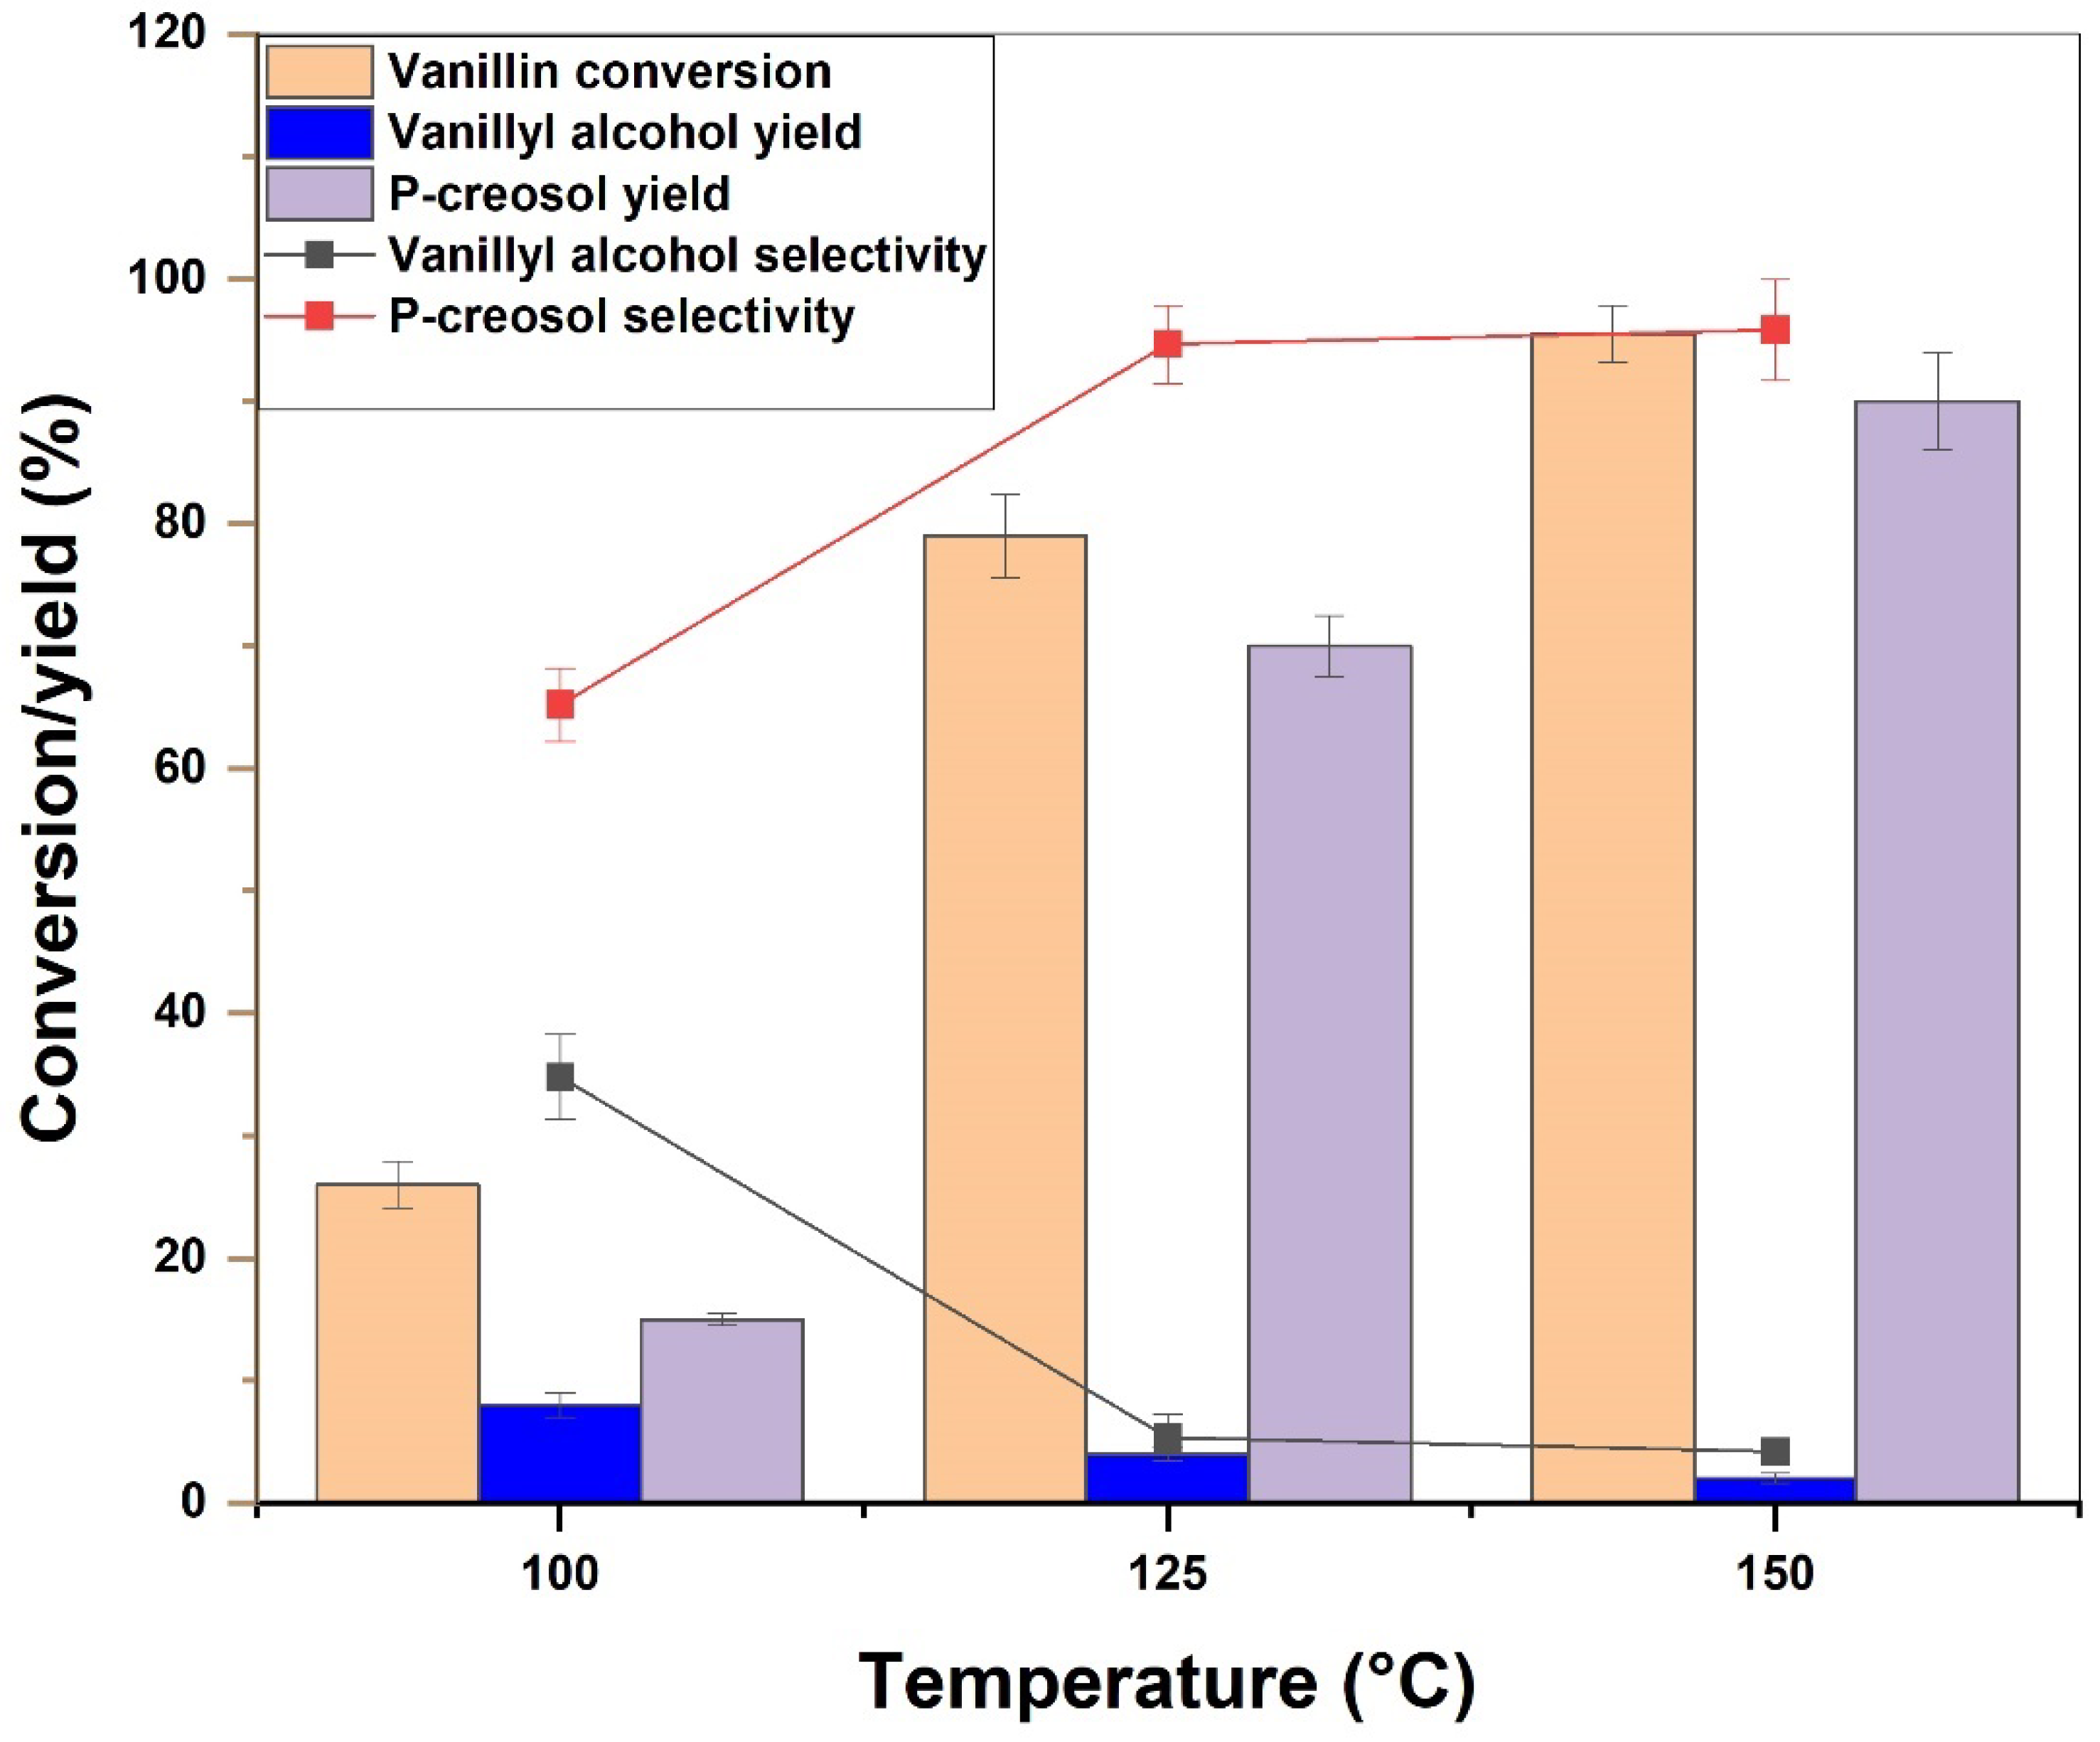
The effect of reaction temperature in the range of 100 to 150 °C was studied over Ni/biochar catalyst. The effect of reaction temperature on the HDO of vanillin is shown in Figure 10. With increasing reaction temperature, vanillin conversion as well as the selectivity of p-creosol and vanillyl alcohol change significantly. With an increase in reaction temperature from 100 °C to 150 °C, vanillin conversion increases from 26% to 95%, while p-creosol yield increases from 15% to 90%, and vanillyl alcohol yield decreases from 8% to 2%. It is evident that increased reaction temperature favors p-creosol selectivity, while simultaneously diminishing the selectivity toward vanillyl alcohol. This suggests that the HDO of vanillin is endothermic in nature [4,54], with the reaction rate generally increasing as the temperature rises [4]. Based on these results, p-creosol yield increases with an increase in temperature from 100 °C to 150 °C, while vanillyl alcohol yield decreases, showing that vanillyl alcohol is the intermediate product, and is converted via hydrogenolysis to p-creosol. Similarly, Ru/CNT catalysts for HDO of vanillin showed similar trends in selectivity for p-creosol and vanillyl alcohol when changing the temperature from 50 °C to 150 °C [55]. In other words, the hydrogenolysis of vanillyl alcohol advanced very rapidly at longer reaction times and high temperature [50]. Reactions at higher temperatures were found to exhibit p-creosol selectivity of up to 96%. As a consequence, at 150 °C, vanillin conversion was greater than 95% after 9.5 h, with a 99% p-creosol yield.
2.2.3. Effect of Pressure on the HDO of Vanillin
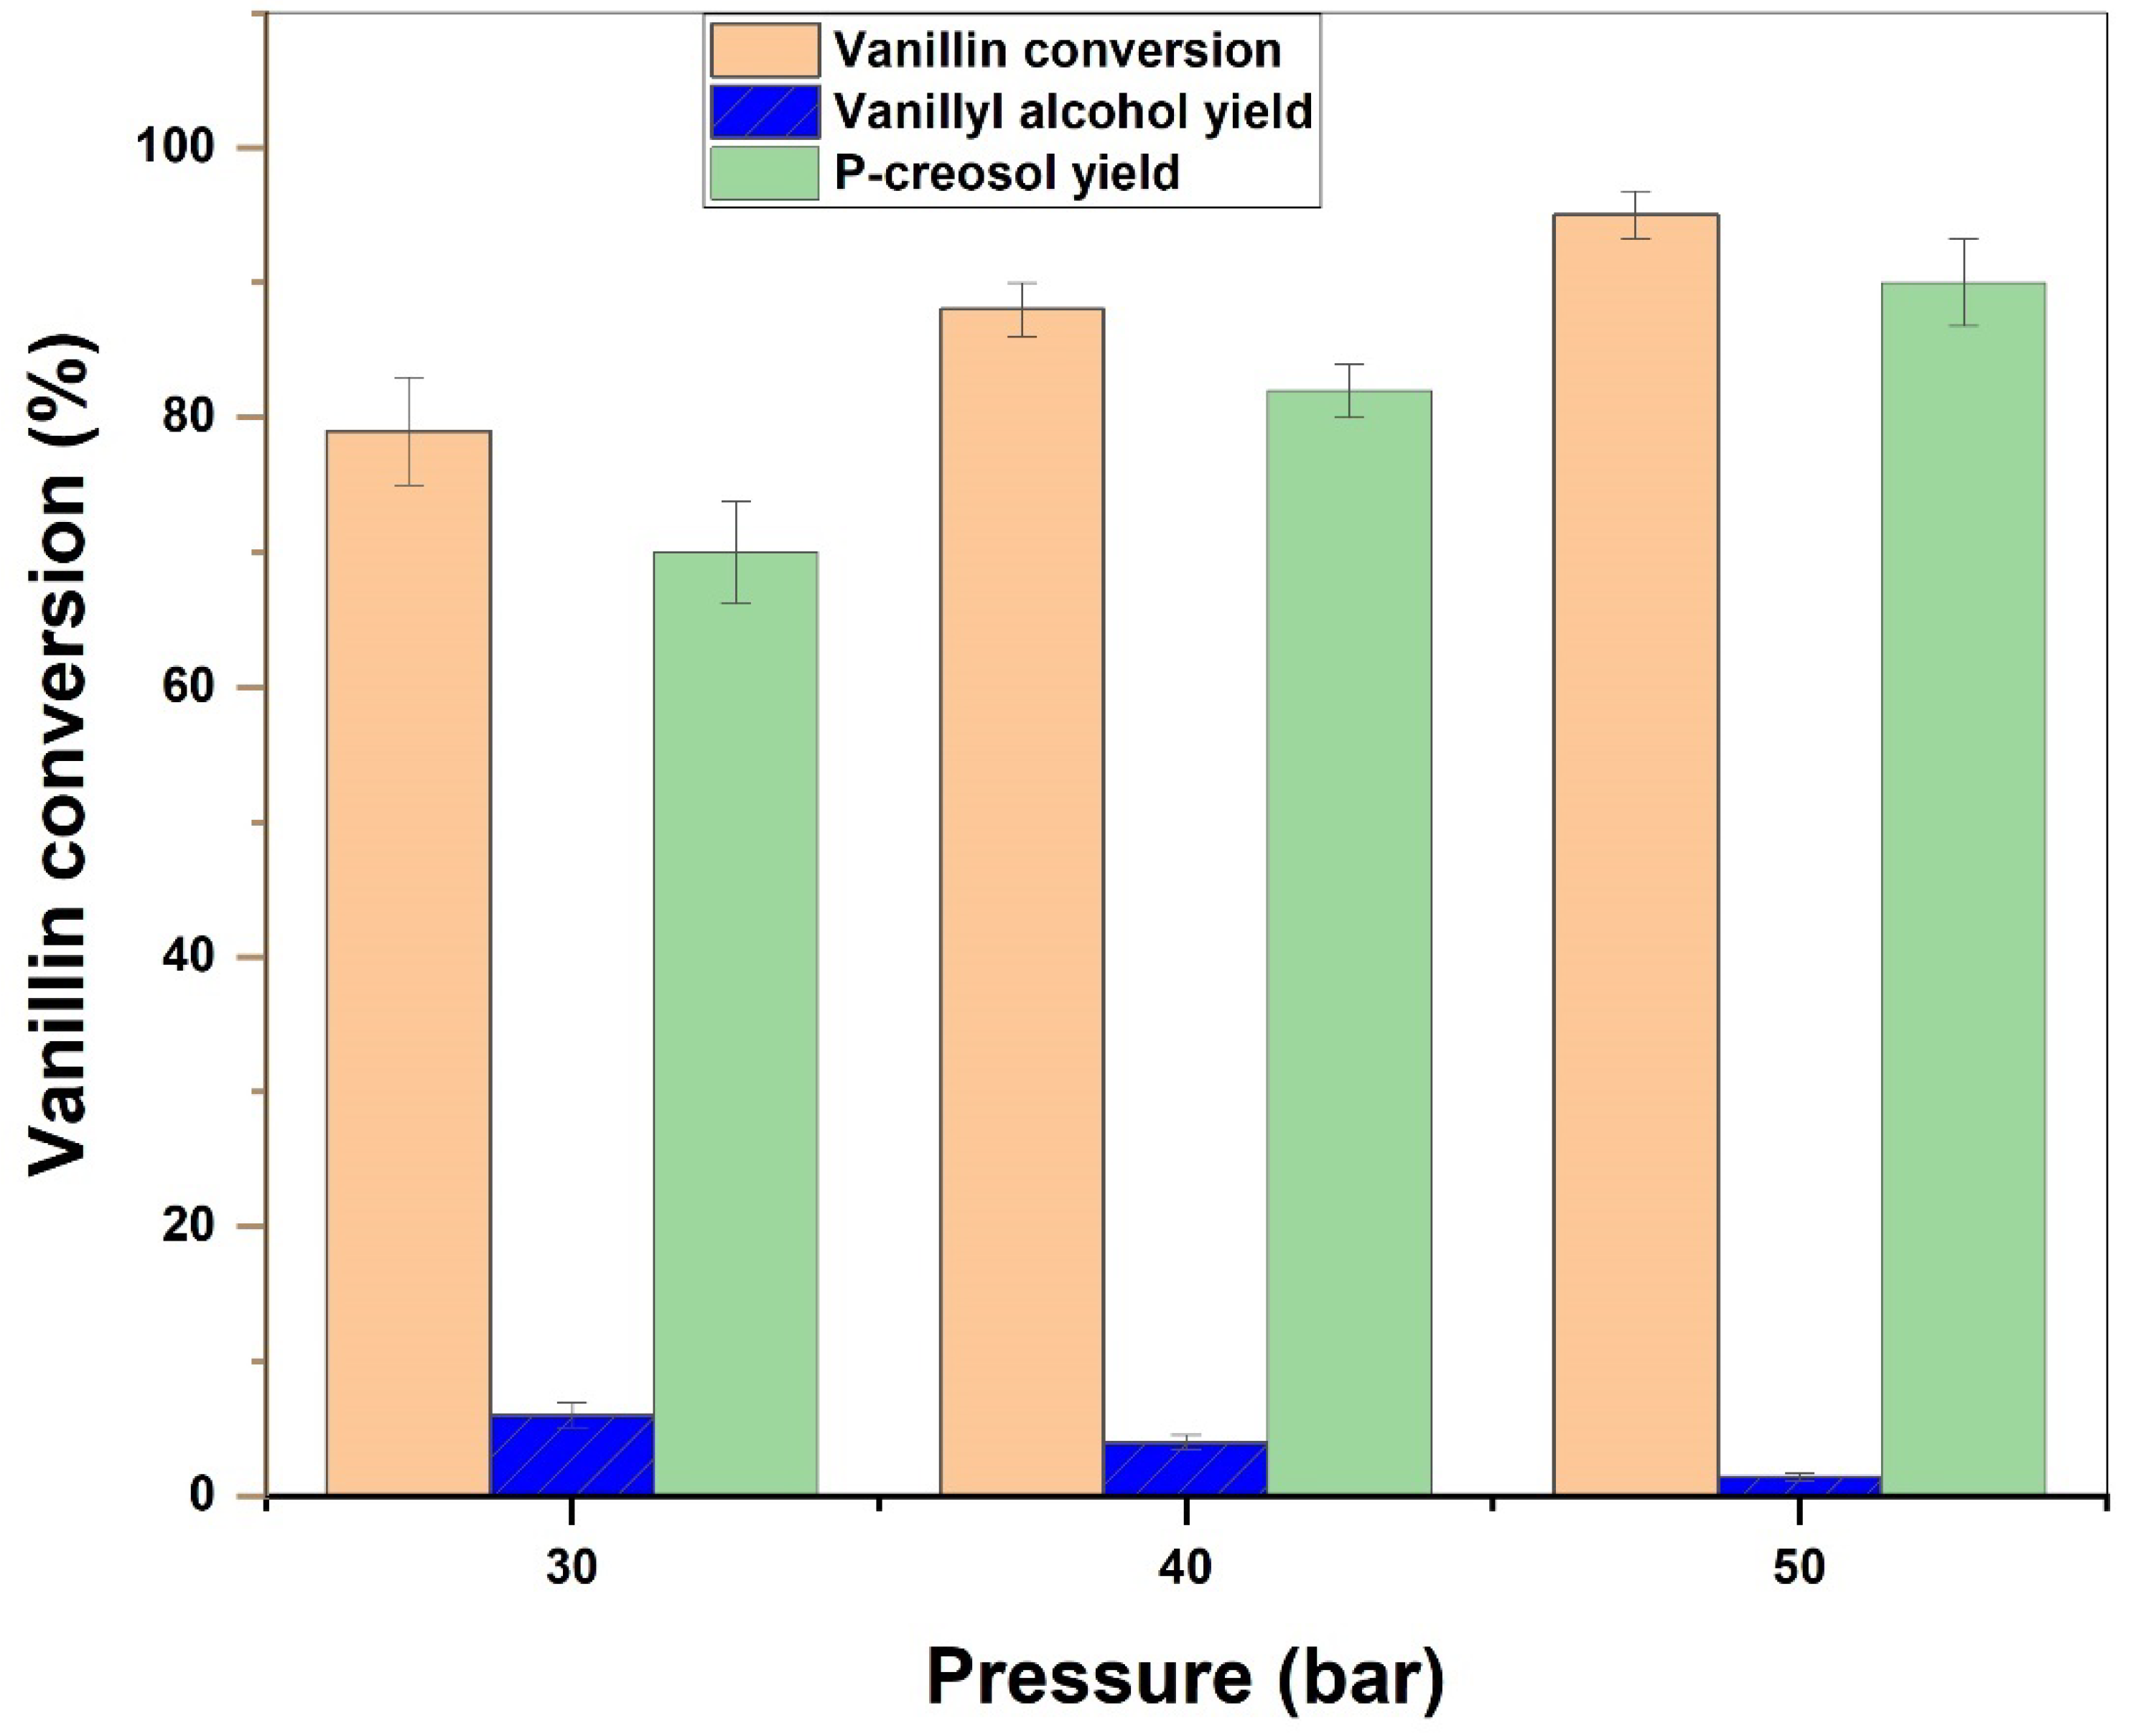
The effect of H2 pressure on the HDO of vanillin was studied from 30 bar to 50 bar at a constant temperature of 150 °C. As shown in Figure 11, an increase in pressure from 30 bar to 50 bar tends to increase vanillin conversion and p-creosol yield. Notably, at 50 bar, the yield of vanillyl alcohol is negligible compared to that obtained at pressures of 30 and 40 bar. Due to the increase in hydrogen pressure, the catalyst surface is exposed to more H2, allowing hydrogenolysis of vanillyl alcohol to occur more easily [3].
2.3. Effect of Reaction Parameters
The effects of three factors—temperature, pressure, and catalyst loading—on the HDO of vanillin were studied using the response surface methodology (RSM), implemented in Minitab 19 statistical software. This Design of Experiments (DOEs) software package was used to assist in achieving optimization using the minimum number of experimental conditions. For the modeling and optimization of the HDO of vanillin, a tri-oxygenate model compound of bio-oil was implemented using the RSM approach. By using the RSM, it is possible to determine the combined effect of process factors as well as their high order, enabling the objective assessment of the relationship between different combinations of reaction factors and yield, as opposed to the traditional optimization approach [56,57].
The results obtained, as presented in the Supplementary Materials Table S1, indicate that the highest vanillin conversion of 97%, with 91.17% p-creosol yield, was obtained at a temperature of 150 °C, 50 bar H2 pressure, and a catalyst loading of 0.6 g. Analysis of variance for the experimental results was used based on a set of 15 replicated experiments (Table S1) to fit the polynomial model used (Equation (1)) in order to determine the effect of linear, square, and interactive reaction variables.
where T: temperature (°C); P: pressure (bar); and C: catalyst loading. Temperature, pressure, catalyst loading, square of temperature, pressure and the combined interaction of temperature and pressure were identified as statistically significant factors for improved vanillin conversion, as shown in Table 2. On the basis of the effect of variations in the reaction parameters or factors studied, a second-order polynomial empirical model, as shown in Equation (1), was able to fit the experimental data obtained, and thus can be used to predict the conversion of vanillin as a response. The values of the determination coefficients (R2) and adjusted coefficient (R2 adj.) were found to be 99.66% and 99.40%, respectively, which indicates that the model was able to adequately fit the experimental data, with a good predictive power (Rsq. Pred.) of 98.65% (Table 3).
Vanillin Conversion = 134.9 − 4.118 T + 2.63 P + 15.60 C + 0.02014 T2 − 0.0372 P2 + 0.01070 TP
Three sets of experiments with different combinations of reaction conditions at temperature 120 °C–140 °C, pressure 30–50 bar, and catalyst loading 0.4–0.8 g were conducted in duplicate to assess the predictive power of the empirical model within the lower and higher limits of the experimental conditions studied in Table S1. The results obtained from the experiments and the empirical model (Equation (1)) predictions are shown in Table 4. Based on the results, vanillin conversion could be predicted to within an error range of 5.02 to 9.95% with the use of this empirical model. Consequently, RSM can be used to develop an empirical model that accounts for the interactive effects of reaction variables such as temperature and pressure on the yield of p-creosol obtained from the HDO of vanillin. There are several advantages to using the RSM technique, including the fact that it generates a significant amount of data from fewer experiments, thereby saving time and resources. It can also be used to determine the effect of the interaction between independent and dependent reaction variables [58].
2.4. Catalyst Reusability
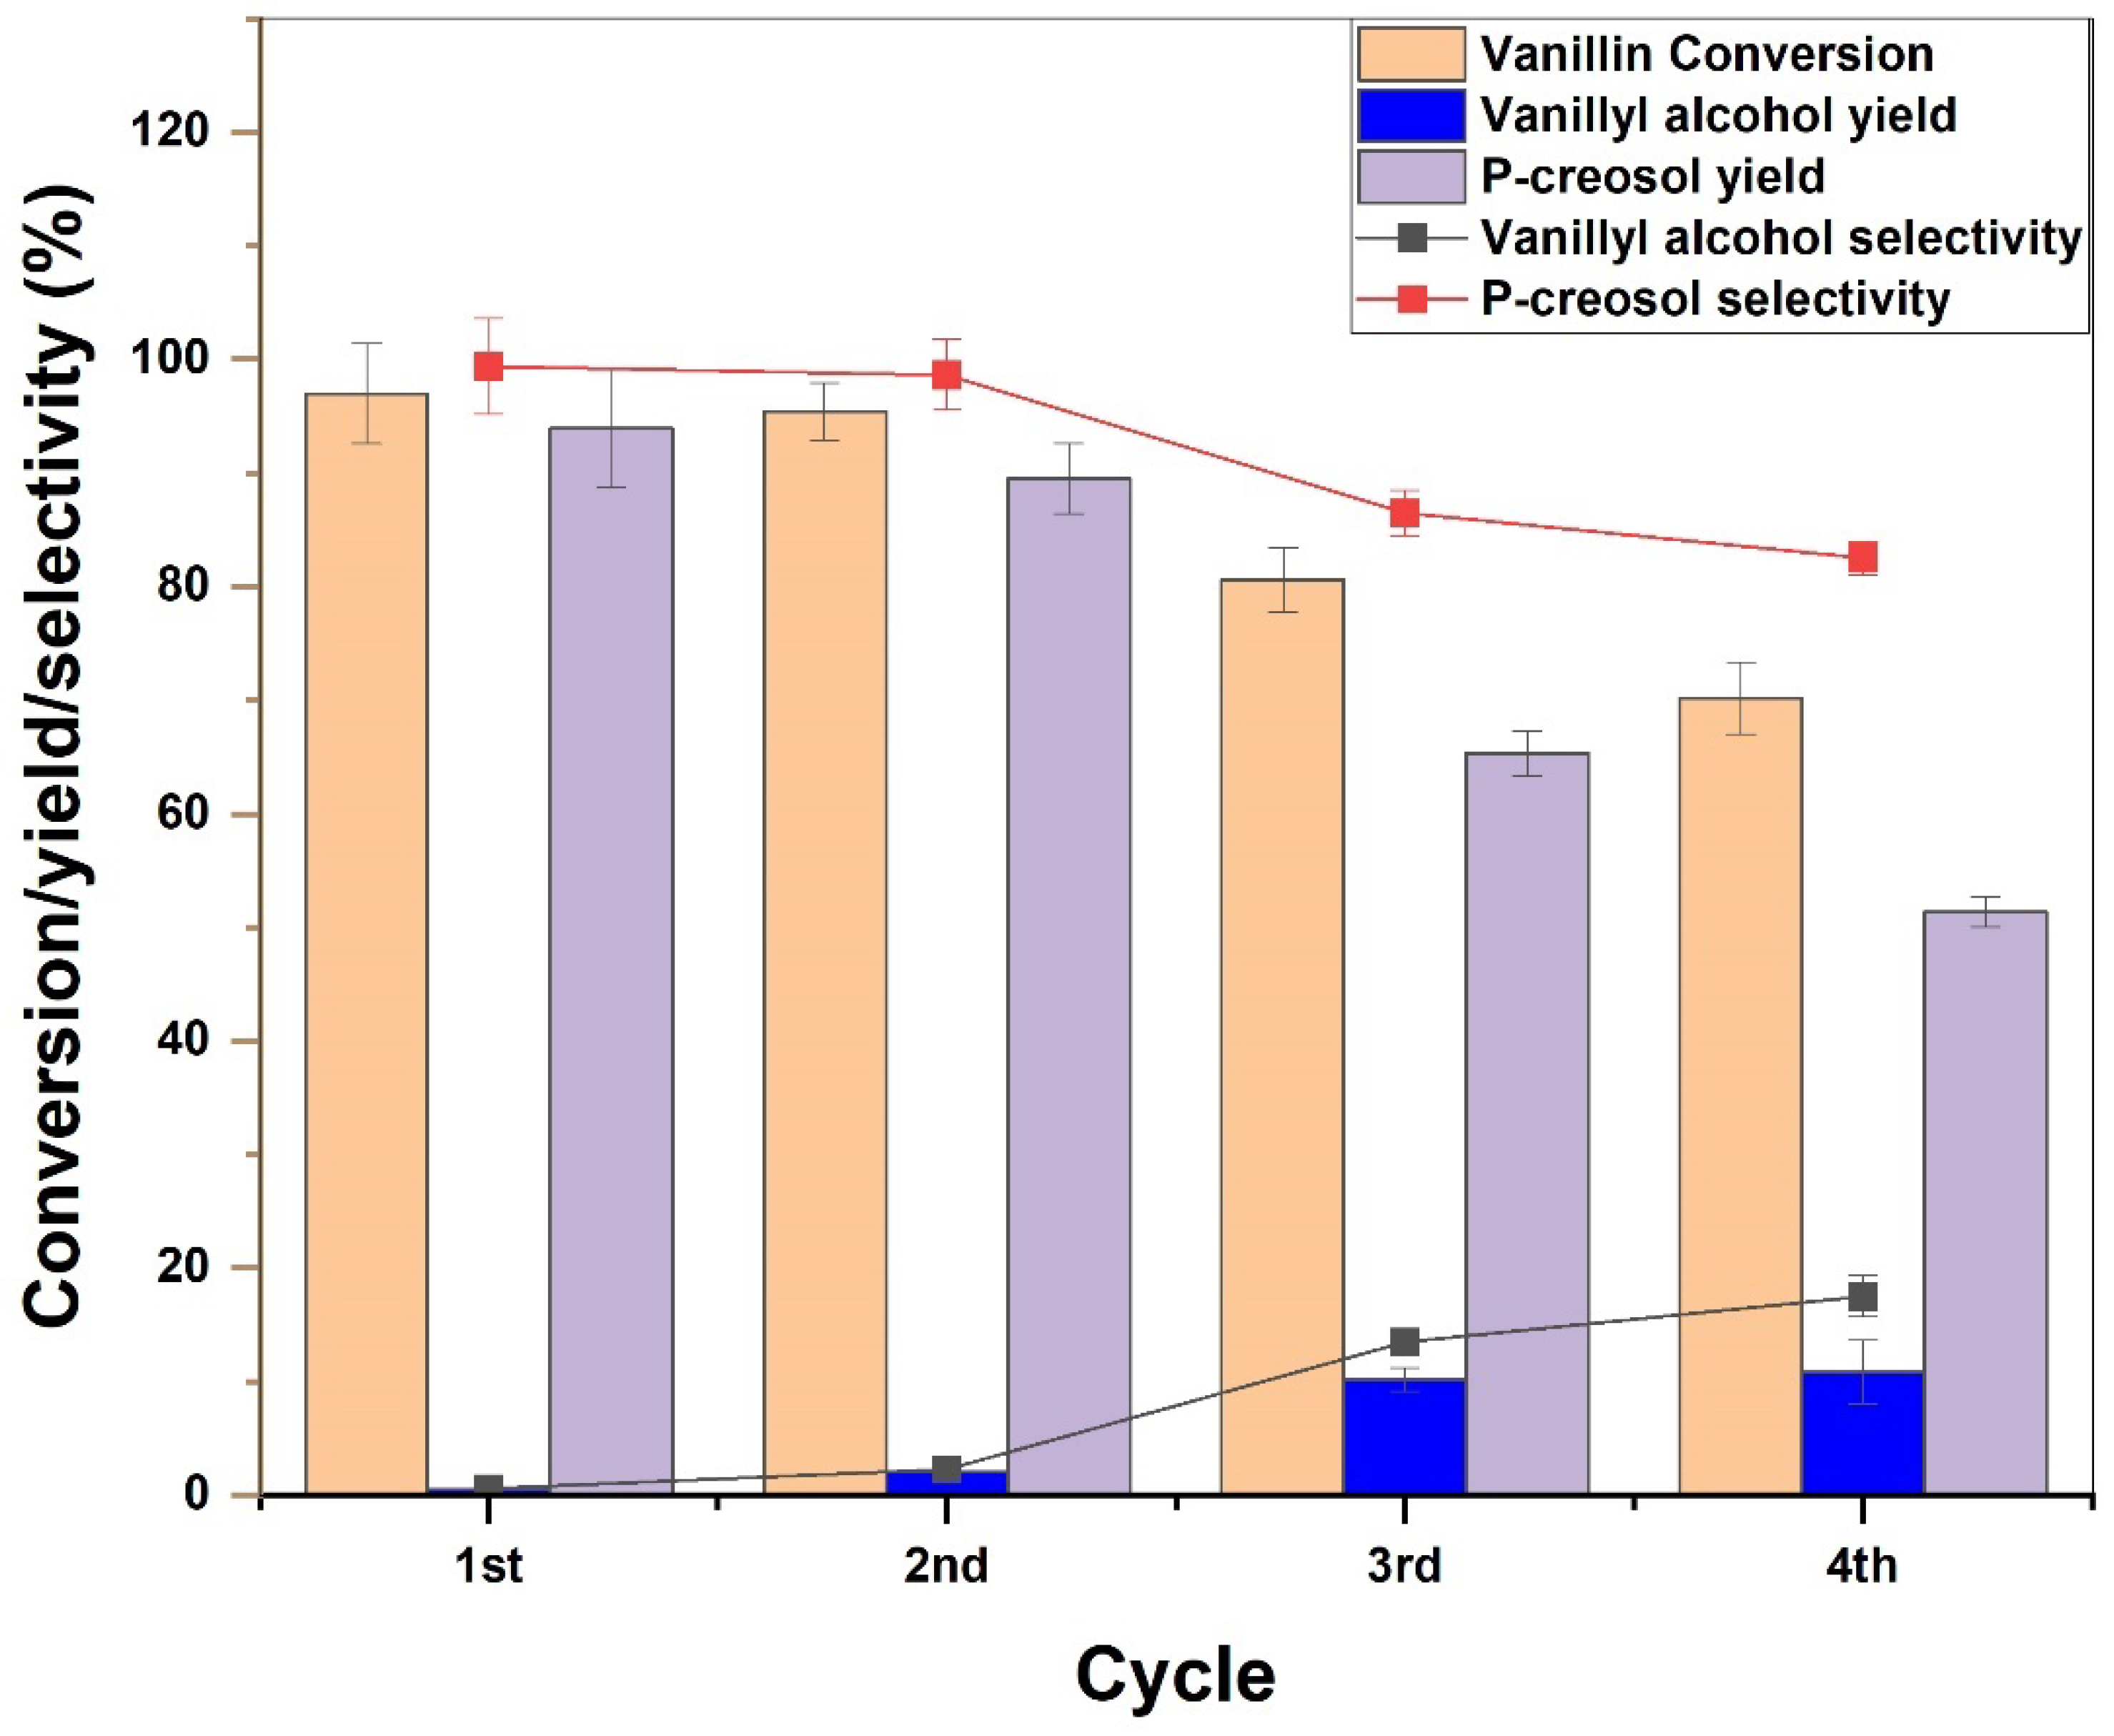
An investigation of Ni/biochar stability was carried out for fresh and used catalysts by reusing the catalyst recovered from the first, second, and third experimental cycles. The vanillin conversion, p-creosol and vanillyl alcohol yields and their selectivity after each cycle are shown in Figure 12.
Vanillin conversion and p-creosol yields showed similar patterns from the first cycle through to the third cycle, with an increase in vanillyl alcohol yield and selectivity in the second, third and fourth cycles. It is clear from Figure 12 that the conversion of vanillin and the yield of the p-creosol product did not significantly change for either the first or the second cycles. However, while both the conversion of vanillin and the yield of p-creosol decreased from the third to the fourth cycle, the yield of vanillyl alcohol increased. This indicates a decrease in the hydrogenolysis of vanillyl alcohol to p-creosol between the successive experiments. The stability of the catalyst can be attributed to the thermal stability of the prepared catalyst, as indicated by the TGA analysis presented in Figure 8. However, the catalyst exhibited a slight deactivation after the third cycle, which might be attributable to the leaching of some of the Ni [59], depending on the strength of the interaction between the Ni and the biochar. This can be explained by the weak Ni-biochar support interaction observed in the H2-TPR analyses in Figure 6, resulting in a reduction in the overall vanillin conversion and p-creosol yield in the third and fourth cycles. With a reaction temperature of 150 °C, C-C cleavage is not likely to occur; therefore, coke will not form during the HDO of vanillin. Furthermore, the only products observed in this study were p-creosol and vanillyl alcohol, both of which were produced by hydrogenation and hydrogenolysis. In light of this, it can be inferred that no coke was formed. As a result, the decreases in the conversion of vanillin, p-creosol yield, and selectivity cannot be ascribed to catalyst deactivation resulting from coke on the Ni. It has also been hypothesized that organic species adsorbed onto the surface of the Ni/biochar during the first and second cycles may be responsible for the decline in the catalytic activity of the catalyst in subsequent reaction cycles [60].
2.5. Effect of Chemical Treatment on Catalytic Performance
The novelty of the present work lies in the design of a robust and low-cost catalyst for the HDO of vanillin. The effect of the chemical activation of biochar on the activity of Ni/biochar in vanillin HDO was studied using Ni/biochar, Ni/ biochar (KOH) and Ni/biochar (H2SO4). Figure 13 demonstrates the impact of the chemical treatment of the biochar on the catalytic performance of the HDO of vanillin. Notably, the catalyst prepared using the KOH- and H2SO4-treated biochar clearly outperformed that prepared with raw biochar.
There was a moderate improvement in the catalytic performance of the modified catalysts, especially the H2SO4 treated biochar, which showed a high yield of p-creosol and a negligible vanillyl alcohol yield. It is expected that the improved mesoporous structure seen in the particle size distribution from the BET analyses (Figure 1a) of the biochar following chemical treatment would provide a large surface area for Ni metal dispersion and pore size, minimizing the mass transport of vanillin and hydrogen, and thereby increasing catalytic activity. A 23% increase in vanillin conversion was observed with the Ni/biochar (KOH) catalyst, and an increase of 35% over Ni/biochar (H2SO4). Despite the biochar’s excellent physicochemical properties after KOH and H2SO4 treatments as a catalyst support, the active metal, in this case Ni, is the major determinant of catalytic performance. This can be plausibly attributed to the reduced basic strength of chemically treated biochar catalysts relative to Ni/biochar (Figure 7). It could also possibly be attributed to the nature and distribution of the Ni nanoparticles on the surface of the biochar (Figure 3). Due to the increased surface area of biochar following chemical treatment, the nanoparticles of Ni metal are dispersed more widely.
Considering the fact HDO reaction is dependent on the Ni metal, the more widely distributed the active Ni nanoparticles are on the surface of the biochar, the less effective the chemically treated biochar support catalyst will be. It is also possible that the Ni loading might not be adequate for the chemically treated biochar to achieve good surface coverage, considering the significant increase in surface area relative to the raw biochar. The Ni/biochar catalyst demonstrated excellent catalytic activity in the HDO of vanillin; however, it has a small specific surface area (Figure 1) and is prone to the agglomeration of Ni nanoparticles, as can be observed in Figure 3.
3. Materials and Methods
3.1. Materials
The biochar used in this research work was produced at the School of Chemical Engineering, University of Birmingham, UK by pyrolysis of sewage sludge waste. The gases used in this research were obtained from British Oxygen Company (BOC), Ltd., Woking, UK, and include 5% H2/N2, hydrogen (purity 99.0%) and nitrogen (purity 99.9%). The vanillin (4-Hydroxy-3-methoxybenzaldehyde, 4-(HO)C6H3-3-(OCH3)CHO, 99% purity) substrate used in this study was purchased from Alfa, Aesar, UK, while vanillyl alcohol (4-Hydroxy-3-methoxybenzyl alcohol, HOC6H3(OCH3)CH2OH, purity 98%), p-creosol (2-Methoxy-4-methylphenol, CH3OC6H3(CH3)OH, purity >98%), 2-propanol (CH3)2CHOH, purity 99.99%), sulfuric acid, H2SO4 (Sigma Aldrich, Gillingham, UK), potassium hydroxide, KOH (Sigma Aldrich) and nickel (ii) nitrate hexahydrate (Ni(NO3)2·6H2O, purity 99.99%) were purchased from Sigma Aldrich, UK and deionized water was sourced locally (University of Birmingham, 100%).
3.2. Chemical Activation of Biochar
Chemical activation was accomplished using 7 M KOH (aq.) in the ratios 3:1 (KOH solution: Biochar) by weight and stirred for 3 h with the aid of magnetic stirrer at 120 °C. The resulting mixture was filtered with the aid of a vacuum filter to obtain the chemically impregnated biochar as residue. Several washing steps were performed with deionized water, and the filtrate was tested with litmus paper after each step until a neutral pH was reached [29]. The KOH activated biochar is labelled as thus: biochar (KOH).
3.3. Acidification of Biochar
The biochar (20 g) was sulfonated using 300 mL concentrated sulfuric acid (95–98%) in a 250 mL round-bottomed flask fitted with a reflux condenser at 120 °C on a hot plate equipped with thermocouple and heating mantle for 3 h. After cooling to ambient temperature, the mixture was slowly added to 300 mL deionized water (2/3 ice) to ensure the mixture cooled to room temperature, and the reaction is quenched completely, diluted, stirred and filtered using a vacuum filter. Then, the precipitate was washed repeatedly with hot distilled water until the filtrate was free from sulfate ions, which was confirmed by testing the pH. The samples were oven dried at 80 °C overnight based on the protocol reported in the literature [33]. The solid material produced was denoted as biochar (H2SO4).
3.4. Preparation of Ni/Biochar Catalyst
The 15 wt. % Ni/biochar catalyst was prepared by a wet impregnation method in which the biochar support was soaked and mixed in aqueous solution of nickel (ii) hexahydrate as follows: 17.82 g of nickel (ii) nitrate hexahydrate was dissolved in 50 mL of deionized water, and 20 g of biochar was gradually added to the aqueous solution while stirring. The mixture was stirred at 800 rpm and 70 °C using a hot plate magnetic stirrer until all surface water had evaporated, leaving behind a wet solid catalyst that was dried overnight at 80 °C in the oven. The resulting Ni/biochar catalyst was calcined at 500 °C for 5.5 h. The same preparation methodology was followed for all catalysts used in this study for Ni/biochar, Ni/biochar (KOH) and Ni/biochar (H2SO4).
3.5. Catalyst Characterization
The surface area, pore size distribution, and pore volume of the prepared catalysts were determined by the means of N2¬ adsorption–desorption isotherms technique at a temperature of 77.261 K using a Micrometrics Analytical Instrument ASAP 2010. The surface area and pore size distribution were estimated using the Brunauer–Emmett–Teller (BET) and Barrett–Joyner–Halenda (BJH) model equations. The surface morphology of the catalysts was studied using an SEM Hitachi TM3030 Plus Tabletop microscope, and the particle size distributions of the Ni (metal) over the biochar support was studied by transmission electron microscopy (TEM) using a Hitachi TM4000 plus instrument. Furthermore, ChemBET Pulsar temperature-programmed reduction/desorption (TPR/TPD) equipment was used to determine the strength and number of the basic sites of the prepared catalysts by carbon dioxide temperature-programmed desorption (CO2-TPD) at desorption temperatures between 120 °C and 900 °C at a ramp rate of 20 °C/min with about 0.34 g of sample. The reduction temperature of the catalysts was determined using hydrogen gas temperature-programmed reduction (H2-TPR) and Cat-lab equipment for temperature ranging from ambient to 900 °C at a heating rate of 20 °C/min. Additionally, X-ray diffraction (XRD) analysis was carried out on the biochar itself and prepared catalysts (i.e., 15 wt% Ni/biochar, 15 wt% Ni/biochar (KOH), 15 wt% Ni/biochar (H2SO4) and their counterparts) to determine the crystallinity of the material, the crystal phase, and the elemental composition. Meanwhile, the thermal stability of the catalysts was studied by means of thermogravimetric analysis, TGA (Perkin Elmer TGA 8000) ramping from 25 °C to 800 °C at the rate of 10 °C/min under a nitrogen atmosphere (purity 99.9%), and the functional groups on the surface of the prepared catalysts were determined using Perkin Elmer FTIR (Fourier-transform infrared) spectrometer frontier equipment. The FTIR spectra data collection used a detector LiTaO3, KBr window with a resolution of 0.4 cm−1 and a scanning rate of 100 scans/second. Inductively coupled plasma–optical emission spectroscopy (ICP-OES) method was used to determine how much Ni metal had been incorporated into the biochar. To prepare the sample for ICP-OES analysis, 8 mL of concentrated nitric acid and 2 mL of hydrogen peroxide were combined with about 1 g of sample and digested at 140 °C for 20 min.
3.6. Catalytic Reaction
This study used a 100 mL stainless steel batch reactor supplied by Parr Instruments for all experiments on vanillin hydrodeoxygenation (HDO). The Parr reactor was fitted with a mechanical stirrer, thermocouple, pressure gauge, and a control system for temperature and stirring speed. Prior to each experiment, the catalyst was activated (ex situ) in a Carbolite Gero TF1200 tubular furnace under a constant flow of 5% H2/N2 at 500 °C for 5.5 h. The amount of catalyst tested in the experiment was in the range of 0.4–0.8 g and vanillin in 2-propanol solvent 50 gL−1 (2.5 g vanillin in 50 mL of 2-propanol) was fed into the reactor, sealed, and purged three times with nitrogen and subsequently heated under hydrogen to the desired temperature and pressure. There was no evidence that 2-propanol solvent was hydrodeoxygenated during the HDO of vanillin from the GC analysis, since the peak remained unchanged. The choice of solvent was based on the findings reported in the previous study [3] showing that conversion and selectivity (p-creosol) for 2-propanol solvent was about 100% [3]. Consequently, the stability of the Ni/biochar catalyst was tested over four cycles under the same experimental conditions. This was done using fresh and used catalysts recovered from the first, second and third experimental cycles, respectively. A simple filtration procedure using 150 mm Whatman filter paper was adopted to separate the catalyst from the reaction solution at the end of the reaction. The solid catalyst used was heated at 150 °C for 2 h under a nitrogen atmosphere to remove the visible white crystals of the reactants and products still adsorbed on the catalyst surface.
The HDO reaction was carried out under the following range of conditions: temperatures 100 °C to 150 °C, hydrogen (H2) pressures 30 to 50 bar, and stirring rate 1000 rpm. Based on the preliminary experiments, it was found that a stirring rate of 1000 rpm was sufficient to eliminate the effect of external mass transfer. Hence, all experiments were performed using this mixing speed. As soon as hydrogen was introduced into the reactor, the reaction time was started. For each reaction, samples were taken at the end (undisturbed) or at equally spaced time intervals throughout the duration of the reaction, and the amount of each sample was fixed to reduce pressure loss.
3.7. Optimization of the Reaction Parameters over Ni/biochar Catalyst
The following reaction parameters were optimized over the range: temperature (100 °C–150 °C), H2 pressure (30–50 bar), and catalyst loading (0.4–0.8 g) using a 3-level Box–Behnken design in response surface methodology (Minitab 19 statistical software) for HDO of vanillin over Ni/biochar catalyst only. The experimental runs (15 sets) were performed in duplicate to ensure variability of the data, and the regression equation was obtained for p-creosol yield (Supplementary Materials Table S1).
3.8. Product Analysis
For every experiment, about 2 mL of liquid samples were collected periodically and analyzed using a gas chromatographer (GC—Agilent 6890N) equipped with an FID detector and column (30 m × 0.320 mm × 0.25 μm). The GC was operated at an inlet pressure of 4.1 psi with helium as the carrier gas. The inlet and detector temperatures were set at 320 °C and 330 °C, respectively. The oven temperature was programmed at 60 °C and subsequently ramped to 300 °C at a heating rate of 24 °C min−1. Then, 1 μL of the collected sample was injected into the column using a split ratio of 20:1 for each analysis. Despite the fact that the reaction pathway indicates the formation of water molecules, the GC-FID could not detect peaks for water. As a result, the yield was calculated using the moles of the reactant (i.e., vanillin) and products (i.e., vanillyl alcohol and p-creosol), and the selectivity was also calculated with those moles. The following equations were used to quantify vanillin conversion, yields of vanillyl alcohol and P-creosol, as well as their selectivity.
where the desired product (np) = Vanillyl alcohol or P-creosol, and the total product = moles of vanillyl alcohol + mole of p-creosol
4. Conclusions
The conversion of vanillin, an oxygenated phenolic compound found in bio-oil, into p-creosol, a future fuel, was carried out using biochar as a catalyst carrier. A robust, cost-effective and renewable catalyst was developed by chemically improving the mesoporous structure of the biochar before impregnating the nickel metal to produced Ni/biochar catalyst. The surface area and pore volume of KOH treated biochar increased by 65.5% and 65.3%, while H2SO4-treated biochar exhibited increases of 372.3% and 256.8% in comparison to raw biochar (74.84 m2g−1 and 0.095 cm3g−1). The optimization of vanillin HDO using the response surface methodology (RSM) showed that 150 °C, 50 bar, 0.6 g catalyst loading and 1000 rpm were the optimal conditions for vanillin hydrodeoxygenation to p-creosol over a duration of 10 h. The catalyst also showed high stability after being used for four cycles. However, the KOH and H2SO4 treatments of the biochar only moderately increased catalyst performance when compared to the observed enhancement in physicochemical properties such as surface area, pore volume and pore size distribution.
Supplementary Materials
The following supporting information can be downloaded at: https://0-www-mdpi-com.brum.beds.ac.uk/article/10.3390/catal13010171/s1, Table S1: Design of Experiment (DOE) matrix, vanillin conversion and corresponding p-creosol yields, Figure S1: SEM-EDX of the biochar and the compositional element mapping.
Author Contributions
Conceptualization, J.W.; Methodology, I.M.; Software, I.M.; Validation, I.M. and J.W.; Formal Analysis, I.M.; Investigation, I.M.; Resources, J.W.; Data Curation, I.M.; Writing—Original Draft Preparation, I.M.; Writing—Review and Editing, I.M., A.H., A.I. and J.W; Visualization, I.M.; Supervision, A.I. and J.W.; Project Administration, J.W.; Funding Acquisition, I.M. and J.W. All authors have read and agreed to the published version of the manuscript.
Funding
Financial support for this work was provided by Petroleum Technology Development Fund (PTDF), Nigeria and School of Chemical Engineering, University of Birmingham.
Data Availability Statement
Data are available free of charge via https://edata.bham.ac.uk.
Acknowledgments
Technical support from Jonathan Goldfinch and Chyntol Kanhimbe of School of Chemical Engineering, University of Birmingham, John Wedderburn (Metallurgy and Materials), University of Birmingham and June Callison (Harwell Research complex) is well acknowledged.
Conflicts of Interest
The authors declare no conflict of interest.
References
- Wang, C.; Mironenko, A.V.; Raizada, A.; Chen, T.; Mao, X.; Padmanabhan, A.; Vlachos, D.G.; Gorte, R.J.; Vohs, J.M. Mechanistic study of the direct hydrodeoxygenation of m-cresol over WO x-decorated Pt/C catalysts. ACS Catal. 2018, 8, 7749–7759. [Google Scholar] [CrossRef]
- Huang, R.; Kwon, O.; Lin, C.; Gorte, R.J. The effects of SMSI on m-Cresol hydrodeoxygenation over Pt/Nb2O5 and Pt/TiO2. J. Catal. 2021, 398, 102–108. [Google Scholar] [CrossRef]
- Aliu, E.; Hart, A.; Wood, J. Mild-Temperature hydrodeoxygenation of vanillin a typical bio-oil model compound to Creosol a potential future biofuel. Catal. Today 2021, 379, 70–79. [Google Scholar] [CrossRef]
- Aliu, E.; Hart, A.; Wood, J. Reaction kinetics of vanillin hydrodeoxygenation in acidic and nonacidic environments using bimetallic PdRh/Al2O3 catalyst. Energy Fuels 2019, 33, 11712–11723. [Google Scholar] [CrossRef] [Green Version]
- Santos, J.L.; Mäki-Arvela, P.; Wärnå, J.; Monzón, A.; Angel-Centeno, M.; Murzin, D.Y. HDO of vanillin over noble metal catalyst supported on biochars: Part II: Catalytic behaviour. Appl. Catal. B Environ. 2020, 268, 118425. [Google Scholar] [CrossRef]
- Neumann, J.; Meyer, J.; Ouadi, M.; Apfelbacher, A.; Binder, S.; Hornung, A. The conversion of anaerobic digestion waste into biofuels via a novel Thermo-Catalytic Reforming process. Waste Manag. 2016, 47, 141–148. [Google Scholar] [CrossRef]
- Garcia-Perez, M.; Shen, J.; Wang, X.S.; Li, C.-Z. Production and fuel properties of fast pyrolysis oil/bio-diesel blends. Fuel Process. Technol. 2010, 91, 296–305. [Google Scholar] [CrossRef]
- Chi, N.T.L.; Anto, S.; Ahamed, T.S.; Kumar, S.S.; Shanmugam, S.; Samuel, M.S.; Mathimani, T.; Brindhadevi, K.; Pugazhendhi, A. A review on biochar production techniques and biochar based catalyst for biofuel production from algae. Fuel 2021, 287, 119411. [Google Scholar] [CrossRef]
- Lee, J.; Kim, K.-H.; Kwon, E.E. Biochar as a catalyst. Renew. Sustain. Energy Rev. 2017, 77, 70–79. [Google Scholar] [CrossRef]
- Cheng, F.; Li, X. Preparation and application of biochar-based catalysts for biofuel production. Catalysts 2018, 8, 346. [Google Scholar] [CrossRef]
- Ren, S.; Lei, H.; Wang, L.; Bu, Q.; Chen, S.; Wu, J. Hydrocarbon and hydrogen-rich syngas production by biomass catalytic pyrolysis and bio-oil upgrading over biochar catalysts. RSC Adv. 2014, 4, 10731–10737. [Google Scholar] [CrossRef]
- Wang, B.; He, Z.; Zhang, B.; Duan, Y. Study on hydrothermal liquefaction of spirulina platensis using biochar based catalysts to produce bio-oil. Energy 2021, 230, 120733. [Google Scholar] [CrossRef]
- Yadav, K.; Jagadevan, S. Influence of process parameters on synthesis of biochar by pyrolysis of biomass: An alternative source of energy. In Recent Advances in Pyrolysis; IntechOpen: London, UK, 2019. [Google Scholar]
- Barik, D. Energy extraction from toxic waste originating from food processing industries. Energy Toxic Org. Waste Heat Power Gener. 2019, 3, 17–42. [Google Scholar] [CrossRef]
- Kohl, T.; Laukkanen, T.P.; Järvinen, M.P. Integration of biomass fast pyrolysis and precedent feedstock steam drying with a municipal combined heat and power plant. Biomass Bioenergy 2014, 71, 413–430. [Google Scholar] [CrossRef]
- Xiu, S.; Shahbazi, A. Bio-oil production and upgrading research: A review. Renew. Sustain. Energy Rev. 2012, 16, 4406–4414. [Google Scholar] [CrossRef]
- Sajjadi, B.; Zubatiuk, T.; Leszczynska, D.; Leszczynski, J.; Chen, W.Y. Chemical activation of biochar for energy and environmental applications: A comprehensive review. Rev. Chem. Eng. 2019, 35, 777–815. [Google Scholar] [CrossRef]
- Chen, W.; Gong, M.; Li, K.; Xia, M.; Chen, Z.; Xiao, H.; Fang, Y.; Chen, Y.; Yang, H.; Chen, H. Insight into KOH activation mechanism during biomass pyrolysis: Chemical reactions between O-containing groups and KOH. Appl. Energy 2020, 278, 115730. [Google Scholar] [CrossRef]
- Meinshausen, M.; Meinshausen, N.; Hare, W.; Raper, S.C.; Frieler, K.; Knutti, R.; Frame, D.J.; Allen, M.R. Greenhouse-gas emission targets for limiting global warming to 2 °C. Nature 2009, 458, 1158–1162. [Google Scholar] [CrossRef]
- Chen, T.; Kwon, O.; Huang, R.; Lin, C.; Vohs, J.M. WOx promoted nickel catalyst for hydrodeoxygenation of m-cresol. J. Catal. 2021, 400, 294–300. [Google Scholar] [CrossRef]
- Duan, M.; Cheng, Q.; Wang, M.; Wang, Y. In situ hydrodeoxygenation of vanillin over Ni–Co–P/HAP with formic acid as a hydrogen source. RSC Adv. 2021, 11, 10996–11003. [Google Scholar] [CrossRef]
- Cheng, Q.-y.; Liu, D.-j.; Wang, M.-m.; Wang, Y.-j. Study on catalytic performance of Ni-Co-P amorphous alloy for HDO of vanillin. J. Fuel Chem. Technol. 2019, 47, 1205–1213. [Google Scholar] [CrossRef]
- Yue, X.; Zhang, L.; Sun, L.; Gao, S.; Gao, W.; Cheng, X.; Shang, N.; Gao, Y.; Wang, C. Highly efficient hydrodeoxygenation of lignin-derivatives over Ni-based catalyst. Appl. Catal. B Environ. 2021, 293, 120243. [Google Scholar] [CrossRef]
- Mukherjee, D.; Singuru, R.; Venkataswamy, P.; Damma, D.; Reddy, B.M. Ceria promoted Cu-Ni/SiO2 catalyst for selective hydrodeoxygenation of vanillin. ACS Omega 2019, 4, 4770–4778. [Google Scholar] [CrossRef] [Green Version]
- Yang, Y.; Ochoa-Hernández, C.; Víctor, A.; Pizarro, P.; Coronado, J.M.; Serrano, D.P. Effect of metal–support interaction on the selective hydrodeoxygenation of anisole to aromatics over Ni-based catalysts. Appl. Catal. B Environ. 2014, 145, 91–100. [Google Scholar] [CrossRef]
- Saidi, M.; Moradi, P. Catalytic hydrotreatment of lignin-derived pyrolysis bio-oils using Cu/γ-Al2O3 catalyst: Reaction network development and kinetic study of anisole upgrading. Int. J. Energy Res. 2021, 45, 8267–8284. [Google Scholar] [CrossRef]
- Ranga, C.; Alexiadis, V.I.; Lauwaert, J.; Lødeng, R.; Thybaut, J.W. Effect of Co incorporation and support selection on deoxygenation selectivity and stability of (Co) Mo catalysts in anisole HDO. Appl. Catal. A Gen. 2019, 571, 61–70. [Google Scholar] [CrossRef]
- Karakurt, I.; Aydin, G. Fossil fuel use and related carbon dioxide emissions: A global perspective. In Proceedings of the 23rd International Mining Congress and Exhibition of Turkey, Antalya, Turkey, 16–19 April 2013; pp. 2137–2141. [Google Scholar]
- Bhadmus, O. Sustainable approaches for surface Transportation mortality in Nigeria. AFRREV STECH Int. J. Sci. Technol. 2013, 2, 113–124. [Google Scholar]
- Dehkhoda, A.M.; West, A.H.; Ellis, N. Biochar based solid acid catalyst for biodiesel production. Appl. Catal. A Gen. 2010, 382, 197–204. [Google Scholar] [CrossRef]
- Zhang, P. Adsorption and Desorption Isotherms; KE Group: Bangkok, Thailand, 2016. [Google Scholar]
- Zhang, F.-S.; Nriagu, J.O.; Itoh, H. Mercury removal from water using activated carbons derived from organic sewage sludge. Water Res. 2005, 39, 389–395. [Google Scholar] [CrossRef]
- Cha, J.S.; Park, S.H.; Jung, S.-C.; Ryu, C.; Jeon, J.-K.; Shin, M.-C.; Park, Y.-K. Production and utilization of biochar: A review. J. Ind. Eng. Chem. 2016, 40, 1–15. [Google Scholar] [CrossRef]
- Luo, Y.; Street, J.; Steele, P.; Entsminger, E.; Guda, V. Activated carbon derived from pyrolyzed pinewood char using elevated temperature, KOH, H3PO4, and H2O2. BioResources 2016, 11, 10433–10447. [Google Scholar] [CrossRef]
- Zhang, S.; Wang, J. Removal of chlortetracycline from water by immobilized Bacillus subtilis on honeysuckle residue–derived biochar. Water Air Soil Pollut. 2021, 232, 236. [Google Scholar] [CrossRef]
- Wang, Y.; Shao, Y.; Zhang, L.; Zhang, S.; Wang, Y.; Xiang, J.; Hu, S.; Hu, G.; Hu, X. Co-presence of hydrophilic and hydrophobic sites in Ni/biochar catalyst for enhancing the hydrogenation activity. Fuel 2021, 293, 120426. [Google Scholar] [CrossRef]
- Mohan, D.; Abhishek, K.; Sarswat, A.; Patel, M.; Singh, P.; Pittman, C.U. Biochar production and applications in soil fertility and carbon sequestration–a sustainable solution to crop-residue burning in India. RSC Adv. 2018, 8, 508–520. [Google Scholar] [CrossRef] [Green Version]
- Aftab, Z.-e.-H.; Aslam, W.; Aftab, A.; Shah, A.N.; Akhter, A.; Fakhar, U.; Siddiqui, I.; Ahmed, W.; Majid, F.; Wróbel, J. Incorporation of engineered nanoparticles of biochar and fly ash against bacterial leaf spot of pepper. Sci. Rep. 2022, 12, 8561. [Google Scholar] [CrossRef]
- Wang, Y.; Zhang, Y.; Pei, L.; Ying, D.; Xu, X.; Zhao, L.; Jia, J.; Cao, X. Converting Ni-loaded biochars into supercapacitors: Implication on the reuse of exhausted carbonaceous sorbents. Sci. Rep. 2017, 7, 41523. [Google Scholar] [CrossRef] [PubMed]
- Behazin, E.; Ogunsona, E.; Rodriguez-Uribe, A.; Mohanty, A.K.; Misra, M.; Anyia, A.O. Mechanical, chemical, and physical properties of wood and perennial grass biochars for possible composite application. BioResources 2016, 11, 1334–1348. [Google Scholar] [CrossRef]
- Zhang, K.; Sun, P.; Zhang, Y. Decontamination of Cr (VI) facilitated formation of persistent free radicals on rice husk derived biochar. Front. Environ. Sci. Eng. 2019, 13, 22. [Google Scholar] [CrossRef]
- Reza, M.S.; Afroze, S.; Bakar, M.S.; Saidur, R.; Aslfattahi, N.; Taweekun, J.; Azad, A.K. Biochar characterization of invasive Pennisetum purpureum grass: Effect of pyrolysis temperature. Biochar 2020, 2, 239–251. [Google Scholar] [CrossRef]
- Sanchis, R.; García, T.; Dejoz, A.M.; Vázquez, I.; Llopis, F.J.; Solsona, B. Easy method for the transformation of levulinic acid into gamma-valerolactone using a nickel catalyst derived from nanocasted nickel oxide. Materials 2019, 12, 2918. [Google Scholar] [CrossRef] [Green Version]
- Cheng, F.; Li, X. Temperature-Programmed Reduction of NiO/Al2O3 by Biochar In Situ Generated from Citric Acid. Processes 2022, 10, 1542. [Google Scholar] [CrossRef]
- Cheng, F.; Dupont, V.; Twigg, M.V. Temperature-programmed reduction of nickel steam reforming catalyst with glucose. Appl. Catal. A Gen. 2016, 527, 1–8. [Google Scholar] [CrossRef]
- Liu, N.; Song, X.; Wang, C.; Li, K.; Ning, P.; Sun, X.; Wang, F.; Ma, Y. Surface characterization study of corn-straw biochar catalysts for the simultaneous removal of HCN, COS, and CS 2. New J. Chem. 2020, 44, 13565–13575. [Google Scholar] [CrossRef]
- Eltaweil, A.S.; Abdelfatah, A.M.; Hosny, M.; Fawzy, M. Novel biogenic synthesis of a Ag@ Biochar nanocomposite as an antimicrobial agent and photocatalyst for methylene blue degradation. ACS Omega 2022, 7, 8046–8059. [Google Scholar] [CrossRef]
- Li, S.; Chen, G. Thermogravimetric, thermochemical, and infrared spectral characterization of feedstocks and biochar derived at different pyrolysis temperatures. Waste Manag. 2018, 78, 198–207. [Google Scholar] [CrossRef] [PubMed]
- Zhu, Z.; Tan, H.; Wang, J.; Yu, S.; Zhou, K. Hydrodeoxygenation of vanillin as a bio-oil model over carbonaceous microspheres-supported Pd catalysts in the aqueous phase and Pickering emulsions. Green Chem. 2014, 16, 2636–2643. [Google Scholar] [CrossRef]
- Zhang, F.; Jin, Y.; Fu, Y.; Zhong, Y.; Zhu, W.; Ibrahim, A.A.; El-Shall, M.S. Palladium nanoparticles incorporated within sulfonic acid-functionalized MIL-101 (Cr) for efficient catalytic conversion of vanillin. J. Mater. Chem. A 2015, 3, 17008–17015. [Google Scholar] [CrossRef]
- Vázquez-Fuentes, L.F.; Cortés-Jacome, M.; López-Salinas, E.; Valente, J.S.; Gil, P.M.; Hernández-Cortez, J.; Toledo-Antonio, J.A. Selective vanillin hydrodeoxygenation on synthetic Takovite derived NiAlOx mixed oxide. Top. Catal. 2020, 63, 428–436. [Google Scholar] [CrossRef]
- Kayalvizhi, J.; Pandurangan, A. Hydrodeoxygenation of vanillin using palladium on mesoporous KIT-6 in vapour phase reactor. Mol. Catal. 2017, 436, 67–77. [Google Scholar] [CrossRef]
- Santos, J.; Alda-Onggar, M.; Fedorov, V.; Peurla, M.; Eränen, K.; Mäki-Arvela, P.; Centeno, M.Á.; Murzin, D.Y. Hydrodeoxygenation of vanillin over carbon supported metal catalysts. Appl. Catal. A Gen. 2018, 561, 137–149. [Google Scholar] [CrossRef]
- Aliu, E.; Hart, A.; Wood, J. Kinetics of vanillin hydrodeoxygenation reaction in an organic solvent using a Pd/C catalyst. Ind. Eng. Chem. Res. 2019, 58, 15162–15172. [Google Scholar] [CrossRef]
- Yang, X.; Liang, Y.; Cheng, Y.; Song, W.; Wang, X.; Wang, Z.; Qiu, J. Hydrodeoxygenation of vanillin over carbon nanotube-supported Ru catalysts assembled at the interfaces of emulsion droplets. Catal. Commun. 2014, 47, 28–31. [Google Scholar] [CrossRef]
- Arun, J.; Gopinath, K.P.; SundarRajan, P.; Shyam, S.; Mayuri, N.; Sivaramakrishnan, R.; Pugazhendhi, A. Upgradation of Nostoc punctriforme under subcritical conditions into liquid hydrocarbons (bio-oil) via hydro-deoxygenation: Optimization and engine tests. J. Environ. Chem. Eng. 2021, 9, 105230. [Google Scholar] [CrossRef]
- Varala, S.; Dharanija, B.; Satyavathi, B.; Rao, V.B.; Parthasarathy, R. New biosorbent based on deoiled karanja seed cake in biosorption studies of Zr (IV): Optimization using Box–Behnken method in response surface methodology with desirability approach. Chem. Eng. J. 2016, 302, 786–800. [Google Scholar] [CrossRef]
- Baş, D.; Boyacı, I.H. Modeling and optimization I: Usability of response surface methodology. J. Food Eng. 2007, 78, 836–845. [Google Scholar] [CrossRef]
- Nguyen, H.K.; Pham, V.V.; Do, H.T. Preparation of Ni/biochar catalyst for hydrotreating of bio-oil from microalgae biomass. Catal. Lett. 2016, 146, 2381–2391. [Google Scholar] [CrossRef]
- Pipitone, G.; Zoppi, G.; Bocchini, S.; Rizzo, A.M.; Chiaramonti, D.; Pirone, R.; Bensaid, S. Aqueous phase reforming of the residual waters derived from lignin-rich hydrothermal liquefaction: Investigation of representative organic compounds and actual biorefinery streams. Catal. Today 2020, 345, 237–250. [Google Scholar] [CrossRef]
Figure 1.
The (a) N2 adsorption–desorption isotherm and (b) pore size distribution of the prepared catalysts. The pore size distribution of the catalysts further confirms that they are mesoporous materials, with a pore size distribution found mostly in the range between 2 nm and 16.24 nm (mesopore range 2 to 50 nm).

Figure 2.
SEM-EDX analysis of biochar. (a) SEM micrograph; (b) EDX analysis including tabulated elemental composition below the figure.
Figure 2.
SEM-EDX analysis of biochar. (a) SEM micrograph; (b) EDX analysis including tabulated elemental composition below the figure.

Figure 3.
TEM analysis and histograms of the Ni metal nanoparticle sizes of (a) Ni/biochar, (b) Ni/biochar (KOH), and (c) Ni/biochar (H2SO4).
Figure 3.
TEM analysis and histograms of the Ni metal nanoparticle sizes of (a) Ni/biochar, (b) Ni/biochar (KOH), and (c) Ni/biochar (H2SO4).

Figure 4.
XRD diffraction patterns of (a) biochar supports, (b) fresh Ni/biochar catalysts, and (c) fresh vs. used Ni/biochar catalysts.
Figure 4.
XRD diffraction patterns of (a) biochar supports, (b) fresh Ni/biochar catalysts, and (c) fresh vs. used Ni/biochar catalysts.

Figure 5.
FTIR spectra of biochar, biochar (KOH), biochar (H2SO4), and their corresponding Ni catalysts.
Figure 5.
FTIR spectra of biochar, biochar (KOH), biochar (H2SO4), and their corresponding Ni catalysts.

Figure 6.
H2-TPR profiles of raw biochar, Ni/biochar, Ni/biochar (KOH), and Ni/biochar (H2SO4) catalysts.
Figure 6.
H2-TPR profiles of raw biochar, Ni/biochar, Ni/biochar (KOH), and Ni/biochar (H2SO4) catalysts.

Figure 7.
CO2-TPD profile of raw biochar, Ni/biochar, Ni/biochar (KOH), and Ni/biochar (H2SO4) catalysts.
Figure 7.
CO2-TPD profile of raw biochar, Ni/biochar, Ni/biochar (KOH), and Ni/biochar (H2SO4) catalysts.

Figure 8.
TGA thermogram of Ni/biochar, Ni/biochar (KOH) and Ni/biocharH2SO4 catalysts.

Scheme 1.
Reaction pathway for vanillin HDO over Ni/biochar catalyst.

Figure 9.
Conversion and product yield from vanillin HDO over Ni/biochar catalyst (reaction conditions: initial substrate concentration 0.33 M; temperature 150 °C; H2 pressure 50 bar; catalyst 0.8 g; reaction time 10 h).
Figure 9.
Conversion and product yield from vanillin HDO over Ni/biochar catalyst (reaction conditions: initial substrate concentration 0.33 M; temperature 150 °C; H2 pressure 50 bar; catalyst 0.8 g; reaction time 10 h).

Figure 10.
Effect of temperature on HDO of vanillin (reaction conditions: initial concentration 0.33 M; catalyst 0.4 g; H2 pressure 50 bar; reaction time 9.5 h).
Figure 10.
Effect of temperature on HDO of vanillin (reaction conditions: initial concentration 0.33 M; catalyst 0.4 g; H2 pressure 50 bar; reaction time 9.5 h).

Figure 11.
Effect of pressure on the HDO of vanillin (reaction conditions: initial concentration 0.33 M; catalyst 0.6 g; reaction temperature 150 °C; reaction time 9.5 h).
Figure 11.
Effect of pressure on the HDO of vanillin (reaction conditions: initial concentration 0.33 M; catalyst 0.6 g; reaction temperature 150 °C; reaction time 9.5 h).

Figure 12.
Catalyst stability study, showing product yield and selectivity over 4 cycles of reuse (reaction conditions: initial substrate concentration 0.33 M, temperature 150 °C, H2 pressure 50 bar, catalyst 0.8 g, reaction time 9.5 h).
Figure 12.
Catalyst stability study, showing product yield and selectivity over 4 cycles of reuse (reaction conditions: initial substrate concentration 0.33 M, temperature 150 °C, H2 pressure 50 bar, catalyst 0.8 g, reaction time 9.5 h).

Figure 13.
The effect of chemical treatment of biochar on catalytic performance (reaction conditions: initial substrate concentration 0.33 M, temperature 150 °C, H2 pressure 50 bar, catalyst 0.8 g, reaction time 7.5 h).
Figure 13.
The effect of chemical treatment of biochar on catalytic performance (reaction conditions: initial substrate concentration 0.33 M, temperature 150 °C, H2 pressure 50 bar, catalyst 0.8 g, reaction time 7.5 h).


Table 1.
Surface area and pore volume of Ni/biochar, Ni/activated biochar, and Ni/acidified biochar.
Table 1.
Surface area and pore volume of Ni/biochar, Ni/activated biochar, and Ni/acidified biochar.
| Catalyst | Surface Area (m2g−1) | Pore Volume (cm3g−1) | Ni Content (%) |
|---|---|---|---|
| Ni/biochar | 74.837 | 0.095 | 15.1 |
| Ni/biochar (KOH) | 123.304 | 0.15 | 15.3 |
| Ni/biochar (H2SO4) | 353.503 | 0.339 | 14.7 |
Table 2.
Results of analysis of variance for hydrodeoxygenation of vanillin.
| Source | DF | Adj ss | Adj MS | F-Value | P-Value Significance |
|---|---|---|---|---|---|
| Model Linear | 9 3 | 106,44.7 9927.7 | 1182.74 3309.23 | 355.07 993.46 | 0.000 S 0.000 S |
| Temperature (°C) | 1 | 9058.6 | 9058.58 | 2719.47 | 0.000 S |
| Pressure (Bar) | 1 | 791.2 | 791.22 | 237.53 | 0.000 S |
| Catalyst Loading (g) | 1 | 77.9 | 77.88 | 23.38 | 0.005 S |
| Square | 3 | 676.1 | 225.36 | 67.65 | 0.000 S |
| Temp. (°C) × Temp. (°C) | 1 | 595.6 | 595.61 | 178.81 | 0.000 S |
| Pressure (Bar) × Pressure (Bar) | 1 | 48.1 | 48.10 | 14.44 | 0.013 S |
| Cat. Loading (g) × Cat. Loading (g) | 1 | 7.7 | 7.67 | 2.30 | 0.190 NS |
| 2-Way Interaction | 3 | 40.9 | 13.64 | 4.09 | 0.082 NS |
| Temp. (°C) × Pressure (Bar) | 1 | 28.6 | 28.62 | 8.59 | 0.033 S |
| Temp. (°C) × Catalyst Loading (g) | 1 | 4.6 | 4.62 | 1.39 | 0.292 NS |
| Pressure (Bar) × Cat.Loading (g) | 1 | 7.7 | 7.67 | 2.30 | 0.190 NS |
| Error | 5 | 16.7 | 3.33 |
DF: degrees of freedom, Adj ss: adjusted sum of square, Add ms: adjusted mean squares. P-value: probability value and F-value: Fisher value; Temp: temperature; Cat loading: catalyst loading regression equation in uncoded units.
Table 3.
Model summary.
| S | R2 | R2 (adj.) | R2 (pred.) |
|---|---|---|---|
| 2.14 | 99.66 | 99.40 | 98.65 |
Table 4.
Validation of the regression model.
| S/no. | Temperature (°C) | Pressure (bar) | Catalyst (g) | Calculated Value | Experimental Value |
|---|---|---|---|---|---|
| 1 | 120 | 40 | 0.4 | 34.04 | 44.01 |
| 2 | 135 | 30 | 0.6 | 45.14 | 54.48 |
| 3 | 140 | 50 | 0.8 | 79 | 84.02 |
Disclaimer/Publisher’s Note: The statements, opinions and data contained in all publications are solely those of the individual author(s) and contributor(s) and not of MDPI and/or the editor(s). MDPI and/or the editor(s) disclaim responsibility for any injury to people or property resulting from any ideas, methods, instructions or products referred to in the content. |
© 2023 by the authors. Licensee MDPI, Basel, Switzerland. This article is an open access article distributed under the terms and conditions of the Creative Commons Attribution (CC BY) license (https://creativecommons.org/licenses/by/4.0/).
Share and Cite
MDPI and ACS Style
Mudi, I.; Hart, A.; Ingram, A.; Wood, J. Catalytic Hydrodeoxygenation of Vanillin, a Bio-Oil Model Compound over Renewable Ni/Biochar Catalyst. Catalysts 2023, 13, 171. https://0-doi-org.brum.beds.ac.uk/10.3390/catal13010171
AMA Style
Mudi I, Hart A, Ingram A, Wood J. Catalytic Hydrodeoxygenation of Vanillin, a Bio-Oil Model Compound over Renewable Ni/Biochar Catalyst. Catalysts. 2023; 13(1):171. https://0-doi-org.brum.beds.ac.uk/10.3390/catal13010171
Chicago/Turabian StyleMudi, Ismaila, Abarasi Hart, Andrew Ingram, and Joseph Wood. 2023. "Catalytic Hydrodeoxygenation of Vanillin, a Bio-Oil Model Compound over Renewable Ni/Biochar Catalyst" Catalysts 13, no. 1: 171. https://0-doi-org.brum.beds.ac.uk/10.3390/catal13010171
Note that from the first issue of 2016, this journal uses article numbers instead of page numbers. See further details here.