Article

g-C3N4 as Photocatalyst for the Removal of Metronidazole Antibiotic from Aqueous Matrices under Lab and Pilot Scale Conditions

by
Christos Lykos
1,
Sotirios Sioulas
1 and
Ioannis Konstantinou
1,2,*
1
Department of Chemistry, University of Ioannina, 45110 Ioannina, Greece
2
Institute of Environment and Sustainable Development, University Research Center of Ioannina (URCI), 45110 Ioannina, Greece
*
Author to whom correspondence should be addressed.
Submission received: 22 December 2022 / Revised: 13 January 2023 / Accepted: 17 January 2023 / Published: 22 January 2023

Abstract

:
The presence of pharmaceuticals in water is a problem of utmost importance due to the various adverse effects that these compounds may have on aquatic organisms and also humans. Since conventional wastewater treatment plants fail to efficiently remove many of these compounds, new techniques such as heterogeneous photocatalysis have been developed that are capable of degrading them. In this study, graphitic carbon nitride (g-C3N4) was used as photocatalyst to remove metronidazole (MTZ), which is a widely prescribed antibiotic that has been reported as a potential carcinogen. The experiments were performed under lab and pilot scale conditions. During the lab scale experiments, 90.6% of the initial pharmaceutical concentration was removed after 360 min of irradiation and its removal followed a pseudo first order kinetic model with a degradation rate constant of k = 0.00618 min−1. Moreover, scavenging studies indicated that the indirectly produced hydroxy radicals contribute very little to the degradation mechanism. Through high precision mass spectrometry techniques, eight transformation products (TPs) were identified, and possible transformation pathways were suggested. Similarly, in the case of pilot scale experiments, 100 and 200 mg L−1 of g-C3N4 were used and the antibiotic’s removal also followed pseudo first order kinetics with k = 0.00827 min−1 and k = 0.00942 min−1, respectively. However, starting from low level inherent concentrations, only two TPs were identified. By using in silico tools (ECOSAR and T.E.S.T.), various ecotoxicological values were predicted for the TPs, which were generally found to be less toxic than the parent compound and with lower mutagenic and bioaccumulative potential. Moreover, the monitoring of the ecotoxicity with the in vitro Microtox bioassay showed that at the end of all the photocatalytic processes, the toxicity was reduced. In conclusion, this technique could have the potential to remove MTZ and other similar pharmaceuticals in full-scale applications. However, for this to happen with the highest possible efficiency, further studies must be conducted, focusing on improving the catalyst’s performance and reusability, improving the separation of catalyst as well as finding the optimum conditions for this process.

1. Introduction

One of the most recent problems that humanity has to face, especially in recent decades, is the presence of pharmaceuticals in water, which are considered as contaminants of emerging concern (ECs) and due to their characteristics, according to various studies, tend to cause adverse effects to aquatic organisms and humans [1,2,3].
One such compound is the antibiotic metronidazole (MTZ), which is a pro-drug of the nitroimidazole class and is widely prescribed for the treatment of anaerobic infections in both humans and animals [4,5]. A recent study, which focused on monitoring pharmaceuticals in effluents of wastewater treatment plants (WWTPs) in various European countries, reported that MTZ was detected frequently at concentrations ranging from 19.6 ng L−1 to 93.2 ng L−1 [6]. Therefore, this compound could potentially be transferred to environmental water matrices and through the water cycle could even end up in drinking water [7]. The presence of MTZ in drinking water could cause advert effects even in humans, as according to some reports, it can damage lymphocyte DNA, potentially causing mutations or even carcinogenesis [8,9]. In addition, MTZ is listed as a probable human carcinogen by both the International Agency for Research on Cancer (IARC) and the National Toxicology Program of the US Department of Health and Human Services [10,11]. Moreover, the presence of antibiotic compounds in discharged effluents reaching environmental compartments promotes antibiotic resistance, which is a major public health concern worldwide. Therefore, its removal from wastewater before it reaches surface or ground waters is important. However, conventional WWTPs fail to efficiently remove pharmaceuticals, such as MTZ [12,13], and new unconventional techniques capable of removing such compounds need to be developed.
Advanced oxidation processes (AOPs) are promising techniques in this regard, due to their advantages such as low selectivity and high efficiency at reasonable cost [14,15]. These processes mainly focus on the in situ formation of reactive species (e.g., HO, O2•−, 1O2) capable of degrading a multitude of organic compounds, such as pharmaceuticals, even mineralizing them [1,16]. Of the various AOPs that have been reported, heterogeneous photocatalysis is possibly one of the most popular, with the most common photocatalysts being metal oxides, such as titanium dioxide (TiO2) and zinc oxide (ZnO), which, due to their relatively wide bandgap, are capable of absorbing photons of the ultraviolet (UV) spectrum [17,18]. In recent years, the interest of scientists has focused on the development of photocatalysts that can operate under visible light and offer great economic benefits, due to their practical advantages [16,19]. One such material is graphitic carbon nitride (g-C3N4), which is a two-dimensional (2D) polymeric material composed of heptazine (tris-s-triazine) units and has found applications as a photocatalyst, since it possesses certain advantages over other semiconductors (e.g., high chemical stability, abundance of its precursor compounds, low cost, non-toxicity and medium band gap energy equal to 2.7 eV) [20,21,22,23,24,25]. Despite the various lab scale studies, which utilize g-C3N4 (in pure form or coupled with other semiconductors) as a photocatalyst to degrade organic compounds [21,23,25,26,27,28], and especially common pharmaceuticals such as tetracycline [29,30], carbamazepine [30,31,32], diclofenac [24,30,33,34] and ciprofloxacin [23,35], very few if any focus on its photocatalytic application to remove pharmaceuticals in pilot scale conditions and evaluate the ecotoxicological effect of the process in real hospital wastewater (HWW), as in the present study. Moreover, while several photocatalytic studies have investigated the degradation of MTZ [8,18,36,37,38], few have utilized g-C3N4 and provided insight in the pharmaceutical’s degradation pathways.

2. Results and Discussion

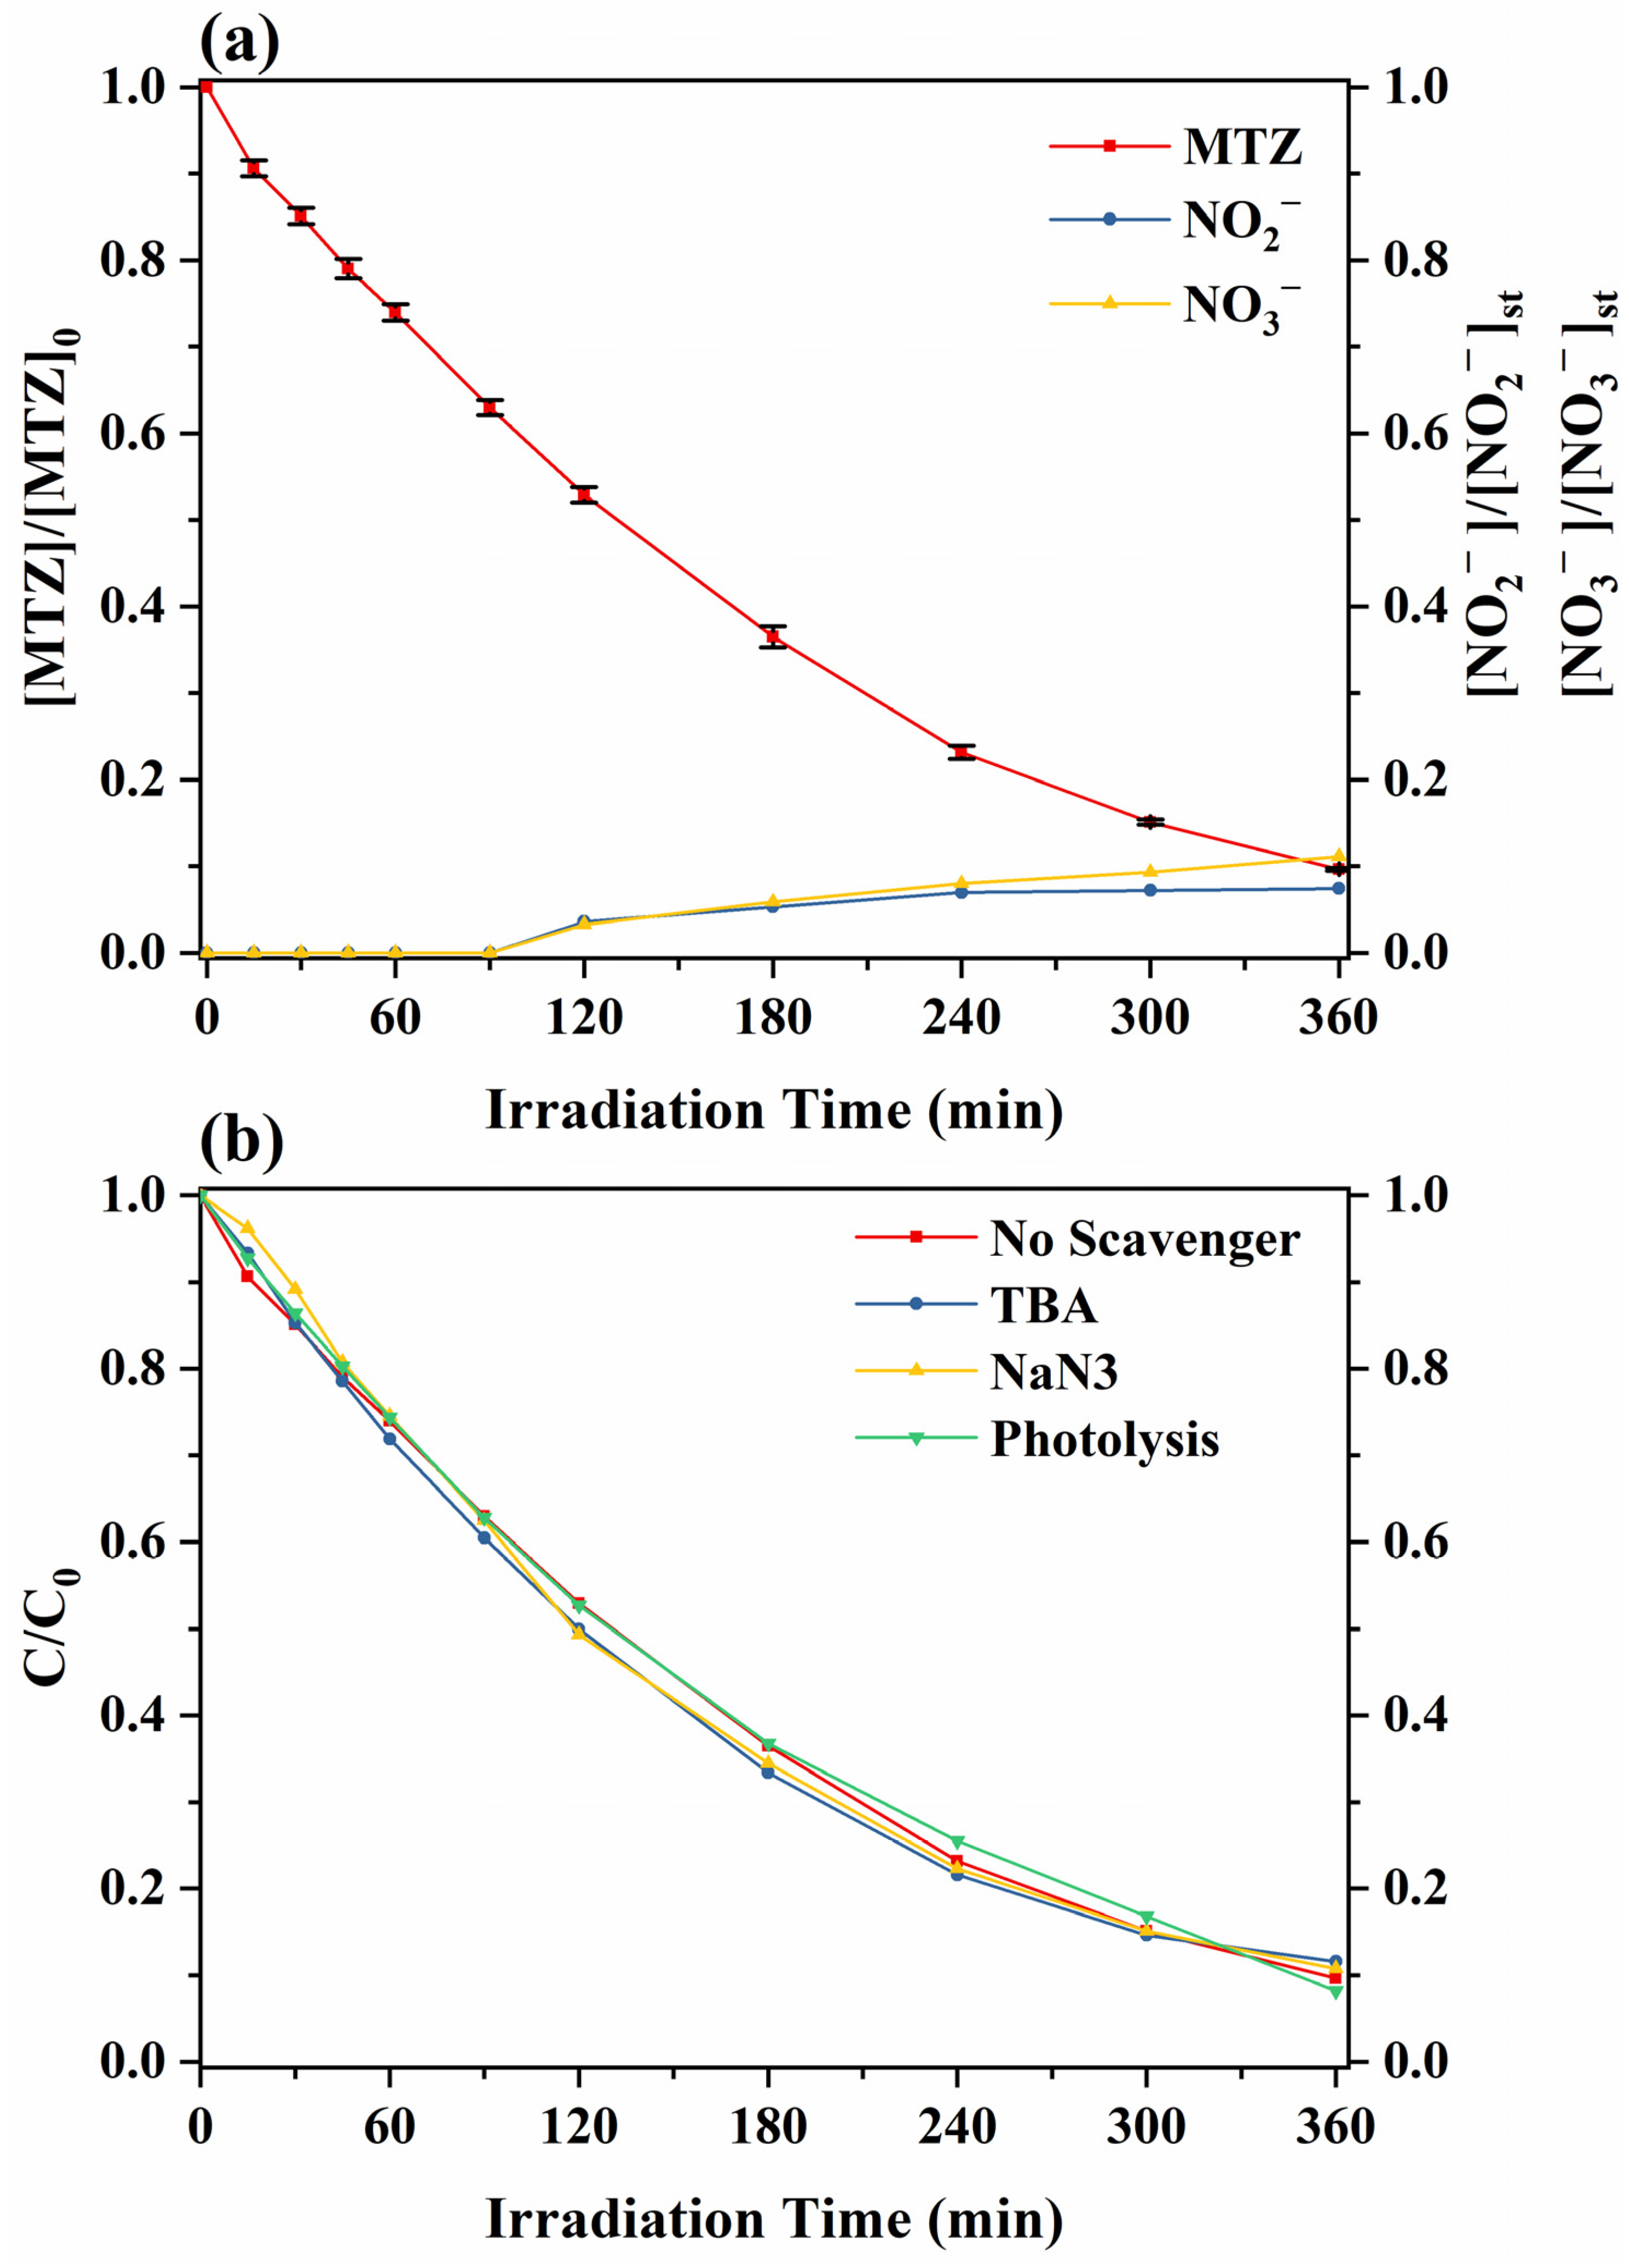
2.1. Removal Kinetics and Degree of Mineralization (Lab Scale Conditions)

As can be observed from Figure 1a, after 360 min of simulated irradiation, MTZ was not completely removed (90.6%). The antibiotic’s removal followed a pseudo-first order kinetic model according to Equation (1) with a correlation coefficient R2 = 0.9936. Considering the aforementioned kinetic model, the removal kinetic constant (k), as well as MTZ’s half-life (t1/2), were calculated using Equation (1) (where C0 is the initial concentration of MTZ and Ct is its concentration after t minutes of irradiation) and Equation (2), respectively, and found to be k = 0.00618 min−1 and t1/2 = 111.8 min, respectively.
Ct = C0e−kt
t1/2 = ln2/k
The degree of mineralization of MTZ was partially studied by monitoring the concentrations of nitrite (NO2) and nitrate (NO3) anions, formed as a result of the compound’s oxidative degradation throughout the photocatalytic process. In both cases, the maximum concentration of NO2 and NO3 that can ideally be produced by the oxidation of MTZ (10 mg L−1) was calculated through stoichiometric equations and found to be [NO2]st = 8.07 mg L−1 and [NO3]st = 10.88 mg L−1, respectively. From the evolution kinetics (Figure 1a) of the aforementioned anions, it becomes evident that no reaction leading to the release of the compound’s nitrogen atoms took place within the first 90 min of irradiation. After 90 min, both anions began to form at apparently the same rate, up to 240 min. However, at higher irradiation times and until the end of the process, the concentration of NO2 stayed practically the same, while the concentration of NO3 continued to increase. This observation led to the conclusion that during these last 2 h of irradiation, the rate of formation of NO2 was practically equal to the rate of transformation into NO3. Upon completion of the photocatalytic process, the concentrations of both of NO2 and NO3 corresponded to a total of 18% of the stoichiometrically available nitrogen in the MTZ molecule, leading to the conclusion that complete mineralization of the antibiotic may be possible through this process at higher irradiation times.

2.2. Investigation of the Hydroxy Radicals’ (HO•) Contribution to the Degradation Mechanism

The degree of contribution of the indirectly generated oxidant species [39] to the photocatalytic removal mechanism of MTZ with g-C3N4 was studied by adding suitable scavengers, namely tert-butanol (TBA) (kHO• = (3.8 - 7.6) × 109 M−1s−1) and sodium azide (NaN3) (kHO• = 1.2 × 10¹⁰ M−1s−1), (k1O2 = 5x10⁸ M−1s−1) [40]. As shown in Figure 1b, the presence of these substances had an insignificant inhibitory effect on the removal kinetics of MTZ with the degree of reduction of the removal kinetic constant (%Δk), in both cases being lower than 1% (Table 1).
Preliminary studies focusing on the photolytic removal of MTZ (I = 500 W m−2) demonstrated that within 360 min of irradiation, 91.8% of the pharmaceutical’s initial concentration (10 mg L−1) was removed (Figure 1b), a removal percentage, which is very close to the one (90.6%) achieved in the presence of g-C3N4 under the same irradiation conditions. Moreover, in both cases, the removal kinetic constants were found to be equal. Therefore, it was concluded that HO and 1O2 had a minor contribution to the initial degradation steps and the parent pharmaceutical’s removal was significantly proceeded though photolysis, which, according to literature, is likely to have occurred [41].

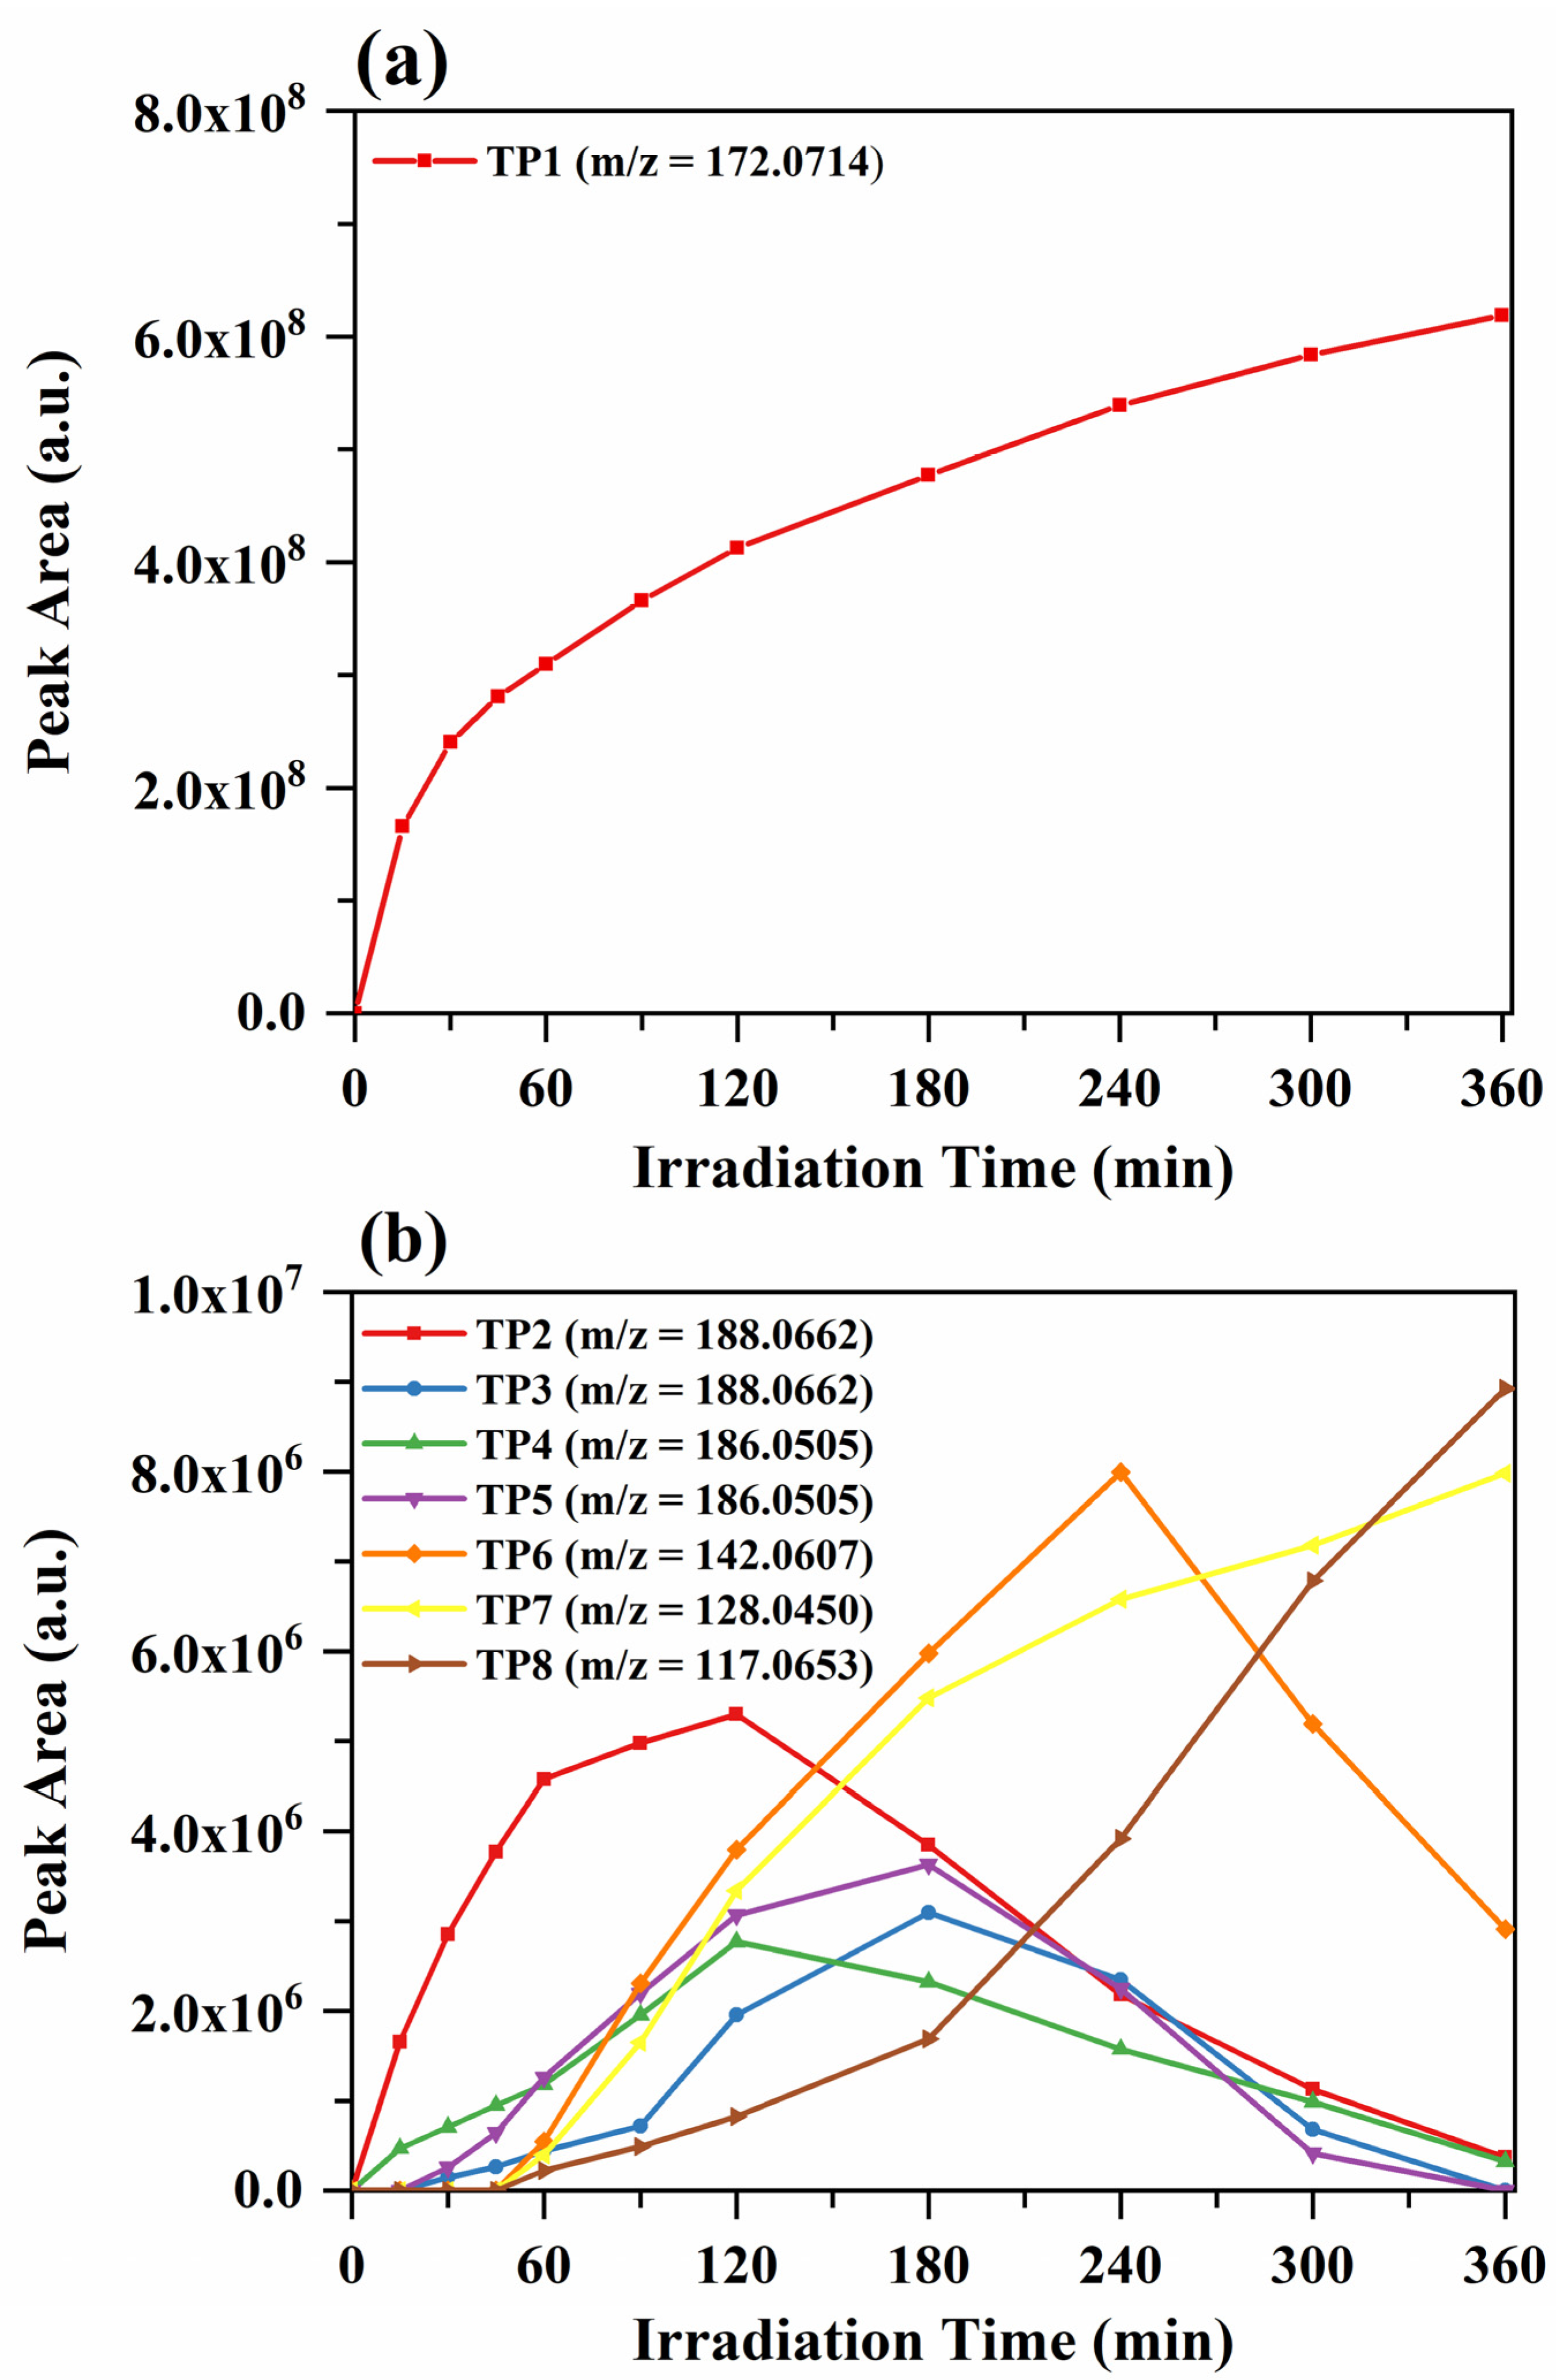
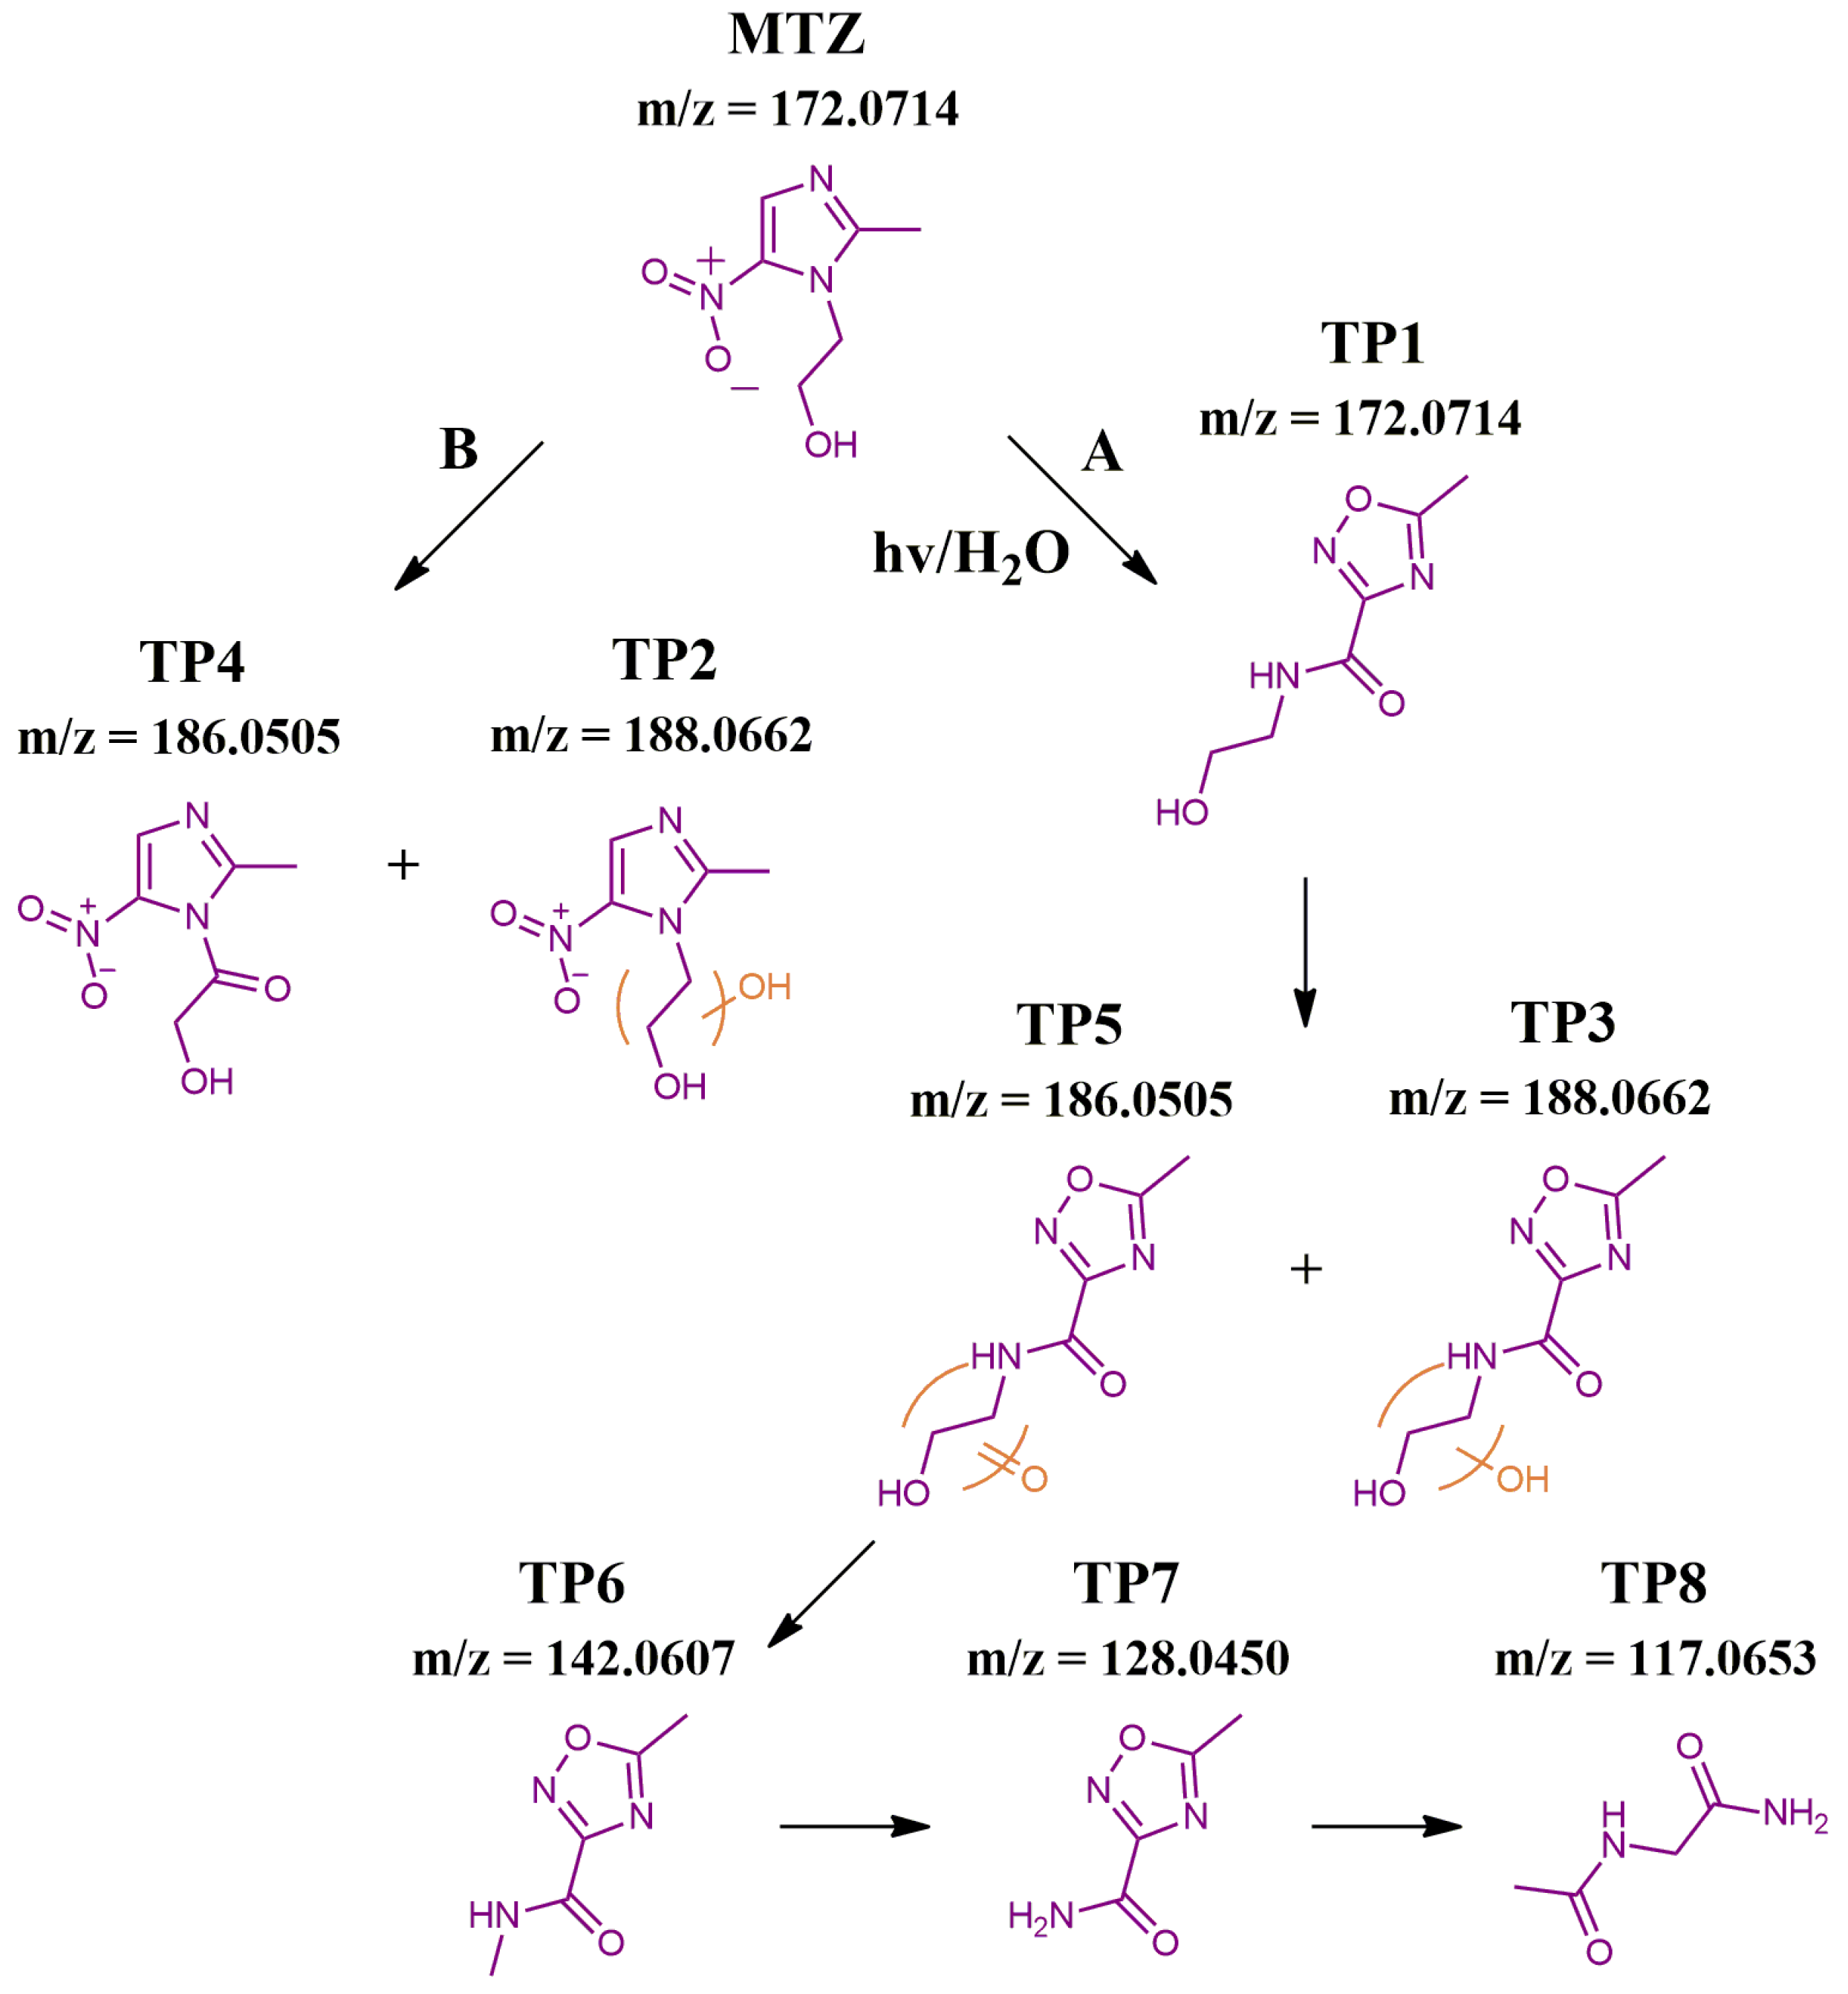
2.3. Identification of Transformation Products (TPs) of MTZ and Possible Transformation Pathways

Throughout the irradiation of MTZ in the presence of g-C3N4 suspension, eight TPs were identified to have formed based on the mass spectrometry results summarized in Table S1. TP1 was eluted before MTZ, showed exactly the same m/z = 172.0714 Da as the parent compound, and based on its MS2 fragments, it was identified as the isomer N-(2-hydroxyethyl)-5-methyl-1,2,4-oxadiazole-3-carboxamide. TP2 and TP3, whose m/z = 188.0662 Da differed by 15.9948 Da from the pseudo-molecular ions of MTZ and TP1, were identified based on their retention times as the corresponding hydroxylated products of these compounds. However, since the exact carbon site at which hydroxylation took place could not be identified in either compounds, two possible structures were proposed in each case: TP2a 2-(2-methyl-5-nitro-1H-pyrrol-1-yl) ethane-1,1-diol or TP2b 1-(2-methyl-5-nitro-1H-pyrrol-1-yl)ethane-1,2-diol and TP3a N-(2,2-dihydroxyethyl)-5-methyl-1,2,4-oxadiazole-3-carboxamide or TP3b N-(1,2-dihydroxyethyl)-5-methyl-1,2,4-oxadiazole-3-carboxamide. Similarly, TP4 and TP5 (m/z = 186.0505 Da) were identified as carbonylated products of MTZ and TP1, respectively. Moreover, in these two cases, the exact carbonylation site could not be determined, but since TP4 was eluted after MTZ, it was tentatively concluded that it was a keto derivative, since a carboxylic acid derivative would have been more polar than the antibiotic. However, for TP5 this was not the case, and therefore two possible structures were proposed: TP5a 2-(5-methyl-1,2,4-oxadiazole-3-carboxamido)acetic acid and TP5b N-(2-hydroxyacetyl)-5-methyl-1,2,4-oxadiazole-3-carboxamide. Finally, TP6, TP7 and TP8, based on their m/z, retention time and MS2 fragments, were identified as N,5-dimethyl-1,2,4-oxadiazole-3-carboxamide, 5-methyl-1,2,4-oxadiazole-3-carboxamide and 2-acetamidoacetamide, respectively.
From the semi-quantitative determination of the molecular ions of the aforementioned TPs, their corresponding evolutionary profiles were obtained as presented in Figure 2a,b. Based on the structure of the TPs, their evolutionary profiles, the results of scavenging and photolytic experiments as well as mineralization studies, two possible transformation pathways were proposed (Scheme 1).
In pathway A, MTZ rearranges under UV irradiation in the presence of water to form TP1, i.e., MTZ isomer, which is a stable molecule also observed in similar photolytic and photocatalytic studies [18,41,42,43]. TP1 then undergoes either hydroxylation or carbonylation at Cα or Cβ with respect to the hydroxy group, to form TP3 and TP5. The formation of these compounds could be described by the Russell mechanism, according to which carbon centered radicals are formed after hydrogen abstraction at Cα or Cβ of the hydroxyethyl chain of TP1. These radicals then, react with dissolved oxygen, forming superoxide radicals, which in turn react with each other to form dimers, that afterwards degrade to either hydroxylated or carbonylated products [44,45]. If carbonylation has taken place on Ca then, TP5 via a photo Kolbe reaction leads to the formation of TP6. TP6 is then demethylated into TP7, whose oxadiazolic ring opens to finally yield TP7, completing the pathway. On the other hand, in pathway B MTZ is either hydroxylated or carbonylated to give TP2 and TP4, which, as in the case of TP1, can also be described with the Russell mechanism.
As can be observed from their evolutionary profiles, TP2 and TP4 as well as TP3 and TP5 start to form and reach their maximum concentrations at the same time intervals. This observation partially confirms the claim that these compounds could have formed simultaneously through the Russell mechanism. Moreover, the profiles of TP5, TP6, TP7 and TP8 seemingly succeed each other, much like the proposed pathway A.
From Figure 2a,b, it is evident that the photolytically produced TP1 is the main product of the process due to its much higher concentration compared to the other TPs. However, the TPs that succeed it in pathway A are not reported in other photolytic studies of MTZ [41,42,43], thus indicating that its further degradation occurs via photocatalysis with g-C3N4.
In conclusion, under the applied experimental conditions, photolysis and photocatalysis appear to be competitive processes taking place simultaneously, leading to the degradation and partial mineralization of MTZ, with pathway A being the major one and pathway B being the minor one due to very low HO contribution.

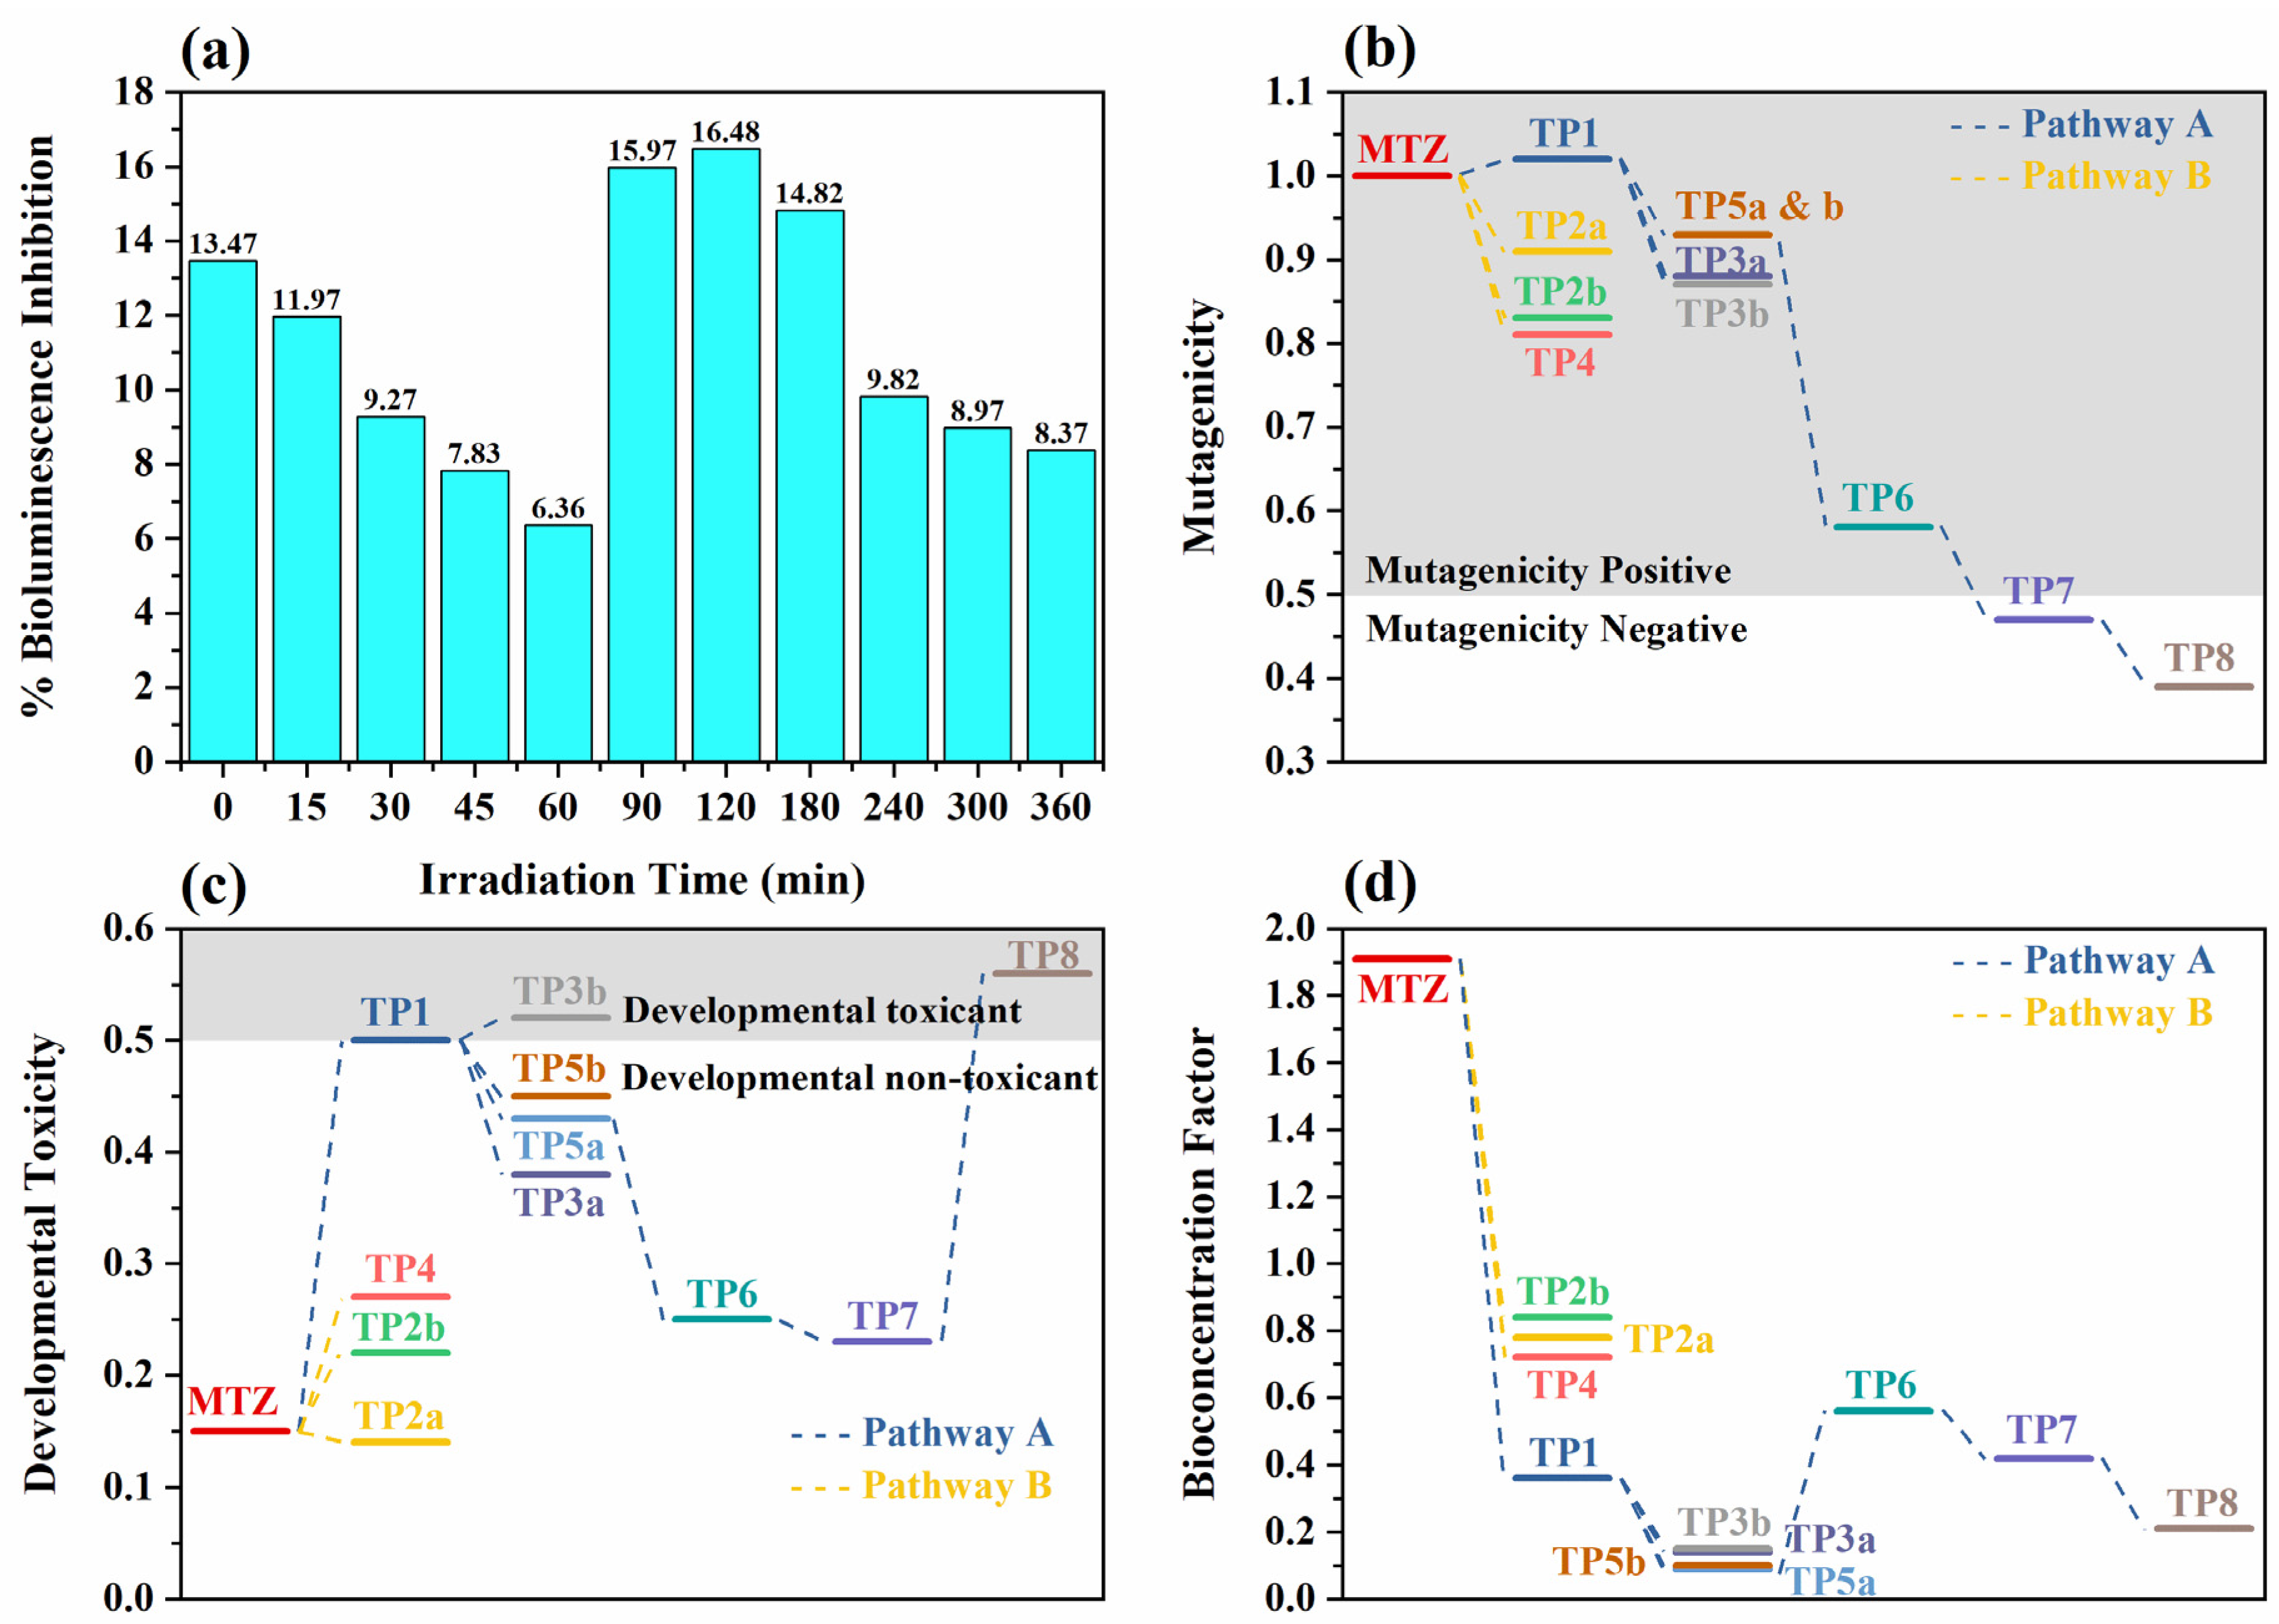
2.4. In Vitro and In Silico Toxicity Evaluation

According to Microtox results (Figure 3a), the toxicity of the solution initially corresponded to 13.47% bioluminescence inhibition and demonstrated a downward trend up to 60 min of irradiation. From 90 min onwards, the % bioluminescence inhibition started to increase slightly, reaching its maximum value (16.48%) at 120 min. This time point coincides with the maximum concentrations of TP2 and TP4, based on their evolutionary profiles. Therefore, the observed increase in toxicity could be attributed to the presence of TP2, TP4 or to some synergistic effect between them. After 120 min, the toxicity showed a gradual decrease, and by the end of the photocatalytic process corresponded to 8.37% of bioluminescence inhibition. Overall, from the beginning to the end of the whole process, the toxicity was reduced, hinting that in higher irradiation periods, complete detoxification may be possible.
Ecotoxicity values predicted by ECOSAR for MTZ, and its TPs are summarized in Table 2. As can be observed, each compound based on its acute and chronic toxicity values for each trophic level was categorized according to the Globally Harmonized System of Classification and Labeling of Chemicals (GHS) [46]. In order to make these values somewhat comparable to the aforementioned Microtox results, the study focused on the category of daphnids, which are zooplanktonic crustaceans and are biologically closer to the marine bacterium Vibrio Fischeri. Each identified TP demonstrated lower acute toxicity values compared to MTZ, including TP2 and TP4, indicating that the synergistic effect between these compounds may be the most likely scenario that led to the sudden increase in toxicity.
The T.E.S.T. evaluation results (Figure 3b,c) demonstrated that except for TP1, all the other TPs are less mutagenic than the parent compound. In particular, pathway A ultimately led to the formation of substances, which were characterized as “mutagenicity negative”, thus demonstrating that the application of this process could be applied to address the main problem with MTZ, which is its mutagenicity. Likewise, the bioconcentration factor values demonstrated that the photocatalytic removal of MTZ resulted in the formation of compounds that do not tend to accumulate in the various organisms as much as it does. Finally, most TPs showed higher developmental toxicity values than MTZ but only three out of the TPs were found to be “developmental toxicants” and capable of causing harmful effects on embryos or organisms who have not fully matured.

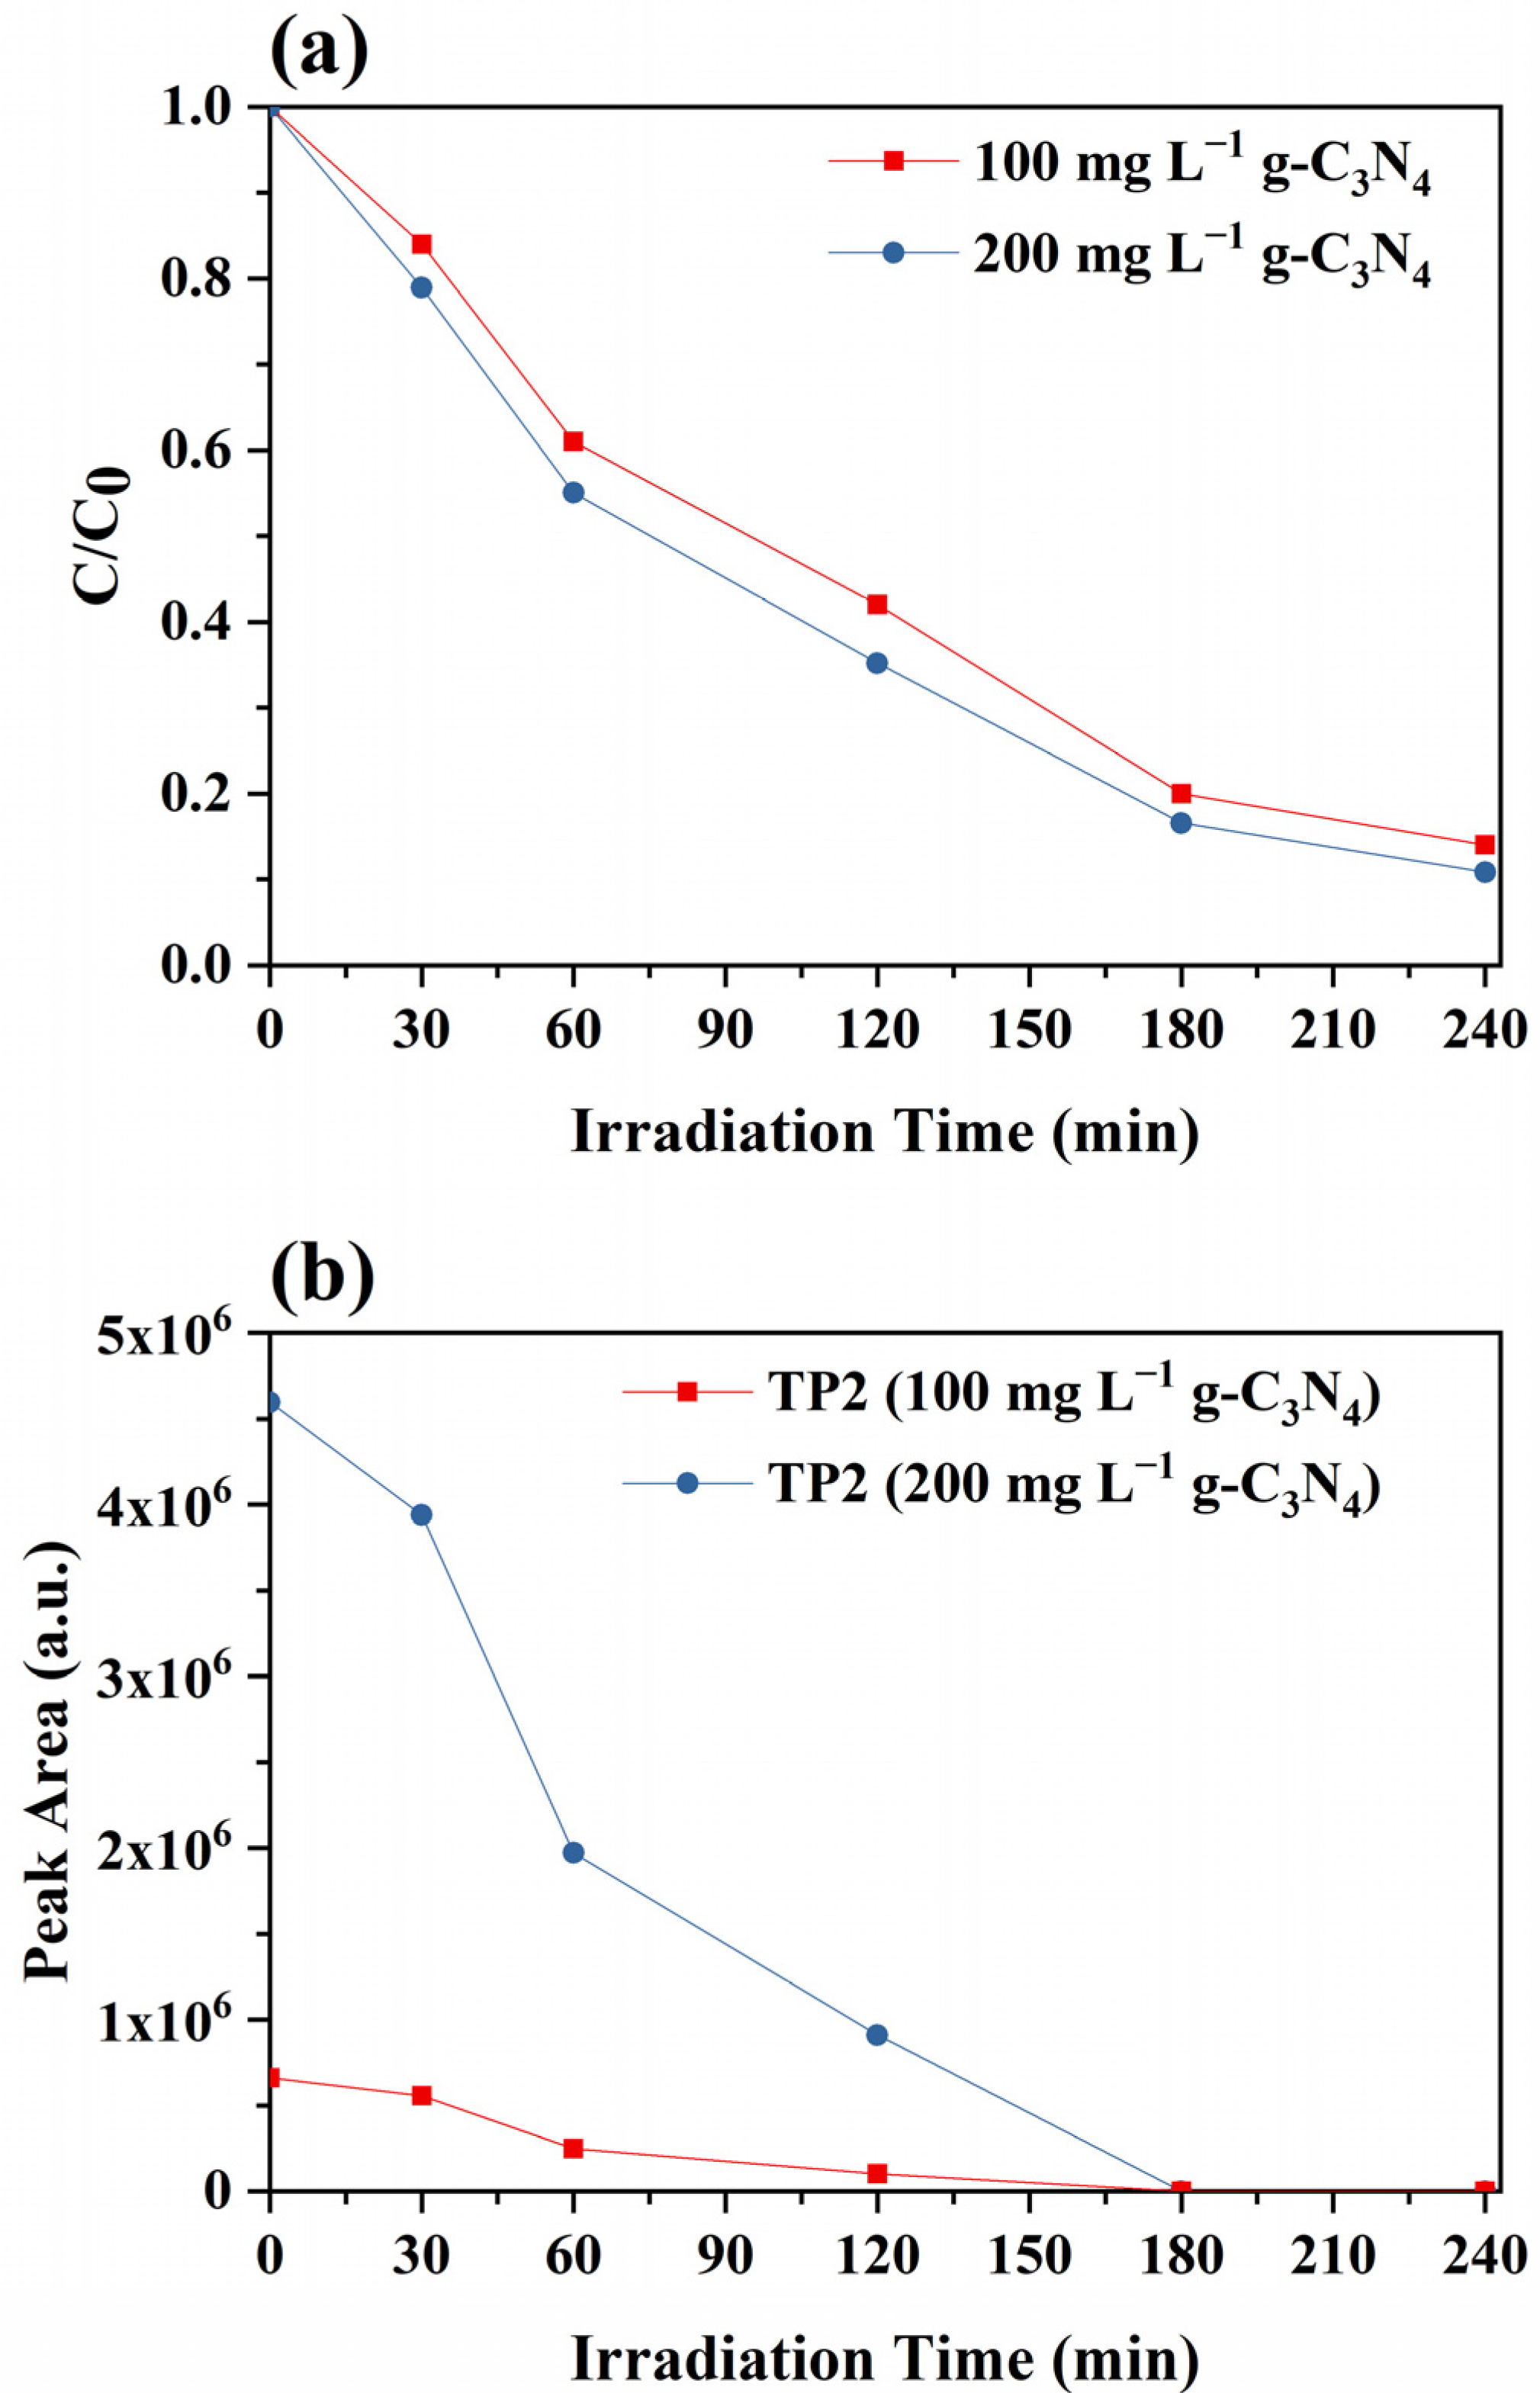
2.5. Removal Kinetics of MTZ and Identification of TPs under Pilot Scale

In the pilot scale experiments, the initial concentration of MTZ was chosen to be only 10 μg L−1 in order to mimic “real conditions”, while the catalyst dose was in the first case chosen to be the same as the in lab scale experiments and in the second case was increased to twice the initial amount, since according to similar studies, the heterogeneous photocatalysis was applied using a CPC pilot plant [47], and the optimum catalyst concentration was found to be 200 mg L−1. At the end of the 4-h photocatalytic processes, 85% and 89% of the antibiotic initial concentration was removed, respectively. Moreover, in both experiments, MTZ’s removal followed a pseudo-first order kinetic model according to Equation (1), such as in the lab scale experiments (Figure 4a). As can be observed, the increased catalyst concentration resulted in higher removal efficiency (Table 3), with the removal kinetic constant increasing by 13.2%.
Only one TP, which was identified as the aforementioned TP2 of pathway B, was found to be pre-existing in both lab scale experiments, possibly due to the presence of MTZ in the effluent before spiking. However, after 180 min of irradiation, it was completely removed in both cases.
The absence of pathway A TPs in the pilot scale experiments could be attributed to the presence of dissolved organic matter (DOM) in the HWW, which through the attenuation of solar light acts as a UV filter [48], thus not allowing the rearrangement of MTZ to TP1. As a result, at the pilot scale experiments where the solar radiation is much less intense than that of the lab scale experiment, MTZ is possibly degraded photocatalitically through pathway B (major pathway in this case). Finally, the Microtox results demonstrated that the toxicity decreased by the end of the photocatalytic processes, since the % bioluminescence inhibition value was reduced from 13.51% (0 min) to 1.51% (240 min).

3. Materials and Methods

3.1. Materials, Reagents and Solvents

g-C3N4 (crystal size = 10.8 nm, Median particle diameter = 220 nm, Average pore diameter = 13.1 nm, SBET = 10.0 m2g−1, VTOT = 0.035 cm3g−1 and Ebg = 2.51 eV) was synthesized through thermal polycondensation of melamine, as previously reported [27]. The detailed characterization of the material is also included in our previous publication [27]. MTZ of analytical purity, Disodium Ethylenediaminetetraacetate (Na2EDTA) (≥97%), Acetic Acid (≥99.8), Para-hydroxy-benzoic acid (99%), NaN3 ( ≥99.5%) and Triethanolamine (TEOA) (98%) were obtained from Sigma-Aldrich (St. Louis, MO, USA). Boric Acid (H3BO3), Bis (2-hydroxyethyl) amino-tris (hydroxymethyl) methane (Bis-Tris) and TBA were purchased from Supelco (Bellefonte, PA, USA), Merck (Darmstadt, Germany) and Carlo Erba (Barcelona, Spain), respectively. The bacterium Vibrio Fischeri in solid form (Acute Reagent) and the respective Reconstitution Solution used to activate it were supplied by Modern Water (New Castle, DE, USA). HPLC grade solvents (Water and Methanol (MeOH)) were obtained from Merck (Darmstadt, Germany). Solvents of LC-MS purity (Water, MeOH and Formic acid (FA)) were purchased from Fluka (Buchs, Switzerland). The lab scale solutions were prepared with ultra-pure water that was supplied by an Evoqua water purification system (Pittsburgh, PA, USA) while secondary treated real HWW that was used as matrix for the pilot scale experiments was provided from the University Hospital of Ioannina WWTP. Oasis HLB solid phase extraction cartridges (60 mg/3 mL and 200 mg/6 mL) were obtained from Waters Corporation (Milford, MA, USA).

3.2. Lab and Pilot Scale Photocatalytic Experiments

The lab scale photocatalytic experiments were carried out using a SUNTEST XLS+ solar simulator (Atlas, Linsengericht, Germany). The apparatus was supplied with a Xe lamp (2.2 kW) and special UV cut-off filters (wavelengths < 290 nm). Throughout the process, the intensity of the simulated solar radiation was kept at 500 W m−2. Inside the apparatus was installed a double-walled pyrex glass Duran reactor, which was maintained at ambient temperature through constant water circulation and within it was loaded an aqueous solution of MTZ (200 mL, 10 mg L−1). Afterwards, 20 mg (100 mg L−1) of solid, bulk g-C3N4 were added and the suspension was left to stir constantly in total darkness for 30 min in order to reach the adsorption-desorption equilibrium of the antibiotic on the photocatalyst’s surface. During the experiment (6 h), samples of the reactor’s content were collected at specific time intervals (0, 15, 30, 45, 60, 90, 120, 180, 240, 300 and 360 min) using a plastic syringe. Each sample was filtered through a PTFE syringe filter (pore size = 0.22 μm) and was stored in a 12 mL glass vial. The process was repeated three times and showed good repeatability, expressed as % relative standard deviation (%RSD: 1.02–3.29%). The scavenging experiments followed the exact experimental set up, with the only difference that a scavenger was also added inside the solution at a molar ratio of scavenger to MTZ = 1000:1.
The pilot scale photocatalytic experiments were carried out utilizing a compound parabolic collector (CPC) pilot plant reactor, which was installed at the facilities of the University Hospital WWTP of Ioannina located in Northwestern Greece and consisted of a 300 L reservoir-equilibration tank (equipped a mechanical stirrer and an air blower) and a PCP consisting of an aluminum surface (12 m2), on top of which 24 borosilicate glass tubes (55 mm × 1.5 m, wall thickness 1.8 mm, total volume 85 L) were placed. The reactor’s tube module was connected to a recirculation tank and a centrifugal pump to achieve continuous flow and recirculation of the effluent (Scheme S1).
At the beginning of the experiment, HWW effluents were transferred to the reservoir-equilibration tank, spiked with 10 μg L−1 of MTZ. Afterwards, under continuous stirring and aeration, an amount of g-C3N4 (100 mg L−1 or 200 mg L−1) was added and a radiation resistant textile was used to cover the solar collector to maintain dark conditions. For 1 h, the contents of the tank were continuously recirculated within the pilot plant to achieve homogenization of the photocatalyst. Then, a sample of the contents was collected, and the textile was removed, exposing the solar collector to direct sunlight. In total, 7 samples (500 mL) were collected at specified time intervals during the 4 h experiment (0, 30, 60, 90, 120, 180 and 240 min). Each of them was vacuum filtered with an HVLP type filter (pore diameter = 0.45 μm) and stored in a plastic bottle until extraction. The experiments were carried out under sunny weather conditions.

3.3. Extraction of Lab and Pilot Scale Samples

Samples collected throughout the lab scale experiment were extracted to preconcentrate the TPs formed during the antibiotic’s removal. Extraction was performed using a Visiprep-DL 12-port vacuum extraction manifold (Bellefonte, PA, USA) and followed three simple steps: i) conditioning of the HLB columns (60 mg/3 mL) with 3 mL of MeOH (HPLC grade) and 3 mL of Water (HPLC grade), ii) sample loading (2 mL) at a flow rate of 1 mL min−1 followed by cartridge drying under a vacuum (15 min) and iii) elution of the analytes with 2 × 2.5 mL of MeOH (HPLC grade). The extracts then were dried under a stream of N2 and reconstituted with 500 μL of a mixture of water (0.1 FA % v/v): MeOH (0.1 FA % v/v) (80:20).
In a similar way, the pilot scale experiment’s samples were extracted based on previous methodology [49]. First, the pH of each sample was adjusted to 7, followed by the addition of an appropriate amount of an aqueous solution of 5% Na2EDTA (final concentration 01.%). Using the previously mentioned apparatus, the Oasis HLB cartridges (200 mg/ 6mL) were conditioned with 5 mL of MeOH (LC-MS grade) and 5 mL Water (LC-MS grade). Then, 100 mL of sample were loaded and percolated at a flow rate of 5 mL min−1. The cartridges were then washed with 5 mL water (LC-MS grade) and dried under a vacuum for 15 min. The analytes were eluted with 2 × 5 mL of MeOH (LC-MS grade) at a flow rate of 1 mL min−1, and finally, the extracts were dried under a stream of N2 and reconstituted in a 500 μL mixture of water (0.1 FA % v/v): MeOH (0.1 FA % v/v) (80:20).

3.4. Analytical Methods

The residual concentration of MTZ during the lab scale experiments was determined using a Shimadzu (Kyoto, Japan) high performance liquid chromatography (HPLC) system equipped with a photo diode array detector (SPD-M40) and a Discovery HS C18 column (25 mm × 4.6 mm, 5 μm particle size). Isocratic separation was performed using a mixture of MeOH and ultrapure water with 5% v/v acetic acid in a ratio of 30:70 as the mobile phase. The flow rate, column oven and injection volume were set at 1 mL min−1, 30 °C and 20 μL, respectively.
The concentrations of the anions formed during the lab scale experiment (NO2 and NO3) were determined utilizing a Shimadzu ion chromatography system (Kyoto, Japan) equipped with a conductivity detector (CDD-6A) and a Shim-pack IC-A3 column (15 mm × 4.6 mm, 5 μm particle size). An aqueous mixture of boric acid (50 mmol L−1), para-hydroxy-benzoic acid (8 mmol L−1) and Bis-Tris (3.2 mmol L−1) was used as the mobile phase, while the flow rate, column oven and injection volume were set at 1.1 mL min−1, 40 °C and 100 μL, respectively.
The TPs formed during both pilot and lab scale processes were detected and identified using an ultra-high-performance liquid chromatography (UHPLC) Accela LC system coupled with a hybrid LTQ-FT Orbitrap XL 2.5.5 SP1 mass spectrometer, which was equipped with an electrospray ionization source (ESI) (Thermo Fisher Scientific, Inc., GmbH, Bremen, Germany). More specifically, the separation of MTZ and its TPs was performed using a reversed phase Hypersil Gold C18 (Thermo Fisher Scientific) analytical column (100 × 2.1 mm, 1.9 µm). Their elution was carried out utilizing a gradient program (Table S2) with a mixture of water (0.1 FA % v/v) (eluent A) and MeOH (0.1 FA % v/v) (eluent B) used as the mobile phase, while column temperature, flow rate and injection volume were set at 27 °C, 400 μL min−1 and 20 μL, respectively. Identification of the aforementioned compounds was performed in a positive ionization mode (PI), using full scan (mass range 90–600 Da), with the mass resolving power set at 60,000 FWHM. Additionally, based on the collision-induced dissociation (CID), was carried out a data-dependent acquisition (full MS/dd-MS2). Further operational parameters of the LTQ-Orbitrap instrumentation are included in Table S3. Experiments (n = 3) conducted for TPs identification showed good repeatability (%RSD: 5.32–15.45%).

3.5. In Vitro and In Silico Assessment of Ecotoxicity

Ecotoxicity changes during the lab experiment as well as the start and the end points of the pilot scale experiments were monitored in vitro by the Microtox technique, which was applied using the bacterium Vibrio Fischeri and the Azur Environmental m500 Analyzer (Carlsbad, CA, USA). Initially, the bacteria were frozen (−20 °C) in a glass vial and had to be activated by adding an amount of reconstitution solution. Afterwards, their bioluminescence was measured before and after their exposure to the sample (5 min) according to the 89.1% Basic Test protocol recommended by the provider, and the resulting % bioluminescence inhibition effect was calculated by the MicrotoxOmni v1.18 software.
The ecotoxicity of MTZ and its TPs as well as other toxicological factors were evaluated using in silico tools, namely ECOSAR v2.0 and the T.E.S.T. v5.1.2., which were developed by the US Environmental Protection Agency (US E.P.A.) and use Quantitative structure–activity relationship (QSAR) models to make various predictions. More specifically, ECOSAR predicts the acute and chronic toxicity of compounds in three trophic levels: fish, daphnid and green algae, while T.E.S.T. estimates values for mutagenicity, developmental toxicity and bioconcentration factors. In the case of T.E.S.T., the Consensus Method was applied, as according to the user’s guide, it provides the most accurate results.

4. Conclusions

In summary, the results of the present study demonstrated that the removal of MTZ can be achieved at high rates (>80%) during the simulation of natural solar irradiation in the presence of g-C3N4, both in lab and pilot scale conditions, while mineralization studies evidenced that such a process could potentially lead to the mineralization of MTZ during extended periods of solar irradiation. Photolysis competes with photocatalysis when using higher intensity simulated solar light and distilled water as a substrate matrix, while photocatalysis predominates when natural solar light and real secondary wastewater were used. A total of eight different TPs were identified, and by using in silico tools, were predicted to be less toxic to aquatic organisms than MTZ. Moreover, their mutagenic and bioaccumulation potential was found in most cases to be lower than the parent compound’s. The in vitro toxicity assessment provided further insight regarding the environmental impact of the heterogeneous photocatalysis with g-C3N4 and proved that with a few hours of application, this process can significantly decrease the toxicity of real HWW.
In conclusion, heterogeneous photocatalysis with g-C3N4 could be described as a viable application for wastewater remediation. However, for real-scale applications, further studies must be conducted focusing on increasing the catalyst’s photocatalytic performance and reusability, and catalyst separation, as well as finding the optimal catalytic conditions.

Supplementary Materials

The following supporting information can be downloaded at: https://0-www-mdpi-com.brum.beds.ac.uk/article/10.3390/catal13020254/s1, Figure S1: Total ion current (TIC) and extracted pseudo-molecular ion [M+H]+ (EIC) chromatograms of MTZ and its TPs (lab scale conditions); Figure S2: Mass spectra of MTZ and its TPs formed under lab scale conditions; Table S1: High resolution mass data of MTZ and its TPs; Table S2: Gradient elution program for the separation MTZ and its TPs; Table S3: LTQ-Orbitrap instrumentation operational parameters; Scheme S1: Schematic diagram of the compound parabolic collector (CPC) pilot plant reactor.

Author Contributions

C.L., Investigation, Formal analysis, Visualization, Writing—Original draft and Editing. S.S., Investigation and Formal analysis. I.K., Conceptualization, Project administration, Methodology, Supervision, Resources, Writing—Original draft preparation and Writing—Review and editing. All authors have read and agreed to the published version of the manuscript.

Funding

This research received no external funding.

Data Availability Statement

Data are included in the manuscript.

Acknowledgments

The authors would like to thank the Unit of Environmental, Organic and Biochemical high-resolution analysis–Orbitrap-LC–MS of the University of Ioannina for providing access to the facilities.

Conflicts of Interest

The authors declare that they have no known competing financial interests or personal relationships that could have appeared to influence the work reported in this paper.

References

  1. Antonopoulou, M.; Kosma, C.; Albanis, T.; Konstantinou, I. An Overview of Homogeneous and Heterogeneous Photocatalysis Applications for the Removal of Pharmaceutical Compounds from Real or Synthetic Hospital Wastewaters under Lab or Pilot Scale. Sci. Total Environ. 2021, 765, 144163. [Google Scholar] [CrossRef]
  2. Quesada, H.B.; Baptista, A.T.A.; Cusioli, L.F.; Seibert, D.; de Oliveira Bezerra, C.; Bergamasco, R. Surface Water Pollution by Pharmaceuticals and an Alternative of Removal by Low-Cost Adsorbents: A Review. Chemosphere 2019, 222, 766–780. [Google Scholar] [CrossRef]
  3. Chander, V.; Sharma, B.; Negi, V.; Aswal, R.S.; Singh, P.; Singh, R.; Dobhal, R. Pharmaceutical Compounds in Drinking Water. J. Xenobiotics 2016, 6, 5774. [Google Scholar] [CrossRef]
  4. Fitzgerald, K.T. Chapter 61—Metronidazole. In Small Animal Toxicology, 3rd ed.; Peterson, M.E., Talcott, P.A., Eds.; W.B. Saunders: Philadelphia, PA, USA, 2013; pp. 653–657. ISBN 9781455707171. [Google Scholar]
  5. Bendesky, A.; Menéndez, D.; Ostrosky-Wegman, P. Is Metronidazole Carcinogenic? Mutat. Res.-Rev. Mutat. Res. 2002, 511, 133–144. [Google Scholar] [CrossRef]
  6. Rodriguez-Mozaz, S.; Vaz-Moreira, I.; Varela Della Giustina, S.; Llorca, M.; Barceló, D.; Schubert, S.; Berendonk, T.U.; Michael-Kordatou, I.; Fatta-Kassinos, D.; Martinez, J.L.; et al. Antibiotic Residues in Final Effluents of European Wastewater Treatment Plants and Their Impact on the Aquatic Environment. Environ. Int. 2020, 140, 105733. [Google Scholar] [CrossRef]
  7. Fatta, D.; Achilleos, A.; Nikolaou, A.; Meriç, S. Analytical Methods for Tracing Pharmaceutical Residues in Water and Wastewater. TrAC-Trends Anal. Chem. 2007, 26, 515–533. [Google Scholar] [CrossRef]
  8. Malakootian, M.; Olama, N.; Malakootian, M.; Nasiri, A. Photocatalytic Degradation of Metronidazole from Aquatic Solution by TiO2-Doped Fe3+ Nano-Photocatalyst. Int. J. Environ. Sci. Technol. 2019, 16, 4275–4284. [Google Scholar] [CrossRef]
  9. Ré, J.L.; De Méo, M.P.; Laget, M.; Guiraud, H.; Castegnaro, M.; Vanelle, P.; Duménil, G. Evaluation of the Genotoxic Activity of Metronidazole and Dimetridazole in Human Lymphocytes by the Comet Assay. Mutat. Res.-Fundam. Mol. Mech. Mutagen. 1997, 375, 147–155. [Google Scholar] [CrossRef]
  10. World Health Organization. IARC Monographs on the Identification of Carcinogenic Hazards to Humans. Available online: https://monographs.iarc.who.int/list-of-classifications (accessed on 4 January 2023).
  11. NTP (National Toxicology Program). Report on Carcinogens, Fifteenth Edition. Available online: https://ntp.niehs.nih.gov/go/roc152021 (accessed on 4 January 2023).
  12. Velempini, T.; Prabakaran, E.; Pillay, K. Recent Developments in the Use of Metal Oxides for Photocatalytic Degradation of Pharmaceutical Pollutants in Water—A Review. Mater. Today Chem. 2021, 19, 100380. [Google Scholar] [CrossRef]
  13. Bisognin, R.P.; Wolff, D.B.; Carissimi, E.; Prestes, O.D.; Zanella, R. Occurrence and Fate of Pharmaceuticals in Effluent and Sludge from a Wastewater Treatment Plant in Brazil. Environ. Technol. 2021, 42, 2292–2303. [Google Scholar] [CrossRef]
  14. Konstantinou, I.K.; Albanis, T.A. Photocatalytic Transformation of Pesticides in Aqueous Titanium Dioxide Suspensions Using Artificial and Solar Light: Intermediates and Degradation Pathways. Appl. Catal. B Environ. 2003, 42, 319–335. [Google Scholar] [CrossRef]
  15. Konstantinou, I.K.; Albanis, T.A. TiO2-Assisted Photocatalytic Degradation of Azo Dyes in Aqueous Solution: Kinetic and Mechanistic Investigations: A Review. Appl. Catal. B Environ. 2004, 49, 1–14. [Google Scholar] [CrossRef]
  16. Liu, J.; Guo, S.; Wu, H.; Zhang, X.; Li, J.; Zhou, K. Synergetic Effects of Bi5+ and Oxygen Vacancies in Bismuth(V)-Rich Bi4O7 Nanosheets for Enhanced Near-Infrared Light Driven Photocatalysis. J. Mater. Sci. Technol. 2021, 85, 1–10. [Google Scholar] [CrossRef]
  17. Djurišić, A.B.; He, Y.; Ng, A.M.C. Visible-Light Photocatalysts: Prospects and Challenges. APL Mater. 2020, 8, 030903. [Google Scholar] [CrossRef] [Green Version]
  18. Tran, M.L.; Fu, C.C.; Juang, R.S. Removal of Metronidazole by TiO2 and ZnO Photocatalysis: A Comprehensive Comparison of Process Optimization and Transformation Products. Environ. Sci. Pollut. Res. 2018, 25, 28285–28295. [Google Scholar] [CrossRef]
  19. Kong, L.; Wang, J.; Mu, X.; Li, R.; Li, X.; Fan, X.; Song, P.; Ma, F.; Sun, M. Porous Size Dependent g-C3N4 for Efficient Photocatalysts: Regulation Synthesizes and Physical Mechanism. Mater. Today Energy 2019, 13, 11–21. [Google Scholar] [CrossRef]
  20. Ong, W.J.; Tan, L.L.; Ng, Y.H.; Yong, S.T.; Chai, S.P. Graphitic Carbon Nitride (g-C3N4)-Based Photocatalysts for Artificial Photosynthesis and Environmental Remediation: Are We a Step Closer to Achieving Sustainability? Chem. Rev. 2016, 116, 7159–7329. [Google Scholar] [CrossRef]
  21. Bairamis, F.; Konstantinou, I.; Petrakis, D.; Vaimakis, T. Enhanced Performance of Electrospun Nanofibrous TiO2/g-C3N4 Photocatalyst in Photocatalytic Degradation of Methylene Blue. Catalysts 2019, 9, 880. [Google Scholar] [CrossRef] [Green Version]
  22. Wen, J.; Xie, J.; Chen, X.; Li, X. A Review on g-C3N4-Based Photocatalysts. Appl. Surf. Sci. 2017, 391, 72–123. [Google Scholar] [CrossRef]
  23. Liu, J.; Wei, X.; Sun, W.; Guan, X.; Zheng, X.; Li, J. Fabrication of S-Scheme CdS-g-C3N4-Graphene Aerogel Heterojunction for Enhanced Visible Light Driven Photocatalysis. Environ. Res. 2021, 197, 111136. [Google Scholar] [CrossRef]
  24. Liu, D.; Li, C.; Zhao, C.; Zhao, Q.; Niu, T.; Pan, L.; Xu, P.; Zhang, F.; Wu, W.; Ni, T. Facile Synthesis of Three-Dimensional Hollow Porous Carbon Doped Polymeric Carbon Nitride with Highly Efficient Photocatalytic Performance. Chem. Eng. J. 2022, 438, 135623. [Google Scholar] [CrossRef]
  25. Liu, D.; Li, C.; Ge, J.; Zhao, C.; Zhao, Q.; Zhang, F.; Ni, T.; Wu, W. 3D Interconnected g-C3N4 Hybridized with 2D Ti3C2 MXene Nanosheets for Enhancing Visible Light Photocatalytic Hydrogen Evolution and Dye Contaminant Elimination. Appl. Surf. Sci. 2022, 579, 152180. [Google Scholar] [CrossRef]
  26. Leelavathi, H.; Muralidharan, R.; Abirami, N.; Tamizharasan, S.; Sankeetha, S.; Kumarasamy, A.; Arulmozhi, R. Construction of Step-Scheme g-C3N4/Co/ZnO Heterojunction Photocatalyst for Aerobic Photocatalytic Degradation of Synthetic Wastewater. Colloids Surf. A Physicochem. Eng. Asp. 2023, 656, 130449. [Google Scholar] [CrossRef]
  27. Bairamis, F.; Konstantinou, I. Wo3 Fibers/g-C3N4 Z-Scheme Heterostructure Photocatalysts for Simultaneous Oxidation/Reduction of Phenol/Cr (Vi) in Aquatic Media. Catalysts 2021, 11, 792. [Google Scholar] [CrossRef]
  28. Liu, D.; Li, C.; Ni, T.; Gao, R.; Ge, J.; Zhang, F.; Wu, W.; Li, J.; Zhao, Q. 3D Interconnected Porous g-C3N4 Hybridized with Fe2O3 Quantum Dots for Enhanced Photo-Fenton Performance. Appl. Surf. Sci. 2021, 555, 149677. [Google Scholar] [CrossRef]
  29. Pei, X.; An, W.; Zhao, H.; He, H.; Fu, Y.; Shen, X. Enhancing Visible-Light Degradation Performance of g-C3N4 on Organic Pollutants by Constructing Heterojunctions via Combining Tubular g-C3N4 with Bi2O3 Nanosheets. J. Alloys Compd. 2023, 934, 167928. [Google Scholar] [CrossRef]
  30. John, A.; Rajan, M.S.; Thomas, J. Carbon Nitride-Based Photocatalysts for the Mitigation of Water Pollution Engendered by Pharmaceutical Compounds. Environ. Sci. Pollut. Res. 2021, 28, 24992–25013. [Google Scholar] [CrossRef]
  31. Kane, A.; Chafiq, L.; Dalhatou, S.; Bonnet, P.; Nasr, M.; Gaillard, N.; Dikdim, J.M.D.; Monier, G.; Assadie, A.A.; Zeghioud, H. g-C3N4/TiO2 S-Scheme Heterojunction Photocatalyst with Enhanced Photocatalytic Carbamazepine Degradation and Mineralization. J. Photochem. Photobiol. A Chem. 2022, 430, 113971. [Google Scholar] [CrossRef]
  32. Du, X.; Bai, X.; Xu, L.; Yang, L.; Jin, P. Visible-Light Activation of Persulfate by TiO2/g-C3N4 Photocatalyst toward Efficient Degradation of Micropollutants. Chem. Eng. J. 2020, 384, 123245. [Google Scholar] [CrossRef]
  33. John, P.; Johari, K.; Gnanasundaram, N.; Appusamy, A.; Thanabalan, M. Enhanced Photocatalytic Performance of Visible Light Driven TiO2/g-C3N4 for Degradation of Diclofenac in Aqueous Solution. Environ. Technol. Innov. 2021, 22, 101412. [Google Scholar] [CrossRef]
  34. You, Q.; Zhang, Q.; Gu, M.; Du, R.; Chen, P.; Huang, J.; Wang, Y.; Deng, S.; Yu, G. Self-Assembled Graphitic Carbon Nitride Regulated by Carbon Quantum Dots with Optimized Electronic Band Structure for Enhanced Photocatalytic Degradation of Diclofenac. Chem. Eng. J. 2022, 431, 133927. [Google Scholar] [CrossRef]
  35. Van Thuan, D.; Nguyen, T.B.H.; Pham, T.H.; Kim, J.; Hien Chu, T.T.; Nguyen, M.V.; Nguyen, K.D.; Al-onazi, W.A.; Elshikh, M.S. Photodegradation of Ciprofloxacin Antibiotic in Water by Using ZnO-Doped g-C3N4 Photocatalyst. Chemosphere 2022, 308, 136408. [Google Scholar] [CrossRef] [PubMed]
  36. Liu, J.; Zhang, X.; Zhong, Q.; Li, J.; Wu, H.; Zhang, B.; Jin, L.; Tao, H.B.; Liu, B. Electrostatic Self-Assembly of a AgI/Bi2Ga4O9 p-n Junction Photocatalyst for Boosting Superoxide Radical Generation. J. Mater. Chem. A 2020, 8, 4083–4090. [Google Scholar] [CrossRef]
  37. Boxi, S.S.; Paria, S. Effect of Silver Doping on TiO2, CdS, and ZnS Nanoparticles for the Photocatalytic Degradation of Metronidazole under Visible Light. RSC Adv. 2014, 4, 37752–37760. [Google Scholar] [CrossRef]
  38. Farzadkia, M.; Esrafili, A.; Baghapour, M.A.; Shahamat, Y.D.; Okhovat, N. Degradation of Metronidazole in Aqueous Solution by Nano-ZnO/UV Photocatalytic Process. Desalin. Water Treat. 2014, 52, 4947–4952. [Google Scholar] [CrossRef]
  39. Lim, J.; Kim, H.; Park, J.; Moon, G.H.; Vequizo, J.J.M.; Yamakata, A.; Lee, J.; Choi, W. How g-C3N4 Works and Is Different from TiO2 as an Environmental Photocatalyst: Mechanistic View. Environ. Sci. Technol. 2020, 54, 497–506. [Google Scholar] [CrossRef] [PubMed]
  40. Wang, C.; Huang, R.; Sun, R.; Yang, J.; Sillanpää, M. A Review on Persulfates Activation by Functional Biochar for Organic Contaminants Removal: Synthesis, Characterizations, Radical Determination, and Mechanism. J. Environ. Chem. Eng. 2021, 9, 106267. [Google Scholar] [CrossRef]
  41. Tong, L.; Pérez, S.; Gonçalves, C.; Alpendurada, F.; Wang, Y.; Barceló, D. Kinetic and Mechanistic Studies of the Photolysis of Metronidazole in Simulated Aqueous Environmental Matrices Using a Mass Spectrometric Approach. Anal. Bioanal. Chem. 2011, 399, 421–428. [Google Scholar] [CrossRef]
  42. Wilkins, B.J.; Moore, D.E. Common Products from Gamma-Radiolysis and Ultraviolet Photolysis of Metronidazole. Int. J. Radiat. Applic. Instrum. Part C Radiat. Phys. Chem. 1990, 36, 547–550. [Google Scholar] [CrossRef]
  43. Felis, E.; Buta-Hubeny, M.; Zieliński, W.; Hubeny, J.; Harnisz, M.; Bajkacz, S.; Korzeniewska, E. Solar-Light Driven Photodegradation of Antimicrobials, Their Transformation by-Products and Antibiotic Resistance Determinants in Treated Wastewater. Sci. Total Environ. 2022, 836, 155447. [Google Scholar] [CrossRef]
  44. Piesiak, A.; Schuchmann, M.N.; Zegota, H.; von Sonntag, C. β-Hydroxyethylperoxyl Radicals: A Study of the y-Radiolysis and Pulse Radiolysis of Ethylene in Oxygenated Aqueous Solutions. Zeitschrift fur Naturforsch.-Sect. B J. Chem. Sci. 1984, 39, 1262–1267. [Google Scholar] [CrossRef]
  45. Pang, X.; Chen, C.; Ji, H.; Che, Y.; Ma, W.; Zhao, J. Unraveling the Photocatalytic Mechanisms on TiO2 Surfaces Using the Oxygen-18 Isotopic Label Technique. Molecules 2014, 19, 16291–16311. [Google Scholar] [CrossRef] [PubMed] [Green Version]
  46. United Nations. Globbaly Harmonized System of Classification and Labeling of Chemicals, 9th ed.; United Nations: New York, NY, USA; Geneva, Switzerland, 2021; ISBN 9789211172522. [Google Scholar]
  47. Sousa, M.A.; Gonçalves, C.; Vilar, V.J.P.; Boaventura, R.A.R.; Alpendurada, M.F. Suspended TiO2-Assisted Photocatalytic Degradation of Emerging Contaminants in a Municipal WWTP Effluent Using a Solar Pilot Plant with CPCs. Chem. Eng. J. 2012, 198–199, 301–309. [Google Scholar] [CrossRef]
  48. Reche, I.; Pace, M.L.; Cole, J.J. Modeled Effects of Dissolved Organic Carbon and Solar Spectra on Photobleaching in Lake Ecosystems. Ecosystems 2000, 3, 419–432. [Google Scholar] [CrossRef]
  49. Papageorgiou, M.; Kosma, C.; Lambropoulou, D. Seasonal Occurrence, Removal, Mass Loading and Environmental Risk Assessment of 55 Pharmaceuticals and Personal Care Products in a Municipal Wastewater Treatment Plant in Central Greece. Sci. Total Environ. 2016, 543, 547–569. [Google Scholar] [CrossRef]
Figure 1. (a) Photocatalytic removal kinetics of MTZ (C0 = 10 mg L−1) with g-C3N4 (100 mg L−1) and evolution kinetics of the produced NO2 & NO3 under lab scale conditions. (b) Photolytic and photocatalytic (g-C3N4, 100 mg L−1) removal kinetics of MTZ (C0 = 10 mg L−1) in the presence of scavengers (Cscav:C0 = 1000:1).
Catalysts 13 00254 g001
Figure 2. Evolutionary profiles of (a) TP1 and (b) TP2-8.
Catalysts 13 00254 g002
Scheme 1. Proposed transformation pathways of MTZ under lab scale conditions.
Catalysts 13 00254 sch001
Figure 3. (a) % Bioluminescence inhibition of Vibrio Fischeri vs. irradiation time under lab-scale conditions and predicted values (in silico) for (b) mutagenicity, (c) developmental toxicity and (d) bioconcentration factor of MTZ and its identified TPs.
Catalysts 13 00254 g003
Figure 4. (a) Photocatalytic removal kinetics of MTZ (C0 = 10 μg L−1) with g-C3N4 (100 & 200 mg L−1) under pilot scale conditions and (b) evolutionary profiles of the identified TP2 per photocatalyst dose.
Catalysts 13 00254 g004
Table 1. Removal kinetic constants (k), correlation coefficients (R2) and degree of reduction of the removal kinetic constants (%Δk).
k (min−1)R2Δk%
No Scavenger0.006180.9936-
TBA0.006150.99820.48%
NaN30.006140.99610.65%
Photolysis0.006180.99400%
Table 2. Ιn silico predicted values of acute and chronic toxicity of MTZ and its identified TPs.
Compound (Chemical Category)Acute Toxicity (LC50/EC50)Chronic Toxicity (ChV)
Fish LC50
(mg L−1)
Daphnid LC50
(mg L−1)
Green Algae EC50
(mg L−1)
Fish ChV (mg L−1)Daphnid ChV
(mg L−1)
Green Algae ChV
(mg L−1)
MTZ (PY/DZ)878.3179.76.920.953.082.70
TP1 (AM)801612001344.229.96696.262.38
TP2a (PY/DZ)1627271.19.671.324.643.69
TP2b (PY/DZ)3611440.714.011.897.545.18
TP3a (AM)1329620618524.644.89109885.82
TP3b (AM)670021190501.904152.44554209.3
TP4 (PY/DZ)20825127731.484.1421.8110.85
TP5a (AM)57560832562686237.85252538.3
TP5b (IM)158.4882.817.58718.2978.20.34
TP6 (AM)1148148470.366.58123.219.61
ΤΡ7 (AΜ)23903313123.511.16231.728.01
ΤΡ8 (AΜ)4221175097119595.652863130.9
PY/DZ: Pyrroles/Diazoles
AM: Amides
IM: Imides
Very ToxicToxicHarmfulNot Harmful
Table 3. Removal kinetic constants (k), half-life values (t1/2) and correlation coefficients (R2) per catalyst dose.
Catalyst Dosek (min−1)t1/2 (min)R2
100 mg L−10.0082783.510.9888
200 mg L−10.0094273.740.9960
Disclaimer/Publisher’s Note: The statements, opinions and data contained in all publications are solely those of the individual author(s) and contributor(s) and not of MDPI and/or the editor(s). MDPI and/or the editor(s) disclaim responsibility for any injury to people or property resulting from any ideas, methods, instructions or products referred to in the content.

