
Transient Absorption Spectrum Analysis for Photothermal Catalysis Perovskite Materials
1
School of Material Science and Engineering, Shanghai Institute of Technology, Shanghai 201418, China
2
School of Chemical and Environment Engineering, Shanghai Institute of Technology, Shanghai 201418, China
*
Authors to whom correspondence should be addressed.
Catalysts 2023, 13(3), 452; https://0-doi-org.brum.beds.ac.uk/10.3390/catal13030452
Submission received: 5 January 2023
/
Revised: 7 February 2023
/
Accepted: 20 February 2023
/
Published: 21 February 2023
(This article belongs to the Special Issue Catalysis for CO2 Conversion)
Abstract
:To gain insight into photocatalytic behavior, transient absorption spectroscopy (TAS) was used to study LaCoxMn1−xO3, LaMnxNi1−xO3 and LaNixCo1−xO3 (x = 0, 0.2, 0.4, 0.6, 0.8 and 1.0) on a microsecond time scale. The results show that the electron lifetime is key to determining the photocatalytic reduction of CO2. This is the first time that the photogenerated electron lifetime in perovskite has been proposed to express the performance of the photocatalytic reduction of CO2 with H2O into CH4. In all cases, the decay curve can be well explained by two consecutive first-order kinetics, indicating that the electron exists within two major populations: one with a short lifetime and the other one with a long lifetime. The long-lived electrons are the rate-limiting species for the photocatalytic reaction and are related to the activity of the photocatalytic reduction of CO2 with H2O to produce CH4. For different photocatalysts, we find that the longer the electron decay lifetime is, the stronger the electron de-trapping ability is, and the electrons perform more activity. In this paper, TAS can not only detect the micro-dynamics process of carriers, but it is also demonstrated to be an easy and effective method for screening the most active catalyst in various catalysts for the photocatalytic reduction of CO2 with H2O accurately and quickly.
1. Introduction
The excessive emission of CO2 leads to global warming, so achieving the sustainable recycling of CO2 has emerged as one of the significant technical challenges that humans face [1,2,3,4]. One of the most promising approaches is the photocatalytic reduction of CO2 and H2O into hydrocarbon fuels using sunlight as the sole energy input [5,6,7,8]. It is essential to explore and design new efficient photocatalysts that can possess photosynthesis functions such as chlorophyll in natural plants [9,10].
Perovskite shows excellent catalytic activity and a stable crystal structure with a general formula of ABO3. In general, the A site is occupied by a cation with a large radius to form an AO12 polyhedron, which stabilizes the perovskite structure, while the B site is usually occupied by transition metals and acts as the active center for the catalysts [11,12]. LaCoO3, LaMnO3 and LaNiO3 have been widely studied for photocatalytic, energy conversion, magnetism and sensing applications [13,14,15,16]. Self-doped SrTiO3 produced a high CH4 (0.25 mmol m−2 cata h−1) yield under visible light irradiation [17]. In our previous studies [18,19,20], LaCoxFe1−xO3, LaNixFe1−xO3 and LaNixCo1−xO3 (x = 0, 0.2, 0.4, 0.6, 0.8 and 1.0) were carefully studied for the photothermal reduction of CO2 and H2O into hydrocarbon fuels. The results showed that perovskite could successfully convert CO2 into CH4 and CH3OH, and doping could improve the catalytic efficiency. The double perovskite 3DOM-LaSrCoFeO6−δ catalysts were also investigated for the reduction of CO2 and efficiently produced CH4 (557.88 μmol·g−1) under the photothermal coupling condition. Photothermal catalysis can improve the catalytic performance. In photothermal catalysis, two main processes involve the photocatalytic reduction of CO2 and H2O to produce CH4. Using light energy to generate electron-hole pairs, and the hole promotes the splitting of H2O to yield H+, which in turn helps the CO2 to gain different electrons in CB to obtain different hydrocarbon products in the second step. H2O is the source of H+/H2. Catalysts with oxygen vacancies could spilt H2O into H2 under heating. Combining the two splitting reactions improved the conversion and selectivity of CO2 to CH4. The high yield and selectivity of CH4 due to the splitting of CO2 tend to form C, and the production of CH3OH because of the splitting of CO2 tends to form CO. In addition, the relatively high temperature in the thermochemical reaction is conducive to improving the mass transfer and reaction kinetics. A high temperature can provide more heat energy to the system, thus increasing the reactant molecules’ speed and kinetic energy and the probability of collisions between molecules, thus accelerating the reaction rate [21]. It can be concluded that perovskite can be a promising catalyst for artificial photosynthesis. However, it is difficult to understand the critical function mechanisms of these catalysts. Neither oxygen vacancies nor the band gap can be universally regarded as the catalyst design/selection principle to judge the photothermal catalysis performance of the developed catalysts. It is necessary to consider other characteristics of catalysts, which can be the screening principle for future material development.
The research showed that the photocatalytic reduction of CO2 involves three main steps, (1) the semiconductor absorbs energy to form electron-hole pairs; (2) these electrons and holes separate and migrate for the reduction of oxidation sites on the surface; (3) the electrons react with the surface-adsorbed CO2 and H+ to generate hydrocarbons [22,23,24]. All these kinetic steps can be the rate-controlling step. In recent years, effective charge separation and electron transfer have been considered as key steps for many different catalysis processes, especially for water splitting and the photocatalytic reduction of CO2. Therefore, it is essential to understand the whole life history of photogenerated charge carriers.
Transient absorption spectroscopy (TAS) is a valuable tool for studying the dynamics of photogenerated electrons and holes. The photocatalyst was excited by a short, strong pulse (pumped light) to create short-lived intermediate states such as excited states, free radicals, and free ions. These intermediate states may trigger chemical or physical interaction between species. Different excited states have specific, characteristic absorption behaviors, so transient changes in the excited state features can be directly observed [25]. At present, TAS is widely used to study the carrier dynamics of photocatalytic hydrolyses, such as TiO2, WO3, α-Fe2O3 and so on. The results showed for a very long lifetime that photo holes are a prerequisite for water oxidation, with the rate-limiting step for photochemical water oxidation being prolonged hole transfer in a solution (α-Fe2O3 (τ ≈ 3 s) and TiO2 (τ ≈ 30–300 ms) WO3 (τ ≈ ms-s)) [26,27,28,29,30]. However, the photocatalytic reduction of CO2 differs from the photolysis of H2O. The most wanted process is the reduction of photogenerated electrons with the substrate (H2O and CO2), so monitoring photoelectron dynamics helps us to understand the photoreduction of CO2 better.
In this study, we attempted to monitor the electron dynamics (charge carrier trapping, migration and transfer) and characterize the lifetime of photoelectrons in LaCoxMn1−xO3 (LCMO), LaMnxNi1−xO3 (LMNO) and LaNixCo1−xO3 (LNCO) with x = 0, 0.2, 0.4, 0.6, 0.8 and 1.0 using TAS. To further prove the reliability of the TAS results, the TAS results were compared with traditional photothermal catalysis measurements to determine whether or not the two methods showed consistent results. The results showed that the photoelectrons with a long lifetime are related to the catalytic efficiency of photocatalysts. Compared with traditional photothermal catalysis measurements, the advantage of the TAS method is that it can screen the most active catalyst accurately and quickly detect the carriers’ micro-dynamic process.
2. Results and Discussion
2.1. Basic Material Properties and Catalysis Performance
Three series of perovskites LCMO, LMNO and LNCO (x = 0, 0.2, 0.4, 0.6, 0.8 and 1.0) were prepared. All the crystal phases were confirmed by X-ray diffraction (XRD). Perovskite was the main phase without impurities (Figure S2). SEM characterized the morphology; all the catalysts are porous materials, which are suitable for CO2 adsorption and surface reactions (Figure S3). The surface area plays an essential factor in photocatalysis. Although doping can alter the specific surface area and porosity, the catalytic efficiency does not correspond to the specific surface area value (Table S1), which agrees with other research that states that a specific surface area is not the primary determinant for catalytic efficiency [31]. The photoresponse of catalysts was measured by UV-Vis absorption spectroscopy (Figure S4). All the catalysts show strong absorption in the wavelength range of 200–800 nm, indicating that nanoparticles respond to visible light strongly. The Tauc equation was used to fit Eg. It is obvious that B-doping can reduce the band gap (Figure S5). The CB was fitted by Mott–Schottky (Figure S6). The VB value can be calculated through the formula ECB = EVB − Eg. To better understand the chemical valence state, the surface morphology and the proportion of each valence state for the elements, XPS was used to analyze each sample. It was found that there are at least two oxidation states for each ion, and the valence states’ ratio changed with the doping ratio (Figure S7).
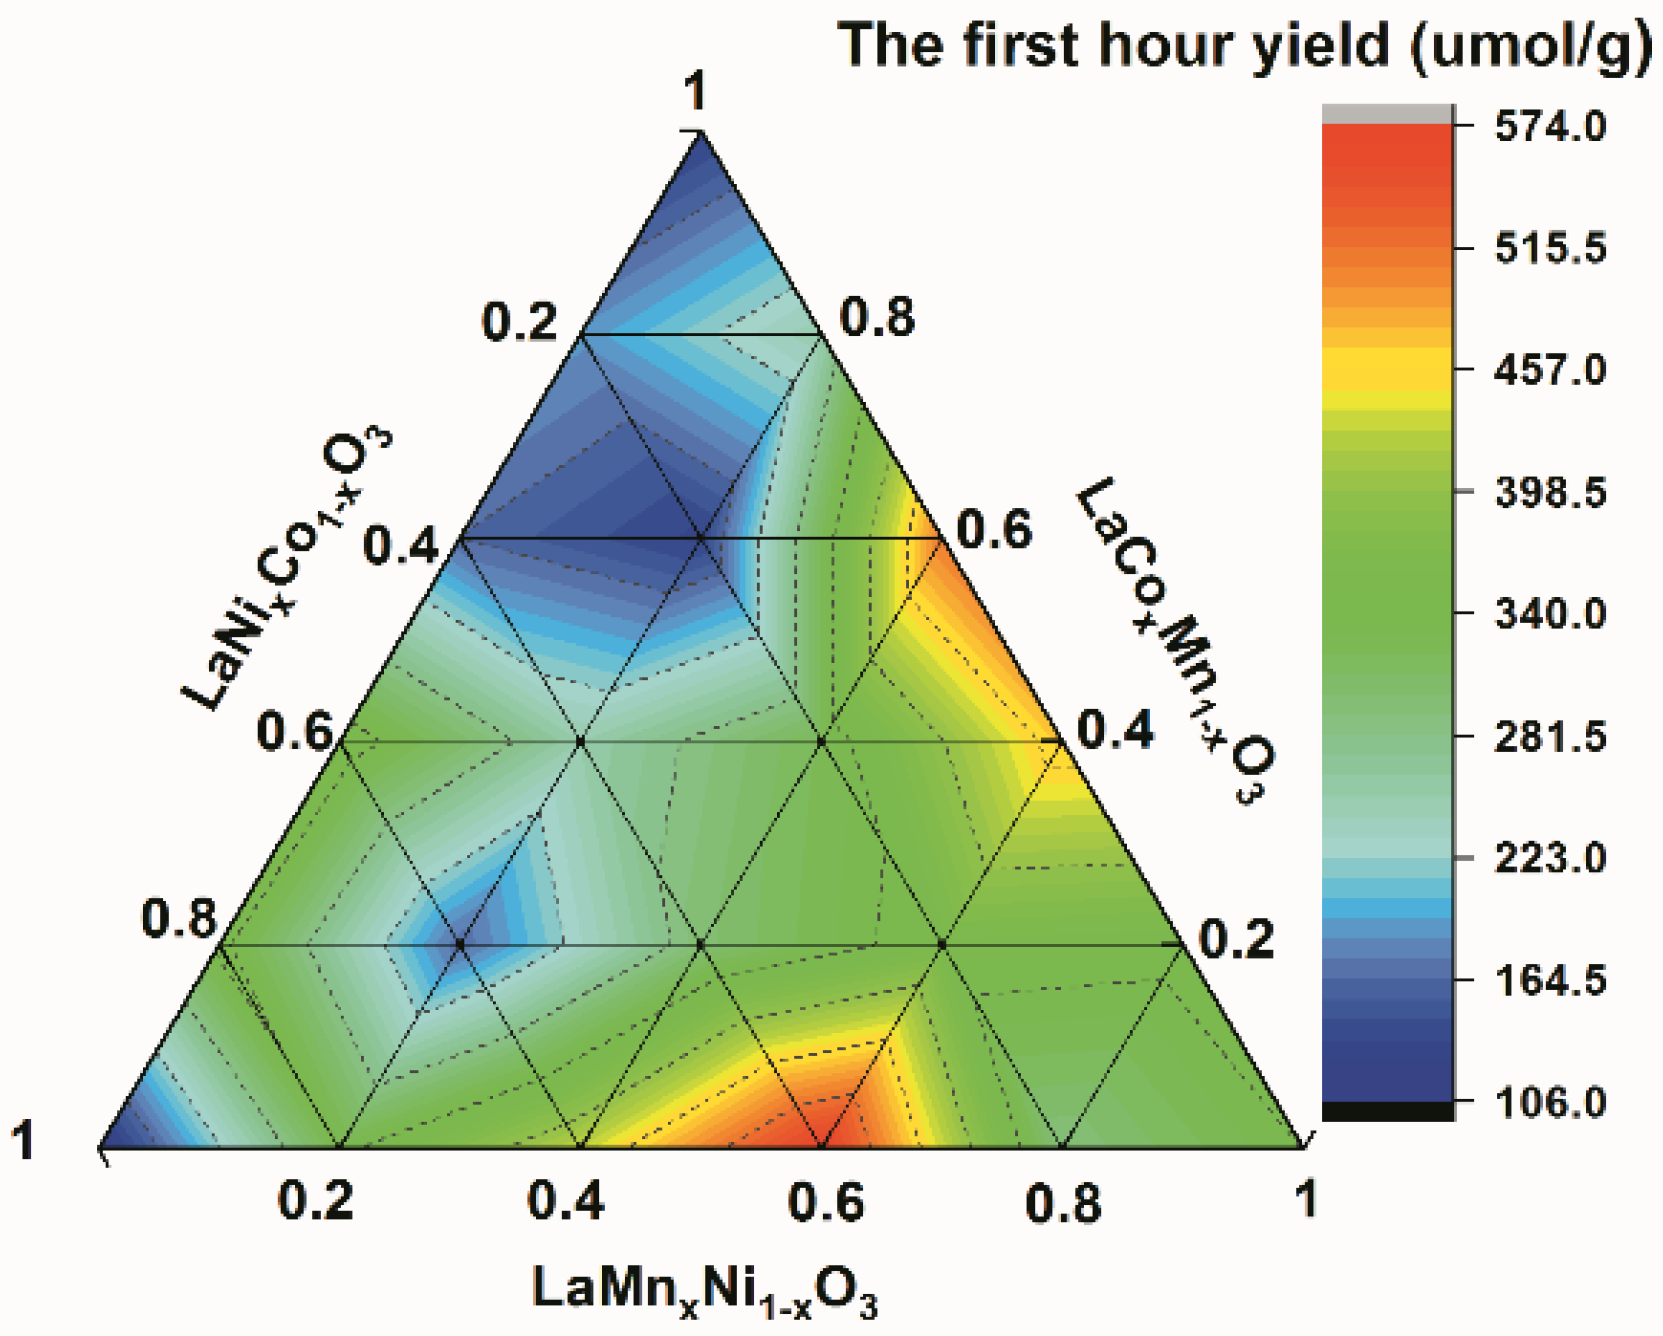
It is well known that photocatalysis is a surface chemical reaction [32]. As the reaction occurs, the products accumulate on the surface of the catalyst, which can occupy active sites and reduce the catalytic activity. Therefore, the initial reaction is closer to the real catalytic efficiency. In our work, the first hour yield was taken as the standard for judging the catalytic efficiency of the catalysts. CH4 is the main product, and the selectivity reaches as high as >97%. The results showed that all the doped solid solutions perform more catalytic activity than the pristine perovskite catalyst does (LaMnO3, LaCoO3 and LaNiO3) (Figure 1). LaMn0.6Ni0.4O3 shows the most catalytic activity out of all the catalysts, with the CH4 yield reaching 573.26 µmol·g−1. Doping can modify the structure of the energy levels and improve catalytic activity [33,34]. The separation, migration and recombination of electrons and holes are the keys to the catalytic process, and the photocatalytic reduction of CO2 is a surface catalysis reaction involving electrons and holes [35]. Based on traditional photothermal catalysis, TAS was used to further understand the difference between LCMO, LMNO and LNCO from the kinetic perspective. Carriers can be directly monitored by measuring the change in the intensity of a probe light as a function of time after pulsed band-gap excitation. To further understand the behavior of photogenerated electrons, hole scavengers were used during the TAS tests.
2.2. Transient Absorption Spectrum Analysis
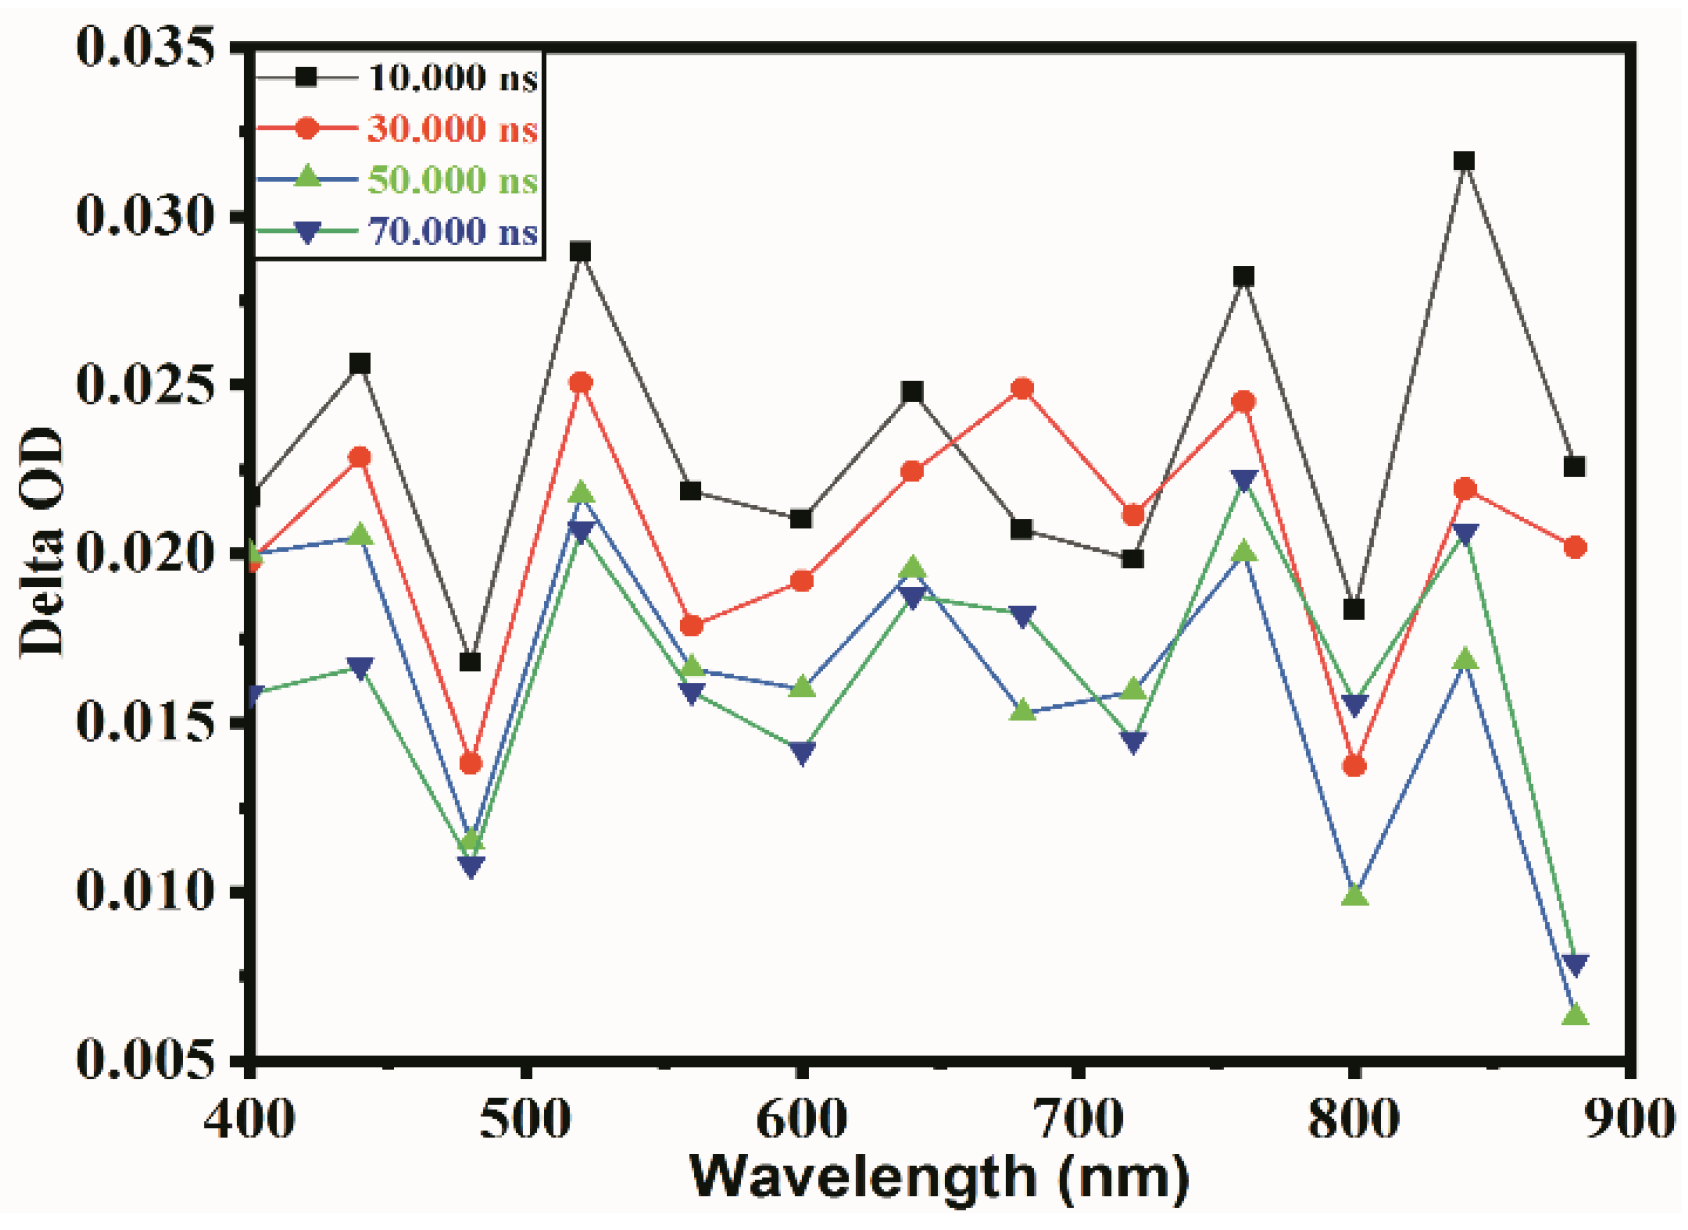
To understand the specific kinetics of electrons in the photocatalytic reduction of CO2 with H2O, CH3OH was used as a hole acceptor. In this case, holes can react with CH3OH at once, and electrons remain in the particles, so the electron spectrum can be easily obtained. Figure 2 shows the TAS in the presence of CH3OH as a hole scavenger for LaMn0.6Ni0.4O3 after excitation. Due to the characteristics of the catalysts, the intermediate states for different materials show a different wavelength response in TAS. From Figure 2, when CH3OH quenches the holes, there is no noticeable change for the other wavelengths, except 520 nm, 760 nm and 840 nm. Although 760 nm and 840 nm showed strong absorption, they have poor regularity. This result corresponds to the previous UV results, which showed that B-site doping in perovskite caused strong absorption from UV to visible light.
Through TAS, the research has extracted the absorption spectrum for carriers in a TiO2 film, which contains conducting electrons, holes and trapped electrons. The conducting electron absorption increases with wavelength, while the trapped electrons show a strong absorption peak at 770 nm [36,37,38,39]. Because of the characteristics of materials, the absorption at 520 nm can be attributed to trapped electrons in this experiment. The different transient absorption peaks as the electrons are located in different chemical environments at different wavelengths. It can be said that the electrons located at different trapped depths, such as electrons at 520 nm, 760 nm and 840 nm are trapped more deeply. One more conclusion that can be drawn is that the TAS data recorded for the suspensions are most likely attributed to transients generated in the suspended semiconductor perovskite nanoparticles and not due to metal ions in the solution [40]. The electrons have a high absorption intensity and regularity at 520 nm. Therefore, 520 nm was selected as the photogenerated electrons’ characteristic absorption spectrum wavelength.
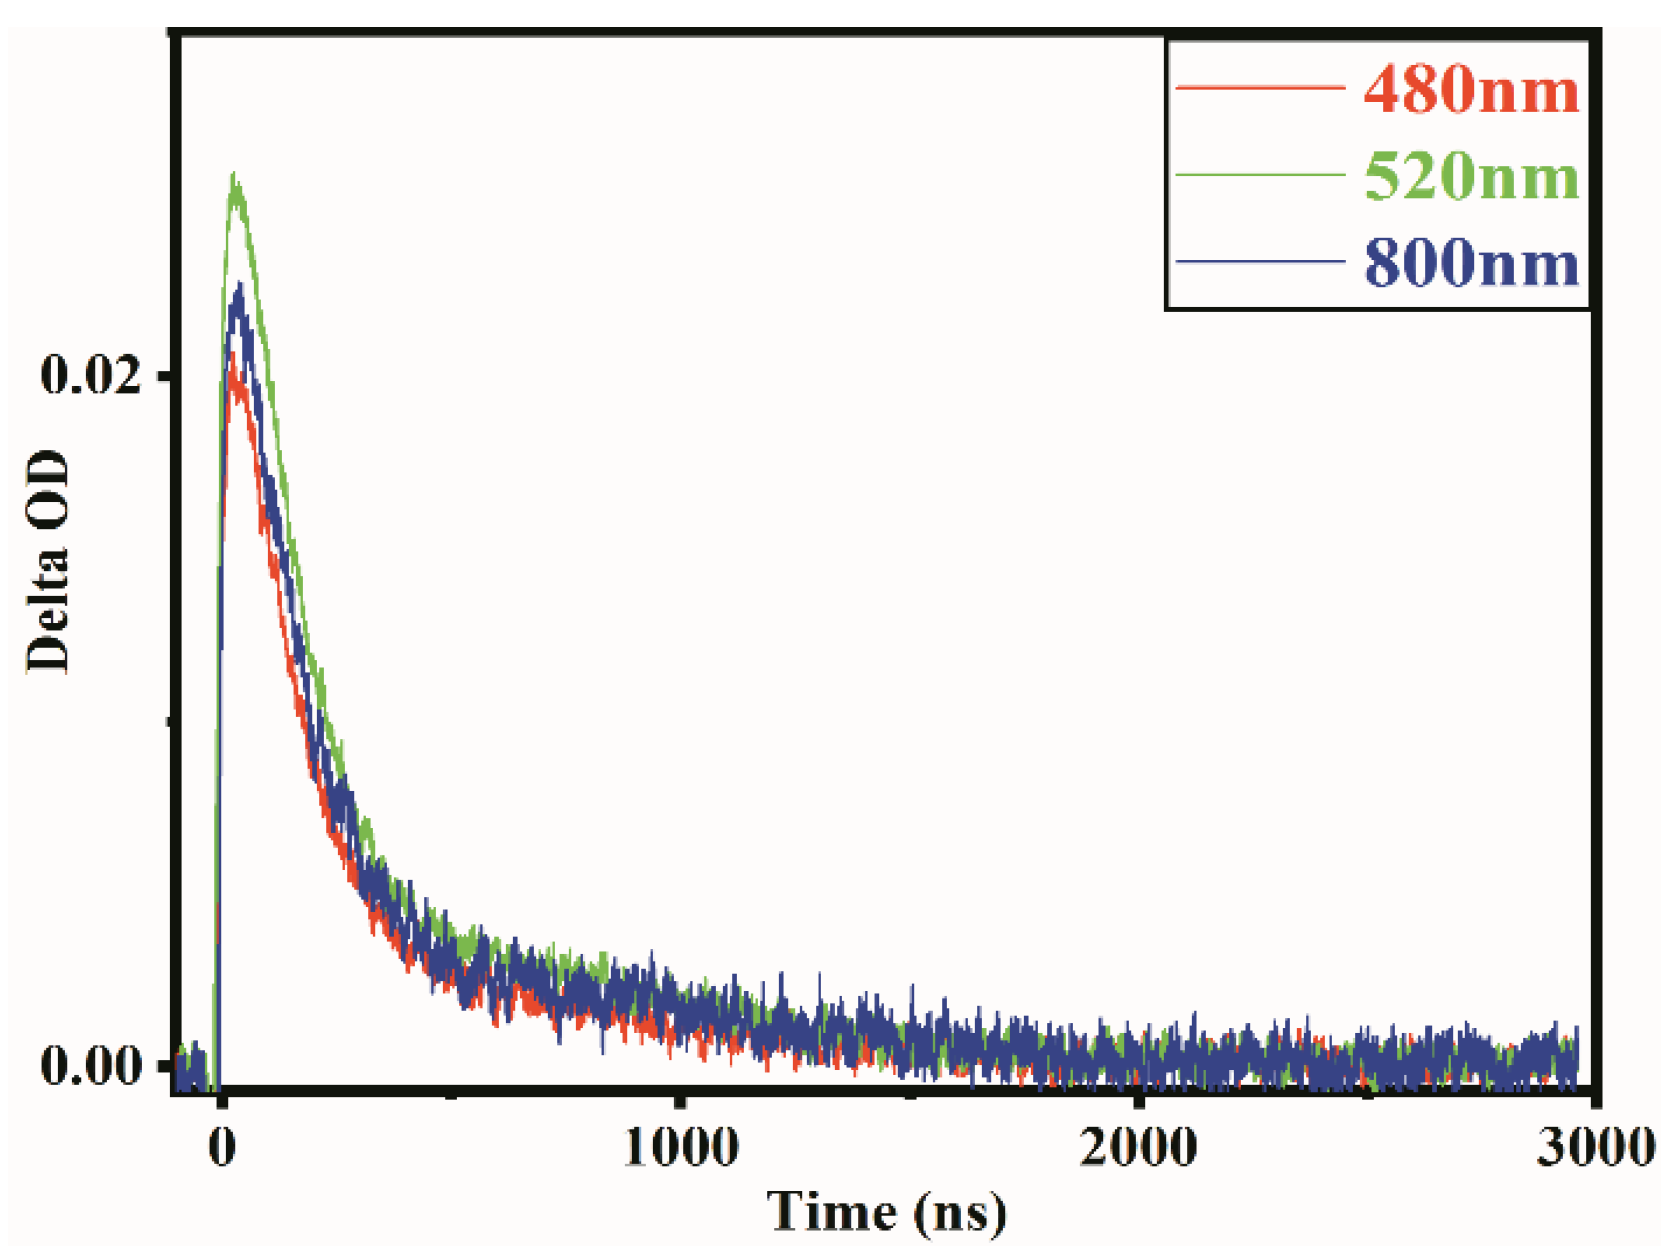
Figure 3 shows the temporal profiles for the transient absorption spectrum for LaMn0.6Ni0.4O3 observed at 480 nm, 520 nm and 800 nm suspended in CH3OH at an excitation intensity of 1.29 mJ. It is evident that electrons have similar attenuation traces at different wavelengths, with the strongest absorption at 520 nm, which matches the wavelength absorption in Figure 2. This result proves that a single species was produced after light excitation and the relaxation and trapping of electrons occurred early [41]. This is why the trapping state distributions for electrons are different, but the attenuation traces are similar.
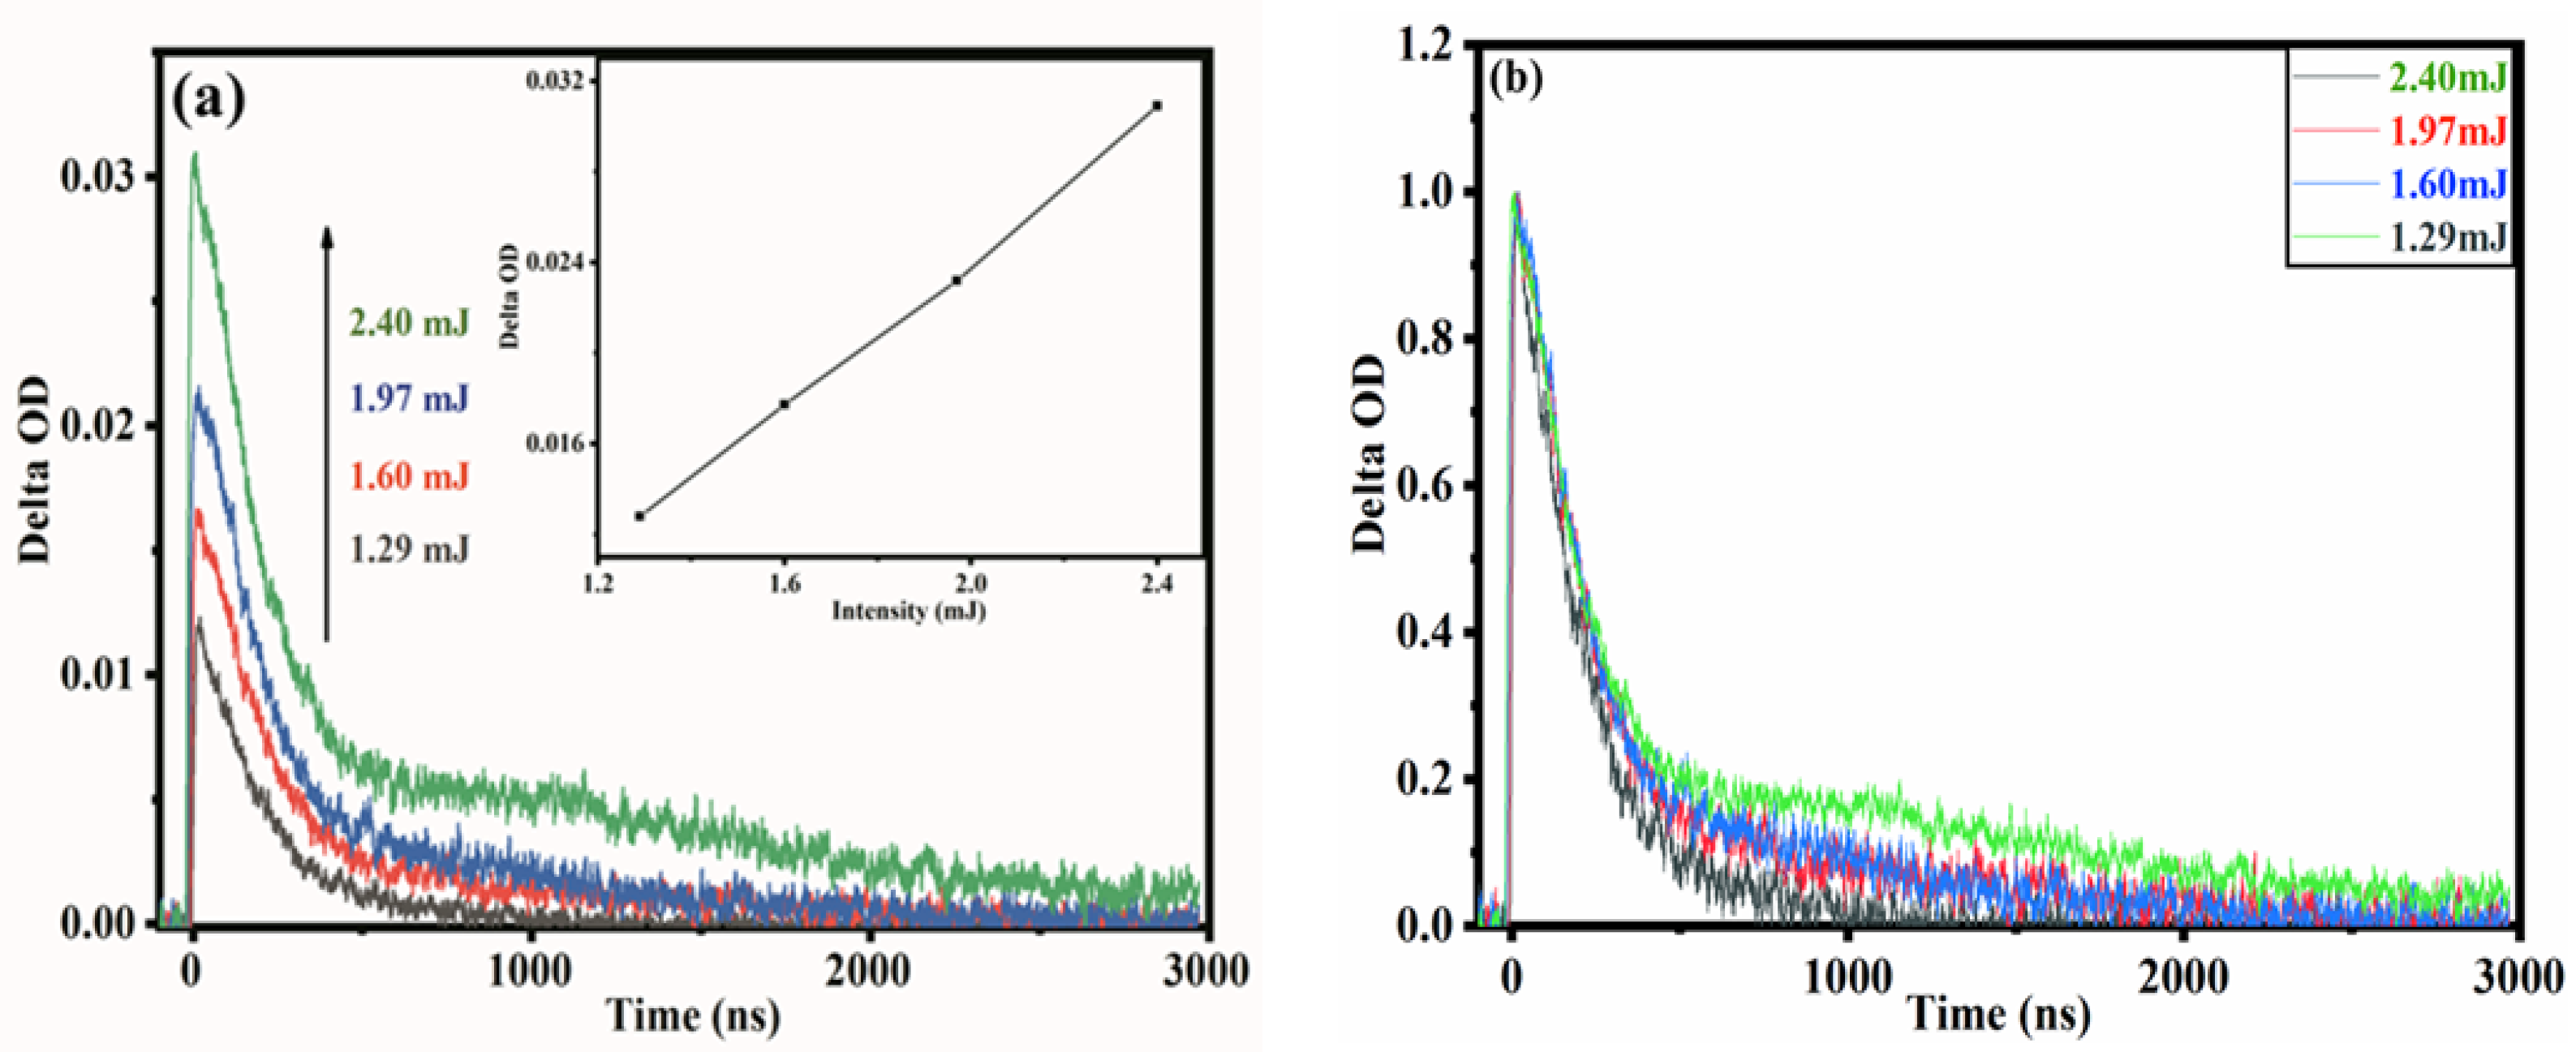
Since the excitation intensity has a specific effect on the photoelectron kinetics, we measured the temporal profiles of TAS of LaMn0.6Ni0.4O3 suspended in CH3OH at 520 nm at excitation intensities of 2.40 mJ, 1.97 mJ, 1.60 mJ and 1.29 mJ, respectively (Figure 4a,b). With an increasing excitation intensity, the absorption of the electrons increases, and the decay rate for electrons becomes significantly slower. This result indicated that more electrons could be excited at a high excitation intensity, including those trapped in deep traps. In other words, more electrons will be participating in the reaction, resulting in the relatively slow decay of electrons. The electron absorption increased with the excitation intensity, and so the absorption intensity can also evidence of the function of excitation intensity. The electron absorption rises linearly with an increasing excitation intensity (Figure 4a inset). However, an excitation intensity that is too high will generate secondary electron emission, which can introduce misleading results in understanding the actual kinetics of the photogenerated carriers. In fact, photocatalysis simulates solar radiation, so a weak excitation intensity is more suitable for studying photocatalytic kinetics.
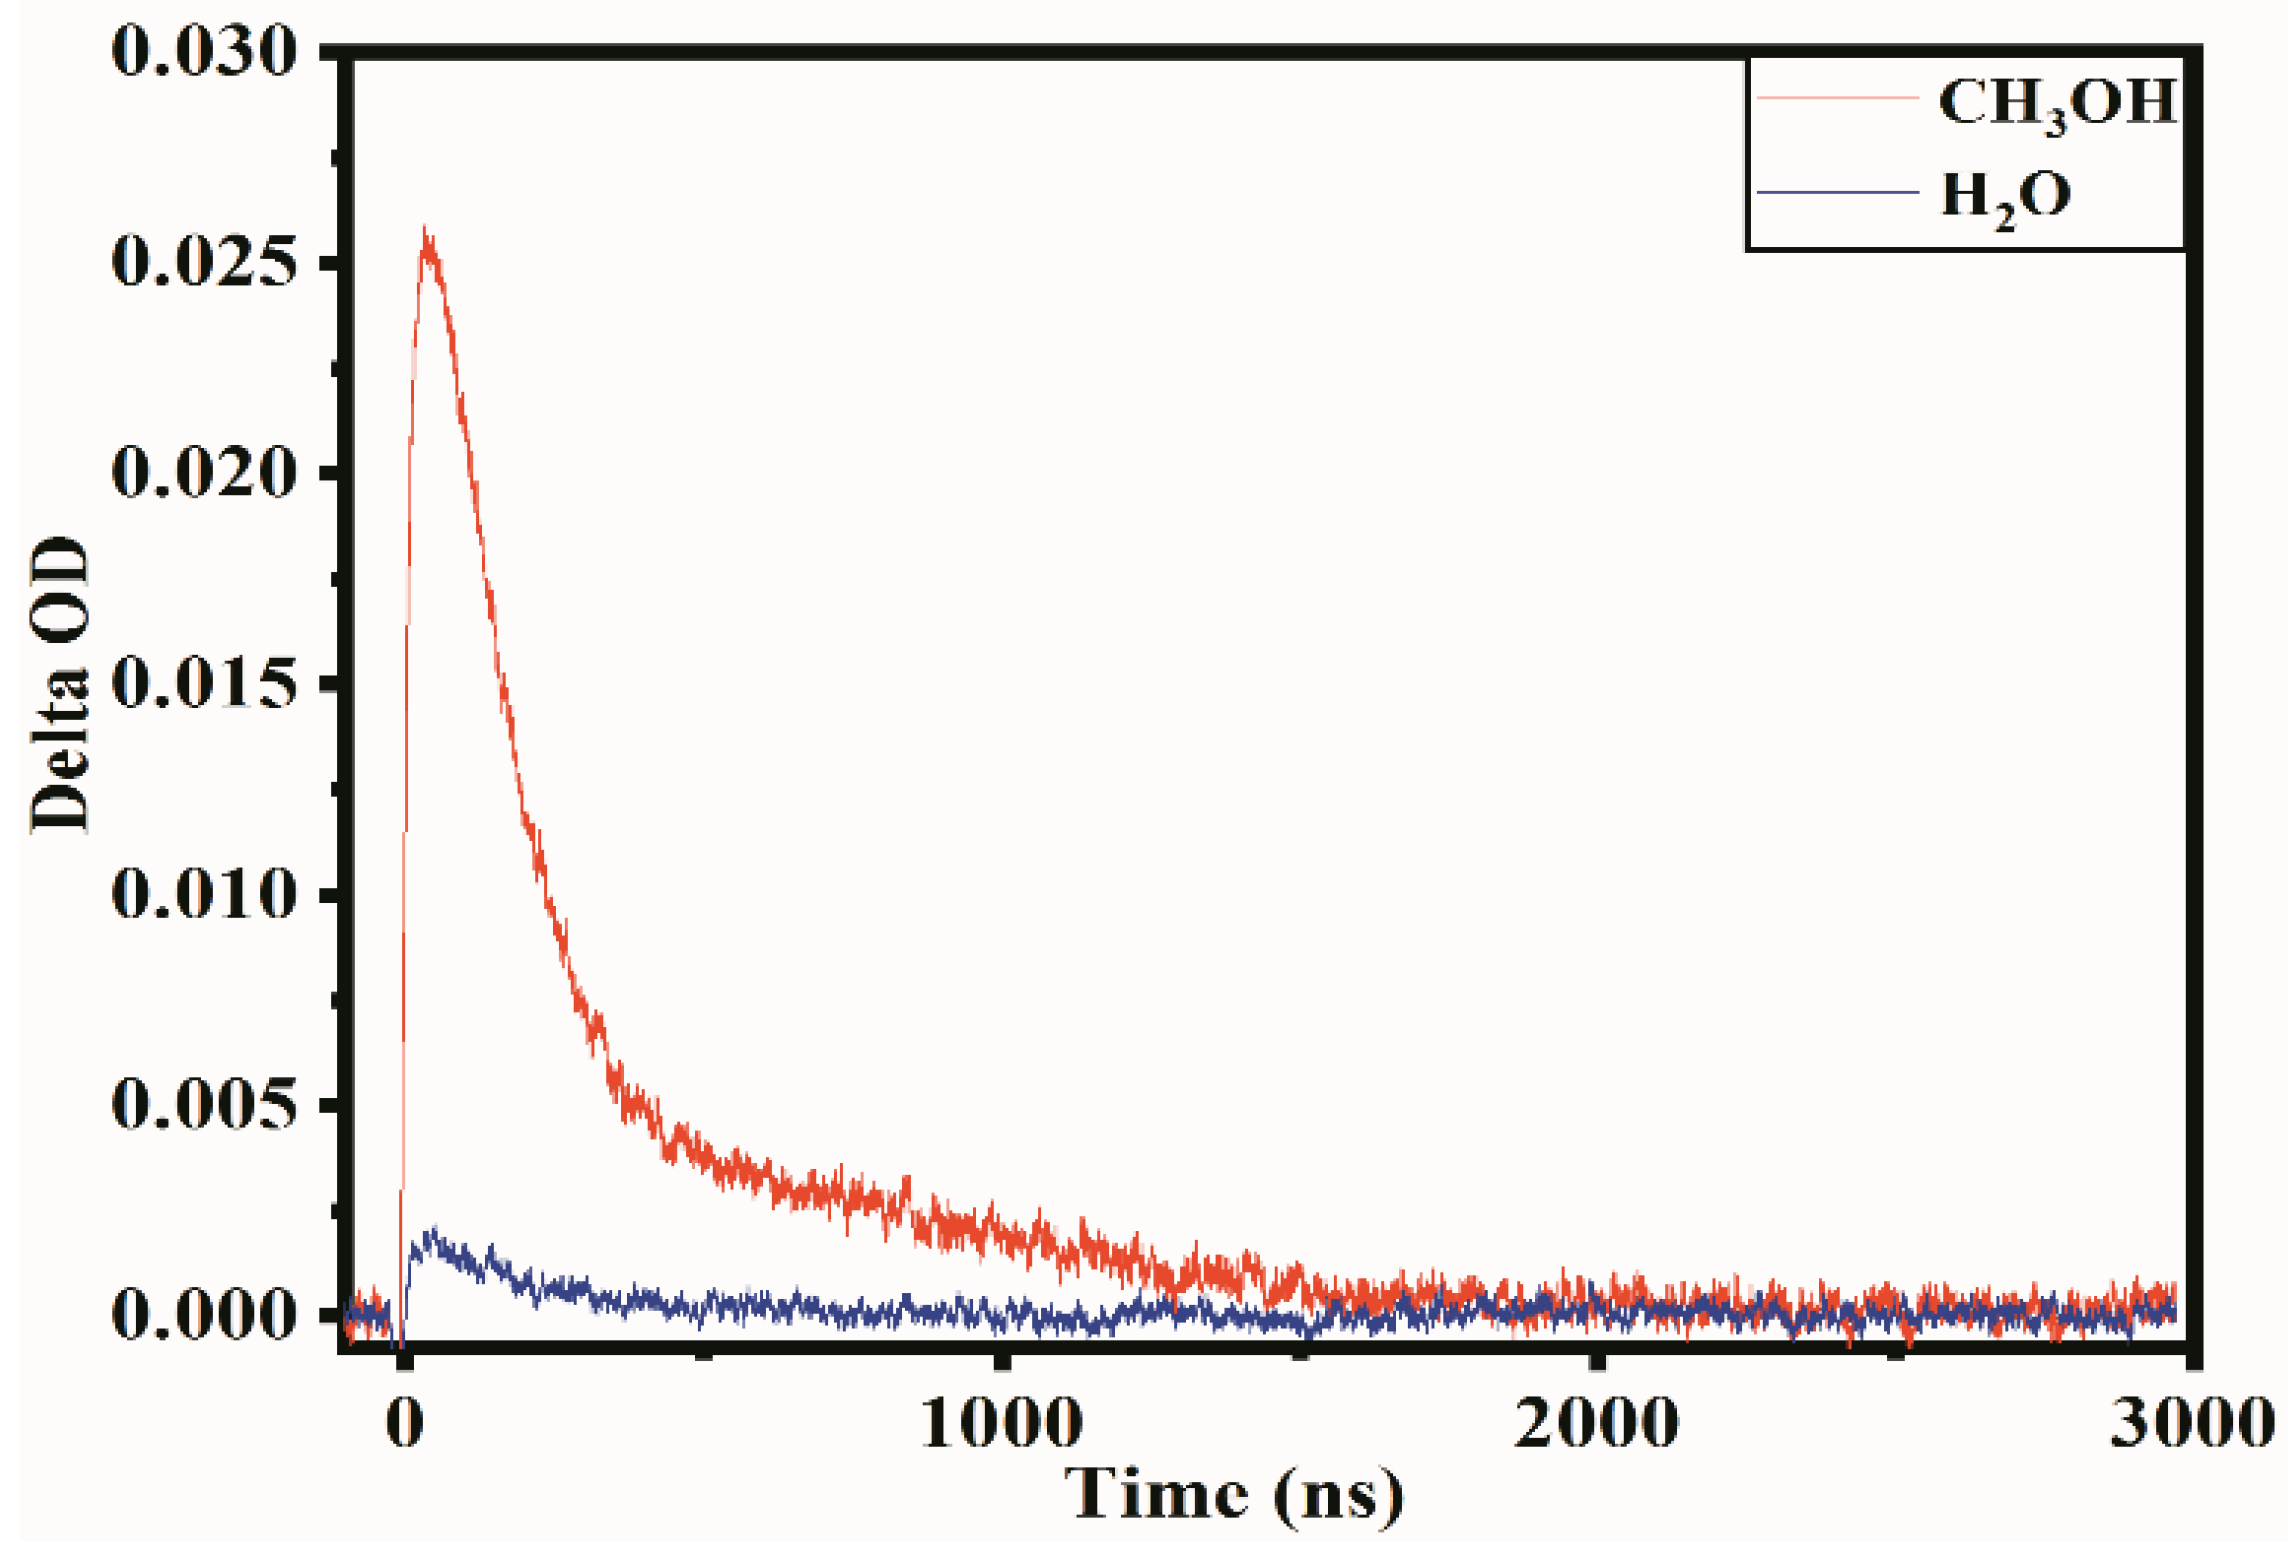
It is well known that carrier separation occurs under the action of photoexcited semiconductor catalysts, along with the generation of electrons in the conduction band and the holes in the valence band. As shown in Figure 5, in the absence of the hole quencher, the low carrier concentration indicates that the recombination of electron-hole pairs occurred quickly, which led to a low absorption intensity, but with a relatively slow decay, indicating that the electron-hole moved slowly in the particles. However, in the presence of CH3OH, the carriers’ absorption rate increased, reflecting that the recombination decreased significantly, indicating that holes can rapidly react with CH3OH, and the absorption primarily contributes to photogenerated electrons. This law is in line with previous studies of the TAS spectra for other materials [42,43]. The fast reaction can also state that the generated carriers exist on the surface of the particles, and photocatalytic reactions occur on the surface of the catalyst. These results can be used to determine that the transient decay curve with the presence of a hole quencher is the decay behavior for the trapped electrons instead of free electrons.
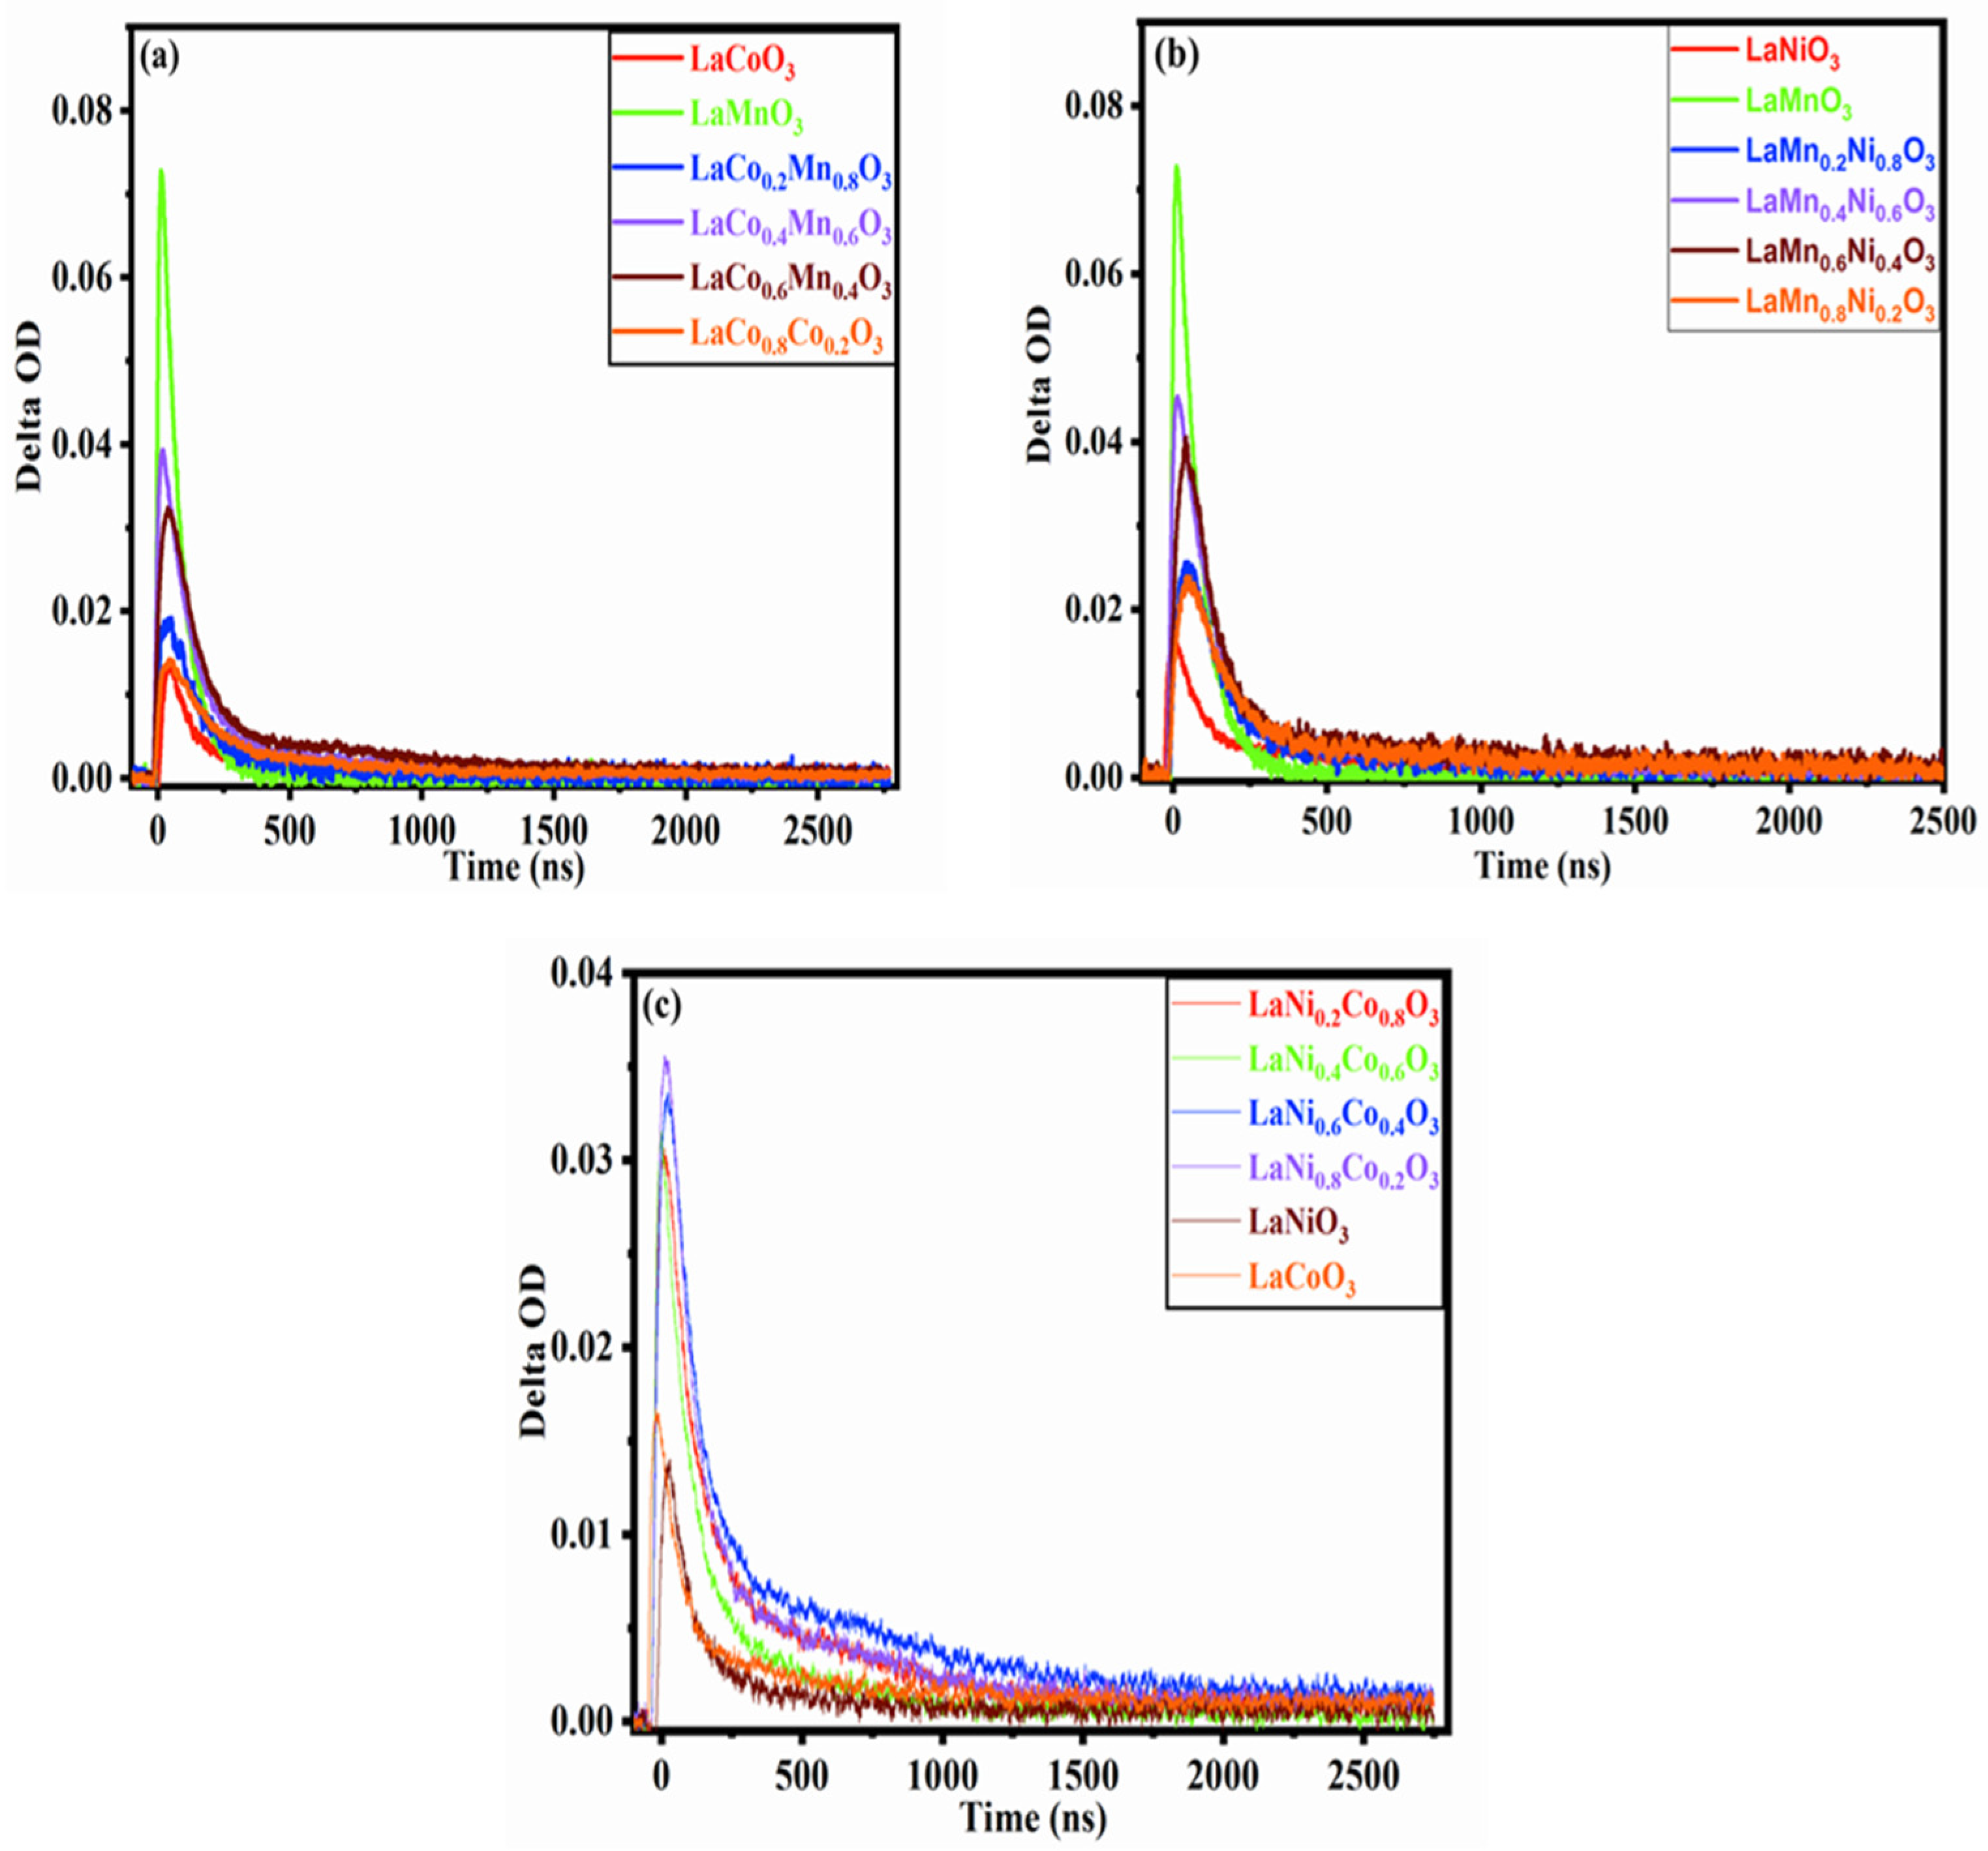
Figure 6 shows the temporal change in the TAS signals observed at 520 nm for LCMO, LMNO and LNCO in the CH3OH excited by 355 nm laser pulses at an excitation intensity of 1.29 mJ. All the signals decay completely at 3000 ns after the laser flash. Figure 6a showed that different doping ratios exhibit a similar attenuation trend and kinetic process, leading to the intermediate states being the same. The difference lies in the decay behavior of the electrons, which is attributed to the carrier concentration, carrier transfer, trapping, relaxation and decay rate, including the chemical reaction rate after photoexcitation. In general, all the compounds have only one B-site element, which shows a quite different decay behavior compared with that of the compounds with two B-site elements. A mixed ion state at the B-site led to a relatively slow decay process, which is beneficial for efficiently using the excited electrons. The decay curves for these hybrid B-site compounds show severe overlap in Figure 6, but further fitting with these curves gave a crystal clear difference in the characteristic lifetime τ2, which is discussed later.
Different absorption intensities may be attributed to the sensitivity and response of the photocatalysts to excitation light: the more sensitive the material is, the more excited the electrons become, and the higher the absorption intensity is. However, the absorption intensity does not entirely determine the catalytic efficiency of the catalyst; the decay rate of the electrons is the main factor determining the catalytic efficiency of the catalyst. This conclusion corresponds to the UV tests (Figure S4) and TAS (Figure 6). LaMnO3 showed the strongest absorption in TAS, but it had a faster decay rate than LaMn0.6Co0.4O3 and LaMn0.4Co0.6O3 did. The reason for this is that LaMnO3 generated fewer effective electrons to participate in the reaction. All the temporal profiles can adequately fit with two consecutive first-order kinetics, which indicates that the distribution of the charge states can be separated into two populations: fast and slow ones. The fast components (τ1) could correspond to the electrons trapped in proximity to the point at which the photochemical event occurs, and slow components (τ2) could correspond to electron de-trapping or delocalization after migration [44,45]. The slow component is related to the efficiency of the photocatalytic reduction of CO2 and determines the catalytic efficiency of the photocatalyst, which is the rate-limiting step of the photocatalytic reaction. Slow decay indicated that the electrons could effectively participate in the photocatalytic reaction, representing the actual process for electrons participating in the reaction and corresponding to a long lifetime for electrons. In the photocatalytic process, the longer the lifetime for the electrons is, the stronger the electron de-rapping ability is. The more effective the electrons are near the conduction band, the higher the photocatalytic efficiency is.
In reviewing the decay kinetics for the same series of catalysts, although the processes are similar, the decay rate and electron lifetime are different. The lifetime of the electrons is the key to deciding the catalytic efficiency. Doping can effectively improve the electron lifetime since doping can modify the band gap structure and change the electron states. The effective electrons required to participate in the photocatalytic reactions are located near the conduction band and migrate from the conduction band to the semiconductor surface to join the reduction reaction with the adsorbed materials [46]. Therefore, modifying the proportion of the elements at the B-site will change the trapping energy level near the conduction band, which will affect the electron trapping, de-trapping and migration ability, and ultimately, the effective number of electrons and electron activity involved in the photocatalytic reactions. In summary, different B-site doping ratios can effectively improve the capability of trapping and migration for charge carriers.
Figure 6b shows the decay profile for LMNO. In this series, adjusting the doping ratio has only a small effect in LMNO, so it is difficult to distinguish each sample in the LMNO series. This further indicated that doping could form an excellent single solid solution. However, we can roughly divide the series of materials into two groups. One group has a low absorption value, which includes Mn = 0.2 and 0.8, and for the other groups, Mn = 0.4 and 0.6. Compared with Mn = 0.4 and 0.6, Mn = 0.6 decays more slowly. Finally, the decay lifetime for all the samples can be ranked as LaNiO3 < LaMnO3 < LaMn0.2Ni0.8O3 < LaMn0.8Ni0.2O3 < LaMn0.4Ni0.6O3 < LaMn0.6Ni0.4O3. This series follows the same rule found for LCMO regarding all the kinetic decay curves. These results are also due to the different doping proportions, which change the energy level near the conduction band, influencing the ability for electron trapping, de-trapping, migration and delocalization. Finally, it leads to different electron lifetime differences for other catalysts.
Different metals have specific electron transfer capabilities, and the combination of various metal elements also affects the properties. Compared with LCMO, LMNO and LNCO, Co, Mn or Ni are paired, the new CB and trapped level will be produced in a different combination series. This is why the LCMO, LMNO and LNCO series show different carrier lifetimes. Figure 6c shows the decay trace for LNCO. Ni = 0.6 has the slowest decay rate, and next one is Ni = 0.8. Pure perovskite LaCoO3 and LaNiO3 show the fastest decay rates and the shortest lifetime. The kinetic decay curve for LNCO is similar to those in the previous description for LCMO and LMNO. The difference between the catalysts with different doped elements and proportions can be explained more specifically by fitting the effective lifetime for electrons. The lifetimes for all the samples are listed in Table 1. The lifetime uses a two-exponential decay function: . It should be noted here that a two-exponential decay function is not only applicable to perovskite oxides, but also to metal halide perovskite [47], even oxides (TiO2 and α-Fe2O3) [48,49]. As long as the material has band gap defects, there will be a two-order attenuation time. A triexponential decay function will also occur if the catalyst is combined with multiple catalysts or has a specific structure (2D/3D layered catalysts) [50]. It is worth noting that the lifetime constants were fitted by using a two-exponential decay function. There are some errors in the quality of the data fitting. LaCo0.6Mn0.4O3 is taken as an example in Figure S8. The lifetime errors for other catalysts are included in Figure S9.
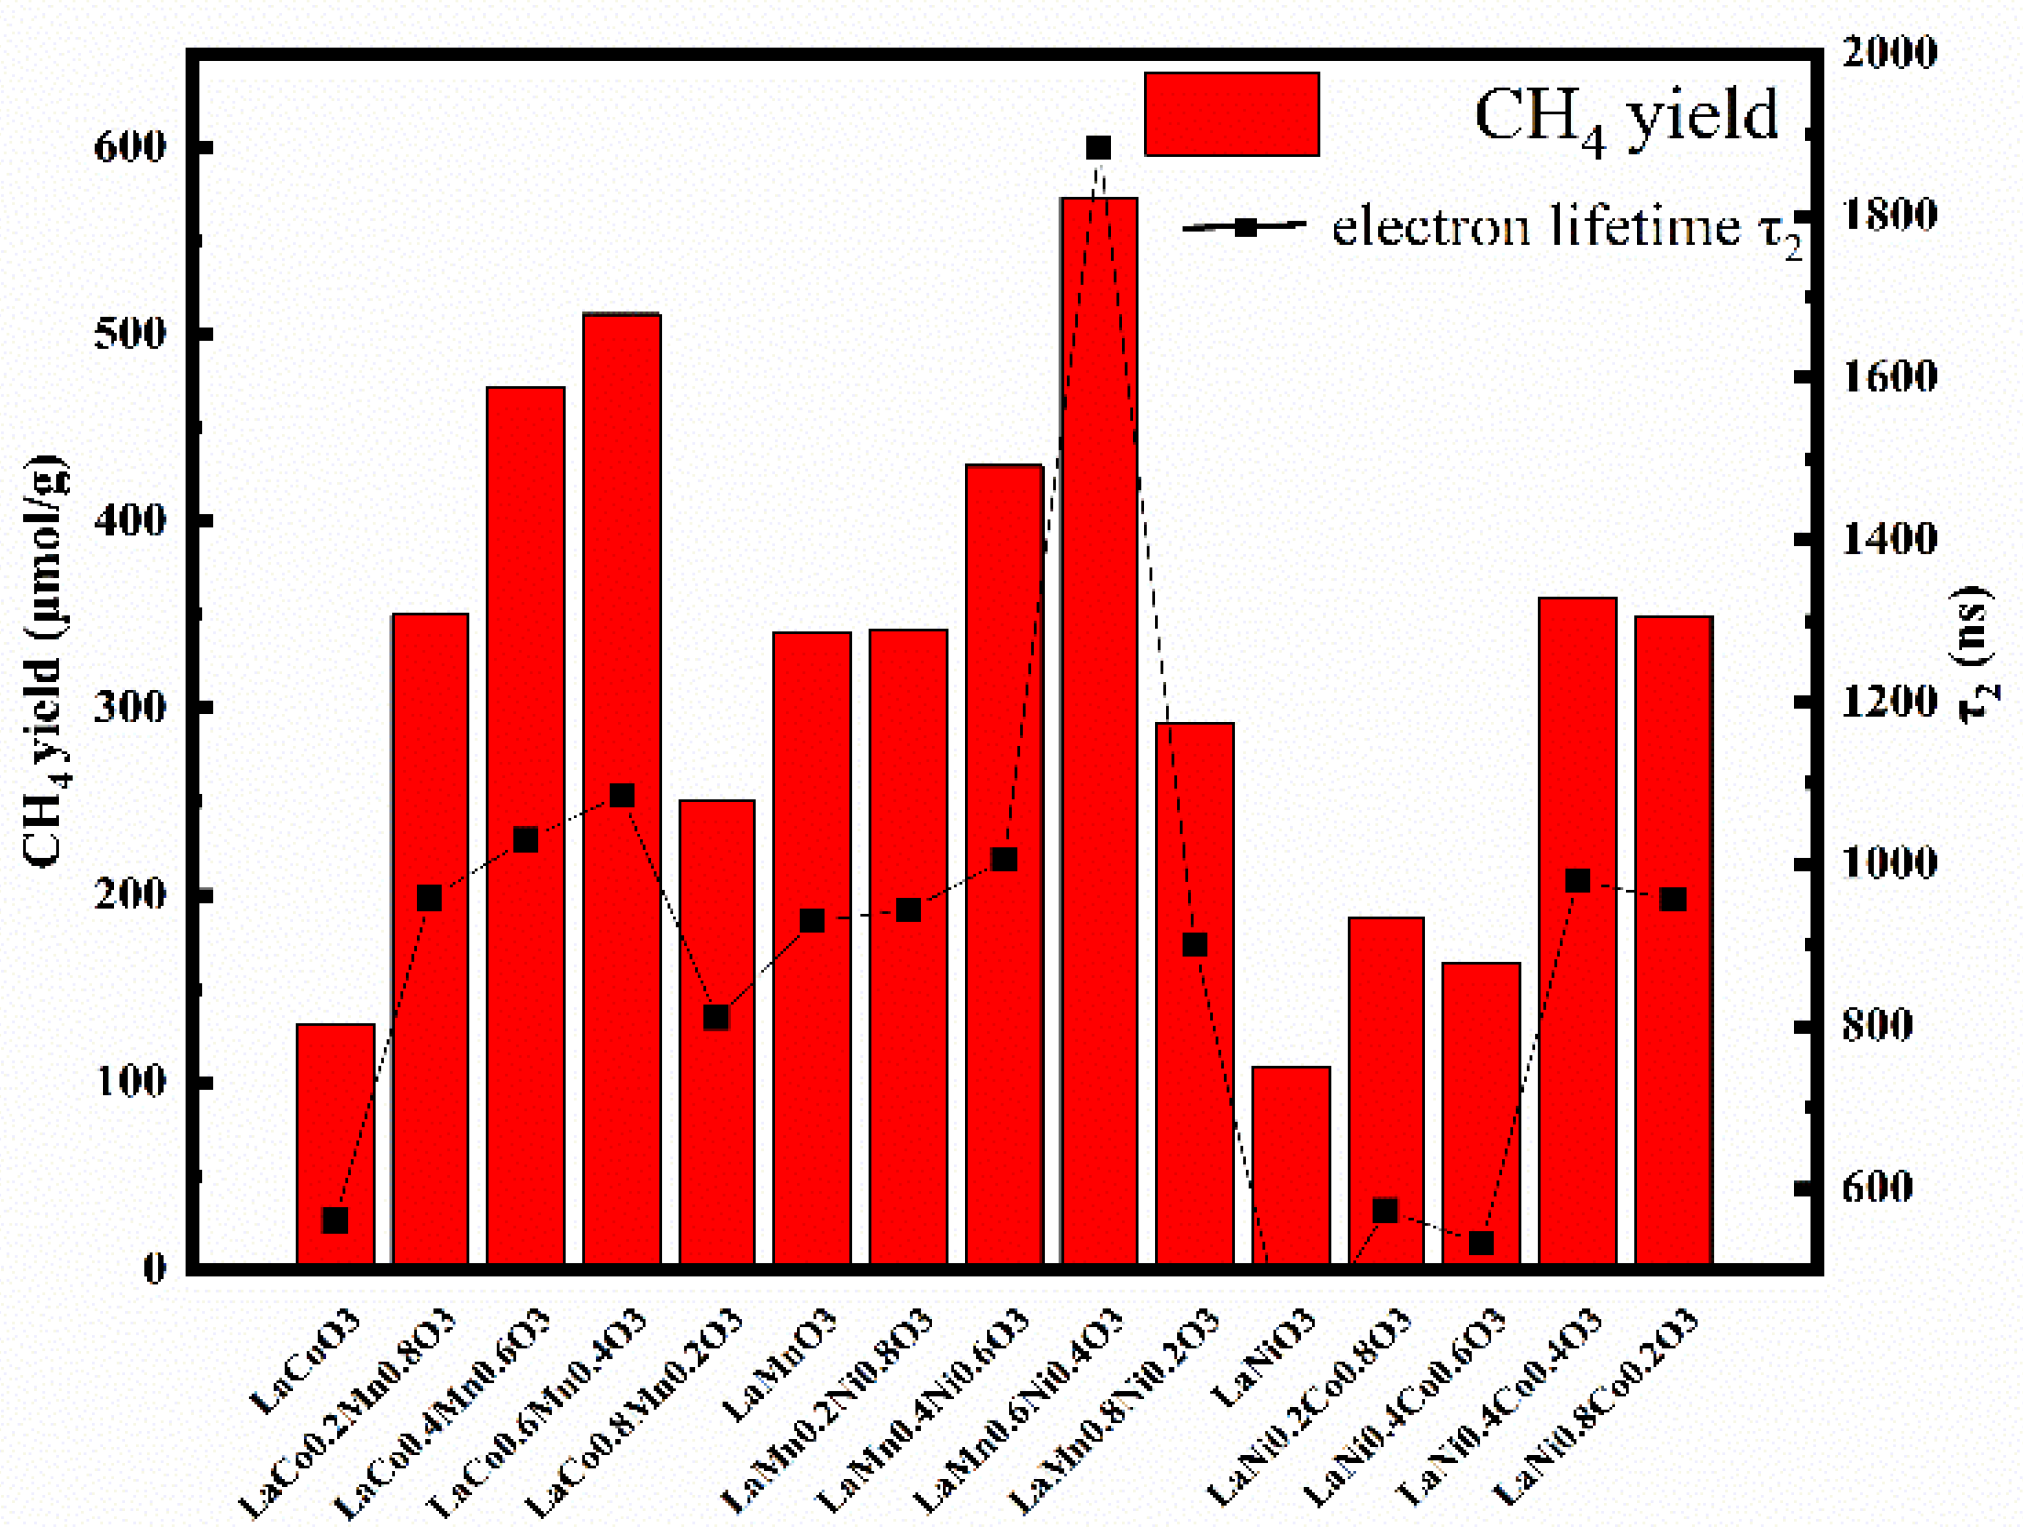
Traditional photocatalytic results are basically consistent with the electron transient decay lifetime, which means the catalytic activity can be expressed by the electron lifetime. In other words, besides the traditional photocatalytic method used for detecting the yield of the photocatalytic products, the electron lifetime can better and more intuitively reflect the catalytic ability of the photocatalyst. Detecting the decay lifetime for electrons by TAS can be a new way to judge the catalytic efficiency of photocatalysts. In this paper, the relationship between the electron lifetime and catalytic efficiency is well established and proved in Figure 7, which shows the CH4 yield and electron lifetime for all the catalysts. The longer the lifetime of the electrons is, the higher the CH4 yield is; this illustrates that long-lived photogenerated electrons are a primary condition for the photocatalytic reduction of CO2, since the rate-limiting step for the photochemical reduction of CO2 is the slow migration of electrons in a solution.
It is found that B-site-doped elements and their proportion has a significant influence on the carrier lifetime and catalytic efficiency. The reason is that doping can change the energy band gap in semiconductor-based catalysts. After doping, impurities are formed in the energy bandgap, which can shorten the bandgap and create more semiconducting mid-gaps for the excited carriers, so that the electrons and holes trapped in the mid-gaps can survive for a longer period. Besides that, doping can cause defects in the catalysts, facilitating the separation of the charge carriers and increasing the carriers’ population [51]. The effective number of electrons in the reaction increased, and photogenerated electron-hole pairs’ recombination was effectively inhibited. Therefore, the lifetime of the photogenerated electrons increased, and the catalytic efficiency improved. A change in the doping ratio in the same series greatly influences the morphology: too high or too low a proportion is not conducive to CO2 adsorption and electron transfer. When the doping ratio reaches 0.6 in each series (LaCo0.6Mn0.4O3, LaMn0.6Ni0.4O3 and LaNi0.6Co0.4O3), perovskite shows the highest CH4 yield and longest electron lifetime. Through the density functional theory, the valence band is composed of an O 2p orbital, and the conduction band is formed by the B-site element 3d orbital (2eg and 3t2g) in ABO3 [52,53]. Therefore, the doping ratio and elements impact the location of the conduction band and valence band, which can be seen in Table S2. It is well known that the band gap (Eg) is an essential factor that reflects the photocatalytic activity, which can reflect the region and intensity of the light response and the ability of electrons to be excited from the valence band to the conduction band. Doping can effectively reduce the Eg, but there is no apparent correlation between the Eg and actual catalytic yield. At the same time, it is difficult to directly observe the difference in the catalytic efficiency of catalysts due to small changes in the Eg. TAS can not only be used to satisfactorily resolve an unnoticeable change in the catalyst efficiency caused by a slight change in the Eg due to the importance of the photogenerated electron lifetime in the microscopic carrier dynamics for the photocatalytic process, but it can also be used to better understand the importance of the photogenerated carrier lifetime in the photocatalytic process. At the same time, TAS provides a method for the rapid and accurate judging of the catalytic efficiency of a catalyst.
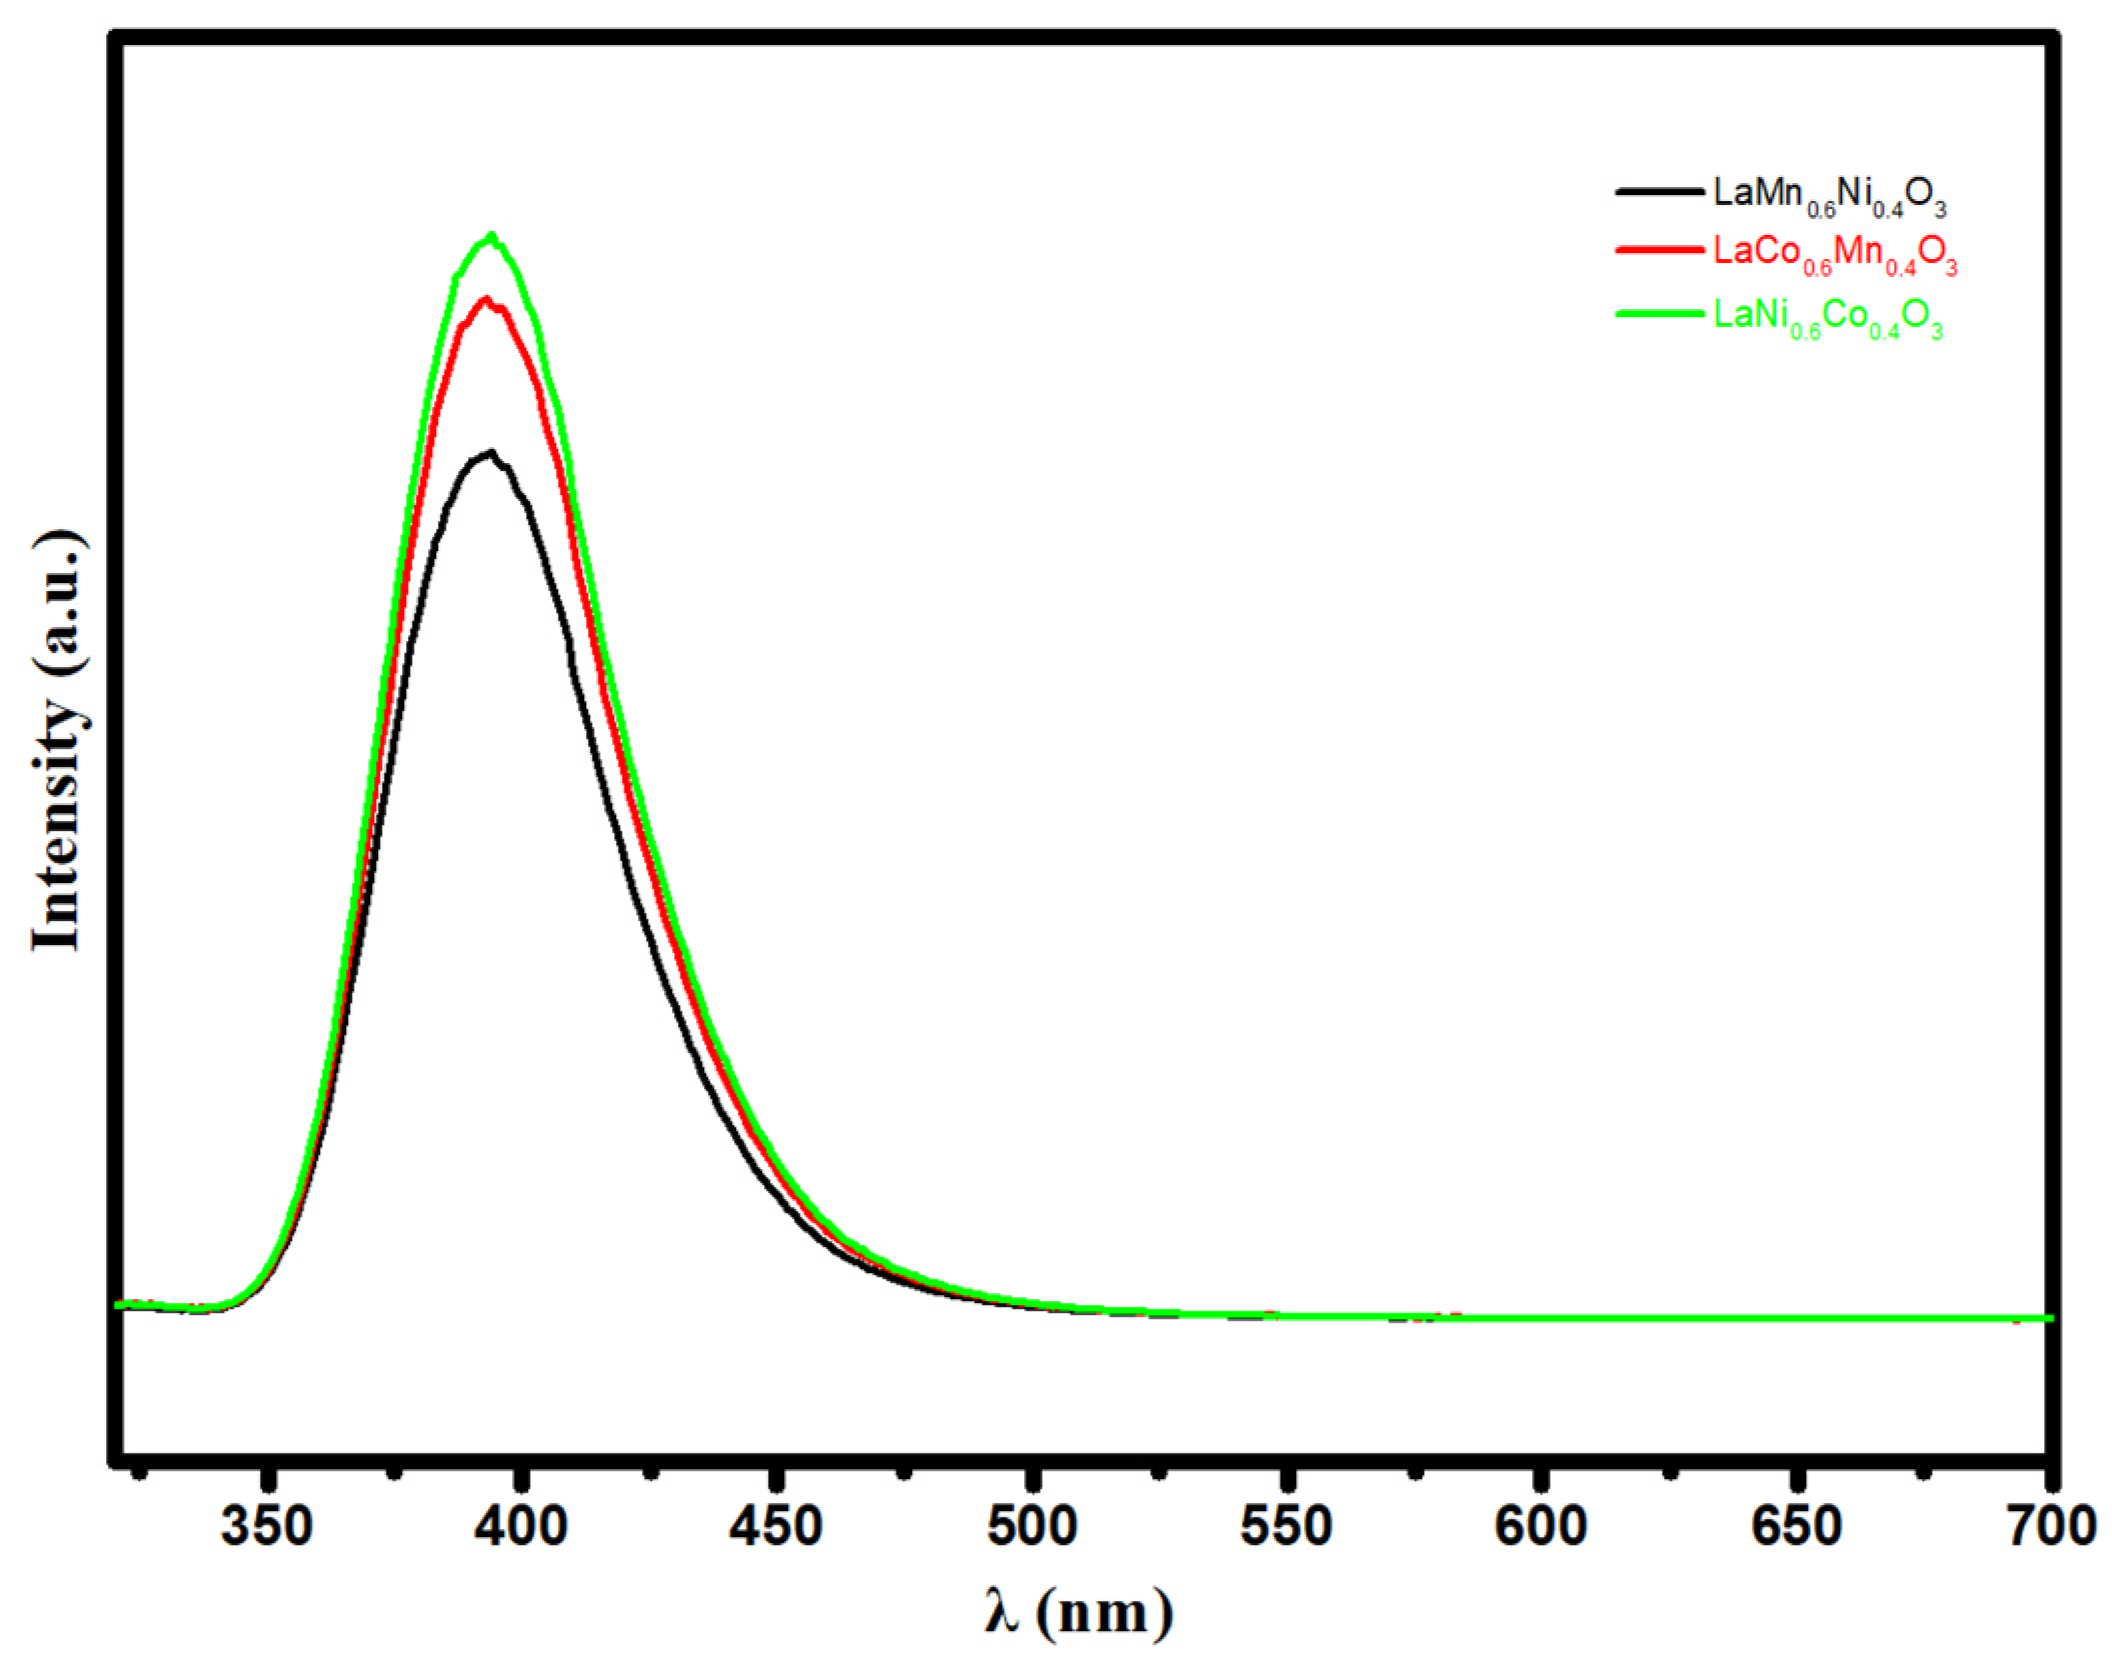
Photoluminescence spectroscopy (PL) has been carried out to examine the recombination efficiency of photo-induced electrons and holes in photocatalysts. Generally, a high emission PL intensity means that there is a rapid charge recombination rate and low photocatalytic activity, while a photocatalyst with a low PL intensity refers to a low rate of electron/hole pairs and high photocatalytic activity [54]. Figure 8 exhibits the PL spectra of LaMn0.6Ni0.4O3, LaCo0.6Mn0.4O3 and LaNi0.6Co0.4O3; the PL emission intensity sequence is LaMn0.6Ni0.4O3 < LaCo0.6Mn0.4O3 < LaNi0.6Co0.4O3, and the re-combination rate of carriers is consistent with this. The PL spectra indicate that LaMn0.6Ni0.4O3 has the highest electron-hole pair separation efficiency and the lowest recombination rate. Therefore, LaMn0.6Ni0.4O3 has the largest number of effective electrons involved in the photocatalytic reduction of CO2, which corresponds to the highest photocatalytic activity level. According to the PL absorption intensity of the catalyst, it can be inferred that the catalytic activity order is LaMn0.6Ni0.4O3 > La-Co0.6Mn0.4O3 > LaNi0.6Co0.4O3. This result is consistent with the photothermal catalysis and TAS.
3. Materials and Methods
3.1. Materials
LCMO, LMNO and LNCO nano-powders were prepared with a citric acid sol-gel method. All the metal nitrates were dissolved in 60 mL deionized water to form a homogeneous mixed solution, followed by stirring and dissolving until a clarification solution was formed; then, the solution was heated in an oil bath at 80 °C until the sol was formed, which was then moved to an oven for drying at 170 °C overnight. Finally, after calcination at 700 °C for 7 h, perovskite-type LCMO, LMNO and LNCO nanoparticles were obtained. The total molar mass of the sample was 0.03 mol, and the molar ratio of nitrate to citric acid was 1:1.25.
X-ray diffraction (XRD, TD-3500, Dandong Tongda Science and Technology Co., Ltd., Dandong, China) examined the phase composition of the photocatalysts. The microstructure and morphology of various photocatalysts were investigated using a desktop Scanning Electronic Microscope (SEM, Phenom Pro, Phenom-World, Alemlo, The Netherlands). The specific surfabetce area was measured by BET (ASAP 2020, Micromeritics, MICROMERITICS INSTRUMENT CORP, Atlanta, GA, USA). The light absorption performance of the photocatalyst was tested by ultraviolet and visible diffuse reflectance spectra (UV-Vis, SHIMADZU-3600, Shimadzu, Kyoto, Japan). The chemical composition and chemical valence of the photocatalyst surface were analyzed by X-ray photoelectron spectroscopy (XPS, ESCALAB250, ThermoFisher SCIENTIFIC, Waltham, UK). The photoluminescence (PL) spectrophotometer excited with 250 nm was used to analyze the emission wavelength of 330–700 nm and the recombination efficiency of photo-induced electrons and holes (FLS1000, Edinburgh, Techcomp (China) Scientific Instrument Co., Ltd., Edinburgh, UK).
3.2. Catalytic Measurements
Photocatalytic CO2 reduction experiments were carried out in a gas-tight circulation system. The volume of the reaction system was about 120 mL. One hundred mg sample powder was evenly dispersed and uniformly placed at the bottom of a Pyrex glass cell. The reactor was vacuum treated several times, and high-purity CO2 (≥99.999%) was flown through the whole system for 5 min at a flow rate of 27 mL/min to ensure the maximum adsorption of CO2 molecules onto the active sites of the catalyst water vapor mixture into the reactor that has a quartz window at a constant temperature. The whole system was maintained at 25 KPa. The entire catalytic activity evaluation was performed at 350 °C, which was maintained using an external heating sleeve (heat source). A 300 W Xe lamp (PLS-SXE300, Beijing Zhongjiaojinyuan Technology Co., Ltd., Beijing, China) with a UV light filter (λ > 420 nm) was employed as the light source, which was kept 8–10 cm away from the upper surface of the catalyst. The first sample (0.5 mL) was taken after 1 h of reaction, after which the samples were collected every 0.5 h and analyzed using a gas chromatograph (Echrom A90, Changzhoupannuo Co., Ltd., Changzhou, China). The GC was equipped with a flame ionization detector (FID, capillary column, HP-PLOTQ, Agilent Technologies Inc., Santa Clara, CA, USA) using Pure N2 (99.999%) as carrier gas. For the calculation of the CH4 yield, one can refer to our previous studies [18,19,55]
3.3. Transient Absorption Spectrum Measurements
The transient absorption spectra (TAS) for charge carriers in the LCMO, LMNO and LNCO solutions were measured on the ns time scale (LP 980, Techcomp (China) Scientific Instrument Co., Ltd., Edinburgh, UK). On the nanosecond (ns) time scale, the excitation source was employed as a third harmonic of the Nd: YAG laser (SLI-10, Continuum I-10, 355 nm, 10 μs pulse width, Genuine optronics (Shanghai) Co., Ltd., Shanghai, China). The repetition rate of the laser was 10 Hz, and the pulse was approximately 2000 μs. A 150 W ozone-free xenon lamp was used as the probe source. A monochromator controlled the wavelength of the probe light before and after the test was conducted. The signal from the detector was recorded using a digital oscilloscope (Tektronix TDS3012C, Teck Technology Co., Ltd., Beaverton, OR, USA). Then, a connection between a computer and the oscilloscope was used to transfer the measured data to a computer. The intensity of the laser pulse was measured using a laser power meter. To measure TAS, all the powders were suspended in methanol by sonication. The concentration was controlled at approximately 0.05 mg/mL to ensure high-quality data collection (see the details in Figure S1).
4. Conclusions
In this paper, the relationship between the electron lifetime and photocatalytic activity is well established by combining traditional photocatalytic measurements with TAS. It was concluded that the key to determining photocatalytic efficiency is the separation, transfer, trapping and de-trapping abilities of active electrons. Long-lived photogenerated electrons can illustrate the reducing capacity of electrons in reactions. TAS detected the electron lifetimes for LCMO, LMNO and LNCO in the presence of CH3OH as a hole quencher. LMNO showed a slower decay and longer lifetime for the electrons than LCMO and LNCO did, which corresponds to a higher catalytic activity level than those of LCMO and LNCO. Doping can extend the lifetime of carriers and enhance catalytic activity due to impurities and defects that are formed, which create more semiconducting mid-gaps for the excited carriers, so that the electrons and holes trapped in the mid-gaps can survive a longer period, and doping facilitates the separation of the charge carriers and increases the carrier population. Among the three series of catalysts studied, LaCo0.6Mn0.4O3, LaMn0.6Ni0.4O3 and LaNi0.6Co0.4O3 showed the longest electron lifetimes in the same series. All the electron dynamic decay curves can be well fitted by two consecutive first-order kinetics, indicating that the electrons exist in the form of two major populations. Electrons with a long lifetime are the rate-limiting species for the photocatalytic reaction and are related to the efficiency of the photocatalytic reduction of CO2 with H2O to produce CH4. In the photocatalyst, the longer the electron lifetime is, the stronger the electron de-trapping ability is, and the more effectively the electrons near the conduction band can react with the adsorbed material, the higher the photocatalytic efficiency will be. It is concluded that the lifetime of photogenerated electrons can be used as a new method to judge the catalytic efficiency for the photocatalytic reduction of CO2. This paper used TAS to describe the difference in the catalytic efficiencies for different perovskite catalysts and prove that long-lived photogenerated electrons are the key to determining the photocatalytic reduction of CO2 from a kinetics perspective. The rate-limiting step for the photochemical reduction of CO2 is shown to be the slow migration of electrons in the solution. This study provides a fast detection method and theoretical basis for the future research, design and development of high-performance catalysts.
Supplementary Materials
The following supporting information can be downloaded at: https://0-www-mdpi-com.brum.beds.ac.uk/article/10.3390/catal13030452/s1. Figure S1: The different concentrations of the decay curve in LaMn0.6Ni0.4O3; Figure S2: XRD patterns of perovskite (a) LCMO, (b) LMNO (c) and LNCO (x = 0, 0.2, 0.4, 0.6, 0.8 and 1.0); Figure S3: SEM images of LCMO powers synthesized by sol-gel combustion method at 700 °C for 7 h. (a) x = 0, (b) x = 0.2, (c) x = 0.4, (d) x = 0.6, (e) x = 0.8, (f) x = 1.0; Table S1: The BET analysis and CH4 yield of LCMO, LMNO and LNCO (x = 0, 0.2, 0.4, 0.6, 0.8 and 1.0); Figure S4: UV-vis diffuse reflectance spectra of the LCMO powders (x = 0, 0.2, 0.4, 0.6, 0.8 and 1.0); Figure S5: The energy gap of the LCMO powders (x = 0, 0.2, 0.4, 0.6, 0.8 and 1.0); Table S2: The Eg, CB, VB and CH4 yield of LCMO, LMNO and LNCO (x = 0, 0.2, 0.4, 0.6, 0.8 and 1.0); Figure S6: Mott–Schottky plots of LaNi0.4Mn0.6O3, LaCo0.6Mn0.4O3 and LaNi0.6Co0.4O3; Figure S7: The XPS spectra of (a) Co 2p, (b) Ni 2p, (c) Mn 2p (d) and O 1s of LCMO and LMNO; Figure S8: Two exponential decay function and fitting curve of LaCo0.6Mn0.4O3; Figure S9: The error of lifetime of LCMO, LMNO and LNCO.
Author Contributions
J.T.: framework, drafting and writing this article, graphical representation. L.L. and H.N.: writing—review and editing, supervision. Q.G., Z.Z. and N.S.: drafting, providing input for refining the paper and English editing. All authors have read and agreed to the published version of the manuscript.
Funding
This study was supported by the National Key R&D Program of China (No. 2021YFB3701501) and Shanghai Technical Service Center for Advanced Ceramics Structure Design and Precision Manufacturing (NO. 20DZ2294000).
Data Availability Statement
No applicable.
Conflicts of Interest
The authors declare no conflict of interest.
References
- Stolarczyk, J.K.; Bhattacharyya, S.; Polavarapu, L.; Feldmann, J. Challenges and Prospects in Solar Water Splitting and CO2 Reduction with Inorganic and Hybrid Nanostructures. ACS Catal. 2018, 8, 3602–3635. [Google Scholar] [CrossRef]
- Shi, R.; Waterhouse, G.I.N. Recent Progress in Photocatalytic CO2 Reduction Over Perovskite Oxides. Sol. RRL 2017, 1, 1700126. [Google Scholar] [CrossRef]
- Neaţu, Ş.; Maciá-Agulló, J.A.; Concepción, P.; Garcia, H. Gold–Copper Nanoalloys Supported on TiO2 as Photocatalysts for CO2 Reduction by Water. J. Am. Chem. Soc. 2014, 136, 15969–15976. [Google Scholar] [CrossRef]
- Abdullah, H.; Khan, M.M.R.; Ong, H.R.; Yaakob, Z. Modified TiO2 Photocatalyst for CO2 Photocatalytic Reduction: An Overview. J. CO2 Util. 2017, 22, 15–32. [Google Scholar] [CrossRef]
- Li, K.; Peng, B.; Peng, T. Recent Advances in Heterogeneous Photocatalytic CO2 Conversion to Solar Fuels. ACS Catal. 2016, 6, 7485–7527. [Google Scholar] [CrossRef]
- Zeng, S.; Kar, P.; Thakur, U.K.; Shankar, K. A Review on Photocatalytic CO2 Reduction Using Perovskite Oxide Nanomaterials. Nanotechnology 2018, 29, 052001. [Google Scholar] [CrossRef]
- Li, Y.; Wang, W.-N.; Zhan, Z.; Woo, M.-H.; Wu, C.-Y.; Biswas, P. Photocatalytic Reduction of CO2 with H2O on Mesoporous Silica Supported Cu/TiO2 Catalysts. Appl. Catal. B: Environ. 2010, 100, 386–392. [Google Scholar] [CrossRef]
- Ye, L.; Wu, D.; Chu, K.H.; Wang, B.; Xie, H.; Yip, H.Y.; Wong, P.K. Phosphorylation of G-C3N4 for Enhanced Photocatalytic CO2 Reduction. Chem. Eng. J. 2016, 304, 376–383. [Google Scholar] [CrossRef]
- Matsubara, Y.; Grills, D.C.; Kuwahara, Y. Thermodynamic Aspects of Electrocatalytic CO2 Reduction in Acetonitrile and with an Ionic Liquid as Solvent or Electrolyte. ACS Catal. 2015, 5, 6440–6452. [Google Scholar] [CrossRef]
- Izumi, Y. Recent Advances in the Photocatalytic Conversion of Carbon Dioxide to Fuels with Water and/or Hydrogen Using Solar Energy and Beyond. Coord. Chem. Rev. 2013, 257, 171–186. [Google Scholar] [CrossRef] [Green Version]
- Qian, R.; Zong, H.; Schneider, J.; Zhou, G.; Zhao, T.; Li, Y.; Yang, J.; Bahnemann, D.W.; Pan, J.H. Charge Carrier Trapping, Recombination and Transfer during TiO2 Photocatalysis: An Overview. Catal. Today 2019, 335, 78–90. [Google Scholar] [CrossRef]
- Zhu, H.; Zhang, P.; Dai, S. Recent Advances of Lanthanum-Based Perovskite Oxides for Catalysis. ACS Catal. 2015, 5, 6370–6385. [Google Scholar] [CrossRef]
- Yan, J.-Q.; Zhou, J.-S.; Goodenough, J.B. Ferromagnetism in LaCoO3. Phys. Rev. B 2004, 70, 014402. [Google Scholar] [CrossRef]
- Abdolrahmani, M.; Parvari, M.; Habibpoor, M. Effect of Copper Substitution and Preparation Methods on the LaMnO3±δ Structure and Catalysis of Methane Combustion and CO Oxidation. Chin. J. Catal. 2010, 31, 394–403. [Google Scholar] [CrossRef]
- Dhinesh Kumar, R.; Thangappan, R.; Jayavel, R. Enhanced Visible Light Photocatalytic Activity of LaMnO3 Nanostructures for Water Purification. Res. Chem. Intermed. 2018, 44, 4323–4337. [Google Scholar] [CrossRef]
- Gao, J.; Jia, L.; Fang, W.; Li, Q.; Song, H. Methanation of Carbon Dioxide over the LaNiO3 Perovskite Catalysts Activated under the Reactant Stream. J. Fuel Chem. Technol. 2009, 37, 573–577. [Google Scholar] [CrossRef]
- Xie, K.; Umezawa, N.; Zhang, N.; Reunchan, P.; Zhang, Y.; Ye, J. Self-Doped SrTiO3−δ Photocatalyst with Enhanced Activity for Artificial Photosynthesis under Visible Light. Energy Environ. Sci. 2011, 4, 4211–4219. [Google Scholar] [CrossRef]
- Xu, L.; Ha, M.N.; Guo, Q.; Wang, L.; Ren, Y.; Sha, N.; Zhao, Z. Photothermal Catalytic Activity of Combustion Synthesized LaCoxFe1−xO3 (0 ≤ x ≤ 1) Perovskite for CO2 Reduction with H2O to CH4 and CH3OH. RSC Adv. 2017, 7, 45949–45959. [Google Scholar] [CrossRef] [Green Version]
- Zheng, D.; Wei, G.; Xu, L.; Guo, Q.; Hu, J.; Sha, N.; Zhao, Z. LaNixFe1−xO3 (0 ≤ x ≤1) as Photothermal Catalysts for Hydrocarbon Fuels Production from CO2 and H2O. J. Photochem. Photobiol. A Chem. 2019, 377, 182–189. [Google Scholar] [CrossRef]
- Wei, G.; Zheng, D.; Xu, L.; Guo, Q.; Hu, J.; Sha, N.; Zhao, Z. Photothermal Catalytic Activity and Mechanism of LaNixCo1−xO3 (0 ≦ x ≦ 1) Perovskites for CO2 Reduction to CH4 and CH3OH with H2O. Mater. Res. Express 2019, 6, 086221. [Google Scholar] [CrossRef]
- Ha, M.N.; Lu, G.; Liu, Z.; Wang, L.; Zhao, Z. 3DOM-LaSrCoFeO6−δ as a Highly Active Catalyst for the Thermal and Photothermal Reduction of CO2 with H2O to CH4. J. Mater. Chem. A 2016, 4, 13155–13165. [Google Scholar] [CrossRef]
- Xie, S.; Zhang, Q.; Liu, G.; Wang, Y. Photocatalytic and Photoelectrocatalytic Reduction of CO2 Using Heterogeneous Catalysts with Controlled Nanostructures. Chem. Commun. 2016, 52, 35–59. [Google Scholar] [CrossRef] [PubMed]
- Chang, X.; Wang, T.; Gong, J. CO2 Photo-Reduction: Insights into CO2 Activation and Reaction on Surfaces of Photocatalysts. Energy Environ. Sci. 2016, 9, 2177–2196. [Google Scholar] [CrossRef]
- Habisreutinger, S.N.; Schmidt-Mende, L.; Stolarczyk, J.K. Photocatalytic Reduction of CO2 on TiO2 and Other Semiconductors. Angew. Chem. Int. Ed. 2013, 52, 7372–7408. [Google Scholar] [CrossRef]
- Iwata, K.; Takaya, T.; Hamaguchi, H.; Yamakata, A.; Ishibashi, T.; Onishi, H.; Kuroda, H. Carrier Dynamics in TiO2 and Pt/TiO2 Powders Observed by Femtosecond Time-Resolved Near-Infrared Spectroscopy at a Spectral Region of 0.9–1.5 μm with the Direct Absorption Method. J. Phys. Chem. B 2004, 108, 20233–20239. [Google Scholar] [CrossRef]
- Cowan, A.J.; Barnett, C.J.; Pendlebury, S.R.; Barroso, M.; Sivula, K.; Grätzel, M.; Durrant, J.R.; Klug, D.R. Activation Energies for the Rate-Limiting Step in Water Photooxidation by Nanostructured α-Fe2O3 and TiO2. J. Am. Chem. Soc. 2011, 133, 10134–10140. [Google Scholar] [CrossRef]
- Cowan, A.J.; Tang, J.; Leng, W.; Durrant, J.R.; Klug, D.R. Water Splitting by Nanocrystalline TiO2 in a Complete Photoelectrochemical Cell Exhibits Efficiencies Limited by Charge Recombination. J. Phys. Chem. C 2010, 114, 4208–4214. [Google Scholar] [CrossRef]
- Tang, J.; Durrant, J.R.; Klug, D.R. Mechanism of Photocatalytic Water Splitting in TiO2. Reaction of Water with Photoholes, Importance of Charge Carrier Dynamics, and Evidence for Four-Hole Chemistry. J. Am. Chem. Soc. 2008, 130, 13885–13891. [Google Scholar] [CrossRef]
- Tang, J.; Cowan, A.J.; Durrant, J.R.; Klug, D.R. Mechanism of O2 Production from Water Splitting: Nature of Charge Carriers in Nitrogen Doped Nanocrystalline TiO2 Films and Factors Limiting O2 Production. J. Phys. Chem. C 2011, 115, 3143–3150. [Google Scholar] [CrossRef]
- Pesci, F.M.; Cowan, A.J.; Alexander, B.D.; Durrant, J.R.; Klug, D.R. Charge Carrier Dynamics on Mesoporous WO3 during Water Splitting. J. Phys. Chem. Lett. 2011, 2, 1900–1903. [Google Scholar] [CrossRef]
- Sachs, M.; Pastor, E.; Kafizas, A.; Durrant, J.R. Evaluation of Surface State Mediated Charge Recombination in Anatase and Rutile TiO2. J. Phys. Chem. Lett. 2016, 7, 3742–3746. [Google Scholar] [CrossRef] [Green Version]
- Vasileff, A.; Xu, C.; Jiao, Y.; Zheng, Y.; Qiao, S.-Z. Surface and Interface Engineering in Copper-Based Bimetallic Materials for Selective CO2 Electroreduction. Chem 2018, 4, 1809–1831. [Google Scholar] [CrossRef] [Green Version]
- Chen, H.; Lim, C.; Zhou, M.; He, Z.; Sun, X.; Li, X.; Ye, Y.; Tan, T.; Zhang, H.; Yang, C.; et al. Activating Lattice Oxygen in Perovskite Oxide by B-Site Cation Doping for Modulated Stability and Activity at Elevated Temperatures. Adv. Sci. 2021, 8, 2102713. [Google Scholar] [CrossRef]
- Kim, B.-J.; Fabbri, E.; Abbott, D.F.; Cheng, X.; Clark, A.H.; Nachtegaal, M.; Borlaf, M.; Castelli, I.E.; Graule, T.; Schmidt, T.J. Functional Role of Fe-Doping in Co-Based Perovskite Oxide Catalysts for Oxygen Evolution Reaction. J. Am. Chem. Soc. 2019, 141, 5231–5240. [Google Scholar] [CrossRef] [Green Version]
- Usubharatana, P.; McMartin, D.; Veawab, A.; Tontiwachwuthikul, P. Photocatalytic Process for CO2 Emission Reduction from Industrial Flue Gas Streams. Ind. Eng. Chem. Res. 2006, 45, 2558–2568. [Google Scholar] [CrossRef]
- Tamaki, Y.; Furube, A.; Murai, M.; Hara, K.; Katoh, R.; Tachiya, M. Direct Observation of Reactive Trapped Holes in TiO2 Undergoing Photocatalytic Oxidation of Adsorbed Alcohols: Evaluation of the Reaction Rates and Yields. J. Am. Chem. Soc. 2006, 128, 416–417. [Google Scholar] [CrossRef] [PubMed]
- Baldoví, H.G.; Neaţu, Ş.; Khan, A.; Asiri, A.M.; Kosa, S.A.; Garcia, H. Understanding the Origin of the Photocatalytic CO2 Reduction by Au- and Cu-Loaded TiO2: A Microsecond Transient Absorption Spectroscopy Study. J. Phys. Chem. C 2015, 119, 6819–6827. [Google Scholar] [CrossRef]
- Katoh, R.; Murai, M.; Furube, A. Transient Absorption Spectra of Nanocrystalline TiO2 Films at High Excitation Density. Chem. Phys. Lett. 2010, 500, 309–312. [Google Scholar] [CrossRef]
- Bahnemann, D.W.; Hilgendorff, M.; Memming, R. Charge Carrier Dynamics at TiO2 Particles: Reactivity of Free and Trapped Holes. J. Phys. Chem. B 1997, 101, 4265–4275. [Google Scholar] [CrossRef]
- Baldoví, H.G.; Ferrer, B.; Álvaro, M.; García, H. Microsecond Transient Absorption Spectra of Suspended Semiconducting Metal Oxide Nanoparticles. J. Phys. Chem. C 2014, 118, 9275–9282. [Google Scholar] [CrossRef]
- Yoshihara, T.; Katoh, R.; Furube, A.; Tamaki, Y.; Murai, M.; Hara, K.; Murata, S.; Arakawa, H.; Tachiya, M. Identification of Reactive Species in Photoexcited Nanocrystalline TiO2 Films by Wide-Wavelength-Range (400–2500 nm) Transient Absorption Spectroscopy. J. Phys. Chem. B 2004, 108, 3817–3823. [Google Scholar] [CrossRef]
- Ma, Y.; Pendlebury, S.R.; Reynal, A.; Le Formal, F.; Durrant, J.R. Dynamics of Photogenerated Holes in Undoped BiVO4 Photoanodes for Solar Water Oxidation. Chem. Sci. 2014, 5, 2964–2973. [Google Scholar] [CrossRef] [Green Version]
- Le Formal, F.; Pendlebury, S.R.; Cornuz, M.; Tilley, S.D.; Grätzel, M.; Durrant, J.R. Back Electron–Hole Recombination in Hematite Photoanodes for Water Splitting. J. Am. Chem. Soc. 2014, 136, 2564–2574. [Google Scholar] [CrossRef] [PubMed]
- Shirai, K.; Fazio, G.; Sugimoto, T.; Selli, D.; Ferraro, L.; Watanabe, K.; Haruta, M.; Ohtani, B.; Kurata, H.; Di Valentin, C.; et al. Water-Assisted Hole Trapping at the Highly Curved Surface of Nano-TiO2 Photocatalyst. J. Am. Chem. Soc. 2018, 140, 1415–1422. [Google Scholar] [CrossRef] [PubMed] [Green Version]
- Khan, M.A.; Maity, P.; Al-Oufi, M.; Al-Howaish, I.K.; Idriss, H. Electron Transfer of the Metal/Semiconductor System in Photocatalysis. J. Phys. Chem. C 2018, 122, 16779–16787. [Google Scholar] [CrossRef]
- Mishra, A.; Bhattacharjee, S. Effect of A- or B-Site Doping of Perovskite Calcium Manganite on Structure, Resistivity, and Thermoelectric Properties. J. Am. Ceram. Soc. 2017, 100, 4945–4953. [Google Scholar] [CrossRef]
- Kobosko, S.M.; DuBose, J.T.; Kamat, P.V. Perovskite Photocatalysis. Methyl Viologen Induces Unusually Long-Lived Charge Carrier Separation in CsPbBr3 Nanocrystals. ACS Energy Lett. 2020, 5, 221–223. [Google Scholar] [CrossRef] [Green Version]
- Lai, T.-H.; Katsumata, K.; Hsu, Y.-J. In Situ Charge Carrier Dynamics of Semiconductor Nanostructures for Advanced Photoelectrochemical and Photocatalytic Applications. Nanophotonics 2020, 10, 777–795. [Google Scholar] [CrossRef]
- Pendlebury, S.R.; Wang, X.; Le Formal, F.; Cornuz, M.; Kafizas, A.; Tilley, S.D.; Grätzel, M.; Durrant, J.R. Ultrafast Charge Carrier Recombination and Trapping in Hematite Photoanodes under Applied Bias. J. Am. Chem. Soc. 2014, 136, 9854–9857. [Google Scholar] [CrossRef] [Green Version]
- Bhosale, S.S.; Kharade, A.K.; Jokar, E.; Fathi, A.; Chang, S.; Diau, E.W.-G. Mechanism of Photocatalytic CO2 Reduction by Bismuth-Based Perovskite Nanocrystals at the Gas–Solid Interface. J. Am. Chem. Soc. 2019, 141, 20434–20442. [Google Scholar] [CrossRef]
- Hung, P.-H.; Vequizo, J.J.M.; Wu, R.-A.; Yamakata, A.; Tseng, W.J. Effect of CuFe2O4 Ferrite on Photocatalysis and Carrier Dynamics of Electrospun α-Fe2O3 Nanofibers by Time-Resolved Transient Absorption Spectroscopy. Ceram. Int. 2019, 45, 15676–15680. [Google Scholar] [CrossRef]
- Baiyee, Z.M.; Chen, C.; Ciucci, F. A DFT+U Study of A-Site and B-Site Substitution in BaFeO3−δ. Phys. Chem. Chem. Phys. 2015, 17, 23511–23520. [Google Scholar] [CrossRef]
- Alay-e-Abbas, S.M.; Javed, F.; Abbas, G.; Amin, N.; Laref, A. Density Functional Theory Evaluation of Ceramics Suitable for Hybrid Advanced Oxidation Processes: A Case Study for Ce4+-Doped BaZrO3. J. Phys. Chem. C 2019, 123, 6044–6053. [Google Scholar] [CrossRef]
- Phanichphant, S.; Nakaruk, A.; Chansaenpak, K.; Channei, D. Evaluating the Photocatalytic Efficiency of the BiVO4/RGO Photocatalyst. Sci. Rep. 2019, 9, 16091. [Google Scholar] [CrossRef] [Green Version]
- Wang, L.; Wang, Y.; Cheng, Y.; Liu, Z.; Guo, Q.; Ha, M.N.; Zhao, Z. Hydrogen-Treated Mesoporous WO3 as a Reducing Agent of CO2 to Fuels (CH4 and CH3OH) with Enhanced Photothermal Catalytic Performance. J. Mater. Chem. A 2016, 4, 5314–5322. [Google Scholar] [CrossRef]
Figure 1.
The first hour of CH4 yield of LaCoxMn1−xO3, LaMnxNi1−xO3 and LaNixCo1−xO3 (x = 0, 0.2, 0.4, 0.6, 0.8 and 1.0).
Figure 1.
The first hour of CH4 yield of LaCoxMn1−xO3, LaMnxNi1−xO3 and LaNixCo1−xO3 (x = 0, 0.2, 0.4, 0.6, 0.8 and 1.0).

Figure 2.
TAS spectrum recorded in the presence of CH3OH as holes scavenger of LaMn0.6Ni0.4O3.

Figure 3.
Temporal profiles of transient absorption spectrum on LaMn0.6Ni0.4O3 observed at 480, 520 and 800 nm suspended in CH3OH.
Figure 3.
Temporal profiles of transient absorption spectrum on LaMn0.6Ni0.4O3 observed at 480, 520 and 800 nm suspended in CH3OH.

Figure 4.
(a) Temporal profiles of transient absorption spectrum on LaMn0.6Ni0.4O3 observed at 520 nm at 2.40, 1.97, 1.60 and 1.29 mJ suspended in CH3OH; inset shows the absorption intensity at 520 nm as a function of excitation intensity. (b) Normalized profiles at time zero.
Figure 4.
(a) Temporal profiles of transient absorption spectrum on LaMn0.6Ni0.4O3 observed at 520 nm at 2.40, 1.97, 1.60 and 1.29 mJ suspended in CH3OH; inset shows the absorption intensity at 520 nm as a function of excitation intensity. (b) Normalized profiles at time zero.

Figure 5.
Temporal profiles of transient absorption spectrum in the present (red line) and absence of quencher (blue line).
Figure 5.
Temporal profiles of transient absorption spectrum in the present (red line) and absence of quencher (blue line).

Figure 6.
The TAS decay trace recorded following the UV excitation (1.29 mJ, 355 nm, 10 HZ) of (a) LaCoxMn1−xO3, (b) LaMnxNi1−xO3 (c) and LaNixCo1−xO3 (x = 0, 0.2, 0.4, 0.6, 0.8 and 1.0) in the presence of a chemical scavenger (CH3OH).
Figure 6.
The TAS decay trace recorded following the UV excitation (1.29 mJ, 355 nm, 10 HZ) of (a) LaCoxMn1−xO3, (b) LaMnxNi1−xO3 (c) and LaNixCo1−xO3 (x = 0, 0.2, 0.4, 0.6, 0.8 and 1.0) in the presence of a chemical scavenger (CH3OH).

Figure 7.
CH4 yield corresponding to long electron lifetime τ2.

Figure 8.
Photoluminescence spectra of LaMn0.6Ni0.4O3, LaCo0.6Mn0.4O3 and LaNi0.6Co0.4O3.


Table 1.
The lifetime of LaCoxMn1−xO3, LaMnxNi1−xO3 and LaNixCo1−xO3 (x = 0, 0.2, 0.4, 0.6, 0.8 and 1.0).
Table 1.
The lifetime of LaCoxMn1−xO3, LaMnxNi1−xO3 and LaNixCo1−xO3 (x = 0, 0.2, 0.4, 0.6, 0.8 and 1.0).
| Catalysts | τ1 (ns) | τ2 (ns) |
|---|---|---|
| LaCoO3 | 70 | 560 |
| LaCo0.2Mn0.8O3 | 105 | 958 |
| LaCo0.4Mn0.6O3 | 104 | 1030 |
| LaCo0.6Mn0.4O3 | 107 | 1085 |
| LaCo0.8Mn0.2O3 | 159 | 810 |
| LaMnO3 | 72 | 929 |
| LaMn0.2Ni0.8O3 | 106 | 943 |
| LaMn0.4Ni0.6O3 | 103 | 1005 |
| LaMn0.6Ni0.4O3 | 95 | 1884 |
| LaMn0.8Ni0.2O3 | 121 | 900 |
| LaNiO3 | 83 | 383 |
| LaNi0.2Co0.8O3 | 89 | 573 |
| LaNi0.4Co0.6O3 | 101 | 532 |
| LaNi0.6Co0.4O3 | 96 | 980 |
| LaNi0.8Co0.2O3 | 92 | 956 |
Disclaimer/Publisher’s Note: The statements, opinions and data contained in all publications are solely those of the individual author(s) and contributor(s) and not of MDPI and/or the editor(s). MDPI and/or the editor(s) disclaim responsibility for any injury to people or property resulting from any ideas, methods, instructions or products referred to in the content. |
© 2023 by the authors. Licensee MDPI, Basel, Switzerland. This article is an open access article distributed under the terms and conditions of the Creative Commons Attribution (CC BY) license (https://creativecommons.org/licenses/by/4.0/).
Share and Cite
MDPI and ACS Style
Tian, J.; Liu, L.; Nian, H.; Guo, Q.; Sha, N.; Zhao, Z. Transient Absorption Spectrum Analysis for Photothermal Catalysis Perovskite Materials. Catalysts 2023, 13, 452. https://0-doi-org.brum.beds.ac.uk/10.3390/catal13030452
AMA Style
Tian J, Liu L, Nian H, Guo Q, Sha N, Zhao Z. Transient Absorption Spectrum Analysis for Photothermal Catalysis Perovskite Materials. Catalysts. 2023; 13(3):452. https://0-doi-org.brum.beds.ac.uk/10.3390/catal13030452
Chicago/Turabian StyleTian, Jindan, Lili Liu, Hongqiang Nian, Qiangsheng Guo, Na Sha, and Zhe Zhao. 2023. "Transient Absorption Spectrum Analysis for Photothermal Catalysis Perovskite Materials" Catalysts 13, no. 3: 452. https://0-doi-org.brum.beds.ac.uk/10.3390/catal13030452
Note that from the first issue of 2016, this journal uses article numbers instead of page numbers. See further details here.