Article

Effect of C3-Alcohol Impurities on Alumina-Catalyzed Bioethanol Dehydration to Ethylene: Experimental Study and Reactor Modeling

by
Elena V. Ovchinnikova
*,
Sardana P. Banzaraktsaeva
,
Maria A. Kovgan
and
Victor A. Chumachenko
Boreskov Institute of Catalysis SB-RAS, 5, Lavrentiev Ave., Novosibirsk 630090, Russia
*
Author to whom correspondence should be addressed.
Submission received: 20 January 2023 / Revised: 17 February 2023 / Accepted: 23 February 2023 / Published: 1 March 2023
(This article belongs to the Special Issue Mechanism/Kinetic Modeling Study of Catalytic Reactions)

Abstract

:
The impact of feedstock impurities on catalytic process is among the crucial issues for processing real raw materials. A real and model 92%-bioethanol contaminated with 0.03–0.3% mol 1-propanol or 2-propanol were used to make ethylene on a proprietary alumina catalyst in isothermal flow reactor. We proposed a formal kinetic model to describe the impure bioethanol conversion to ethylene and byproducts and used it to evaluate the multi-tubular reactor (MTR) for 60 KTPA ethylene production. The simulated data agree well with experimental results. Under reaction-controlled conditions, C3-alcohols strongly suppress the formation of by-products and ethylene-from-ethanol, and slightly inhibit the formation of ethylene-via-ether. It is the suppression of the ethylene-via-ether route that causes a decrease in ethanol conversion. The predominant formation of ethylene-via-ether results in an increased ethylene yield but doubling the catalyst load is required to achieve conversion as for pure feedstock. 2-Propanol has a stronger effect on dehydration than 1-propanol. Diffusion inside the grain’s levels out the effect of C3-alcohols on the process in MTR, giving an ethylene yield as high as ~98% while dehydrating a contaminated 92% ethanol. However, impurities dilute ethanol and generate propylene (which contaminates target product), and these worsen feedstock consumption and ethylene productivity in MTR.

Graphical Abstract

1. Introduction

Bioethanol produced from a non-food phytogenic feedstock can be used to manufacture ethylene as a platform product for a great number of downstream derivatives [1,2,3]. More specifically, polyethylene [1,2,3,4], carbon nanotubes [5,6,7], multi-walled carbon nanotubes [8,9], ethylene oxide [10], and others can be obtained from bioethylene. The impact of impurities on the catalytic process is one of the crucial issues in catalytic technologies for processing real feedstock [11]. Once distilled, bioethanol contains various organic impurities, mostly fusel oil (propanol, butanol, pentanol, etc.) [11,12], which can adversely affect its further processing. In particular, 2G bioethanol derived from oat hulls [13,14] and Miscanthus [12,15] is contaminated with C3-alcohols in excess of 60% of the total fusel oil impurities. The effect of ethanol impurities has been widely discussed in relation to the steam reforming of ethanol into hydrogen [11,16,17,18,19]. It was shown in [16,17] that C3-alcohols of 1% mol reduce the feedstock conversion in ethanol steam reforming over alumina-based catalysts. Studies on the impact of ethanol impurities on ethylene production are very scarce. When evaluating the process of ethylene production from ethanol contaminated with organic impurities up to ~1% wt., Mohsenzadeh et al. [20] showed that impurities have no effect on the ethylene quality when the technology provides for conventional ethylene purification stages. However, this estimation did not address the impact of impurities on the activity and selectivity of the ethanol dehydration catalyst. In testing, ethylene produced from a real 2G bioethanol contained less than 0.5 g/L (~0.05% mol) organic impurities [12], and a slight increase in ethylene selectivity due to suppression of byproducts formation without loss in catalyst activity was observed; however, no systematic study was carried out. The effect of 2-propanol (i-PrOH) impurity on ethylene production over an alumina catalyst was examined by varying the concentration and temperature [15], but no kinetic model was suggested.
Kinetic models with different levels of detail are used to describe catalytic processes of ethanol to ethylene dehydration (EtOH-to-C2). Detailed kinetic models that consider the inhibitory actions of water and ethanol as the main components of the reaction feedstock are discussed in [21,22,23,24]. Kagyrmanova et al. [25] employed semi-empirical power-law equations for product formation rates and showed a good agreement between the pilot-scale experiments and predicted data, which were used to simulate a commercial multi-tubular ethanol dehydration reactor. When modelling the ethanol dehydration, the formation routes of the target ethylene C2 (1) and intermediate diethyl ether DEE (2–3) products are traditionally factored in, while for byproducts, only the formation of butylene C4 (5) [26] or C4 and acetaldehyde AA (4) [25,27] is considered. Other studies additionally take into account the formation of COx from EtOH [28] and ethane from C2 [29].
C2H5OH ⇒ C2H4 + H2O
2C2H5OH ⇒ C4H10O + H2O
C4H10O ⇒ 2 C2H4 + H2O
C2H5OH ⇒ C2H4O + H2
2C2H4 ⇒ C4H8
A pilot study [21] demonstrated that C4 could come from both C2 (5) and DEE (6). In [21], ethane was observed among the EtOH-to-C2 dehydration byproducts at high conversions, while the AA selectivity declined due to the Cox formation, as ethanol conversion rose above 98%. Thus, we can assume that the formation of Cox from AA is the main route (7). After removal of liquid reaction products (alcohols, aldehydes, esters), ethane remains one of the main gas products in dry-ethylene, which affects its quality [21]. Therefore, it is necessary to consider formation of ethane from C2 by Reaction (8).
C4H10O ⇒ C4H8 + H2O
C2H4O +3H2O ⇒ 2CO2 +5H2
C2H4 +H2 ⇒ C2H6
Propylene is the main product of i-PrOH dehydration (9) [15,30,31,32].
C3H7OH ⇒ C3H6 + H2O
Diisopropyl ether is another product of i-PrOH dehydration; it was observed at temperatures below 300 °C [30,31,32]. However, in EtOH to C2 dehydration performed at temperatures above 350 °C, conversion of C3-alcohols impurities leads to the formation of propylene only; other reaction products were not observed [15].
In the present work, we experimentally studied the impact of C3-alcohols impurities on ethanol dehydration to ethylene, as well as on the catalytic activity of a proprietary alumina catalyst [21]. To the best of our knowledge, an advanced kinetic model of dehydration of contaminated ethanol into ethylene, which takes into account the influence of C3-alcohols impurities on the formation of the target product, byproducts, and secondary reaction products, was first proposed. Mathematical simulation using the kinetic model allowed a preliminary assessment of the effect of impurities on ethylene production in a multi-tubular reactor (MTR).

2. Results

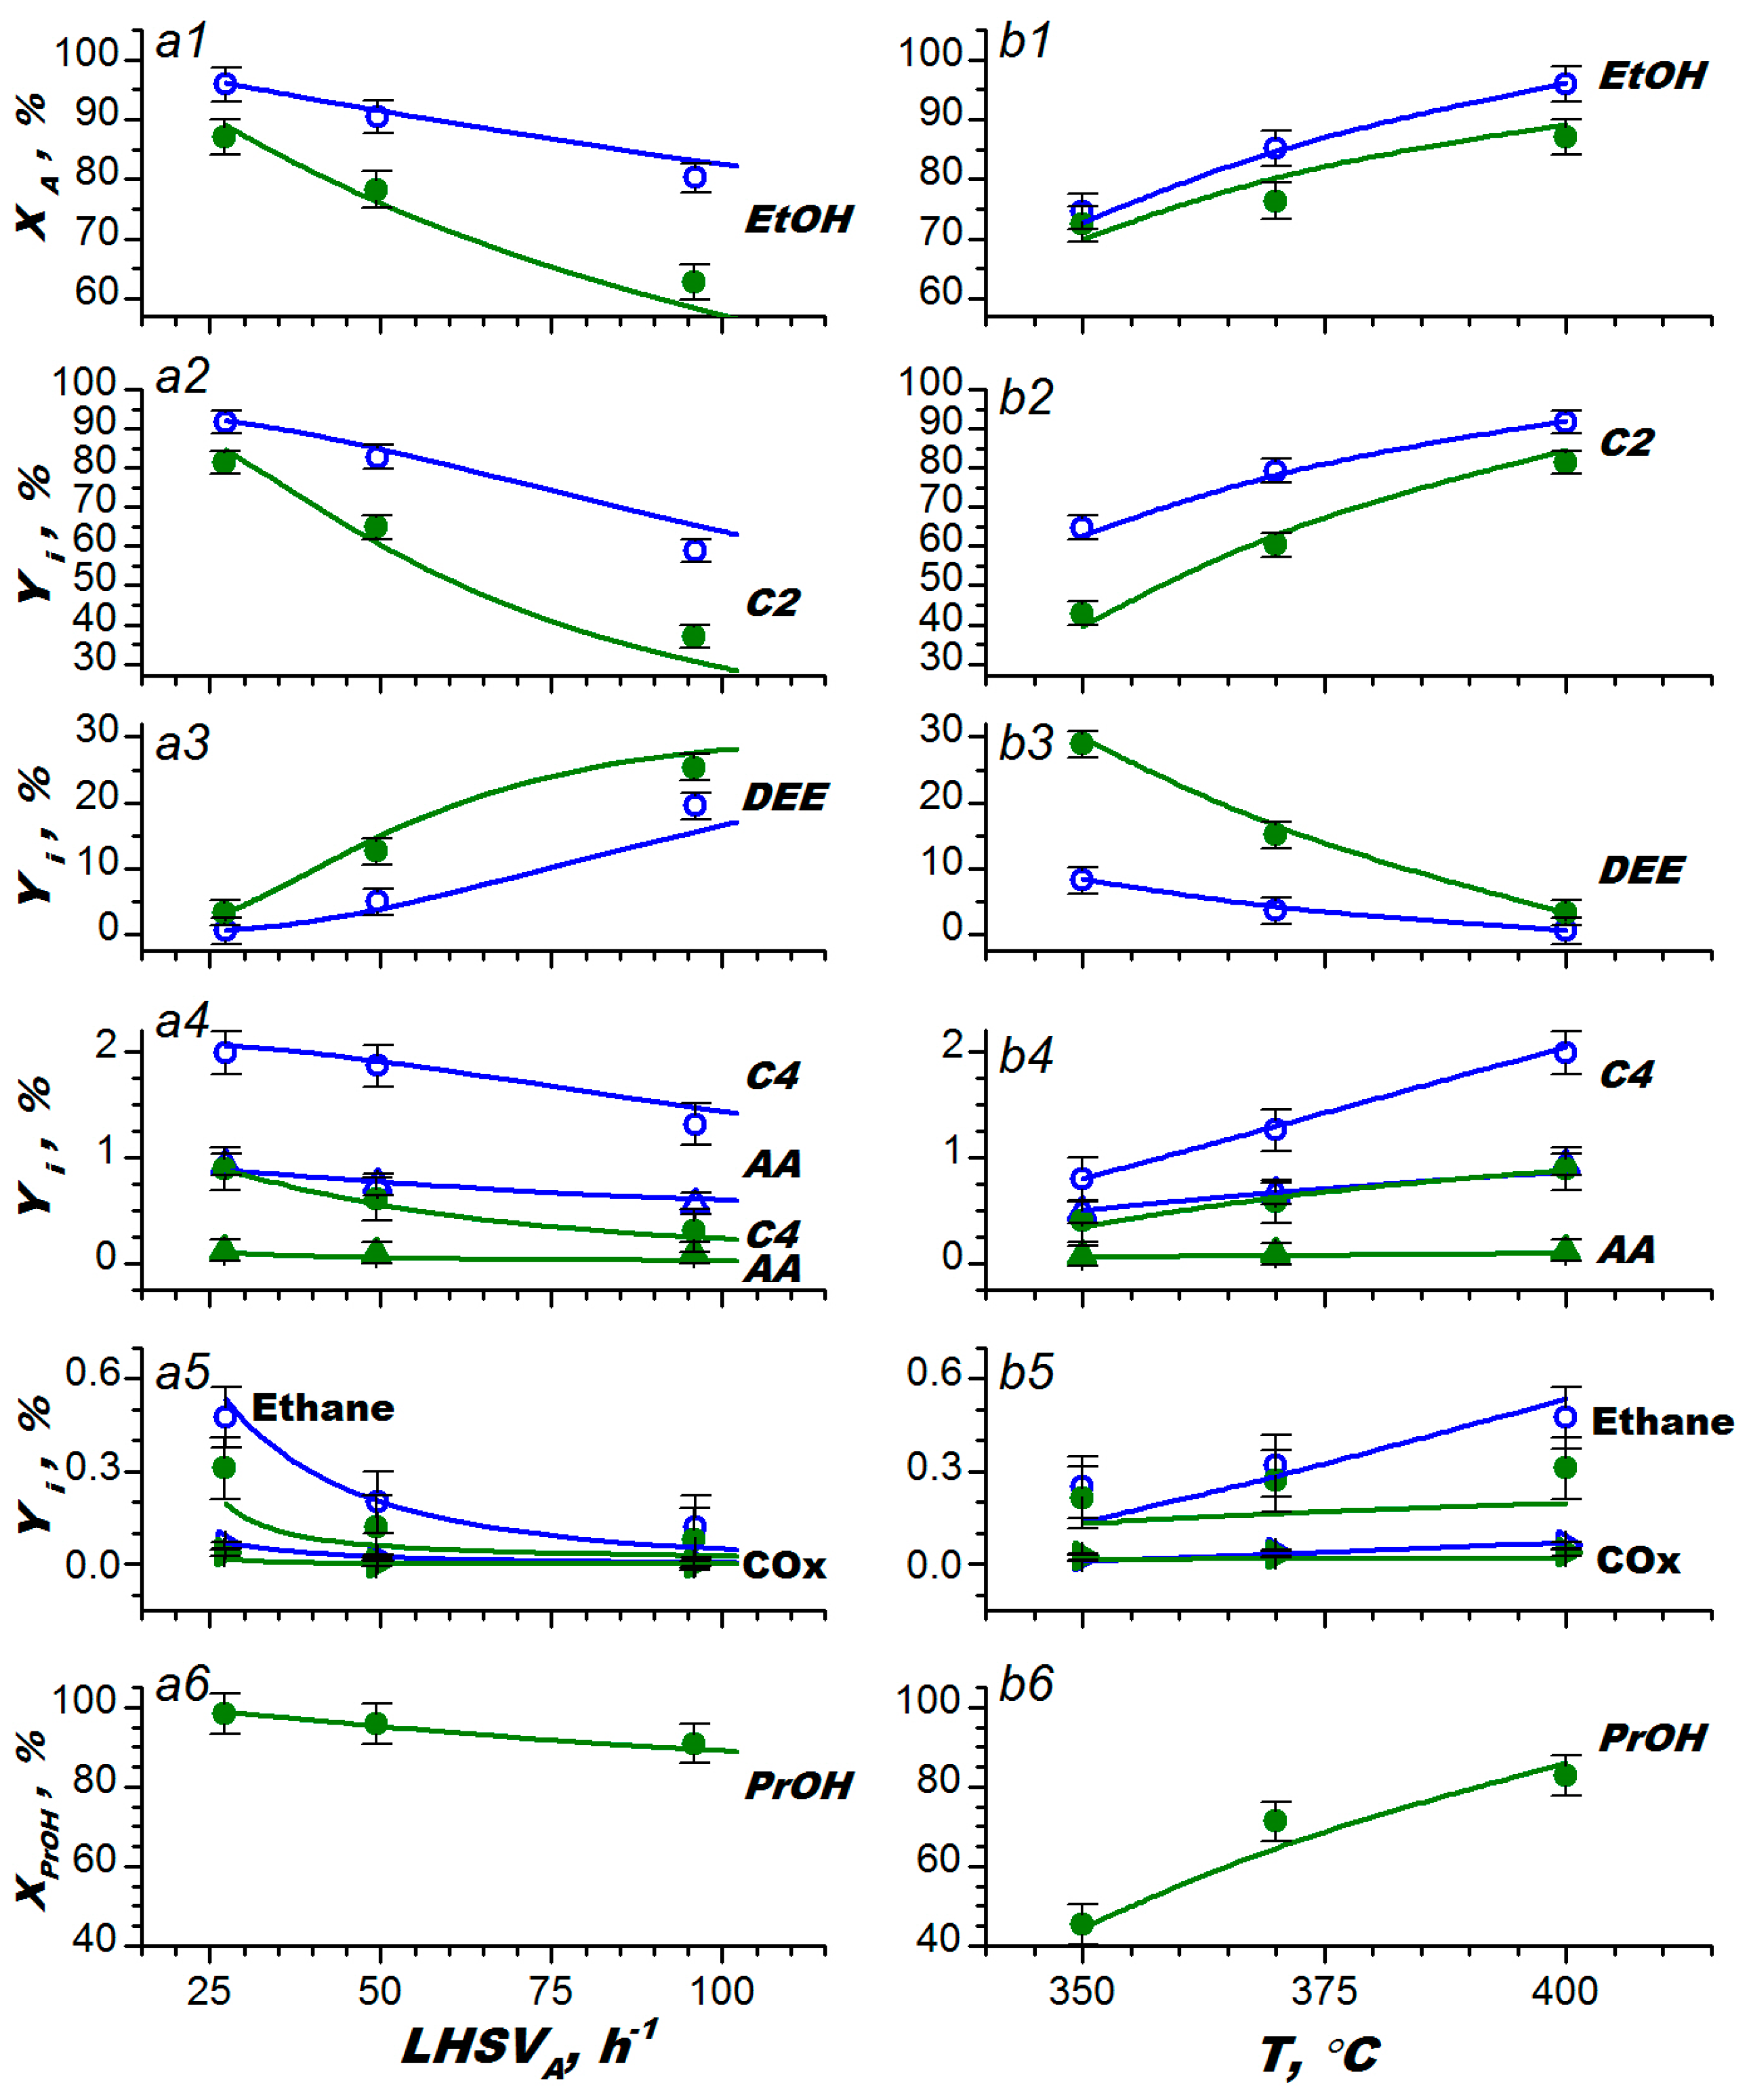
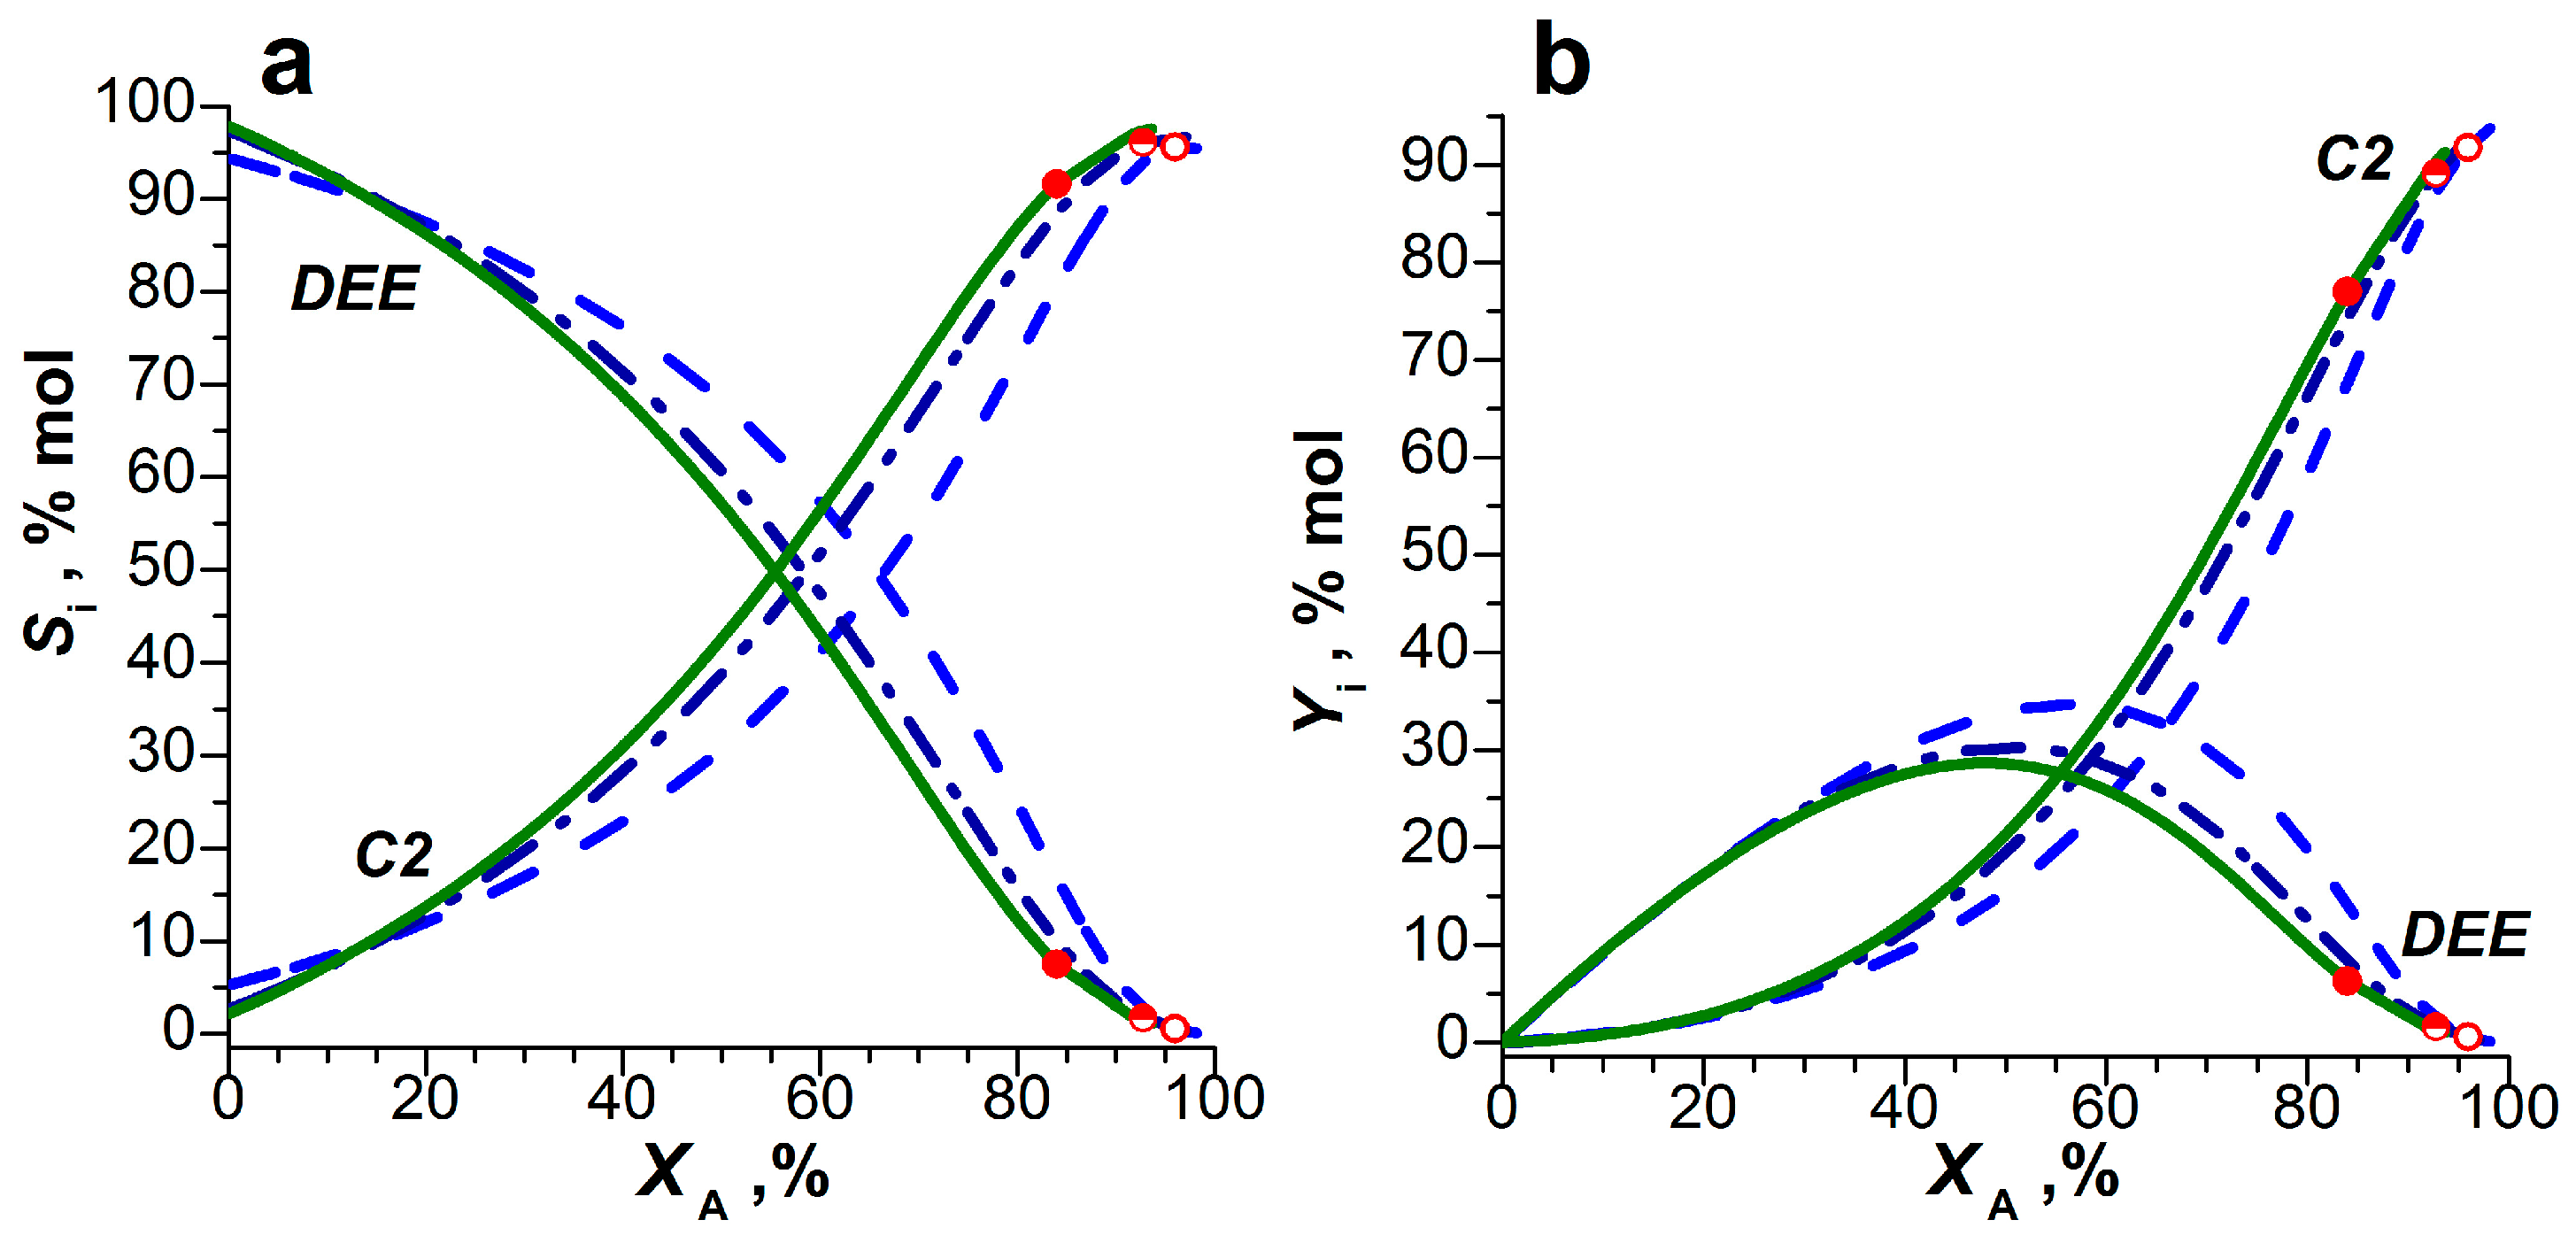
2.1. Experimental Results

Figure 1 and Figure 2 show the results of an experimental study of the effect of C3-alcohols impurities on ethanol conversion X A and products yield Y i in the isothermal reactor by varying the temperature, anhydrous ethanol loading L H S V A , and concentration of n-PrOH and i-PrOH under the reaction-controlled conditions. The Nomenclature is given in Appendix A.
In dehydration of both pure (m0) and contaminated with C3-alcohols (m1m4) ethanol at 350–400 °C and L H S V A of 96–27 h–1, ethylene was the main product; its yield Y C 2 reached 37–94% mol with X A of 63–96% (Figure 1 and Figure 2), yields of byproducts C4, AA, ethane, COx were 0.3–2%, 0.03–1%, 0.2–0.6%, and 0.001–0.06% mol, respectively. C3-alcohol conversion ( X P r O H ) was 22–99% (Figure 1 and Figure 2). In the dehydration of C3-alcohols, no products, except for propylene, were observed; therefore, the conversion X P r O H was equal to the propylene yield Y C 3 .
When pure ethanol m0 was dehydrated at 400 °C, with an increase in L H S V A from 27 to 96 h–1 (Figure 1a), the Y C 2 dropped by 36% mol with a 17% decrease in X A , mainly due to a ~20% increase in Y D E E ; the total yield of byproducts (C4, AA, ethane, COx) decreased by 1.5% mol. This indicates a parallel-consecutive scheme of C2 formation through DEE as an intermediate (1–3), i.e., routes of products formation directly from EtOH (1,2) dominate at lower X A , and route of C2 formation from DEE (3) dominates at higher X A .
Ethanol m3 contaminated with n-PrOH of 0.27% gave the total yield of byproducts 2.5–5 times lower than that for m0, as shown in Figure 1(a4,a5). At higher X A ( L H S V A ~27 h–1), this impurity reduced Y C 2 and X A by 10% mol and increased Y D E E by 4% mol (Figure 1(a1–a3)) compared to m0. Meanwhile, at lower X A ( L H S V A ~96 h–1), the impurity reduced Y C 2 and X A by 20% and kept ~4% mol increase for Y D E E . As L H S V A increased, the conversion of impurity X P r O H decreased by ~7% (Figure 1(a6)). Given the parallel-consecutive scheme of products formation, the observed difference in the product yields at lower and higher X A may be related to the inhibitory effect of impurity on the direct routes of the products formation from EtOH (1). The slight change in Y D E E with the significant decline in X A may be due to impurity inhibition of the DEE consumption routes (3,6).
When we reduced the temperature by 50 °C at L H S V A ~27 h–1 for m0 (Figure 1b), the values of X A and Y C 2 decreased by 20% and 27% mol, respectively, while Y D E E rose by ~7% mol (Figure 1(b1–b3)); the total yield of byproducts decreased by 2% mol (Figure 1(b4,b5)). Thus, the temperature favors the yield of C2 rather than byproducts. Compared to m0, impurity of n-PrOH (m3) made an observed decrease in X A and byproduct yields had a less steep temperature (Figure 1(b1,b4,b5)), and the decrease in Y C 2 and Y D E E was steeper (Figure 1(b2,b3)). This indicates that impurity of n-PrOH changes the temperature dependencies of the product formation rates and suppresses the EtOH consumption into C2 and DEE (1,2), and the DEE consumption into C2 (3). As the temperature was reduced, the X P r O H decreased by ~35% (Figure 1(b6)).
With the increase in n-PrOH and i-PrOH concentration (Figure 2(a6,b6)), C3-alcohols conversion X P r O H declined by 1–9%. The highest content of byproducts was observed in the dehydration of pure ethanol: the yield of butylene was as high as 2% mol (Figure 2(a4,b4)), while the yields of AA (Figure 2(a2,b2)), ethane, and COX (Figure 2(a5,b5)) were as high as ~1, ~0.5, and ~0.06% mol, respectively. When dehydrating ethanol was contaminated with n-PrOH or i-PrOH, the total yield of byproducts was as low as ~0.7 or ~0.5% mol, respectively; this quality of ethylene was achieved at the highest concentration of C3-alcohols and the lowest temperature.
A 10-fold increase in impurity content, from 0.03 to 0.3% mol, reduces the yield of C2 and byproducts (C4, ethane, COx) by an average of ~1.4 and ~2.4 times, respectively, while the AA yield drops by ~7 times (Figure 2). However, at 400 °C, within the C3-alcohol concentration range of 0.05–0.1% mol, the highest values of X A (96.2 and 95.1%) and Y C 2 (94 and 92%) were observed (for n-PrOH and i-PrOH, respectively). Note that relative to X A and Y C 2 obtained at impurity concentrations of 0–0.03%, such excess is only 1–3% mol, which is not much larger than the experimental error in measuring X A and Y C 2 . In any case, there may be a narrow range of C3-alcohol concentrations, in which the impact of impurities is negligible, but it increases significantly with impurities greater than ~0.1% mol (Figure 2).
The effect of n-PrOH (Figure 2a) on X A and Y i is not very different from that of i-PrOH (Figure 2b). On the average, the dehydration indices ( X A and Y i ) decrease 1.3 times more in the presence of i-PrOH impurity.

2.2. Kinetic Model

The proprietary [21] and commercially available [25] alumina catalysts remained stable for 72 h when dehydrating 94–96% ethanol in a pilot-scale reactor [21,25], and were stable over a total time-on-stream (TOS) of 8–12 h when exposed to impurities (Section 4.1). This indicates that the alumina catalysts are sufficiently active in dehydration of azeotropic and contaminated ethanol, despite the presence of carbonaceous deposits on the catalyst surface noted in [33]. These facts allowed us to neglect the coke formation and assume steady-state conditions in the extended kinetic model for the EtOH-to-C2 process on the proprietary alumina catalyst. The reaction network of bioethanol dehydration is shown in Scheme 1.
Computer processing of the experimental data allowed us to propose a semi-empirical kinetic model for reactions rates, in which the coefficient β j (10) formally accounted for the impact of C3-alcohol impurities on the product formation.
β j = ( 1 + a j P P r O H ) ( 1 + b j P P r O H ) 2 ,
here, j = 1–9; P P r O H is the partial pressure of C3-alcohols; a j and b j are temperature dependent constants: a j = a 0 j · e E a j R T , b j = b 0 j · e E b j R T ; a 0   j and b 0   j are the pre-exponential factors; E a j and E b j are the temperature coefficients in the Arrhenius equation.
The coefficient β j is a formalized form of the kinetic equation where a 0 j , b 0 j , E a j and E b j are the generalized parameters describing the changes in the reaction rates of the product formation when exposed to a mixture of C3-alcohols impurities. In the suggested form, coefficient β j can describe both the weak inhibition (and even acceleration) of the product formation rates at low impurity concentration, and the significant inhibition of the rates at high impurity concentration.
The reaction rate equations and its parameters are given in Table 1. The rate Equations (11)–(19) correspond to the stoichiometric Reactions (1)–(9), respectively. Kinetic model includes five reactions (11)–(15) discussed in [25,27], and four new reactions: formation of C4 from DEE (16), formation of carbon oxides (17) and ethane (18), and transformation of propanol (PrOH) impurities into propylene (19).

2.3. Validation of the Kinetic Model

Reagents concentrations measured in the isothermal plug-flow reactor (PFR) under reaction-controlled conditions correlate quite well with the values predicted by the kinetic model, as seen in Figure 3. In Figure 3a,b, the correlations for pure and contaminated ethanol are plotted against 32 experimental data points. Since the values of concentrations (Figure 3a,b) and yields of byproducts (Figure 3c) were much lower than those of ethylene, we therefore applied a scaling factor to display all substances on the same graph.
With the use of the extended kinetic model, the relative errors in calculation X A and Y i in PFR were in the ranges of 3–55% rel. for contaminated ethanol (Table 2, #1) and 1–11% rel. for pure ethanol (Table 2, #2). In evaluating small concentrations of side (C4, AA) and secondary (ethane, COx) products, the calculation errors are higher. In some cases, the calculation error may be due to the use of the coefficient β j with generalized parameters in the kinetic model.
Before modeling the dehydration of contaminated ethanol in a large-scale commercial multi-tubular reactor (MTR), we compared the process indices in the MTR predicted using an extended kinetic model with the results of the experimental process study in a wall-heated pilot tubular reactor (10 data points in total); the latter were published in [21]. In the pilot studies, the calculation errors were in the range of 0.2–22% rel. for X A and Y i , except for Y C O x (Table 2, #3). Because of the small COx content (~0.002% mol), the error in calculation COx yield was 119% rel., which is much higher than for the other components. A sufficient correlation between calculated values and experimental measurements in the pilot study is shown in Figure 3c.
The extended kinetic model proposed here provides an adequate description of the experimentally observed impact of the C3-alcohols on the conversion and yields of all reaction products in the EtOH-to-C2 dehydration process.

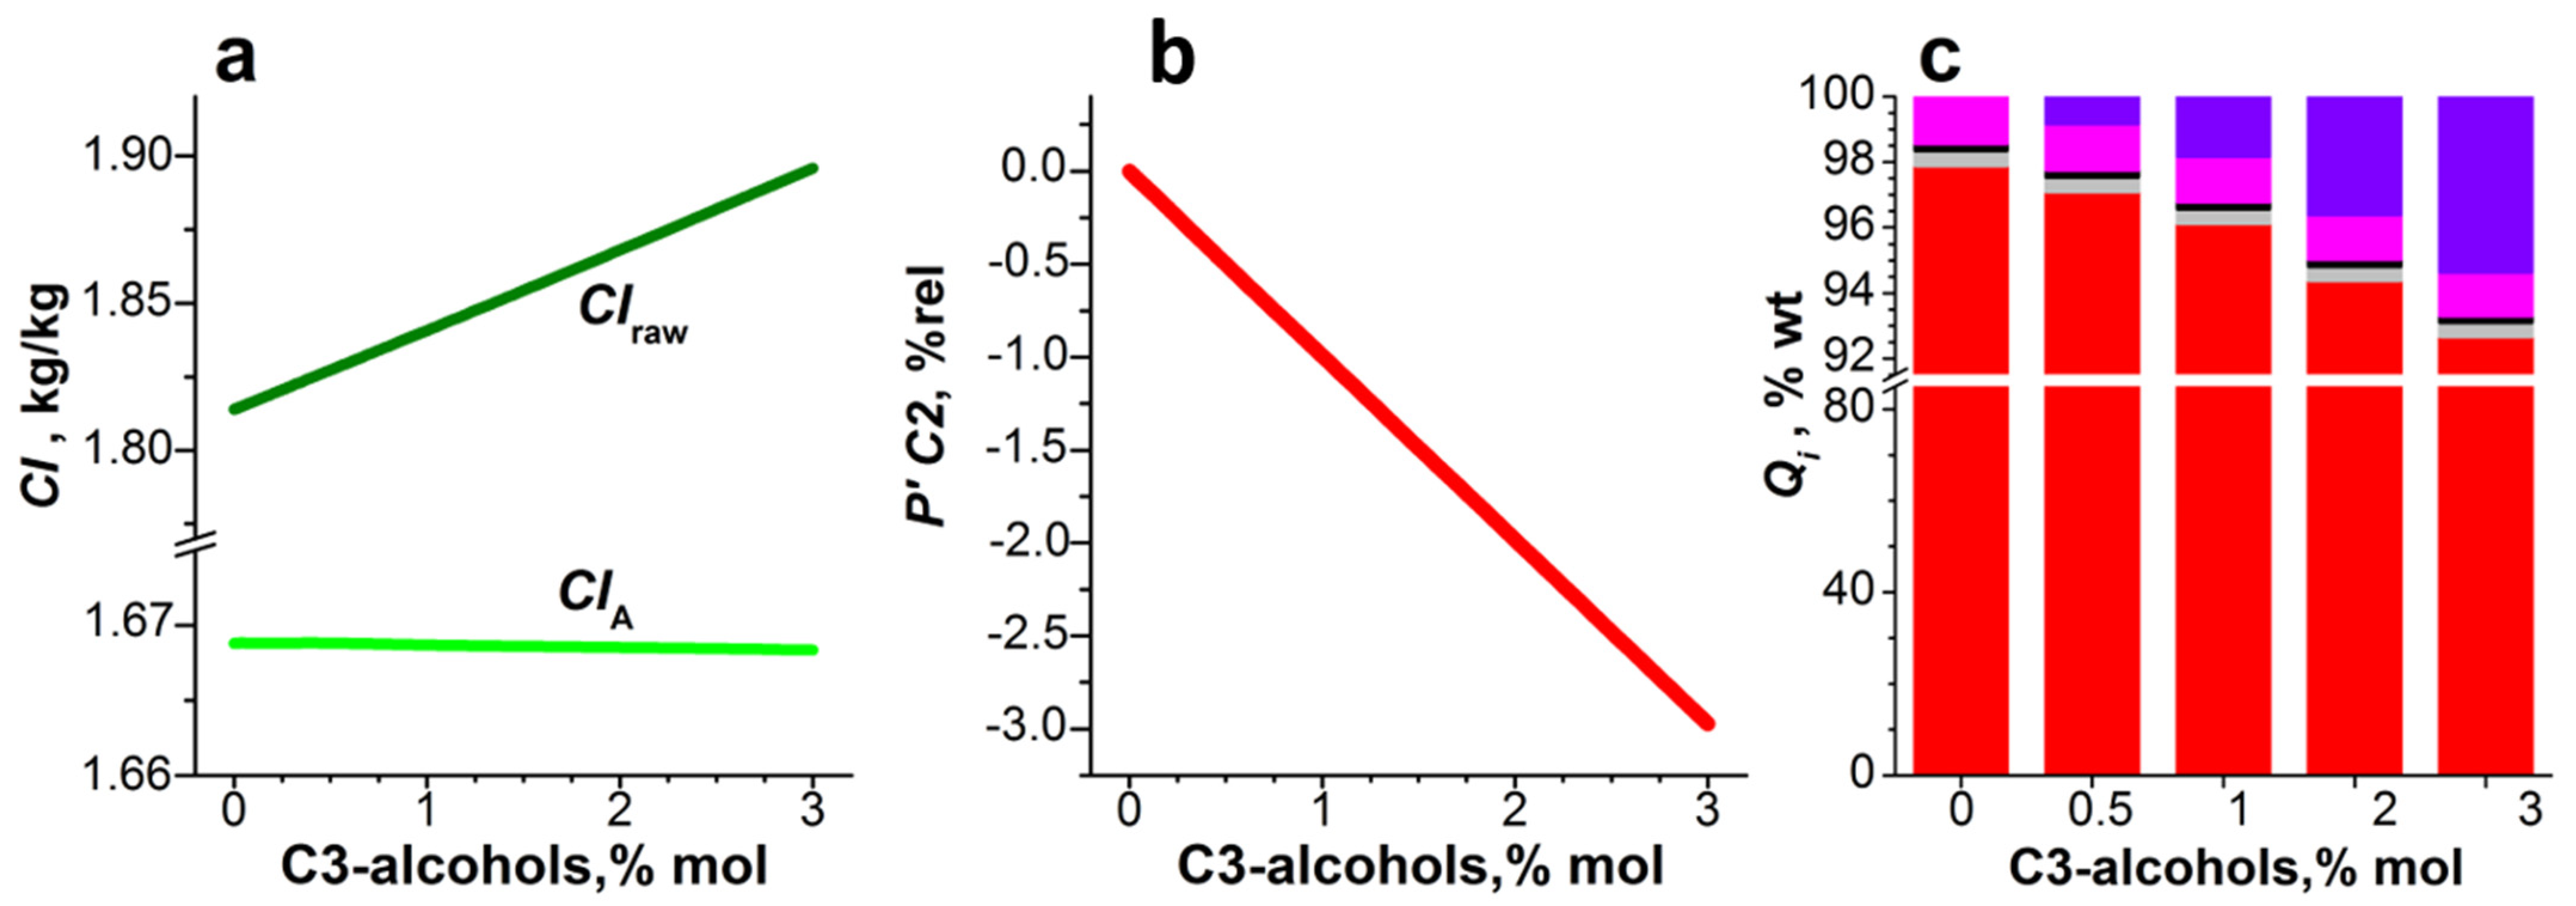
2.4. Dehydration of Contaminated Bioethanol to Ethylene: Simulating Procedure

2.4.1. The Process in Plug-Flow Reactor (PFR) under Reaction-Controlled Conditions

The process indices calculated using the extended kinetic model (Table 1, Equations (11)–(19)) made it possible to evaluate the effect of C3-alcohols on the products formation routes. We simulated dehydration of bioethanol contaminated with C3-alcohols of 0.001, 0.15 and 0.3% mol in PFR at 400 °C. Figure 4 illustrates how the selectivity (a) and yield (b) of C2 and DEE depend on ethanol conversion X A . Byproduct selectivity is given in Supplementary, Figure S1.
If we compare the selectivity at X A ≈ 1% conversion, we can assess the effect of C3-alcohols on the rates of products formation directly from EtOH (Figure 4a). At X A ≈ 1% the S C 2 and S D E E were 5.5–2.5 and 94–97% mol, respectively; therefore, C2 is obtained mainly via the consecutive route EtOHDEEC2 (2,3). This can be clearly seen in Figure 4b, where Y D E E passes through the maximum at X A ~48–57%. As calculated, the C3-alcohol impurities have a minimal effect on the formation of DEE from EtOH (12). With the impurity increase from 0.001 to 0.3%, DEE selectivity at X A ≈ 1% becomes ~3% mol higher (Figure 4a), resulting in a slight increase in C2 formation via the consecutive route (2,3). C3-alcohol impurities lead to a growth in S C 2 and Y C 2 at X A above 20% (Figure 4) but require a decrease in L H S V A to achieve the same X A as in pure ethanol dehydration. Thus, at X A ≈ 93.6% for ethanol contaminated with impurities of 0.001–0.03 and 0.3% mol, S C 2 of 94.6 and 97.6%, and Y C 2 of 88.5 and 91.4% were achieved at L H S V A of 39 and 16.5 h–1, respectively.
Figure 5 shows how coefficient β j varies with increasing C3-alcohol concentration in bioethanol samples. It follows from the expression (10) for coefficient β j that if P P r O H tends to zero, the coefficient β j tends to unity, that is, the inhibition of reaction rates of product formation by impurities is less pronounced.
When dehydrating bioethanol with 0.001% mol C3-alcohols, the coefficients β j were equal at least to 0.96; i.e., low concentration of impurity had almost no effect on the products formation in EtOH-to-C2 process (Figure 5, solid lines). When dehydrating bioethanol with 0.3% mol C3-alcohols, the lowest β 4 = 0.08–0.3 was found for AA formation by Reaction (14), and the highest was β 9 = 0.6–0.9 for PrOH conversion by Reaction (19). This means that AA formation is strongly affected by impurities, while inhibition of PrOH conversion is less pronounced (Figure 5, dash-dot lines). The inhibitory effect of C3-alcohols on the formation of different products varies greatly; thus, at 0.3% mol and X A ~50%, the formation rates of AA (14), C4 (15, 16), and C2 (11) decreased by factors of ~60, 9–13, and 9 (1/ β j ), while the formation rate of DEE (12) and its consumption to C2 (13) decreased by factors ~3.8 and 2, respectively. The production of C4 from DEE and from C2 (5, 6), and C2 directly from EtOH (1) is inhibited almost equally, as evidenced by the close values of β 1 , β 5 , and β 6 (Figure 5).

2.4.2. The Process in Multi-Tubular Reactor (MTR)

In this study, we focused only on the main process features that occur during dehydration in MTR of ethanol contaminated with C3-alcohols.
First, we found the dehydration process conditions (heat-medium temperature T W , linear velocity U , bed height L , tube diameter D ) that ensure the maximum Y C 2 when pure ethanol is used. A diluted 92% ethanol, the quality of which corresponded to the quality of a real bioethanol (Section 4.1), was considered as a feedstock. The parameters T W , U , L , and D were varied in the range of 420–450 °C, 0.85–1.2 m/s, 2.5–4.5 m, and 30–34 mm, respectively; number of tubes N was adjusted to provide ethylene capacity of 60 KTPA (25).
The indices of selectivity S i , product yield Y i , and ethylene quality Q C 2 (26), plotted as a function of ethanol conversion X A , are shown in Figure 6. In MTR, when L extends from 2.5 to 3.5 m, X A increases from 98.5 to 99.99%. The process indicators at the reactor outlet calculated at a fixed L are provided in Table 3. The temperature T W favors selectivity for ethylene rather than for byproducts (Figure 6); this is consistent with the PFR experiments presented above in Figure 1b, and with the pilot experiments reported in [21].
In dehydrating pure 92% ethanol, the maximum ethylene yield Y C 2 = 98.1% was achieved when X A was close to 99.9% (Figure 6c); the process conditions were as follows: U = 0.85 m/s, T W = 430 °C, D = 32 mm, and L = 3.5 m. A further rise in conversion degree leads to a sharp drop in ethylene yield, mainly due to the formation of byproducts such as C4, ethane, and COx. In addition, ethylene quality drops dramatically if X A rises above 99.8–99.9% (Figure 6d).
Second, we have assessed the effect of C3-alcohols impurities on the performance of contaminated 92% ethanol dehydration process in MTR at the process parameters mentioned above ( U = 0.85 m/s, T W = 430 °C, D = 32 mm, L = 3.5 m).
The catalytic process on the ring-shaped granules is controlled by diffusion. In contrast to the process on small particles, C3-alcohols impurities have almost no effect on dehydration of contaminated ethanol in MTR on industrial size catalyst granules. Even at C3-alcohol concentration up to 3% (Section 4.3), X A and Y C 2 do not markedly change. Therefore, to discuss the results of modeling, we chose the indices of feedstock consumption C I A and C I r a w (24), products capacity P’C2 (25), and dry-ethylene composition Q i (Figure 7). The weak impact of impurities on X A and Y i is manifested by a slight decline in the anhydrous-ethanol consumption index C I A (Figure 7a). When C3-alcohols are added to the feed in amounts up to 3% mol, the ethanol concentration becomes 2.4% mol lower (Section 4.3), while the yield of propylene as a product of C3-alcohols dehydration rises; this increases feed consumption index C I r a w (Figure 7a) and decreases production capacity P C 2 by ~3% rel. (Figure 7b). An ~5% wt increase of propylene concentration means a corresponding loss in the amount of C2 in dry-ethylene from 98 to 93% wt (Figure 7c). In order to raise the ethylene productivity to the required 60 KTPA, either the number of tubes in MTR or the temperature T W should be increased.

3. Discussion

Our experimental data showed that C3-alcohols in concentrations below 0.1% mol have almost no negative effect on product formation, but amounts above 0.1% mol strongly inhibit the formation of by-products, and this is most true for the formation of AA. Of the C3-alcohols, the branched isomer has a greater effect on EtOH-to-C2 conversion; this observation is consistent with the data reported in [16]. The resulting set of experimental data served as a basis for the formulation of the kinetic model.
As observed experimentally, the total yield of C2 and DEE exceeds the total yield of byproducts (Figure 1 and Figure 2). When X A is varied, the yields of C2 and DEE change significantly and in opposite directions; contrary to them, the by-product yields change only slightly. This behavior is consistent with the parallel-consecutive network of C2 formation and allows us to assume that the consecutive path of C2 formation via DEE predominates. It follows that impurities suppress the conversion of EtOH to DEE and its subsequent conversion to C2; this is the main reason for the decrease in X A .
Modelling the PFR using the kinetic model (11–19) showed that ethylene formation through DEE by consecutive route (2,3) prevails over parallel route (1); this confirms the experimental observations outlined above. Impurities inhibit the direct route of ethylene formation (1/ β 1 ≈ 9) more strongly than the consecutive one (1/ β 2 ≈ 3.8, 1/ β 3   ≈ 2), which increases the contribution of consecutive route to ethylene accumulation. Reduction of catalyst activity during dehydration of contaminated ethanol can be explained by the suppression of the predominant routes of DEE formation and consumption (2,3). The impurities also significantly inhibit the formation of by-products (1/ β j ≈ 9–60); with equal conversions of contaminated and pure ethanol this could give ~3% mol higher ethylene yield but would require more than a twofold reduction in the feedstock load L H S V A . The values of the β j coefficient are close for the routes of butylene formation from C2 (5) and from DEE (6), as well as for ethylene formation from EtOH (1) (1/ β 1 ≈ 1/ β 5     1 / β 6 ≈ 9–13); this may indicate that these products are formed with the participation of the same active sites. Undoubtedly, this assumption requires additional experimental research.
Simulated data for MTR showed that the influence of C3-alcohols impurities on the ethanol dehydration in the MTR was significantly less than in the PFR. The reason may be that the apparent kinetics shifts from being dominated by the chemical reactivity on the fine-dispersed catalyst to the internal diffusion controlled on the catalyst grains. This leads to a decrease in the observed reaction rates, including the rates of formation of byproducts; we can say that the diffusion inside the grains levels out the effect of impurities on the dehydration process.
The negative effect of C3-alcohols on the process performance in MTR can be caused mainly by dilution of ethanol with impurities and formation of propylene. The first factor leads to a lower ethylene production capacity, while the second one reduces the quality of ethylene produced. However, for a given MTR size, the slight (~3% rel.) decrease in ethylene capacity can easily be compensated by raising temperature T W by 2–5 degrees; the standard crude-ethylene conditioning shall give a target polymer-grade product [20]. Since the influence of impurities during dehydration of the real (contaminated) bioethanol is insignificant, it is possible to save the costs of the raw purification and thereby reduce the cost of processing of real bioethanol into ethylene. This assumption needs to be confirmed experimentally on a pilot scale.

4. Materials and Methods

4.1. Experimental

The catalytic dehydration of ethanol to ethylene was run in an isothermal flow reactor 12 mm in diameter on a catalyst with a particle size of 0.25–0.50 mm under reaction-controlled conditions [21]; the procedure and the main reactor features were reported in [12,15,21]. The catalyst bed was diluted with quartz grit at a 2:1 ratio. The catalyst particles were prepared by grinding the ring-shaped granules. The proprietary catalyst comprises a mixture of phases: 53% γ-Al2O3 and 47% χ-Al2O3; BET surface area was 208 m2/g. The textural and acidic properties of the catalyst, alkaline content, and preparation procedure were reported in [21].
Earlier, we found that in the real bioethanol derived from oat hulls and Miscanthus by the method described in [12,13,14,15], impurities of C3-alcohols prevail, their concentration reaches ~4 g/L, and the mass content of ethanol is ~92%. In the present study, we used two samples of a real Miscanthus-derived bioethanol (b1 and b2), and five model samples prepared from a commercially available azeotropic ethanol diluted with distilled water and C3-alcohols, namely: pure (m0), contaminated with n-PrOH (m1 and m3), and contaminated with i-PrOH (m2 and m4). The composition of impurities in all samples expressed on anhydrous alcohol basis (g/L) is shown in Figure 8.
The effect of temperature (350−400 °C) and the concentration of C3-alcohols (0.03–0.3% mol) on the catalytic process was studied at 21 ± 0.05 g/h alcohol solution (91.8 ± 0.7% wt EtOH) flow rate and 0.726 ± 0.005 g catalyst charge; anhydrous ethanol feed per catalyst volume L H S V A was ~27.2 ± 0.2 h–1. By changing the load of both the alcohol solution and the catalyst in the range of 21–33 g/h and 0.73–0.33 g, respectively, the L H S V A can be varied in the range of ~27.2–96.1 h–1. The effect of L H S V A on the catalytic dehydration of pure (m0) and contaminated (m3) ethanol was studied at 400 °C. The total pressure in the reactor was 1.03–1.07 bar.
Product yield Y i , ethanol conversion X A , and product selectivity S i were calculated by the Formulas (20)–(22).
Y i = 100 Δ m i / ξ i j m E t O H + Δ m i / ξ i j ,
X A = Y i ,
S i = Y i X A ,
here, Δ m i is the difference in molar fluxes of the i -th component at the reactor inlet and outlet, mol/h; ξ i j is the stoichiometric coefficient of the i -th component in the j -th reaction; m E t O H is the molar flux of ethanol at the reactor exit, mol/h.
To check the reproducibility and determine the experimental error, a series of experiments were performed for pure and contaminated ethanol under standard conditions. The relative experimental errors (rel.%) in measuring ethanol X A and propanol X P r O H conversions, and the yields of C2, DEE, C4, AA, ethane, and COx were 2, 3, 3, 10, 12, 12, 32, and 17%, respectively. Resource tests were conducted under steady-state conditions while dehydrating either pure 92% wt ethanol, or ethanol contaminated with C3-alcohols, and each test lasted 8 h. The process indicators Y i , X A , S i and mass balance were checked every 1–2 h during the catalyst time-on-stream. The mass balance for the entire series of measurements was 100 ± 5%. The catalyst was stable within the measurement error.

4.2. Kinetic Modeling

The parameters of the kinetic model were determined using MathCad software by minimizing the deviations in the measured and calculated data for PFR; the procedure involved two main steps:
1.
Determination of parameters k j and E j of the extended kinetic model for pure ethanol ( P P r O H = 0, β j = 1);
2.
Determination of the β j parameters ( a 0 j , b 0 j , E a j , and E b j ) of the extended kinetic model for contaminated ethanol, with k j and E j found in the previous step. Real bioethanol contains a mixture of C3-alcohols in various ratios; therefore, the estimation of the generalized parameters of β j (for a sum of n-PrOH and i-PrOH) seems more relevant. The upper limit of the parameters E a j and E b j was set as 200 kJ/mol.

4.3. Mathematical Modeling

A mathematical simulation using an extended kinetic model of dehydration of contaminated ethanol into ethylene allowed us to preliminarily assess how the impurities affect the performance of the process in the MTR [25].
For this purpose, we used the two-dimensional quasi-homogeneous model of the wall-heated tubular reactor; this model had been reported in [27,34]. The model includes differential equations for material and heat transport in the radial and axial directions in the bed (Supplementary Materials), and considers the different interstitial gas velocities around ring-shaped grains and inside their holes (Figure S2), as well as the equation describing diffusion and reactions in the porous isothermal catalyst grain (23):
ρ ( D r i * C i ρ ) R T P ρ ( V i * C i ) = j = 1 9 ξ i j ω j ,   i = 1 ,   11 ¯ ,  
here D r i * and V i * are the Wilke diffusion coefficient and hydrodynamic velocity of the i -th component; C i the is molar concentration of the i -th component; ω j is the rate of the j -th reaction under reaction-controlled conditions; ϖ j is the apparent rate of the j -th reaction in the catalyst grain defined as 1 ρ g r a i n 0 ρ g r a i n ω j ( ρ ) d ρ ; ρ g r a i n is the equivalent grain size, i.e., the ratio of the geometric volume to the external geometric surface area.
The Wilke diffusion coefficient D r i * and hydrodynamic velocity V i * [34] depend on the effective binary diffusion coefficient D i k * = Π D i k and on the effective Knudsen diffusion coefficient D i * k n = Π D i k n , where D i k is binary diffusion coefficient, D i k n is Knudsen diffusion coefficient, and Π is the empirical permeability coefficient accounting for the physical behavior of the porous structure ( Π ≈ 0.2).
In the present study, the behavior of MTR during the dehydration of 92% wt. pure and contaminated ethanol over a ring-shaped catalyst was simulated. The strength of ethanol corresponded to the strength of a real bioethanol (Section 4.1). The catalyst dimensions (diameter × height × wall thickness = 6.0 × 5.30 × 1.25 mm) were set as the average sizes of the ring-shaped grains used in the pilot studies [21], where the heat-medium temperature T W , linear velocity U , and bed height L were varied at a fixed tube diameter D . The change in U and L led to a variation in the feedstock loading per catalyst volume, L H S V A , in terms of anhydrous ethanol. The concentration of C3-alcohols impurities in gas feed varied from 0.5 to 3% mol (which is equivalent to ~0.6 to 30 g/L per anhydrous ethanol); the molar composition of the inlet gas mixture is depicted in Figure 9. MTR simulation for 60 KTPA ethylene capacity was performed assuming an identical behavior for all tubes.
To validate the model adequacy, we compared the results of our previous pilot studies for pure ethanol published in [21] with the data simulated by the 2D mathematical model using the new extended kinetic model (Section 2.2) for the wall-heated tubular reactor.
The simulation of the process took place in two stages:
1.
Determination of process conditions ( T W , U ) and reactor design ( L , D , N ) to achieve maximum ethylene yield from pure (not contaminated) 92% ethanol and to ensure ethylene capacity of 60 KTPA;
2.
Determination of process indicators when varying the impurity concentrations in the MTR under process conditions and reactor design defined in the previous step.
Indicators of the catalytic process, namely ethylene yield Y C 2 , consumption indices of anhydrous ethanol and feedstock ( C I A and C I r a w kg/kg), relative ethylene production capacity ( P C 2 , rel.%), and weight fraction of C2 in dry-ethylene ( Q C 2 , wt%) were calculated by the Formulas (24)–(26):
C I A = f   E t O H   f C 2   = 100 Y C 2 46 28 ,   C I r a w = 100 · C I A M E t O H   ,
P C 2 = P C 2 pure P C 2 contaminated     P C 2 pure       100 ,   P C 2 = f C 2   · N · 8000 10 6 ,   N = 60   KTPA   f C 2   · 8000 · 10 3
Q C 2 = f C 2   f   C 2   + f   c 3 + f H 2   + f   e t h a n e + f C O x   + f C 4     100 ,
here, f C 2     ,   f C 4   , f   e t h a n e , f C O x   , f H 2   , and f C 3   are the mass fluxes of ethylene, butylene, ethane, carbon oxides, hydrogen, and propylene, respectively, at the outlet of the single tube in MTR, kg/h; M E t O H is the mass fraction of ethanol in the feed, % wt; P C 2 is the ethylene production capacity of MTR in the dehydration of pure or contaminated ethanol, KTPA; N is the number of tubes to secure 60 KTPA with a pure ethanol as a feedstock, 103 pieces; 8000 is the annual operating time, h.

5. Conclusions

During experimental and theoretical studies on the dehydration of 92% bioethanol over alumina catalysts, how the content of C3-alcohols impurities in the feed affects the products selectivity and yield was quantitatively estimated. For the first time, an extended kinetic model of real ethanol dehydration has been proposed; it considers the influence of C3-alcohols impurities on the rates of formation of basic (ethylene and ether), side (butylene and acetaldehyde), and secondary (ethane and COx) reaction products.
The kinetic model has been approved experimentally in the dehydration of pure and contaminated ethanol on a milled catalyst in a plug-flow reactor, as well as in the dehydration of pure ethanol on a ring-shaped catalyst in a wall-heated tubular reactor.
C3-alcohols have very little effect on the process performance in PFR at concentrations below 0.05% mol; at higher loads they suppress the formation of byproducts by 9–60 times and ethylene formation directly from ethanol by 9 times, while ethylene formation via ether was only suppressed 2–3.8 times. Ethylene formation via ether is dominated on the tested catalyst. The branched propanol affects the ethanol-to-ethylene process more strongly than the linear isomer.
For the first time, to preliminarily assess the dehydration of contaminated ethanol in the MTR, we applied a quasi-homogeneous 2D model that incorporated an extended kinetic model. When ethanol conversion degree is 99.9%, the highest ethylene yield is 98.1%. Internal diffusion levels out the negative effect of C3-alcohols on the ethylene yield in the MTR. Despite this, ethylene productivity and its grade are reduced because impurities dilute ethanol and produce propylene. A proper adjustment of the heat-transfer fluid temperature and/or the number of tubes in the commercial MTR can provide the targeted ethylene production capacity.
Since the role of impurities in the catalytic dehydration process is very diverse, further in-depth studies of the influence of this important factor are necessary.

Supplementary Materials

The following supporting information can be downloaded at: https://0-www-mdpi-com.brum.beds.ac.uk/article/10.3390/catal13030509/s1, Mathematical model of the wall-heated tubular reactor; Figure S1: The calculated selectivity to C2, DEE, C4, AA, ethane and COx vs. ethanol conversion in PFR; Figure S2: A sketch of “gas flow sharing” in a holed cylinder. References [35,36,37,38,39,40,41] are cited in the Supplementary Materials.

Author Contributions

Conceptualization, E.V.O. and V.A.C.; methodology, E.V.O. and S.P.B.; validation, E.V.O., S.P.B. and M.A.K.; investigation, S.P.B. and M.A.K.; writing—original draft preparation, E.V.O. and S.P.B.; writing—review and editing, E.V.O. and V.A.C.; visualization, E.V.O.; project administration, E.V.O. All authors have read and agreed to the published version of the manuscript.

Funding

This work was supported by the Ministry of Science and Higher Education of the Russian Federation within the governmental order for Boreskov Institute of Catalysis (project AAAA-A21-121011390010-7).

Data Availability Statement

Not applicable.

Acknowledgments

The authors are grateful to Vernikovskaya N.V. for adapting the software package for calculating MTR using the new extended kinetic model.

Conflicts of Interest

The authors declare that they have no known competing interest or personal relationships that could have appeared to influence the work reported in this paper.

Appendix A. Nomenclature and Abbreviations

 Components of the reaction mixture
AAAcetaldehyde, C2H4O
C2Ethylene, C2H4
C3Propylene, C3H6
C3-alcoholsn-PrOH and i-PrOH
C4Butylene, C4H8
DEEDiethyl ether, (C2H5)2O
EtOHEthanol, C2H5OH
n-PrOH1-Propanol, C3H7OH
i-PrOH2-Propanol, C3H7OH
 Samples of ethanol
b1, b2Bioethanol from Miscanthus
m0Pure ethanol
m1, m3Model bioethanol contaminated with n-PrOH
m2, m4Model bioethanol contaminated with i-PrOH
 Parameters of kinetics equation
P i Partial pressure of the i-th component of the reaction mixture, atm
E j Temperature coefficient in Arrhenius equation, kJ·mol–1
k j Kinetic rate constant in ω j , mol·atm–n·kg–1·s–1
k 0 j Pre-exponential factor in Arrhenius equation, mol·atm–n·kg–1·s–1
ω j Rate of the j-th reaction, mol·atm–n·kg–1·s–1
β j Coefficient considering the effect of C3-alcohols impurities on ω j
 Process indicators
PFRPlug-flow reactor
MTRMulti-tubular reactor
C I A Consumption index of anhydrous ethanol, kg·kg–1
C I r a w Consumption index of feedstock, kg·kg–1
D Diameter of tube, mm
L Height of catalyst bed, m
L H S V A Liquid hourly space velocity of anhydrous ethanol, h–1
N Number of tubes, 103 pieces
P C 2 Productivity of ethylene, KTPA (thousand tons per year)
P C 2 Relative ethylene production capacity, % rel
Q C 2 Quality of ethylene (weight fraction of C2 in dry-ethylene), % wt.
S i Selectivity to the i-th product, % mol
T W Heat-medium temperature, °C
U Linear velocity (STP), m/s
X A Conversion of anhydrous ethanol, %
X P r O H Conversion of C3-alcohols, %
Y i Yield of the i-th product, % mol

References

  1. Hulea, V. Toward Platform Chemicals from Bio-Based Ethylene: Heterogeneous Catalysts and Processes. ACS Catal. 2018, 8, 3263–3279. [Google Scholar] [CrossRef]
  2. Zacharopoulou, V.; Lemonidou, A. Olefins from Biomass Intermediates: A Review. Catalysts 2018, 8, 2. [Google Scholar] [CrossRef] [Green Version]
  3. Alvarenga, R.A.F.; Dewulf, J. Plastic vs. Fuel: Which use of the Brazilian ethanol can bring more environmental gains? Renew. Energy 2013, 59, 49–52. [Google Scholar] [CrossRef]
  4. Sharada, D.; Naresh, U.; Shiva, K.V.; Kumar, R.J. Drop-in plastics. In Advanced Catalysis for Drop-in Chemicals; Sudarsanam, P., Li, H., Eds.; Elsevier: Amsterdam, The Netherlands, 2022; pp. 31–46. [Google Scholar] [CrossRef]
  5. Khabusheva, E.M.; Krasnikov, D.V.; Goldt, A.E.; Fedorovskaya, E.O.; Tsapenko, A.P.; Zhang, Q.; Kauppinen, E.I.; Kallio, T.; Nasibulin, A.G. Joint effect of ethylene and toluene on carbon nanotube growth. Carbon 2022, 189, 474–483. [Google Scholar] [CrossRef]
  6. Ahmad, S.; Ding, E.-X.; Zhang, Q.; Jiang, H.; Sainio, J.; Tavakkoli, M.; Hussain, A.; Liao, Y.; Kauppinen, E.I. Roles of sulfur in floating-catalyst CVD growth of single-walled carbon nanotubes for transparent conductive film applications. Chem. Eng. J. 2019, 378, 122010. [Google Scholar] [CrossRef] [Green Version]
  7. Karagedov, G.R.; Shutilov, R.A.; Kolesov, B.A.; Kuznetsov, V.L. The effect of carbon nanotubes introduction on the mechanical properties of reaction bonded boron carbide ceramics. J. Eur. Ceram. Soc. 2021, 41, 5782–5790. [Google Scholar] [CrossRef]
  8. Barabashko, M.S.; Drozd, M.; Szewczyk, D.; Jeżowski, A.; Bagatskii, M.I.; Sumarokov, V.V.; Dolbin, A.V.; Nesov, S.N.; Korusenko, P.M.; Ponomarev, A.N.; et al. Calorimetric, NEXAFS and XPS Studies of MWCNTs with Low Defectiveness. Fuller. Nanotub. Carbon Nanostruct. 2021, 29, 331–336. [Google Scholar] [CrossRef]
  9. Zdanovich, A.A.; Moseenkov, S.I.; Ishchenko, A.V.; Kuznetsov, V.L.; Matsko, M.A.; Zakharov, V.A. The Morphology Evolution of Polyethylene Produced in the Presence of a Ziegler-type Catalyst Anchored on the Surface of Multi-Walled Carbon Nanotubes. J. Appl. Polym. Sci. 2021, 138, 50528. [Google Scholar] [CrossRef]
  10. Marek, E.J.; García-Calvo Conde, E. Effect of catalyst preparation and storage on chemical looping epoxidation of ethylene. Chem. Eng. J. 2021, 417, 127981. [Google Scholar] [CrossRef]
  11. Sanchez, N.; Ruiz, R.; Hacker, V.; Cobo, M. Impact of bioethanol impurities on steam reforming for hydrogen production: A review. Int. J. Hydrog. Energy 2020, 45, 11923–11942. [Google Scholar] [CrossRef]
  12. Skiba, E.A.; Ovchinnikova, E.V.; Budaeva, V.V.; Banzaraktsaeva, S.P.; Kovgan, M.A.; Chumachenko, V.A.; Kortusov, A.N.; Mironova, G.F.; Parmon, V.N.; Sakovich, G.V. Miscanthus bioprocessing using HNO3-pretreatment to improve productivity and quality of bioethanol and downstream ethylene. Ind. Crop. Prod. 2022, 177, 114448. [Google Scholar] [CrossRef]
  13. Skiba, E.A.; Baibakova, O.V.; Budaeva, V.V.; Pavlov, I.N.; Vasilishin, M.S.; Makarova, E.I.; Sakovich, G.V.; Ovchinnikova, E.V.; Banzaraktsaeva, S.P.; Vernikovskaya, N.V.; et al. Pilot Technology of Ethanol Production from Oat Hulls for Subsequent Conversion to Ethylene. Chem. Eng. J. 2017, 391, 178–186. [Google Scholar] [CrossRef]
  14. Ovchinnikova, E.V.; Mironova, G.F.; Banzaraktsaeva, S.P.; Skiba, E.A.; Budaeva, V.V.; Kovgan, M.A.; Chumachenko, V.A. Bioprocessing of Oat Hulls to Ethylene: Impact of Dilute HNO3- or NaOH-pretreatment on Process Efficiency and Sustainability. ACS Sustain. Chem. Eng. 2021, 9, 16588–16596. [Google Scholar] [CrossRef]
  15. Banzaraktsaeva, S.P.; Surmina, M.A.; Chumachenko, V.A.; Ovchinnikova, E.V. Effect of the Isopropanol Impurity in the Feed on Catalytic Dehydration of Bioethanol to Ethylene. Russ. J. Appl. Chem. 2020, 93, 721–728. [Google Scholar] [CrossRef]
  16. Le Valant, A.; Garron, A.; Bion, N.; Duprez, D.; Epron, F. Effect of higher alcohols on the performances of a 1%Rh/MgAl2O4/Al2O3 catalyst for hydrogen production by crude bioethanol steam reforming. Int. J. Hydrog. Energy 2011, 36, 311–318. [Google Scholar] [CrossRef]
  17. Bilal, M.; Jackson, S.D. Ethanol steam reforming over Pt/Al2O3 and Rh/Al2O3 catalysts: The effect of impurities on selectivity and catalyst deactivation. Appl. Catal. A Gen. 2017, 529, 98–107. [Google Scholar] [CrossRef] [Green Version]
  18. Sanchez, N.; Ruiz, R.Y.; Cifuentes, B.; Cobo, M. Controlling sugarcane press-mud fermentation to increase bioethanol steam reforming for hydrogen production. Waste Manag. 2019, 98, 1–13. [Google Scholar] [CrossRef]
  19. Le Valant, A.; Garron, A.; Bion, N.; Epron, F.; Duprez, D. Hydrogen production from raw bioethanol over Rh/MgAl2O4 catalyst impact of impurities: Heavy alcohol, aldehyde, ester, acid and amine. Catal. Today 2008, 138, 169–174. [Google Scholar] [CrossRef]
  20. Mohsenzadeh, A.; Zamani, A.; Taherzadeh, M.J. Bioethylene production from ethanol: A review and techno-economical evaluation. ChemBioEng Rev. 2017, 4, 75–91. [Google Scholar] [CrossRef] [Green Version]
  21. Banzaraktsaeva, S.P.; Ovchinnikova, E.V.; Danilova, I.G.; Danilevich, V.V.; Chumachenko, V.A. Ethanol-to-Ethylene Dehydration on Acid-Modified Ring-Shaped Alumina Catalyst in a Tubular Reactor. Chem. Eng. J. 2019, 374, 605–618. [Google Scholar] [CrossRef]
  22. Yoo, K.-Y. Effects of Reactor Type on the Economy of the Ethanol Dehydration Process: Multitubular vs. Adiabatic Reactors. Korean Chem. Eng. Res. 2021, 59, 467–479. [Google Scholar] [CrossRef]
  23. Becerra, J.; Quiroga, E.; Tello, E.; Figueredo, M.; Cobo, M. Kinetic modeling of polymer-grade ethylene production by diluted ethanol dehydration over H-ZSM-5 for industrial design. J. Environ. Chem. Eng. 2018, 6, 6165–6174. [Google Scholar] [CrossRef]
  24. Frosi, M.; Tripodi, A.; Conte, F.; Ramis, G.; Mahinpey, N.; Rossetti, I. Ethylene from renewable ethanol: Process optimization and economic feasibility assessment. J. Ind. Eng. Chem. 2021, 104, 272–285. [Google Scholar] [CrossRef]
  25. Kagyrmanova, A.P.; Chumachenko, V.A.; Korotkikh, V.N.; Kashkin, V.N.; Noskov, A.S. Catalytic dehydration of bioethanol to ethylene: Pilot-scale studies and process simulation. Chem. Eng. J. 2011, 176–177, 188–194. [Google Scholar] [CrossRef]
  26. Van der Borght, K.; Alexopoulos, K.; Toch, K.; Thybaut, J.W.; Marin, G.B.; Galvita, V.V. First-Principles-Based Simulation of an Industrial Ethanol Dehydration Reactor. Catalysts 2019, 9, 921. [Google Scholar] [CrossRef] [Green Version]
  27. Ovchinnikova, E.V.; Banzaraktsaeva, S.P.; Chumachenko, V.A. Optimal Design of Ring-Shaped Alumina Catalyst: A Way to Intensify Bioethanol-to-Ethylene Production in Multi-Tubular Reactor. Chem. Eng. Res. Des. 2019, 145, 1–11. [Google Scholar] [CrossRef]
  28. Tripodi, A.; Belotti, M.; Rossetti, I. Bioethylene Production: From Reaction Kinetics to Plant Design. ACS Sustain. Chem. Eng. 2019, 7, 13333–13350. [Google Scholar] [CrossRef]
  29. Maia, J.G.S.S.; Demuner, R.B.; Secchi, A.R.; Melo, P.A.; do Carmo, R.W.; Gusmão, G.S. Process Modeling and Simulation of an Industrial-Scale Plant for Green Ethylene Production. Ind. Eng. Chem. Res. 2018, 57, 6401–6416. [Google Scholar] [CrossRef]
  30. Díaz de Leona, J.N.; Cruz-Taboada, A.; Esqueda-Barron, Y.; Alonso-Nuñez, G.; Loera-Serna, S.; Venezia, A.M.; Poisot, M.E.; Fuentes-Moyado, S. Catalytic dehydration of 2 propanol over Al2O3-Ga2O3 and Pd/Al2O3-Ga2O3 Catalysts. Catal. Today 2020, 356, 339–348. [Google Scholar] [CrossRef]
  31. Bedia, J.; Ruiz-Rosas, R.; Rodríguez-Mirasol, J.; Cordero, T. A kinetic study of 2-propanol dehydration on carbon acid catalysts. J. Catal. 2010, 271, 33–42. [Google Scholar] [CrossRef]
  32. El-Sharkawy, E.A.; Mostafa, M.R.; Youssef, A.M. Changes in surface and catalytic dehydration activities of 2-propanol on AlPO-5 induced by silver impregnation. Colloids Surf. A Physicochem. Eng. Asp. 1999, 157, 211–218. [Google Scholar] [CrossRef]
  33. Garbarino, G.; Vijayakumar, R.P.P.; Riani, P.; Finocchio, E.; Busca, G. Ethanol and diethyl ether catalytic conversion over commercial alumina and lanthanum-doped alumina: Reaction paths, catalyst structure and coking. Appl. Catal. B 2018, 236, 490–500. [Google Scholar] [CrossRef]
  34. Kagyrmanova, A.P.; Zolotarskii, I.A.; Vernikovskaya, N.V.; Smirnov, E.I.; Kuzmin, V.A.; Chumakova, N.A. Modeling of steam reforming of natural gas with shaped catalyst. Theor. Found. Chem. Eng. 2006, 40, 155–167. [Google Scholar] [CrossRef]
  35. Kagyrmanova, A.P.; Zolotarskii, I.A.; Smirnov, E.I.; Vernikovskaya, N.V. Optimum Dimensions of Shaped Steam Reforming Catalysts. Chem. Eng. J. 2007, 134, 228–234. [Google Scholar] [CrossRef]
  36. Smirnov, E.I.; Muzykantov, A.V.; Kuzmin, V.A.; Kronberg, A.E.; Zolotarskii, I.A. Radial heat transfer in packed beds of spheres, cylinders and Rashig rings Verification of model with a linear variation of λer in the vicinity of the wall. Chem. Eng. J. 2003, 91, 243–248. [Google Scholar] [CrossRef]
  37. Zolotarskii, I.A.; Voennov, L.I.; Zudilina, L.Y.; Isupova, L.A.; Zotov, R.A.; Medvedev, D.A.; Stepanov, D.A.; Livanova, A.V.; Meshcheryakov, E.P.; Kurzina, I.A. Theoretical Optimization of the Shape and Size of Adsorbent Grains for Associated Petroleum Gas Drying. Catal. Ind. 2018, 10, 49–56. [Google Scholar] [CrossRef]
  38. Ovchinnikova, E.V.; Vernikovskaya, N.V.; Andrushkevich, T.V.; Chumachenko, V.A. Mathematical modeling of β-picoline oxidation to nicotinic acid in multitubular reactor: Effect of the gas recycle. Chem. Eng. J. 2011, 176–177, 114–123. [Google Scholar] [CrossRef]
  39. Ovchinnikova, E.V.; Chumachenko, V.A.; Valuiskikh, N.N. Influence of the process parameters on temperature conditions and productivity of multitubular reactor for methanol to formaldehyde oxidation. Catal. Ind. 2013, 5, 297–311. [Google Scholar] [CrossRef]
  40. Ovchinnikova, E.V.; Chumachenko, V.A. Nicotinic acid synthesis at elevated β-picoline load: Exploring the possibility to intensify the process. Chem. Eng. Res. Des. 2021, 171, 63–72. [Google Scholar] [CrossRef]
  41. Frank-Kamenetskii, D.A. Diffuziya i teploperedacha v khimicheskoi kinetike. In Diffusion and Heat Transfer in Chemical Kinetics; Nauka: Moscow, Russia, 1987. [Google Scholar]
Figure 1. Effect of n-PrOH impurity in 92% wt feedstock on ethanol X A and propanol X P r O H conversions, and products yield Y i with variation in L H S V A at 400 °C (a1a6) and in T at L H S V A ~27 h–1 (b1b6) for pure ethanol (m0, open), contaminated ethanol with n-PrOH of 0.01% (m1, semi-open) and 0.27% (m3, solid). C2, DEE, C4, ethane (circle), AA, and COx (triangle). Conditions: PFR; proprietary Al2O3 catalysts of 0.25–0.50 mm. Symbols indicate experiments; lines indicate calculations for PFR using the extended kinetic model.
Catalysts 13 00509 g001
Figure 2. Effect of n-PrOH (a1a6) and i-PrOH (b1b6) impurity in 92% wt feedstock on ethanol X A and propanol X P r O H conversions, and products yield Y i at 350 (open), 370 (semi-open), and 400 °C (solid). C2, DEE, C4, ethane (circle), AA, and COx (triangle). For conditions, see Figure 1. Symbols indicate experiments; lines indicate calculations for PFR using the extended kinetic model.
Catalysts 13 00509 g002
Scheme 1. Reaction network.
Catalysts 13 00509 sch001
Figure 3. Correlation between the measured and calculated values. Reactor design: plug-flow (a,b), tubular with wall heating (c). Ethanol: pure (a,c), contaminated (b). In the legend, the numbers mean the scaling factors for each substance.
Catalysts 13 00509 g003
Figure 4. The calculated C2 and DEE selectivity (a) and yield (b) vs. ethanol conversion X A in PFR. Conditions: 400 °C, 1.2 g catalyst, 21.05 g/h solution of 92% wt EtOH and C3-alcohol impurities of 0.001 (dash, open), 0.15 (dash-dot, half), and 0.3% mol (solid, solid). Symbols indicate S i and Y i at L H S V A ≈ 27 h–1.
Catalysts 13 00509 g004
Figure 5. The coefficient β j vs. ethanol conversion X A in PFR. Conditions as in Figure 3. C3-alcohol of 0.001 (solid) and 0.3% mol (dash-dot).
Catalysts 13 00509 g005
Figure 6. Selectivity S i (a,b), yield Y C 2 (c), and C2 fraction in dry-ethylene Q C 2 (d) vs. conversion X A in MTR under diffusion-controlled conditions. Conditions in Table 3: #1 (Catalysts 13 00509 i001), #2 (Catalysts 13 00509 i002).
Catalysts 13 00509 g006
Figure 7. The impact of impurity concentrations on feedstock consumption (a), products capacity (b) and dry-ethylene quality (c) for EtOH-to-C2 process in the MTR. Conditions: #2 in Table 3. Catalysts 13 00509 i005—propylene, Catalysts 13 00509 i006C4, Catalysts 13 00509 i007COx, Catalysts 13 00509 i008—ethane, and H2, Catalysts 13 00509 i009C2.
Catalysts 13 00509 g007
Figure 8. Impurities in the samples: pure ethanol (m0), real bioethanol (b1, b2), model ethanol contaminated with n-PrOH (m1, m3), same, contaminated with i-PrOH (m2, m4). Impurities: AA (Catalysts 13 00509 i010), methanol (Catalysts 13 00509 i011), i-PrOH (Catalysts 13 00509 i012), n-PrOH (Catalysts 13 00509 i013), isobutanol (Catalysts 13 00509 i014). The molar percentage of C3-alcohol in the gas phase is given below.
Catalysts 13 00509 g008
Figure 9. Feedstock composition for MTR plotted against C3-alcohol concentrations in bioethanol.
Catalysts 13 00509 g009
Table 1. Kinetic model and its parameters.
Reaction   Rate Equations ,   ω j k 0   j ,
m o l a t m n · k g · s
E j , kJ / mol Coefficient   β j = ( 1 + a j P P r O H ) ( 1 + b j P P r O H ) 2
a 0   j E a   j b 0   j E b   j
(11) ω 1 = k 1 P E t O H   β 1 1.412 × 10 10 141.5 9.249 × 10 17 195.0 4.557 × 10 18 200.0
(12) ω 2 = k 2 P E t O H 2   β 2 7.434 × 10 9 125.1 3.127 × 10 17 187.0 6.025 × 10 17 191.0
(13) ω 3 = k 3 P D E E     β 3 1.587 × 10 4 52.1 5.665 × 10 8 71.5 1.682 × 10 3 4.0
(14) ω 4 = k 4 P E t O H     β 4 2.069 × 10 7 119.7 1.1 × 10 9 73.7
(15) ω 5 = k 5 P C 2 2     β 5 9.027 × 10 1 63.6 2.258 × 10 4 18.5
(16) ω 6 = k 6 P D E E     β 6 9.041 × 10 5 95.2 1.389 × 10 3 5.0
(17) ω 7 = k 7 P A A P H 2 O 3     β 7 1.950 × 10 2 1.0 1.560 × 10 7 18.4 5.417 × 10 10 86.0
(18) ω 8 = k 8 P C 2 P H 2     β 8 2.254 × 10 1 1.0 1.672 × 10 13 105.0 5.634 × 10 3 48.0
(19) ω 9 = k 9 P P r O H     β 9 1.331 × 10 9 120.0 8.452 × 10 17 200.0
ω j is the rate of the j -th reaction under reaction-controlled conditions; P i is the partial pressure of the i -th component of the reaction mixture; k j is the kinetic constant governed by the Arrhenius law k j = k 0 j · e E j R T ; k 0 j is the pre-exponential factor; E j is the temperature coefficient, R = 8.314 J m o l .   K ; n is reaction order; β j is the coefficient that describes the effect of C3-alcohols impurities on ω j . The rate Equations (11)–(19) correspond to the stoichiometric Reactions (1)–(9), respectively.
Table 2. Calculation errors.
#Ethanol GradeReactorCalculation Error, Percent Relative (% rel)
X A   X P r O H   Y C 2   Y D E E   Y C 4   Y e t h a n e   Y A A   Y C O x  
1Contaminated Lab3551412462255
2Pure Lab11739311
3Pure Pilot0.20.31222211119
Table 3. Dehydration of pure 92% ethanol in MTR over proprietary 6mm ring-shaped alumina catalyst.
#Operating Conditions and Reactor Design Parameters L H S V A ,   h 1   Y C 2 ,   mol % X A ,   % S i ,   mol % C I r a w ,   g / kg
U
m/s
T W ,   ° C D
mm
L
m
N
103 pcs
C2DEEC4EthaneAACOx
1 (Catalysts 13 00509 i003)1.0420303.03.02.697.299.098.130.231.220.350.020.051.83
2 (Catalysts 13 00509 i004)0.85430323.53.01.998.099.998.060.001.430.420.010.071.81
U —linear velocity; T W —heat-medium temperature; D —tube diameter; L —bed height; N —number of tubes.
Disclaimer/Publisher’s Note: The statements, opinions and data contained in all publications are solely those of the individual author(s) and contributor(s) and not of MDPI and/or the editor(s). MDPI and/or the editor(s) disclaim responsibility for any injury to people or property resulting from any ideas, methods, instructions or products referred to in the content.

