
Metal-Doped Mesoporous MnO2-CeO2 Catalysts for Low-Temperature Pre-Oxidation of NO to NO2 in Fast SCR Process

Energy and Environment Research Laboratories, Industrial Technical Research Institute, Hsinchu 31040, Taiwan
*
Author to whom correspondence should be addressed.
Catalysts 2023, 13(4), 694; https://0-doi-org.brum.beds.ac.uk/10.3390/catal13040694
Submission received: 30 December 2022
/
Revised: 31 March 2023
/
Accepted: 2 April 2023
/
Published: 3 April 2023
(This article belongs to the Topic Catalysis for Sustainable Chemistry and Energy)
Abstract
:Selective catalytic reduction (SCR) is an effective system for treating nitrogen oxides (NOx; mainly NO), and fast SCR requires the equimolar reactants of NO and NO2. This study focused on catalysts for oxidizing 50% of NO to NO2. A series of catalysts composed of a variety of components, such as mesoporous mMnO2-nCeO2 as carrier catalysts (m:n = 9:1 and 7:3) and transition metals (e.g., Fe, Co, Ni, Cu, and Cr), were synthesized and characterized using N2 adsorption, in situ XRD, TEM, and XPS. All samples had a mesoporous structure with pore size around 8 nm. XPS results demonstrated that addition of cerium ion increased the surface area and provided oxygen vacancy due to the formation of Ce3+ within the structure. NO oxidation activity was tested using a feed (205~300 ppm NO and 6% O2) that simulated typical flue gas conditions. Doped mesoporous mMnO2–nCeO2 has higher NO oxidation activity than pristine mMnO2–nCeO2. The doped mMnO2-nCeO2 catalyzed 50% of NO to NO2 at between 140 and 200 °C resulting in an equivalent amount of NO and NO2. Among the transition metals, Cu, Ni, Co, Fe, and Cr have the highest to lowest oxidation activity, respectively. The precatalytic oxidation of NO can potentially be combined with the current SCR system without changes to existing equipment and can be applied to the exhaust gas treatment for de-NOx.
1. Introduction
Atmosphere nitric acid or particulate nitrate formed from the oxidation of nitrogen oxides (NOX; mainly NO) constitute precursors of fine suspended particles (PM2.5). PM2.5 contributes to cancer, cardiovascular disease, and other critical health problems. Therefore, countries worldwide have enacted regulations to address PM2.5 pollution, which include the strict control of PM2.5 precursor emissions. Within the European Union, the National Emission Ceilings Directive agreed that emissions of the four major pollutant species must comply with the upper limit [1] stipulated by the Gothenburg Protocol. These four species are NOx, sulfur dioxide (SO2), non-methane volatile organic compounds, and ammonia (NH3).
Much research and investment has focused on the reduction of NOx content in industrial waste gas. Bosch and Janssen [2] proposed a variety of methods for removing nitrogen oxides in 1988. Two types of NOx removal methods are currently employed, selective catalytic reduction (SCR) [3] and selective noncatalytic reduction (SNCR), both of which are relatively mature technologies and require NH3 as a reduction agent. SNCR requires no catalysis, and its reaction temperature ranges from 850–1100 °C, consuming a relatively high amount of energy; SCR uses V2O3/WO3 catalysts and has a reaction temperature between 300–400 °C. Researchers have dedicated decades of work to the development of these two technologies. SCR technology has been adopted in the treatment of diesel engine exhaust emissions.
SCR is one of the most effectively adopted treatment techniques for NOx (NO, NO2, and N2O; NO accounts for >95% in most emission sources) abatement with an efficiency of up to 90% in the power generation, steel, cement, and paper and pulp industries. Currently, metal oxide catalysts such as V2O5-WO3/TiO2 are the most widely used; however, commercial metal oxide catalysts must operate at high temperatures (300–400 °C) and require the oxidation of SO2 to SO3, which results in the formation of black viscous liquid ammonia bisulfide (NH4HSO4) with NH3, rendering further catalysis ineffective. Conversely, the development of low-temperature SCR (LT-SCR) solves the aforementioned problems because it can be located downstream of the electrostatic precipitator. However, the drawbacks of LT-SCR include potential poisoning by H2O or SO2 and the formation of the undesired byproduct N2O [4,5]. Thus, achieving a balance between traditional SCR and LT-SCR remains challenging.
The main SCR chemical reaction converts NOx into N2 and H2O (reaction 1). The temperature must be controlled between 300–400 °C to effectively remove >90% NOx. Studies on NO catalysis [6,7] have indicated that if 50% of the NO of pollutants can be converted into NO2, the reaction rate of fast SCR (reaction 2) is 10 times faster with equimolar amounts of NO and NO2 [8] compared with the main SCR reaction and it operates effectively at 200 °C. Therefore, when the equimolar oxidation of NO can be achieved below 200 °C, the SCR [9], the reaction route can be changed from main SCR to fast SCR; the lower reaction temperature of approximately 200 °C results in energy savings and commercial applicability without changes to the currently used process.
4NO + 4NH3 + O2→ 4N2 + 6H2O main SCR
NO + NO2 + 2NH3 → 2N2 + 3H2O fast SCR
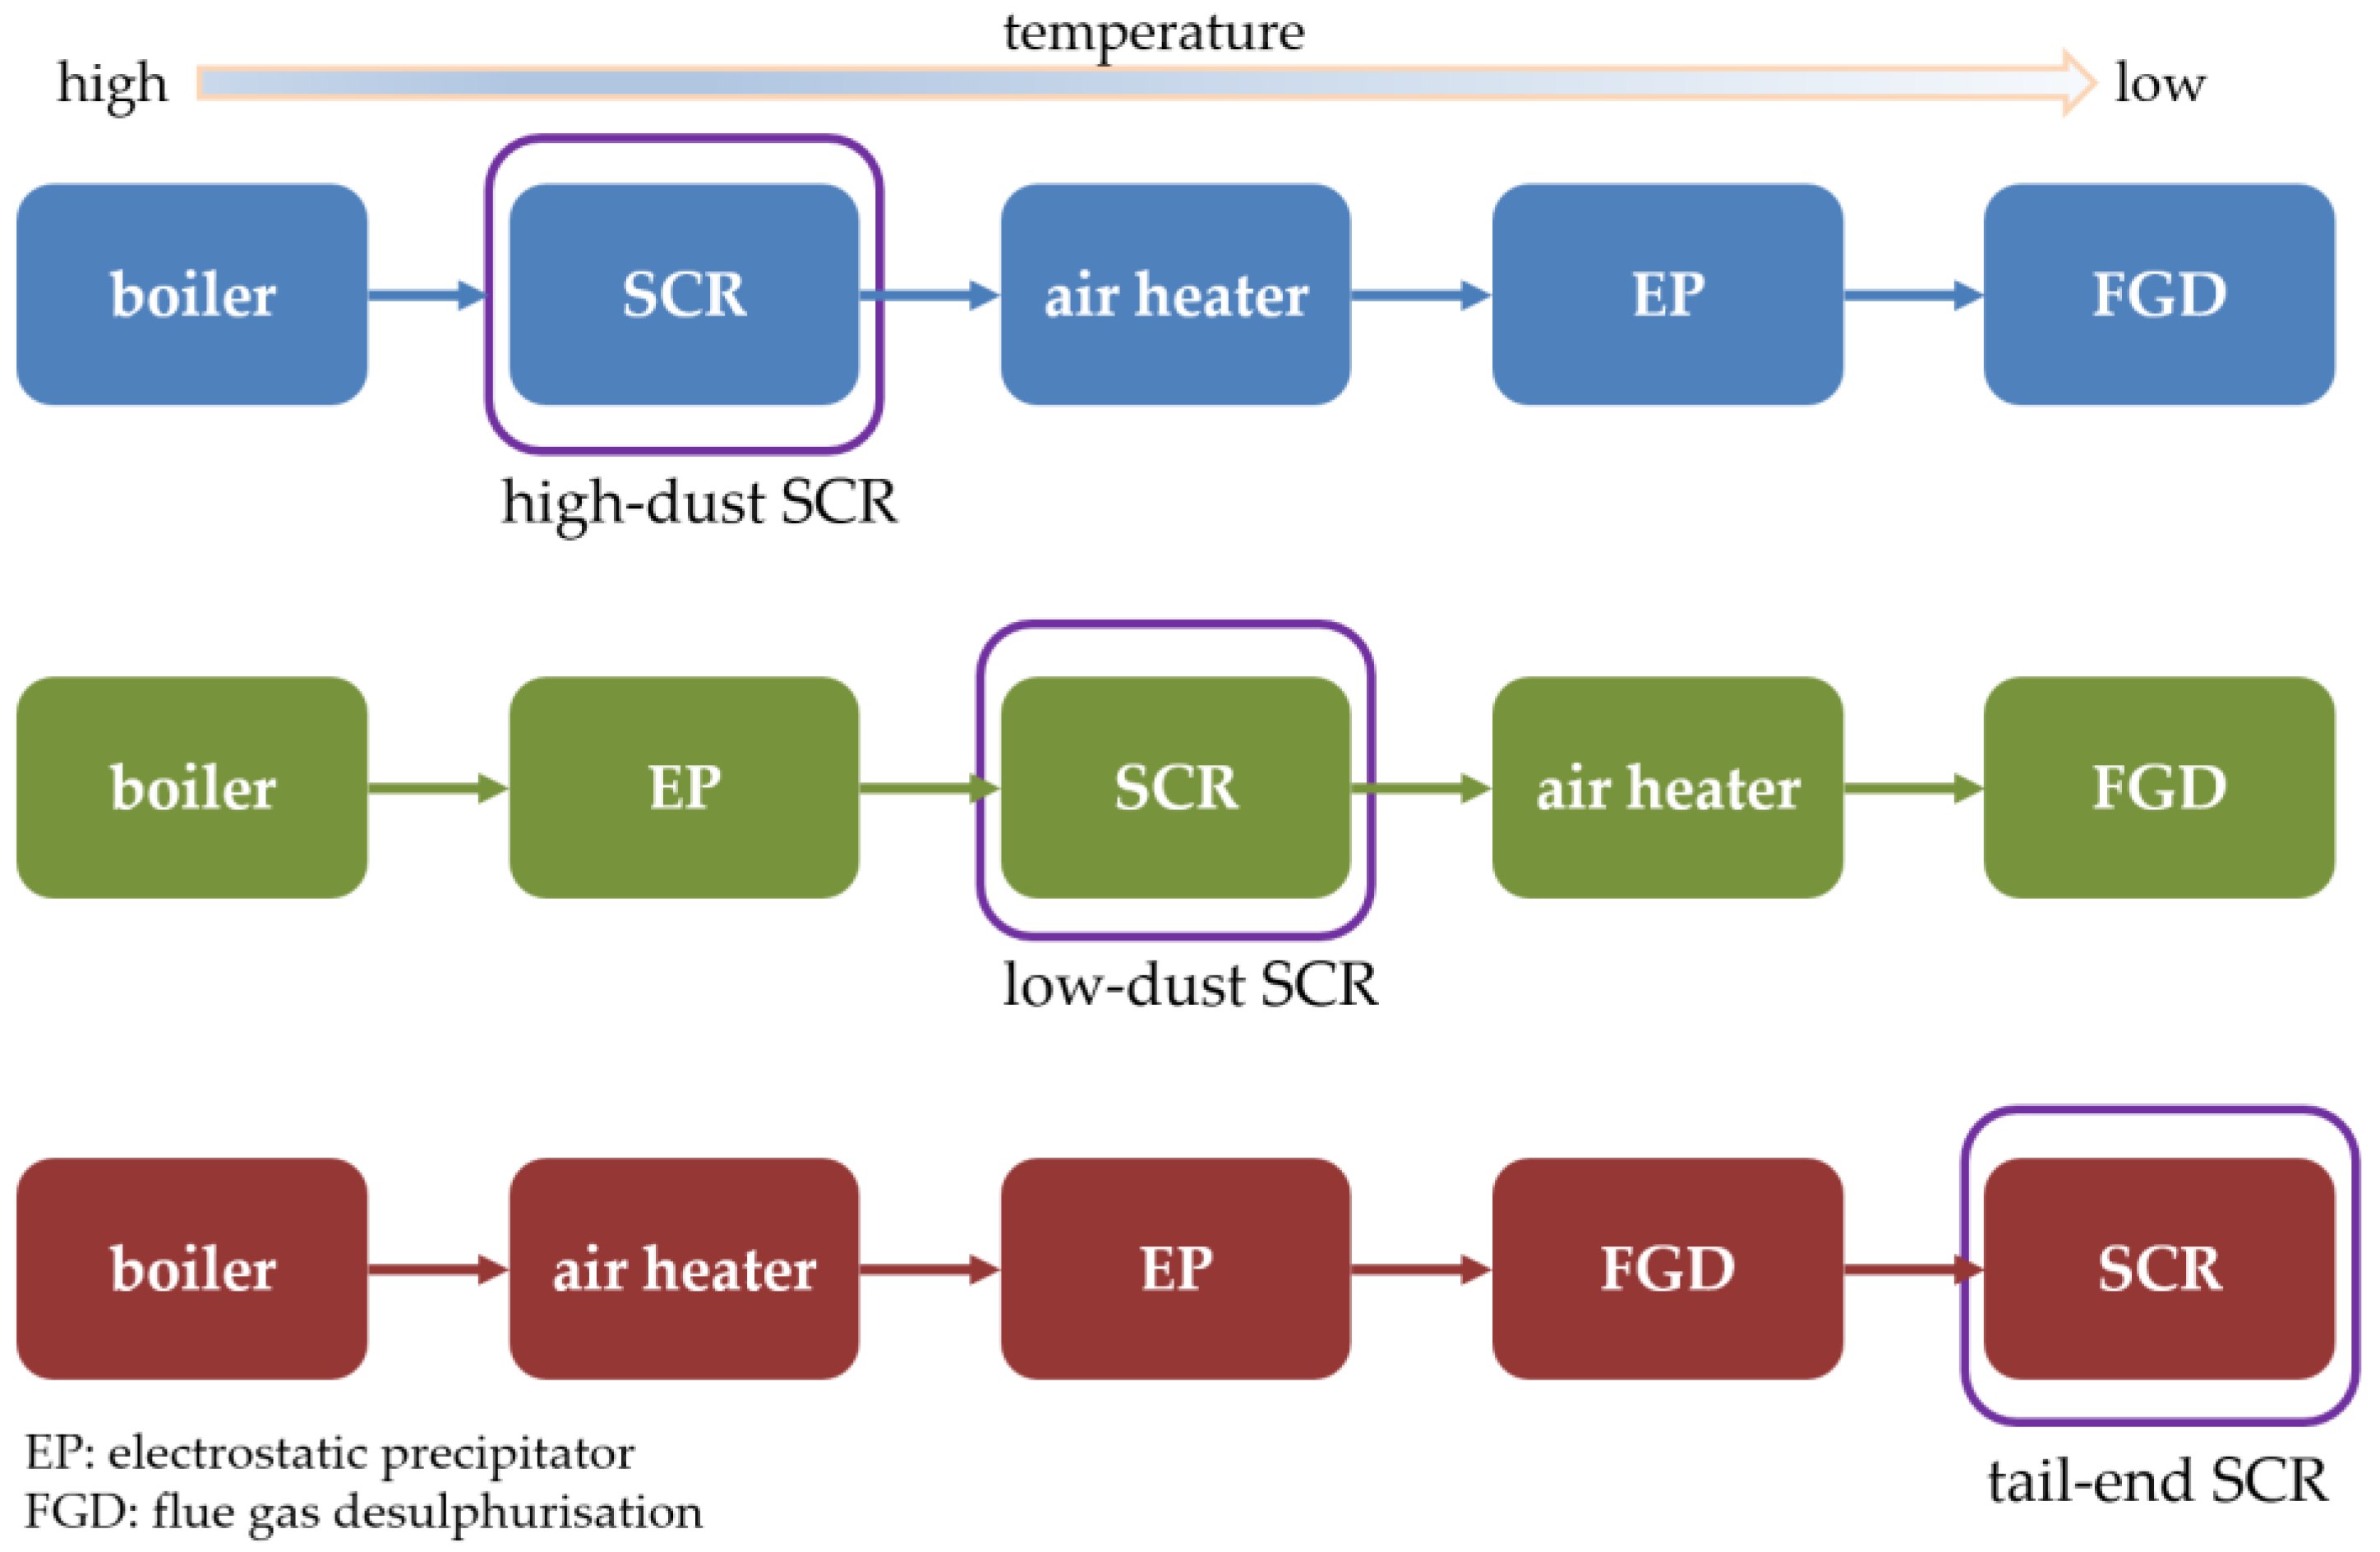
Three types of SCR systems are used to treat flue gas [10] according to its relative position in the treatment system. They include high-dust SCR, low-dust SCR, and tail-end SCR (Figure 1). High-dust SCR has a market share of 88% because the inlet flow temperature easily reaches the required reaction temperature of traditional SCR (350–400 °C). However, the flue gas comprises particles, NOx, and SOx; blockage of the pores on the catalyst surface by the particles and its subsequent deactivation necessitates the regular use of soot blowers and sonic horns to clean the catalyst bed. Furthermore, a continually high reaction temperature causes catalyst agglomeration and a higher fuel consumption cost [11,12]. Second, low-dust SCR, which is located behind the EP (electrostatic precipitator), accounts for approximately 6% of all instances of SCR in use. Low-dust SCR has intake air containing NOx and SOx without particles and does not require a hopper to collect particles; although this allows for reduced SCR system volume, the inlet airflow must be reheated with an economizer to maintain de-NOx efficiency. Furthermore, the inlet flue gas still contains SOx; after increasing NH3 to improve NOx removal efficiency, the formation of ammonia bisulfide occurs, blocking the catalyst, as is the case in high-dust SCR. Finally, tail-end SCR, which also accounts for only 6% of the SCR types, has only NOx at the inlet air flow, and the air flow temperature generally drops to 150–290 °C depending on the efficiency at which process heat is recovered; the temperature can sometimes drop to approximately 80 °C, requiring only 50% of the catalyst [13] in high-dust SCR, resulting in a doubled catalyst lifetime. However, tail-end SCR requires the installation of heat recovery and heating equipment to reach the reaction temperature. Therefore, if the de-NOx process can be completed at approximately 200 °C without changes to the current SCR catalyst and the installation of new equipment (i.e., only with modified pipelines), it constitutes a feasible improvement to flue gas treatment systems from high-dust SCR to tail-end SCR in terms of energy savings, catalyst cost [14], and catalyst lifetime.
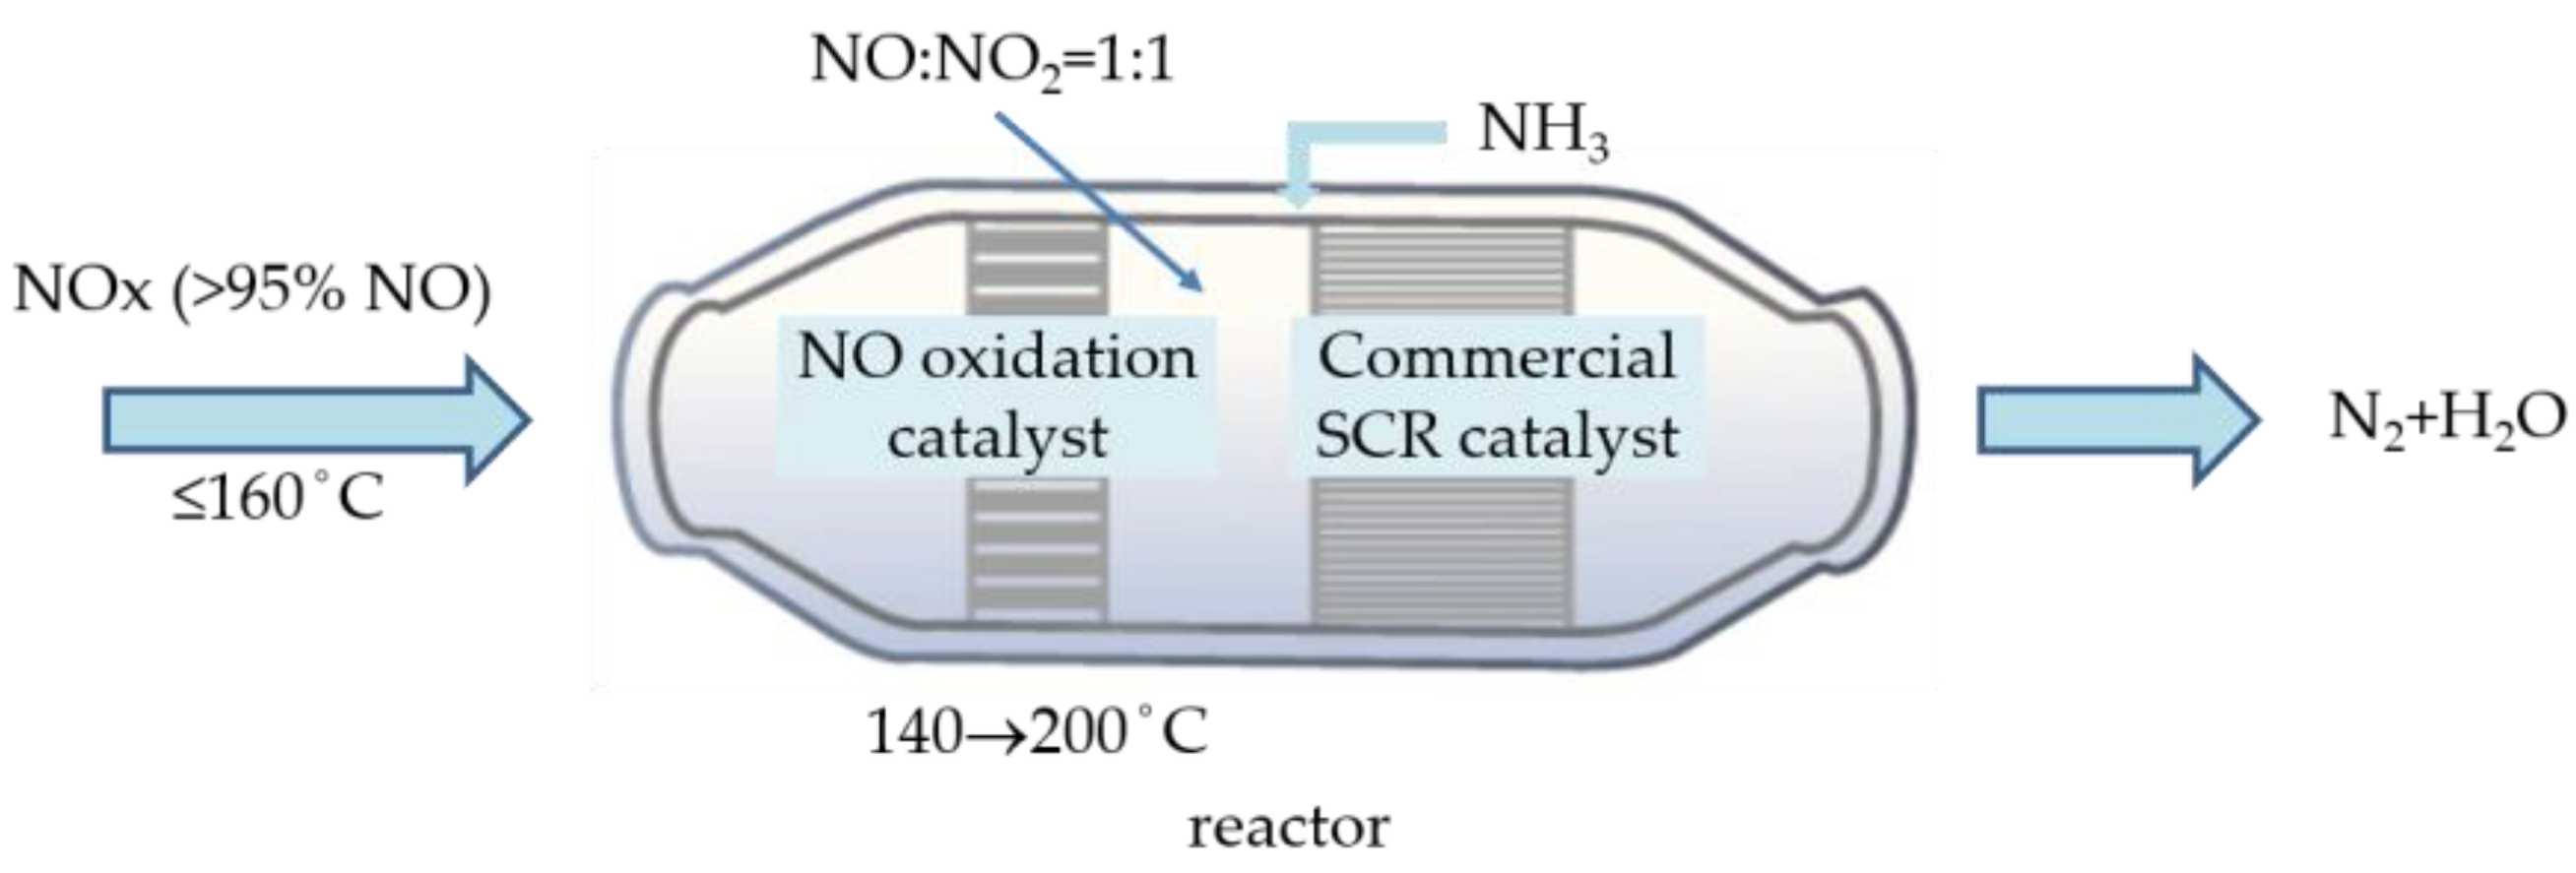
Various catalysts for NO oxidation to NO2 have been developed mostly in supported catalysts doped with a noble metal such as Pt [15], Pd [16], and Ru [17], or in perovskite type [18,19]. These two categories were restricted from field application due to their high price and costly synthesis procedure, respectively. MnO2 has been widely studied as well due to its low cost, environmental benefits, and relatively high activity for catalytic oxidation [20,21]. Mesoporous materials have also been widely used as catalyst carriers because of their large specific surface area, interconnected channels, and well-defined pore diameters [22,23]. These three-dimensional (3D) structural catalysts using KIT-6 as a template have been found to generate abundant active sites and mass transfer, thus enabling effective oxidation. Besides, with high redox properties and the lability of lattice oxygen, ceria (CeO2) shows high catalytic activity. Ceria also possesses high oxygen storage capacity, which allows for using the oxide not only as a support but also as a catalyst for oxidation. The present study developed a selective NO oxidation catalyst comprising mainly mesoporous MnO2 and CeO2 doped with economic transition metal as a pre-oxidation catalyst for SCR to partially convert 50% NO to NO2 and to lower the SCR reaction temperature to 200 °C with promising NO removal efficiency (Figure 2).
2. Results and Discussion
This study used a mesoporous metal oxide coated with trace amounts of transition metals as dopants as a carrier catalyst to synthesize a selected low-temperature NO catalyst; its composition was DP/mMnO2–nCeO2 (m:n = 9:1 and 7:3, wherein the coated metal (DP) could be Fe, Co, Ni, Cu, and Cr). The KIT-6-template was adopted to obtain 3D ordered mesoporous metal oxide (mMnO2–nCeO2). All mMnO2–nCeO2 catalysts were doped with DP at 1 atomic%. The catalysts in this study primarily served to catalyze 50% NO to NO2 at a temperature between 140 and 200 °C and to reduce the traditional SCR reaction temperature to 200 °C, resulting in energy savings, catalyst lifetime extension, and application flexibility. Several additional mesoporous metal oxides were concurrently synthesized to compare their NO oxidation capability with the doped mMnO2-nCeO2.
2.1. Characterization of NOx Oxidation Catalysts
Two major mesoporous metal oxides were synthesized as catalyst carriers for NO oxidation to NO2, namely, mMnO2–nCeO2 (m:n = 9:1 and 7:3 as mole ratio in synthesis). Ce was employed as a component carrier due to its high oxygen storage capacity, excellent tolerance to H2O and SO2, environmental benefits, and low cost [24].
2.1.1. Scanning Electron Microscope (SEM) and X-ray Diffraction (XRD) Analysis
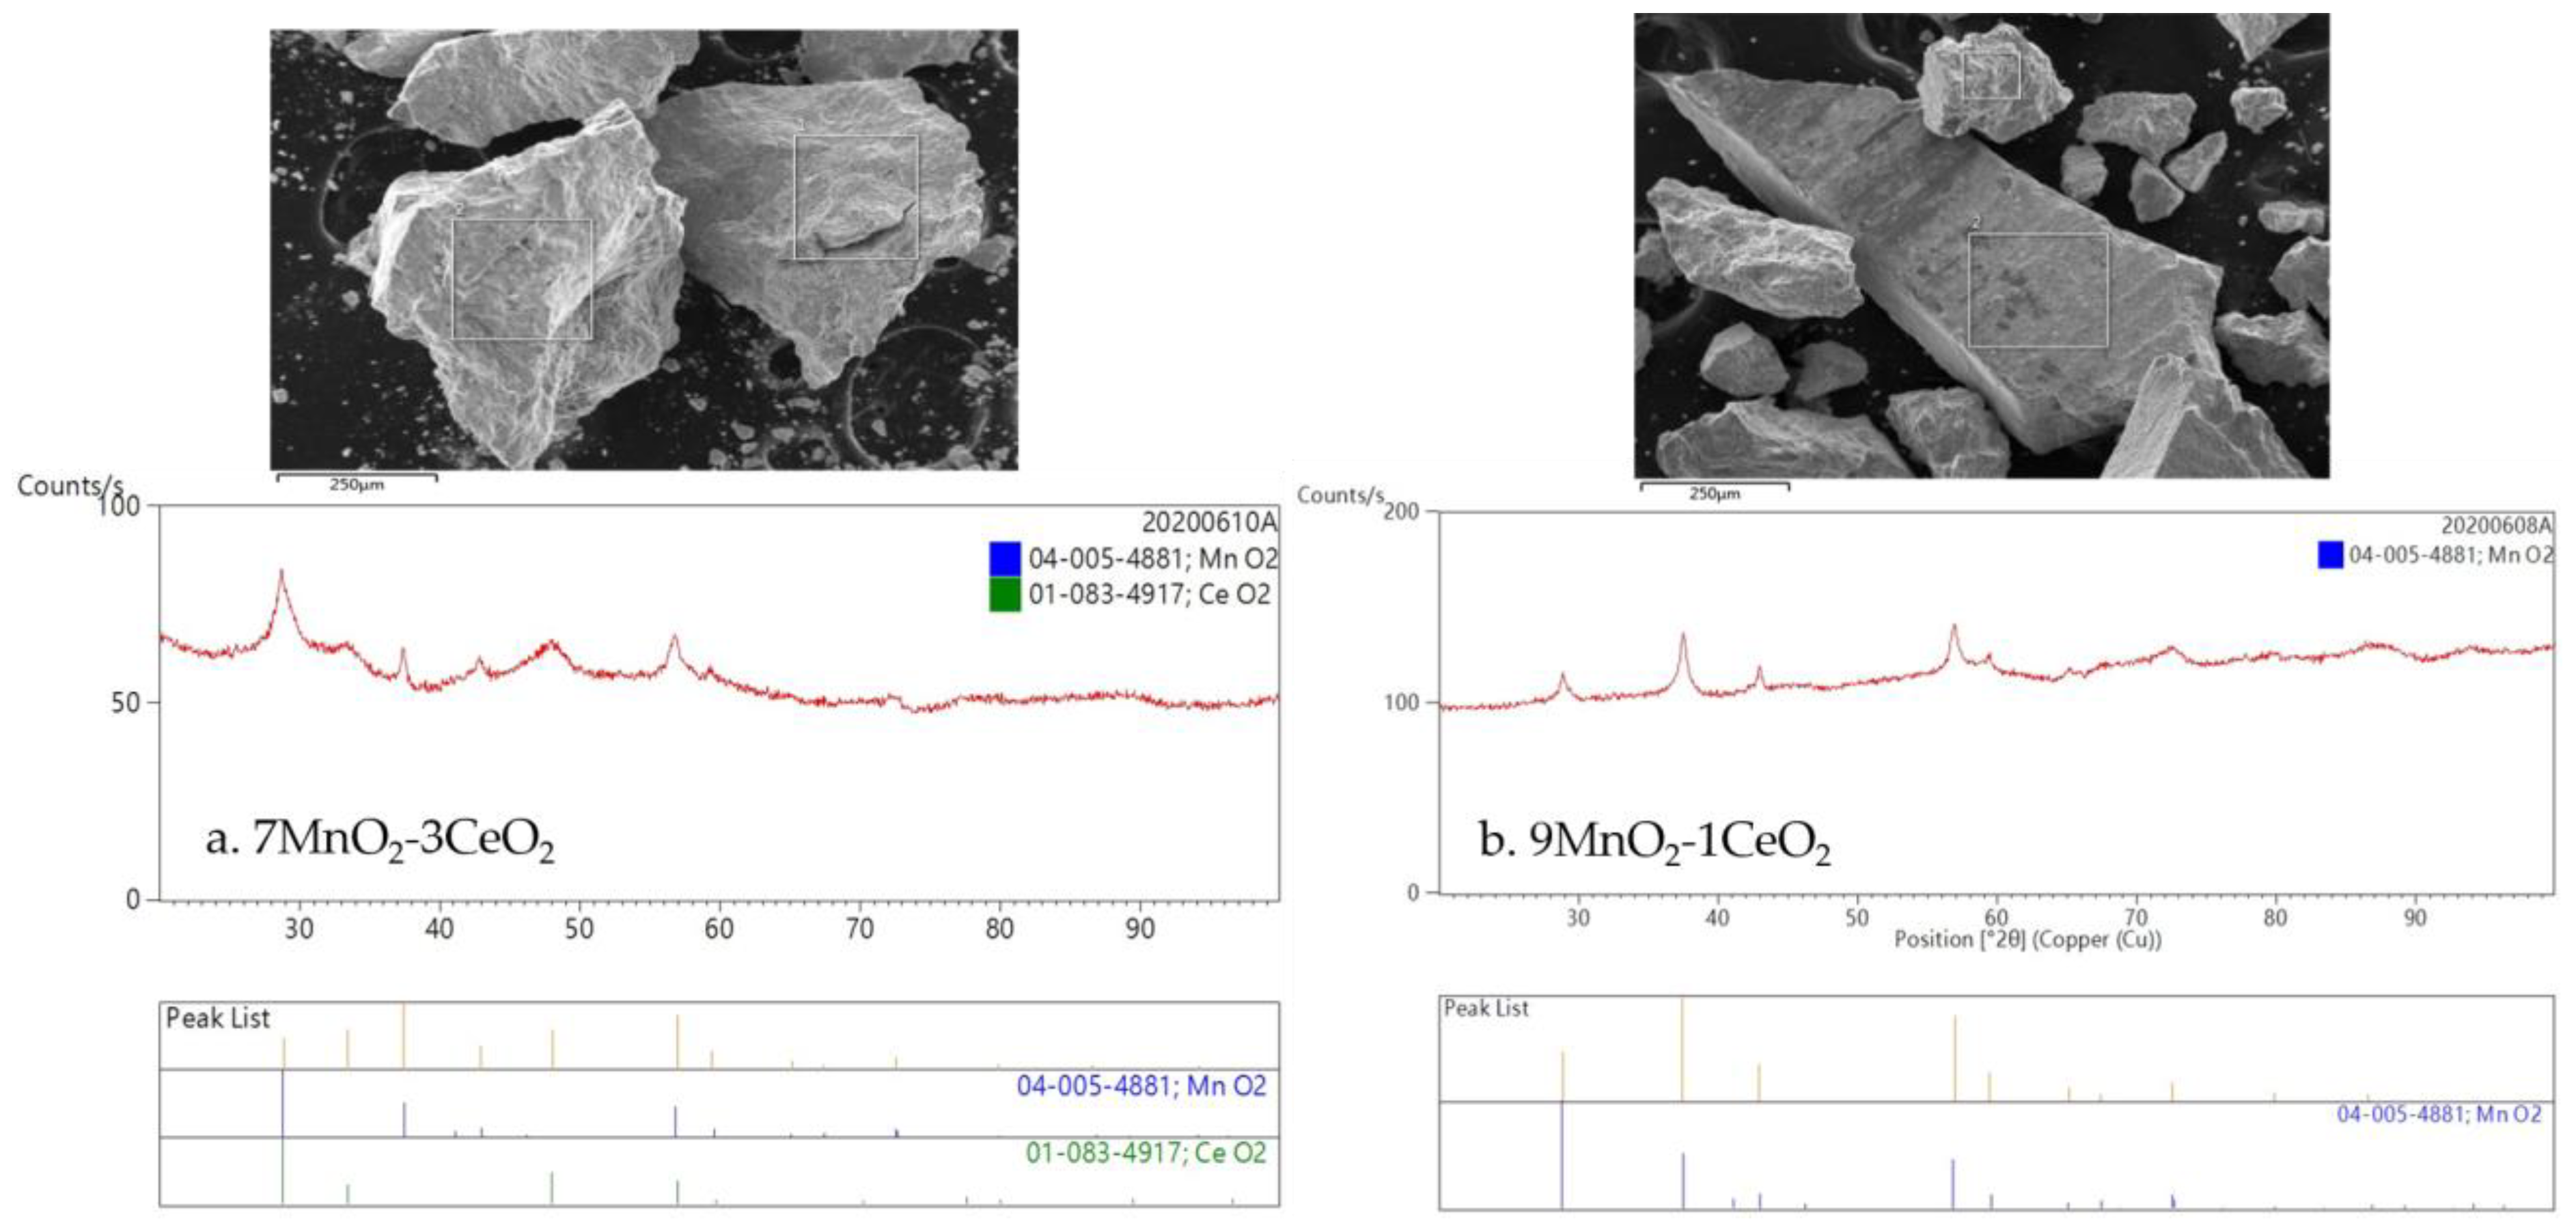
XRD analysis was used to verify the crystallographic structure of mMnO2–nCeO2 (m:n = 9:1 and 7:3) catalysts. XRD patterns revealed broad peaks indicating a low crystallinity of both catalysts. As illustrated in the left image of Figure 3, the 2θ peaks (varying from 20° to 100°) of 7MnO2–3CeO2 at 28.8°, 33.4°, 37.3°, 42.8°, 47.9°, 56.9°, 59.6°, and 72.5° corresponded to the combination from (110) of MnO2 (PDF-ICDD-04-005-4881, β-MnO2) and (111) of CeO2 (PDF-ICDD-01-083-4917), (200) of CeO2, (101) of MnO2, (111) of MnO2, (220) of CeO2, the combination from (211) of MnO2 and (311) of CeO2, and (301) and (112) of MnO2. The diffraction peaks of 9MnO2–1CeO2 illustrated in the right image of Figure 3 are in accordance with those of MnO2; they display no traces of the CeO2 pattern, which indicates an amount of Ce ions so small that their diffraction patterns are covered by those of MnO2. Moreover, crystallites exhibit wide diffraction peaks; in Figure 3, the SEM images of synthesized crystals reveal irregular shapes with various grain sizes indicative of lower crystallinity.
2.1.2. Physical Characteristics Analysis
The BET surface areas, pore volumes, and pore sizes of 7MnO2–3CeO2 and 9MnO2–1CeO2 catalysts are summarized in Table 1; two other porous pristine MnO2 and CeO2 synthesized with KIT-template in previous work [25] are included as well for comparison. It can be seen that the surface area of pure CeO2 was two times larger than pure MnO2. The addition of cerium ions to MnO2 helped increase its surface area. As the added ceric molar ratio increased from 10% to 30%, the surface area of catalyst rose from 87.3 to 124.2 m2/g. Both 9MnO2-1CeO2 and 7MnO2-3CeO2 showed a similar average pore size with that of pure MnO2, while their pore volumes were significantly increased with the increasing proportion of cerium oxide. It is noteworthy that the pores of all the samples were meso-pores (between 2 and 50 nm).
The Mn, Ce, and doped transition metal (Co, Ni, Fe, Cu, Cr) contents of as-synthesized catalysts were investigated by ICP-OES, as shown in Table 2. The ICP results demonstrated that the Mn/Ce atom ratio was 8.77 for 9MnO2-1CeO2 and that all the doped 9MnO2-1CeO2 catalysts possessed similar Mn/Ce atom ratios between 9.01 and 9.14, which indicates their consistency with theoretical values. Although the (Mn + Ce)/corresponding dopant atom ratios varied from roughly 65 to 99, considered as experimental deviation due to the large gap between the dopant and Mn-Ce supporter, elemental mappings (Section 2.1.3) of Co, Ni, Fe, Cu, and Cr revealed that all DPs were full-dispersedly doped into their corresponding Mn–Ce catalysts.
2.1.3. Transmission Electron Microscopy (TEM) and Energy-Dispersive X-ray Spectroscopy (EDS) Results
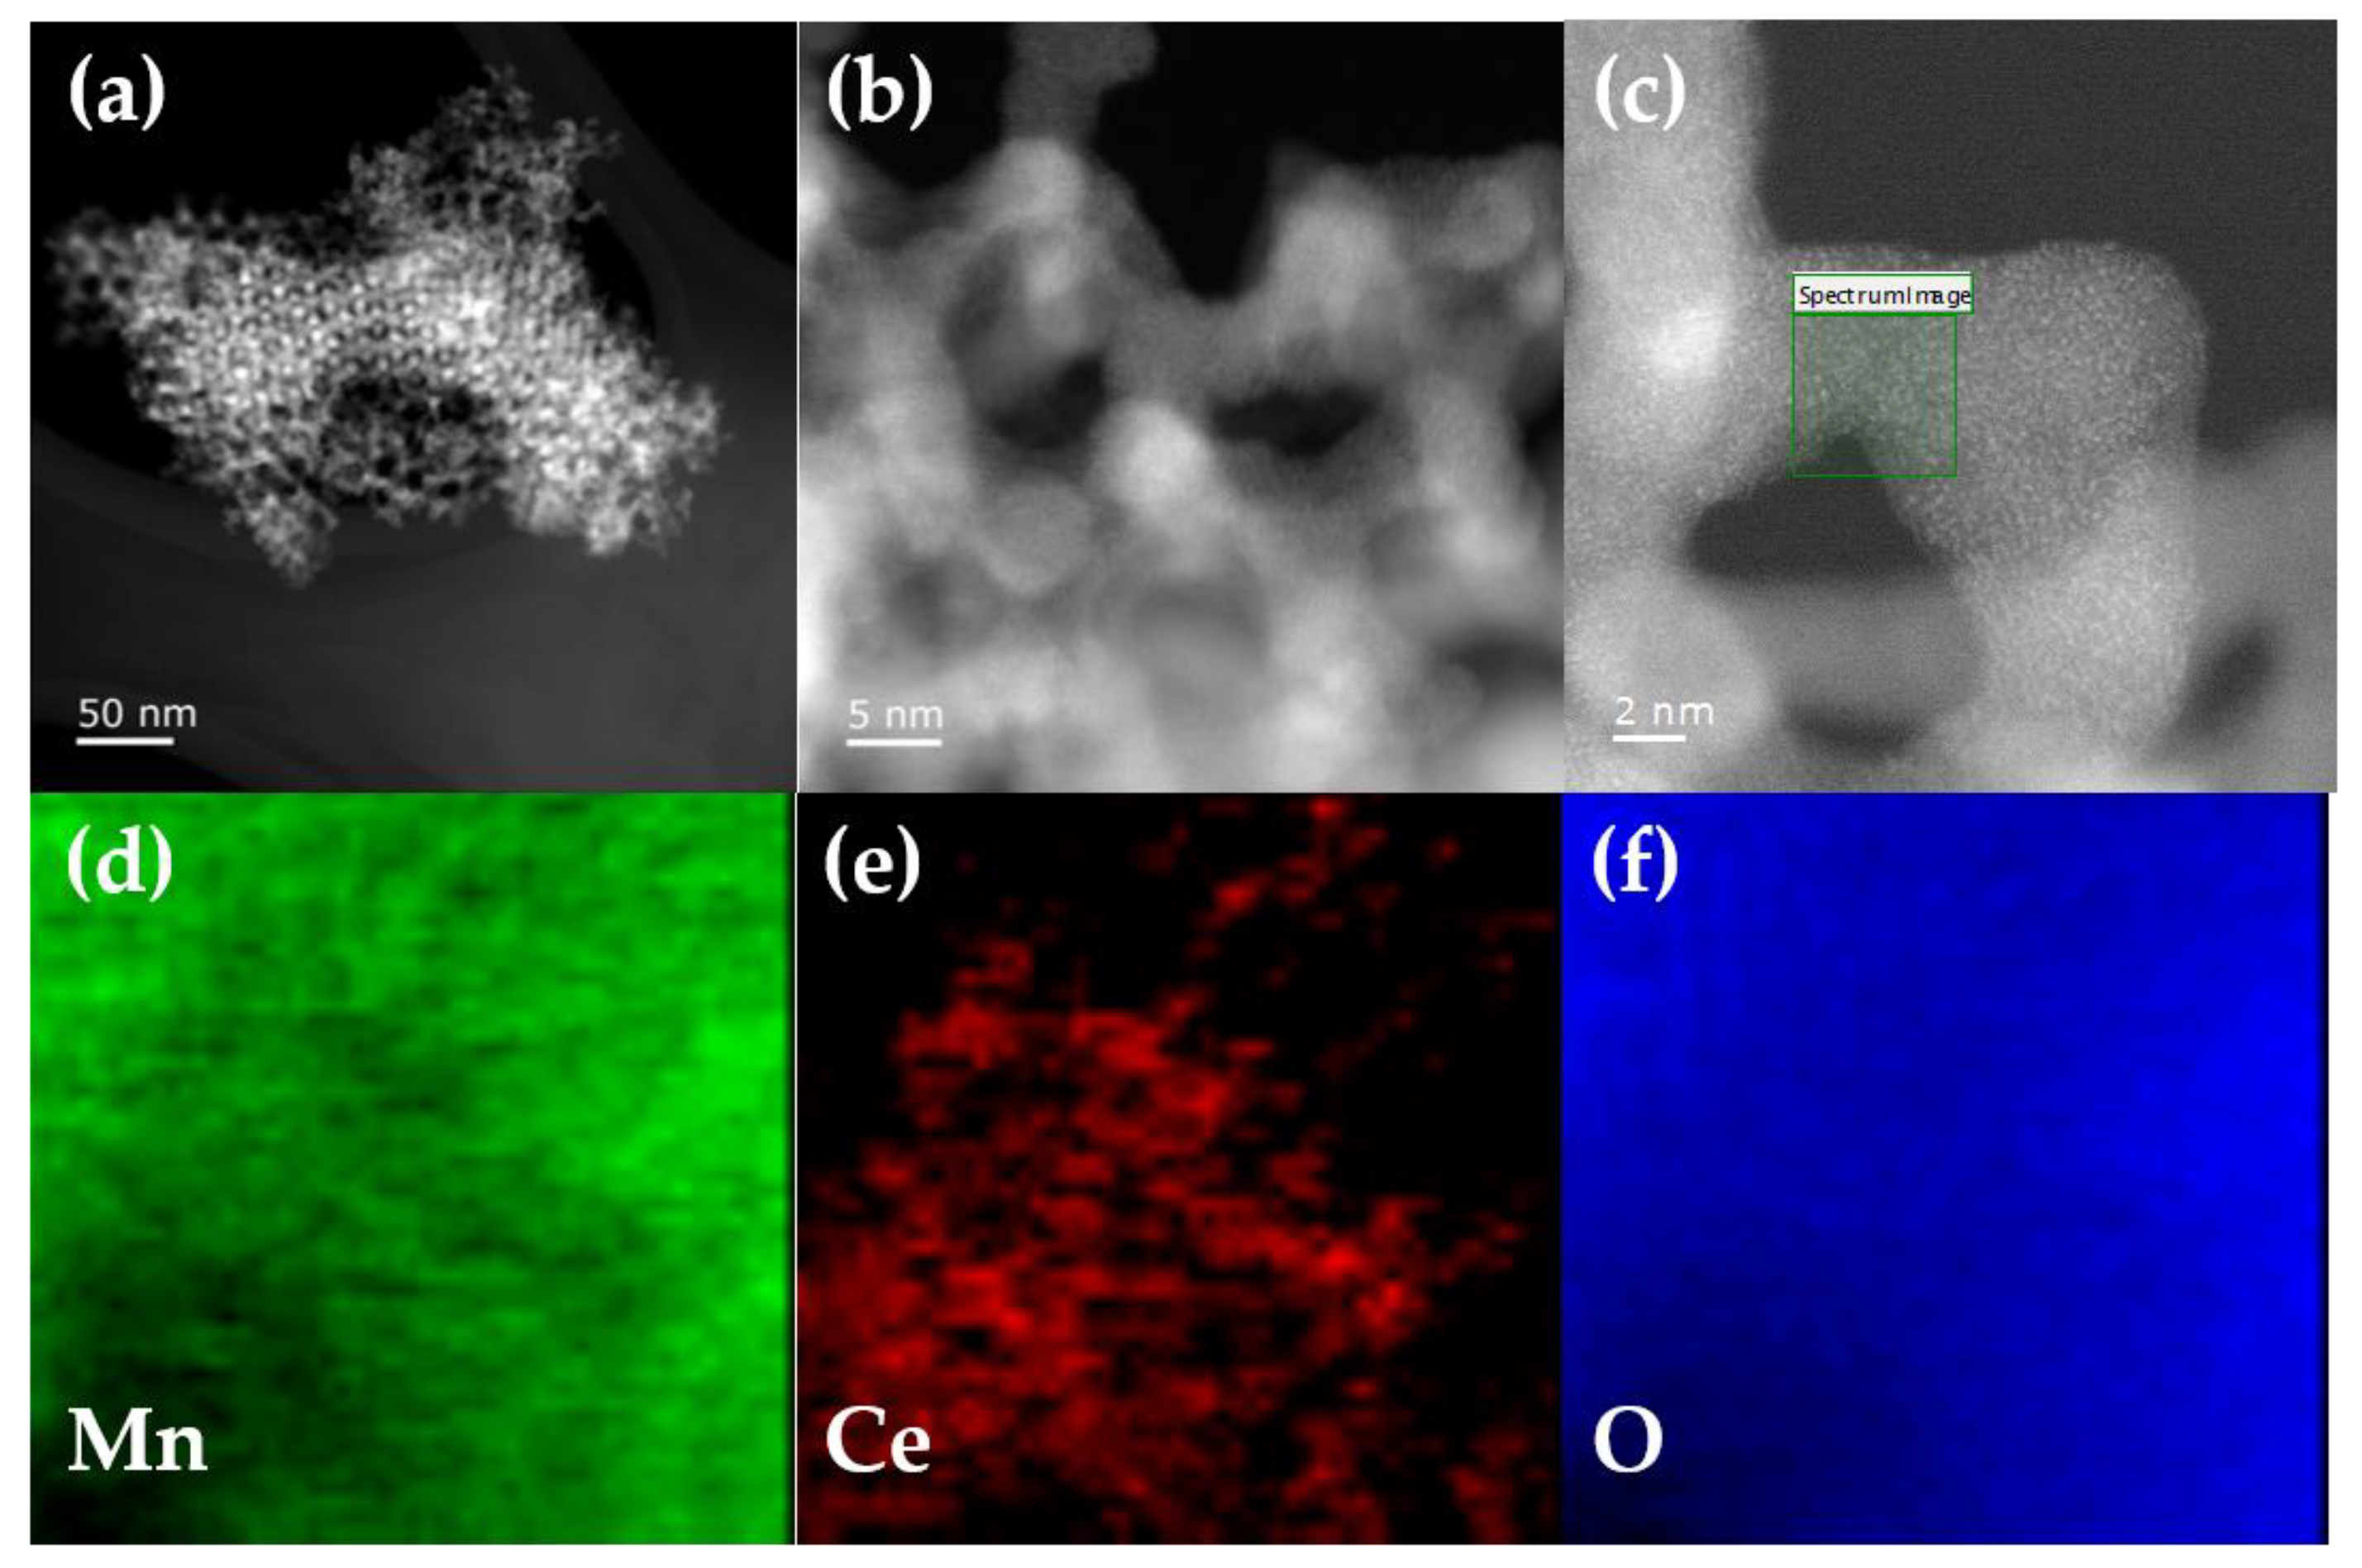
To investigate the synthesized catalysts’ structural and chemical uniformity, high-resolution TEM (HRTEM) and EDS were performed. As shown in Figure 4a–c, typical TEM images were taken at different magnifications. Figure 4a illustrates that 9MnO2–1CeO2 had the same structural properties as porous MnO2, indicating that the addition of Ce did not affect catalyst synthesis by using KIT-6 as a hard template [26]. The average pore diameter of 9MnO2–1CeO2 measured 8.7 nm, which complied with the BET results of 9MnO2–1CeO2 listed in Table 1 and was consistent with that of mesoporous MnO2 synthesized from the KIT-6 template. Moreover, after magnifying the framed spectrum image in 4c, EDS elemental mapping of Mn (Figure 4d) and Ce (Figure 4e) also verified highly-dispersed CeO2 in MnO2.
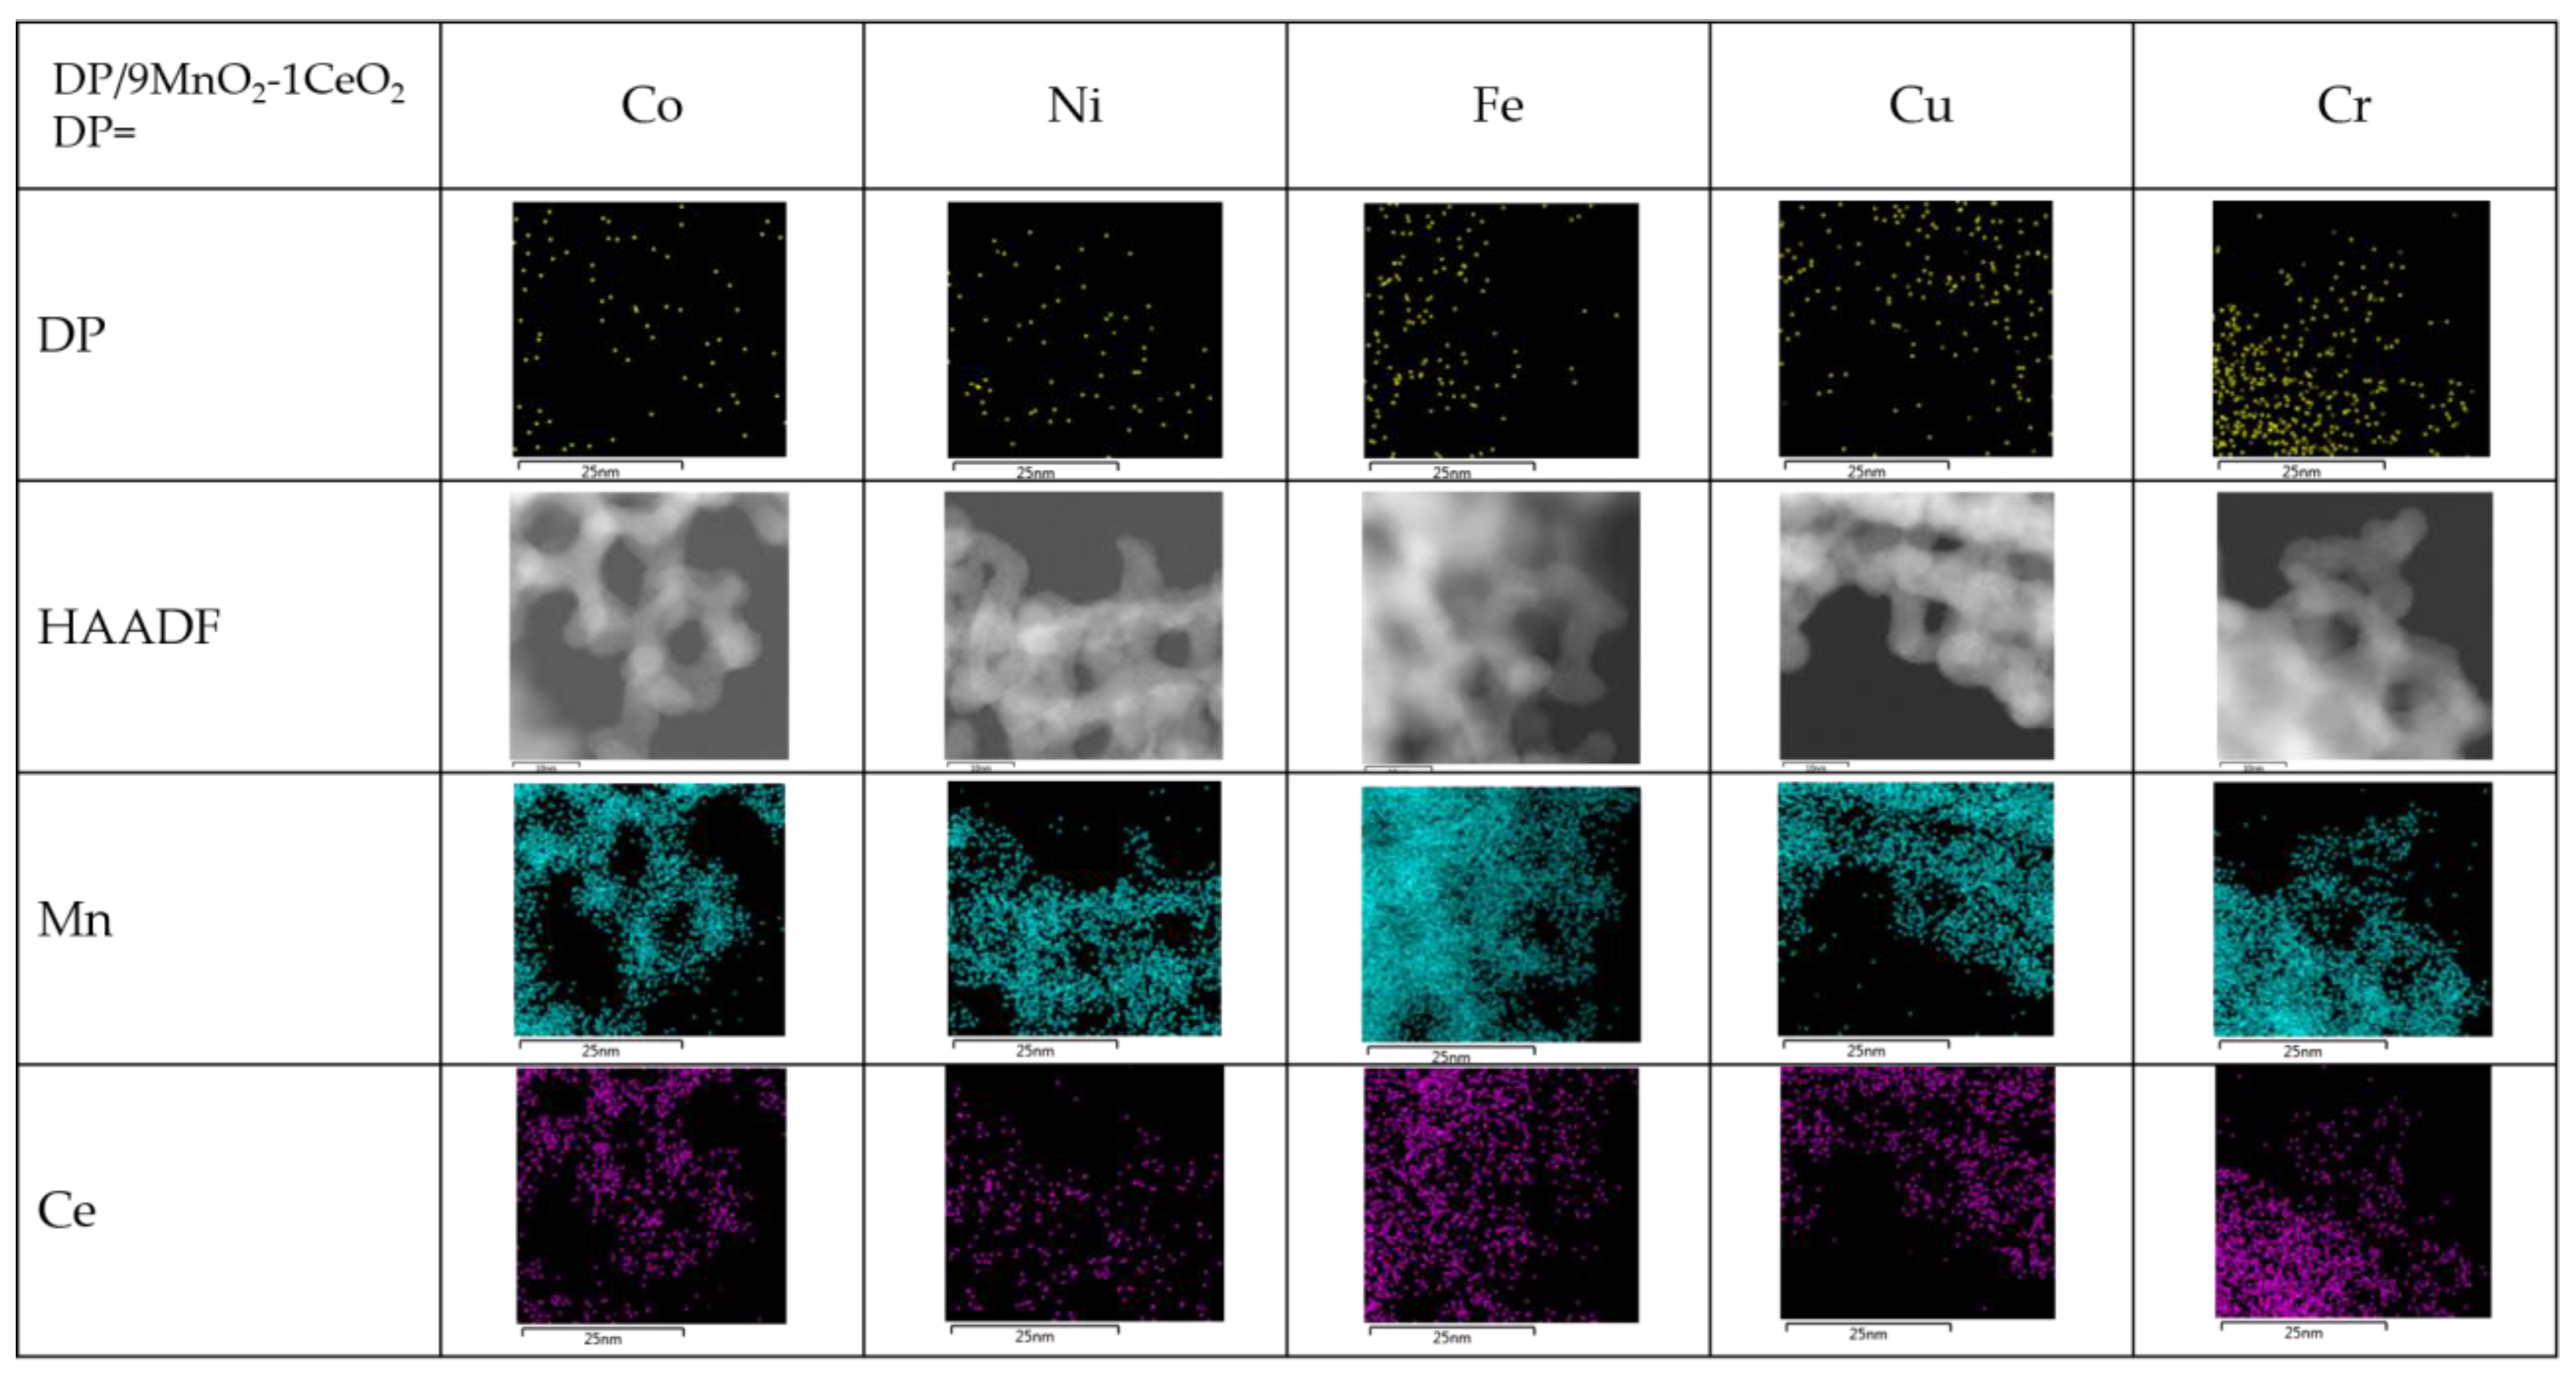
EDS elemental mapping illustrated the metal signal dispersion of Mn, Ce, and DP (dopants = Co, Ni, Fe, Cu, Cr) in five catalysts (Figure 5) using 9MnO2–1CeO2 as the supporting catalyst. Elemental mappings of Co, Ni, Fe, Cu, and Cr revealed that all DPs were successfully and separately doped into their corresponding Mn–Ce catalysts. No obvious aggregations of DP were observed for DP/9MnO2–1CeO2; high-angle annular dark-field scanning TEM (HAADF-STEM) images revealed that the mesoporous structure of all catalysts was maintained after loading different transition metals onto the catalyst surface by the wet impregnation method.
2.1.4. X-ray Photoelectron Spectroscopy (XPS) Analysis
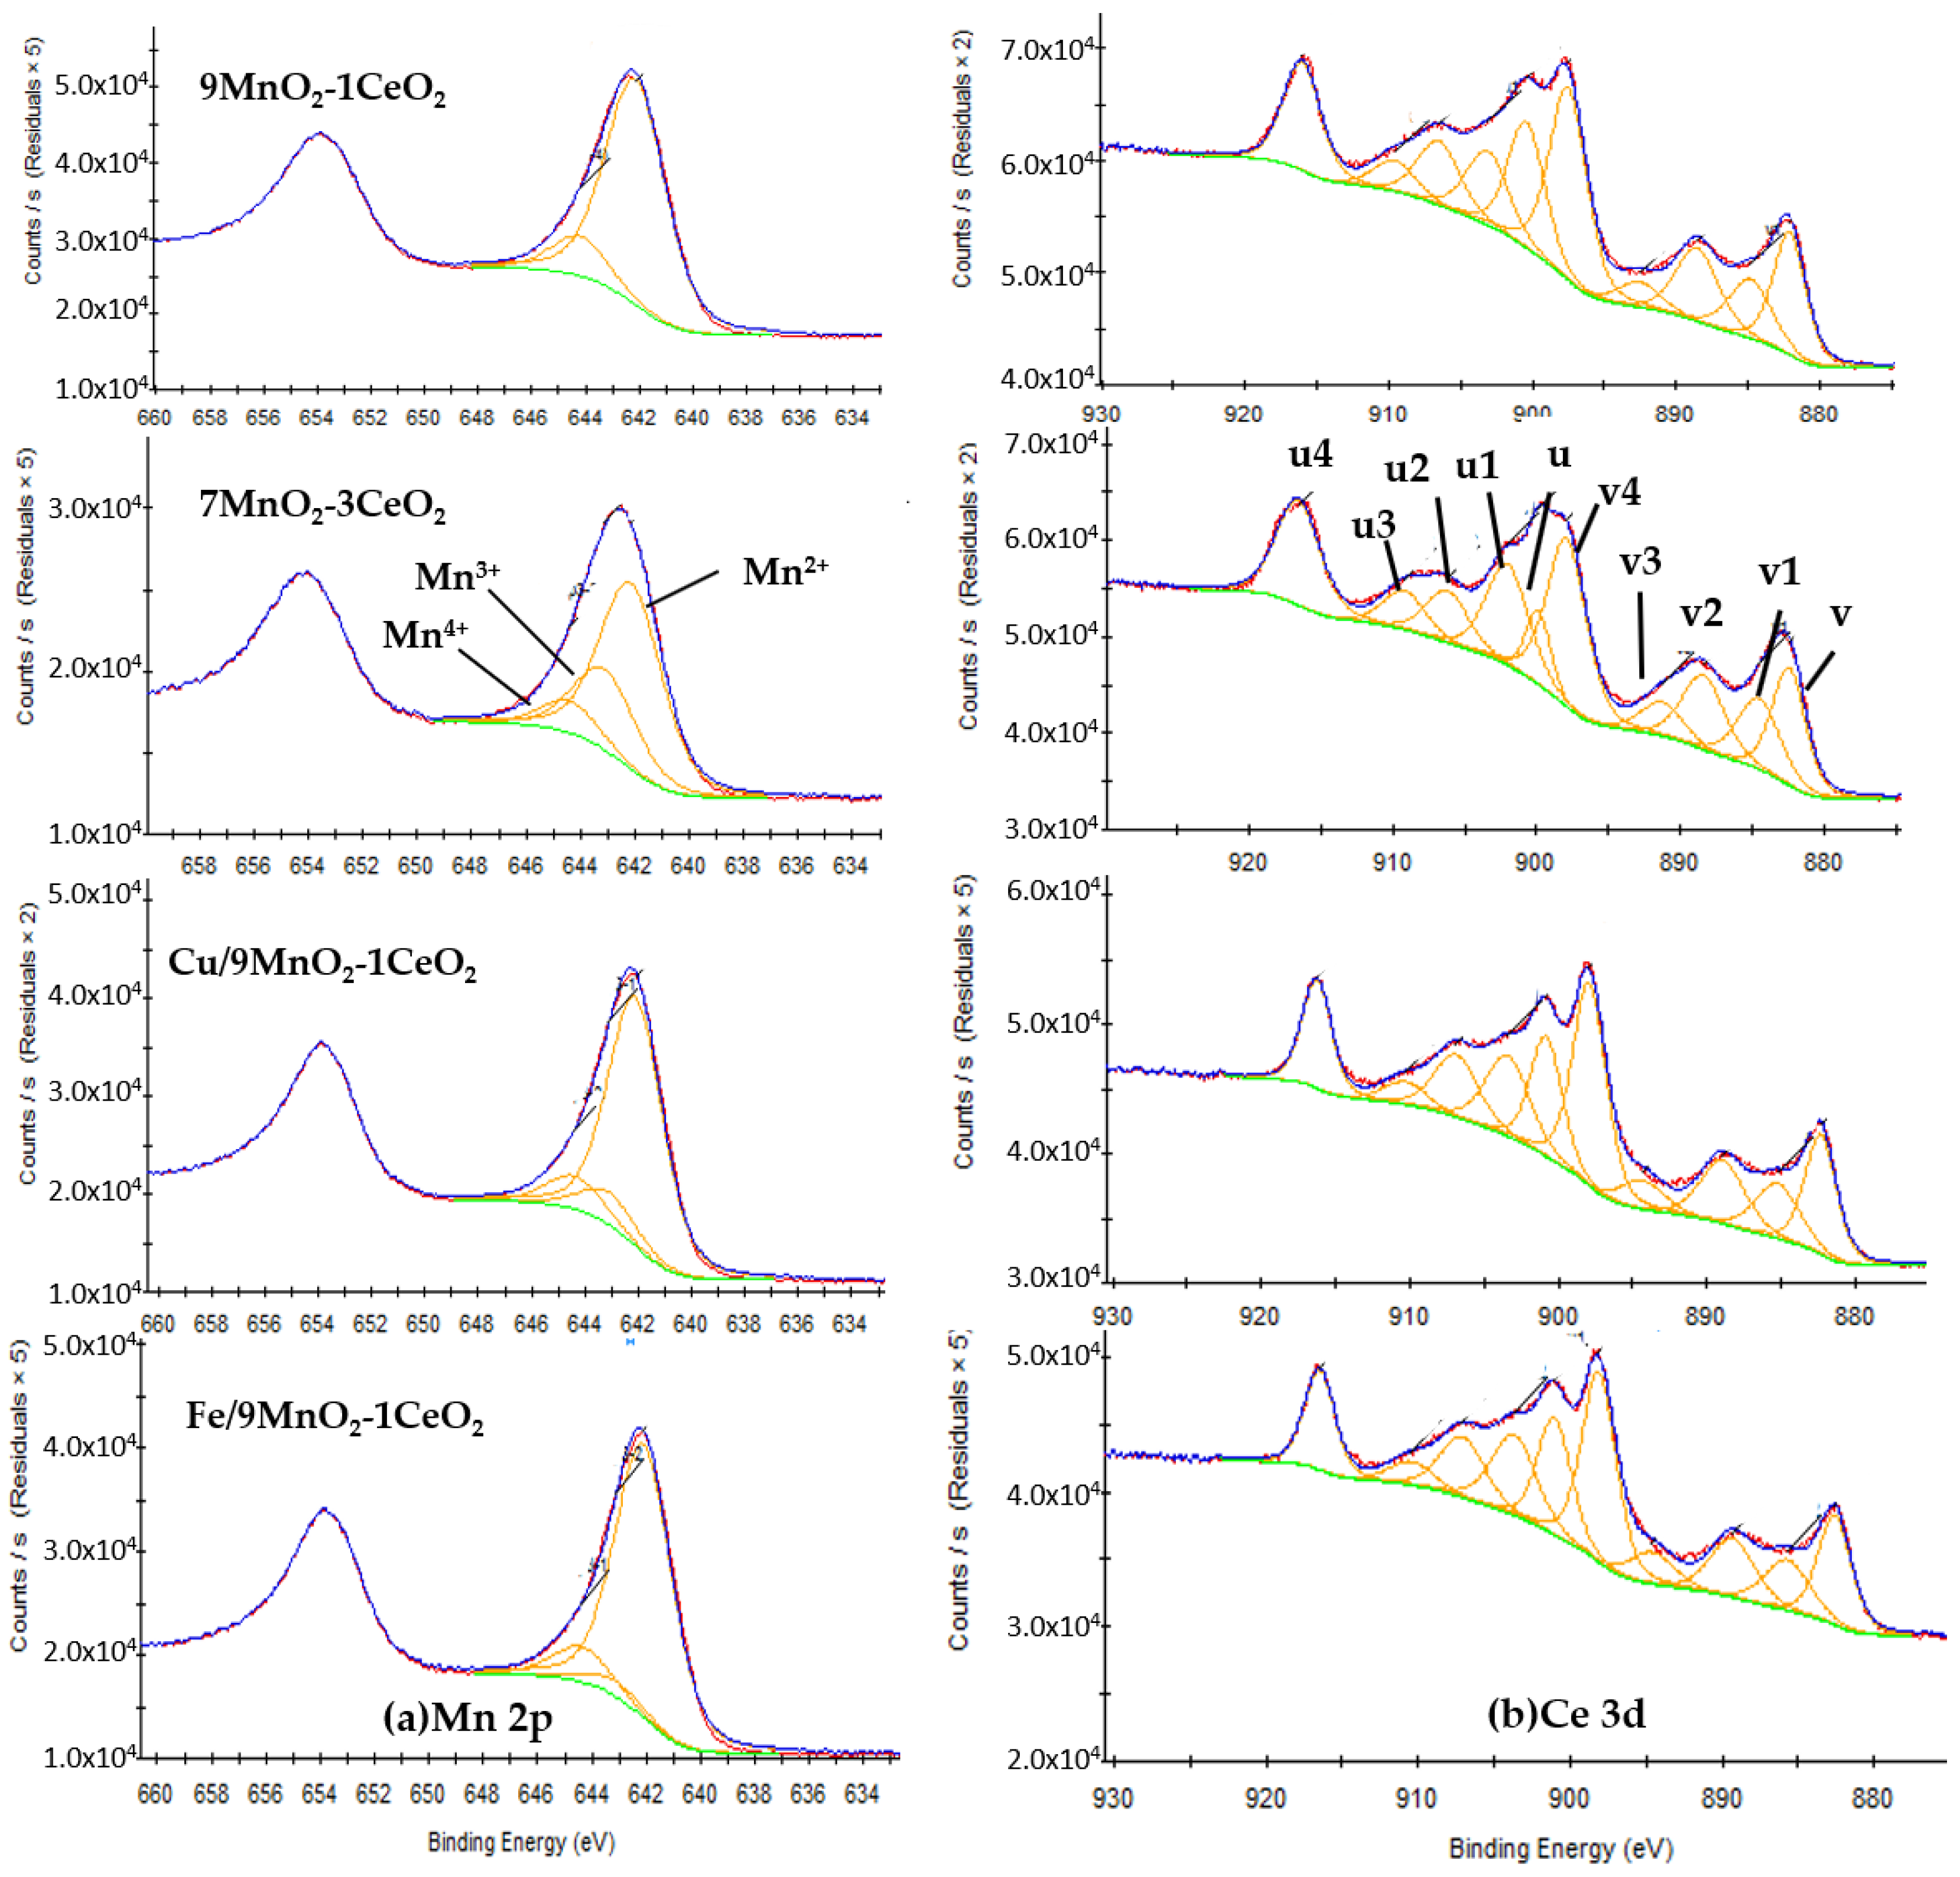
X-ray photoelectron spectroscopy was used to analyze the surface elemental compositions and oxidation states of catalysts. The Mn 2p and Ce 3d XPS spectra of selected catalysts are presented in Figure 6. Proportions of the surface compositions of the catalysts were calculated from the XPS results and are shown in Table 3. The Mn 2p spectrum (Figure 6a) of all samples, beside 9MnO2-1CeO2, can be deconvoluted into three distinguished peaks at 642.3 eV, 643.1 eV, and 644.4 eV (binding energy), which can be ascribed to Mn2+, Mn3+, and Mn4+ [27], respectively, confirming the coexistence of three kinds of Mn species. The signal of Mn3+ in 9MnO2-1CeO2 was not detected, supposing the amount of this oxidation state to be below the detection limit. The ratio of (Mn2++ Mn3+)/Mn4+ increased from 6.3 (9MnO2-1CeO2) to 8.1 (Cu/9MnO2-1CeO2) and 8.2(Cu/9MnO2-1CeO2), suggesting that the Mn ions obtained electrons in the systems (the valence of partial Mn ions dropped from +4 to +2 and +3) after doping trace Cu and Fe on 9MnO2-1CeO2. In the Ce 3d spectra (Figure 6b), the peaks labeled as v, v2, u, and u2 belonged to Ce3+, and the v1, v3, v4, and u1, u3, u4 belonged to Ce4+ [28]. The ratios of Ce3+/Ce4+ decreased from 0.75 to 0.52 after increasing the ceric molar ratio from 10% to 30%, indicating that oxygen vacancy decreased with added amounts of cerium ion. It could be concluded that doping transition metals on 9MnO2-1CeO2 resulting in optimal Mn/Ce not only provided more oxygen vacancy by sustaining higher Ce3+/Ce4+ ratio but also promoted catalytic activity by reducing Mn4+ to Mn2+ and Mn3+.
2.2. Catalytic Performance Results
Table 4 presents results on the catalytic activities of different mesoporous catalysts for comparison. All the catalytic materials listed in Table 4 were synthesized by our group for various oxidation catalysis purposes. For NO oxidation in this study, we compared their catalytic effects to verify if the mesoporous mMnO2-nCeO2 materials possess the desired catalytic ability for this study. The oxidation process began at room temperature, and the temperature was steadily increased to 200 °C, wherein NO oxidation to NO2 proceeded in the presence of a catalyst. The temperature of NOx stream in tail-end flue gas was generally below 200 °C, and the reaction temperature of fast SCR was approximately 200–250 °C; therefore, the temperature of ½-fraction NO oxidation should be lower than 200 °C. A concentration between 200–300 ppm of the NO inlet was maintained in accordance with the typical flue gas concentration range. At 200 °C, MnO2 and Co3O4 oxidized 56.8% and 55.6% of NO into NO2, respectively. The conversion rates of Pt/Cr2O3 and Pt/Fe2O3 measured only 29.8% and 35.7%, respectively. These findings agreed with those in the literature [29] on the superior performance of mesoporous MnO2, particularly 3D-MnO2, as an oxidation catalyst. Precious metals such as Pt [30] and Rh [31] dispersed on specific metal oxides with a high oxygen storage capacity (e.g., CeO2 and Fe2O3) are highly active for oxidation reaction; however, this study doped Pt in mesoporous Cr2O3 and Fe2O3 to promote their activity and no reaction of note was observed from Pt/Cr2O3 and Pt/Fe2O3, which implied that neither of these metal oxides were ideal supporting catalysts of NO oxidation for our purposes. Conversely, the doping of MnO2 with Rh or Co led to an increase in activity at 200 °C from 56.8% to 59.1% (Rh/MnO2) and to 61.5% (Co/MnO2), respectively. The optimal tested catalysts were 9MnO2–1CeO2 and 7MnO2–3CeO2, which yielded 71.0% and 65.0% of NO converted to NO2, respectively. Ce was added onto MnO2 to improve the oxygen storage capacity and oxygen mobility of the catalyst. The Ce addition resulted in a higher activity (71.0%) of 9MnO2–1CeO2 compared with that of 7MnO2–3CeO2 (65.5%), which indicated that the proper addition of CeO2 enhanced the metal–support interaction and increased the reducible phase, thus benefitting the reaction. Because Ce mixed with mesoporous MnO2 catalysts had a higher oxidation ability, the observation of 50% NO oxidation to NO2 at lower temperatures was expected.
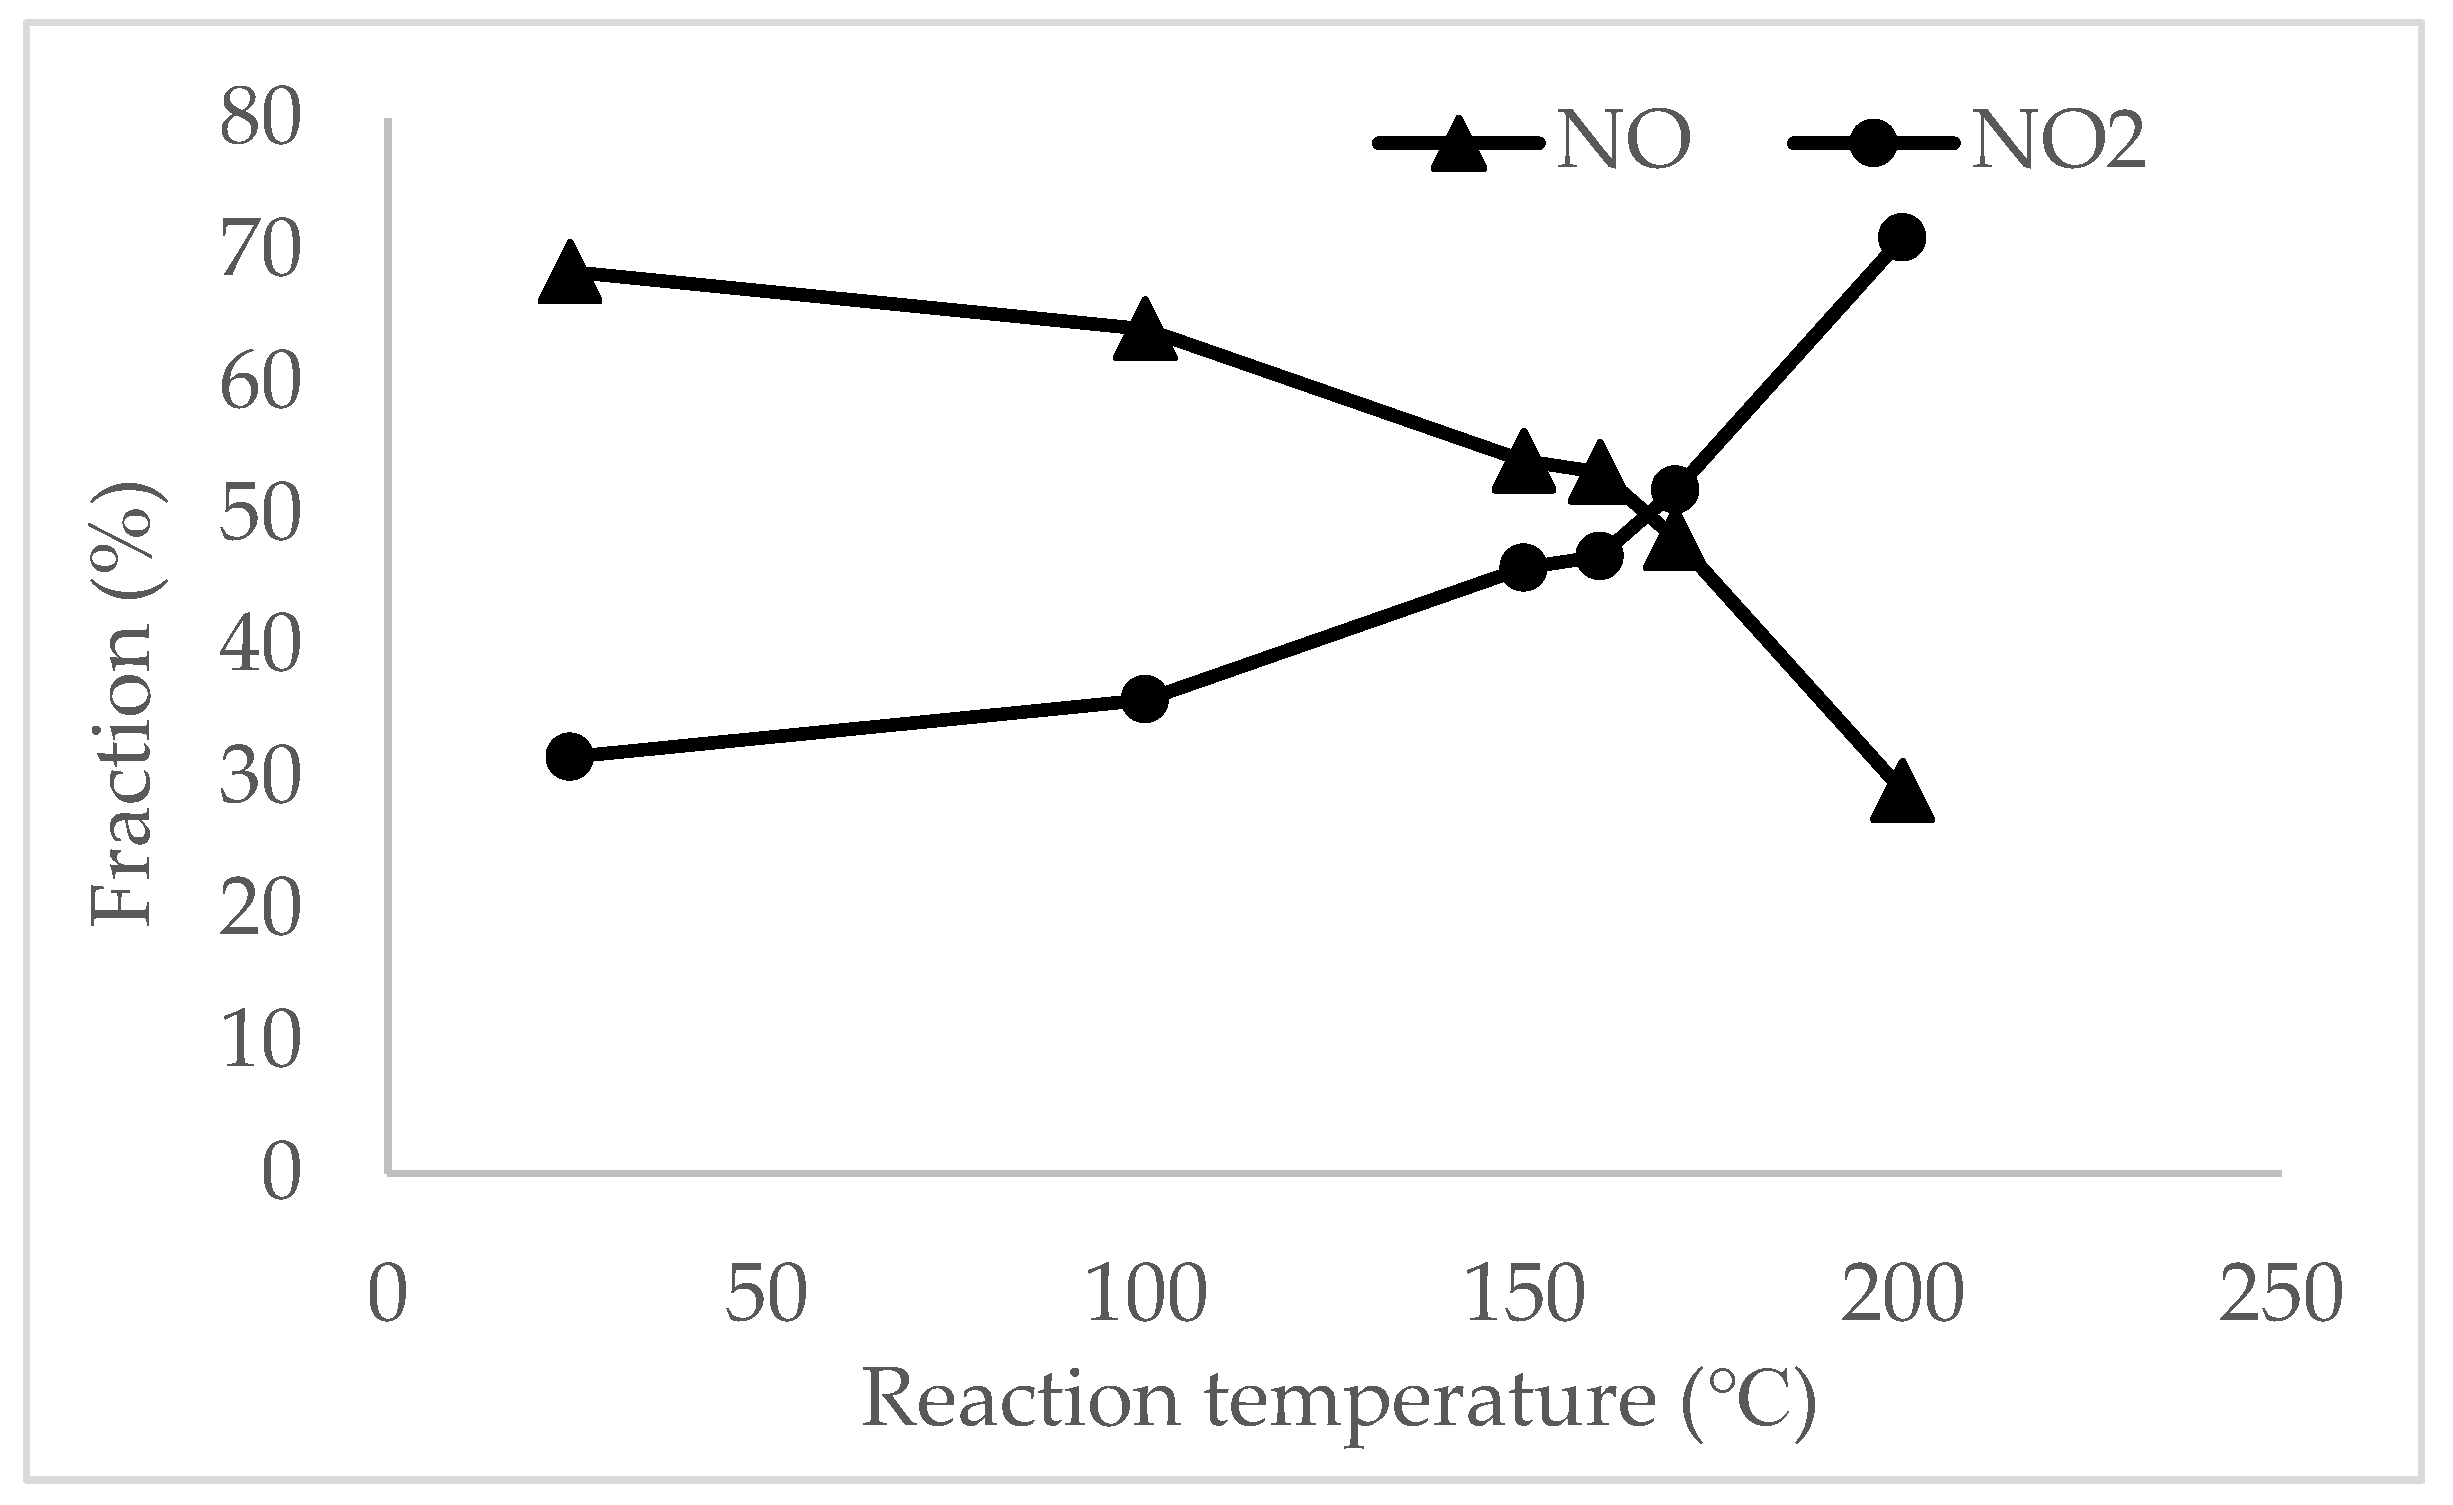
Figure 7 presents the NO curve of oxidation against the reaction temperature of 9MnO2–1CeO2. NO2 concentration increased whereas NO concentration decreased with temperature. The ratio of NO:NO2 reached 1:1 at 167 °C. Although studies have indicated that oxygen from NO, gaseous O2, and catalyst oxygen all function as oxygen sources for the formation of N2O [5], the results of Fourier transform infrared (FT-IR) spectroscopy verified that inlet NO was oxidized to NO2 and no other species were observed. Furthermore, the oxidation of NO to NO2 by mMnO2–nCeO2 avoided the formation of N2O because of the catalyst’s characteristics and the mild reaction conditions. For the same experimental conditions, an equimolar gas of NO and NO2 over 7MnO2–3CeO2 was also observed at 172 °C (Table 4).
To better evaluate the catalytic activity, kinetic parameters were calculated according to the following equation from the NOx conversion [32,33].
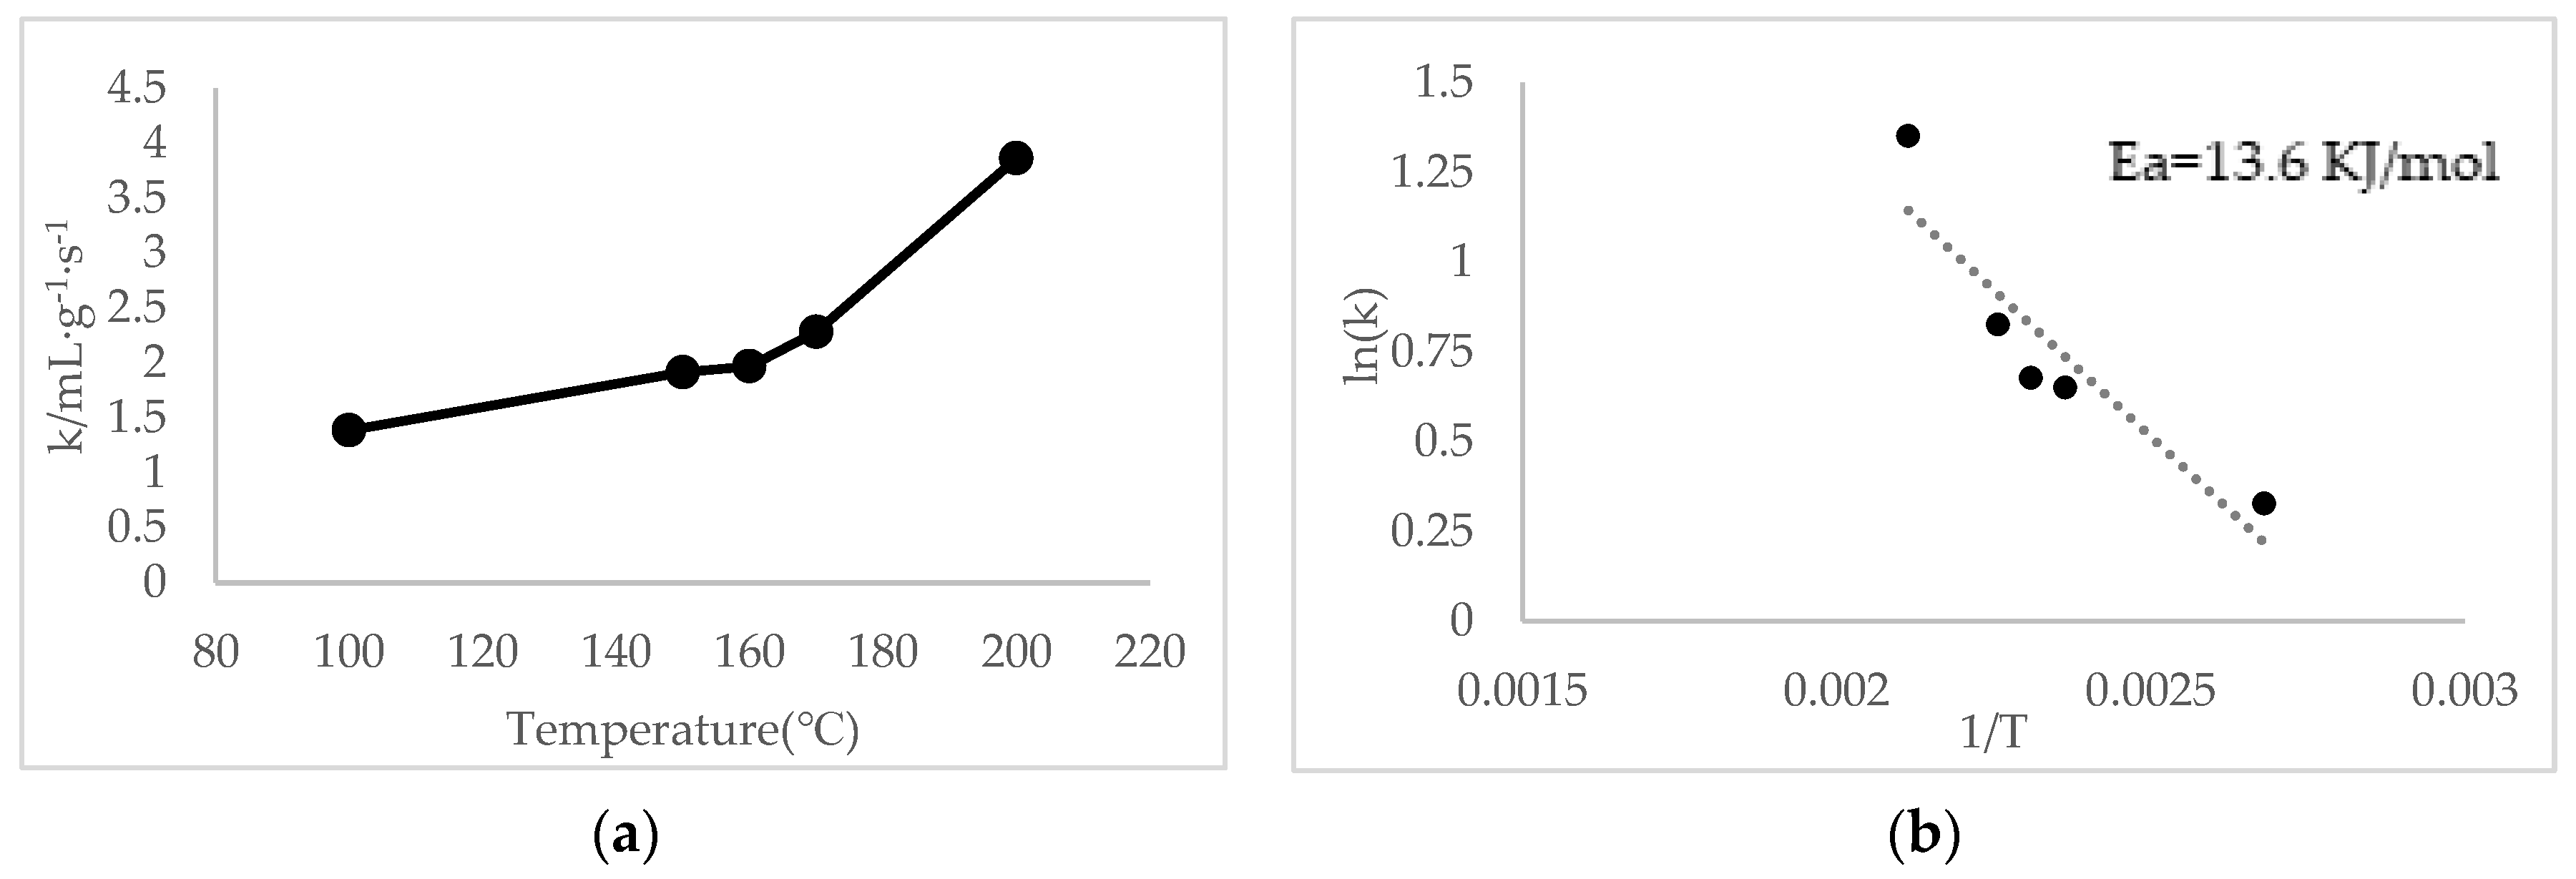
where k is the reaction rate coefficient (mL g−1 s−1), V is the total gas flow rate (mL s−1), W is the mass of catalysts in the quartz reactor, and x is the conversion of NO to NO2 in the testing activity. This equation is based on the theory that the reaction is first-order dependent on NO and zero-order dependent on O2. As shown in Figure 8a, it was observed clearly that the catalytic reaction rate of 9MnO2–1CeO2 at high temperature is much greater than that at low temperatures and the rate constant for oxidation of 50% NO to NO2 at 167 °C was 2.5 mL g−1 s−1. The apparent activation energy was calculated using the Arrhenius equation given by
In Equation (4), Ea is the apparent activation energy. It can be calculated from the slope of the curve ln(k) versus 1/T, as shown in Figure 8b. The apparent activation energy of NO oxidation reaction on the 9MnO2–1CeO2 was 13.6 kJ/mol, which is lower than that of pure nanorod MnO2 (Ea = 20.9 kJ/mol) [34], commercial Cu-zeolite (Ea = 29~31 kJ/mol) [35], and Pt/Al2O3 (Ea = 39 kJ/mol) [36]. This result was also consistent with that of 9MnO2–1CeO2, which oxidized 50% NO to NO2 at a lower temperature than that of pure MnO2 (Table 4).
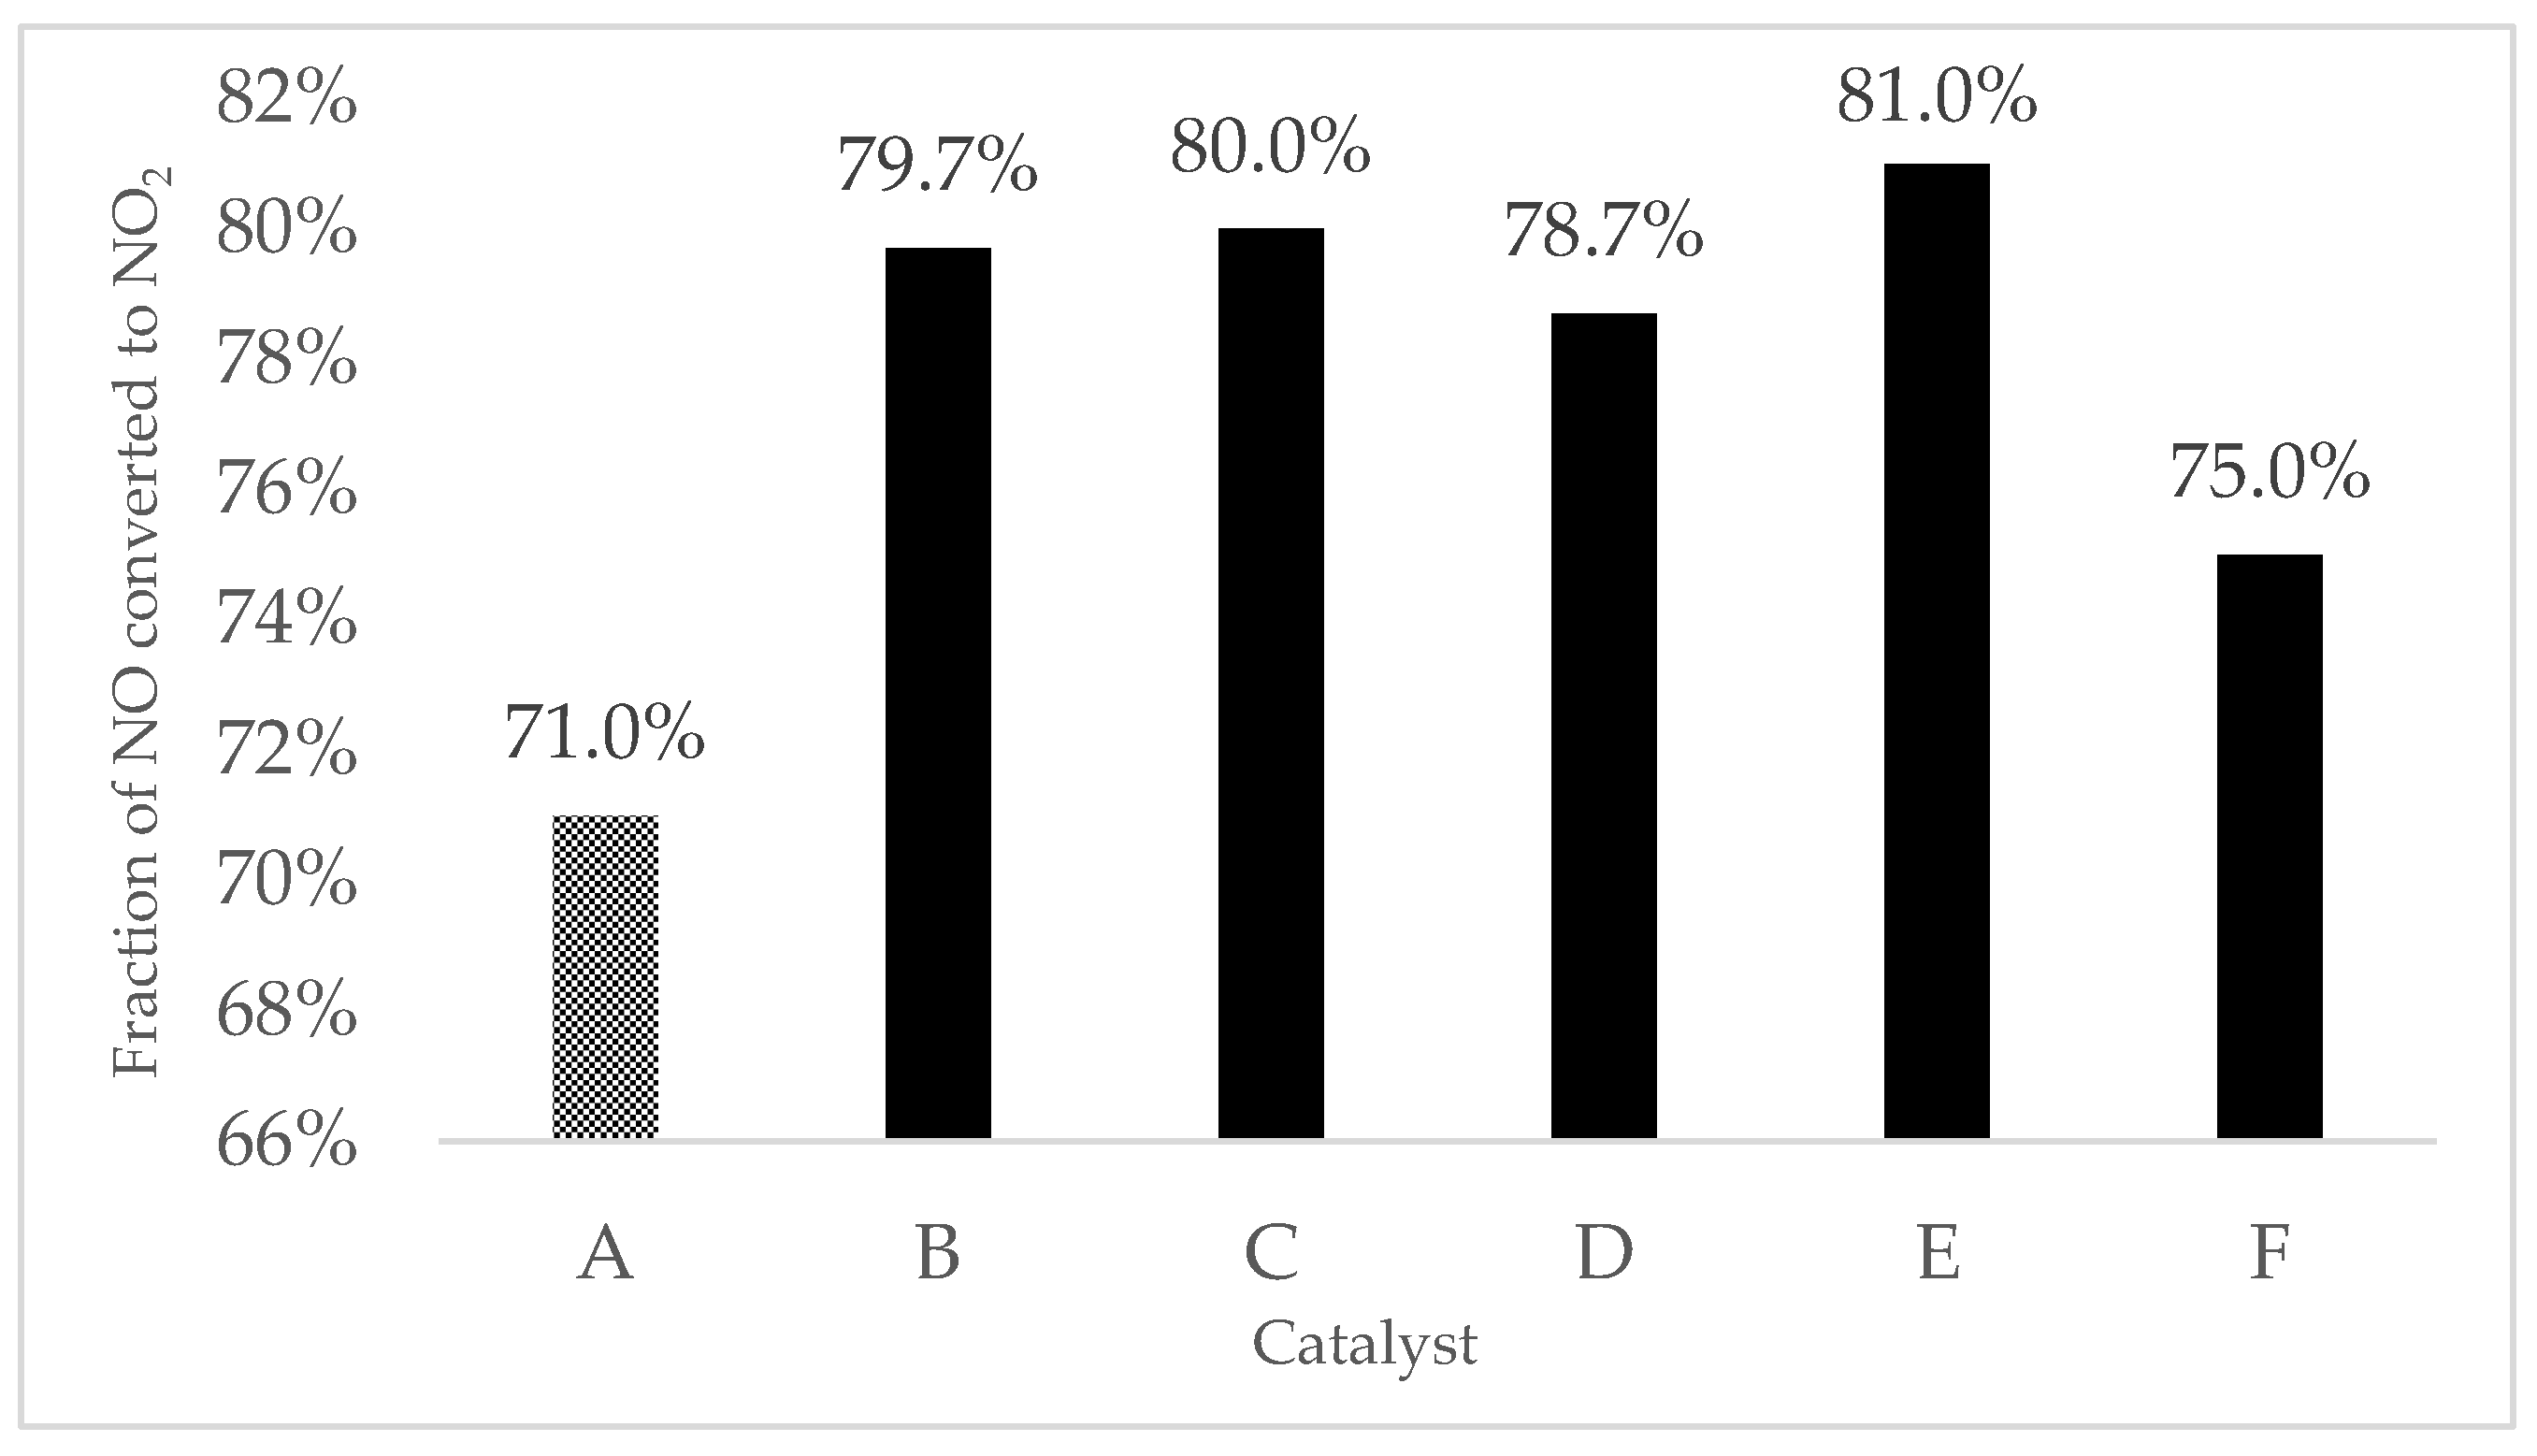
Replacing a small fraction of cations in a supporting metal oxide with a different cation served as a useful strategy for improving catalytic activity. To investigate the effect of transition metal doping on lower catalytic temperature, five transition metals (Co, Ni, Fe, Cu, and Cr) were individually loaded on 9MnO2–1CeO2 because of its promising NO oxidation capability and then tested for their catalytic activity based on equimolar oxidation from NO to NO2. Metal doping increased low-temperature oxidation activity (Figure 9). The catalytic activity test indicated that all doped 9MnO2–1CeO2 exhibited enhanced NO oxidation activity. When 9MnO2–1CeO2 was doped by transition metals, the fraction of NO converted to NO2 at 200 °C increased from 71.0% to 79.7% (Co/9MnO2–1CeO2), 80.0% (Ni/9MnO2–1CeO2), 78.7% (Fe/9MnO2–1CeO2), 81.0% (Cu/9MnO2–1CeO2), and 75.0% (Cr/9MnO2–1CeO2)—that is, 50% NO oxidation to NO2 occurred at a lower temperature compared with pristine 9MnO2–1CeO2. Among the transition metals, Cu, Ni, Co, Fe, and Cr exhibited the highest to lowest oxidation activity, respectively; all transition metals had higher oxidation activity levels than pristine 9MnO2–1CeO2. Cu exhibited the highest activity among all five doped mesoporous 9MnO2–1CeO2 and increased NO oxidation activity by 20% at 200 °C compared with pristine 9MnO2–1CeO2. This finding agreed with those of a previous study [16] in which density functional theory calculations indicated that Cu doping may facilitate the formation of oxygen vacancies in MnO2 more effectively than in Fe, Co, and Ni doping. In addition, all doped mesoporous 9MnO2–1CeO2 exhibited higher NO oxidation activity than pristine 9MnO2–1CeO2, demonstrating that metal doping constitutes a feasible method of increasing the catalytic activity of 9MnO2–1CeO2.
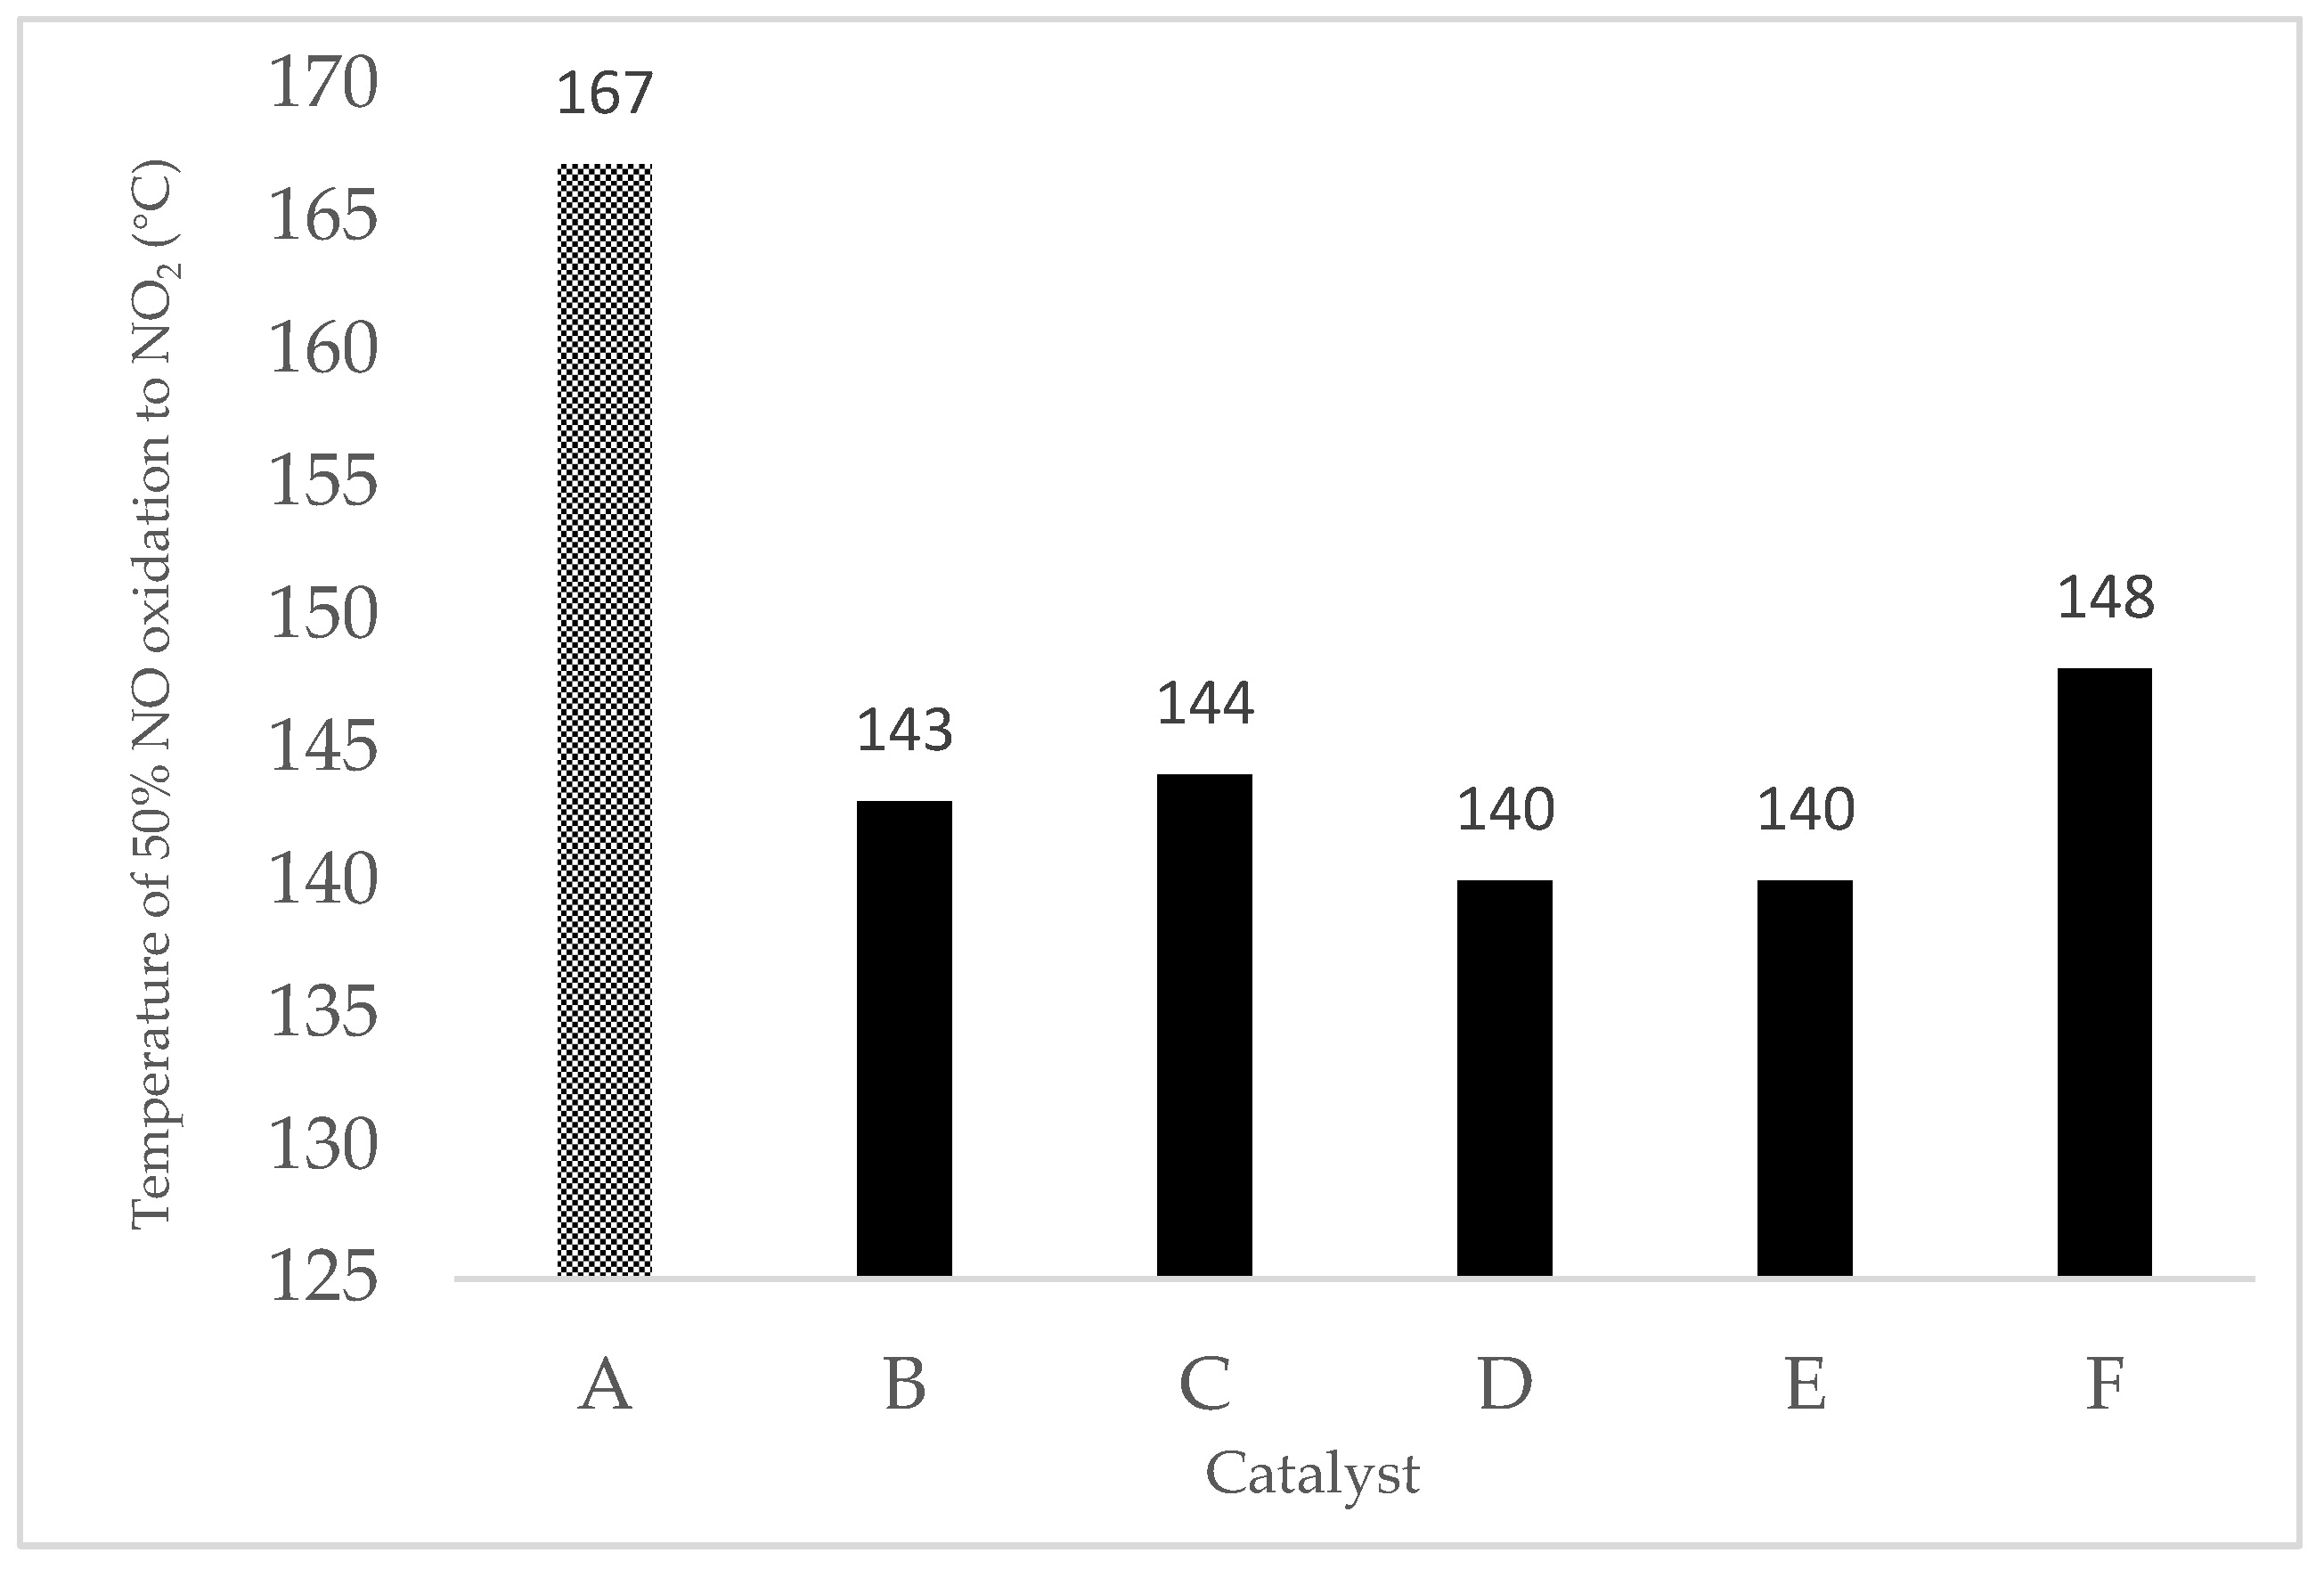
Figure 10 indicates that the reaction temperature of NO:NO2 reached 1:1 for doped and pristine 9MnO2–1CeO2. As in Figure 9, Cu/9MnO2–1CeO2 exhibited the best catalytic activity and achieved equimolar NO:NO2 at 140 °C. Although Fe/9MnO2–1CeO2 had lower NO oxidation activity compared with Ni/9MnO2–1CeO2 and Co/9MnO2–1CeO2 at 200 °C, Fe/9MnO2–1CeO2 and Cu/9MnO2–1CeO2 both exhibited better equimolar NO:NO2 performance at 140 °C. Figure 10 also indicates that all doped mesoporous 9MnO2–1CeO2 had a lower reaction temperature of equimolar NO and NO2 compared with pristine 9MnO2–1CeO2.
Because 9MnO2–1CeO2 exhibited higher catalytic activity than other compounds in Table 4 and its Fe- and Cu-doped species revealed the most promising NO oxidation activity, the effects of Fe- and Cu-doped 7MnO2–3CeO2 on equimolar catalysis of NO and NO2 were further studied (Table 5). Although 9MnO2–1CeO2 converted a higher fraction of NO to NO2 at 200 °C and had better oxidation activity, no obvious difference in reaction temperature for 50% NO oxidation to NO2 was found after doping Cu and Fe.
Studies have indicated that Al2O3 is an ideal support for NO catalytic oxidation because of its thermal stability [37]; perovskite-type oxides are another group of promising catalysts for NO oxidation due to their low cost, good activity, and thermal stability [38,39]. Al2O3 doped with several precious metals and perovskite-type catalysts was studied to compare their NO oxidation activity with those of DP/mMnO2–nCeO2 in this present study (Table 6). The data revealed that DP/mMnO2–nCeO2 still converted 50% NO to NO2 with the highest level of energy efficiency.
2.3. Mechanisms of NO Oxidation and Fast SCR
The fast SCR reaction has a smaller activation energy (≈38 kJ/mol) compared with the standard SCR reaction (≈64 kJ/mol). This resulted in a reaction rate difference between the two reactions with a factor of ≈10 at 200 °C. The fast SCR reaction is derived from two equations involving NH4NO3, an intermediate from NH3, as depicted in reactions (5) and (6). NO2 is a critical component of fast SCR. As mentioned, the oxidation of NO plays a vital role in fast SCR.
2NO2 + 2NH3 → NH4NO3 + N2 + H2O
NH4NO3 +2NO → N2 + 2NO2 + 2H2O
(5) + (6) → (2) (NO + NO2 + 2NH3 → 2N2 + 3H2O fast SCR)
Tang et al. [45] studied the mechanism of NO catalytic oxidation over MnOx. The most likely process of NO oxidation to NO2 over MnOx was described as the following: first, NO was absorbed on Mn sites and the resulting nitrosyls (M–N=O) were oxidized to form nitrates (NO3−); finally, the product NO2 was formed and released after the decomposition of nitrates. Zhong et al. [46] also proposed the possible reaction pathways of NO oxidation on Ce sites. An oxygen vacancy on Ce could bond O2 to form superoxide radicals (O2−), resulting in the formation of free nitrates due to the strong interaction between O2− and NO. In addition, the oxygen vacancy could be recovered by Ce sites after the release of NO2. Our study results agree with these findings; we adopted a mixture of Mn and Ce oxides as supporting catalysts and used doped transition metals to lower the oxidation temperature of converting 50% NO oxidation to NO2.
3. Materials and Methods
3.1. Materials
Analytical grade metal precursor chemicals and organic solvents were purchased from Sigma–Aldrich (St. Louis, MO, USA), Thermo Scientific (Waltham, MA, USA), and Alfa Chemicals (Binfield, Bracknell Forest, UK). Deionized (DI) water was used as the solvent in all experiments. All chemicals and reagents were used directly as received without further purification.
3.2. Preparation
3.2.1. Mn–Ce Catalyst Preparation
9MnO2–1CeO2
The 9MnO2–1CeO2 catalyst was prepared using two solvent methods. First, 4.67 g (18.6 mmol) of Mn(NO3)2·4H2O (MW = 251.01) and 0.90 g (2.07 mmol) of Ce(NO3)3·6H2O (MW = 434.22) were dissolved in 10.24 mL of DI to form a Mn salt and Ce salt solution. Second, 5.12 g of the mesoporous KIT-6 template (synthesis method [47]) was dispersed in 64 mL of toluene and stirred completely to form a KIT-6 dispersion. Next, the KIT-6 dispersion was added to the Mn salt and Ce salt solution. The mixed solution was heated at 65 °C and slowly stirred to volatilize the water and toluene until a powder formed; the powder was then calcined at 300 °C for 3 h to form MnO2–CeO2 (9:1) inside the mesopores of the KIT-6 template. Subsequently, the MnO2–CeO2 containing the mesoporous KIT-6 template was dispersed in 2 M NaOH(aq) and heated to 65 ℃ with stirring for 30 min to remove the KIT-6 template. The product was collected by filtration and repeated washing with DI until a pH of 7 was achieved. Finally, the mesoporous metal oxide MnO2–CeO2 (9:1) was procured after drying at 80 ℃ for 12 h. The EDS results in atomic percentages are as follows: C (7.17), O (40.18), Na (1.22), Si (0.57), Mn (45.52), and Ce (5.34).
7MnO2–3CeO2
Similar in preparation to 9MnO2–1CeO2, the only difference was the adjustment of the molar ratio of Mn(NO3)2·4H2O and Ce(NO3)3·6H2O to 7:3. The EDS results in atomic percentages are as follows: C (7.83), O (54.65), Na (2.47), Si (2.95), Mn (22.28), and Ce (9.82).
3.2.2. DP–Mn–Ce Catalyst Preparation (DP = Fe, Co, Ni, Cu, or Cr)
Co/9MnO2–1CeO2
The Co–Mn–Ce catalysts with 9MnO2–1CeO2 were prepared by the wet impregnation method. The reactant molar ratio of Co:(Mn + Ce) was 1:100. A total 2.01 g (21.0 mmol) of M 9MnO2–1CeO2 was dispersed in 40 mL of methanol. Subsequently, 0.063 g (0.21 mmol) of Co(NO3)2·6H2O (MW = 291.03) was dissolved in 20 mL of DI, then poured slowly into the 9MnO2–1CeO2 dispersion with stirring to form a mixed solution of cobalt salt/9MnO2–1CeO2. Then, 0.08 g of NaBH4 was dissolved in 20 mL of DI and slowly added to the cobalt salt/9MnO2–1CeO2 solution and the mixture solution was stirred for another hour. The product was collected by filtration and alternate washing with DI and ethanol until a pH of 7 was achieved. Finally, the Co/9MnO2–1CeO2 was procured after drying at 80 ℃ for 12 h.
DP/9MnO2–1CeO2 and DP/7MnO2–3CeO2 (DP = Fe, Ni, Cu, or Cr)
Similar in preparation to Co/9MnO2–1CeO2, Fe(NO3)3·9H2O, Ni(NO3)2·6H2O, Cu(NO3)2·3H2O, and Cr(NO3)3·9H2O were individually loaded on the mMnO2–nCeO2 catalysts as dopants.
3.2.3. Preparation of Catalysts for Comparison between them in NO Oxidation Performance
Cr2O3, Co3O4, Fe2O3, and MnO2
Porous catalysts Cr2O3, Co3O4, Fe2O3, [48] and MnO2 were synthesized following the same method of preparation for the Mn–Ce–catalysts; 8.28 g of Cr(NO3)3·9H2O, 6.02 g of Co(NO3)2·6H2O, and 8.36 g of Fe(NO3)3·9H2O were used, respectively.
Pt/Cr2O3, Pt/Fe2O3, Rh/MnO2, and Co/MnO2
Similar in preparation to Co/9MnO2–1CeO2, 0.086 g of H2PtCl6 + 3.19 g of Cr2O3, 0.086 g of H2PtCl6 + 3.3535 g of Fe2O3, 0.0607 g of Rh(NO3)3 + 1.8257 g of MnO2, and 0.063 g of Co(NO3)2·6H2O + 1.8257 g of MnO2 were used, respectively.
3.3. Catalytic Performance: NO Oxidation to NO2
The measurement of the oxidation activity from NO to NO2 was conducted in a fixed-bed continuous flow quartz reactor with an internal diameter of 4.9 mm by temperature-programmed reaction technique. A thermocouple was placed in the region of the catalyst bed to monitor the reaction temperature; the temperature, which was monitored by a proportional–integral–derivative controller, was raised from room temperature to 200 °C. A 2 cm high (0.374 cm3) sample, which was pressed into blocks and sieved with 30 mesh, was used for the NO oxidation test. The mixed reactant gas contained the following constituents: 50 mL/min of 1000 ppm NO, 10 mL/min of 99.9% O2, and balanced N2; the total flow rate was 167 mL/min, resulting in a gas hourly space velocity of 26,791. All the catalysts were kept on stream at the target temperature for at least 30 min. The concentration of the outlet gas was measured online by an FT-IR spectrometer (Work IR-104, ABB Bomem, QC, Canada) with self-developed software. The method developed allowed the simultaneous determination of NO, NO2, N2O, and other related gases if required. The NO oxidation fraction was calculated according to the following formula: NO oxidation (%) = ([NO2]out/([NO]out+[NO2]out) × 100%, with the subscripts “out” indicating the outlet concentration at a steady state. The concentrations of the feed and the output gases were calculated from the relative peak areas of all identified gases with respect to the internal N2 standard.
4. Conclusions
This study synthesized a series of 3D-ordered mesoporous metal oxides DP/mMnO2–nCeO2 (m:n = 9:1 and 7:3) with doped metals (DP) Fe, Co, Ni, Cu, and Cr. These catalysts functioned as pre-oxidation catalysts for SCR to convert 50% NO to NO2 at 140–200 °C and lowered the SCR reaction temperature to 200 °C.
All doped mesoporous mMnO2-nCeO2 had a lower reaction temperature for equimolar NO:NO2 compared with the corresponding pristine mMnO2-nCeO2. Among them, Cu/mMnO2-nCeO2 and Fe/mMnO2-nCeO2 exhibited the best catalytic activity and achieved equimolar NO:NO2 at as low as 138–140 °C. These findings provide a feasible solution for modifying the flue gas treatment system from high-dust SCR to tail-end SCR, resulting in eventual energy savings, lower catalyst cost, and prolonged catalyst life.
Author Contributions
Conceptualization, C.-N.K.; methodology, C.-N.K. and C.-S.L.; validation, C.-N.K., C.-S.L. and Y.-L.L.; formal analysis, C.-N.K.; investigation, Y.-L.L.; resources, S.-I.Y.; data curation, C.-N.K. and C.-S.L.; writing—original draft preparation, C.-N.K.; writing—review and editing, C.-N.K.; visualization, Y.-L.L.; supervision, S.-I.Y.; project administration, C.-N.K.; funding acquisition, S.-I.Y. All authors have read and agreed to the published version of the manuscript.
Funding
This research was funded by the Department of Industrial Technology, Ministry of Economic Affairs, Taiwan (R.O.C.), grant number: 111-EC-17-A-27-0775.
Data Availability Statement
New data are contained within the article. Other data have been cited and listed in the bibliography.
Acknowledgments
The authors wish to thank the Ministry of Economic Affairs, Taiwan (R.O.C.) for funding this research.
Conflicts of Interest
The authors declare no conflict of interest.
References
- Directive (EU) 2016/2284 of the European Parliament and of the Council of 14 December 2016 on the Reduction of National Emissions of Certain Atmospheric Pollutants. Available online: http://data.europa.eu/eli/dir/2016/2284/oj (accessed on 31 March 2023).
- Bosch, H.; Janssen, F. Formation and control of nitrogen oxides. Catal. Today 1988, 2, 369–379. [Google Scholar] [CrossRef]
- Janssen, F.; Meijer, R. Quality control of DeNOx catalysts: Performance testing, surface analysis and characterization of DeNOx catalysts. Catal. Today 1993, 16, 157–185. [Google Scholar] [CrossRef]
- Damma, D.; Ettireddy, P.R.; Reddy, B.M.; Smirniotis, P.G. A Review of Low Temperature NH3-SCR for Removal of NOx. Catalysts 2019, 9, 349. [Google Scholar] [CrossRef] [Green Version]
- Zhu, M.; Lai, J.; Wachs, I.E. Formation of N2O greenhouse gas during SCR of NO with NH3 by supported vanadium oxide cata-lysts. Appl. Catal. B Environ. 2018, 224, 836–840. [Google Scholar] [CrossRef]
- Kato, A.; Matsuda, S.; Kamo, T.; Nakajima, F.; Kuroda, H.; Narita, T. Reaction between nitrogen oxide (NOx) and ammonia on iron oxide-titanium oxide catalyst. J. Phys. Chem. 1981, 85, 4099–4102. [Google Scholar] [CrossRef]
- Tuenter, G.; van Leeuwen, W.F.; Snepvangers, L. Kinetics and Mechanism of the NOx Reduction with NH3 on V2O5—WO3-TiO2 Catalyst. Ind. Eng. Chem. Prod. Res. Dev. 1986, 25, 633–636. [Google Scholar] [CrossRef]
- Jiang, B.; Lin, B.; Li, Z.; Zhao, S.; Chen, Z. Mn/TiO2 catalysts prepared by ultrasonic spray pyrolysis method for NOx removal in low-temperature SCR reaction. Colloids Surf. A Physicochem. Eng. Asp. 2020, 586, 124210. [Google Scholar] [CrossRef]
- Koebel, M.; Madia, G.; Elsener, M. Selective catalytic reduction of NO and NO2 at low temperatures. Catal. Today 2002, 73, 239–247. [Google Scholar] [CrossRef]
- Sorrels, J.L. Chapter 2: Selective Catalytic Reduction. Section 4: NOx Controls. In EPA Air Pollution Control Cost Manual. Available online: https://www.epa.gov/economic-and-cost-analysis-air-pollution-regulations/cost-reports-and-guidance-air-pollution (accessed on 31 March 2023).
- Li, P.; Xin, Y.; Li, Q.; Wang, Z.P.; Zhang, Z.L.; Zheng, L. Ce-Ti Amorphous Oxides for Selective Catalytic Reduction of NO with NH3: Confirmation of Ce-O-Ti Active Sites. Environ. Sci. Technol. 2012, 46, 9600–9605. [Google Scholar] [CrossRef]
- Liu, Z.; Yi, Y.; Zhang, S.; Zhu, T.; Zhu, J.; Wang, J. Selective Catalytic Reduction of NOx with NH3 over Mn-Ce Mixed Oxide Catalyst at Low Temperatures. Catal. Today 2013, 216, 76–81. [Google Scholar] [CrossRef]
- Tsukahara, H.; Ishida, T.; Mayumi, M. Gas-Phase Oxidation of Nitric Oxide: Chemical Kinetics and Rate Constant. Nitric Oxide 1999, 3, 191–198. [Google Scholar] [CrossRef]
- Forecasts and Trends—Total Industrial Air Pollution Control Equipment Market. In Global Industrial Air Pollution Control Equipment Market, Forecast to 2025; Frost & Sullivan: San Antonio, TX, USA, 2018.
- Xue, E.; Seshan, K.; Ross, J.R.H. Roles of supports, Pt loading and Pt dispersion in the oxidation of NO to NO2 and of SO2 to SO3. Appl. Catal. B 1996, 11, 65–79. [Google Scholar] [CrossRef] [Green Version]
- Auvray, X.; Olsson, L. Stability and activity of Pd-, Pt- and Pd–Pt catalysts supported on alumina for NO oxidation. Appl. Catal. B 2015, 168–169, 342–352. [Google Scholar] [CrossRef]
- Li, L.; Qu, L.; Cheng, J.; Li, J.; Hao, Z. Oxidation of nitric oxide to nitrogen dioxide over Ru catalysts. Appl. Catal. B 2009, 88, 224–231. [Google Scholar] [CrossRef]
- Shen, M.; Zhao, Z.; Chen, J.; Su, Y.; Wang, J.; Wang, X. Effects of calcium substitute in LaMnO3 perovskites for NO catalytic oxi-dation. J. Rare Earths 2013, 31, 119–123. [Google Scholar] [CrossRef]
- Chen, J.; Shen, M.; Wang, X.; Wang, J.; Su, Y.; Zhao, Z. Catalytic performance of NO oxidation over LaMeO3 (Me=Mn, Fe, Co) perovskite prepared by the sol–gel method. Catal. Commun. 2013, 37, 105–108. [Google Scholar] [CrossRef]
- Ramesh, K.; Chen, L.; Chen, F.; Liu, Y.; Wang, Z.; Han, Y. Re-investigating the CO oxidation mechanism over unsupported MnO, Mn2O3 and MnO2 catalysts. Catal. Today 2008, 131, 477–482. [Google Scholar] [CrossRef]
- Gao, J.; Jia, C.; Zhang, L.; Wang, H.; Yang, Y.; Hung, S.; Hsu, Y.; Liu, B. Tuning chemical bonding of MnO2 through transition-metal doping for enhanced CO oxidation. J. Catal. 2016, 341, 82–90. [Google Scholar] [CrossRef]
- Zhi, B.; Ding, H.; Wang, D.M.; Cao, Y.; Zhang, Y.; Wang, X.; Liu, Y.L.; Huo, Q.S. Ordered mesoporous MnO2 as a synergetic adsorbent for effective arsenic(III) removal. J. Mater. Chem. A 2014, 2, 2374–2382. [Google Scholar] [CrossRef]
- Sa, Y.J.; Kwon, K.; Cheon, J.Y.; Kleitz, F.; Joo, S.H. Ordered mesoporous Co3O4 spinels as stable, bifunctional, noble metal-free oxygen electrocatalysts. J. Mater. Chem. A 2013, 1, 9992–10001. [Google Scholar] [CrossRef] [Green Version]
- Cao, C.; Zhang, Y.; Liu, D.; Meng, M. Gravity-Driven Multiple Collision-Enhanced Catalytic Soot Combustion over a Space-Open Array Catalyst Consisting of Ultrathin Ceria Nanobelts. Small 2015, 11, 3659–3664. [Google Scholar] [CrossRef]
- Li, C.; Yan, S.; Lai, Y. Catalyst and Method for Manufacturing the Same and Method of Removing VOCs. Taiwan Patent I733200, 11 October 2021. [Google Scholar]
- Xu, H.; Liu, J.; Zhang, Z.; Liu, S.; Lin, Q.; Wang, Y.; Dai, S.; Chen, Y. Design and Synthesis of Highly-Dispersed WO3 Catalyst with Highly Effective NH3–SCR Activity for NOx Abatement. ACS Catal. 2019, 9, 11557–11562. [Google Scholar] [CrossRef]
- Li, H.; Qi, G.; Zhang, X.; Huang, X.; Li, W.; Shen, W. Low-temperature oxidation of ethanol over a Mn0.6Ce0.4O2 mixed oxide. Appl. Catal. B Environ. 2011, 103, 54–61. [Google Scholar] [CrossRef]
- Beche, E.; Charvin, P.; Perarnau, D.; Abanades, S.; Flamant, G. Ce 3d XPS investigation of cerium oxides and mixed cerium oxide (CexTiyOz). Surf. Interface Anal. 2008, 40, 264–267. [Google Scholar] [CrossRef]
- Bai, B.; Li, J.; Hao, J. 1D-MnO2, 2D-MnO2 and 3D-MnO2 for low-temperature oxidation of ethanol. Appl. Catal. B Environ. 2015, 164, 241–250. [Google Scholar] [CrossRef]
- Chen, G.; Zhao, Y.; Fu, G.; Duchesne, P.N.; Gu, L.; Zheng, Y.; Weng, X.; Chen, M.; Zhang, P.; Pao, C.; et al. Interfa-cial Effects in Iron-Nickel Hydroxide–Platinum Nanoparticles Enhance Catalytic Oxidation. Science 2014, 344, 495–499. [Google Scholar] [CrossRef] [PubMed] [Green Version]
- Bunluesin, T.; Cordatos, H.; Gorte, R.J. Study of CO Oxidation Kinetics on Rh/Ceria. J. Catal. 1995, 157, 222–226. [Google Scholar] [CrossRef]
- Amiridis, D.M.; Robert, V.D.; Israel, E.W. The effect of metal oxide additives on the activity of V2O5/TiO2 catalysts for the selective catalytic reduction of nitric oxide by ammonia. Appl. Catal. B Environ. 1999, 20, 111–122. [Google Scholar] [CrossRef]
- Casapu, M.; Krocher, O.; Elsener, M. Screening of doped MnOx–CeO2 catalysts for low-temperature NO-SCR. Appl. Catal. B Environ. 2009, 88, 413–419. [Google Scholar] [CrossRef]
- Tian, W.; Yang, H.; Fan, X.; Zhang, X. Catalytic reduction of NOx with NH3 over different-shaped MnO2 at low temperature. J. Hazard. Mater. 2011, 188, 105–109. [Google Scholar] [CrossRef]
- Joshi, S.; Kumar, A.; Kamasamudram, K.; Currier, N.W.; Yezerets, A. Diagnostic of zeolite-based SCR catalyst deactivation modes using NO oxidation as a probe reaction. In Proceedings of the 23rd North American Catalysts Society Meeting, Louis-ville, KY, USA, 2–7 June 2013. [Google Scholar]
- Mulla, S.; Chen, N.; Delgass, W.; Epling, W.S.; Ribeiro, F.H. NO2 inhibits the catalytic reaction of NO and O2 over Pt. Catal. Lett. 2005, 100, 267–270. [Google Scholar] [CrossRef]
- Guo, Z.; Liang, Q.H.; Yang, Z.; Liu, S.; Huang, Z.H.; Kang, F. Modifying porous carbon nanofibers with MnOx–CeO2–Al2O3 mixed oxides for NO catalytic oxidation at room temperature. Catal. Sci. Technol. 2016, 6, 422–425. [Google Scholar] [CrossRef]
- Ziaei-Azad, H.; Khodadadi, A.; Esmaeilnejad-Ahranjani, P.; Mortazavi, Y. Effects of Pd on enhancement of oxidation activity of LaBO3 (B=Mn, Fe, Co and Ni) pervoskite catalysts for pollution abatement from natural gas fueled vehicles. Appl. Catal. B Environ. 2011, 102, 62–70. [Google Scholar] [CrossRef]
- Esmaeilnejad-Ahranjani, P.; Khodadadi, A.; Ziaei-Azad, H.; Mortazavi, Y. Effects of excess manganese in lanthanum manganite perovskite on lowering oxidation light-off temperature for automotive exhaust gas pollutants. Chem. Eng. J. 2011, 169, 282–289. [Google Scholar] [CrossRef]
- Salman, A.R.; Enger, B.C.; Auvray, X.; Lødeng, R.; Menon, M.; Waller, D.; Rønning, M. Catalytic oxidation of NO to NO2 for nitric acid production over a Pt/Al2O3 catalyst. Appl. Catal. A Gen. 2018, 564, 142–146. [Google Scholar] [CrossRef]
- Tang, X.; Hao, J.; Yi, H.; Li, J. Low-temperature SCR of NO with NH3 over AC/C supported manganese-based monolithic cata-lysts. Catal. Today 2007, 126, 400–405. [Google Scholar] [CrossRef]
- Irani, K.; Epling, W.S.; Blint, R. Effect of hydrocarbon species on no oxidation over diesel oxidation catalysts. Appl. Catal. B Environ. 2009, 92, 422–428. [Google Scholar] [CrossRef]
- Wang, P.; Yin, J.; Lei, L. Evaluation of NO Oxidation Properties over a Mn-Ce/γ-Al2O3 Catalyst. J. Nanomater. 2016, 2016, 2103647. [Google Scholar] [CrossRef] [Green Version]
- Megarajan, S.K.; Rayalu, S.; Teraoka, Y.; Labhsetwar, N. High NO oxidation catalytic activity on non-noble metal based co-balt-ceria catalyst for diesel soot oxidation. J. Mol. Catal. A Chem. 2014, 385, 112–118. [Google Scholar] [CrossRef]
- Tang, N.; Liu, Y.; Wang, H.; Wu, Z. Mechanism Study of NO Catalytic Oxidation over MnOx/TiO2 Catalysts. J. Phys. Chem. C 2011, 115, 8214–8220. [Google Scholar] [CrossRef]
- Zhong, L.; Cai, W.; Zhong, Q. Evaluation of cerium modification over Cr/Ti-PILC for NO catalytic oxidation and their mechanism study. RSC Adv. 2014, 4, 43529–43537. [Google Scholar] [CrossRef]
- Deng, X.; Chen, K.; Tüysüz, H. Protocol for the Nanocasting Method: Preparation of Ordered Mesoporous Metal Oxides. Chem. Mater. 2017, 29, 40–52. [Google Scholar] [CrossRef] [Green Version]
- Yang, K.; Liu, Y.; Deng, J.; Zhao, X.; Yang, J.; Han, Z.; Hou, Z.; Dai, H. Three-dimensionally ordered mesoporous iron oxide-supported single-atom platinum: Highly active catalysts for benzene combustion. Appl. Catal. B Environ. 2019, 244, 650–659. [Google Scholar] [CrossRef]
Figure 1.
Types of SCR in the flue gas treatment system.

Figure 2.
Reaction configuration of SCR with NO oxidation and commercial catalyst.

Figure 3.
SEM images and XRD patterns of (a) 7MnO2–3CeO2 and (b) 9MnO2–1CeO2 catalysts.

Figure 4.
(a,b) TEM image of 9MnO2–1CeO2. (c) EDS elemental mapping of (d) Mn, (e) Ce, and (f) O for 9MnO2–1CeO2 catalyst.
Figure 4.
(a,b) TEM image of 9MnO2–1CeO2. (c) EDS elemental mapping of (d) Mn, (e) Ce, and (f) O for 9MnO2–1CeO2 catalyst.

Figure 5.
TEM images and EDS elemental mapping of DP/9MnO2–1CeO2 catalysts.

Figure 6.
The Mn 2p and Ce 3d XPS spectra of selected catalysts.

Figure 7.
NO oxidation with respect to temperature of 9MnO2–1CeO2.

Figure 8.
(a) Reaction rate coefficient and (b) Arrhenius plot of 9MnO2–1CeO2.

Figure 9.
Catalytic performance for NO oxidation to NO2 at 200 °C: (A) 9MnO2–1CeO2, (B) Co/9MnO2–1CeO2, (C) Ni/9MnO2–1CeO2, (D) Fe/9MnO2–1CeO2, (E) Cu/9MnO2–1CeO2, and (F) Cr/9MnO2–1CeO2.
Figure 9.
Catalytic performance for NO oxidation to NO2 at 200 °C: (A) 9MnO2–1CeO2, (B) Co/9MnO2–1CeO2, (C) Ni/9MnO2–1CeO2, (D) Fe/9MnO2–1CeO2, (E) Cu/9MnO2–1CeO2, and (F) Cr/9MnO2–1CeO2.

Figure 10.
Reaction temperature for oxidation of 50% NO to NO2: (A) 9MnO2–1CeO2, (B) Co/9MnO2–1CeO2, (C) Ni/9MnO2–1CeO2, (D) Fe/9Mn–1CeO2, (E) Cu/9MnO2–1CeO2, and (F) Cr/9MnO2–1CeO2.
Figure 10.
Reaction temperature for oxidation of 50% NO to NO2: (A) 9MnO2–1CeO2, (B) Co/9MnO2–1CeO2, (C) Ni/9MnO2–1CeO2, (D) Fe/9Mn–1CeO2, (E) Cu/9MnO2–1CeO2, and (F) Cr/9MnO2–1CeO2.


Table 1.
BET surface areas, pore volumes, and pore sizes of catalysts synthesized from KIT-6.
| Catalyst | SBET (m2/g) | Dpore (nm) | Vpore (cm3/g) | Refs. |
|---|---|---|---|---|
| MnO2 | 61.5 | 8.7 | 0.13 | [25] |
| 9MnO2-1CeO2 | 87.3 | 8.2 | 0.18 | this work |
| 7MnO2-3CeO2 | 124.2 | 7.3 | 0.23 | this work |
| CeO2 | 135.0 | 12.8 | 0.43 | [25] |
Table 2.
Catalyst component content analysis from ICP-OES.
| Catalyst | Mn/Ce Atom Ratio | (Mn + Ce)/DP Atom Ratio DP = Doped Metal |
|---|---|---|
| 9MnO2-1CeO2 | 8.77 | - |
| Co/9MnO2-1CeO2 | 9.14 | 71.9 |
| Ni/9MnO2-1CeO2 | 9.21 | 66.8 |
| Fe/9MnO2-1CeO2 | 9.11 | 71.4 |
| Cu/9MnO2-1CeO2 | 9.19 | 64.6 |
| Cr/9MnO2-1CeO2 | 9.01 | 99.6 |
Table 3.
The Mn 2p and Ce 3d XPS spectra of selected catalysts.
| Catalyst | Mn ratio | (Mn2++ Mn3+)/Mn4+ | Ce3+/Ce4+ | ||
|---|---|---|---|---|---|
| Mn2+ | Mn3+ | Mn4+ | |||
| 9MnO2-1CeO2 | 6.32 | 0 | 1 | 6.3 | 0.75 |
| 7MnO2-3CeO2 | 6.17 | 2.67 | 1 | 9.0 | 0.52 |
| Cu/9MnO2-1CeO2 | 7.18 | 0.95 | 1 | 8.1 | 0.72 |
| Fe/9MnO2-1CeO2 | 7.90 | 0.48 | 1 | 8.2 | 0.72 |
Table 4.
Catalytic oxidation activity of various catalysts.
| Catalyst | NO Inlet (ppm) | Fraction of NO Converted to NO2@200 °C (%) | Temperature of 50% NO Oxidation to NO2 (°C) |
|---|---|---|---|
| Pt/Cr2O3 | 263 | 29.8 | >200 |
| Co3O4 | 260 | 55.6 | 190 |
| Pt/Fe2O3 | 250 | 35.7 | >200 |
| MnO2 | 310 | 56.8 | 189 |
| Rh/MnO2 | 245 | 59.1 | 185 |
| Co/MnO2 | 260 | 61.5 | 180 |
| 9MnO2-1CeO2 | 266 | 71.0 | 167 |
| 7MnO2-3CeO2 | 252 | 65.5 | 172 |
Table 5.
Catalytic NO oxidation activity of selected DP/mMnO2–nCeO2 catalysts.
| Catalyst | Fraction of NO Converted to NO2@200 °C (%) | Temperature of 50% NO Oxidation to NO2 (°C) |
|---|---|---|
| 9MnO2-1CeO2 | 71.0 | 167 |
| 7MnO2-3CeO2 | 65.5 | 172 |
| Fe/9MnO2-1CeO2 | 78.7 | 140 |
| Fe/7MnO2-3CeO2 | 82.0 | 140 |
| Cu/9MnO2-1CeO2 | 81.0 | 140 |
| Cu/7MnO2-3CeO2 | 78.0 | 138 |
Table 6.
Properties of metal-oxide- and perovskite-type catalysts for NO oxidation.
| Catalyst | Fraction of NO Converted to NO2@200 °C (%) | Temperature of 50% NO Oxidation to NO2 (°C) | Refs. |
|---|---|---|---|
| DP/mMnO2-nCeO2 (m:n = 9:1 and 7:3) | 75~81% | 140~200 | This work |
| Pt/Al2O3 | 40% | 250 | [40] |
| La1−xCexCoO3 | 5% | 270 | [41] |
| Pt-Pd/Al2O3 | 10% | >400 | [42] |
| Mn-Ce/γ-Al2O3 | 40% | 225 | [43] |
| Co3O4-CeO2 | 20% | 230 | [44] |
Disclaimer/Publisher’s Note: The statements, opinions and data contained in all publications are solely those of the individual author(s) and contributor(s) and not of MDPI and/or the editor(s). MDPI and/or the editor(s) disclaim responsibility for any injury to people or property resulting from any ideas, methods, instructions or products referred to in the content. |
© 2023 by the authors. Licensee MDPI, Basel, Switzerland. This article is an open access article distributed under the terms and conditions of the Creative Commons Attribution (CC BY) license (https://creativecommons.org/licenses/by/4.0/).
Share and Cite
MDPI and ACS Style
Kuo, C.-N.; Li, C.-S.; Lai, Y.-L.; Yen, S.-I. Metal-Doped Mesoporous MnO2-CeO2 Catalysts for Low-Temperature Pre-Oxidation of NO to NO2 in Fast SCR Process. Catalysts 2023, 13, 694. https://0-doi-org.brum.beds.ac.uk/10.3390/catal13040694
AMA Style
Kuo C-N, Li C-S, Lai Y-L, Yen S-I. Metal-Doped Mesoporous MnO2-CeO2 Catalysts for Low-Temperature Pre-Oxidation of NO to NO2 in Fast SCR Process. Catalysts. 2023; 13(4):694. https://0-doi-org.brum.beds.ac.uk/10.3390/catal13040694
Chicago/Turabian StyleKuo, Chun-Nan, Cheng-Shiuan Li, Yu-Lun Lai, and Shao-I Yen. 2023. "Metal-Doped Mesoporous MnO2-CeO2 Catalysts for Low-Temperature Pre-Oxidation of NO to NO2 in Fast SCR Process" Catalysts 13, no. 4: 694. https://0-doi-org.brum.beds.ac.uk/10.3390/catal13040694
Note that from the first issue of 2016, this journal uses article numbers instead of page numbers. See further details here.