2.1. Catalytic Deoxygenation of An Industrial FFA Waste Stream at Different Temperatures
Detailed characterization of the 20% Ni-5% Cu/Al
2O
3 catalyst employed has been published previously [
13,
18]. The composition of the FFA feed obtained by steam stripping a biodiesel feedstock—as determined by simulated distillation GC-MS—is shown in
Appendix A within
Table A1. The feed is mostly fatty acids (96.2%) and fatty acid esters (2.3%), the most abundant fatty acids being oleic, palmitic, and stearic acids (ca. 63.5, 21.2 and 9.0%, respectively). This feed was upgraded over 20% Ni-5% Cu/Al
2O
3 in a fixed bed reactor using a WHSV of 1 h
−1 and reaction temperatures ranging from 275 to 375 °C. The results of simulated distillation GC-MS analysis of the liquid products from each hour of time on stream are shown in
Figure 1 and in
Appendix A (
Table A2,
Table A3 and
Table A4). Parenthetically, while all reaction parameters used to produce
Figure 1,
Figure 2,
Figure 3,
Figure 4 and
Figure 5 can be found in
Section 3.4, the label “Heavier (C21–35)” may include oxygenates per
Table A2,
Table A3,
Table A4,
Table A5,
Table A6,
Table A7,
Table A8 and
Table A9 and the discussion below.
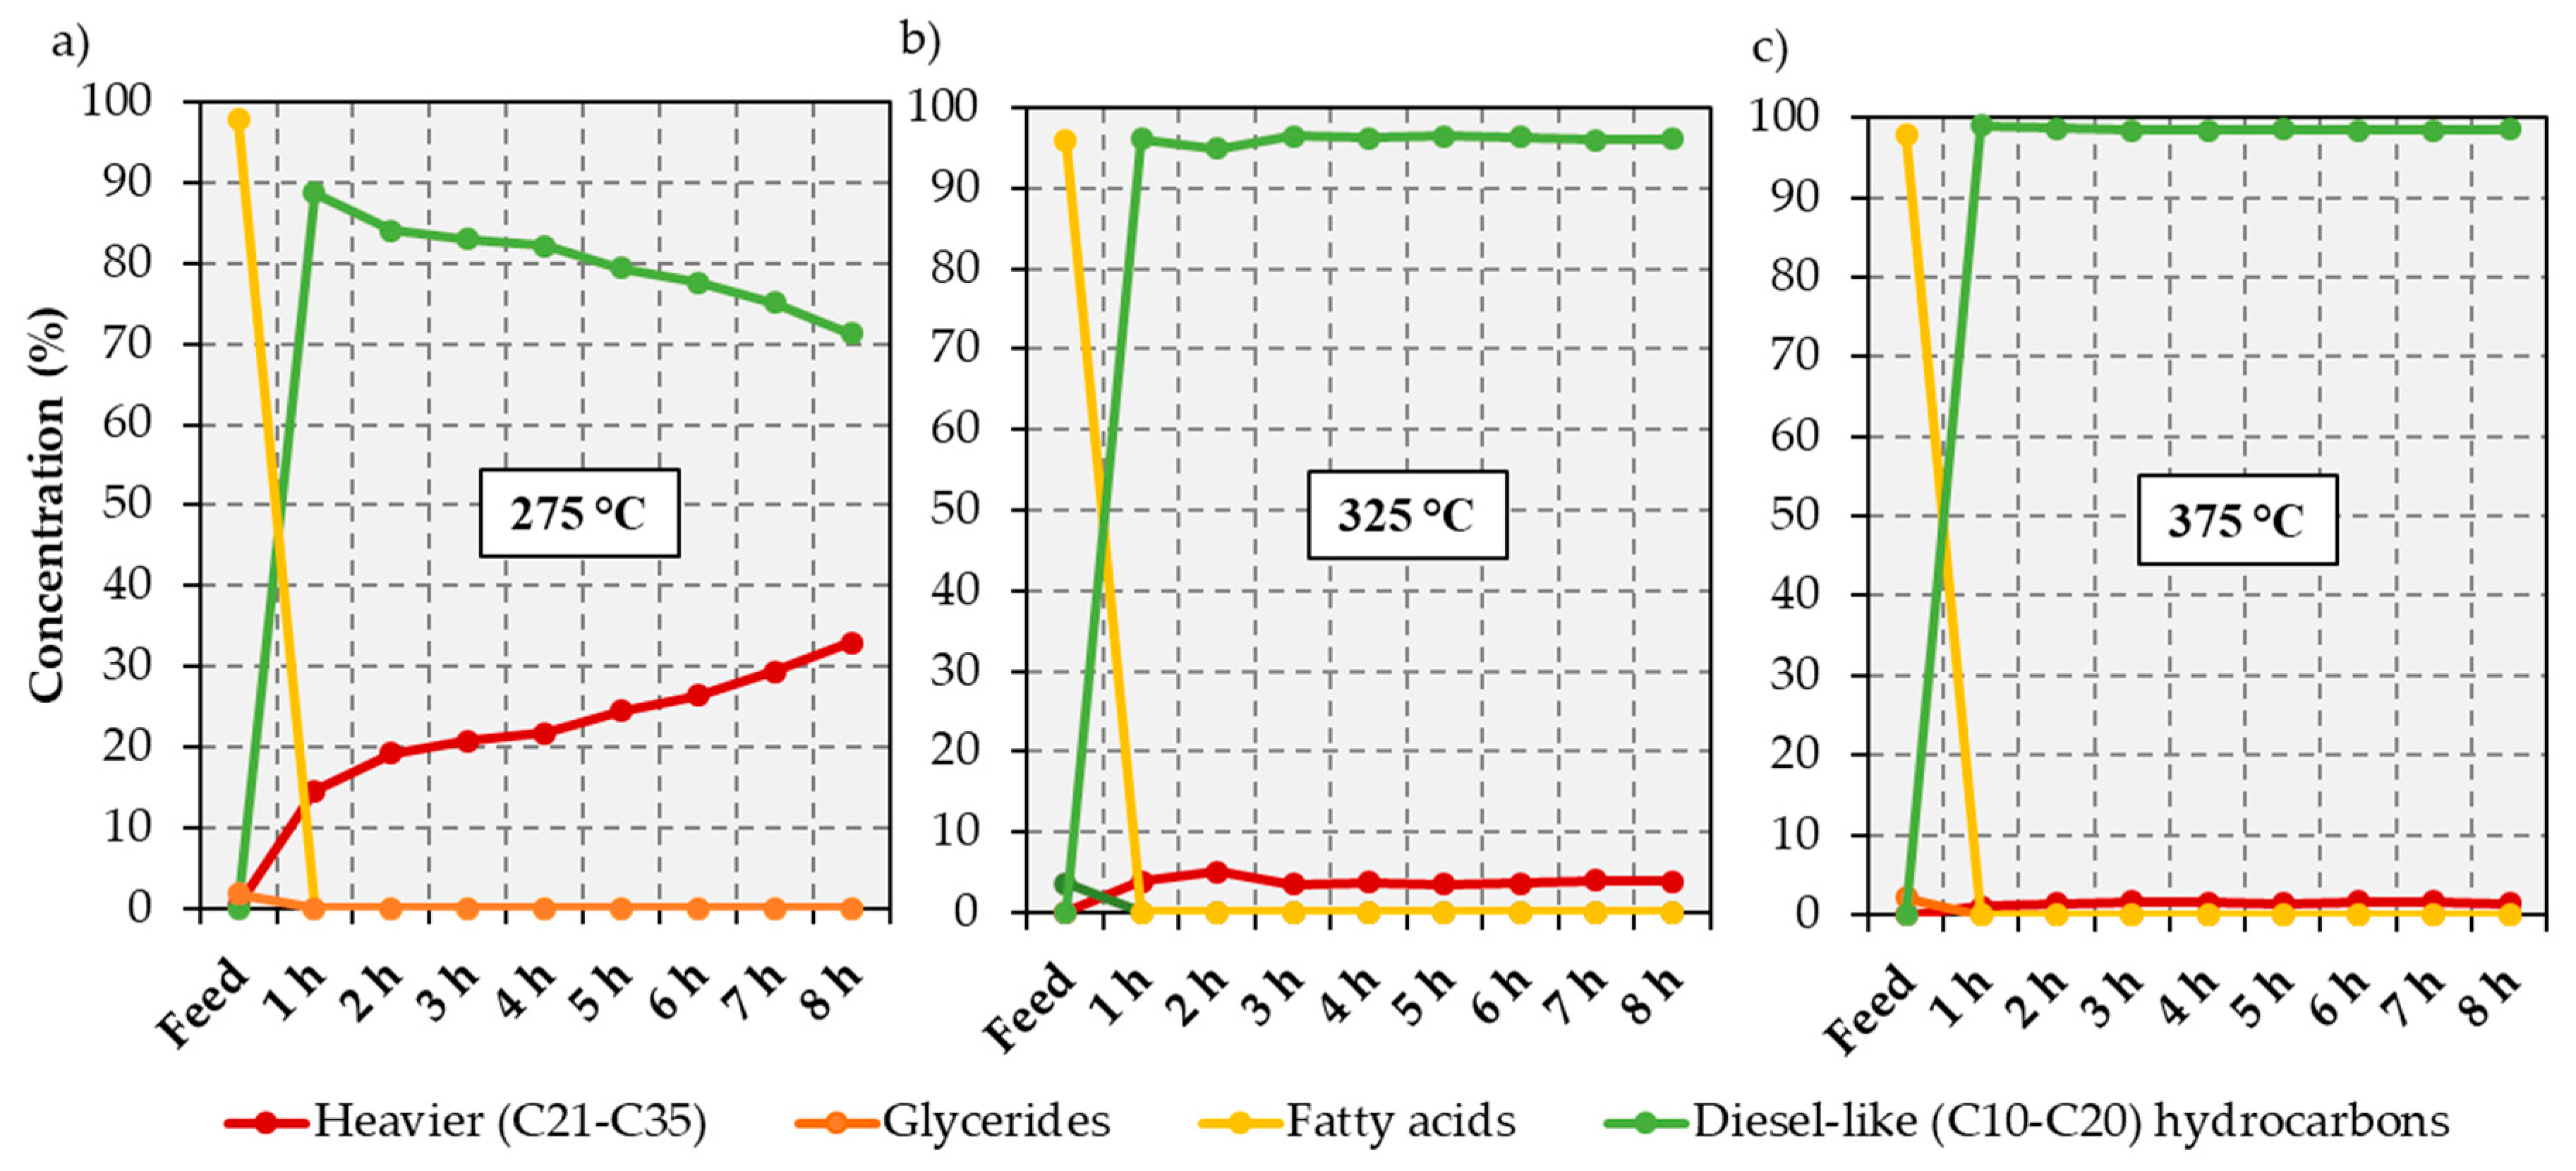
At 275 °C the yield of diesel-like hydrocarbons (C10–C20) decreased from 88.8% at 1 h to 71.3% at 8 h on stream, while the selectivity to heavier products (C21–C35) progressively increased over the same time period. The heavy products, listed in
Table A2, are mainly long chain esters that are formed when alcohol intermediates undergo esterification with fatty acids on the catalyst surface [
21]. These side reaction products are less prominent at high reaction temperatures, as evinced by the lack of any oxygenates (heavy or otherwise) at 375 °C, albeit the small amount of heavier (C21–C35) hydrocarbons formed at this temperature likely stems from the direct decarboxylation of long chain ester intermediates [
21]. Alternatively, these esters can undergo hydrogenolysis to form alcohols and aldehydes, while the former can also be dehydrogenated to the latter as these two products have been shown to exist in equilibrium under hydrogen-rich conditions [
21]. In turn, aldehydes can undergo decarbonylation to form diesel-like hydrocarbons. At 325 °C the yield of diesel-like hydrocarbons is ≥95% irrespective of time on stream. Notably, near complete deoxygenation occurs at this temperature, with the highest amount of oxygenates (accumulated during the last hour of the experiment) totaling only 0.2% of the liquid products. Heavy products are still formed, but in significantly lower quantities than at 275 °C. Complete deoxygenation occurs at all reaction times sampled when the reaction temperature is increased to 375 °C, the selectivity to diesel-like hydrocarbons being ≥98% irrespective of time on stream. The increase in selectivity to diesel-like hydrocarbons as the reaction temperature increases is most likely due to: 1) the cracking of the long chain hydrocarbons (≥C20) observed at lower reaction temperatures; and 2) direct deoxygenation of the fatty acids without formation of long chain ester intermediates.
2.2. Catalytic Deoxygenation of Brown Grease at Different Temperatures
The GC-MS analysis of the lipids extracted from the BG feed is also displayed in
Appendix A within
Table A1. The composition is similar to the industrial FFA waste stream above, the extracted lipids being mainly fatty acids (97.3%) the most abundant of which are oleic, palmitic, and stearic acids (ca. 64. 5, 20.4, and 8.7%, respectively). In addition, the BG contains 2.66% glycerides (mostly diolein), signifying that the feed predominately consists of unsaturated lipids. Notably, this composition is comparable to other BG samples described in the literature [
14,
22,
23], which confirms that the simple extraction method employed (see
Section 3.3) was effective in affording lipids representative of those contained in BG. The lipid concentration for these experiments was increased from that used in the FFA upgrading runs discussed in
Section 2.1 above to 50 wt% lipids in dodecane, while the WHSV was kept at 1 h
−1. This allowed an evaluation of the effect of feed concentration on the deoxygenation of free fatty acid-based feeds. In turn, the most promising reaction temperatures identified through the FFA upgrading runs—namely, 325 and 375 °C—were investigated to assess the effect of temperature on the deoxygenation of BG lipids. The simulated distillation GC-MS analyses of the liquid products obtained during each hour are summarized in
Figure 2 and in
Appendix A (
Table A5 and
Table A6), while the incondensable gaseous products are provided as
Supplementary Material (Figure S1).
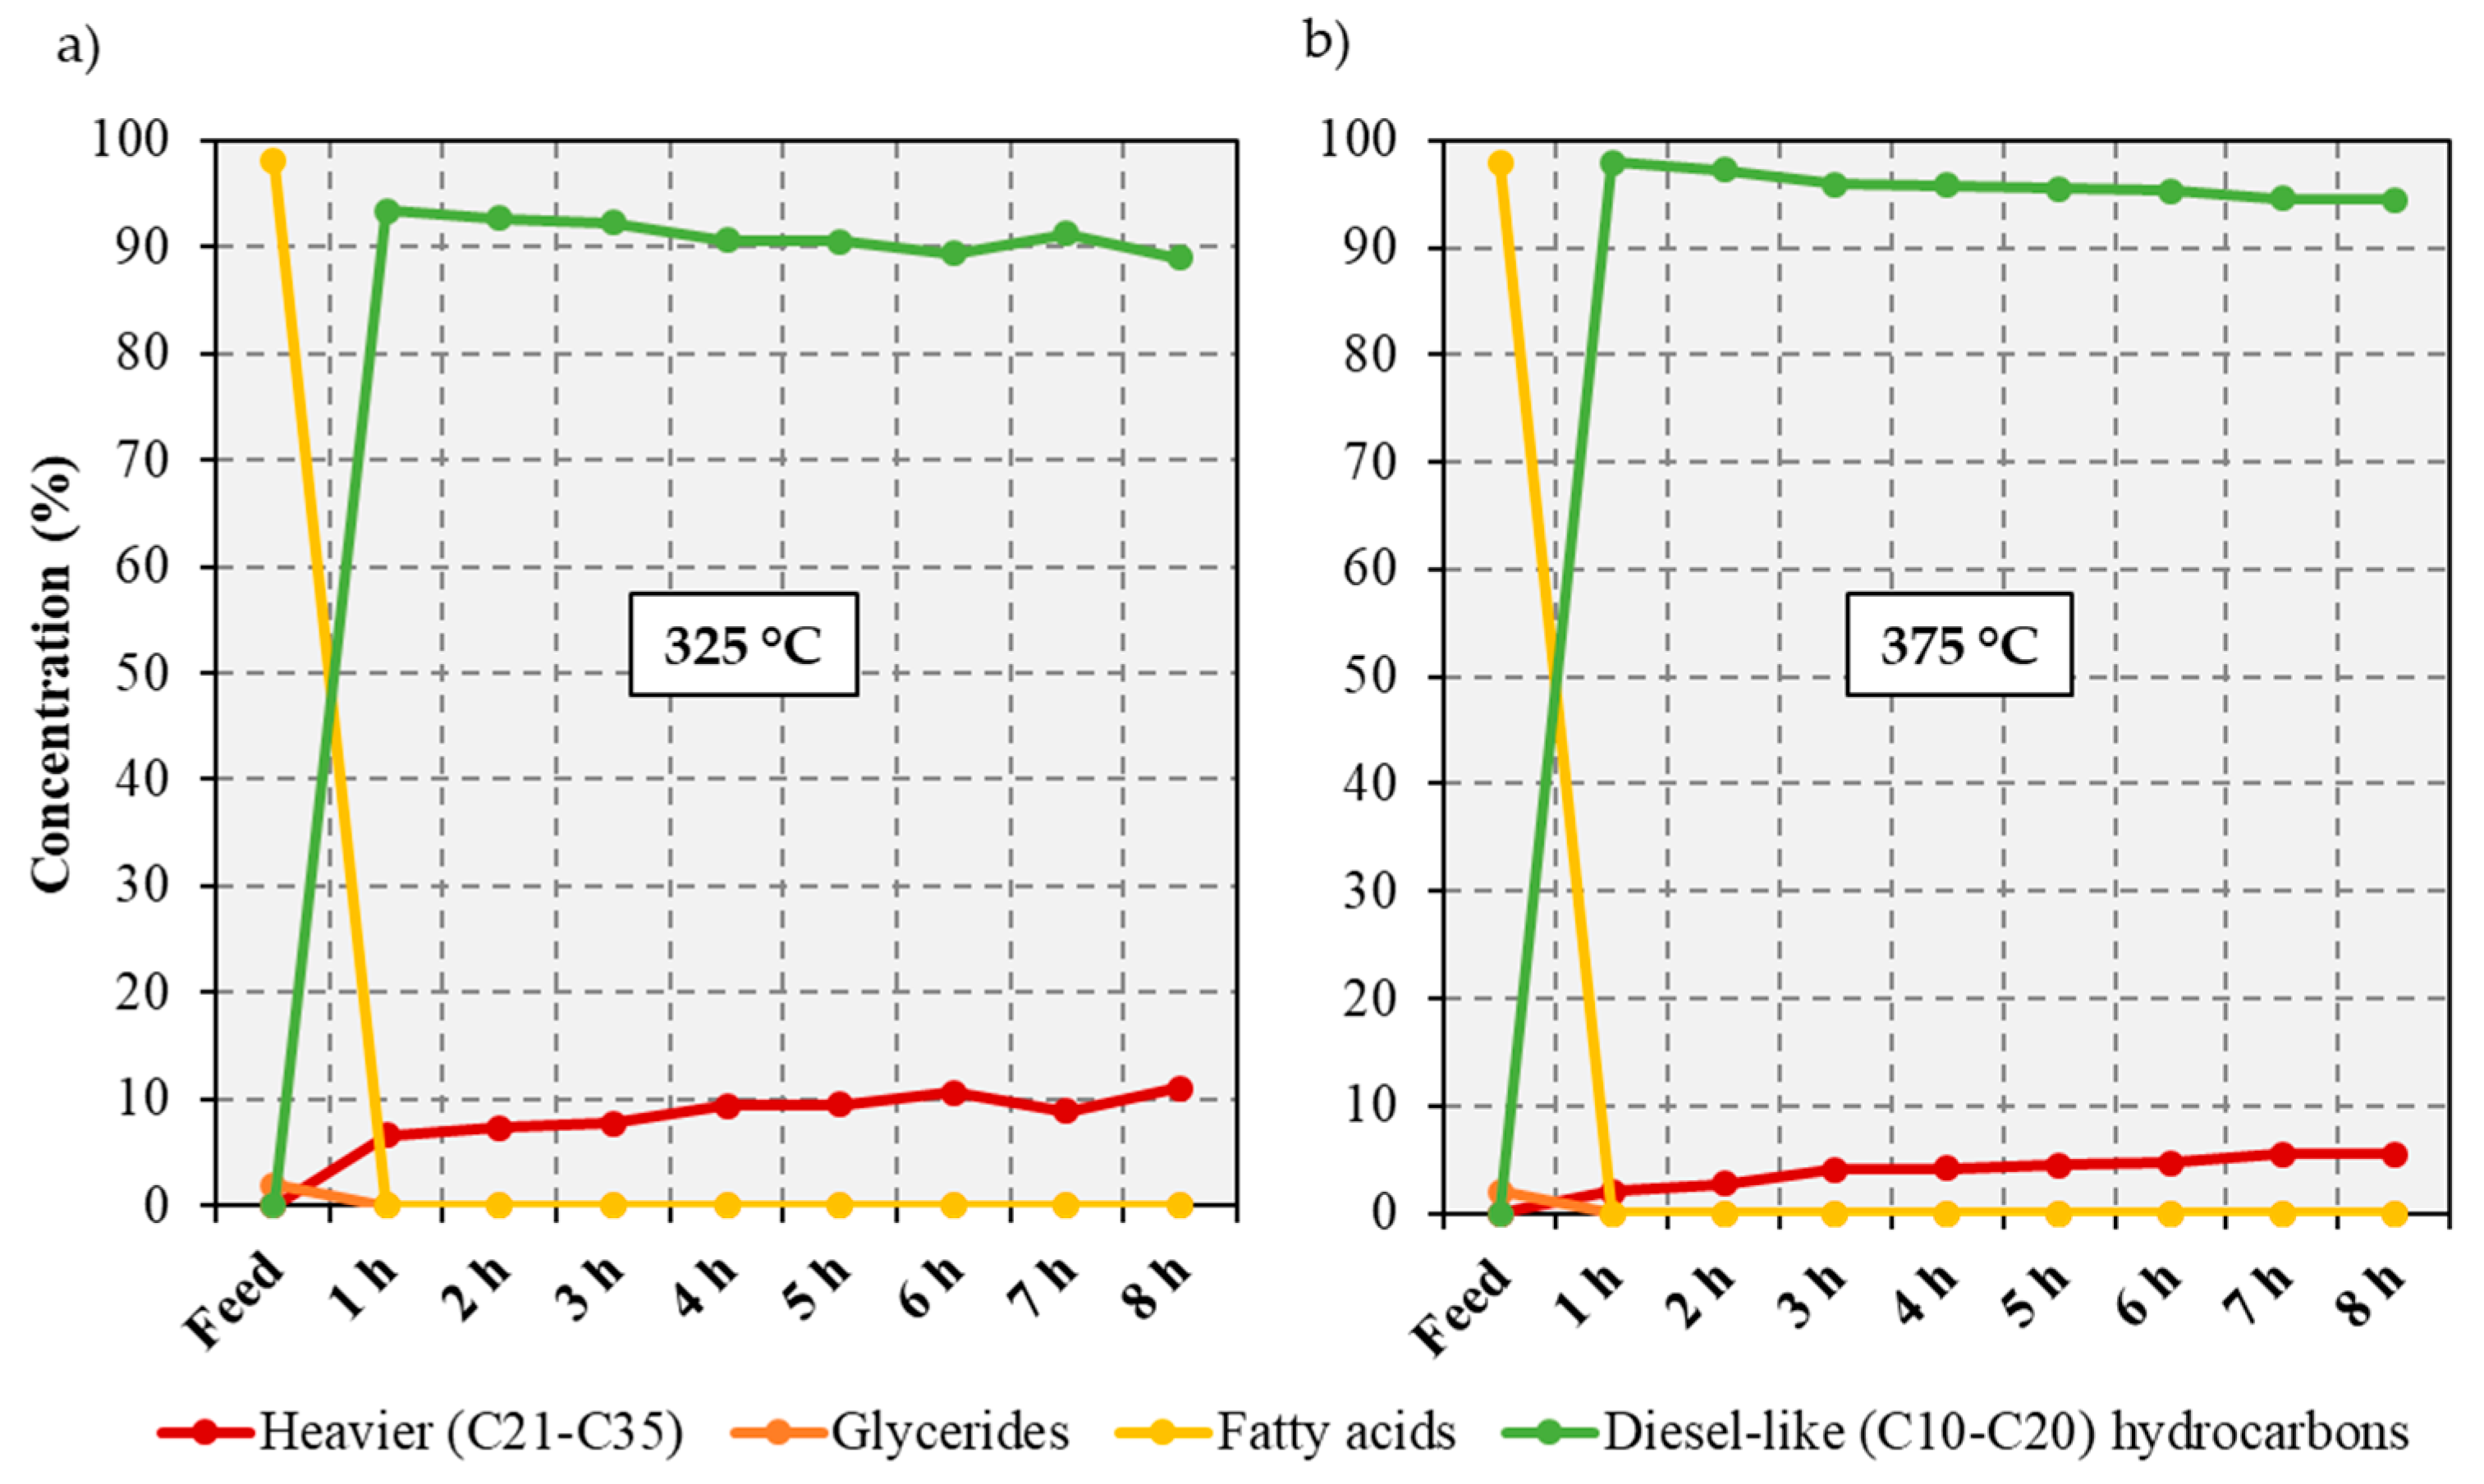
Quantitative conversion of the BG lipids was achieved regardless of the reaction temperature employed. However, the deoxygenation of the BG lipids at 325 °C yields more than double the amount of heavy products that was obtained in the free fatty acid experiments at the same temperature, reaching 11% of the total liquid products at 8 h on stream. Other authors have seen an increase in heavy products as the feed concentration increases and suggested that this stems from an increase in the amount of fatty acids present on the catalyst surface [
14]. The rise in fatty acid concentration increases the possibility of esterification reactions with the alcohol intermediates, forming long chain esters that can undergo direct decarboxylation to yield heavy hydrocarbons. However, the esters observed in the FFA upgrading experiments were not detected in the BG upgrading experiments, suggesting that rapid decarboxylation occurs upon formation of the ester intermediates. Remarkably, >94% of the liquid products obtained during the deoxygenation of the BG lipids at 375 °C are diesel-like hydrocarbons at all reaction times sampled. Parenthetically, at 375 °C there were a number of liquid products—from 9.74% at t = 1 h to 7.62% at t = 8 h (see
Appendix A Table A6)—deemed to be hydrocarbons by the GC-MS, although their specific identity could not be determined. Nevertheless, according to the simulated distillation GC of these unidentifiable products, they all boil within the diesel range (180–350 °C). The heavy product formation also decreased at the higher reaction temperature, the total amount obtained being <6% of the liquid products irrespective of time on stream. This is consistent with higher temperatures favoring the occurrence of cracking reactions, which is also indicated by the higher amount of gaseous C1–C4 products obtained at 375 °C (see
Supplementary Material). Nevertheless, only a relatively small amount of the carbon in the feed becomes C1–C4 gaseous products. Indeed, at 325°C only 3.5 mol% of the carbon in the BG feed is converted to these gaseous products, this value reaching 6.1 mol% when the reaction temperature is increased to 375 °C.
2.3. Catalytic Deoxygenation of Brown Grease at Different H2 Partial Pressures
The presence of H
2 in the reaction atmosphere has been shown to improve catalyst performance during the deCO
x of lipids even if H
2 is not directly involved in the deoxygenation reaction [
24,
25,
26]. Interestingly, some authors have also shown that supported Pd catalysts perform better under lower H
2 partial pressure conditions than under pure H
2 atmospheres [
27], and the same effect has been reported for some Ni catalysts [
26]. Therefore, it is instructive to investigate the effect of H
2 partial pressure on the deoxygenation of waste fatty acid-based feeds. To this end, the deoxygenation of BG was conducted under a reaction atmosphere of 20% H
2/Ar at 375 °C, the GC-MS analysis of the liquid products being shown in
Figure 3 and in
Appendix A (
Table A7), while the incondensable gaseous products are also shown in
Figure 3. Note that the part of the y-axis not shown in
Figure 3 and
Figure 5 consists entirely of the reaction atmosphere, i.e., either H
2 or a mixture of H
2 and Ar.
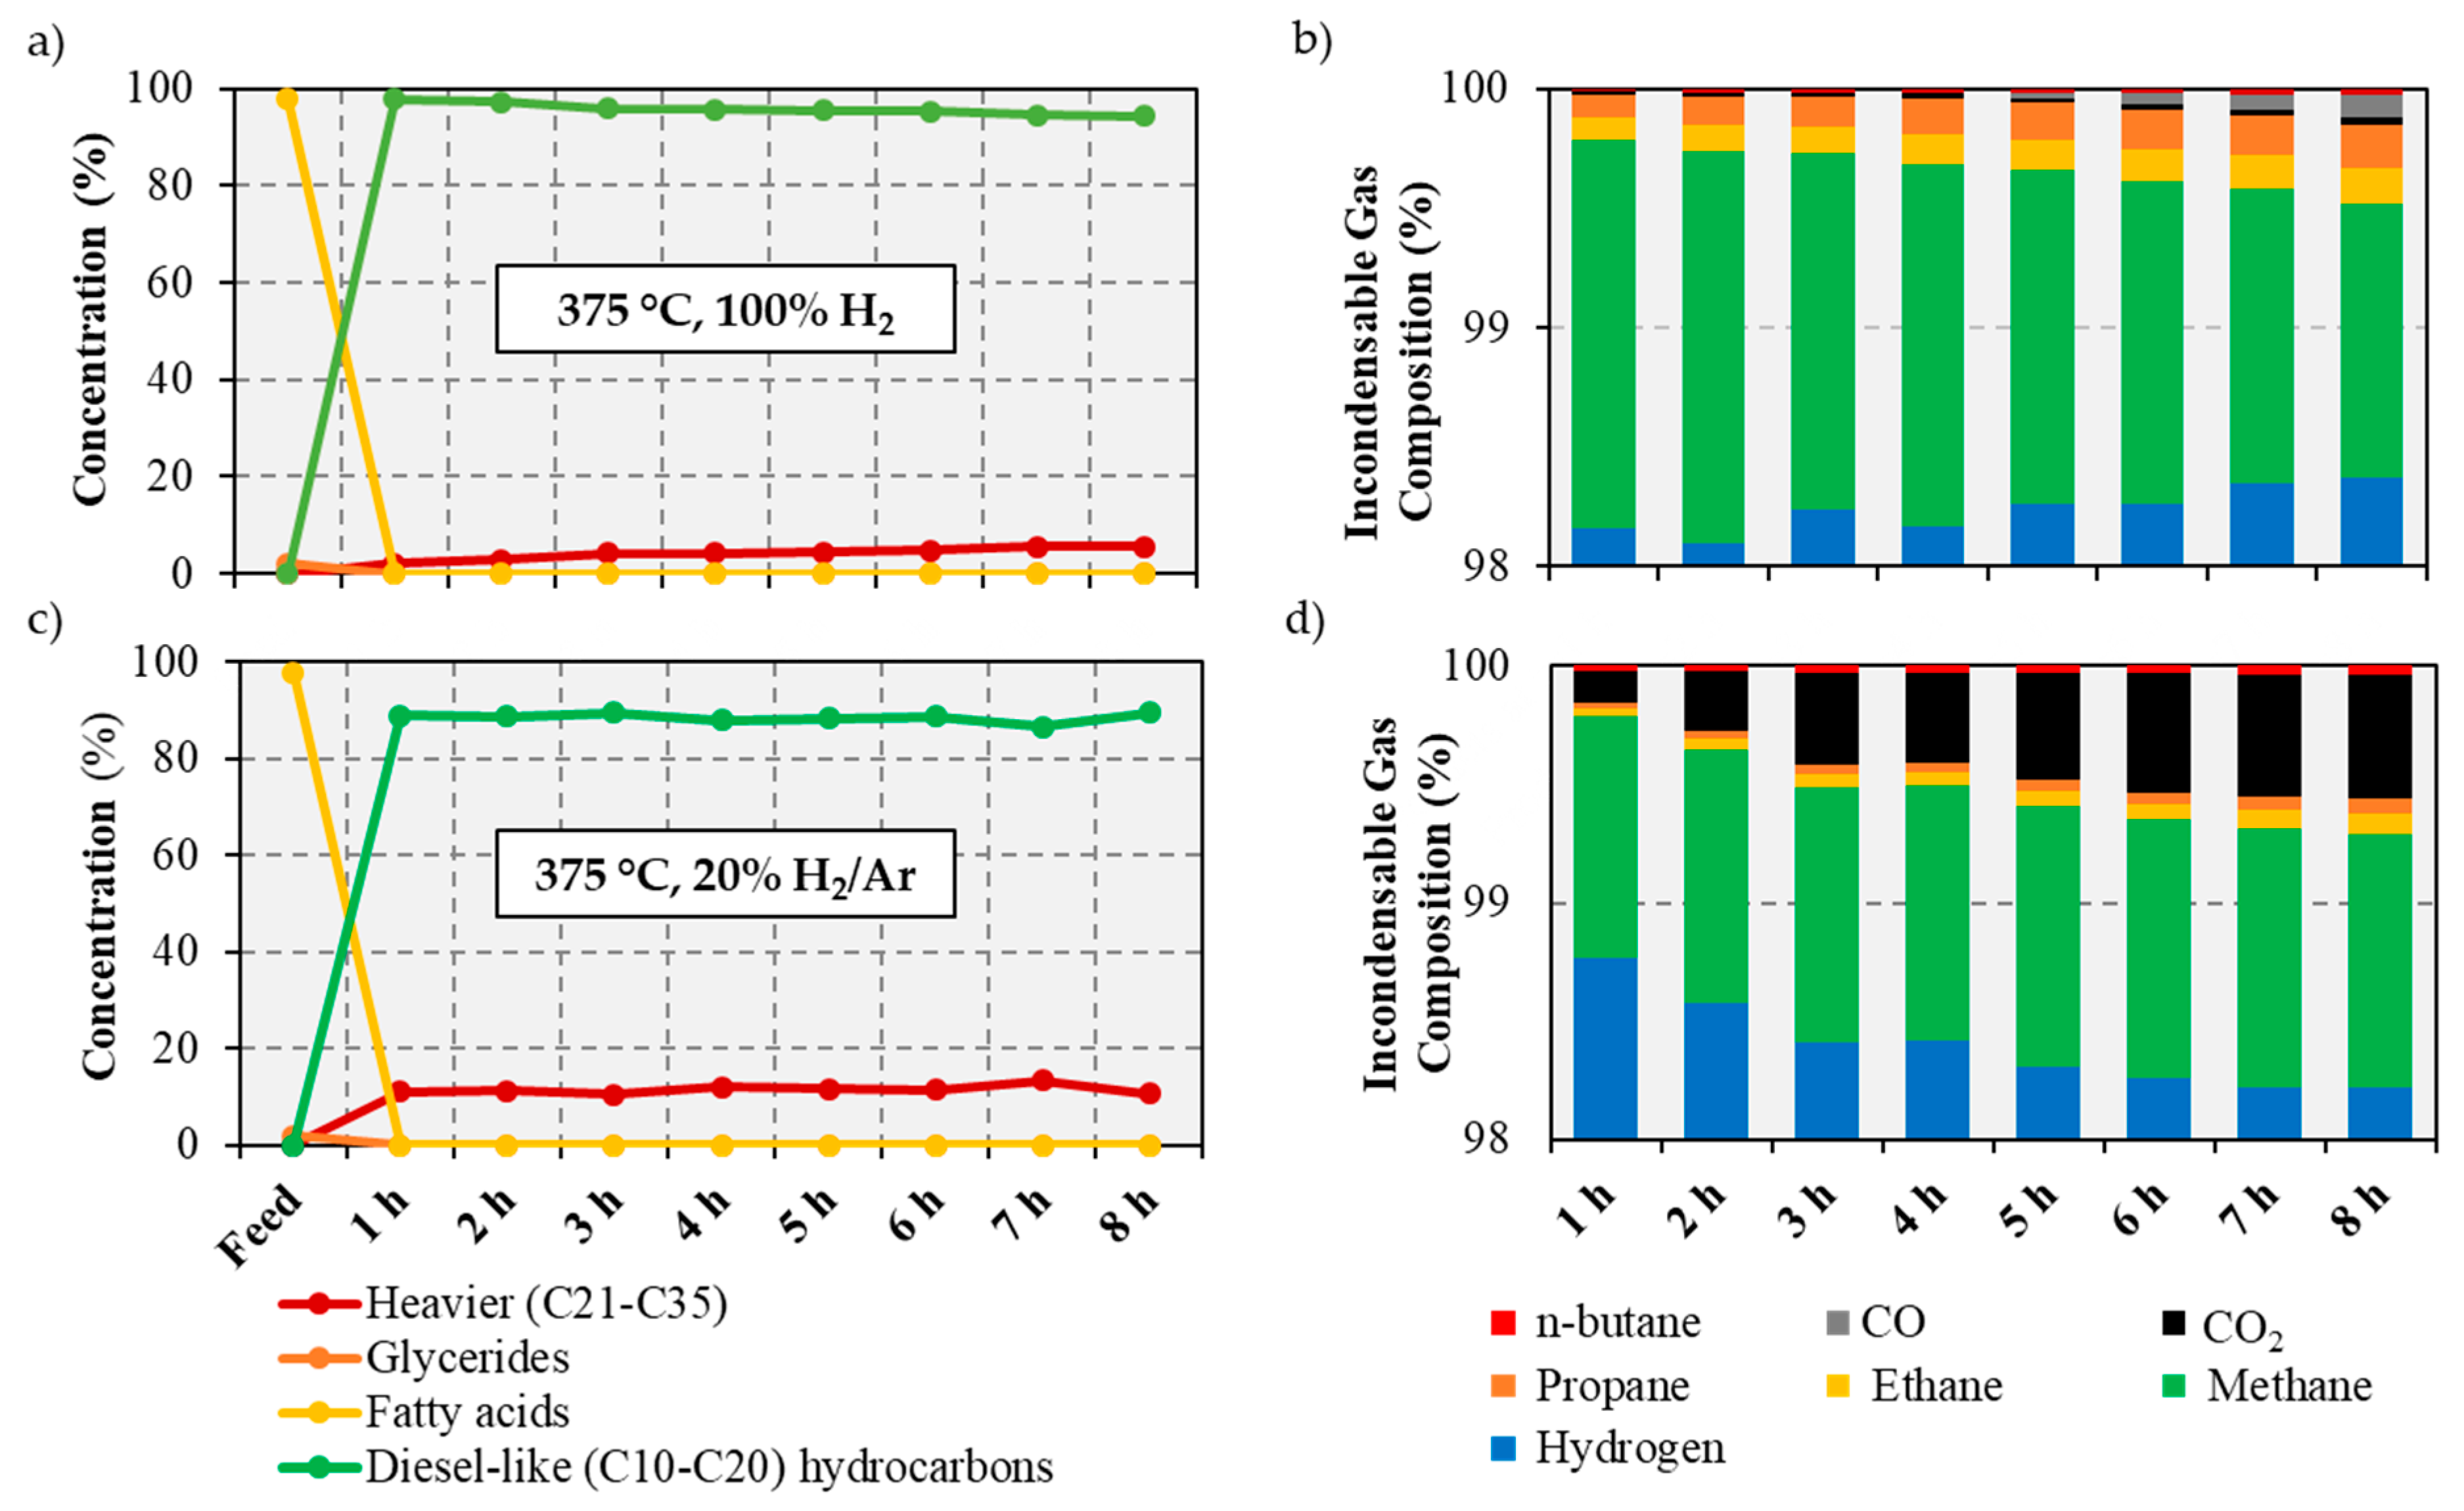
Under 20% H
2, the 20% Ni-5% Cu/Al
2O
3 catalyst quantitatively converts the BG feed, no trace of starting material being observed at any reaction time sampled (see
Figure 3c). However, the amount of diesel-like hydrocarbons in the reaction products decreases to 86–89% of the total liquid products relative to the 94–98% values observed when the reaction is performed under pure H
2 (see
Figure 3a). Additionally, the amount of heavy products increases when the reaction is performed under reduced H
2 partial pressure, albeit it is worth noting that only a relatively small amount (an average of 14.8%) of the total heavy products collected are long chain esters. The increase in the amount of long chain hydrocarbons suggests that after the formation of esters, the lower H
2 partial pressure favors their direct decarboxylation, as opposed to their hydrogenolysis to afford alcohols and aldehydes [
21]. Interestingly, while there is only a small decrease in the yield of diesel-like products, the gaseous products show a noticeable decrease in methane formation when the reaction is performed under reduced H
2 partial pressure (see
Figure 3b,d). Indeed, while the amount of CO or CO
2 present in the gaseous products obtained using pure H
2 is negligible and methane represents the vast majority of the gaseous products, the gas products contain considerably more CO
2 and less methane when the reaction is run under 20% H
2. Therefore, under reduced H
2 partial pressures, methanation of CO
x is disfavored and does not proceed to completion. Instead, the methane formed at lower H
2 partial pressures is likely formed from the fatty acids alkyl chains via the end-chain cracking mechanism described in a recent contribution [
13]. As with other experiments, only a relatively small amount of the carbon in the BG feed becomes C1–C4 gaseous products, this value being 5.8 mol% for the experiment performed under reduced H
2 partial pressure.
2.4. Catalyst Deactivation and Online Regeneration
Tellingly, the composition of the gas products is still changing not only at the end of the reactions discussed in
Section 2.3, but also at the end of previously reported YG and hemp seed oil upgrading experiments [
13], all of which lasted eight hours. Therefore, it appears that eight hours do not constitute sufficient time for the attainment of steady state. Obviously, this also hinders an assessment of whether significant catalyst deactivation occurs when upgrading a realistic feed under these conditions. Therefore, the most promising conditions evaluated in this study, i.e., 375 °C and a pure H
2 atmosphere, were employed in a run in which the deoxygenation reaction time was extended to 100 h on stream. After this (first) 100 h cycle, the catalyst was regenerated in situ by washing, drying, calcining (in air), and re-reducing the catalyst (under flowing H
2). Catalyst calcination was performed for 5 h at 450 °C, which is both the top temperature rating of the furnace employed and a temperature at which the majority of the carbonaceous deposits can be eliminated according to the results of thermogravimetric analysis (see
Section 2.5 and Figure 7). Results from the analysis of representative liquid samples (recovered at 24 h intervals) are shown in
Figure 4 and in
Appendix A (
Table A8 and
Table A9), the analysis of the gaseous products being shown in
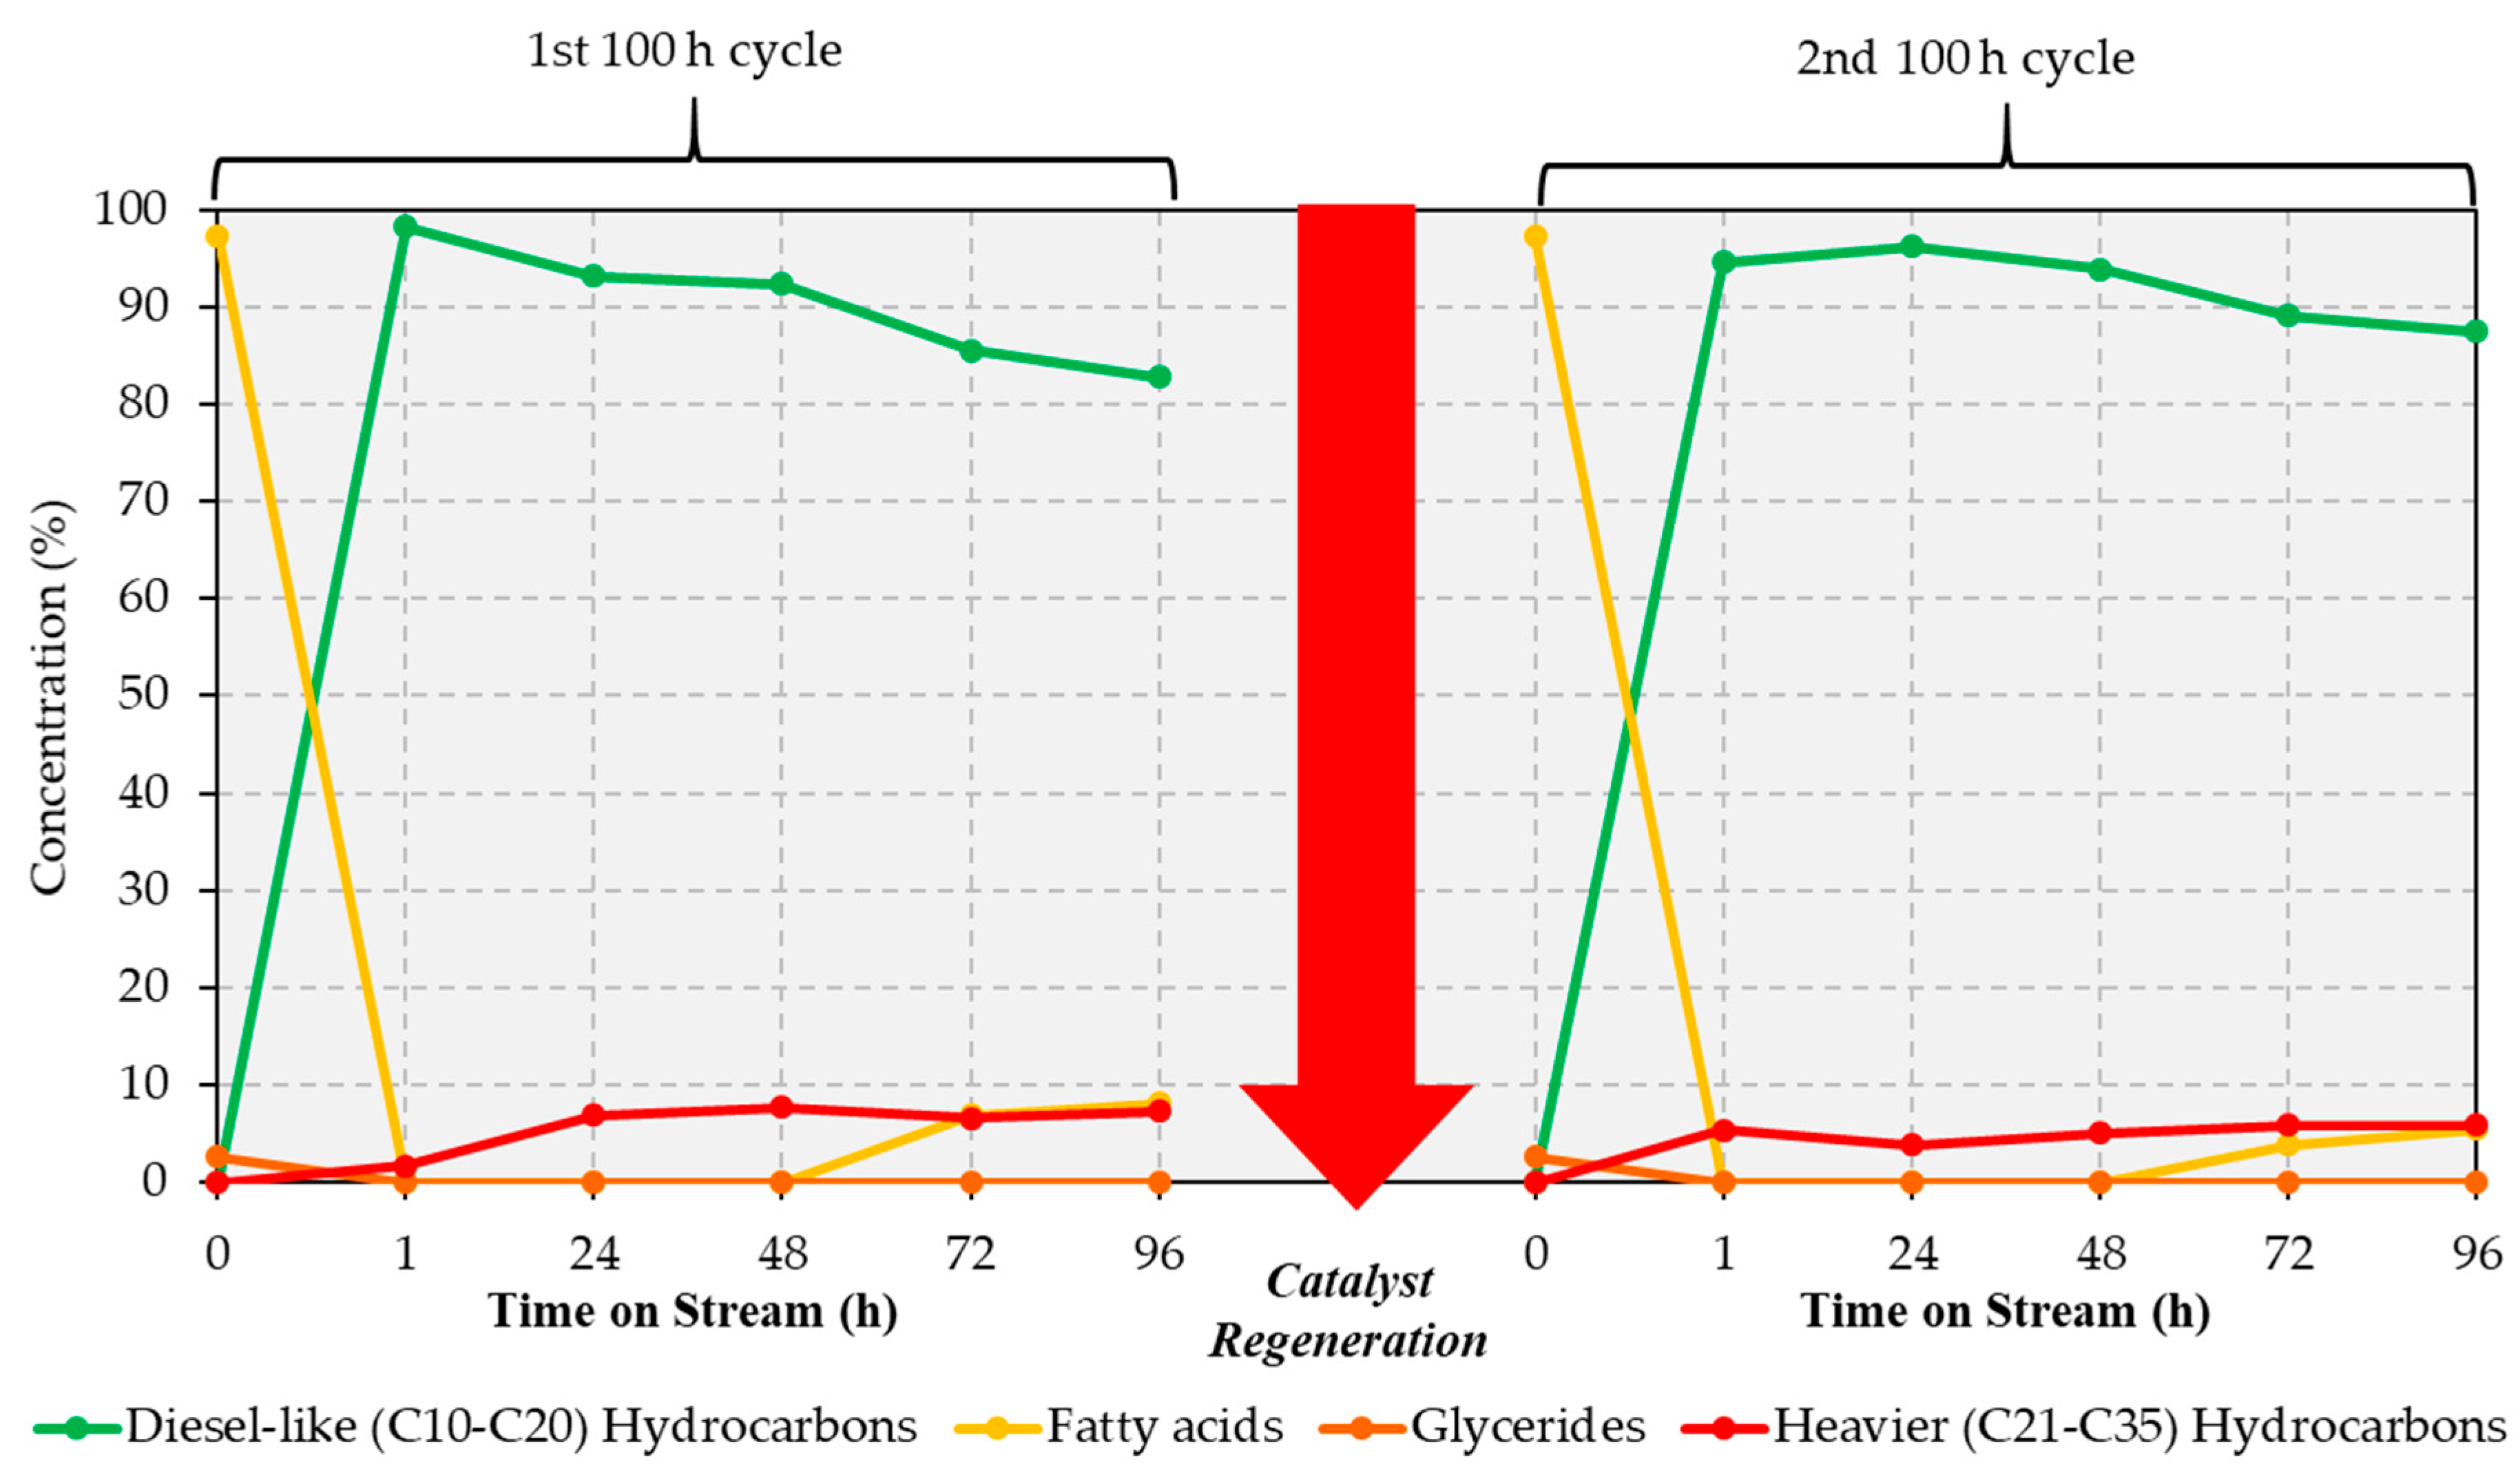
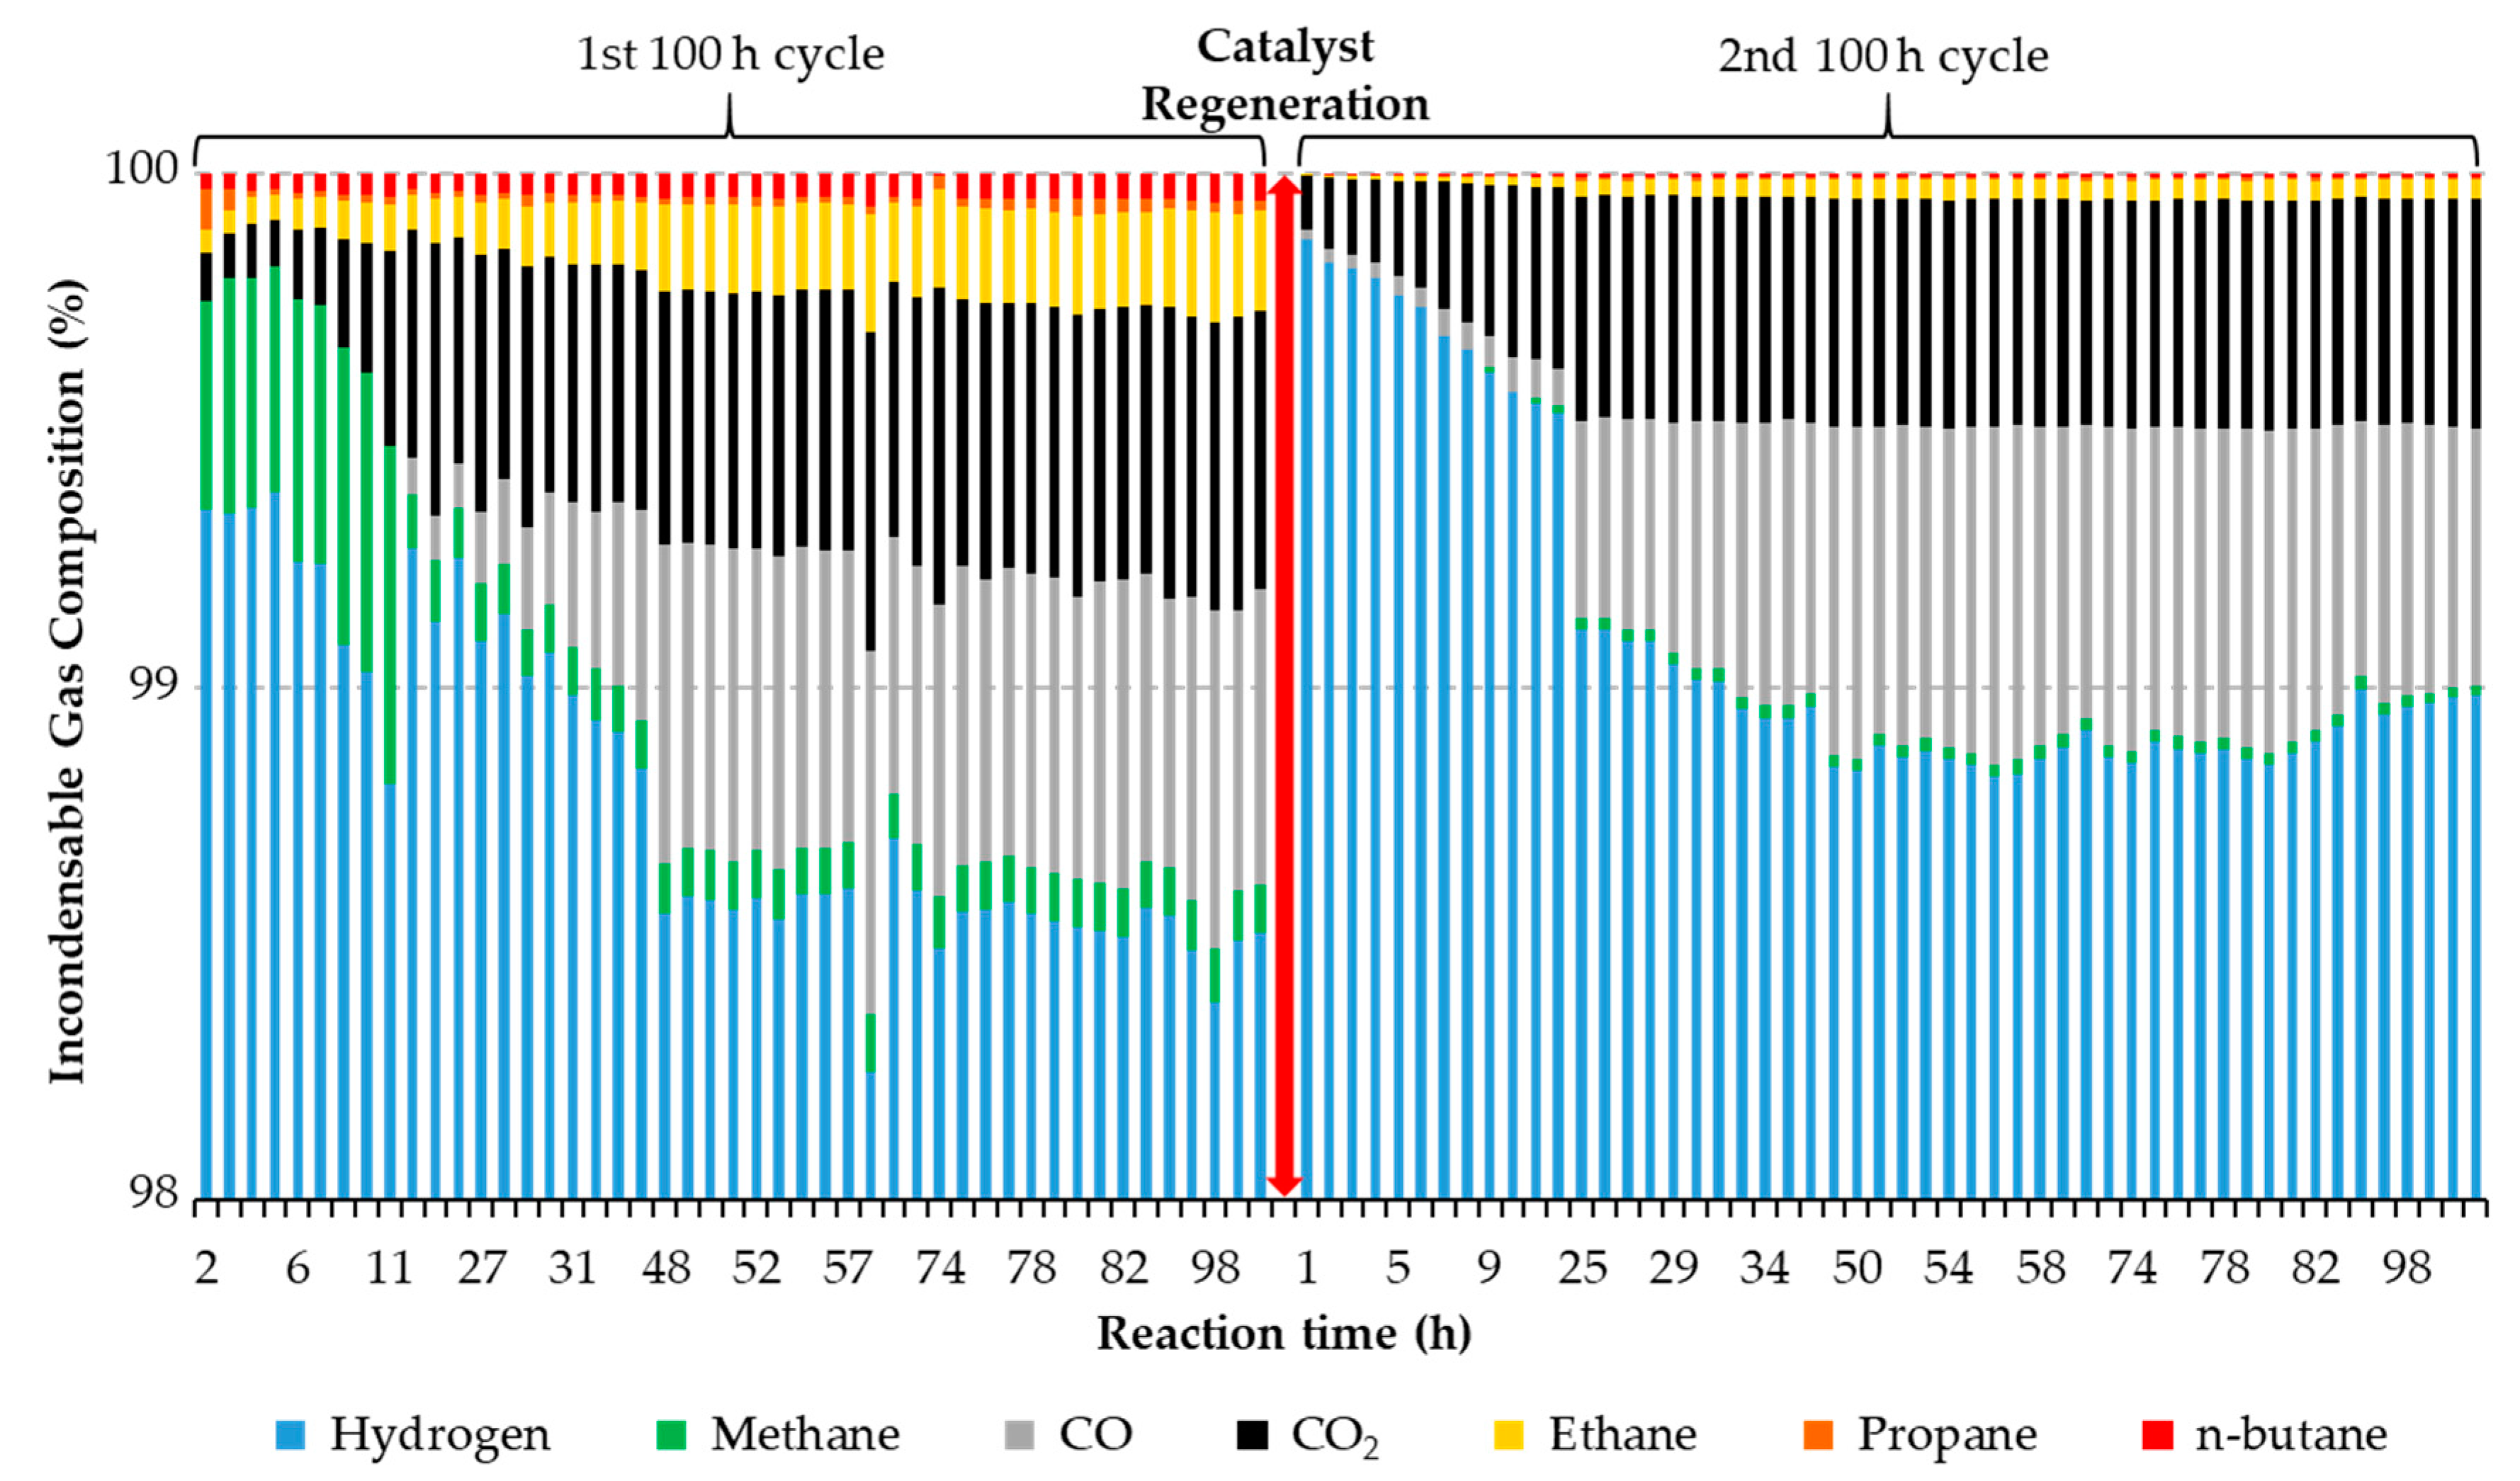
Figure 5. It should be noted that the results shown correspond to products recovered in a single hour and not to products accumulated over a 24 h period, such that the catalyst performance can be assessed at the specified time intervals with a “time resolution” equal to one hour.
During the first 100 h run, quantitative conversion of the BG lipids is achieved during the initial 48 h. After that, the amount of fatty acids in the products begins to increase, reaching a total of 8.1% of the total liquid products collected at the end of the first 100 h cycle. The yield of diesel-like hydrocarbons is >92% of the liquid products for the first 48 h on stream, this value decreasing to 82.8% after 96 h on stream. Notably, catalyst performance improves after the catalyst is regenerated in situ, the yield of diesel-like hydrocarbons being ~90% or greater for 72 h on stream during the second 100 h cycle. Interestingly, improvements in performance following catalyst regeneration have been reported for other Ni-based formulations, which was attributed to an increase in the number of strong basic sites during the treatment of the spent catalyst in hot air [
26]. A closer look at the individual components of the liquid products (listed in
Table A8 and
Table A9) provides valuable information vis-à-vis changes in selectivity that take place as the reaction progresses and/or after catalyst regeneration. Indeed, while the vast majority of the feed (93.6%) comprised C18 and C16 fatty acids—73.2 and 20.4% of the feedstock, respectively—the most abundant products are C17 and C15 hydrocarbons, suggesting that the reaction proceeds mainly via deCO
x as opposed to HDO. Nevertheless, C18 and C16 hydrocarbons are also produced in significant amounts, which indicates that HDO also occurs to some extent. Additionally, of note is the trend followed by lighter diesel-like hydrocarbons (C10–C14), whose abundance in the product mixtures tends to decrease with time on stream and after regeneration (see
Table A8 and
Table A9). This indicates that cracking reactions progressively become less prevalent and implies that surface sites responsible for cracking deactivate gradually and irreversibly. This is in line with the evolution of the incondensable gas products with time on stream, which also provides valuable insights regarding the changes in selectivity observed as the reaction advances and after catalyst regeneration (see
Figure 5).
First, the difference in the amount of light (C1–C4 alkanes) observed before and after regeneration confirms the irreversible deactivation of cracking sites. Indeed, these gases result from the shortening of alkyl chains via terminal carbon loss (-C1) and internal chain cracking (-C2, -C3, and -C4), both of which also lead to the formation of C10–C14 fuel-like hydrocarbons [
13]. However, the fact that both light (C10–C14) fuel-like hydrocarbons and methane tend to decrease with time on stream prior to remaining fairly constant—while C2–C4 hydrocarbons follow the opposite trend—suggests that chain shortening occurs mainly through the removal of terminal carbons, which is in line with the conclusions of a recent contribution [
13]. Moreover, changes in the amounts of CO
x and methane—which progressively increase and decrease, respectively (
Figure 5, left)—may also suggest that sites responsible for methanation are gradually and irreversibly poisoned as the reaction progresses. This represents a noteworthy result, since hydrogen consumption should correspondingly decrease with time on stream without sacrificing significant deoxygenation activity. Lastly, it is worth noting the induction period (observed at the beginning of both cycles in
Figure 5 but also in
Figure 3d) in which the concentration of CO
x gradually increases with time on stream prior to becoming relatively constant at steady state. Given that methane formation is negligible during the second 100 h cycle (right of
Figure 5), the low concentration of CO
x during this induction period cannot be assigned to CO
x methanation. Instead, this can be attributed to the accumulation of CO
x on the catalyst surface, which has to become saturated before CO
2 and CO can break through. Indeed, a previous contribution has shown that CO
2 accumulates on the surface of 20% Ni-5% Cu/Al
2O
3 as alumina-bound carbonates [
13]. Based on the results in
Figure 5—and ignoring the effects of potentially confounding reactions (including methanation, water gas shift and the Boudouard reaction)—it seems that deoxygenation proceeds fairly equally via decarboxylation (-CO
2) and decarbonylation (-CO) once the system reaches steady state. Although—as with other experiments—only a relatively small amount of the carbon in the feed becomes C1–C4 gaseous products, the values obtained for this experiment are particularly informative, since this is the only experiment in which steady state was attained before and after catalyst regeneration. Tellingly, in the first 100 h cycle, the fraction of carbon in the feed converted to C1-C4 gaseous products starts at ~2 mol% before reaching a maximum of ~7 mol% at 11 h on stream, an increase that can be ascribed to the initial accumulation of CO
2 on the catalyst surface mentioned above. Subsequently, this value stabilizes between ~2.5 and ~4.9 mol% for the remainder of the first 100 h cycle. During the second 100 h cycle (after catalyst regeneration), the fraction of carbon in the feed converted to C1–C4 gaseous products starts at ~0.4 mol% before stabilizing (at around 24 h on stream and for the remainder of the experiment) between ~2.6 and ~3.6 mol%. This is consistent with both the initial accumulation of CO
2 on the regenerated catalyst surface and the lower cracking activity observed after catalyst regeneration.
2.5. Catalyst Characterization
Although the characterization of the 20% Ni-5% Cu/Al
2O
3 catalyst used in this contribution has been described previously [
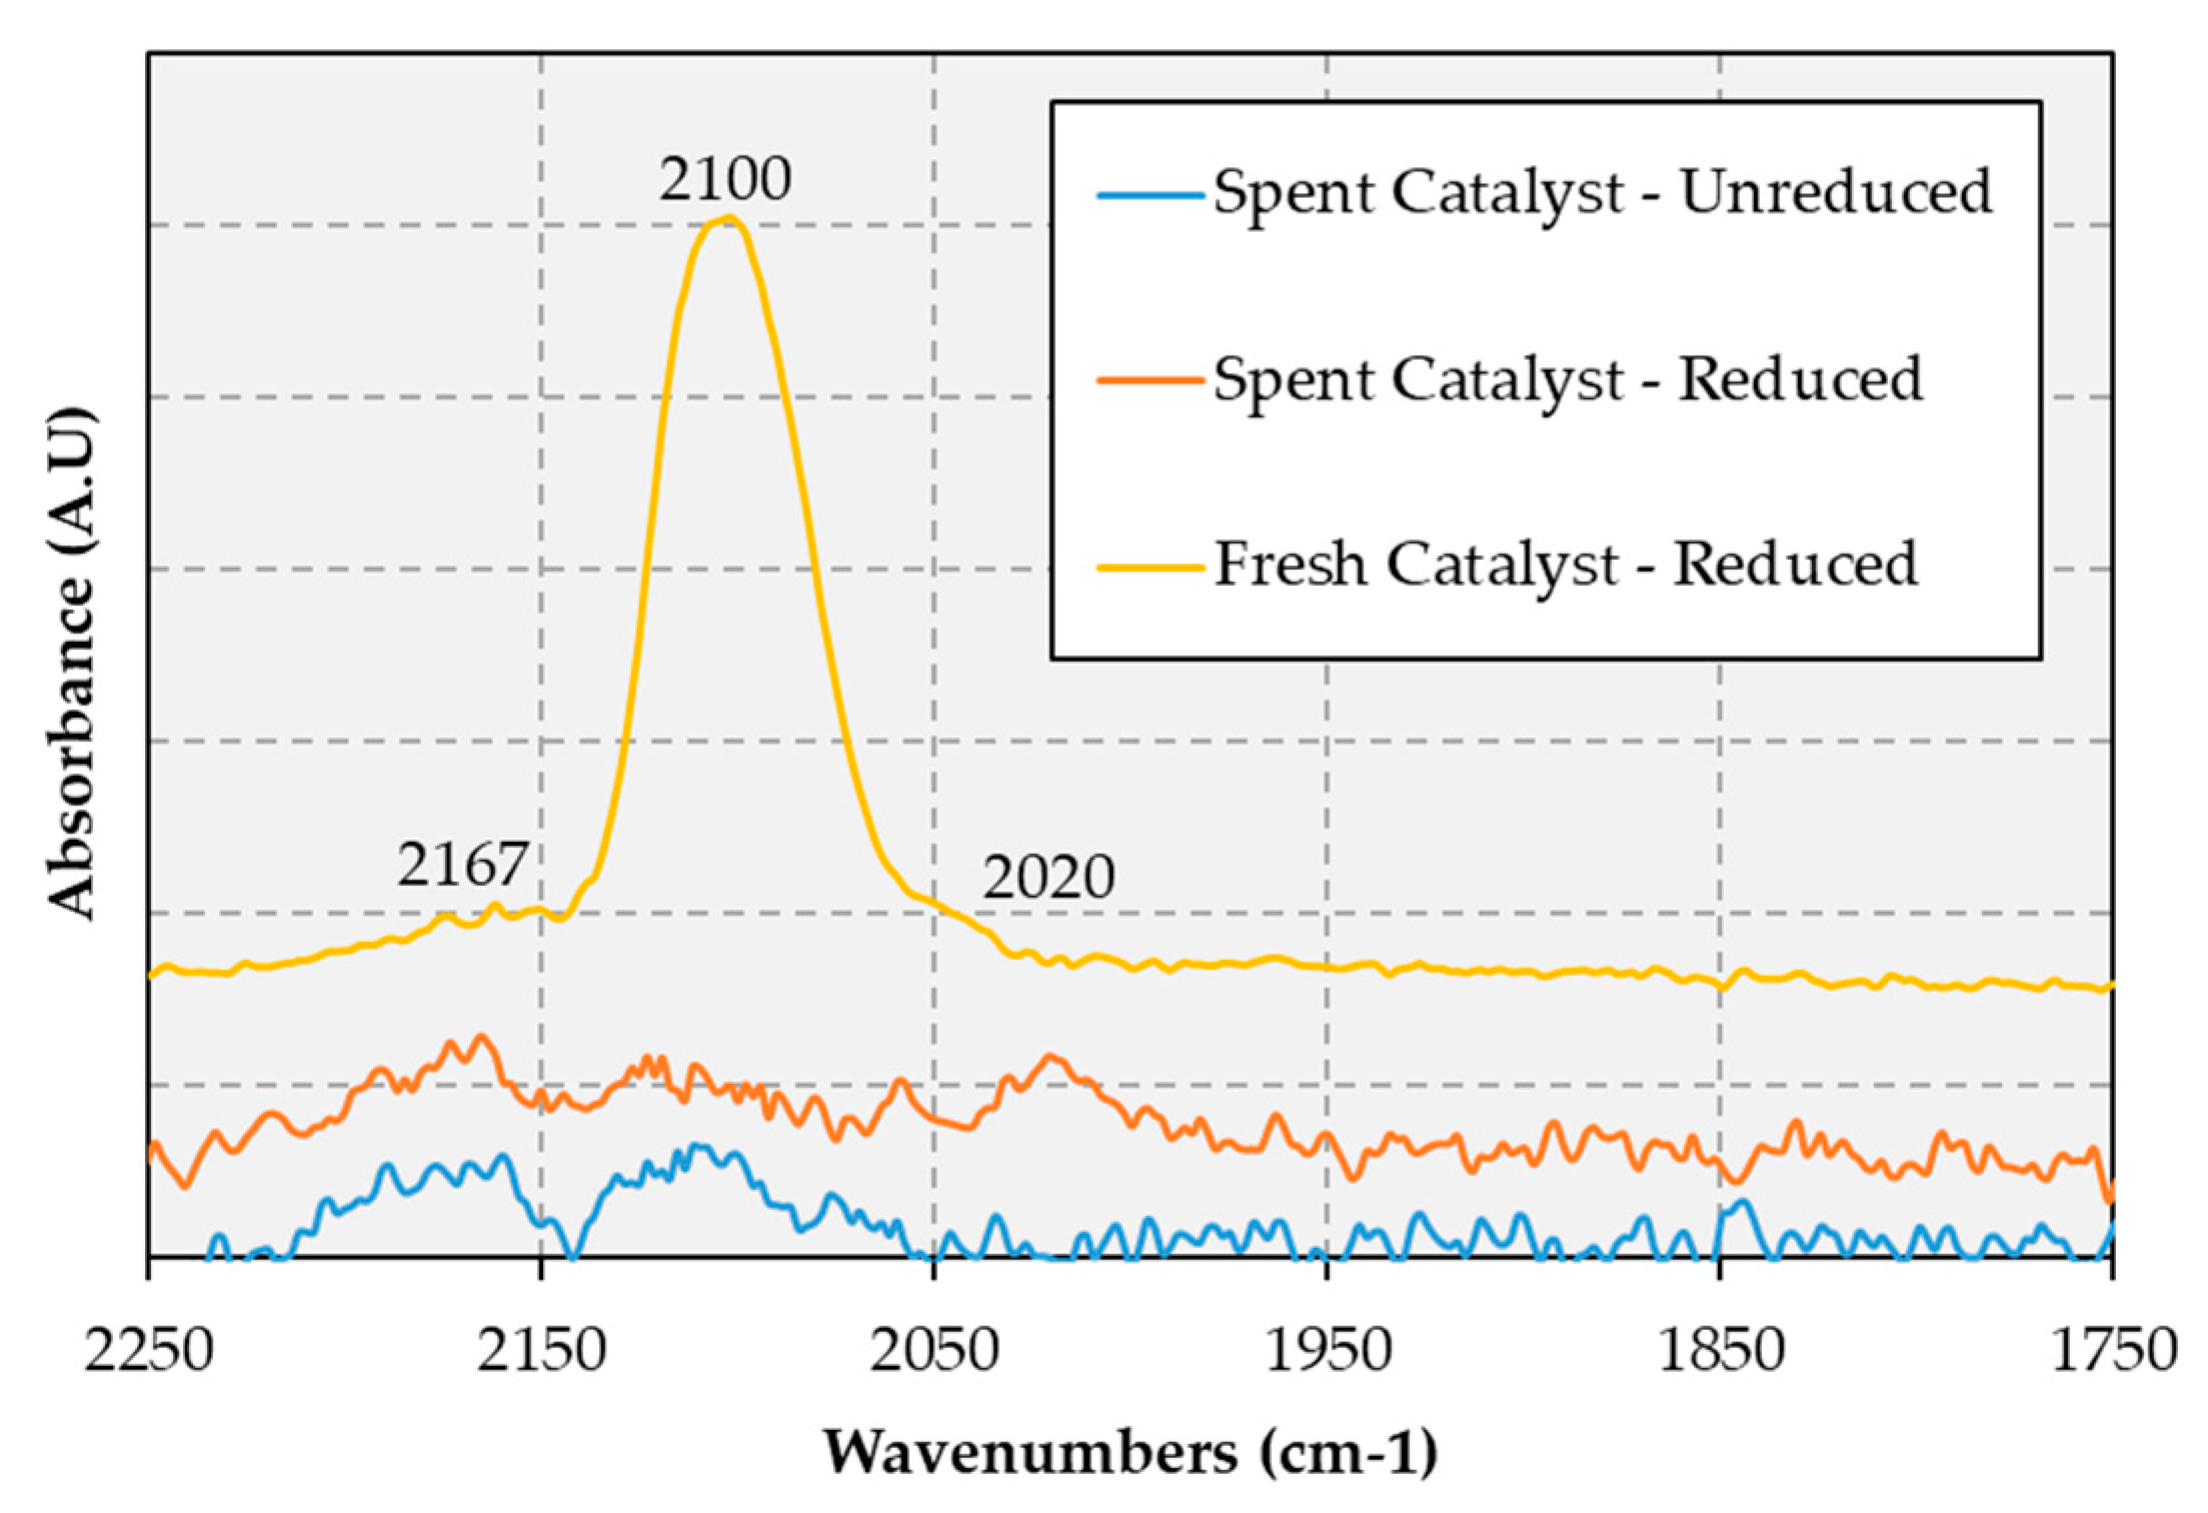
18], additional characterization work was performed in this study, including an investigation of room temperature CO adsorption on the fresh and spent catalyst via diffuse reflectance infrared Fourier transform spectroscopy (DRIFTS), the resulting spectra being shown in
Figure 6.
CO adsorption on the reduced fresh catalyst produced a strong absorbance peak at 2100 cm
−1. Since CO adsorption on the spent catalyst did not afford this peak, the spent catalyst was reduced in situ (i.e., inside the DRIFTS cell) to counter any oxidation that may have occurred when the catalyst was exposed to air while being transferred from the reactor to the DRIFTS cell. The reduced spent catalyst also lacked the CO adsorption peak, which indicates that the surface active sites that readily adsorb CO on the reduced fresh catalysts are irreversibly poisoned—or otherwise eliminated—under the reaction conditions employed. This could explain the reduced methane formation observed during the second 100 h cycle, as less CO adsorbs on the catalyst surface. In fact, the C1 gaseous products observed during the second 100 h cycle are almost entirely CO and CO
2, which is consistent with decreased methanation. Given than in previous work on 20% Ni-5% Cu/Al
2O
3 and 4.7% Cu/Al
2O
3 CO DRIFTS bands at 2121 and 2115 cm
−1 were assigned to CO adsorbed on Cu sites [
18,
28], it is possible that during reaction these sites are made inaccessible by the deposition of carbonaceous material on the surface of metal particles (vide infra and see
Figure A1 in
Appendix B). However, another possibility is that in the course of the reaction these sites tend to disappear via sintering and/or alloying with Ni (see Figure 8 and
Figure A2 in
Appendix B). Since previous CO DRIFTS measurements on 20% Ni-5% Cu/Al
2O
3 have also confirmed an electronic interaction between Cu and Ni [
18], it can be argued that these changes would also have an electronic effect on surface Ni, which offers one potential explanation for the absence of a band at 2050 cm
−1 attributable to CO adsorbed on Ni sites [
29]. Interestingly, other authors have observed improved catalytic performance when the CO binding energy to Ni is lowered, as this causes active sites to be freed up more readily during deCO
x thereby resulting in enhanced activity [
30]. In fact, the CO produced via decarbonylation is a known catalyst poison—as well as a coke precursor (vide infra)—and, thus, a lower amount and/or a reduced residency time of CO on the catalyst surface should benefit deCO
x activity [
31].
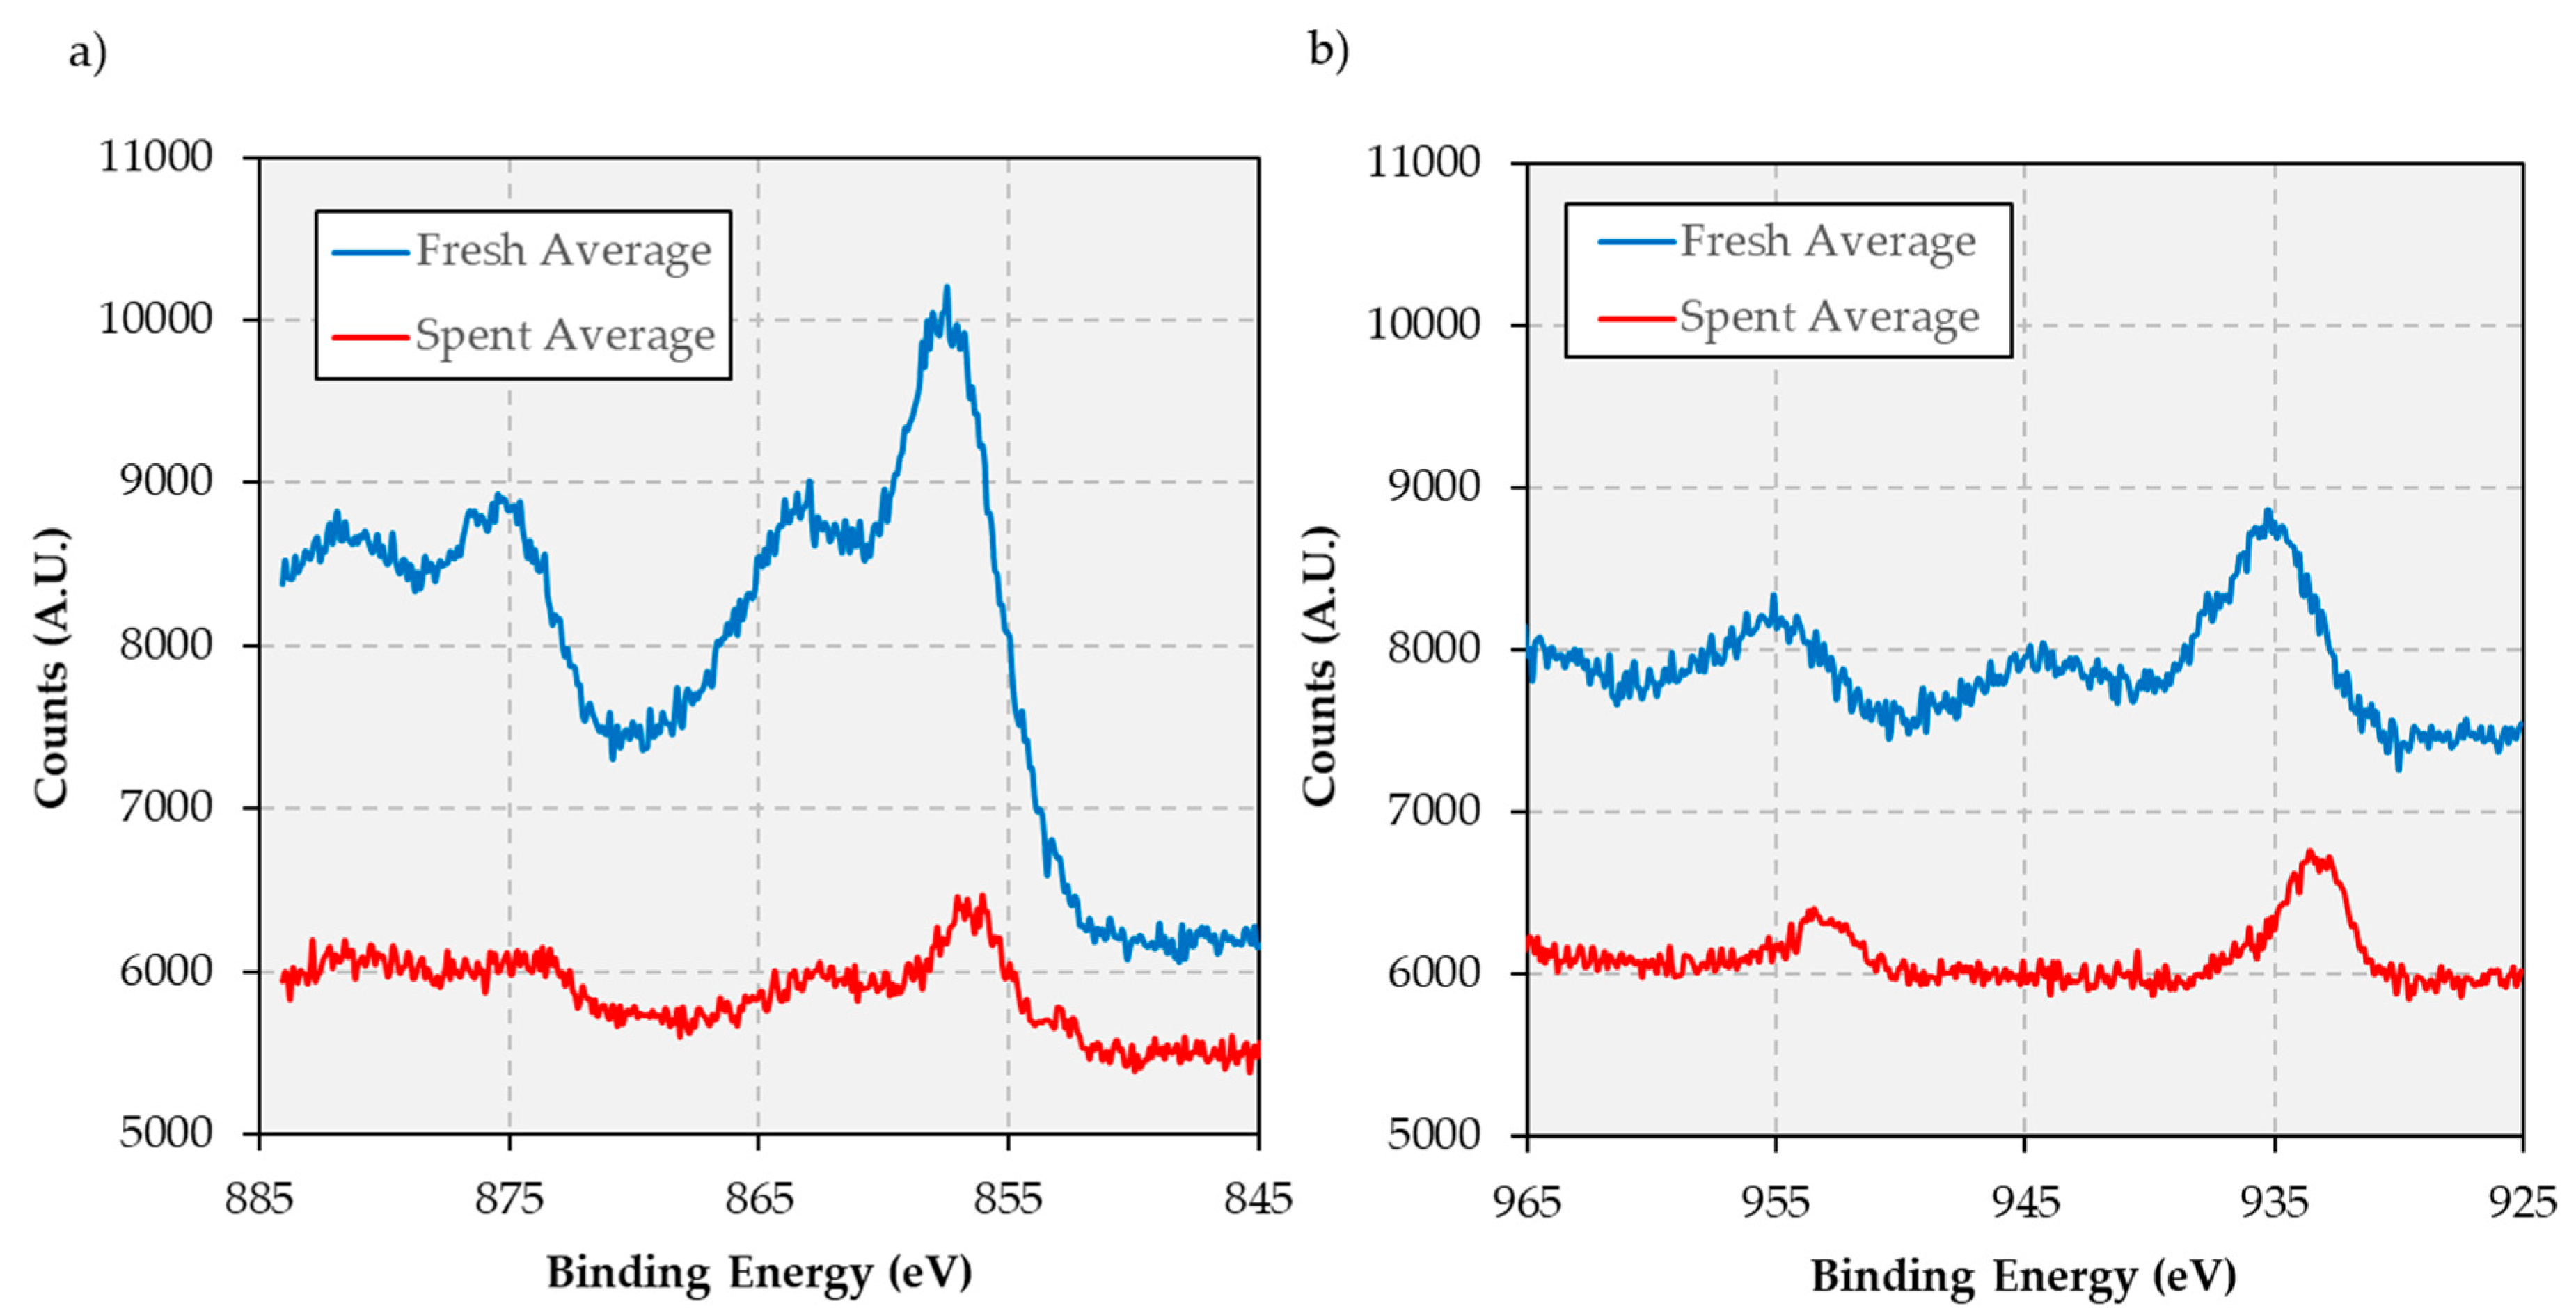
The conclusions garnered from DRIFTS measurements are reinforced by the results of x-ray photoelectron spectroscopy (XPS) analyses performed on both the fresh and spent catalysts (see
Figure A3 in
Appendix B). Indeed, while the spent catalyst displays features indicative of deactivation via coking and fouling—i.e., increased intensity of carbon peaks (not shown) and lower intensity of peaks associated with metals—a shift in both Ni and Cu peak maxima consistent with surface reduction to form metallic phases and a Ni-Cu alloy [
32,
33] is also observed. While the extent of alloying is difficult to determine quantitatively in the absence of density of state measurements, qualitative examination of the peak positions indicate a shift of the Cu 2p
3/2 binding energy to ~0.2 eV higher than that expected for copper metal, consistent with significant Ni-Cu alloying [
34,
35]. Integrating the respective Ni and Cu peaks after correcting for background and elemental sensitivity also shows evidence of Cu enrichment on the surface of the spent catalyst, with the surface Ni/Cu atomic ratio decreasing from 5.55 Ni atoms per Cu atom to 4.14 Ni atoms per Cu atom after 200 h on stream [
36]. Taken together, the CO-DRIFTS and the XPS data provide compelling evidence that both surface enrichment of copper and alloying of Ni with Cu have occurred, with other authors reporting depth profiling of similar species evincing near total coverage of metal particles by Cu despite XPS integrals consistent with the bulk composition [
36].
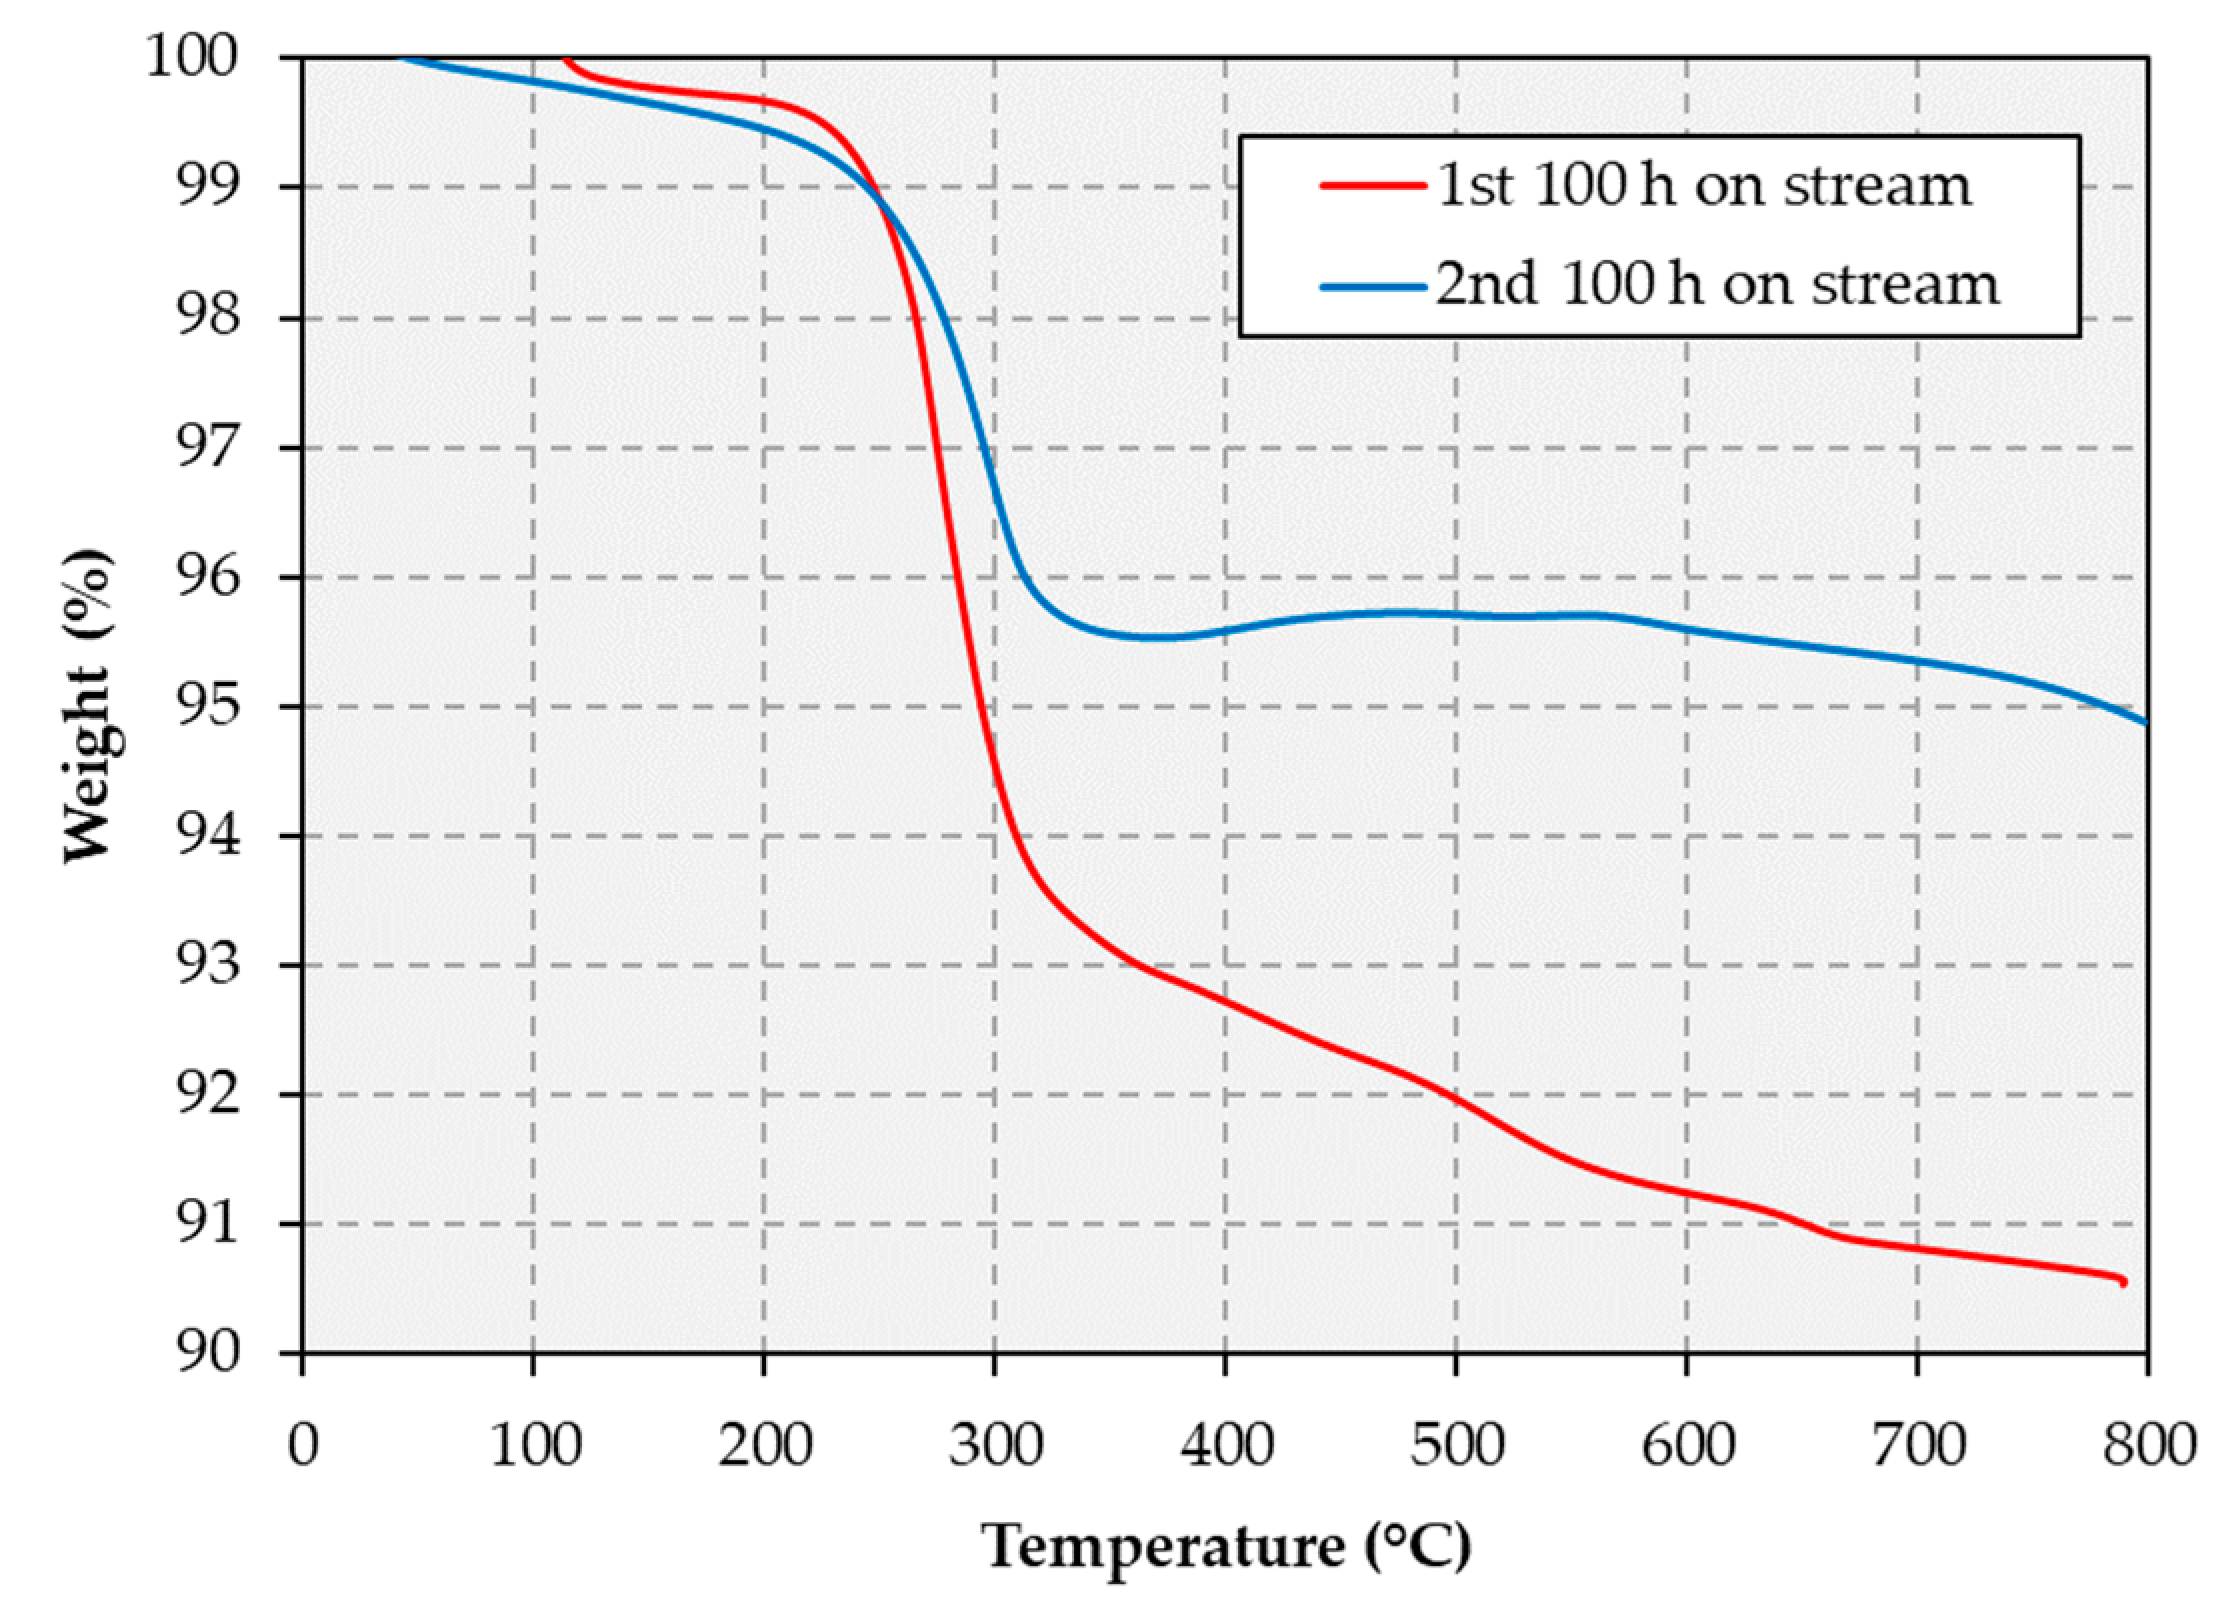
The thermogravimetric analysis (TGA) results in
Figure 7 show that the total mass loss displayed by the spent catalyst is 9.5 and 5.1% after the first and second 100 h cycle, respectively. This indicates that less coke forms during the second 100 h cycle, i.e., after the catalyst regeneration step. Catalytic cracking of the feed is known to exacerbate catalyst deactivation via coking and to be particularly problematic for Ni-based catalysts [
37]. As mentioned above, light hydrocarbons such as ethane, propane and butane are observed in greater abundance in the gaseous products evolved during the first 100 h cycle relative to the amount observed during the second 100 h cycle. This is consistent with the notion that the increased coking observed during the first 100 h stems from a higher cracking activity. Thus, sites responsible for cracking reactions appear to become irreversibly deactivated during the first 100 h cycle. Additionally, since adsorbed CO can also contribute to coking via the Boudouard reaction, the lower CO adsorption discussed above could also explain the decrease in carbonaceous deposits formed on the catalyst surface during the second 100 h cycle.
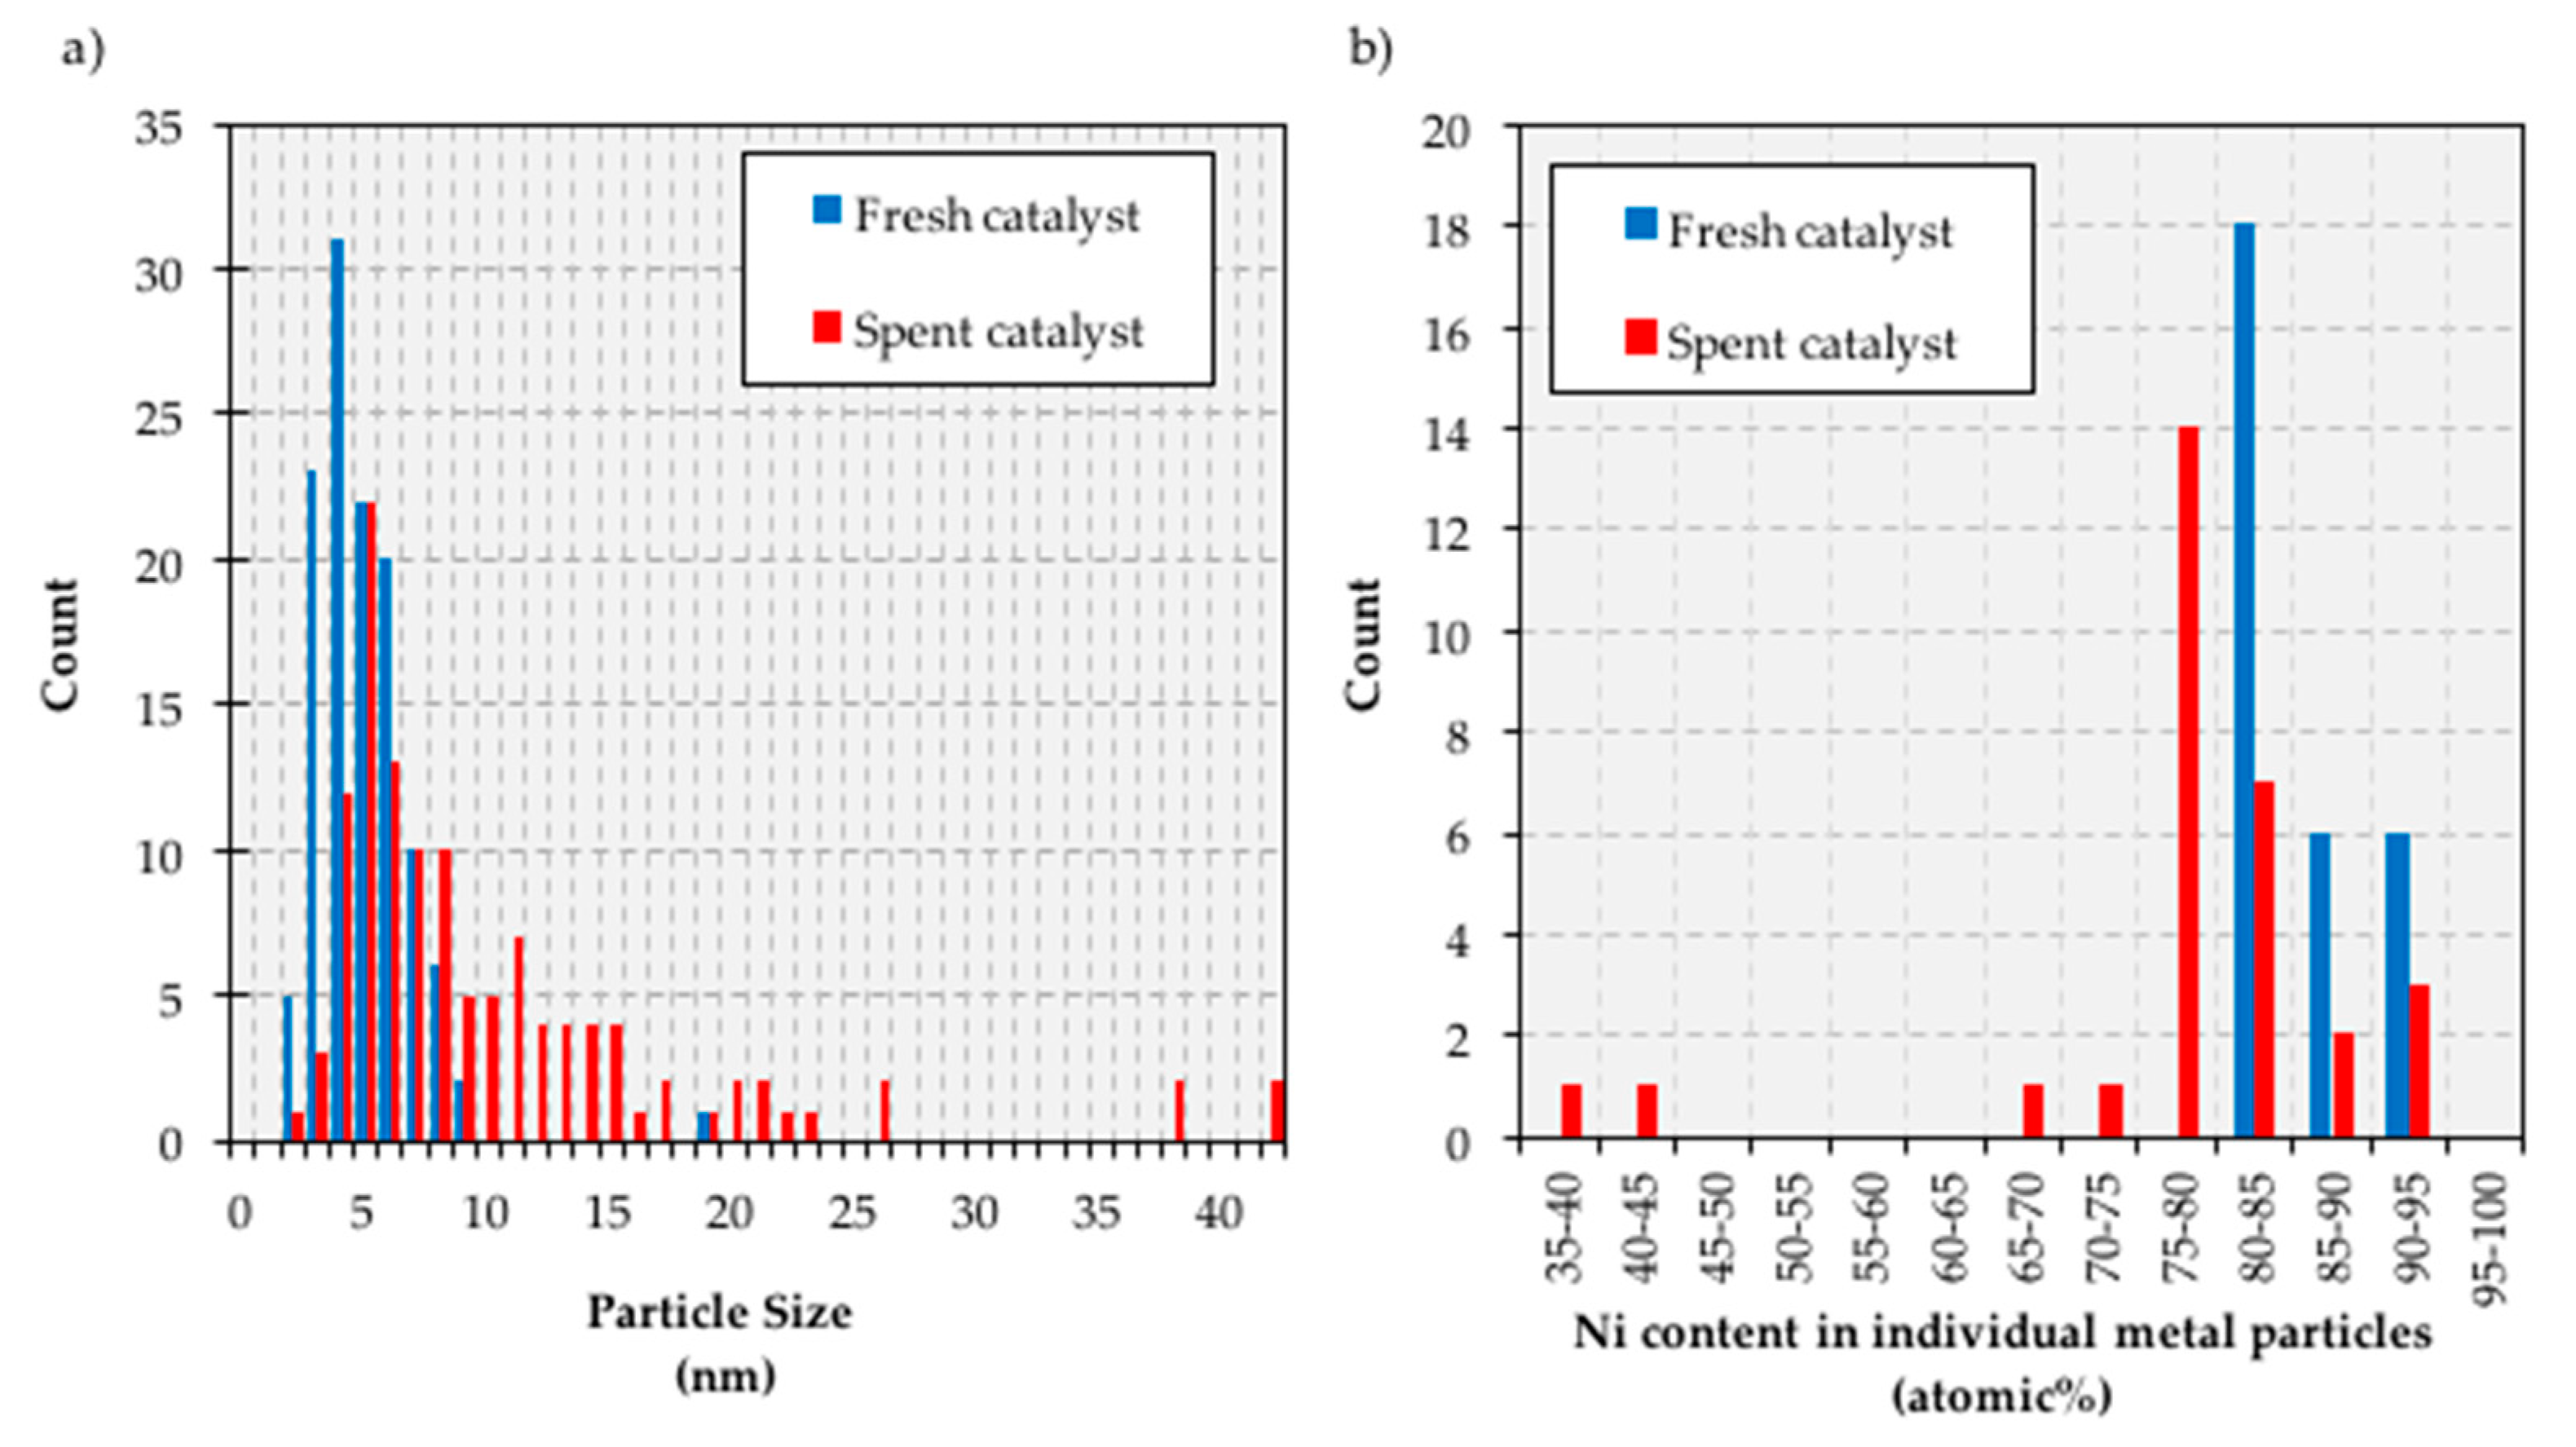
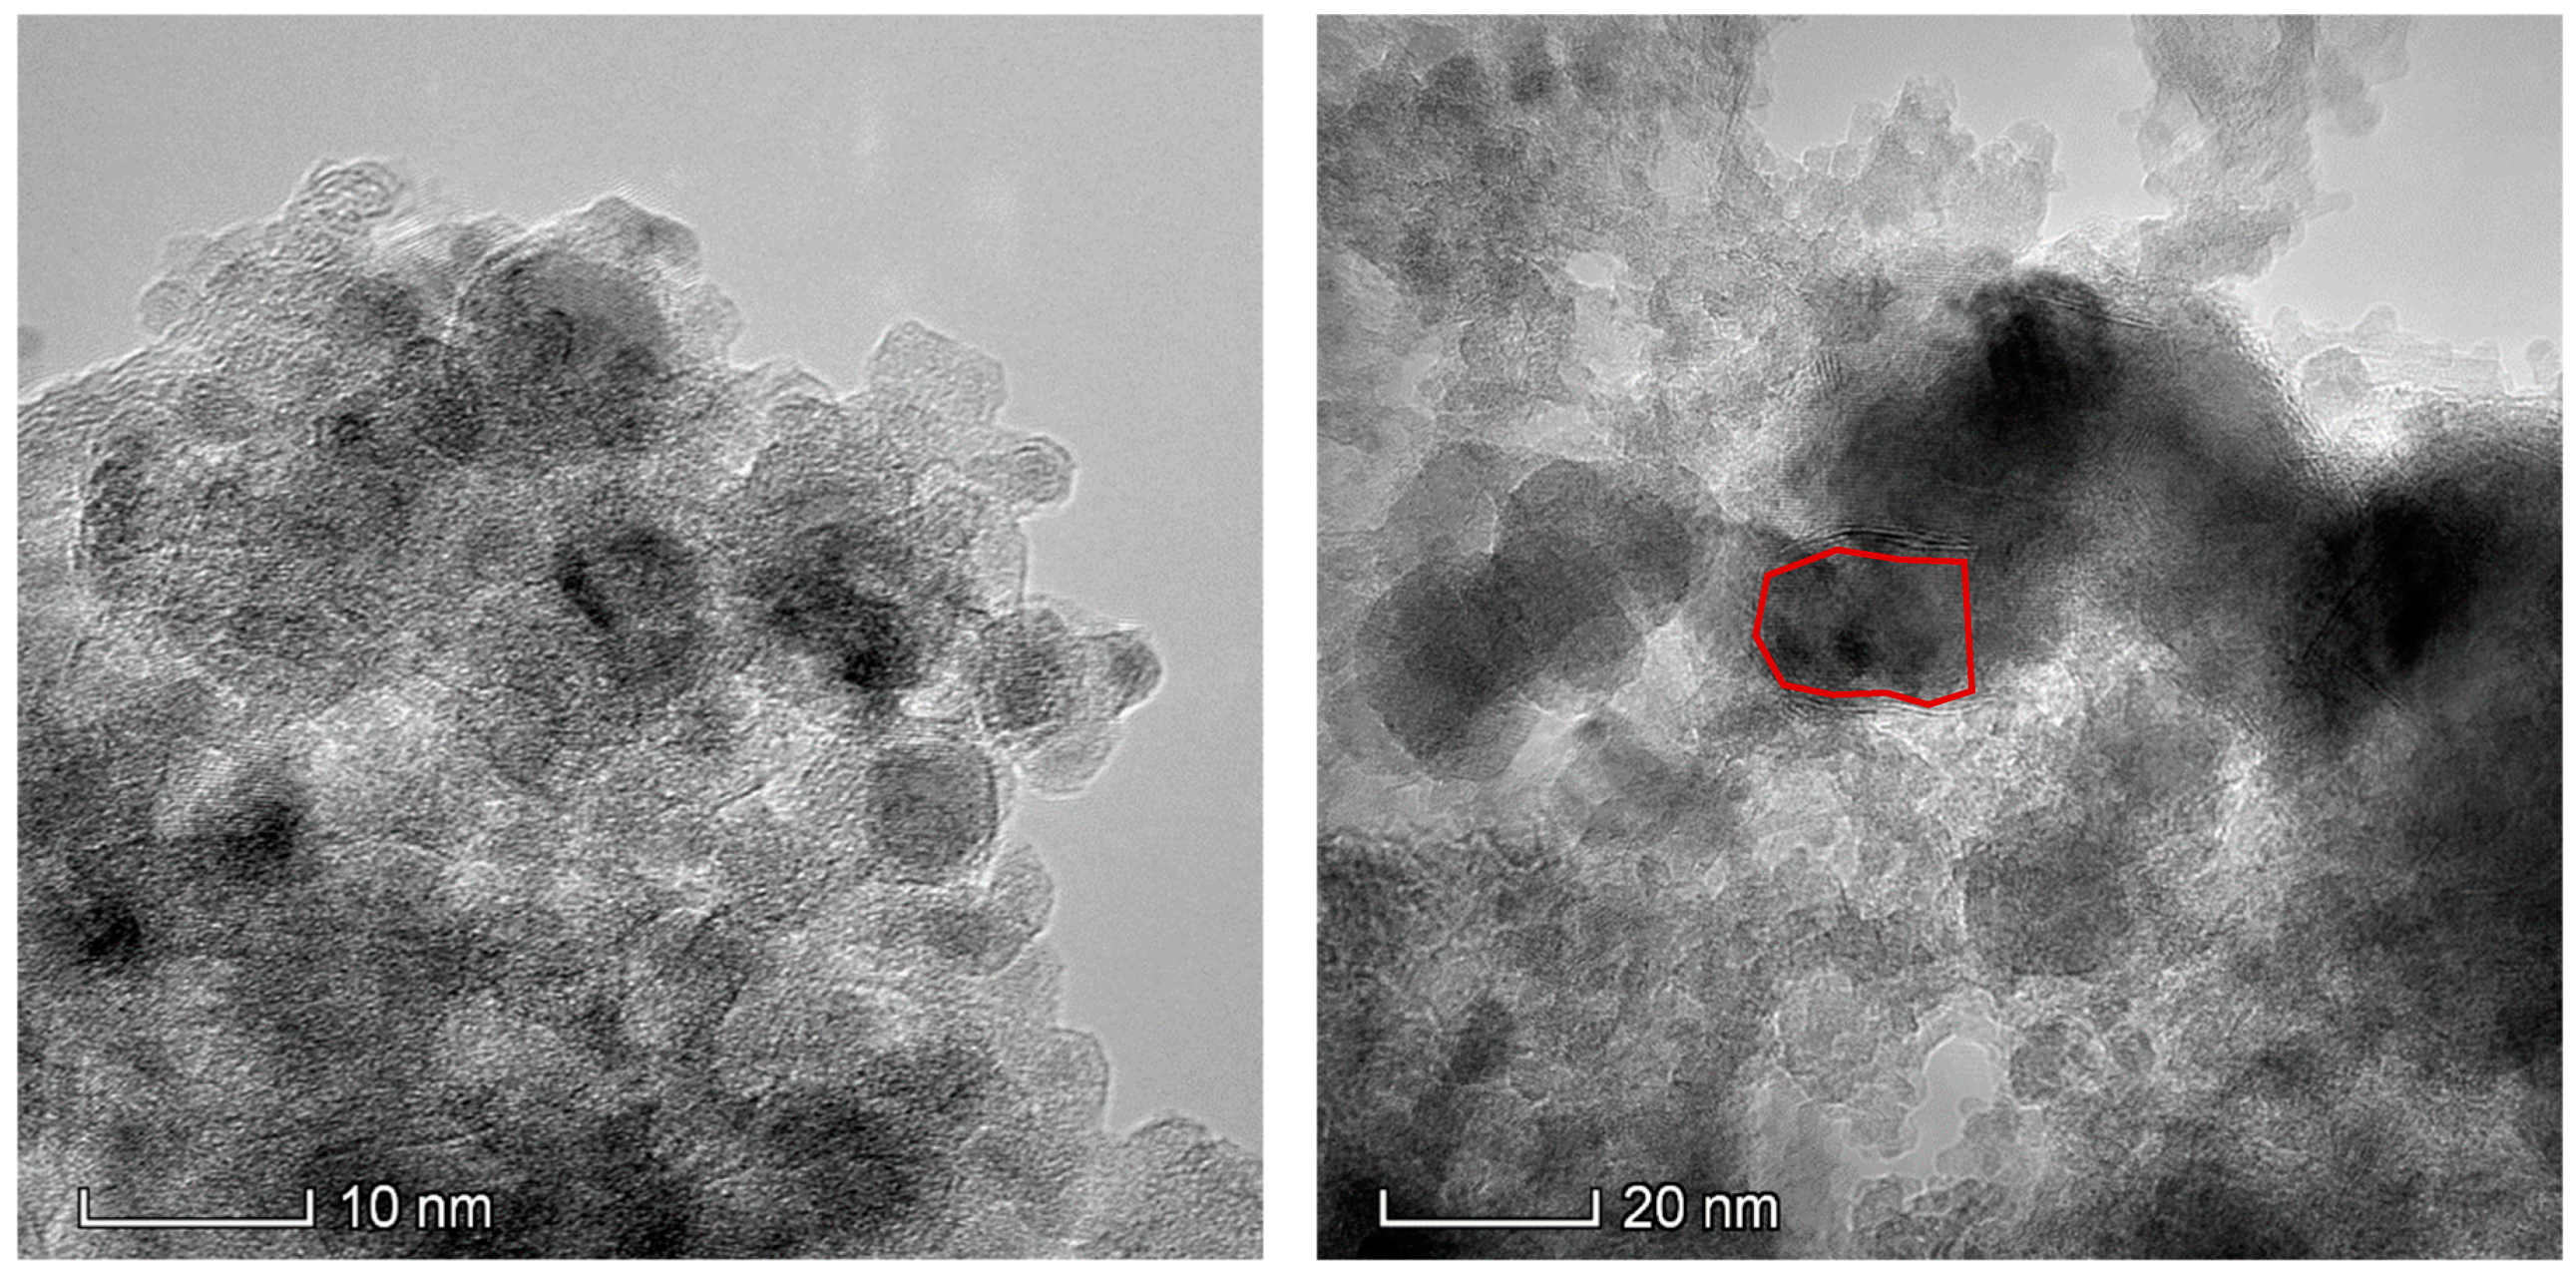
Important insights were also gained through the analysis of the fresh and spent (after the second 100 h on stream) catalyst via transmission electron microscopy-energy dispersive X-ray spectroscopy (TEM-EDS). First, TEM results show that while the metal particle size distribution in the fresh catalysts is narrow and centers around 4 nm particles, the spent catalyst has a wider particle size distribution with a considerable number of particles larger than 10 nm and as large as 40 nm (see
Figure 8a and
Figure A2 in
Appendix B). The fact that large particles arise at the expense of smaller particles (see
Figure 8a) suggests that sintering occurs via Ostwald ripening. TEM-EDS results show that the composition of metal particles in the fresh catalyst is very consistent and close to the composition of the bulk catalyst (particles of 80% Ni-20% Cu are expected for a 20% Ni-5% Cu/Al
2O
3 formulation, atomic and weight percent being very close due to the similar atomic weight of Ni and Cu), albeit a significant number of Ni-rich (85–95% Ni) particles is also observed (see
Figure 8b). However, the composition of metal particles in the spent catalyst is considerably different, as Cu-rich particles—from slightly enriched (75% Ni-25% Cu) to greatly enriched (35% Ni-65% Cu)—arise at the expense of the Ni-rich particles in the fresh catalyst. In short, the TEM and TEM-EDS results in
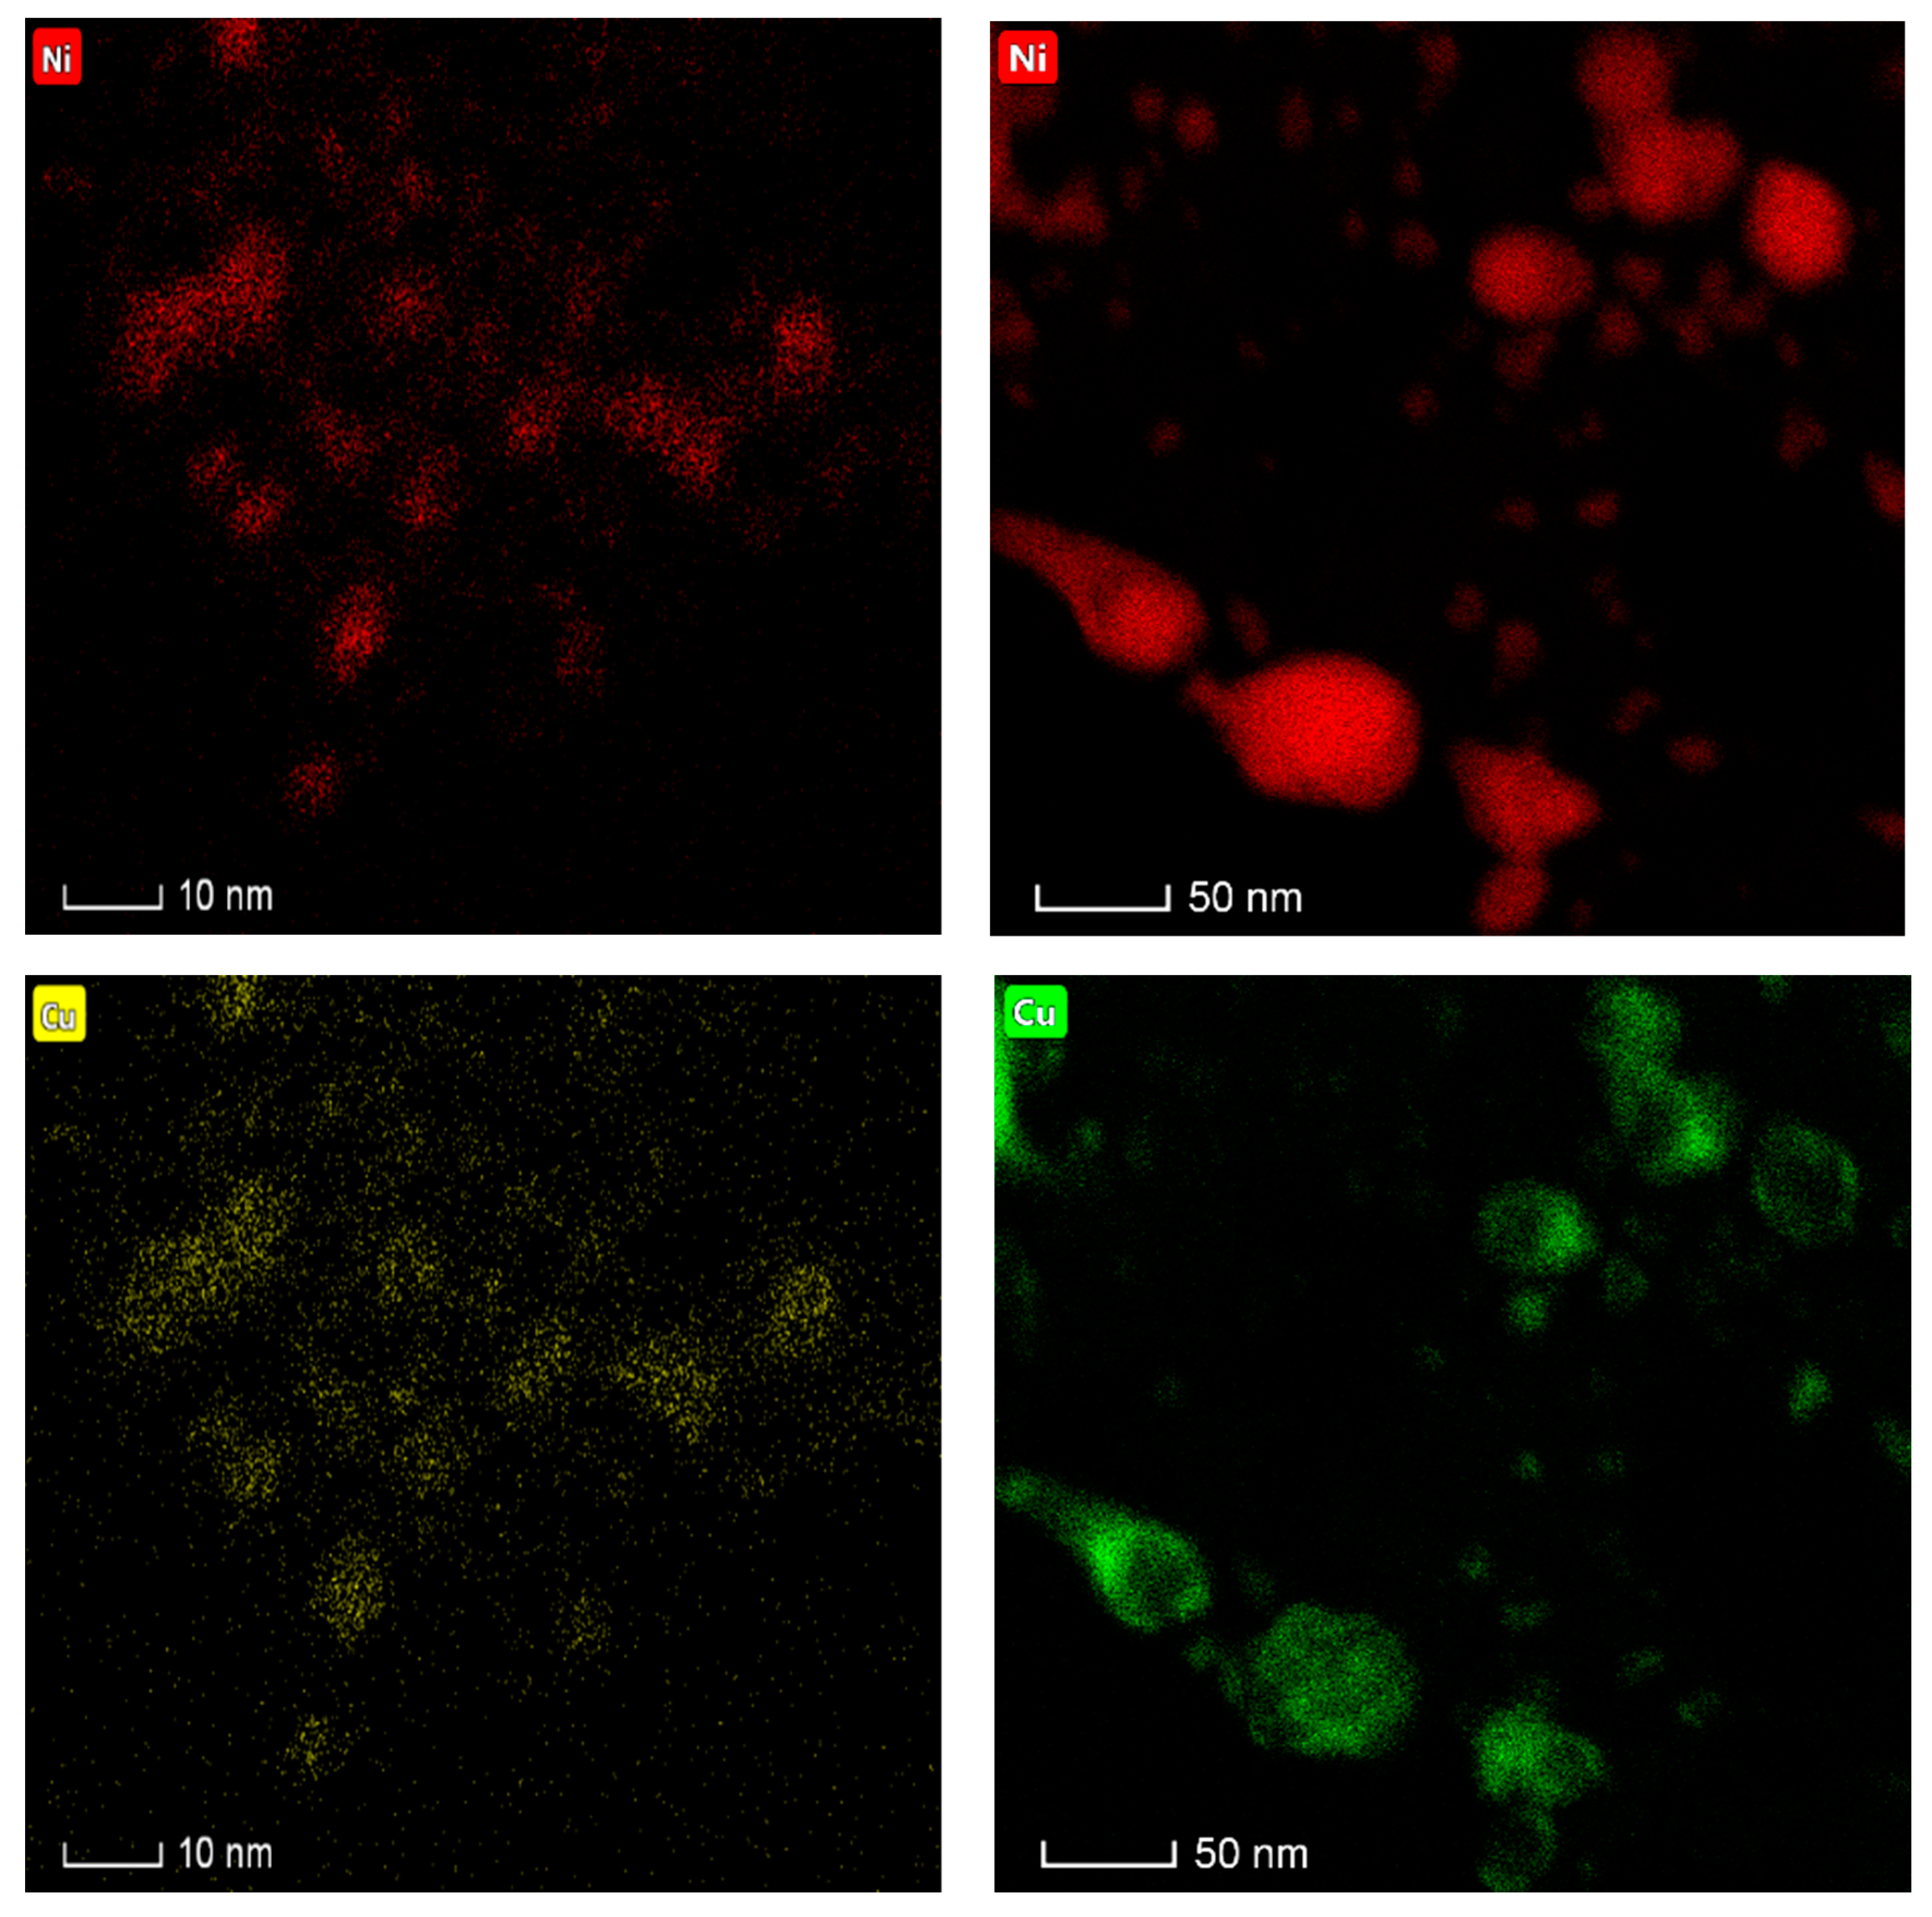
Figure 8 suggest that in the course of the experiment metal particles tend to both grow and become Cu-rich. The latter is consistent with the results of elemental mapping included in
Figure A2 in
Appendix B, which also show that Ni and Cu are closely associated irrespective of the catalyst state (fresh or spent). Nevertheless, more detailed studies—which fall outside the scope of this contribution—are needed to more thoroughly ascertain the relationship between particle size and both surface and bulk composition.
Finally, since it could be argued that the Cu enrichment of the catalyst can be attributed to the reaction between CO and Ni resulting in the formation of volatile Ni carbonyl and the concomitant loss of Ni, the fresh and spent (after the second 100 h cycle) catalyst was analyzed by inductively-coupled plasma-atomic emission spectroscopy (ICP-AES). Tellingly, while the material loaded into the reactor (a 1:1 mixture of catalyst and SiC diluent) had a Ni and Cu content of 8.87 and 1.98%, respectively, the corresponding values for the material recovered from the reactor (which also included 9.5% of coke deposits) were 7.39 and 1.62% (or 8.16 and 1.79% when corrected for coke). This corresponds to a Ni/Cu ratio of ~4.48 and ~4.56 for the fresh and spent catalysts, respectively, which clearly indicates that the catalyst experiences no loss of Ni. This is consistent with a report on the kinetics of nickel carbonyl formation [
38]. Indeed, the authors of this report concluded that the highly exothermic reaction that forms nickel carbonyl reaches a maximum rate at ~75 °C, after which nickel carbonyl formation decreases to reach negligible levels by 150 °C irrespective of the pressures (partial CO, H
2, or total pressure) employed. In deoxygenation experiments, the catalyst would only be exposed to CO at the reaction temperature of 375 °C, i.e., well above the range in which nickel carbonyl would form to an appreciable degree per the reference above. These results further confirm both the robustness of the catalyst under reaction conditions and its industrial applicability.

 and
and 


