Article

Tuning Sn-Cu Catalysis for Electrochemical Reduction of CO2 on Partially Reduced Oxides SnOx-CuOx-Modified Cu Electrodes

1
Key Laboratory for Green Chemical Technology of Ministry of Education, Collaborative Innovation Center of Chemical Science and Engineering, School of Chemical Engineering and Technology, Tianjin University, Tianjin 300072, China
2
College of Chemistry, Central China Normal University, Wuhan 430079, China
3
Department of Chemistry and Biochemistry, Southern Illinois University, Carbondale, IL 62901, USA
*
Authors to whom correspondence should be addressed.
Submission received: 12 April 2019 / Revised: 18 May 2019 / Accepted: 21 May 2019 / Published: 22 May 2019
(This article belongs to the Special Issue Catalytic Properties of Nanostructured Electrodic Materials)

Abstract

:
Copper-based bimetallic catalysts have been recently showing promising performance for the selective electrochemical reduction of CO2. In this work, we successfully fabricated the partially reduced oxides SnOx, CuOx modified Cu foam electrode (A-Cu/SnO2) through an electrodeposition-annealing-electroreduction approach. Notably, in comparison with the control electrode (Cu/SnO2) without undergoing annealing step, A-Cu/SnO2 exhibits a significant enhancement in terms of CO2 reduction activity and CO selectivity. By investigating the effect of the amount of the electrodeposited SnO2, it is found that A-Cu/SnO2 electrodes present the characteristic Sn-Cu synergistic catalysis with a feature of dominant CO formation (CO faradaic efficiency, 70~75%), the least HCOOH formation (HCOOH faradaic efficiency, <5%) and the remarkable inhibition of hydrogen evolution reaction. In contrast, Cu/SnO2 electrodes exhibit a SnO2 coverage-dependent catalysis—a shift from CO selectivity to HCOOH selectivity with the increasing deposited SnO2 on Cu foam. The different catalytic performance between Cu/SnO2 and A-Cu/SnO2 might be attributed to the different content of Cu atoms in SnO2 layer, which may affect the density of Cu-Sn interface on the surface. Our work provides a facile annealing-electroreduction strategy to modify the surface composition for understanding the metal effect towards CO2 reduction activity and selectivity for bimetallic Cu-based electrocatalysts.

Graphical Abstract

1. Introduction

Conversion of CO2 to valuable chemicals has been considered as a prospective way to reduce net CO2 emission and promote utilization of waste gas as well [1,2]. Among present approaches, electrochemical reduction of CO2 (ERC) is of particular interest, since with renewable electricity as an input, CO2 and water could be converted in a sustainable fashion into fuels and chemicals under mild conditions [3,4]. However, the viability of electrochemical conversion of carbon dioxide is currently restricted by the lack of inexpensive, efficient, selective and stable electrocatalysts.
To date, the majority of studies have focused on copper, aroused by a report from Hori and Suzuki that demonstrated methane and ethylene as the dominant products from CO2 reduction on a copper electrode. Cu nanofoam, Cu nanowire and oxide-derived copper (OD-Cu) have been developed for aqueous ERC [5,6,7,8,9,10]. However, there are still many problems to be addressed, such as competition with hydrogen evolution reaction (HER) and low selectivity towards a desired product. Experimental and theoretical studies have revealed that the selectivity of Cu can be tuned by introducing a secondary component, such as indium (In), tin (Sn) and sulfur (S) [11,12,13,14].
Sn has been preferably chosen to fabricate copper-based hybrid electrocatalysts due to its high hydrogen evolution overpotential, low cost and non-toxicity [15]. Takanabe et al. [16] reported that an electrode with the electrodeposited Sn on OD-Cu shows a high selectivity to CO with a CO faradaic efficiency (FECO) over 90%, which is attributed to the generation of a Sn-Cu surface significantly inhibiting adsorbed H*. Meanwhile, Wang et al. [17] developed a catalyst with Sn nanoparticle on copper oxide CuxO nanowire toward the high FECO at an optimal coverage of Sn nanoparticles. Recently, a Sn-Cu electrode consisting of dendritic Cu core and a partially reduced oxides CuOx/SnOx shell also achieved excellent FECO with a maximum of 94% due to the sparse Sn specie [18]. In contrast, some Sn-Cu electrodes generate formate as the dominant product [19,20,21,22,23]. For example, an electrode with spiky Cu@Sn nanocones over Cu foam exhibits an outstanding FEHCOOH of 90.4%. Besides this, Wang et al. reported that FEHCOOH on a porous Sn/Cu electrode can reach up to 91.5%. For understanding the selectivity to CO and formate on Sn-Cu electrodes in ERC, Sun et al. [24] have demonstrated a strategy of controlling the synergistic effect between Cu and SnO2 in the core/shell structure. They found that the thicker SnO2 shell acts like the SnO2 nanoparticle catalysis for the formation of formate, whereas the thinner SnO2 shell is selective to the formation of CO, attributed to the coexistence of uniaxial compression and Cu atoms on the SnO2 surface or subsurface. However, there is still a need for extensive study for understanding the Sn effects for the Sn-Cu based electrocatalysts.
In this work, we use the partially reduced oxides SnOx, CuOx modified Cu electrode to investigate the Sn-Cu catalysis towards CO2 reduction activity and selectivity. The SnO2-decorated Cu foam electrode Cu/SnO2 is fabricated through electrodepositing SnO2 film on porous copper foam followed by electrochemical pre-reduction. Through applying an additional annealing step, the A-Cu/SnO2 electrode is constructed. Following the above strategy but changing the depositing time of SnO2, the electrodes with a different amount of deposited SnO2 are prepared. Furthermore, the effect of Cu and Sn on CO2 reduction activity and product selectivity could be discussed based on their performance for electrochemical reduction of CO2.

2. Results and Discussion

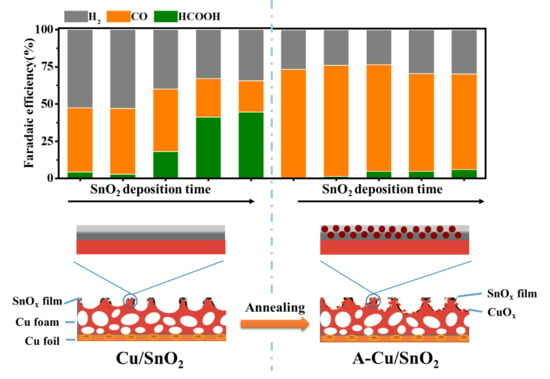
2.1. Fabrication and Characterization of Cu/SnO2 and A-Cu/SnO2 Electrodes

As shown in Figure 1, Cu foam was electrodeposited on Cu foil in an acidic CuSO4 solution at a current density of −3 A cm−2 for 15 s using hydrogen bubbles as a dynamic template. The Cu/SnO2 electrode was obtained by performing electrodeposition in the SnCl4 electrolyte for 30 min followed by the electroreduction treatment in a CO2-saturated 0.1 M KHCO3 solution at −0.5 V vs. reversible hydrogen electrode (RHE) for an hour. For obtaining the A-Cu/SnO2 electrode with coexisting copper oxides in SnO2 layer, annealing procedure (200 °C for 6 h in a muffle furnace) was applied along with the above electrodeposition and electroreduction procedures. After electroreduction under the applied potential in this work, the partially reduced tin oxides, SnOx, or partially reduced copper oxides, CuOx, could form on Cu foam, which would provide the catalytic sites for electrochemical reduction of CO2.
The SEM images at each stage for Cu/SnO2 and A-Cu/SnO2 are shown in Figure 2 and Figures S1–S3. The three-dimensional dendritic Cu foam (Figure S1) with about 40 um pore size was successfully constructed, which could provide a large electrochemical surface area [5]. After depositing SnO2 layer on Cu foam (Figure 2a) and then performing pre-reduction, the resultant Cu/SnO2 electrode (Figure 2b) ideally maintains the porous structure and shows a thin layer consisting of numerous packed flakes covering the original copper dendrites. The cross-sectional view (Figure S2) indicates that the thickness of Cu foam and deposited SnO2 layer on Cu foil is 60–70 um. Furthermore, through above procedure but adding an annealing step before pre-reduction, A-Cu/SnO2 electrode was obtained. Figure 2c,d show the morphology for A-Cu/SnO2 at the stage of annealing and pre-reduction, respectively. Obviously, A-Cu/SnO2 displays the same porous structure, but with a significant increase of Cu atoms on the surface (EDS: 76.5%, 78.4%) compared with Cu/SnO2 (EDS: 66.2%, 66.7%). In addition, the SEM elemental mapping of Cu and Sn for the Cu/SnO2 electrode before and after pre-reduction (Figure S3a and Figure 2e) reveals that SnO2 is mainly electrodeposited on the outer Cu walls of the porous structure, forming a connecting film on the surface. Whereas, from the SEM elemental mapping of A-Cu/SnO2 at the stage of annealing and pre-reduction (Figure S3b and Figure 2f), it can be seen that Sn atoms distribute both inward pores and the outward pores, indicating the re-distribution of SnO2 during preparation. Besides this, ICP-AES results for Cu/SnO2 and A-Cu/SnO2 (Table S1) reveals that there is no missing Sn atom due to annealing treatment. Together with above results, we could speculate that there is a significant migration of Cu and Sn atoms for the A-Cu/SnO2 electrode due to annealing, leading to the enrichment of Cu atoms and a decrease of Sn atoms on the surface, which is also confirmed by XPS analysis (Table S2). Moreover, the structure of the deposited SnO2 film (inset images of Figure 2a–c) shows that there is a slight breakage of SnO2 film after annealing treatment, which might be caused by the formation of copper oxides as well as migration of SnO2 inward to the holes.
Figure S4 and Figure 3a give the XRD patterns of the samples at each fabrication step. Similar to Cu foil, Cu foam (Figure S4) also exhibits three distinct peaks assigned to Cu (JCPDS 04−0836). For the Cu/SnO2 electrode, it shows the same diffraction peaks before and after the electrochemical pre-reduction—two broad peaks at 26.6° and 33.9°assigned to (110) and (101) planes of the deposited SnO2 (JCPDS 41−1445) besides the diffraction peaks of Cu. In contrast, for the A-Cu/SnO2 electrode before the pre-reduction treatment, three obvious peaks at 36.4°, 42.3° and 61.3° ascribed to (111), (200) and (220) planes of Cu2O (JCPDS 65−3288) appear along with the relatively decreased intensity of the Cu(111) peak, suggesting the formation of Cu2O particles through annealing at 200 °C for 6 h. Obviously, the as-prepared A-Cu/SnO2 shows the absence of Cu2O peaks, which indicates the reduction of Cu2O during electrochemical pre-reduction, leading to the formation of partially reduced copper oxides. Besides this, an intensity increase of SnO2 diffraction peaks is observed for the electrode with the annealing step from Figure 3b, indicating the improved crystallinity of SnO2 due to heat treatment. Obviously, the Sn-Cu oxides-modified Cu foam is achieved through facile annealing step.
To confirm the chemical states of Cu and Sn for Cu/SnO2 and A-Cu/SnO2, X-ray photoelectron spectroscopy (XPS) analyses were performed. For comprehensive comparison, the samples of Cu/SnO2 and A-Cu/SnO2 without pre-reduction treatment are also analyzed. XPS survey spectra are shown in Figure S5. Figure 4a shows the high-resolution Cu 2p spectra. It can be seen that they all present the typical four peaks, which could be assigned to the mixed oxidation states of copper [8,9,17]. This result is not entirely consistent with XRD patterns (Figure 3). Since XPS is a surface-sensitive analysis, a trace amount of copper oxide presenting on the surface due to the air oxidation during storage is detected but is not observed in XRD. Similarly, CuO is not detected in XRD but can be identified by XPS. Notably, it is obvious that A-Cu/SnO2 displays increased Cu(II) satellite peaks at 942.8 and 962.1 eV in comparison with those of Cu/SnO2, and the intensity increase is significant even before pre-reduction, indicating the formation of a significant amount of copper oxides on the surface during annealing. This is further confirmed by the quantitative analysis (Table S2) that the atomic percent of Cu is 26.0% for A-Cu/SnO2 and 17.1% for Cu/SnO2. In addition, it is observed that the electroreduction treatment leads to a remarkable intensity decrease of peaks assigned to copper oxide species for A-Cu/SnO2, suggesting the occurrence of the reduction reactions. As a result, partially reduced oxides CuOx could appear on the surface of A-Cu/SnO2 [9,17], in agreement with the disappearance of Cu2O peaks in the XRD pattern of A-Cu/SnO2 (Figure 3). Figure 4b shows the high-resolution Sn 3d spectra for the samples. Two peaks at 494.9 and 486.5 eV, corresponding to Sn 3d5/2 and Sn 3d3/2, are assigned to the Sn(IV)/Sn(II) species (indistinguishable) [17,25,26]. For the Cu/SnO2 electrode, there is a slight decrease of peak intensity, indicating the mild reduction of tin oxide. Different from Cu/SnO2, A-Cu/SnO2 presents another two peaks at 491.7 and 483.1 eV that correspond to Sn(0) [25,26]. This reveals that SnO2 particles on A-Cu/SnO2 are reduced more deeply than that on Cu/SnO2 under the same condition, evidenced by the I-t curves during pre-reduction process (Figure S6). The higher reactivity of A-Cu/SnO2 under the reduction potential might be attributed to the fact that the growth of copper oxides makes the dense SnO2 layer slacked off during annealing. According to the above results, it is demonstrated that Cu/SnO2 mainly consists of partially reduced oxides SnOx on Cu foam, while for A-Cu/SnO2, the main components on Cu foam are Sn-SnOx-CuOx. The distinctive composition between Cu/SnO2 and A-Cu/SnO2 would give rise to the different CO2 reduction activity and product distribution.

2.2. LSV Analysis for Cu/SnO2 and A-Cu/SnO2

Linear scan voltammetry (LSV) tests were performed on Cu foam, Cu/SnO2 and A-Cu/SnO2. The results are shown in Figure 5. The solid and dashed lines represent the cathodic current density curves obtained in CO2-saturated and N2-saturated 0.1 M KHCO3 solutions, respectively. The more dramatic current increase in the CO2-saturated electrolyte indicates that the reduction of CO2 is catalytically more favorable relative to H2O reduction. Thus, it is obvious that they all exhibit activity toward CO2 reduction with the increased activity in sequence: A-Cu/SnO2 > Cu/SnO2 > Cu foam. Besides this, the current densities in N2 atmosphere on Cu/SnO2 and A-Cu/SnO2 are much weaker than that on Cu foam, indicating hydrogen evolution reaction is effectively suppressed. This could be attributed to the fact that H binding sites are inhibited due to the presence of Sn species [15,27].

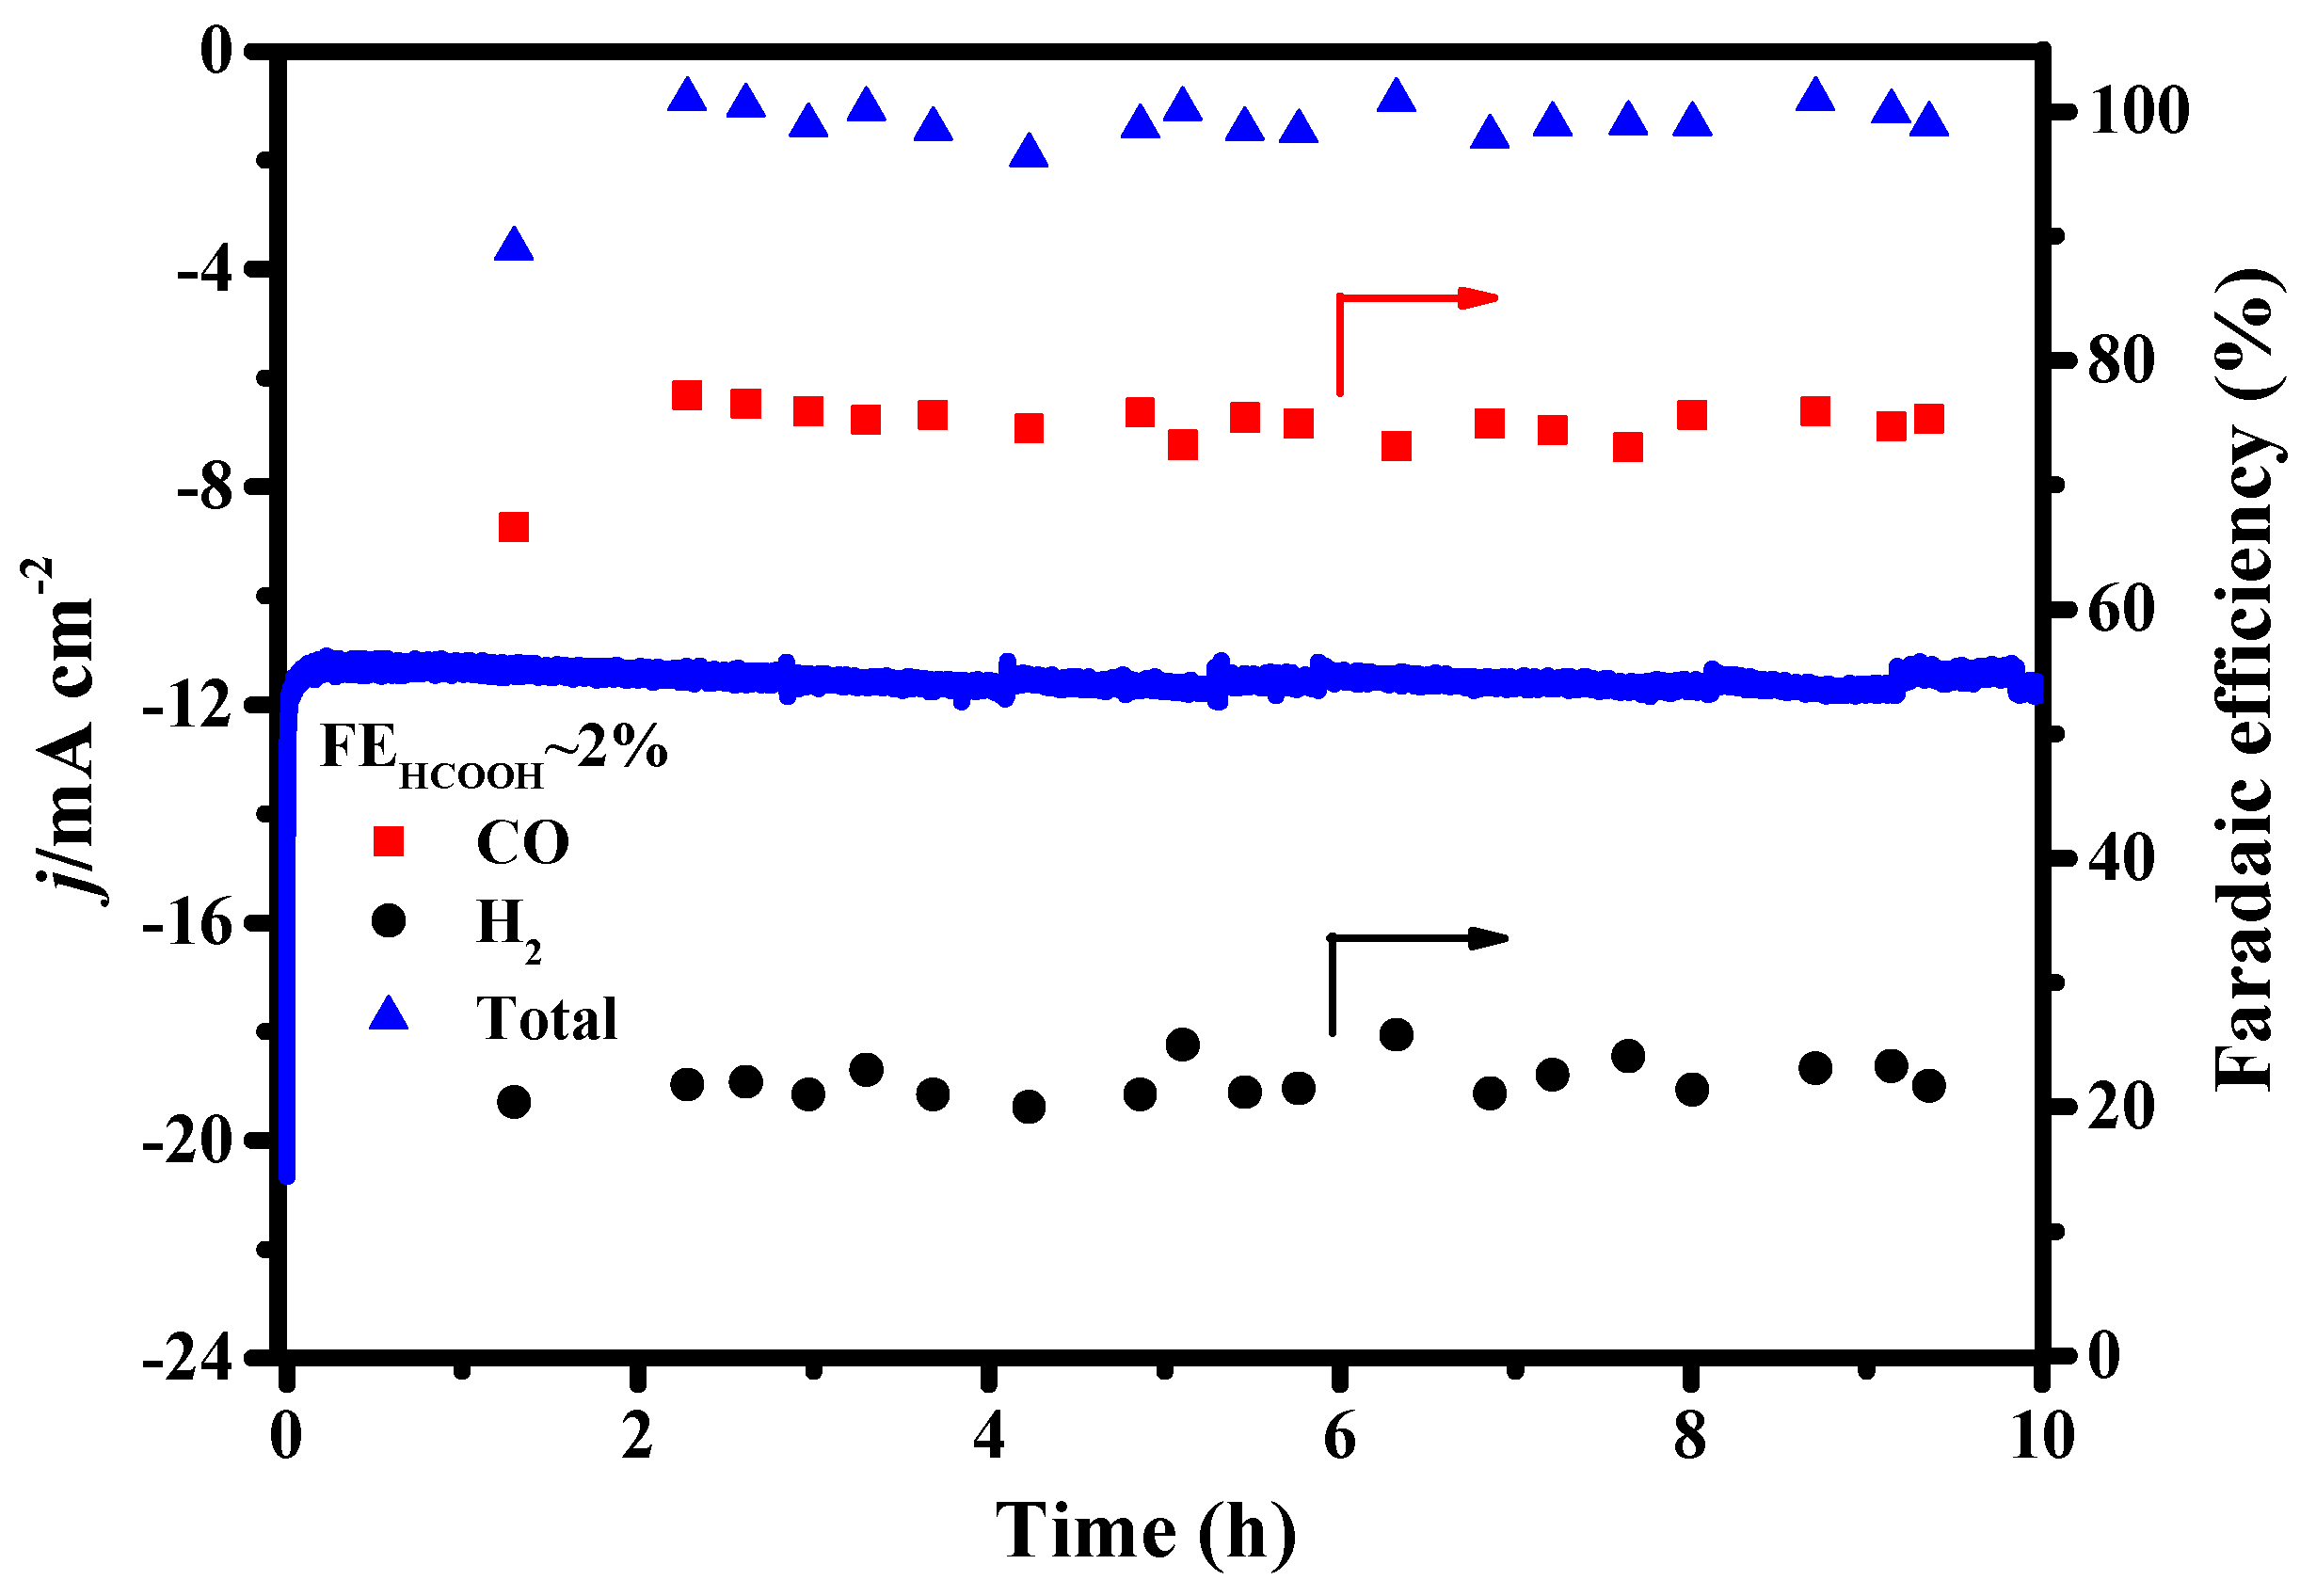
2.3. CO2 Reduction Activity and Product Selectivity on Cu/SnO2 and A-Cu/SnO2

The product distributions of Cu/SnO2 and A-Cu/SnO2 for ERC are further evaluated under different potentials (−0.8 V to −1.2 V vs. RHE) in CO2-saturated 0.1 M KHCO3 solution, respectively. The control experiments are also conducted on Cu foam and Sn plate. The I-t curves and the average current densities at different potentials for four electrodes are shown in Figure S7 and Table S3. The calculated FEs of H2, CO and HCOOH are compared in Figure 6. The Cu foam electrode (Figure 6a) primarily produces H2 with a small amount of CO and HCOOH (total FEs, 30%) throughout a broad potential range (from −0.9 to 1.2 V vs. RHE). In contrast, Cu/SnO2 (Figure 6b) shows a much-decreased FE of H2 in the investigated potential range, indicating hydrogen evolution reaction is effectively suppressed after SnO2 decoration. Besides this, at the low potential of −0.8 V, Cu foam shows the highest H2 FE of 90% and nearly 10% HCOOH FE. In contrast, Cu/SnO2 gives 75% of H2 FE and 25% of CO FE. This clearly demonstrates that Cu/SnO2 has higher CO2 reduction activity and CO selectivity than Cu foam. Furthermore, when comparing with Sn plate (Figure 6d), it is observed that the potential dependent H2 FE and HCOOH FE on Cu/SnO2 are very similar to that of Sn plate, likely indicating the existence of active sites functioning as metal Sn. In the case of A-Cu/SnO2, also a SnO2 decoration Cu electrode but with an additional annealing step, a predominantly higher selectivity to CO and a significant decrease of FEs of H2 and HCOOH are observed, especially at the cathodic region from −0.8 to −1.0 V vs. RHE. Importantly, nearly 60% CO FE is obtained at −0.8 V while H2 FE decreases to ~40% and little HCOOH forms. This result indicates that A-Cu/SnO2 has even higher CO2 reduction activity and CO selectivity than Cu/SnO2. Notably, the trend of the products on A-Cu/SnO2 is consistent with the reported Cu-Sn catalysts showing Sn-Cu synergistic effect, such as Sn decorated oxide-derived Cu [16], tin nanoparticles-decorated Cu2O nanowires [17] and core/shell Cu/SnO2 (thinner shell 0.8 nm) [24]. Therefore, we note from the above results that the Sn-Cu synergistic effect may play a key role for CO2 to CO conversion selectively on Cu/SnO2 and A-Cu/SnO2. This effect may be explained by several studies on the DFT calculation for Cu-Sn catalysts [6,15,27]. The Sn atom can alter the adsorption sites on the surface of Cu, disfavoring the adsorption of H and leaving the adsorption of CO relatively unperturbed. Thus, it diminishes the hydrogenation capability (selectivity toward H2 and HCOOH) while hardly affecting the CO formation, leading to the improved FE of CO.
We can also understand the Sn effect for altering the product distribution of Cu from the mechanistic pathway for CO2 reduction. Generally, the mechanism for electrochemical reduction of CO2 on metal electrodes is believed to start with a rate-determining initial electron transfer to CO2 to form a surface-adsorbed ·CO2 intermediate [6,26,28,29]. For the electrodes Cu foam, Cu/SnO2 and A-Cu/SnO2, their CO partial current density Tafel plots (Figure S8) show the slope of 143.5 mV/dec, 125.9 mV/dec and 119.1 mV/dec, respectively, indicating the above mechanism could be applied. The following step is the protonation of ·CO2 through a second proton-electron pair. Competing rate-determining steps, protonation at C versus O of ·CO2, may determine the HCOOH vs. CO selectivity. In other words, the selectivity of CO and HCOOH depends on the binding strength of key intermediate *COOH for CO production and the key intermediate *OCHO for HCOOH production. Referring to the DFT calculation about the selectivity for CO2 reduction to HCOOH and CO on metal electrodes [15], Sn is the metal near the peak of both the *COOH and *OCHO volcanoes, whereas *OCHO interacts more strongly with Sn surface than *COOH, steering the selectivity to HCOOH over CO for Sn. In contrast, Cu is the metal having a medium *COOH binding energy and sitting on the weak-binding side of the *OCHO volcano, producing hydrocarbons except the CO and HCOOH with low selectivity. Doping the copper with Sn species would result in the changes of the binding energy of the related intermediate [11]. Thus, the Sn-Cu effect could be optimized by tuning the relative amount of Cu and Sn to an optimal value. The difference of CO2 reduction activity and product distribution between Cu/SnO2 and A-Cu/SnO2 might be a result from different density of Cu-Sn interface on the surface, reflected from the different content of Cu atoms in SnO2 layer by XPS analysis (Cu 17.1%, Sn 23.8% for Cu/SnO2 and Cu 26.0%, Sn 10.1% for A-Cu/SnO2) [17,24]. Besides this, the increase of Cu atoms on the surface for A-Cu/SnO2 could be evidenced by the presence of the obvious copper redox feature in cyclic voltammograms (CVs) curves, as illustrated in Figure S9. Further work should focus on operando spectroscopic characterizations to elucidate the exact active sites and the role of the Sn-Cu synergistic effect to determine the pathway of CO2 reduction [27,30].
For understanding the Sn-Cu catalysis on Cu/SnO2 and A-Cu/SnO2 systematically, besides the above investigated electrodes Cu/SnO2 and A-Cu/SnO2 (deposition time, 30 min), other electrodes were fabricated with the short deposition time of 5 min and 15 min, and long deposition time of 45 min and 60 min. Their SEM images and EDX results are displayed in Figures S10–S13 and Table S4. The FEs of the products for these electrodes are illustrated in Figure 7a,b.
For Cu/SnO2 electrodes with different SnO2 deposition time, FE of HCOOH increases with the increasing deposition time, accompanying the decrease tendency for FE of H2. FE of CO is at a higher level when the deposition time is within 30 min. A sharp decrease of CO FE appears at the deposition time of 45 min, and the decrease continues with the prolonged deposition time, which is along with sharp increase of HCOOH FE. It is obvious that there is a selectivity transformation from CO to HCOOH at a deposition time of 45 min, at which the surface of Cu foam becomes completely covered by deposited SnO2. It reveals a SnO2 coverage-dependent catalysis on Cu/SnO2 electrodes, similar to the SnO2 thickness-dependent catalysis for core/shell Cu/SnO2 in Sun’s work [23]. It is likely demonstrated that Sn-Cu synergistic effect doesn’t work without a relative amount of Cu atom on the SnO2 surface. By contrast, there is no apparent shift from one dominant product to another for the A-Cu/SnO2 electrodes with different SnO2 deposition time, which all present the dominant CO formation (FECO, 70~75%), less H2 formation (FEH2, 22~30%) and the least formation of HCOOH (FEHCOOH, <5%), which reflects a characteristic product selectivity caused by Sn-Cu synergistic effect, as previously reported for Sn-modified Cu electrodes [16,17,18]. It has been found from XRD and XPS results of A-Cu/SnO2 (30 min) that annealing could cause the apparent increase of Cu content on the surface. Therefore, the similar product selectivity for A-Cu/SnO2 electrodes with different deposition times also suggested the importance of the content of Cu atom in SnO2 layer for the function of Sn-Cu synergistic effect.
Furthermore, the stability test is conducted on A-Cu/SnO2 electrode with a deposition time of 15 min for 10 h under −1.0 V vs. RHE in CO2-saturated 0.1 M KHCO3 solution. The result is shown in Figure 8. Obviously, the total current density is maintained well at −8.5 mA cm−2, and the selectivity for CO keeps steadily around 75% throughout the 10 h electrolysis. Besides this, by comparing the XRD (Figure S14) patterns and SEM images (Figure S15) of A-Cu/SnO2 (15 min) before and after the 10 h electrolysis, it is revealed that the surface morphology and composition maintain well. The good stability should be ascribed to the large electrochemical active surface area (ECSA, shown in Figure S16), which could prevent the active sites on the surface from the contamination of impurities in solution or C deposits formed during CO2 reduction [31,32].

3. Materials and Methods

3.1. Materials

Copper foil (99.9%, 0.3 mm thickness, IncoleUnion, Tianjin, China) was used to prepare electrode substrate. Tin foil (99.9%, 0.3 mm thickness, IncoleUnion, Tianjin, China) and phosphoric acid (H3PO4, 85%, Yuanli, Taiwan, China) were used for electropolishing copper foil. Copper(II) sulphate pentahydrate (CuSO4·5H2O, 99%, J&K, India) and sulfuric acid (H2SO4, 98%, Yuanli, Taiwan, China) were used in electrodepositing copper foam. Tin foil (99.9%, 0.5 mm thickness, IncoleUnion, Tianjin, China), tin(IV) chloride pentahydrate (SnCl4·5H2O, 99%, J&K, India), nitric acid (HNO3, 99%, Yuanli, Tianjin, China) and sodium nitrate (NaNO3, 99.9%, Aladin, Shanghai, China) were used in electrodepositing SnO2 film on Cu foam. Potassium bicarbonate (KHCO3, 99.5%, J&K, India) was used as electrolyte in electrochemical reduction of CO2.

3.2. Electrode Preparation

3.2.1. Fabrication of Cu Foam

The Cu foil (1.0 × 1.0 cm2) was mechanically polished with 2000 grade sandpaper, followed by electropolishing in an 85% phosphoric acid electrolyte and washing with acetone and deionized water. The back of the Cu foil was encapsulated with epoxy resin. The Cu foam was deposited on the pretreated Cu foil via dynamic hydrogen template method [5] using a current density of −3.0 A cm−2 and deposition time of 15 s in the electrolyte consisting of 0.2 M CuSO4 and 1.5 M H2SO4 aqueous solution. The resultant Cu foam electrode was rinsed with DI water and dried at room temperature. For comparison, the as-prepared Cu foam electrode was annealed in a muffle furnace at 200 °C for 6 h. The annealed Cu foam sample is named A-Cu foam.

3.2.2. Fabrication of Cu/SnO2 and A-Cu/SnO2 Electrodes

SnO2 film was electrodeposited on the Cu foam electrodes in a two-electrode cell with Sn foil (2.0 × 2.0 cm2) as the anode. The electrolyte consisted of an aqueous solution of 0.02 M SnCl4, 0.1 M NaNO3 and 0.075 M HNO3. Electrodepositions were performed at −0.3 V while changing deposition time (5, 15, 30, 45 and 60 min). The typical samples were prepared with the deposition time of 30 min. Then the electrochemical pre-reduction was performed in a CO2-saturated 0.1 M KHCO3 solution at −0.5 V vs. RHE for one hour to obtain the Cu/SnO2 electrode.
A−Cu/SnO2 electrodes were obtained through the same procedure but with an additional annealing step between the electrodepositing and pre-reduction. Annealing was conducted in a muffle furnace at 200 °C for 6 h with static air.

3.3. Physical and Chemical Characterization

The microstructure of the electrodes was tested by X-ray diffraction (XRD, Rigaku D/MAX-2500 diffractometer, Tokyo, Japan) with Cu Kα radiation that was collected from 10° to 80° at a scan rate of 6° per min. The morphologies of the electrocatalysts were observed by scanning electron microscopy (SEM, Hitachi S-4800, Tokyo, Japan) in conjunction with energy-dispersive X-ray spectroscopy (EDS). X-ray photoelectron spectroscopy (XPS) was performed using a PHI 1600 (PerkinElmer, Waltham, MA, USA) analyzer with X-ray excitation provided by an Al Kα X-ray source, and all the XPS spectra were calibrated by C1s¼ binding energy, which was 284.5 eV.

3.4. Electrochemical Measurements

All electrochemical measurements were carried out in a gastight glass H-type electrolytic cell, separated by a proton exchange membrane Nafion 115 (Dupont, Midland, MI, USA) between the anode cell and cathode cell. The electrolyte consisted of a 0.1 M KHCO3 solution. The cathode and anode compartments contained 90 mL and 50 mL of electrolyte, respectively. The CO2 electroreduction measurements were carried out with an electrochemical workstation (AutoLab 302N, Herisau, Switzerland). A Pt Foil (1.0 × 2.0 cm2) and a Hg2Cl2/Hg/saturated KCl electrode (SCE) served as counter electrode and reference electrode respectively. The potentials were measured against SCE and converted to the reversible hydrogen electrode (RHE) potentials by the following equation: ERHE (V) = ESCE (V) + 0.240 V + 0.0591 V × pHelectrolyte. Herein, the pH values of N2-saturated and CO2-saturated 0.1 M KHCO3 electrolytes are determined as 7.0 and 6.8, respectively. Therefore, the compensation potential of 0.01 V due to pH bias is taken into account to determine the applied potentials in LSV tests and CO2 reduction electrolysis experiment. LSV tests were performed at a potential range from 0.0 V to −1.4 V vs. RHE.
During potentiostatic electrolysis CO2 reduction, the cathodic electrolyte was saturated with CO2 at a flow rate of 20 mL min−1 continuously and stirred at the rate of 300 rpm. The obtained gas products were collected by gas bags and detected by gas chromatography (GC, Agilent 7890B). The liquid products were analyzed using a 700 MHz 1H 1D liquid NMR spectrometer (Bruker Avance) at 25 °C. The 1H 1D spectrum was measured with water suppression by a pre-saturation method. The content of formic acid in the liquid product was analyzed using dimethyl sulfoxide as an internal standard.
The FE of the product reflects the selectivity of the product, and is calculated by Equations (1)–(4),
i H 2   or   CO = V H 2   or   CO × q × 2 F p 0 R T
F E H 2   or   CO = i H 2   or   CO i Total × 100 %
Q HCOOH = 2 c HCOOH V F
F E HCOOH = Q HCOOH Q Total
where i H 2   or   CO is partial current density of H2 or CO, V H 2   or   CO is volume concentration of H2 or CO quantified by GC, q is flow rate of CO2, i Total is the measured average current, F is Faradaic constant (96,485.3 C/mol), p 0 is pressure, T is room temperature and R is ideal gas constant (8.314 J mol−1 K−1), c HCOOH is the molar concentration of HCOOH quantified by NMR, V is the total volume of the catholyte and Q Total is the total amount of charge in the electrolysis based on I-t Curves.

4. Conclusions

In conclusion, we successfully fabricated porous Cu/SnO2 and A-Cu/SnO2 electrodes by deposition-electroreduction and deposition-annealing-electroreduction procedures, respectively. The characterizations by SEM, XRD, XPS and EDX demonstrate that they both maintained the porous structure well but possess the significantly different surface compositions. Notably, in comparison with Cu/SnO2, A-Cu/SnO2 exhibits a significant enhancement in terms of CO2 reduction activity and CO selectivity. Besides this, A-Cu/SnO2 electrodes with different deposition time of SnO2 present the characteristic Sn-Cu synergistic catalysis with a feature of dominant CO formation (CO faradaic efficiency, 70~75%), the least HCOOH formation (HCOOH faradaic efficiency, <5%) and the remarkable suppression of hydrogen evolution reaction. In contrast, Cu/SnO2 electrodes with different deposition time from SnO2 exhibit a SnO2 coverage-dependent catalysis—a shift from CO selectivity to HCOOH selectivity with the increasing deposited SnO2 on Cu foam. The different catalytic performance between Cu/SnO2 and A-Cu/SnO2 might be attributed to the different content of Cu atoms in SnO2 layer, which may affect the density of Cu-Sn interface on the surface. Our findings highlight the effects of the relative amount of metals on tuning the product distribution for Cu-based electrocatalysts toward ERC.

Supplementary Materials

The following are available online at https://0-www-mdpi-com.brum.beds.ac.uk/2073-4344/9/5/476/s1. Figure S1: The SEM image of Cu foam. Figure S2: The cross-sectional views of Cu/SnO2. Figure S3: SEM elemental mapping for (a) Cu/SnO2 and (b) A-Cu/SnO2 before pre-reduction. The table is EDX analysis identifying. Figure S4: XRD patterns of Cu Foil and Cu foam. Figure S5: XPS survey spectra of Cu/SnO2, A-Cu/SnO2 before and after pre-reduction. Table S1: The content of Cu and Sn of Cu/SnO2 and A-Cu/SnO2 obtained from ICP-AES. Table S2: Summary of atomic percent of Cu/SnO2 and A-Cu/SnO2 before and after pre-reduction obtained from XPS and SEM-EDX elemental mapping. Table S3: The current density at different potentials obtained from Figure S13 on (a) Cu foam, (b) Cu/SnO2, (c) A-Cu/SnO2 and (d) Sn plate. Table S4: Mass fraction and atomic fraction of Cu, Sn, O on the surface of the electrode with different deposition time of SnO2 detected by SEM-EDS.

Author Contributions

Conceptualization, Q.G.; Data curation, Q.L., M.L., S.Z. and H.W.; Formal analysis, Q.L., M.L. and S.Z.; Funding acquisition, Q.G. and H.W.; Investigation, Q.L.; Methodology, Q.L., M.L. and S.Z.; Project administration, H.W.; Resources, X.L., X.Z., Q.G. and H.W.; Supervision, H.W.; Validation, X.L., X.Z., Q.G. and H.W.; Visualization, Q.L.; Writing—original draft, Q.L.; Writing—review & editing, X.L. and H.W.

Funding

This research was funded by National Natural Science Foundation of China (Grant No.21576204 and 21206117).

Acknowledgments

We are grateful to the analysis and test center of Tianjin University for providing XRD, SEM, XPS characterizations.

Conflicts of Interest

The authors declare no conflict of interest.

References

  1. Dresselhaus, M.S.; Thomas, I.L. Alternative energy technologies. Nature 2001, 414, 332–337. [Google Scholar] [CrossRef]
  2. Pacala, S.; Socolow, R. Stabilization wedges: solving the climate problem for the next 50 years with current technologies. Science 2004, 305, 968–972. [Google Scholar] [CrossRef]
  3. Kuhl, K.P.; Hatsukade, T.; Cave, E.R.; Abram, D.N.; Kibsgaard, J.; Jaramillo, T.F. Electrocatalytic Conversion of Carbon Dioxide to Methane and Methanol on Transition Metal Surfaces. J. Am. Chem. Soc. 2014, 136, 14107–14113. [Google Scholar] [CrossRef]
  4. Zhang, L.; Zhao, Z.; Gong, J. Nanostructured materials for heterogeneous electrocatalytic CO2 reduction and their related reaction mechanisms. Angew. Chem. Int. Ed. 2017, 129, 11482–11511. [Google Scholar] [CrossRef]
  5. Sen, S.; Liu, D.; Palmore, G.T.R. Electrochemical reduction of CO2 at copper nanofoams. ACS Catal. 2014, 4, 3091–3095. [Google Scholar] [CrossRef]
  6. Huang, Y.; Handoko, A.D.; Hirunsit, P.; Yeo, B.S. Electrochemical reduction of CO2 using copper single-crystal surfaces: effects of CO* coverage on the selective formation of ethylene. ACS Catal. 2017, 7, 1749–1756. [Google Scholar] [CrossRef]
  7. Li, Y.; Cui, F.; Ross, M.B.; Kim, D.; Sun, Y.; Yang, P. Structure-sensitive CO2 electroreduction to hydrocarbons on ultrathin 5-fold twinned copper nanowires. Nano Lett. 2017, 17, 1312–1317. [Google Scholar] [CrossRef]
  8. Handoko, A.D.; Ong, C.W.; Huang, Y.; Lee, Z.G.; Lin, L.; Panetti, G.B.; Yeo, B.S. Mechanistic insights into the selective electroreduction of carbon dioxide to ethylene on Cu2O-derived copper catalysts. J. Phys. Chem. C 2016, 120, 20058–20067. [Google Scholar] [CrossRef]
  9. Li, C.W.; Kanan, M.W. CO2 reduction at low overpotential on Cu electrodes resulting from the reduction of thick Cu2O films. J. Am. Chem. Soc. 2012, 134, 7231–7234. [Google Scholar] [CrossRef]
  10. Chen, C.S.; Handoko, A.D.; Wan, J.H.; Ma, L.; Ren, D.; Yeo, B.S. Stable and selective electrochemical reduction of carbon dioxide to ethylene on copper mesocrystals. Catal. Sci. Technol. 2015, 5, 161–168. [Google Scholar] [CrossRef]
  11. Jiao, Y.; Zheng, Y.; Chen, P.; Jaroniec, M.; Qiao, S. Molecular scaffolding strategy with synergistic active centers to facilitate electrocatalytic CO2 reduction to hydrocarbon/alcohol. J. Am. Chem. Soc. 2017, 139, 18093–18100. [Google Scholar] [CrossRef]
  12. He, J.; Johnson, N.J.J.; Huang, A.; Berlinguette, C.P. Electrocatalytic alloys for CO2 reduction. ChemSusChem 2018, 11, 48–57. [Google Scholar] [CrossRef]
  13. Huang, Y.; Deng, Y.; Handoko, A.D.; Goh, G.K.L.; Yeo, B.S. Rational design of sulfur-doped copper catalysts for the selective electroreduction of carbon dioxide to formate. ChemSusChem 2018, 11, 320–326. [Google Scholar] [CrossRef]
  14. Deng, Y.; Huang, Y.; Ren, D.; Handoko, A.D.; Seh, Z.W.; Hirunsit, P.; Yeo, B.S. On the role of sulfur for the selective electrochemical reduction of CO2 to formate on CuSx catalysts. ACS Appl. Mater. Interfaces 2018, 10, 28572–28581. [Google Scholar]
  15. Feaster, J.T.; Shi, C. Understanding selectivity for the electrochemical reduction of carbon dioxide to formic acid and carbon monoxide on metal electrodes. ACS Catal. 2017, 7, 4822–4827. [Google Scholar] [CrossRef]
  16. Sarfraz, S.; Garcia-Esparza, A.T.; Jedidi, A.; Cavallo, L.; Takanabe, K. Cu–Sn bimetallic catalyst for selective aqueous electroreduction of CO2 to CO. ACS Catal. 2016, 6, 2842–2851. [Google Scholar] [CrossRef]
  17. Zhao, Y.; Wang, C.; Wallace, G.G. Tin nanoparticles decorated copper oxide nanowires for selective electrochemical reduction of aqueous CO2 to CO. J. Mater. Chem. A 2016, 4, 10710–10718. [Google Scholar] [CrossRef]
  18. Zeng, J.; Bejtka, K.; Ju, W.; Castellino, M.; Chiodoni, A.; Sacco, A.; Farkhondehfal, M.A.; Hernández, S.; Rentsch, D.; Battaglia, C.; et al. Advanced Cu-Sn foam for selectively converting CO2 to CO in aqueous solution. Appl. Catal. B Environ. 2018, 236, 475–482. [Google Scholar] [CrossRef]
  19. Qin, B.; Wang, H.; Peng, F.; Yu, H.; Cao, Y. Effect of the surface roughness of copper substrate on three-dimensional tin electrode for electrochemical reduction of CO2 into HCOOH. J. CO2 Util. 2017, 21, 219–223. [Google Scholar] [CrossRef]
  20. Wang, Y.; Zhou, J.; Lv, W.; Fang, H.; Wang, W. Electrochemical reduction of CO2 to formate catalyzed by electroplated tin coating on copper foam. Appl. Surf. Sci. 2016, 362, 394–398. [Google Scholar] [CrossRef]
  21. Zhao, C.; Wang, J. Electrochemical reduction of CO2 to formate in aqueous solution using electro-deposited Sn catalysts. Chem. Eng. J. 2016, 293, 161–170. [Google Scholar] [CrossRef]
  22. Chen, C.; Pang, Y.; Zhang, F.; Zhong, J.; Zhang, B.; Cheng, Z. Sharp Cu@Sn nanocones on Cu foam for highly selective and efficient electrochemical reduction of CO2 to formate. J. Mater. Chem. A 2018, 6, 19621–19630. [Google Scholar] [CrossRef]
  23. Lv, W.; Zhou, J.; Kong, F.; Fang, H.; Wang, W. Porous tin-based film deposited on copper foil for electrochemical reduction of carbon dioxide to formate. Int. J. Hydrogen Energy 2016, 41, 1585–1591. [Google Scholar] [CrossRef]
  24. Li, Q.; Fu, J.; Zhu, W.; Chen, Z.; Shen, B.; Wu, L.; Xi, Z.; Wang, T.; Lu, G.; Zhu, J.; et al. Tuning Sn-Catalysis for Electrochemical Reduction of CO2 to CO via the Core/Shell Cu/SnO2 Structure. J. Am. Chem. Soc. 2017, 139, 4290–4293. [Google Scholar] [CrossRef]
  25. Li, Y.; Qiao, J.; Zhang, X.; Lei, T.; Girma, A.; Liu, Y.; Zhang, J. Rational design and synthesis of SnOx electrocatalysts with coralline structure for highly improved aqueous CO2 reduction to formate. ChemElectroChem 2016, 3, 1618–1628. [Google Scholar] [CrossRef]
  26. Chen, Y.; Kanan, M.W. Tin oxide dependence of the CO2 reduction efficiency on tin electrodes and enhanced activity for Tin/Tin oxide thin-film catalysts. J. Am. Chem. Soc. 2012, 134, 1986–1989. [Google Scholar] [CrossRef]
  27. Handoko, A.D.; Wei, F.; Jenndy; Yeo, B.S.; Seh, Z.W. Understanding selectivity for the electrochemical reduction of carbon dioxide to formic acid and carbon monoxide on metal electrodes. Nat. Catal. 2018, 1, 922–934. [Google Scholar] [CrossRef]
  28. Cui, C.; Han, J.; Zhu, X.; Liu, X.; Wang, H.; Mei, D.; Ge, Q. Promotional effect of surface hydroxyls on electrochemical reduction of CO2 over SnOx/Sn electrode. J. Catal. 2016, 343, 257–265. [Google Scholar] [CrossRef]
  29. Cui, C.; Wang, H.; Zhu, X.; Han, J.; Ge, Q. A DFT study of CO2 electrochemical reduction on Pb(211) and Sn(112). Sci. China Chem. 2015, 58, 607–613. [Google Scholar] [CrossRef]
  30. Dutta, A.; Kuzume, A.; Rahaman, M.; Vesztergom, S.; Broekmann, P. Monitoring the chemical state of catalysts for CO2 electroreduction: An in operando study. ACS Catal. 2015, 5, 7498–7502. [Google Scholar] [CrossRef]
  31. Wang, Y.; Hu, H.; Sun, Y.; Tang, Y.; Dai, L.; Hu, Q.; Fisher, A.; Yang, X.J. Facile synthesis of nanostructural high-performance Cu-Pb electrocatalysts for CO2 reduction. Adv. Mater. Interfaces 2019, 6, 1801200. [Google Scholar] [CrossRef]
  32. Wang, H.; Han, Z.; Zhang, L.; Cui, C.; Zhu, X.; Liu, X.; Han, J.; Ge, Q. Enhanced CO selectivity and stability for electrocatalytic reduction of CO2 on electrodeposited nanostructured porous Ag electrode. J. CO2 Util. 2016, 15, 41–49. [Google Scholar] [CrossRef]
Figure 1. Schematic drawing of the fabrication of Cu/SnO2 and A-Cu/SnO2.
Catalysts 09 00476 g001
Figure 2. Typical SEM images of (a) Cu/SnO2 before pre-reduction; (b) Cu/SnO2; (c) A-Cu/SnO2 before pre-reduction; (d) A-Cu/SnO2. SEM elemental mapping of (e) Cu/SnO2 and (f) A-Cu/SnO2. The table is EDX analysis identifying.
Catalysts 09 00476 g002
Figure 3. (a) XRD patterns of Cu/SnO2 and A-Cu/SnO2 before and after pre-reduction; (b) XRD peak position of SnO2 (inset).
Catalysts 09 00476 g003
Figure 4. (a) Cu 2p X-ray photoelectron spectroscopy (XPS) spectra, (b) Sn 3d XPS spectra for Cu/SnO2, A-Cu/SnO2.
Catalysts 09 00476 g004
Figure 5. The linear scan voltammetry (LSV) tests on Cu foam, Cu/SnO2 and A-Cu/SnO2 with a potential range from 0.2 V to −1.4 V (vs. reversible hydrogen electrode—RHE) at a scan rate of 50 mV/s in a N2-saturated and a CO2-saturated 0.1 M KHCO3 electrolyte.
Catalysts 09 00476 g005
Figure 6. The faradaic efficiency of H2, CO and HCOOH on (a) Cu foam, (b) Cu/SnO2, (c) A-Cu/SnO2 and (d) Sn plate at various potentials in 0.1 M KHCO3.
Catalysts 09 00476 g006
Figure 7. Comparison of FEs of H2, CO and HCOOH for (a) Cu/SnO2 and (b) A-Cu/SnO2 electrodes with different SnO2 deposition time at −1.0 V vs. RHE in CO2-saturated 0.1 M KHCO3.
Catalysts 09 00476 g007
Figure 8. Long-term stability test for A-Cu/SnO2 (15 min) electrode at −1.0 V vs. RHE for 10 h in CO2-saturated 0.1 M KHCO3 solution.
Catalysts 09 00476 g008

