Wet Peroxide Oxidation of Chlorobenzenes Catalyzed by Goethite and Promoted by Hydroxylamine


Chemical Engineering and Materials Department, Facultad de Ciencias Químicas, Universidad Complutense de Madrid, Ciudad Universitaria S/N, 28040 Madrid, Spain
*
Author to whom correspondence should be addressed.
Catalysts 2019, 9(6), 553; https://0-doi-org.brum.beds.ac.uk/10.3390/catal9060553
Submission received: 31 May 2019
/
Revised: 18 June 2019
/
Accepted: 18 June 2019
/
Published: 20 June 2019
(This article belongs to the Special Issue Trends in Catalytic Wet Peroxide Oxidation Processes)
Abstract
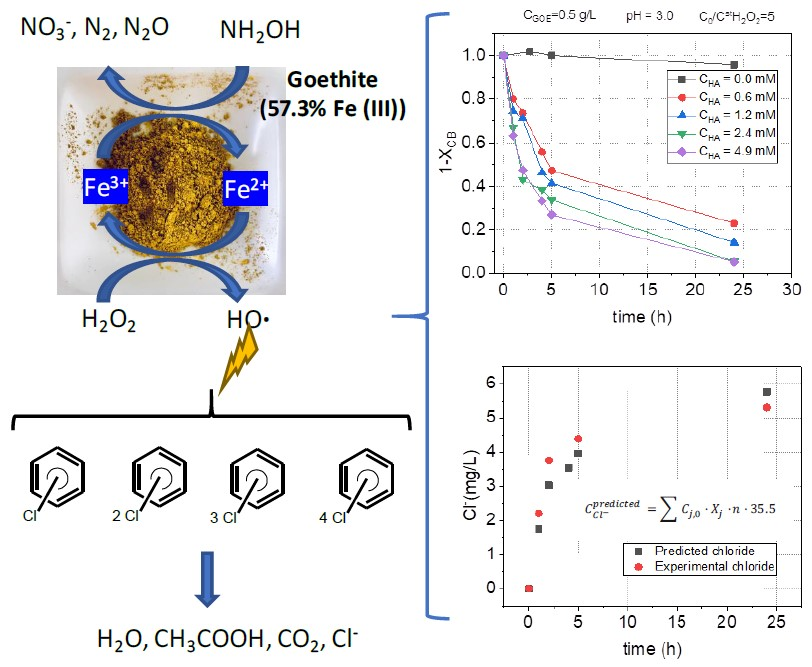
:In this work, the abatement of several chlorobenzenes commonly found as pollutants in the aqueous phase has been carried out by catalytic wet peroxide oxidation using goethite as the catalyst and hydroxylamine as the promotor. Spiked water with monochlorobenzene and different positional isomers of dichlorobenzene, trichlorobenzene, and tetrachlorobenzene, at concentrations ranging from 0.4 to 16.9 mg L−1 was treated. Runs were carried out batch-way, at room conditions, without headspace. The heterogeneous catalyst was commercial goethite, with a specific surface area (SBET) of 10.24 m2 g−1 and a total iron content of 57.3 wt%. Iron acts as a catalyst of hydrogen peroxide decomposition to hydroxyl radicals. Hydroxylamine (in a range from 0 to 4.9 mM) was added to enhance the iron redox cycle from Fe (III) to Fe (II), remarkably increasing the radical production rate and therefore, the conversion of chlorobenzenes. Iron was stable (not leached to the aqueous phase) even at the lowest pH tested (pH = 1). The effect of pH (from 2 to 7), hydrogen peroxide (from 1 to 10 times the stoichiometric dosage), hydroxylamine, and catalyst concentration (from 0.25 to 1 g/L) was studied. Pollutant removal increased with hydroxylamine and hydrogen peroxide concentration. An operating conditions study demonstrated that the higher the hydroxylamine and hydrogen peroxide concentrations, the higher the removal of pollutants. The optimal pH value and catalyst concentration was 3 and 0.5 g L−1, respectively. Operating with 2.4 mM of hydroxylamine and 10 times the stoichiometric H2O2 amount, a chlorobenzenes conversion of 90% was achieved in 2.5 h. Additionally, no toxic byproducts were obtained.

1. Introduction
A drawback of industrial activities is the generation of toxic wastes. In the last decades, these wastes were often dumped without environmental concern near the production sites, resulting in an important soil and groundwater contamination in the nearby area [1,2]. Among these toxic wastes, the most concerning are those known as persistent organic pollutants (POPs) since they are poorly biodegradable and frequently pose a notable risk for health and the ecosystems [3,4,5]. Therefore, the development of effective techniques for the removal of these organic compounds is mandatory.
Compounds with chlorine atoms are among the more toxic organic compounds frequently appearing in soil and groundwater [6,7]. Between these chlorinated organic compounds (COCs), chlorobenzenes (nCBs, (n = mono, di, tri, tetra)) are commonly chlorinated pollutants in soil and groundwater [8]. Their occurrence in the environment is because they are often used in the manufacture of pesticides, dyes, and other widely used chemicals [9,10,11,12,13].
Monochlorobenzene (CB) is mainly used as a raw material in the production of nitrochlorobenzenes, diphenyl oxide, and diphenyldichlorosilane, and as a solvent in the production of isocyanates and in the dyes industry [14]. On the other hand, 1,4 dichlorobenzene (DCB), and 1,2,3 and 1,2,4 trichlorobenzene (TCBs) are raw materials in the synthesis of pesticides, resins, and in the production of several fine chemicals, particularly herbicides, pigments, and dyes [9,12,13,15,16,17]. Some pesticides as hexachlorocyclohexanes and heptachlorocyclohexanes are transformed in trichlorobenzenes and tetrachlorobenzenes, respectively, at alkaline pH [18].
The technologies developed for the treatment of chlorobenzenes in aqueous phase include reductive and oxidative treatments. Reductive treatments, mainly using zerovalent iron, are effective but the times required to achieve high pollutant conversion are often too long. The use of iron nanoparticles reduces this time [19,20,21] from iron microparticles [22], although they are more expensive, and their stability needs to be improved. Dominguez et al. found that the dechlorination rate increased with the chlorine content of the organic molecule and that the non-aromatic chlorinated organic compounds, as hexachlorocyclohexanes (HCHs), were more rapidly eliminated in the presence of zero valent iron microparticles via dechloroelimination, than chlorobenzenes, while the last ones were dechlorinated via hydrogenolysis [22].
Among the oxidative technologies, advanced oxidation processes (AOPs) stand out [23]. These methods are suitable for the treatment of water-soluble contaminants and their applicability has already been documented for water, groundwater, and wastewater decontamination [24]. Among the AOPs treatments proposed for nCBs abatement are the photo-oxidation process, coupling UV, and H2O2 [23,25]. These treatments have achieved conversions up to 90% in several hours but imply high operation costs [24]. Santos et al. used persulfate activated by alkali for the removal of nCBS in groundwater polluted with lindane wastes [26]. The complete conversion of nCBS was obtained in 15 days. This technology could be adapted for an in situ remediation process due to the high stability of persulfate in the subsurface.
Fenton’s reagent (iron + H2O2) has been also tested in nCBs oxidation in aqueous phase, using several sources of iron. Sedlak and Andren reported the effectivity of adding a Fe (II) salt to hydrogen peroxide in the removal of nCBS from wastewaters [27]. Kuang et al. used iron nanoparticles and Pagano et al. used iron powder as a source of Fe2+ ions [28,29]. In all these works, soluble iron cation catalyzed the decomposition of hydrogen peroxide in homogenous phase.
Despite the classical Fenton process, using iron in solution at low pH, is an efficient process [30], but has a major drawback: the catalyst is lost after each reaction cycle. Additionally, additional treatments are usually required (i.e., neutralization, separation, and management of the iron hydroxide sludge generated) [31,32,33].
To overcome these drawbacks, several heterogeneous catalysts, that can be easily recovered at the end of the process, have been tested [31], giving rise to the process known as Fenton-like or catalytic wet peroxide oxidation (CWPO). Many researchers studied this process using mainly iron minerals [31,34,35,36,37]. Those that attract the most attention, due to their availability and low cost, are the naturally occurring iron materials, such as magnetite, hematite, ilmenite, goethite, etc. [34]. The only catalytic species considered in literature when these minerals are employed is iron [31,32,34,35,36,37], responsible for the production of hydroxyl radicals by reaction with the oxidant (hydrogen peroxide). These kinds of heterogeneous catalysts, specifically hematite, were successfully applied in the oxidation of nCBS (1,3,5 TCB and 1,2,3,4 TetraCB) with hydrogen peroxide [38]. The main drawback of these heterogeneous catalysts is the lower rate of H2O2 decomposition and therefore, hydroxyl radical (·OH) generation vs. the classical Fenton process which leads to longer reaction times and restricts their full-scale applications [32,39]. However, heterogeneous catalysts based on iron oxides prepared in the laboratory often promote the iron leaching at acidic pH and the process turns from heterogeneous to homogeneous (Fenton’s reagent) [34].
The use of reducing agent compounds, such as hydroxylamine, to enhance the redox iron cycle in the Fenton and Fenton-like reactions, and therefore, the pollutant oxidation performance, has been recently explored [40,41,42]. Some authors reported the use of hydroxylamine to accelerate the Fenton reaction applied to the abatement of different organics such as benzyl alcohol [42], methylene blue [43], and carbamazepine [44].
A very recent work reported the combined use of goethite (a naturally occurring iron material) and hydroxylamine to enhance the oxidation of alachlor with hydrogen peroxide, finding very interesting results [32]. However, to the best of our knowledge, neither goethite nor hydroxylamine have been applied for the degradation of pollutants as nCBs, which is the goal of the present work. Moreover, more information is required on the role of hydroxylamine, as well as its oxidation byproducts.
Therefore, in the current work, the use of goethite, as an inexpensive heterogeneous source of supported iron (Fe III), coupled with hydroxylamine, has been explored for the first time to promote the oxidation of nCBS with hydrogen peroxide. Moreover, the effect of the main operating variables influencing the performance of the process was evaluated.
2. Results
2.1. Blank Experiments
Seven experiments, gathered as B1a–g, in Table 1, were carried out. Each one was carried out at a different initial pH value within the range of 1 to 7, using the same goethite concentration (0.5 g L−1). After 48 h at room temperature, the concentration of the iron leached was measured in the filtered aqueous phase. At pH = 1, a concentration of 0.52 mg L−1 of total iron in the aqueous phase was found, whereas concentrations below the detection limit were measured at higher pHs. Therefore, it is assumed that the iron leached from the heterogeneous catalyst is negligible even at the lowest pH used.
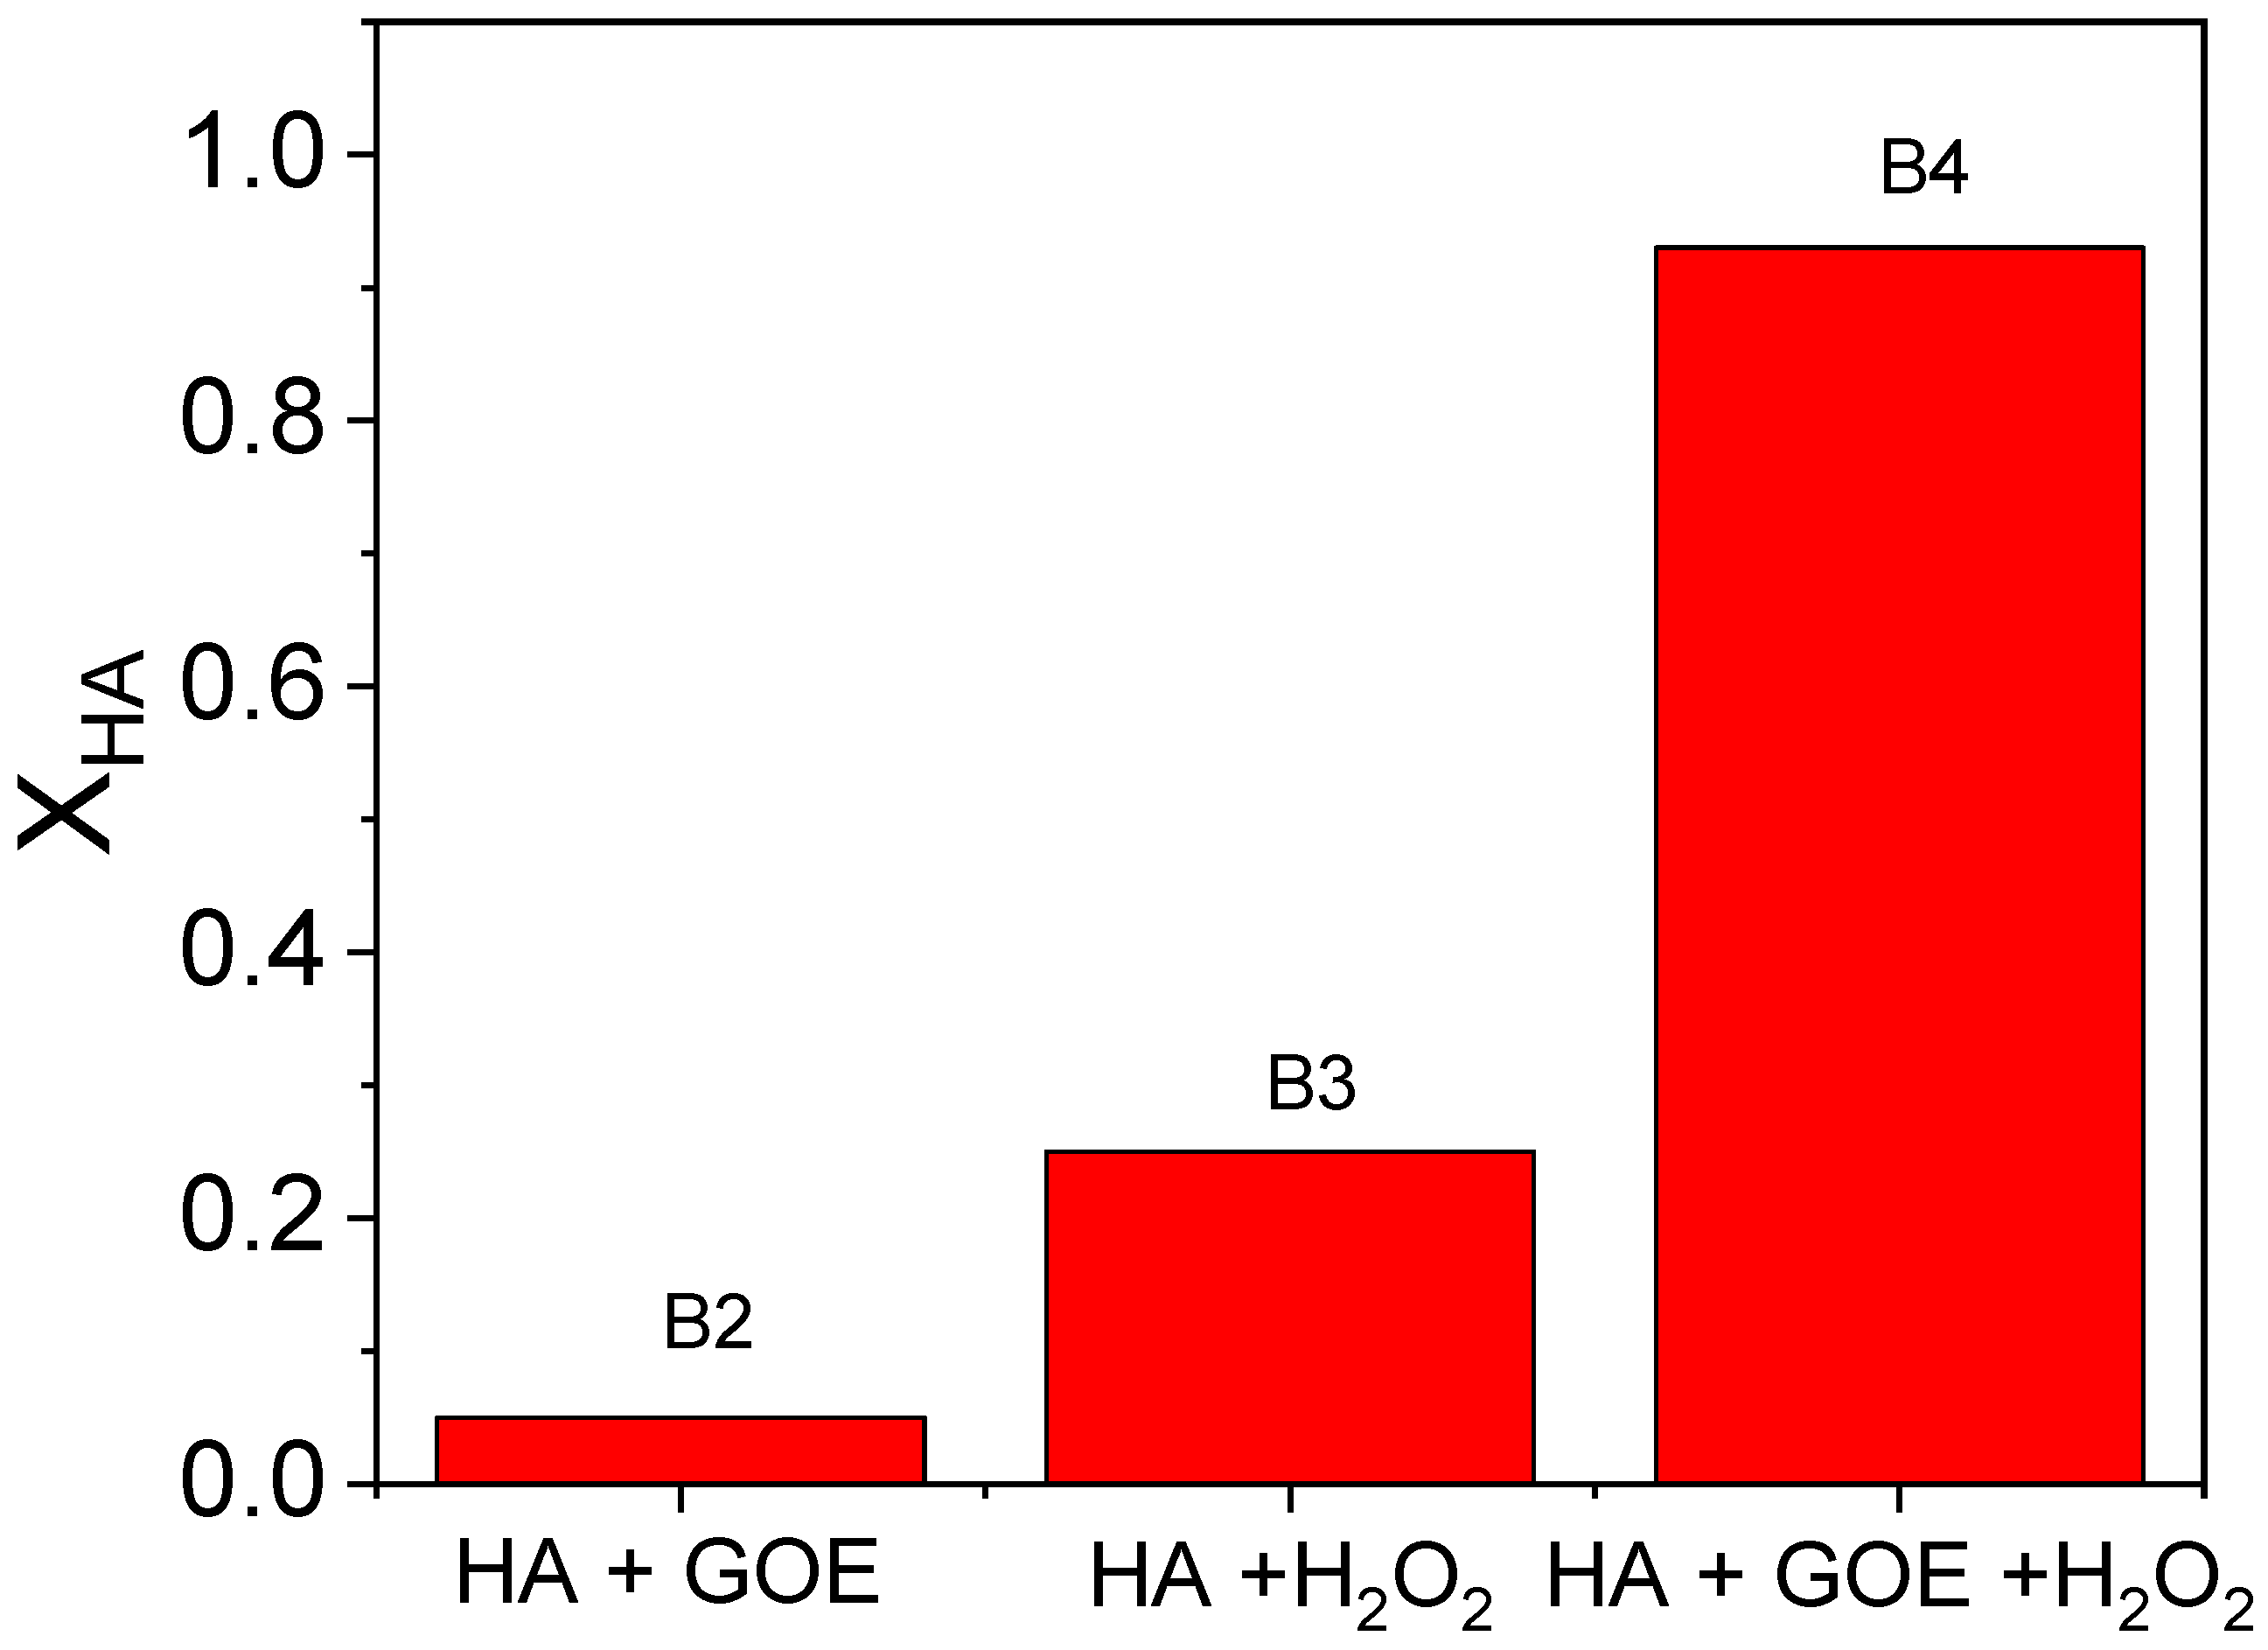
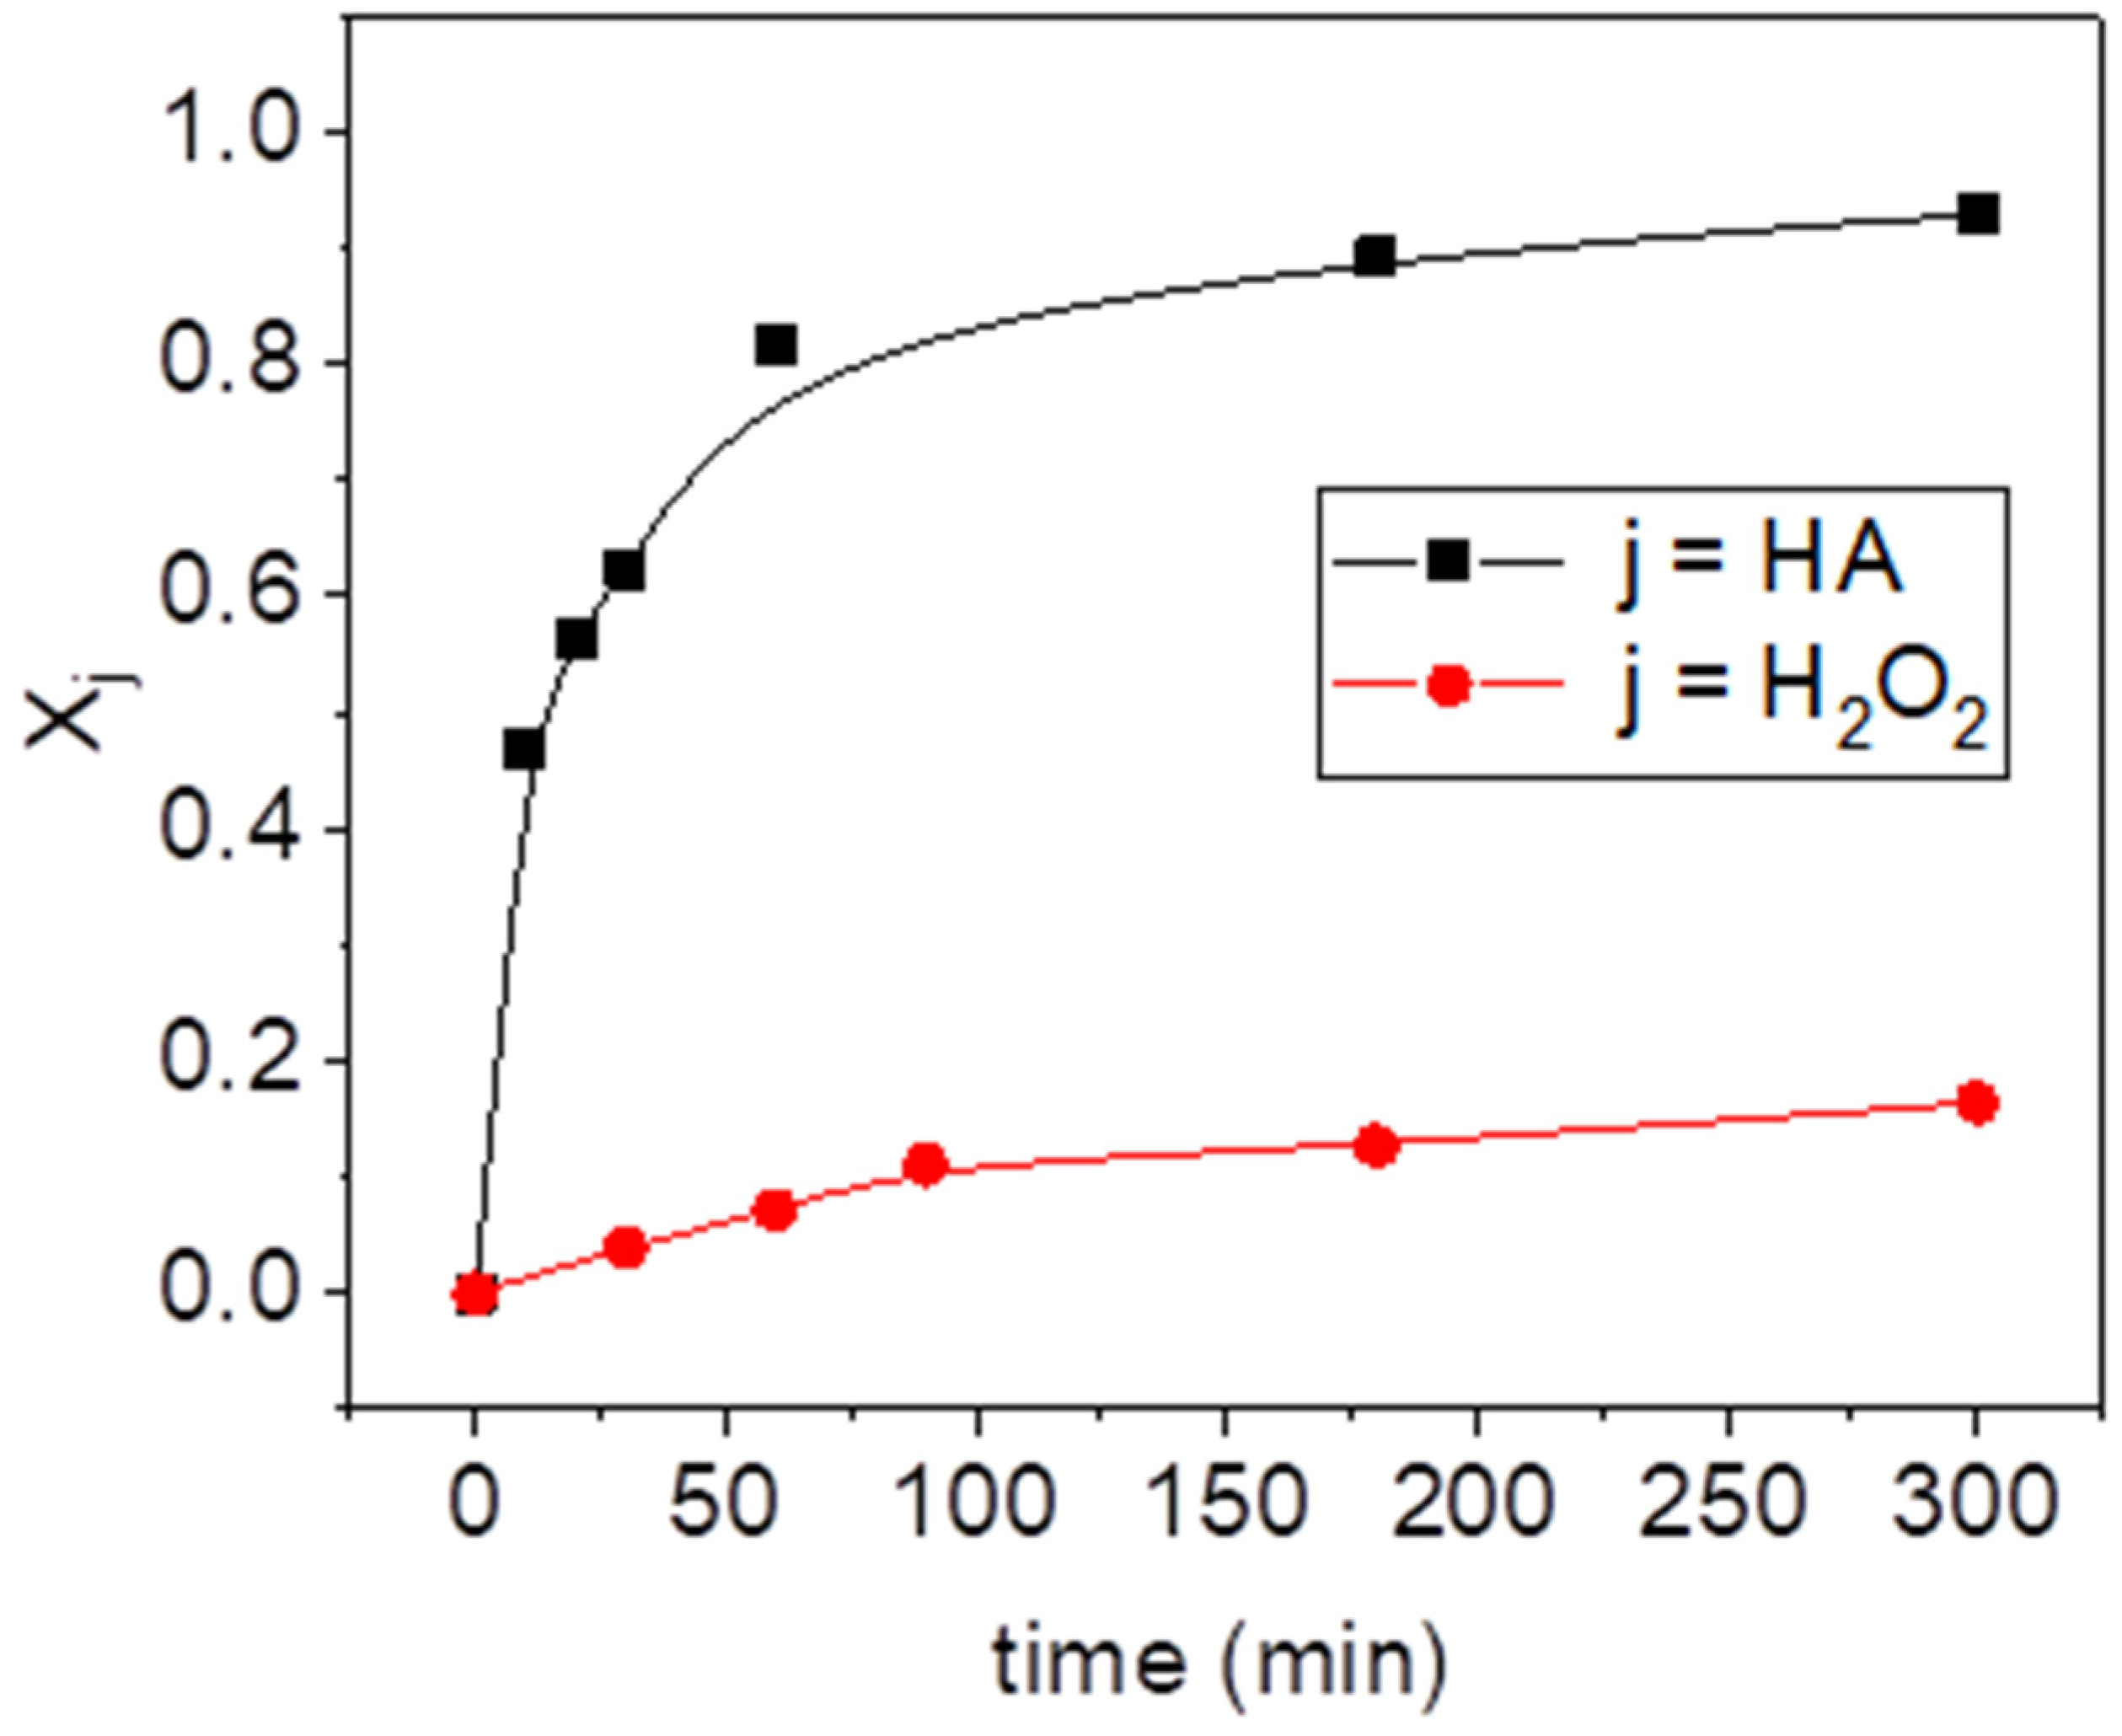
To investigate the reaction between hydroxylamine (HA) and hydrogen peroxide in the presence or absence of goethite, the experiments B2, B3, and B4 were carried out at pH 3. HA conversions at 300 min of reaction time, calculated from Equation (1), are plotted in Figure 1. As can be seen, the conversion of HA was almost negligible in the presence of the catalyst without H2O2 (B2), whereas around 0.25 of HA conversion was obtained when hydrogen peroxide (without catalyst addition) was used (B3). On the contrary, the consumption of HA was almost total when goethite and hydrogen peroxide were added simultaneously (B4). The evolution of HA and hydrogen peroxide with reaction time in this run (B4) is plotted in Figure 2. HA was rapidly consumed in the first stage, achieving more than 90% of the conversion at 300 min. After 24 h of reaction time the amount of HA detected in the media was negligible. Therefore, this compound does not remain in the media for longer times. However, the hydrogen peroxide conversion at the end of the experiment (300 min) was only around 0.2, which suggests that HA is the limiting reagent.
where is the conversion of HA, is the remaining concentration of HA at a given reaction time, and is the initial concentration of HA.
It has been described that the oxidation of HA produced inorganic anions (i.e., nitrates and nitrites) [42,45]. In the present work, only nitrates were identified by ion chromatography, which agrees with the results obtained by Chen et al. [42]. It should be noted that this result was expeceted since hydrogen peroxide was used in high stoichiometric excess.
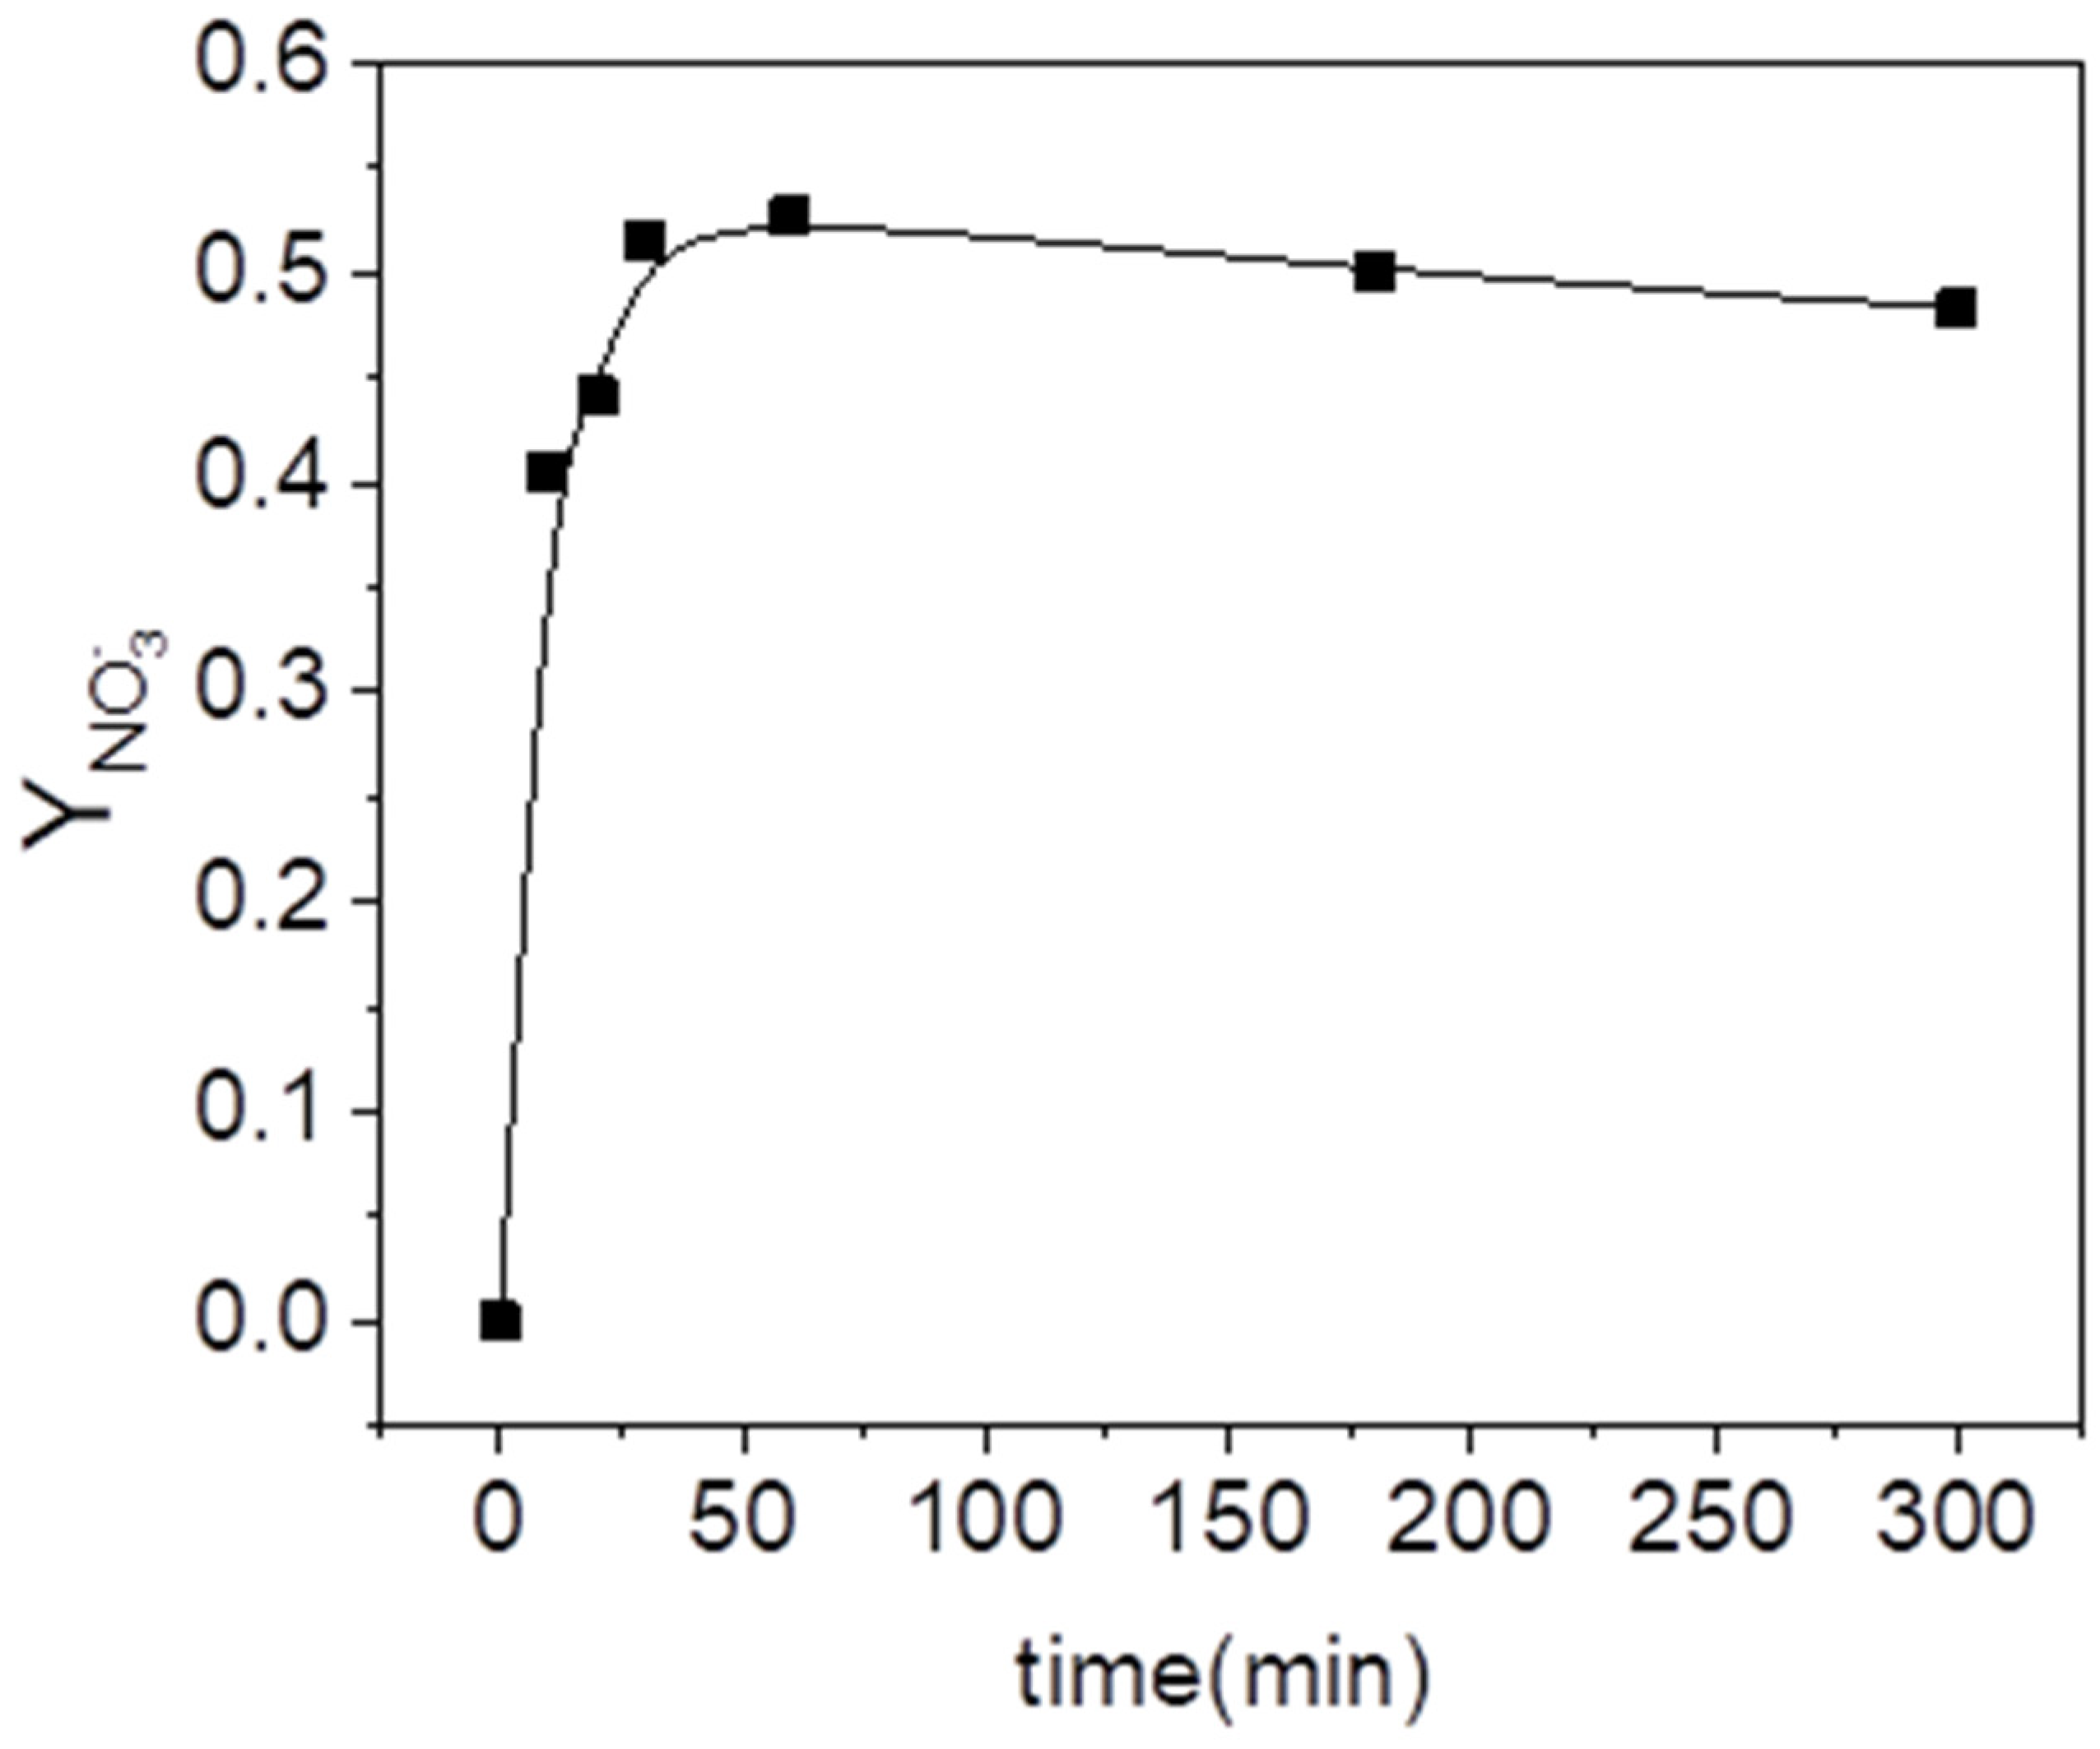
The profile of the molar yield of HA to nitrates with reaction time, plotted in Figure 3, has been calculated using Equation (2). As can be seen, an asymptotic value on nitrate concentration was achieved after 30 min of reaction time. However, the hydroxylamine conversion at that time was only around 0.5. The consumption of this compound continued increasing until it reached almost the complete conversion. This fact could be explained if nitrates are intermediate byproducts of HA oxidation. The products proposed in the literature for the oxidation of hydroxylamine are, besides nitrates, N2 and N2O [42]. Moreover, it was found that the formation of N2O was preferred at pH = 3 (the pH used in run B4), which would explain the nitrogen mismatch.
where is the yield of the oxidation of HA to nitrate. It is calculated as the ratio between the nitrate concentration () measured at a given reaction time (quantified by ion chromatography (IC)), and the concentration of HA reacted.
2.2. CWPO Experiments
A systematic study of the pH, HA, H2O2, and catalyst concentrations on nCBS (n = mono, di, three, and tetra) removal in the aqueous phase has been carried out. It should be pointed out that there was neither evaporation nor reaction of nCBs during the 24 h (control experiments).
2.2.1. Study of pH Effect
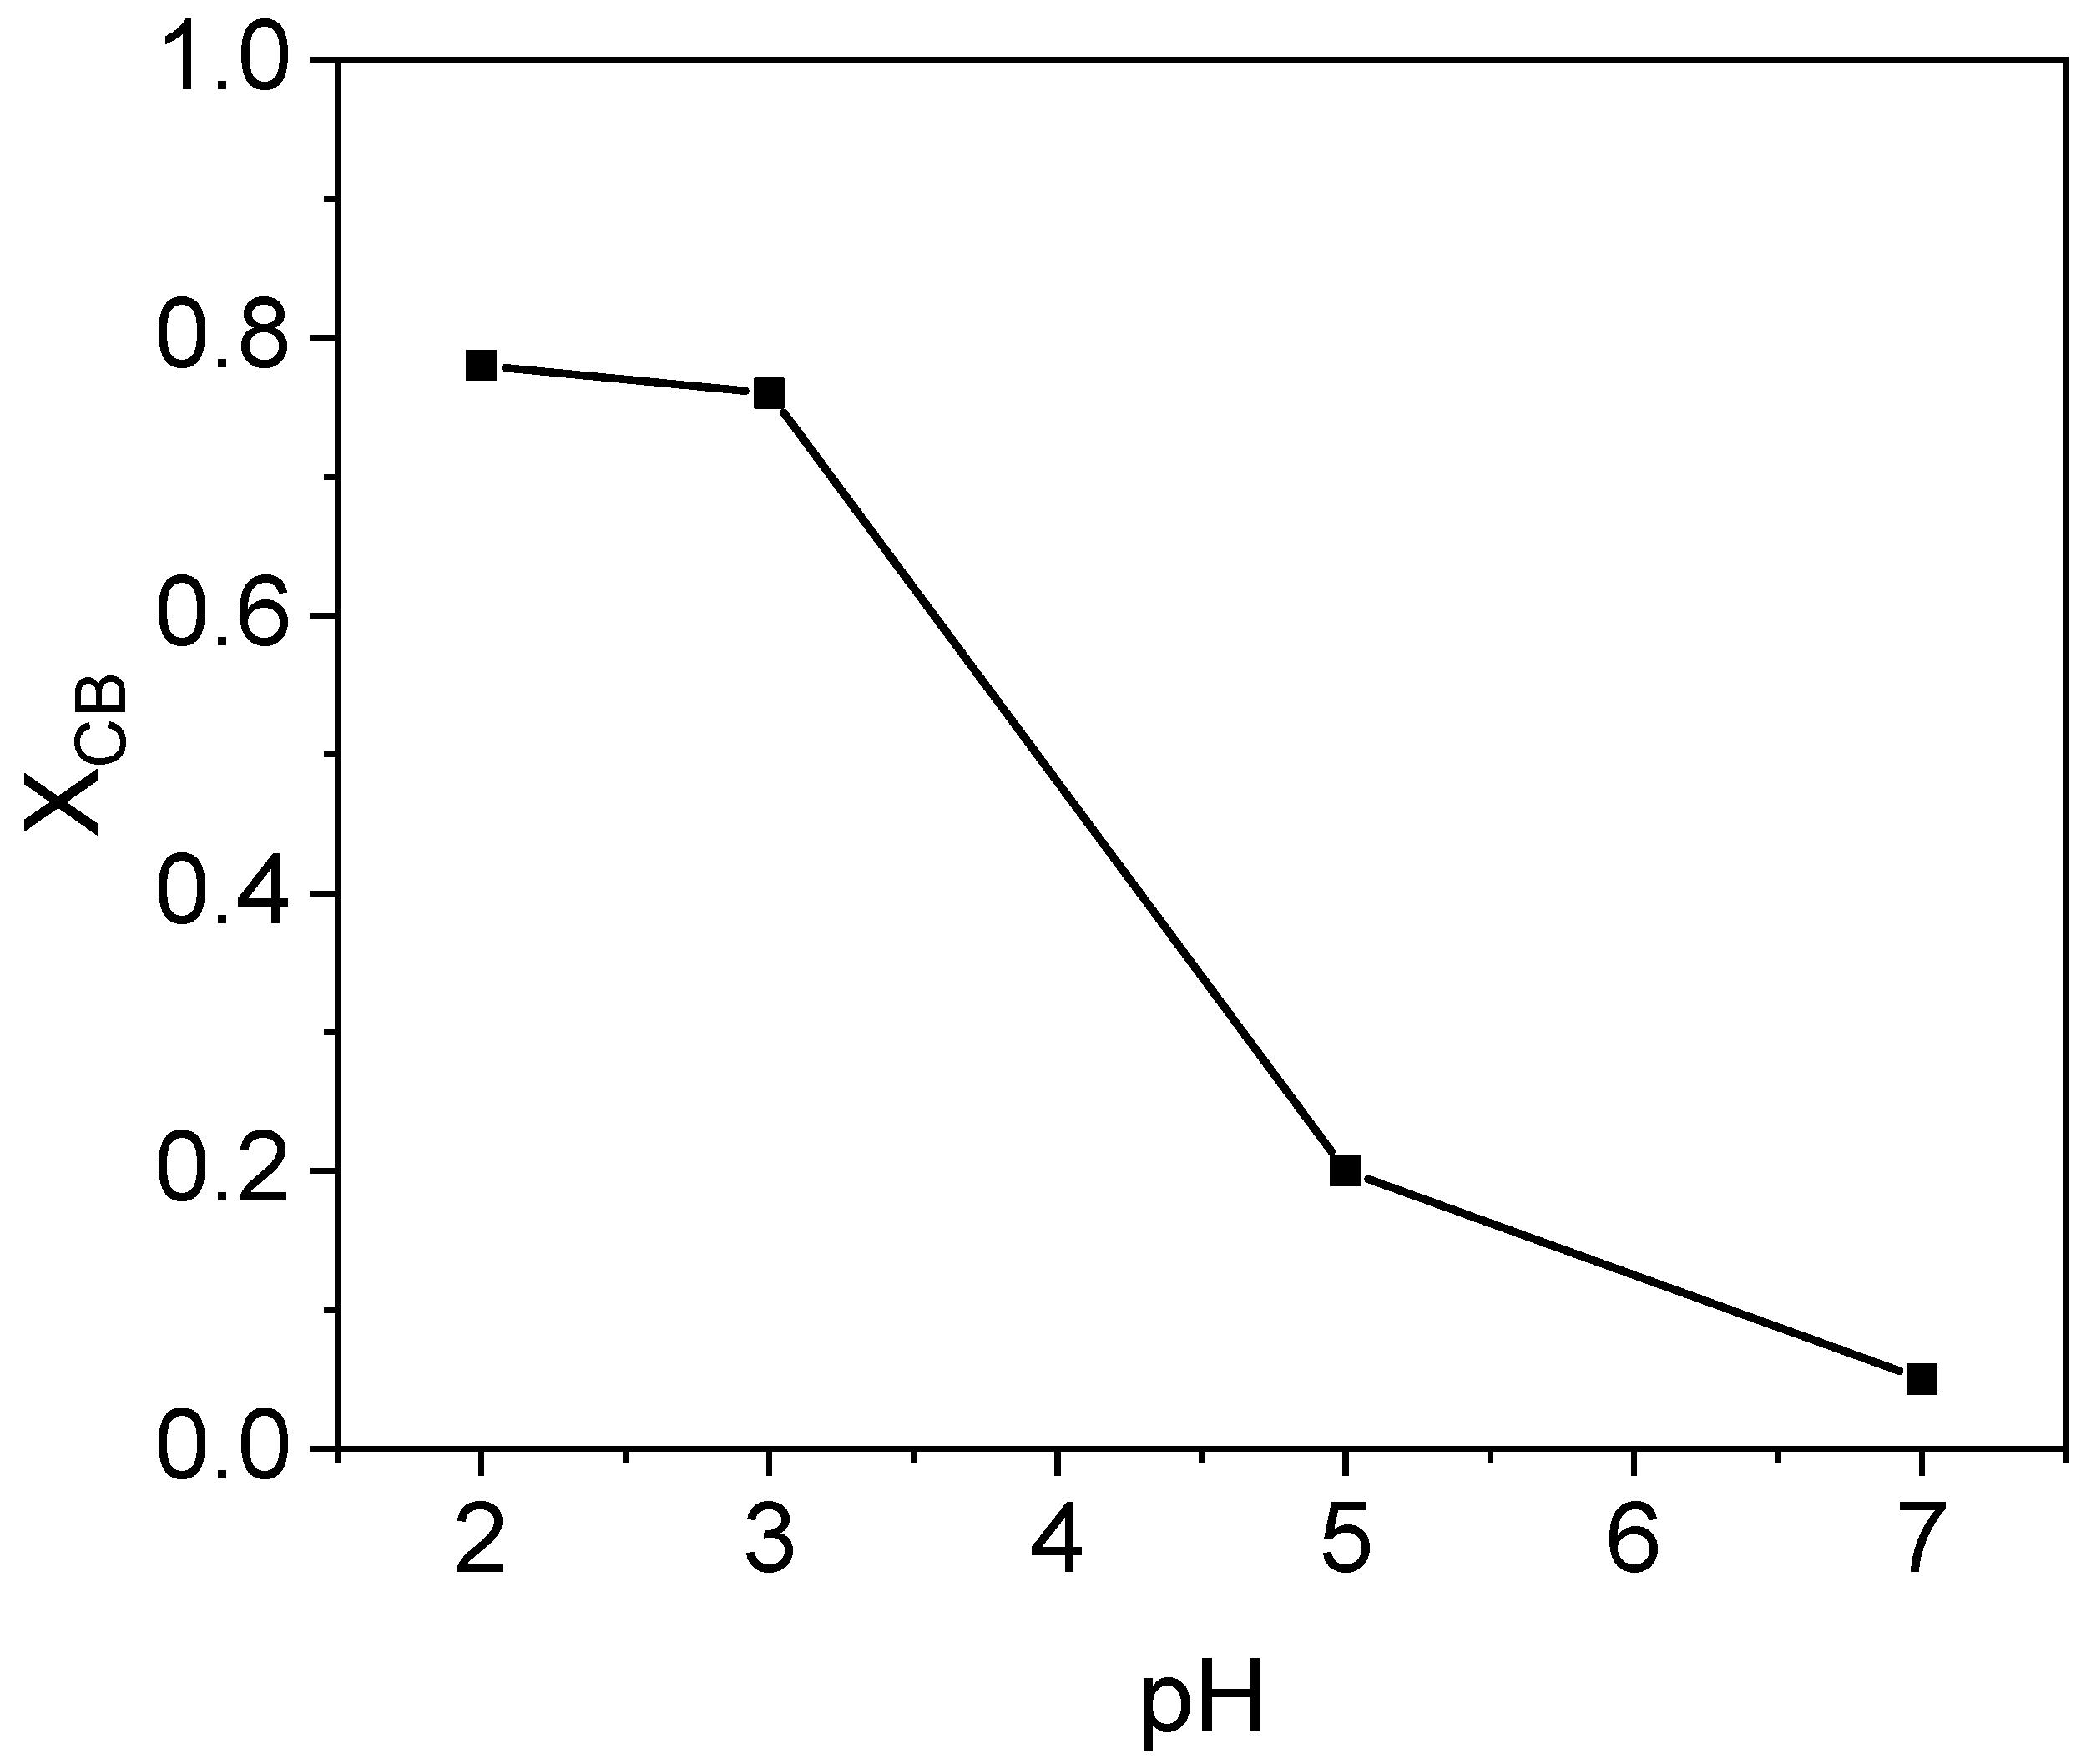
The effect of the initial pH was evaluated within the range 7–2, by comparison of nCBs conversion obtained at 300 min in runs S1 a, b, c, carried out at pH = 7, 5, and 2, respectively, and S5, carried out at pH = 3. The operation conditions for these runs are summarized in Table 1. Taking the CB conversion vs. pH as representative of the profile for the other nCBS, it was noticed that its conversion is greatly increased by acidifying the pH from 7 (XCB = 0.05) to 3 (XCB = 0.76), as can be seen in Figure 4. At pH 5, the conversion of CB obtained at 300 min was about 0.2. The same trend was noticed for the other pollutants studied: the lower the initial pH used, the higher the conversion of chlorobenzenes was found. However, when using lower pHs (pH = 2), only slight differences were found in nCBs conversion over time.
The influence of pH on nCBs abatement found here can be related to the oxidation mechanism of hydroxylamine, which is affected by the pH of the solution [42]. The pH value selected in this work, using the system goethite-H2O2 and hydroxylamine, agrees with the optimal pH value reported in the literature for the homogeneous Fenton reaction [24,30]. In fact, it is widely documented that the highest rate for the hydroxyl radical generation takes place at this pH range using Fenton’s reagent. Chen et al. [42] studied the abatement of benzyl alcohol by homogeneous Fenton reagent (H2O2) enhanced with HA and found that the optimal pH range was also in the acidic range (3–4).
It has been described that at pH values above 6, hydroxylamine can act as a strong termination agent [42]. Consequently, the initial pH selected for further experiments was 3.
The nCBs conversion was checked when 1 mg L−1 of homogeneous iron, Fe (II) (the maximum iron leached value found in blank runs, B1a, pH = 1, t = 48 h was 0.52 mg L−1), was added to the aqueous phase as a catalyst instead of goethite, using the same H2O2 and HA concentrations, as well as the pH used in run S5. At these operating conditions, nCBs conversion (<0.05) at 300 min was found negligible. Therefore, it can be concluded that the Fenton reaction studied here was heterogeneously promoted by the iron in the surface of the solid catalyst, in agreement with that reported in the literature [32].
When using an initial pH of about 3, a decrease in the pH value was noticed during the runs, because of the generation of short chain organic acids [46]. A minimum value pH of about 2.3 was achieved. However, in the pH range 2–3, a significant effect of the pH on the nCBS conversion was not noticed, as was shown in Figure 4.
2.2.2. HA Concentration Effect
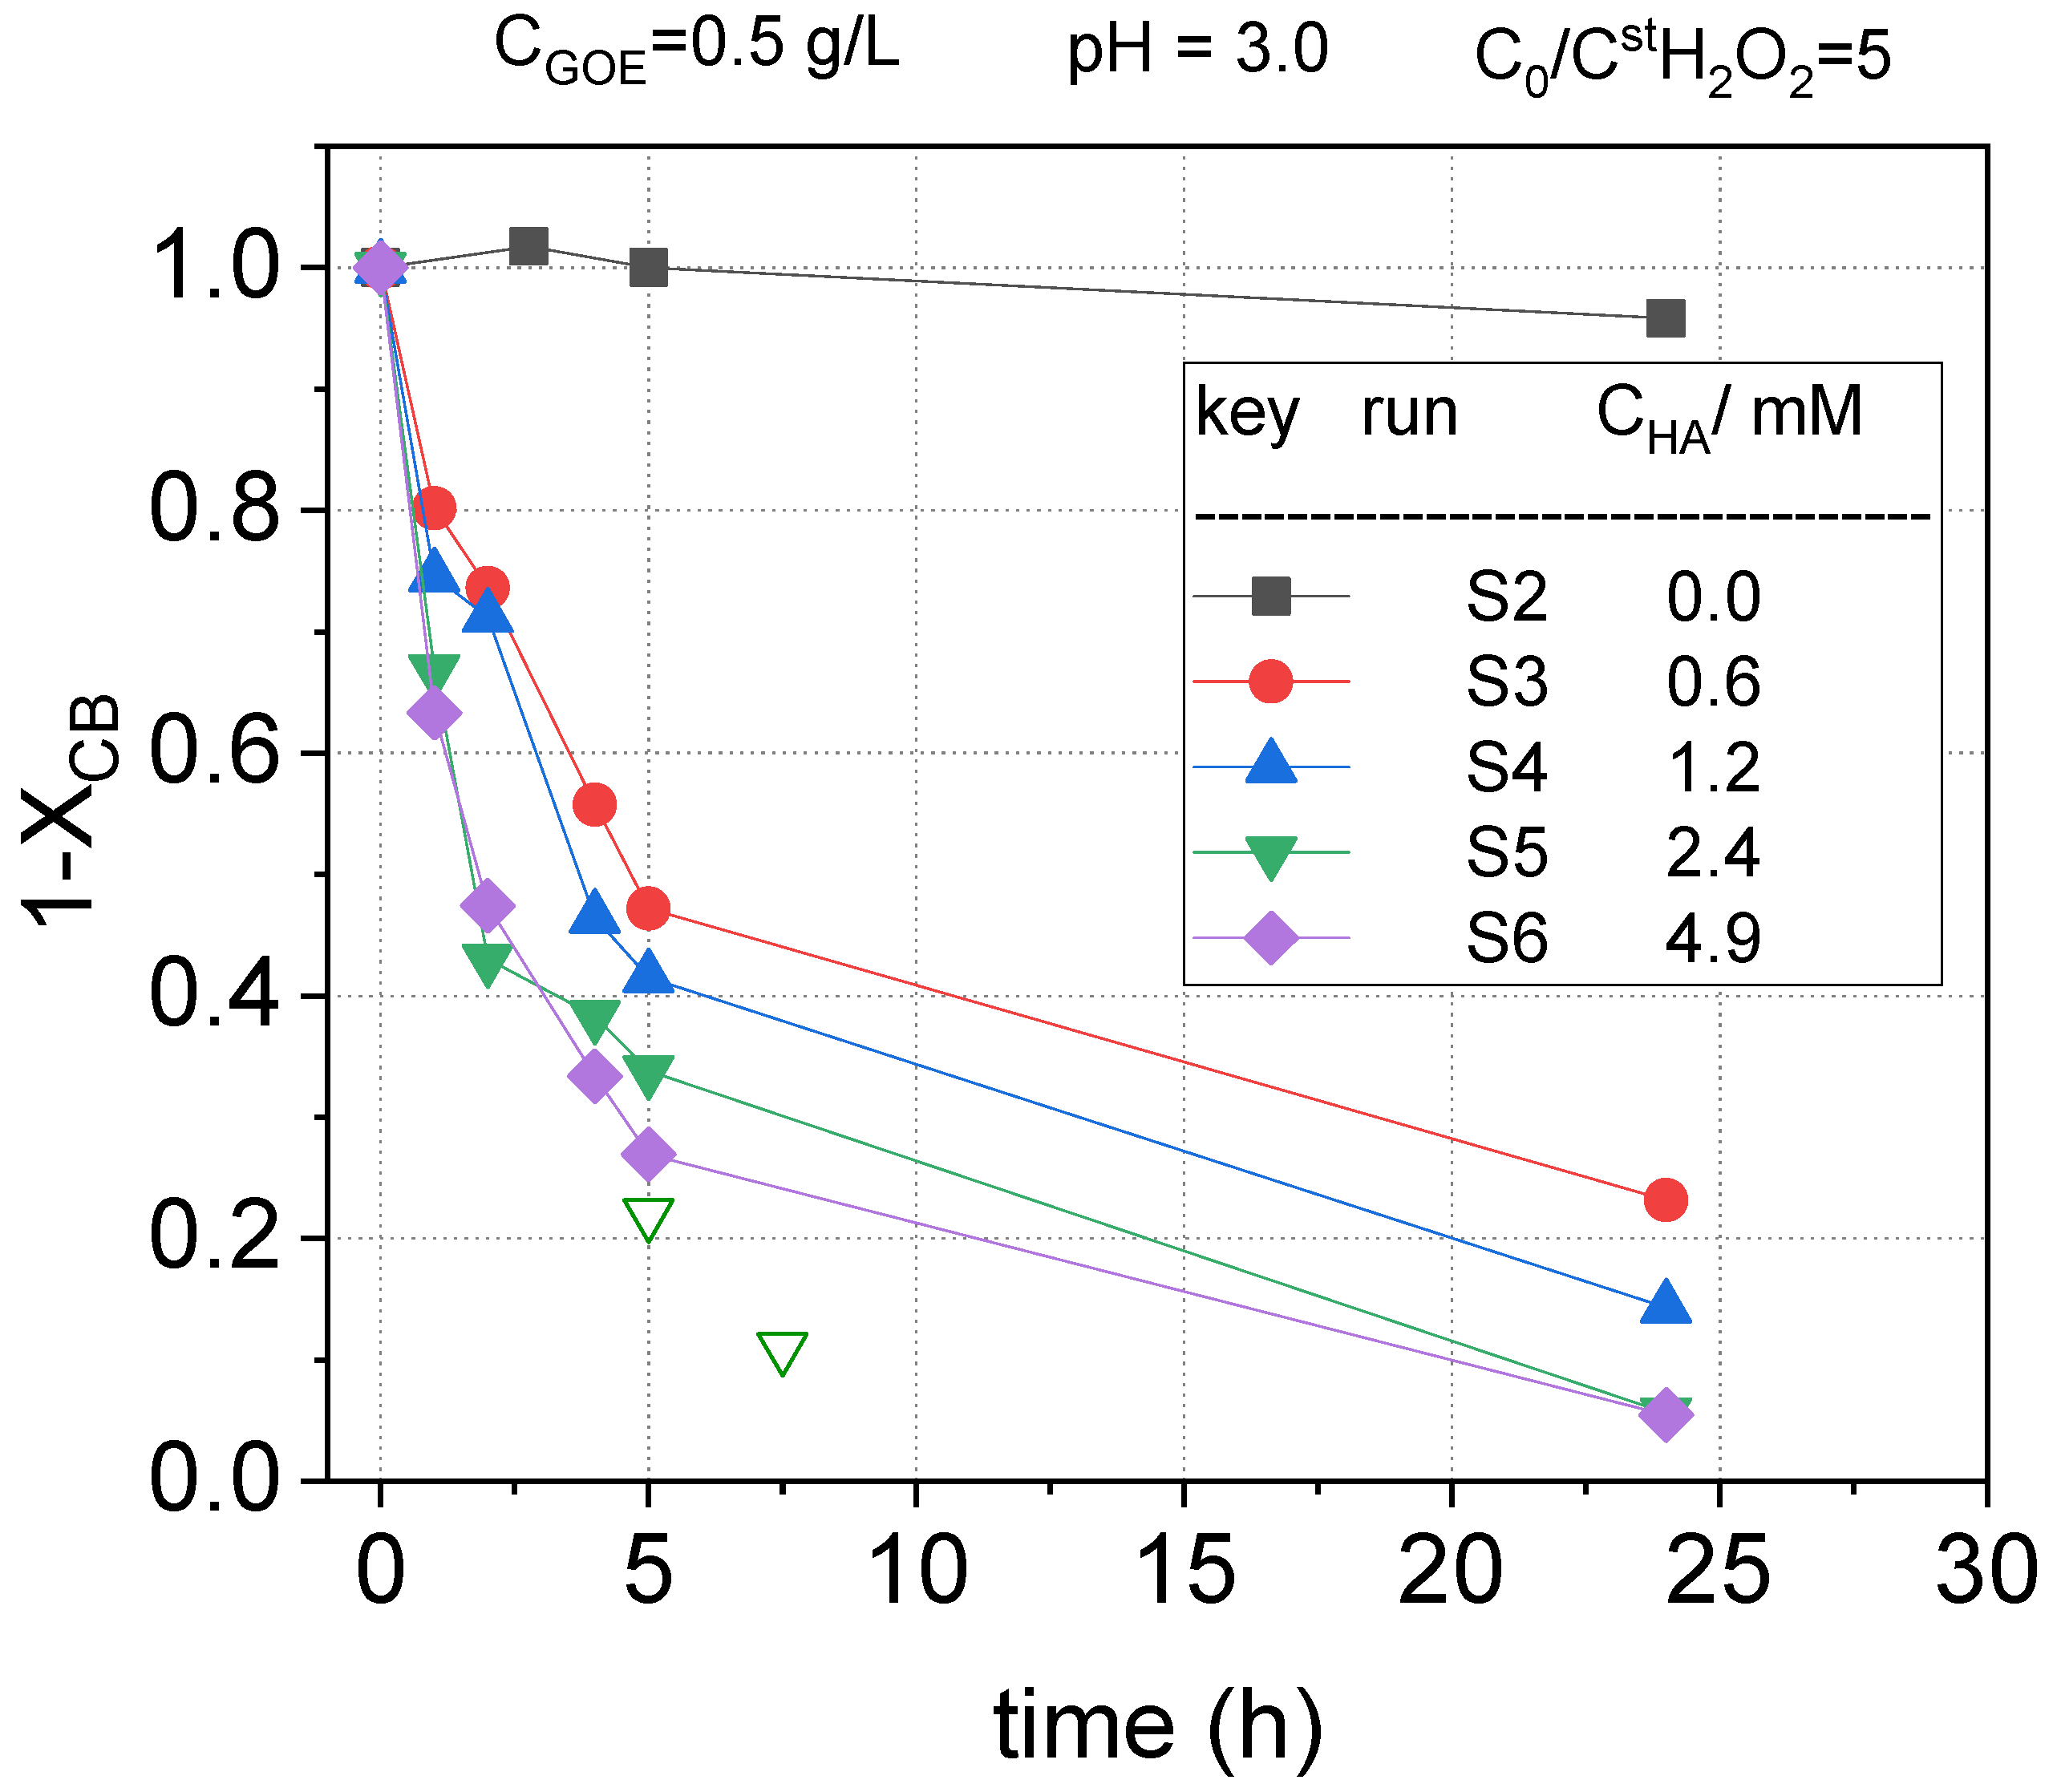
To study the influence of the HA addition on the pollutant’s abatement, several HA concentrations (from 0 to 4.9 mM, runs S2 to S6) have been used to treat the contaminated water, keeping a constant concentration of goethite (0.5 g L−1) and hydrogen peroxide (12.34 mmol L−1). As can be deduced from Table 2, where the initial concentration of each chlorinated compound is included, the selected concentration of the oxidant is 5 times the theoretical stoichiometric amount considering the complete mineralization of the nCBs in the polluted water.
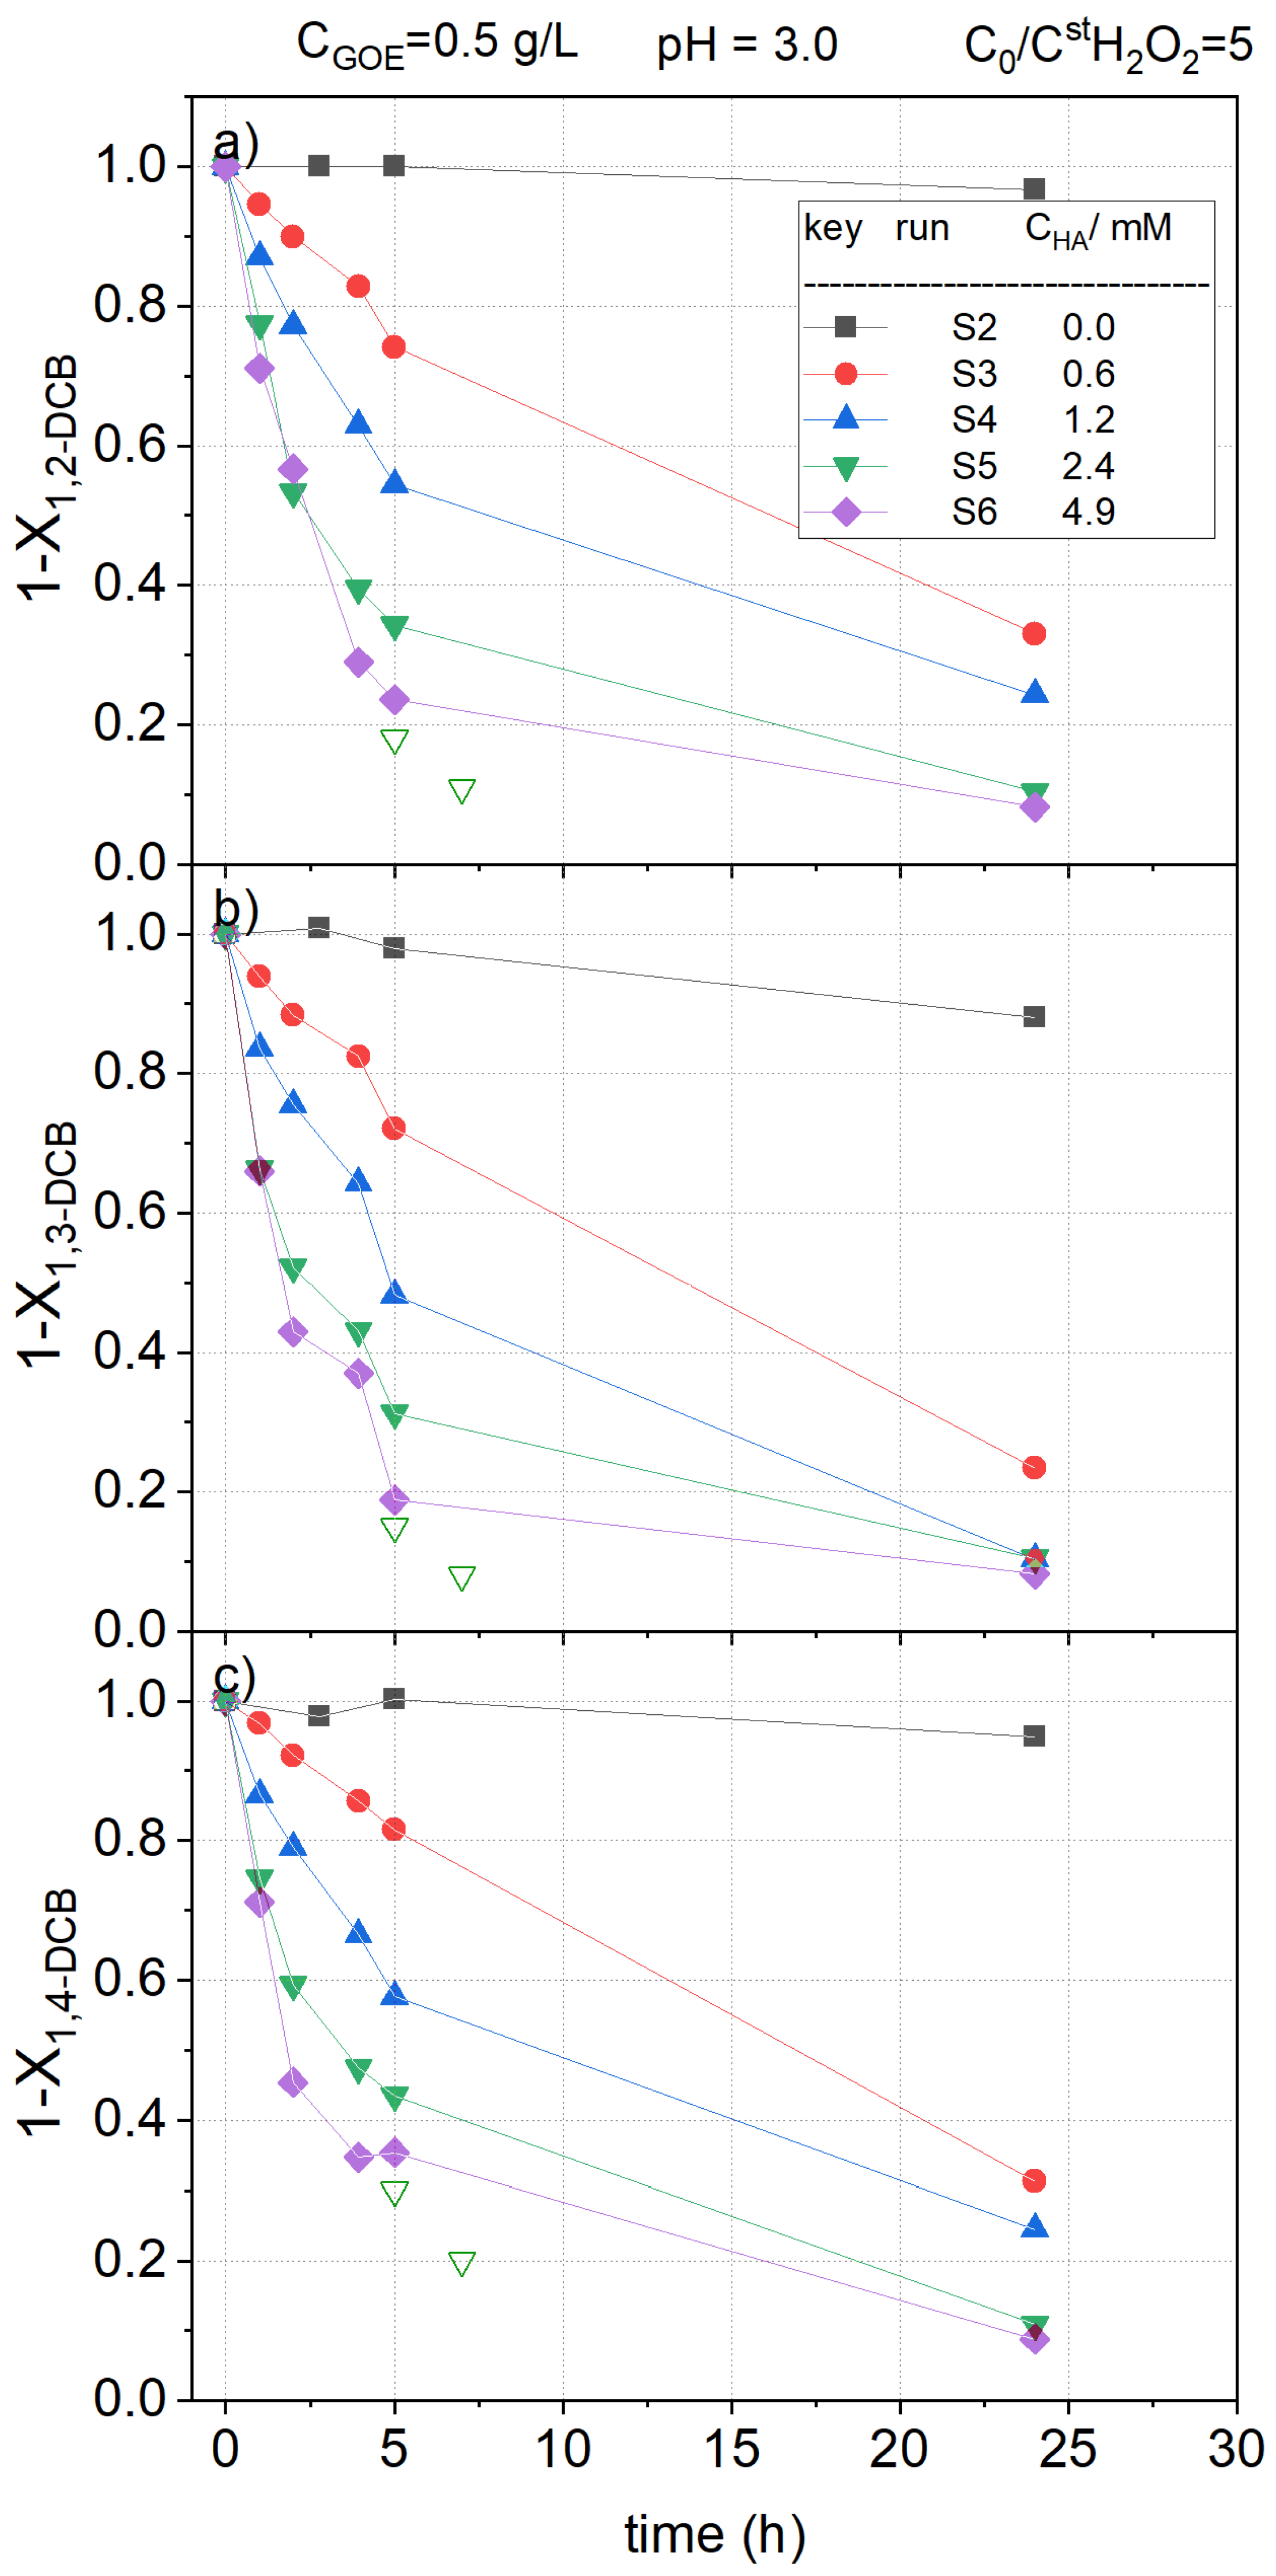
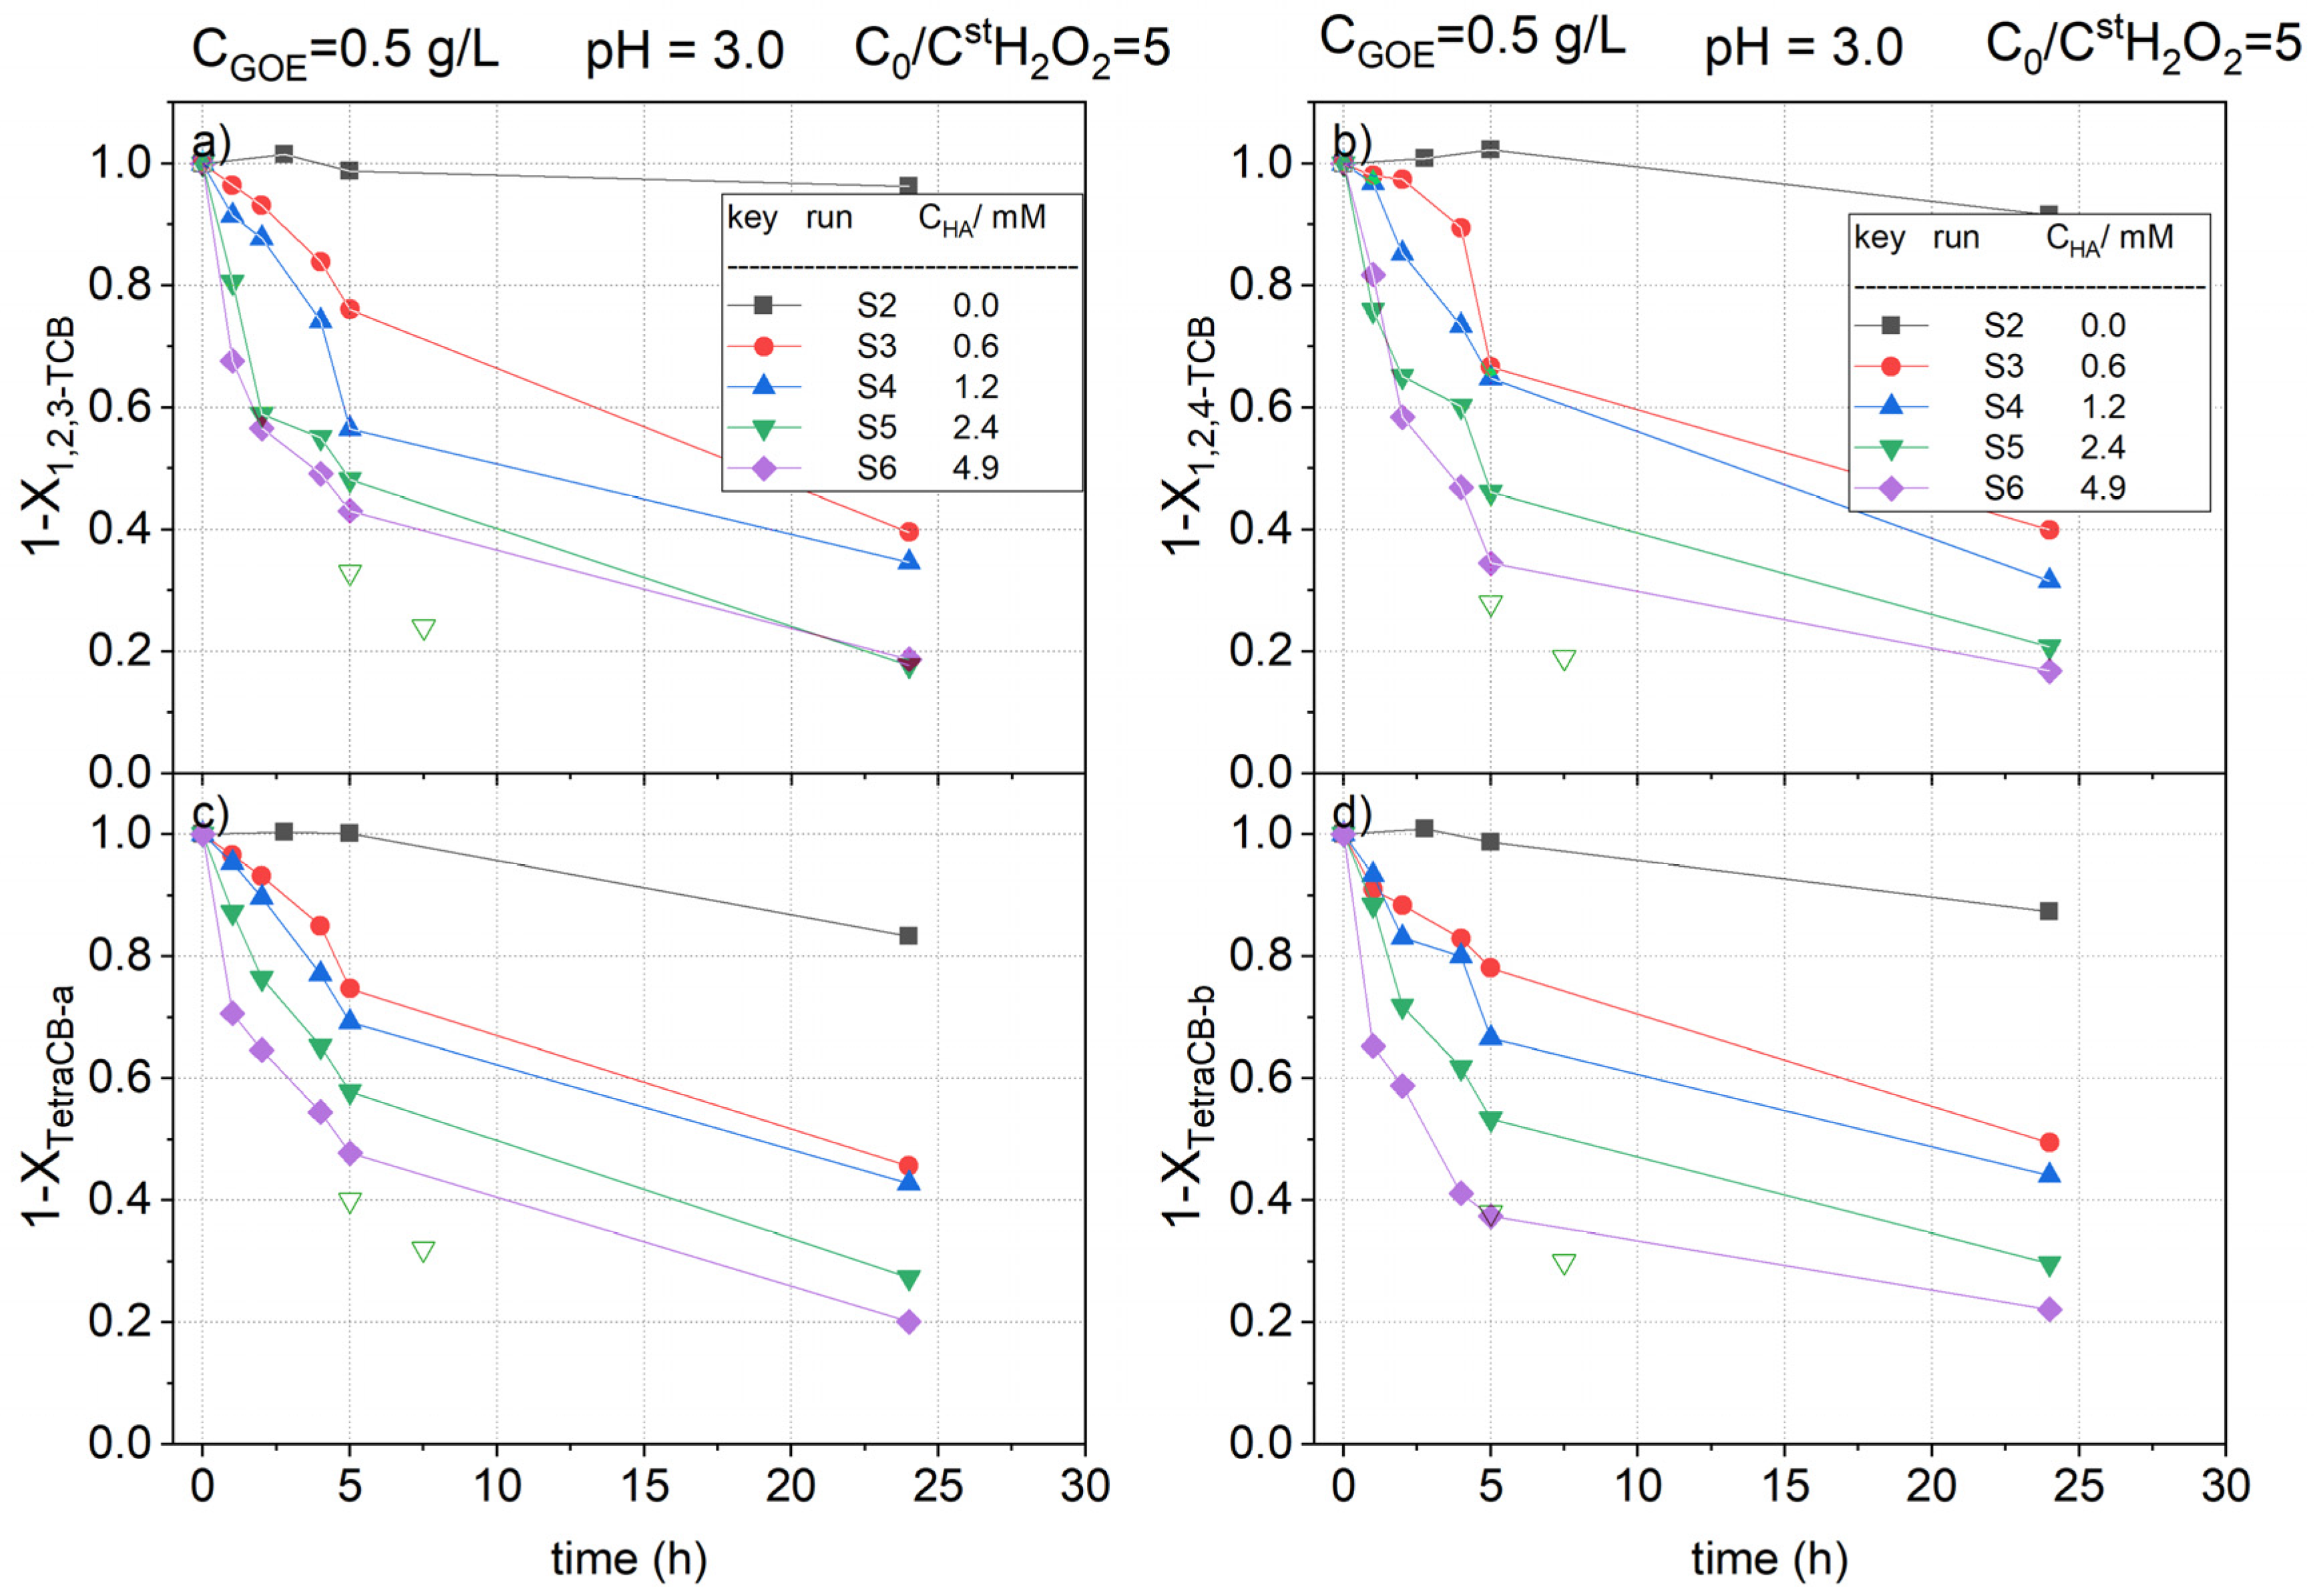
The normalized remaining concentration of mono CB with reaction time in runs S2 to S6 is plotted in Figure 5. The normalized profiles of the positional isomers of DCB (1,2-DCB, 1,3-DCB, and 1,4-DCB), TCBs (1,2,3-TCB and 1,2,4-TCB), and TetraCBs (TetraCB-a and TetraCB-b) concentrations are represented in Figure 6 and Figure 7a–d. The normalized concentration of each chlorinated compound has been calculated using Equation (3):
where is the conversion of the pollutant j, and are the concentration of pollutant j at a given reaction time and at zero time, respectively.
As can be seen in these figures, in the absence of hydroxylamine (run S2), the reaction rate was very slow, and the concentration of the pollutants hardly decreased with reaction time. On the contrary, when hydroxylamine was added to the reaction medium, the abatement of the pollutants was greatly increased. This could be explained considering that the presence of hydroxylamine facilitates the reduction of Fe (III) to Fe (II) in the catalyst surface, accelerating the decomposition of H2O2 to generate hydroxyl radicals, which are responsible for the oxidation of organic matter in the solution, in agreement with that previously reported in the literature [32]. As the iron redox cycle is enhanced by the presence of hydroxylamine and nitrate being the only inorganic product detected in the reaction media, the mechanism in Equations (4–6) can be proposed to explain the iron redox cycle in the presence of hydroxylamine, in accordance with the mechanism reported in literature [47].
In Figure 4, Figure 5, and Figure 6 it can be noted that a fast depletion of the contaminants took place during the first 5 h of the reaction. Following, the pollutant oxidation rate decreased, which can be related to the consumption of HA in the fast stage. In fact, as noted in Figure 2, the almost complete conversion of HA was obtained at 5 h when using the same oxidant and catalyst concentration employed in run S5 (run B4). Therefore, the slow stage in the depletion of COCs observed in Figure 5, Figure 6, and Figure 7 is a consequence of the absence of HA in this period. Concluding, the presence of HA improves the reduction of Fe (III) to Fe (II) over the goethite surface, enhancing the hydroxyl radical formation and the pollutant abatement.
Attending to the results shown in Figure 5, Figure 6 and Figure 7, it can be noticed that the higher the concentration of hydroxylamine used, the higher the conversions of nCBs. However, the differences seem to be narrower when HA concentration raised from 2.4 to 4.9 mM. This fact can be explained considering that HA snot only participate in the iron redox cycle but also competes with the pollutant for the oxidant.
Comparing the profiles obtained for the different COCs (Figure 5, Figure 6 and Figure 7), it can be concluded that the oxidation rates followed the subsequent order: CBs > DCBs >> TCBS = TetraCBs. As can be seen in Figure 6 and Figure 7, the positional stereoisomers of DCBs, TCBs, and TetraCBs showed similar normalized concentration profiles with reaction time, indicating that the catalyst is not regioselective.
On the other hand, the maximum conversion achieved of H2O2 was about 10%, obtained in S6, when a concentration of 4.9 mM of HA was used (data not shown). Therefore, it can be assumed that, at the operating conditions, the limiting reagent was HA, as previously proposed, and in this case, the concentration of hydrogen peroxide can be considered almost constant with reaction time. To confirm that at the operating conditions HA was the limiting reagent, two new reaction vials were prepared at the conditions of run S5 in Table 1. At a reaction time of 2.5 h, a volume of 0.2 mL of the aqueous reaction media was replaced by an aliquot of 0.2 mL of a concentrated HA solution. The amount of HA added in the aliquot corresponds to an amount of 2.4 mM in the final aqueous volume in the vial. At 2.5 and 5 h after the HA aliquots were added, the vials were sacrificed and the pollutants in the aqueous phase were analyzed. Results obtained are shown as open symbols in Figure 5, Figure 6 and Figure 7. As can be seen, the further addition of HA after 2.5 h produced a significant rise in the pollutant conversions, confirming that HA is the limiting reagent. Further, the concentration of hydrogen peroxide was found to be almost constant with the reaction time.
To evaluate if the removal of nCBs was linked to the loss of the chlorine atoms from the pollutant molecule, the release of chloride to the reaction media was analyzed. The profile of chloride concentration in the aqueous phase in run S5 was measured and the results are shown in Figure 8. The predicted chloride concentration was calculated assuming that the conversion of the chlorinated pollutant corresponds to the loss of all the chlorine atoms of the molecule, as indicated in Equation (7).
where is the stoichiometric amount of chloride released assuming the complete dechlorination of each nCBs (n = 1, 2, 3, 4) in mg L−1; is the initial concentration of the pollutant j (in mM, summarized in Table 2); is the experimental conversion of each nCBs; and is the number of chlorine atoms in the starting pollutant (1 for CB, 2 for DCBs, 3 for TCBs and 4 for TetraCB).
The profile of the chloride concentration predicted by Equation (7) with the data obtained is compared with that experimentally measured (Figure 8). As can be seen, both experimental and predicted values are similar, confirming that the dehalogenation of the organic molecules was achieved. As the toxicity of the organic molecules is related to its chlorine content, this a desirable result if the detoxification of the contaminated water is required. No aromatic compounds different than those present in the initial polluted water were detected by gas chromatography/mass spectrometry (GC/MS) analysis of the reaction samples. The only byproduct detected in the oxidation of nCBs with goethite was acetic acid, identified by ion chromatography.
Moreover, the iron leached was measured with the reaction time in all the runs in Table 1. In all the runs the maximum iron concentration in the aqueous phase was less than 0.6 mg/L. The presence of chlorides at the end of the reaction did not increase the amount of iron leached. To check for further reaction in the absence of the solid, a hot filtration test was carried out at the conditions of run S5 in Table 1. To do this, two GC vials of 20 mL were prepared with the corresponding goethite, oxidant and HA concentration employed in run S5. After 2.5 h of reaction time, the stirring was stopped, the liquid of each vial was filtered, an aliquot of the liquid was analyzed by GC/MS and two aliquots of 10 mL of the remaining aqueous phase were placed in two 10 mL GC vials to check the reaction progress in absence of the solid. Vials containing the filtered aqueous phase were sacrificed at 2.5 and 5 h and the pollutant concentration in the aqueous phase was measured. A negligible increase in pollutant conversion in the filtered media was noticed, confirming that the reaction took place in a heterogeneous way.
2.2.3. Hydrogen Peroxide Concentration Effect
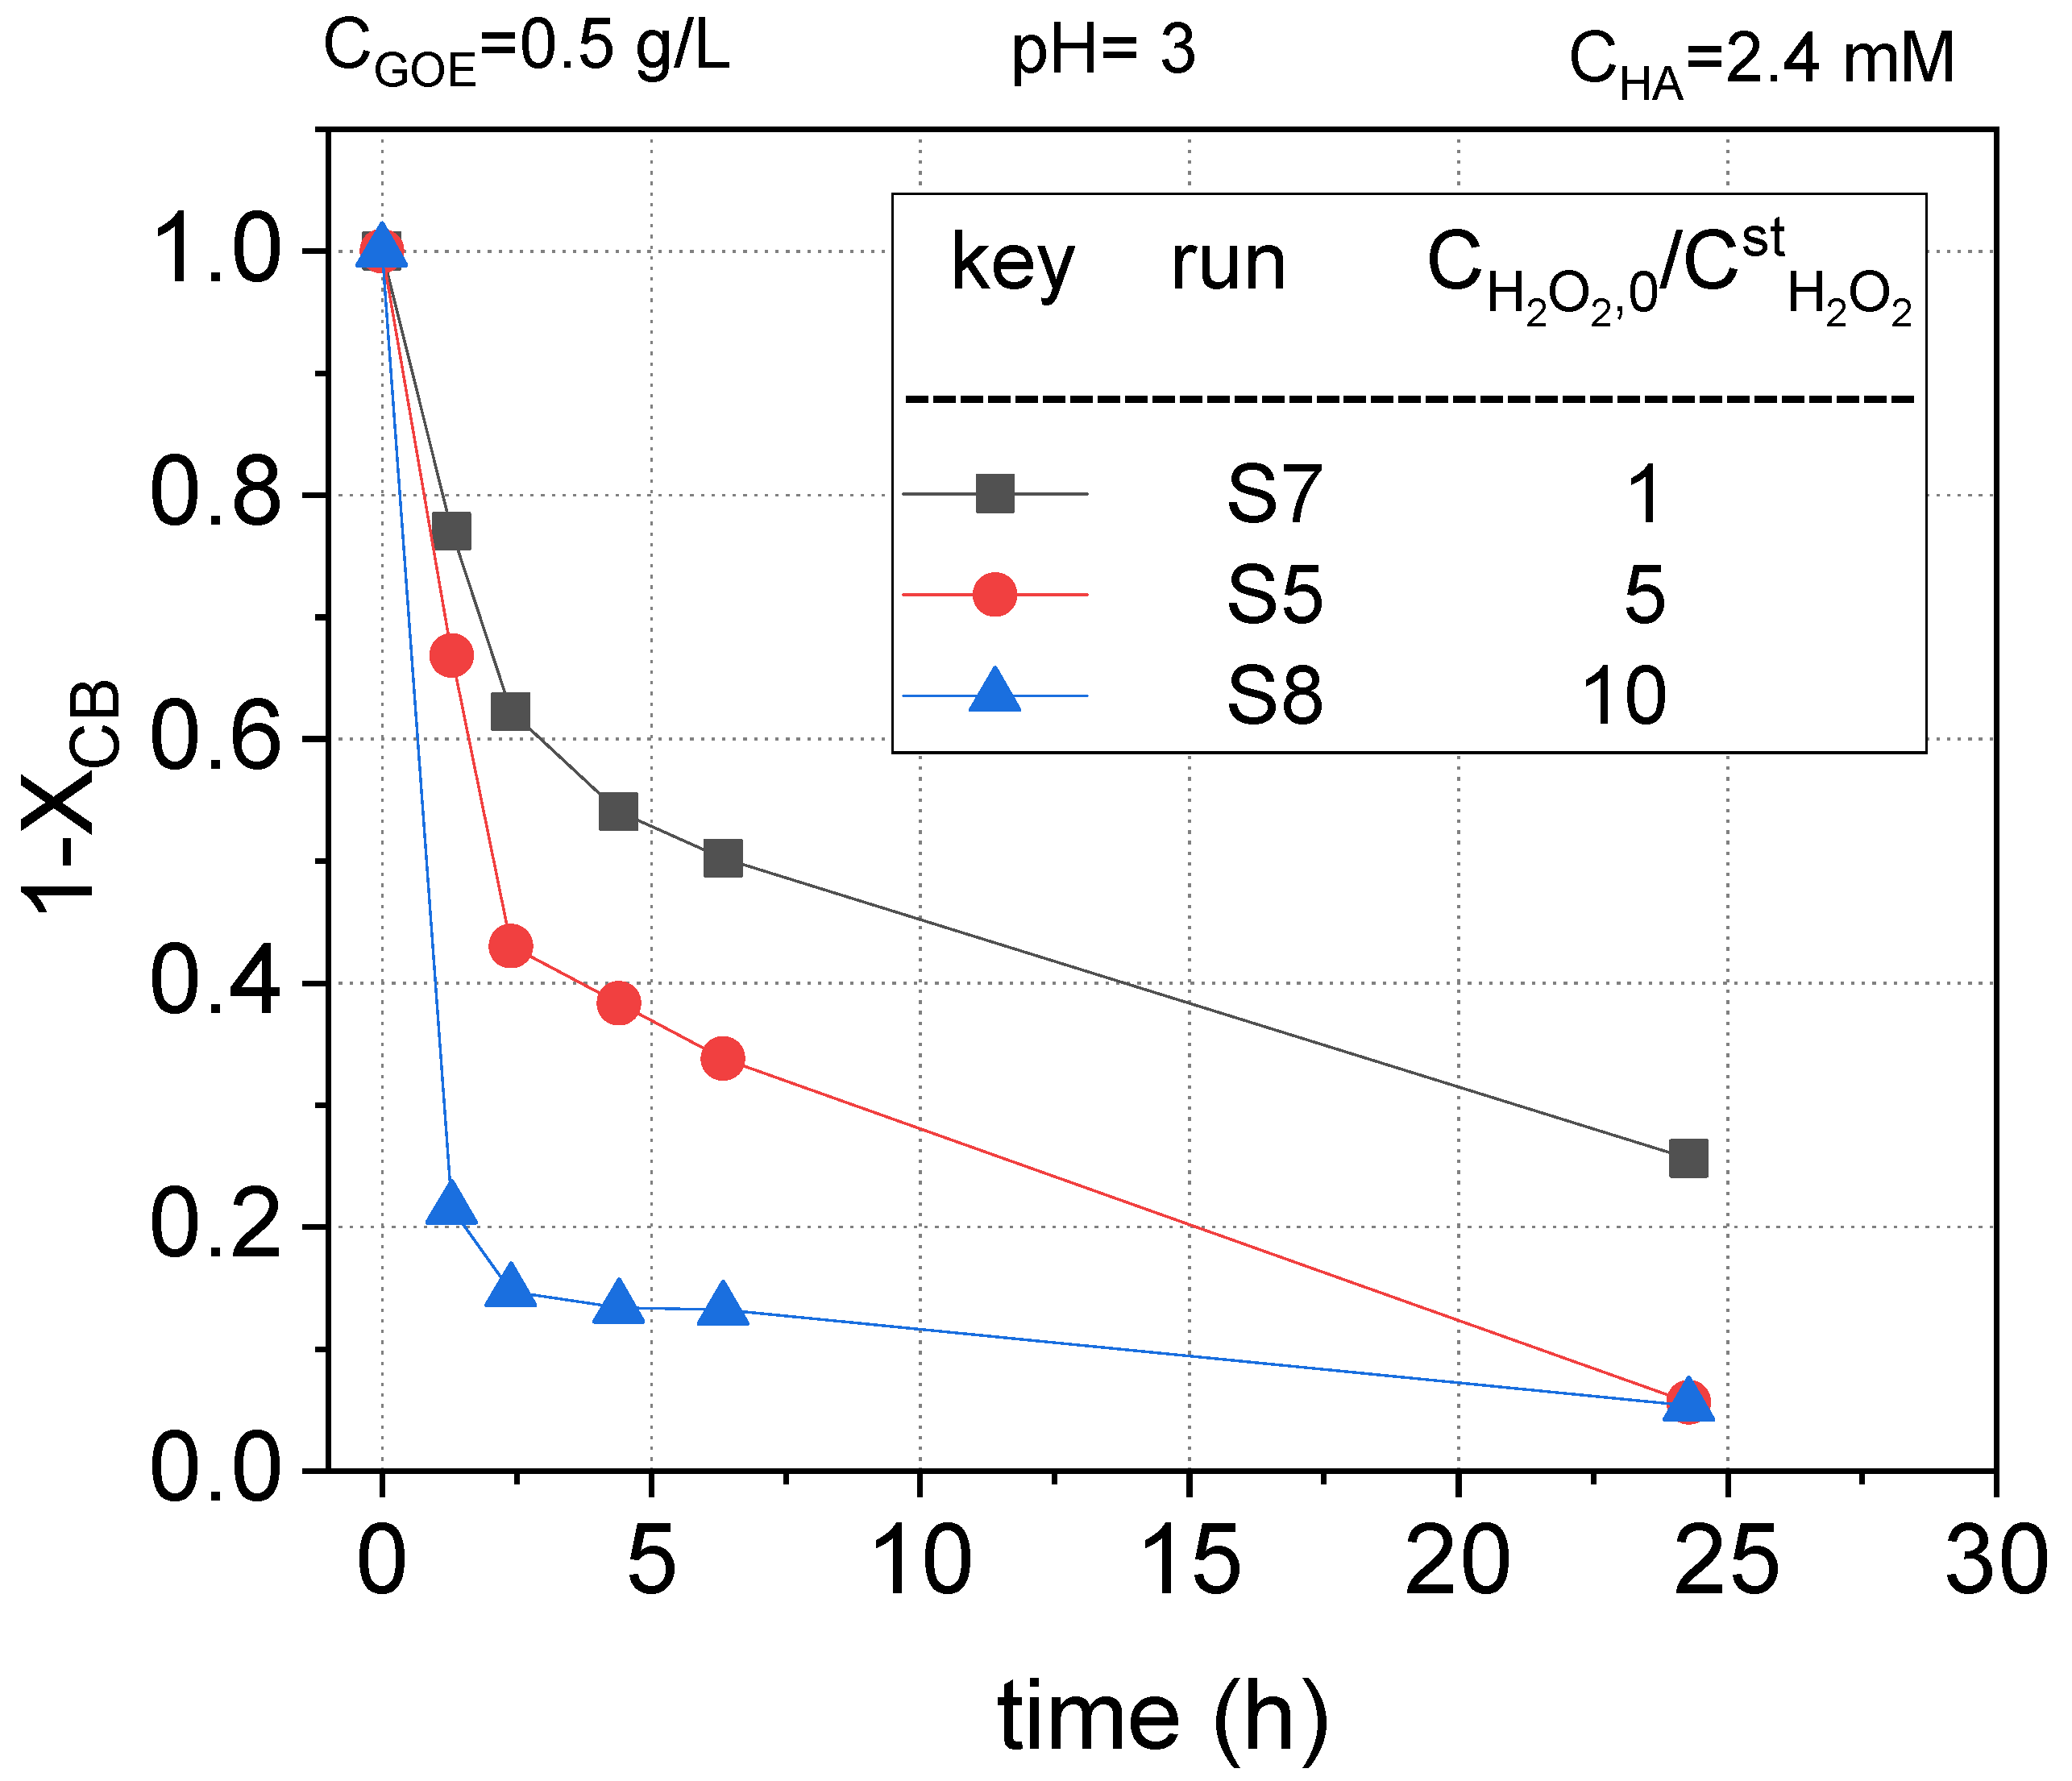
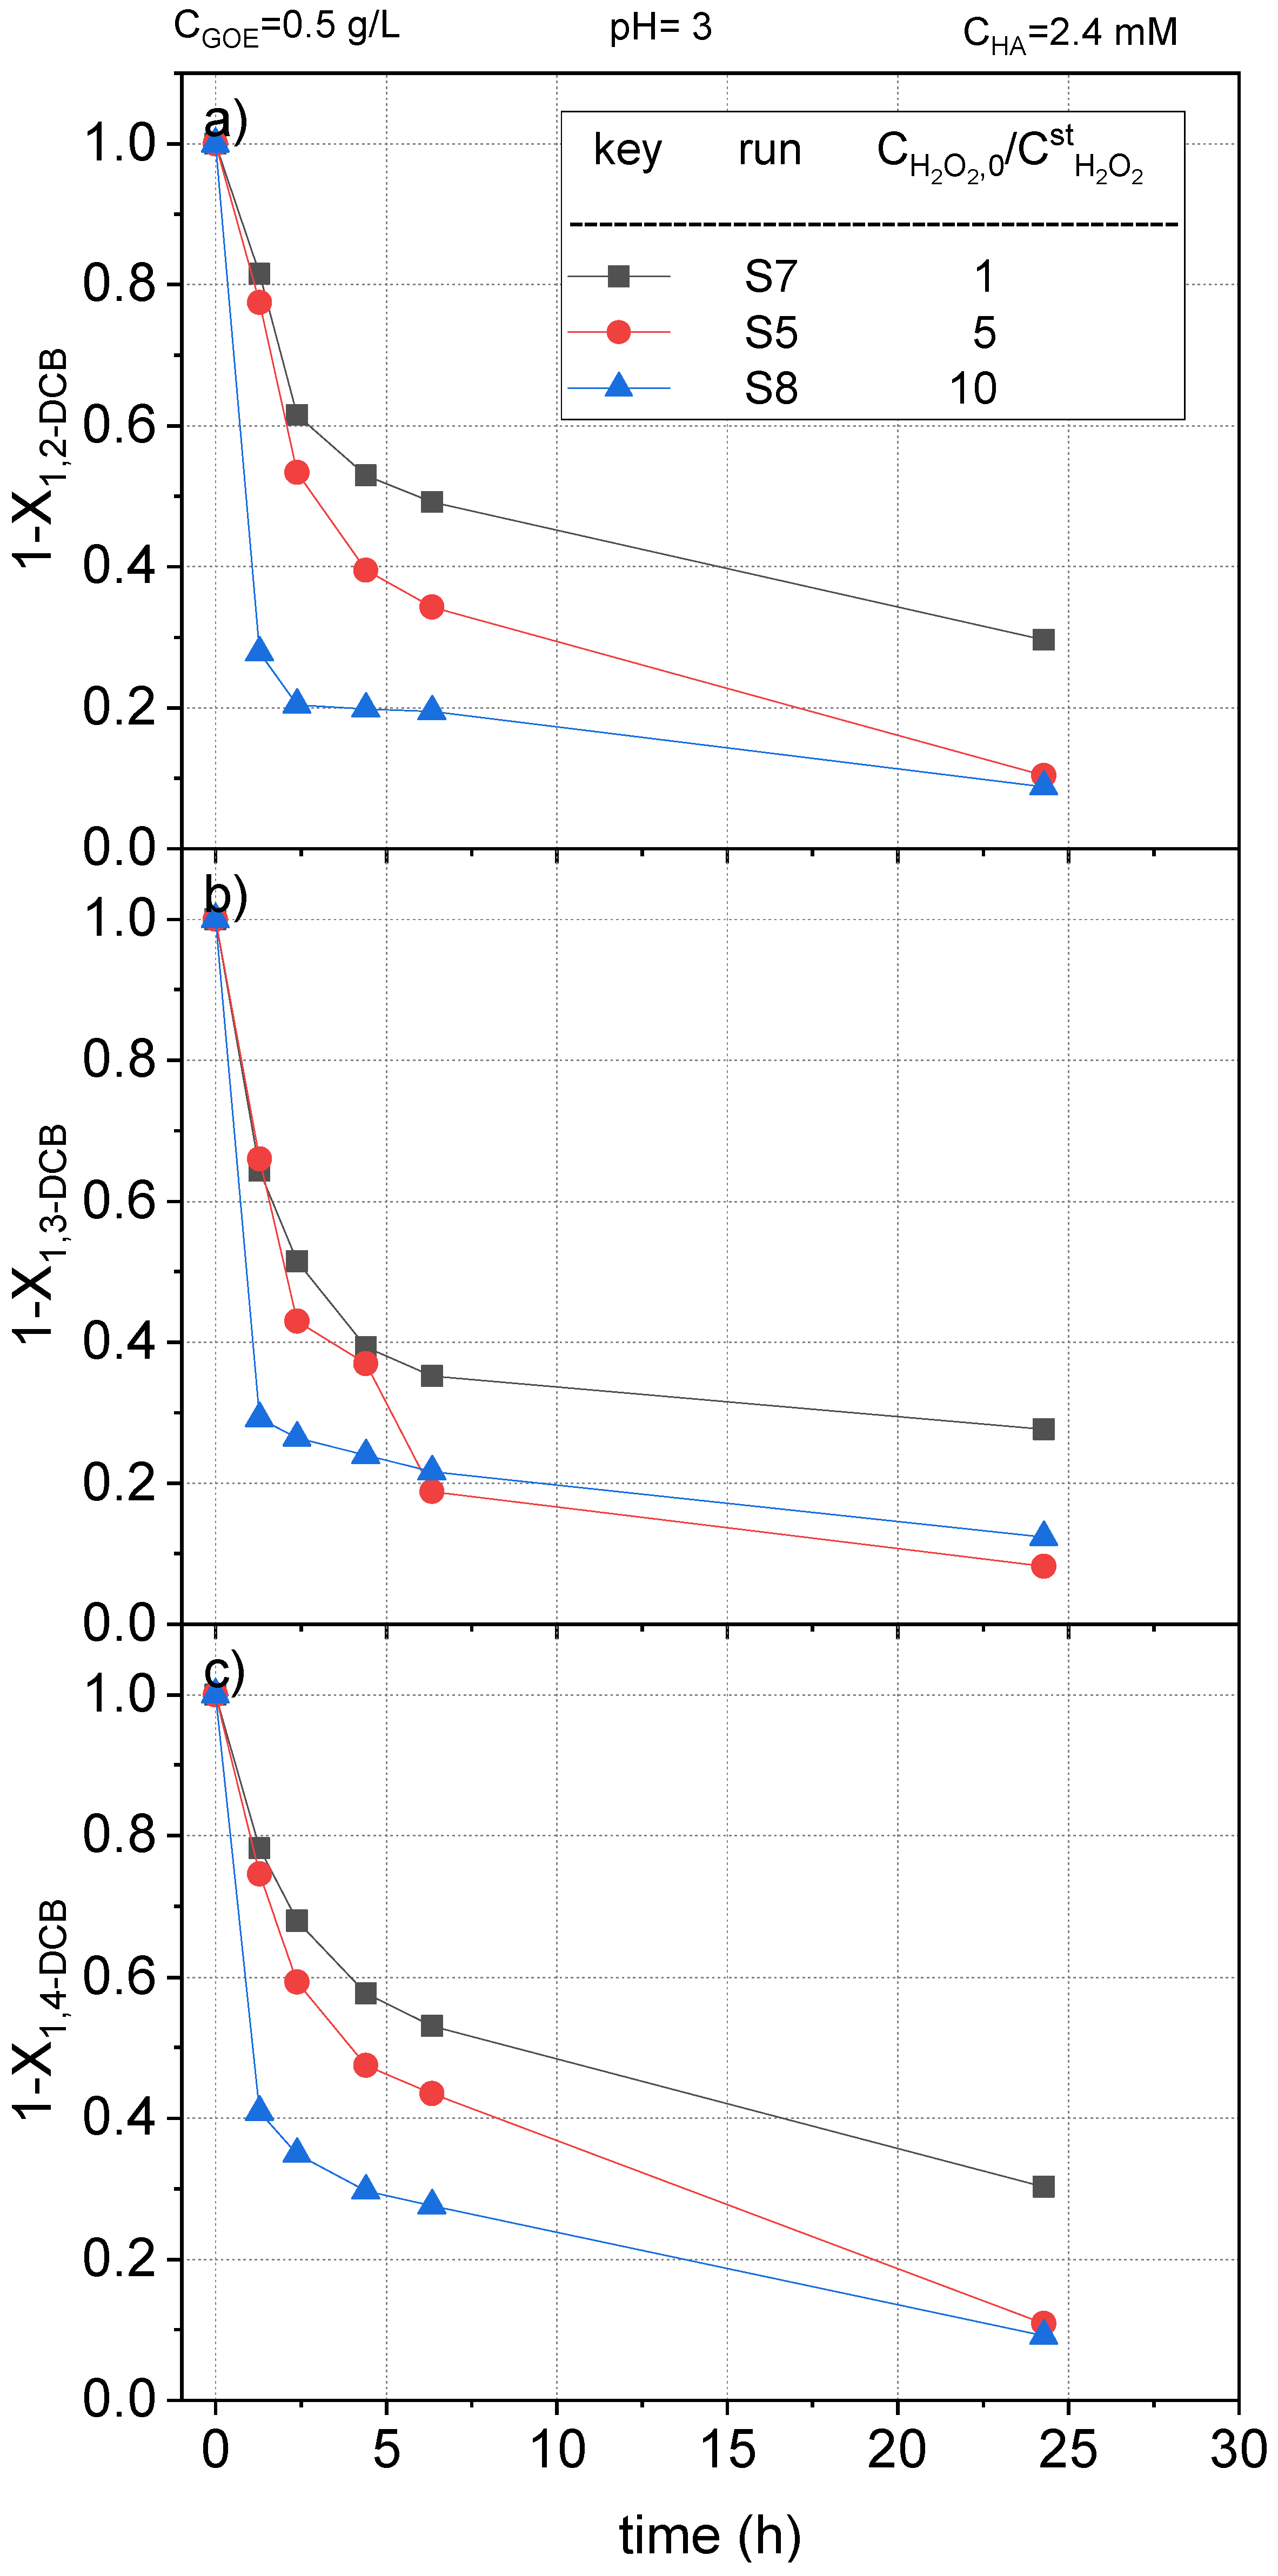
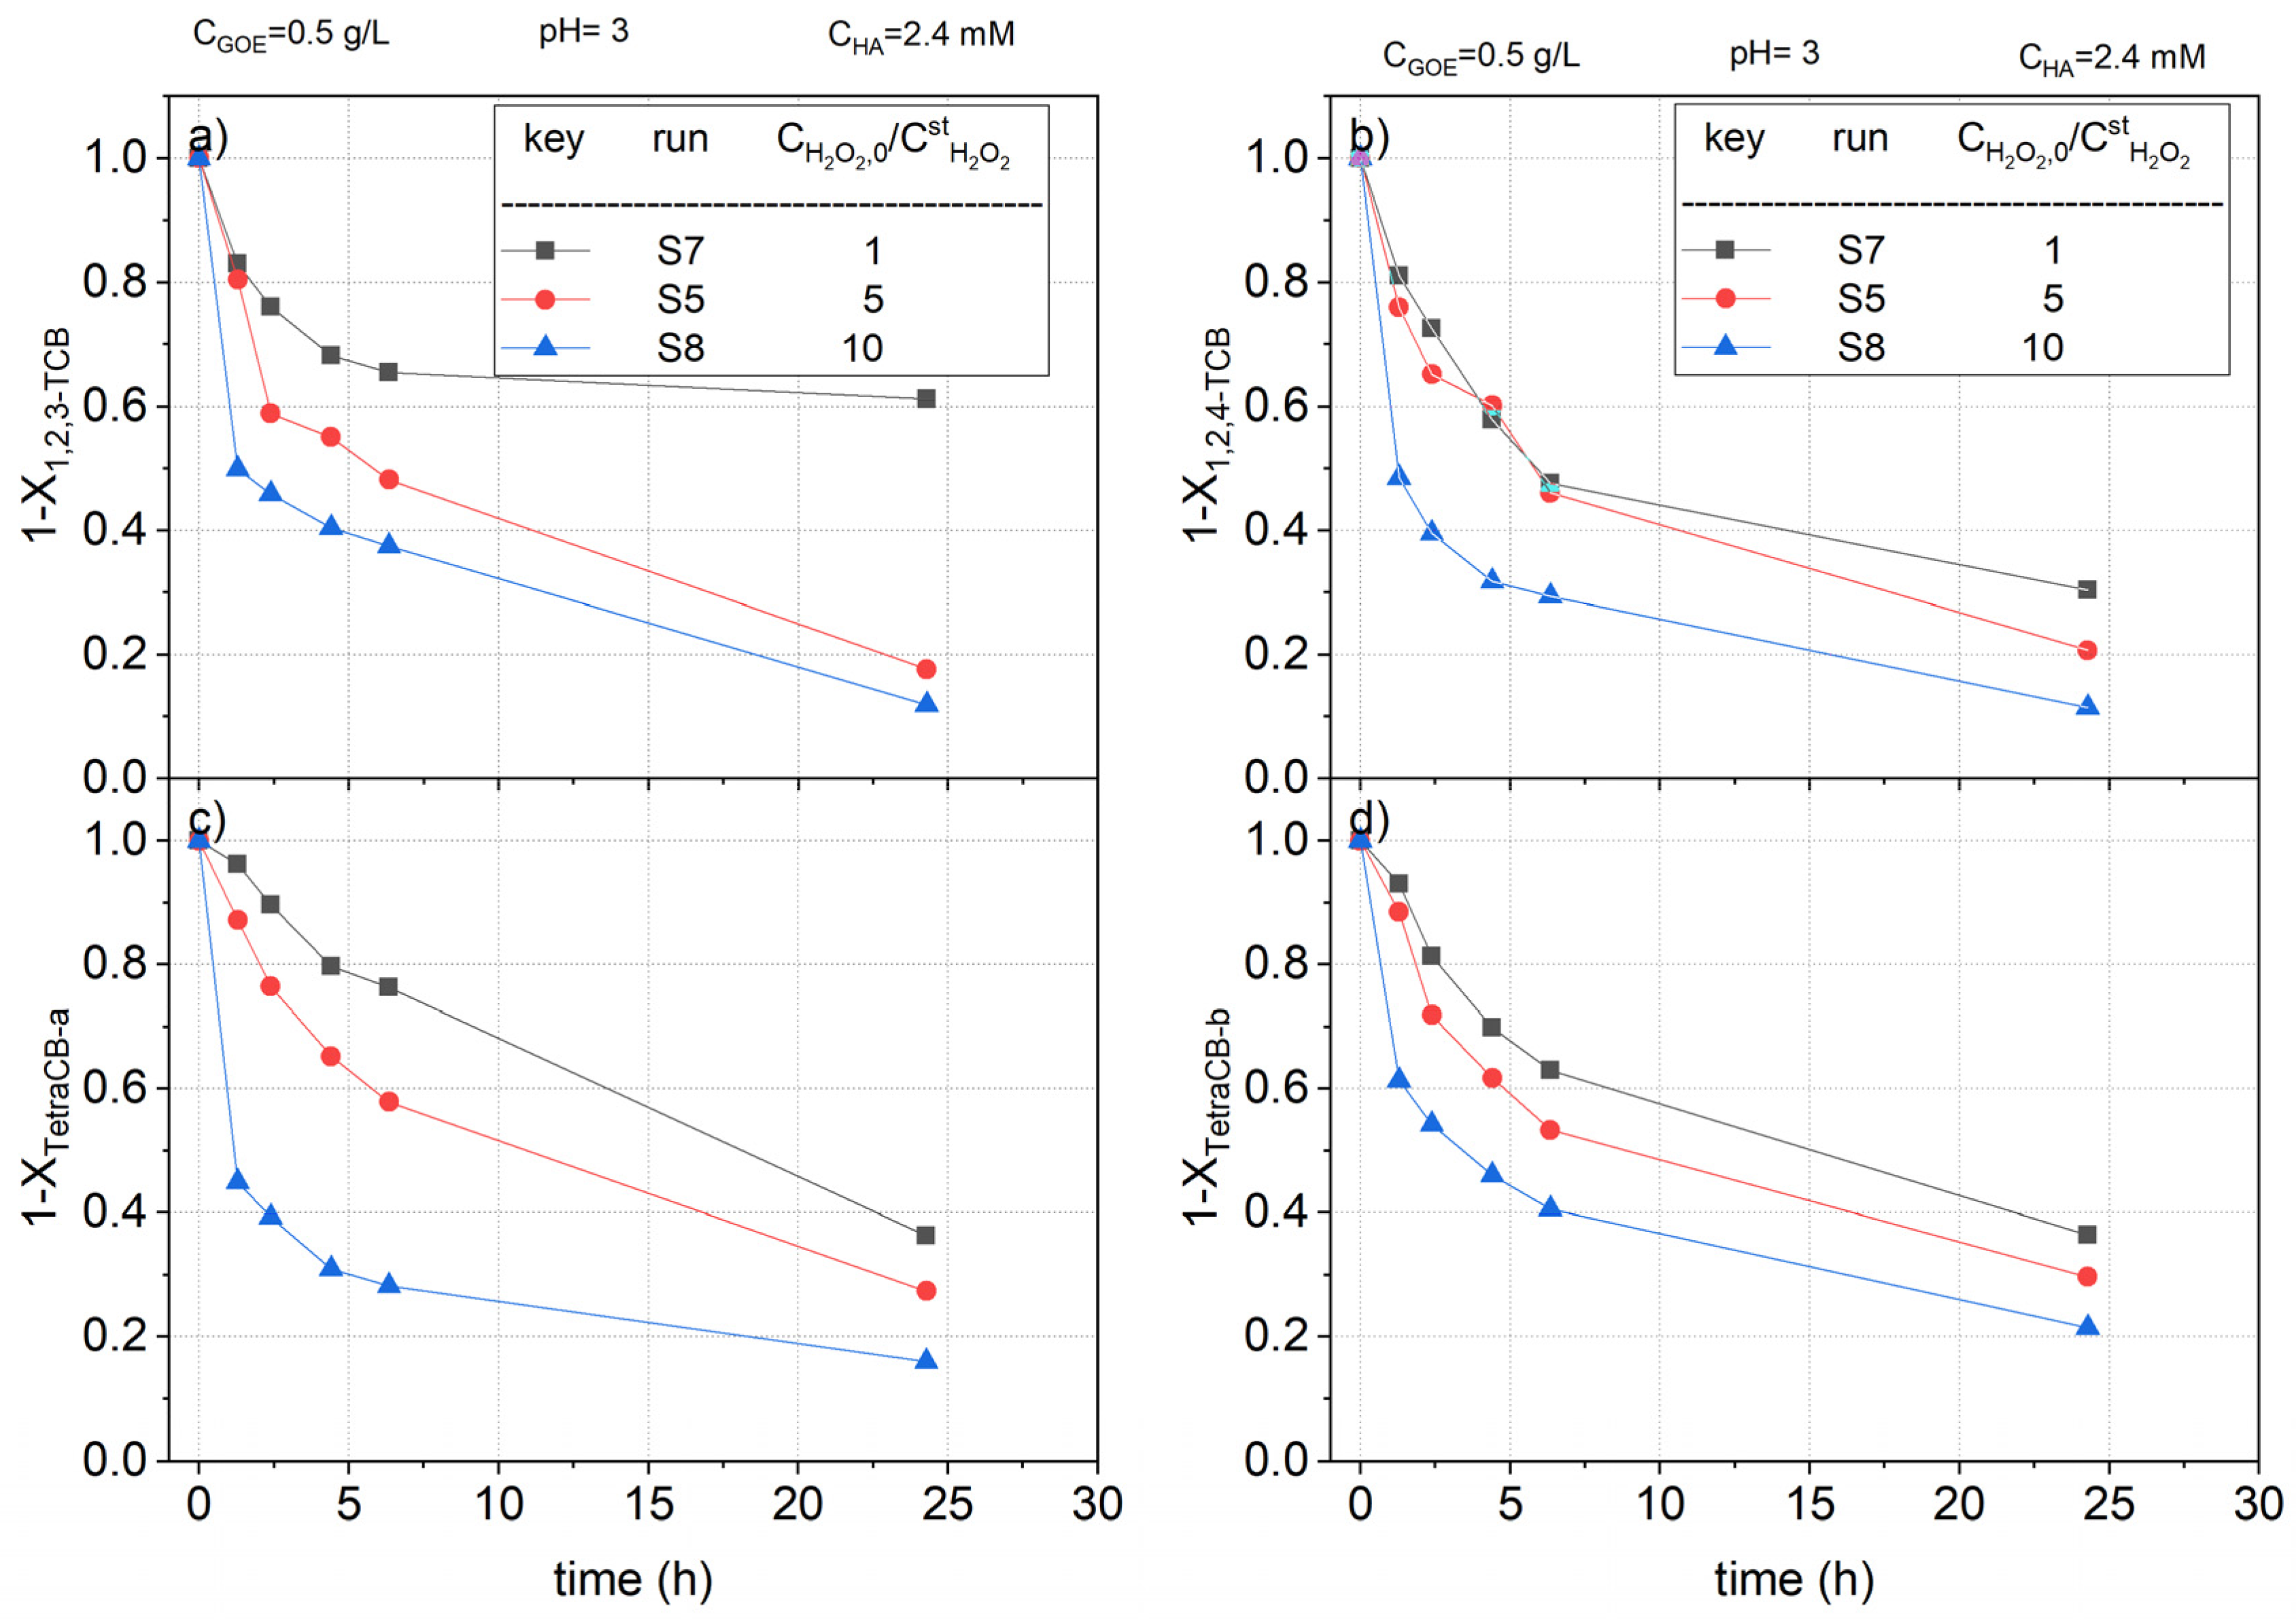
To study the effect of the oxidant on the COCs abatement, runs S5, S7, and S8 (Table 1) were carried out. The dose of hydrogen peroxide varied from 1 to 10 times the stoichiometric amount calculated for the complete mineralization of the starting nCBs (listed in Table 2). The normalized concentration profiles of remaining CB, DCBs, TCBs, and TetraCBs concentration vs. reaction time, are plotted in Figure 9, Figure 10 and Figure 11, respectively.
As can be observed, the higher concentration of hydrogen peroxide, the higher conversion of nCBs, due to a higher production of hydroxyl radicals. This trend was maintained regardless of the type of chlorobenzene. Thus, when a concentration of hydrogen peroxide 10 times the stoichiometric one was used, the reaction time was greatly decreased. For instance, in the case of CB (Figure 9), a conversion of the pollutant above 0.9 was reached in 2 h. On the other hand, more than 24 h of reaction time was needed to reach this conversion value when the stoichiometric dose of H2O2 was used. The samples obtained at 24 h in S7 were analyzed to quantify the remaining hydrogen peroxide and the leaches of iron. For a stoichiometric ratio for H2O2 of 1, the conversion factor was roughly 85%.
2.2.4. Effect of Goethite Concentration
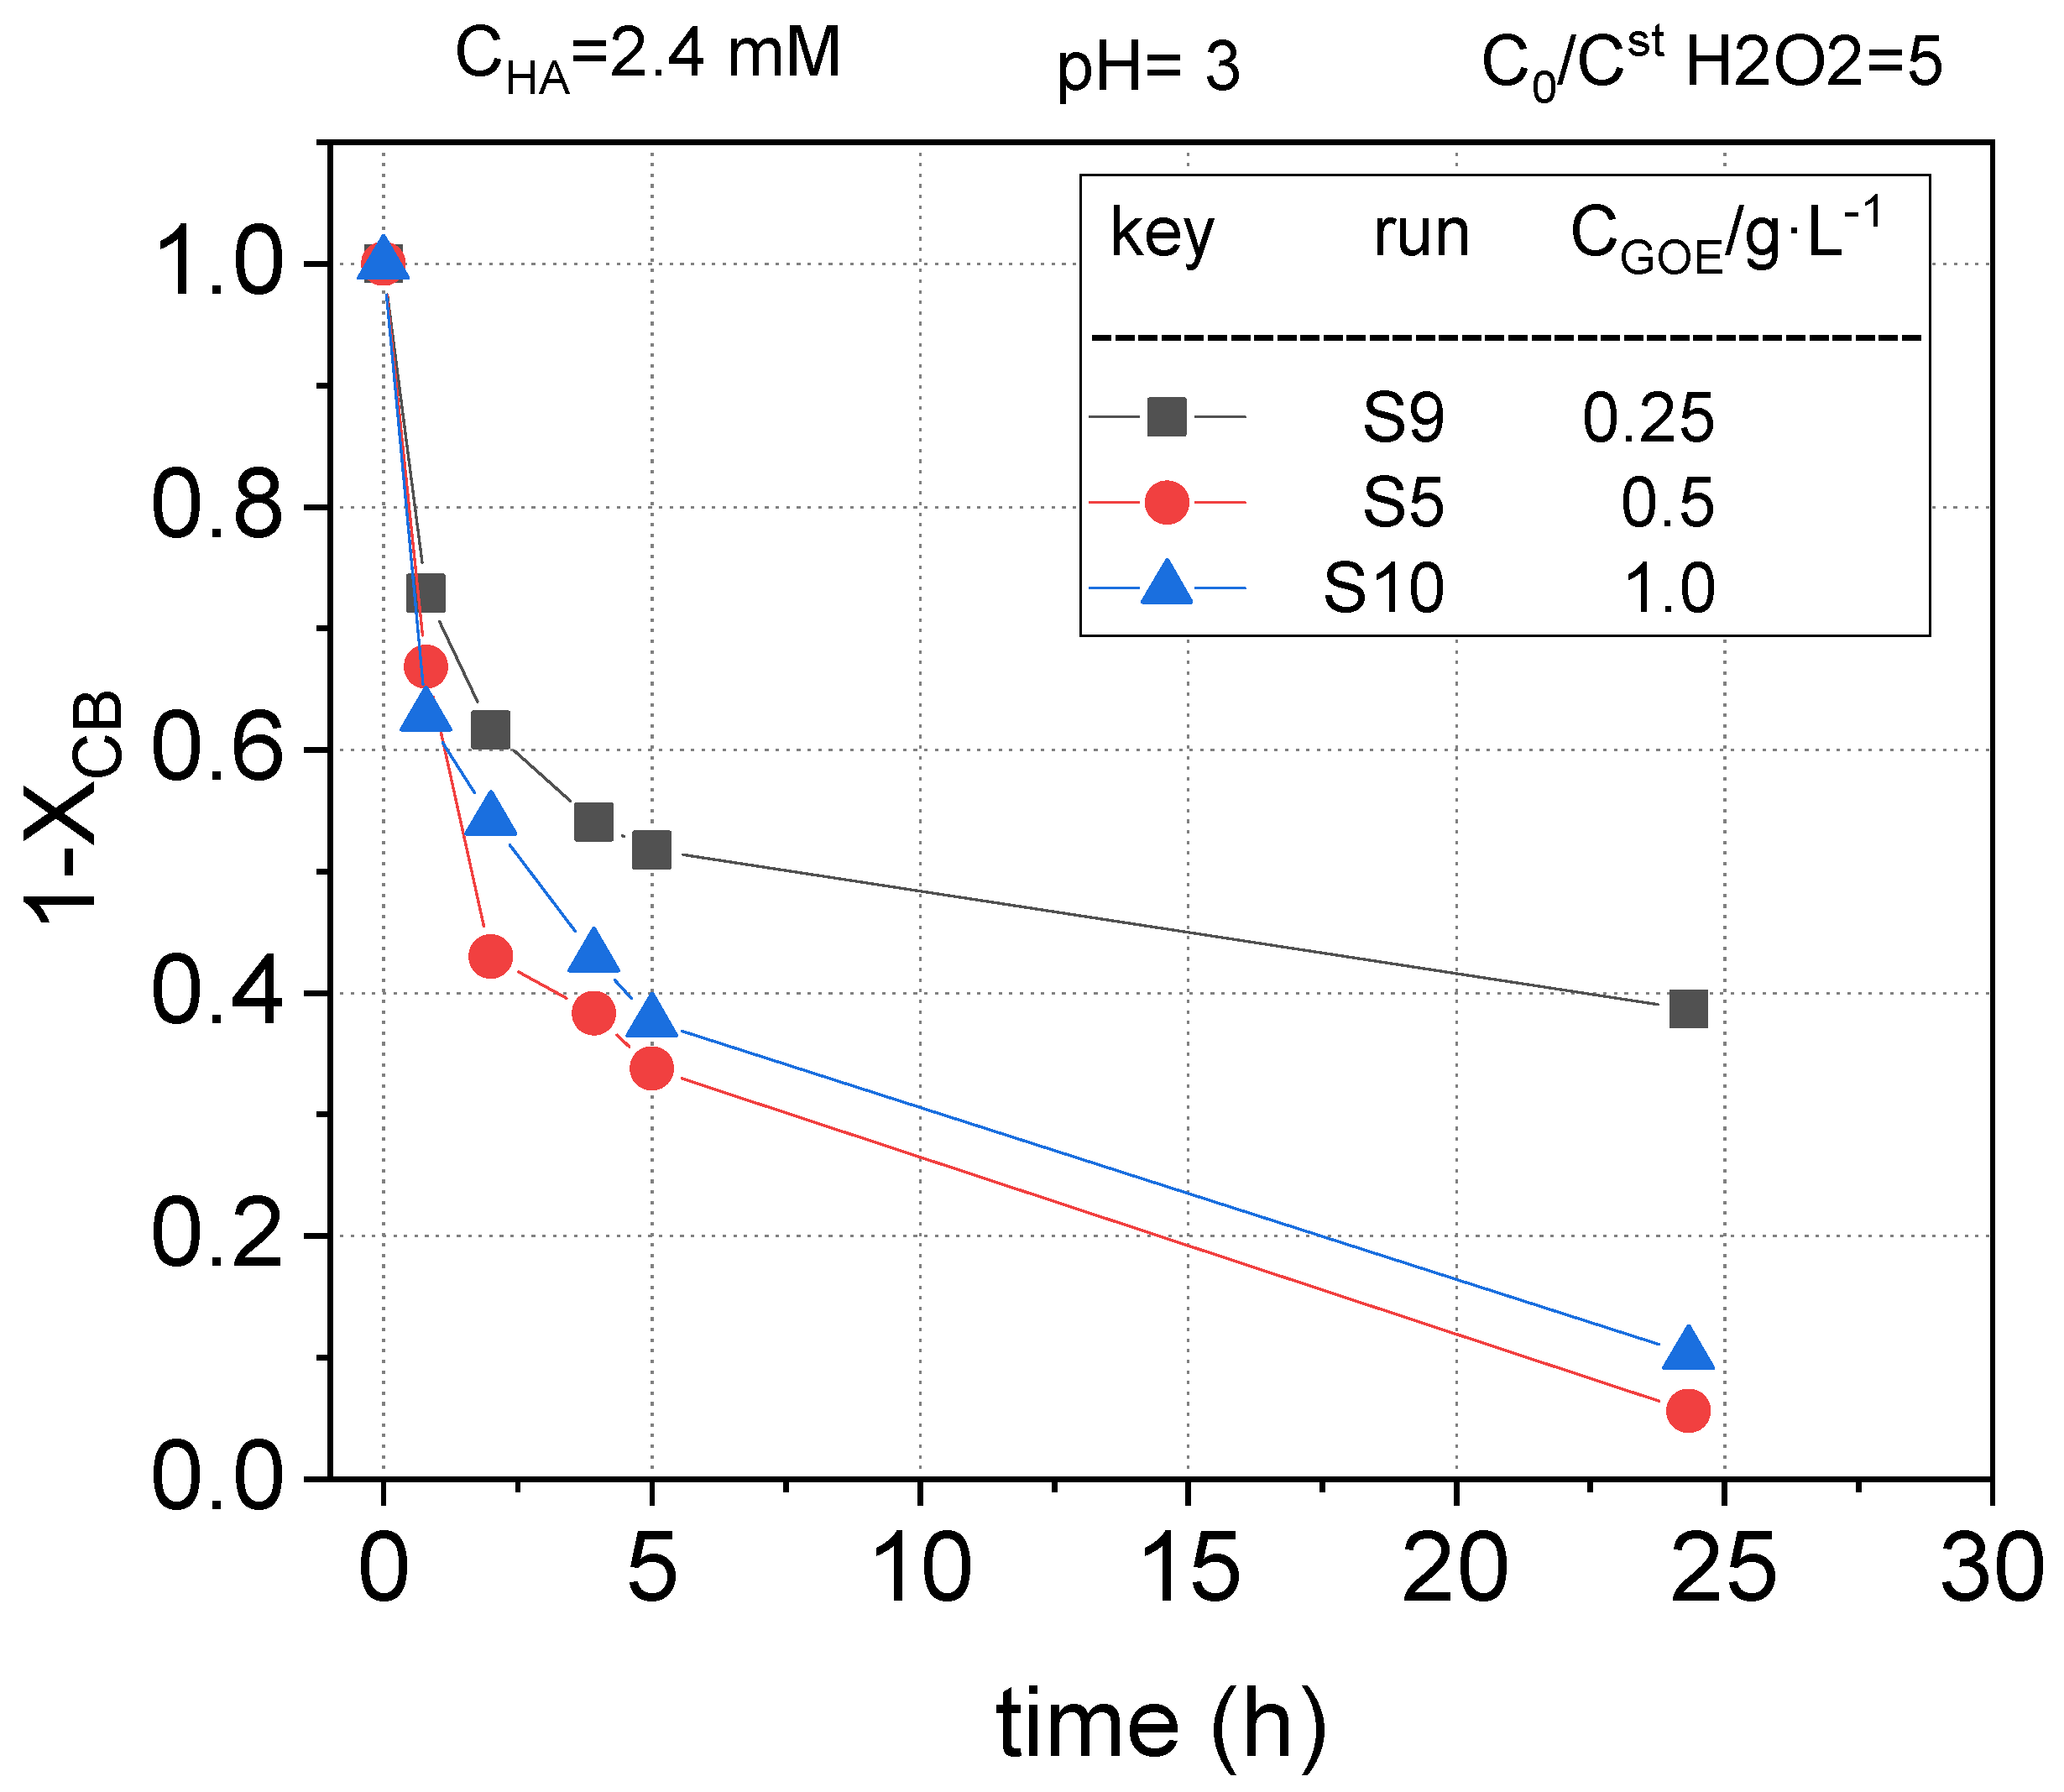
Finally, the influence of the goethite concentration on nCBs removal was also evaluated (runs S5, S9 and S10 of Table 1). The concentration of HA was kept as 2.4 mM, the initial pH was set to 3, and the dose of hydrogen peroxide was fixed at 5 times the stoichiometric amount.
It was noticed that the addition of the heterogeneous catalyst produced a sludge with an orange color (the higher the concentration of goethite, the higher the color intensity). The reaction samples were filtered using nylon filters to remove the heterogenous catalyst, obtaining a colorless aqueous solution. As commented before, the iron leaching at these conditions was negligible.
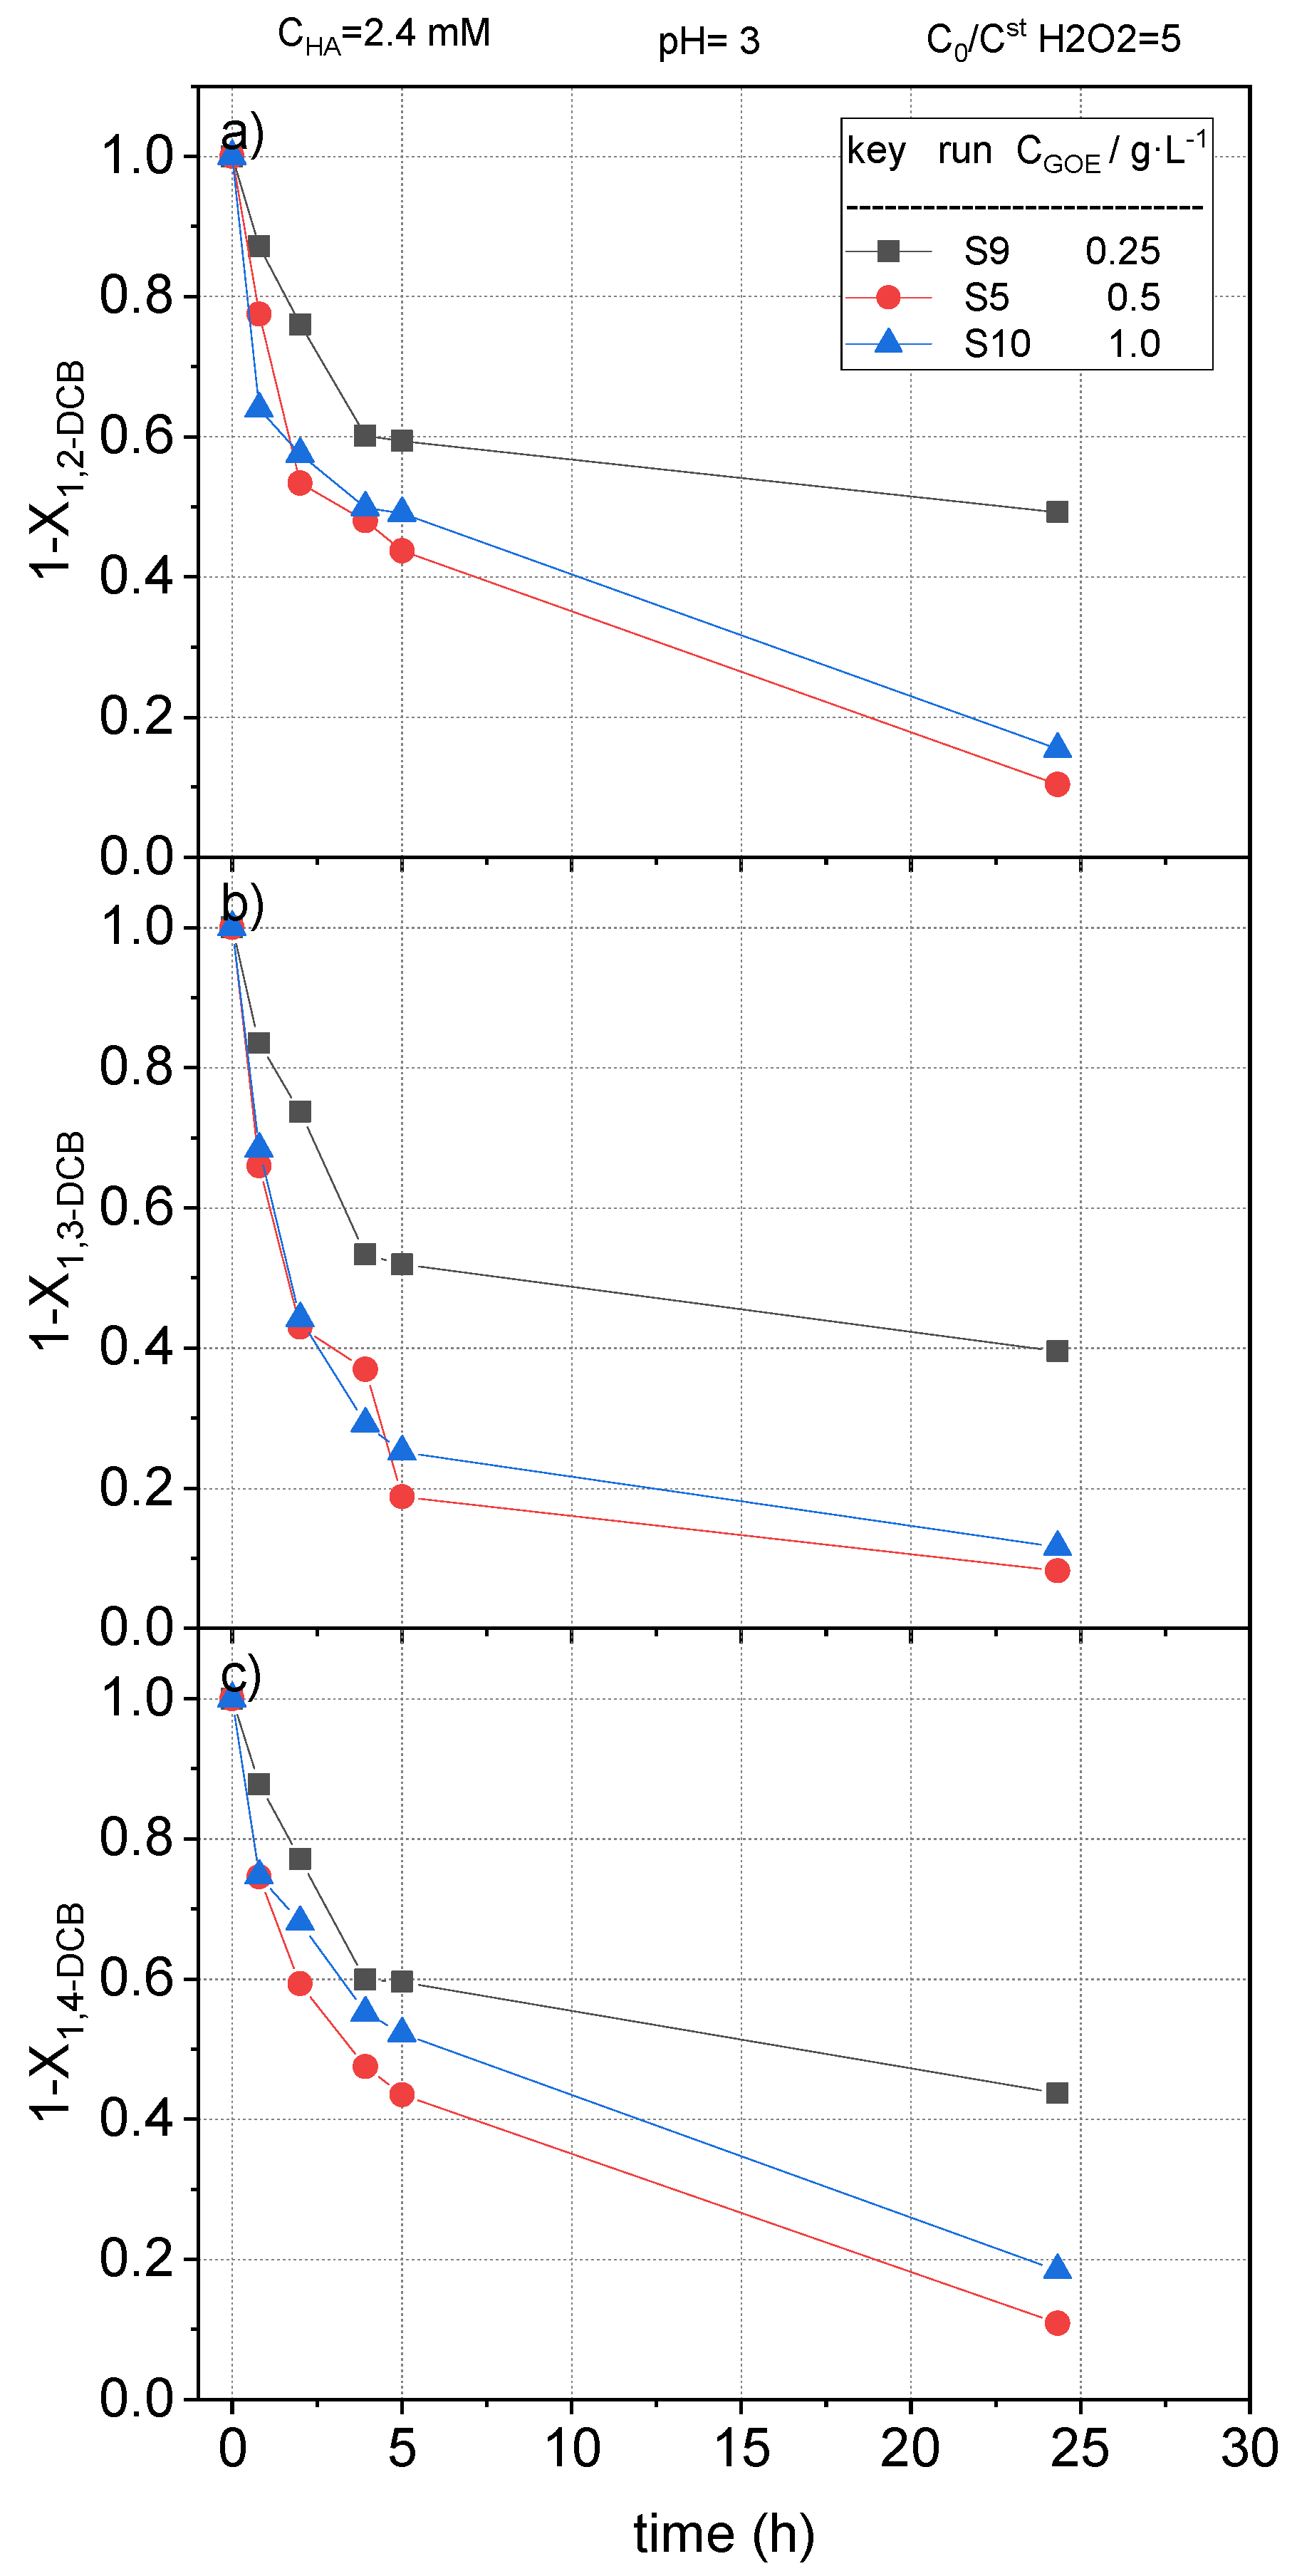
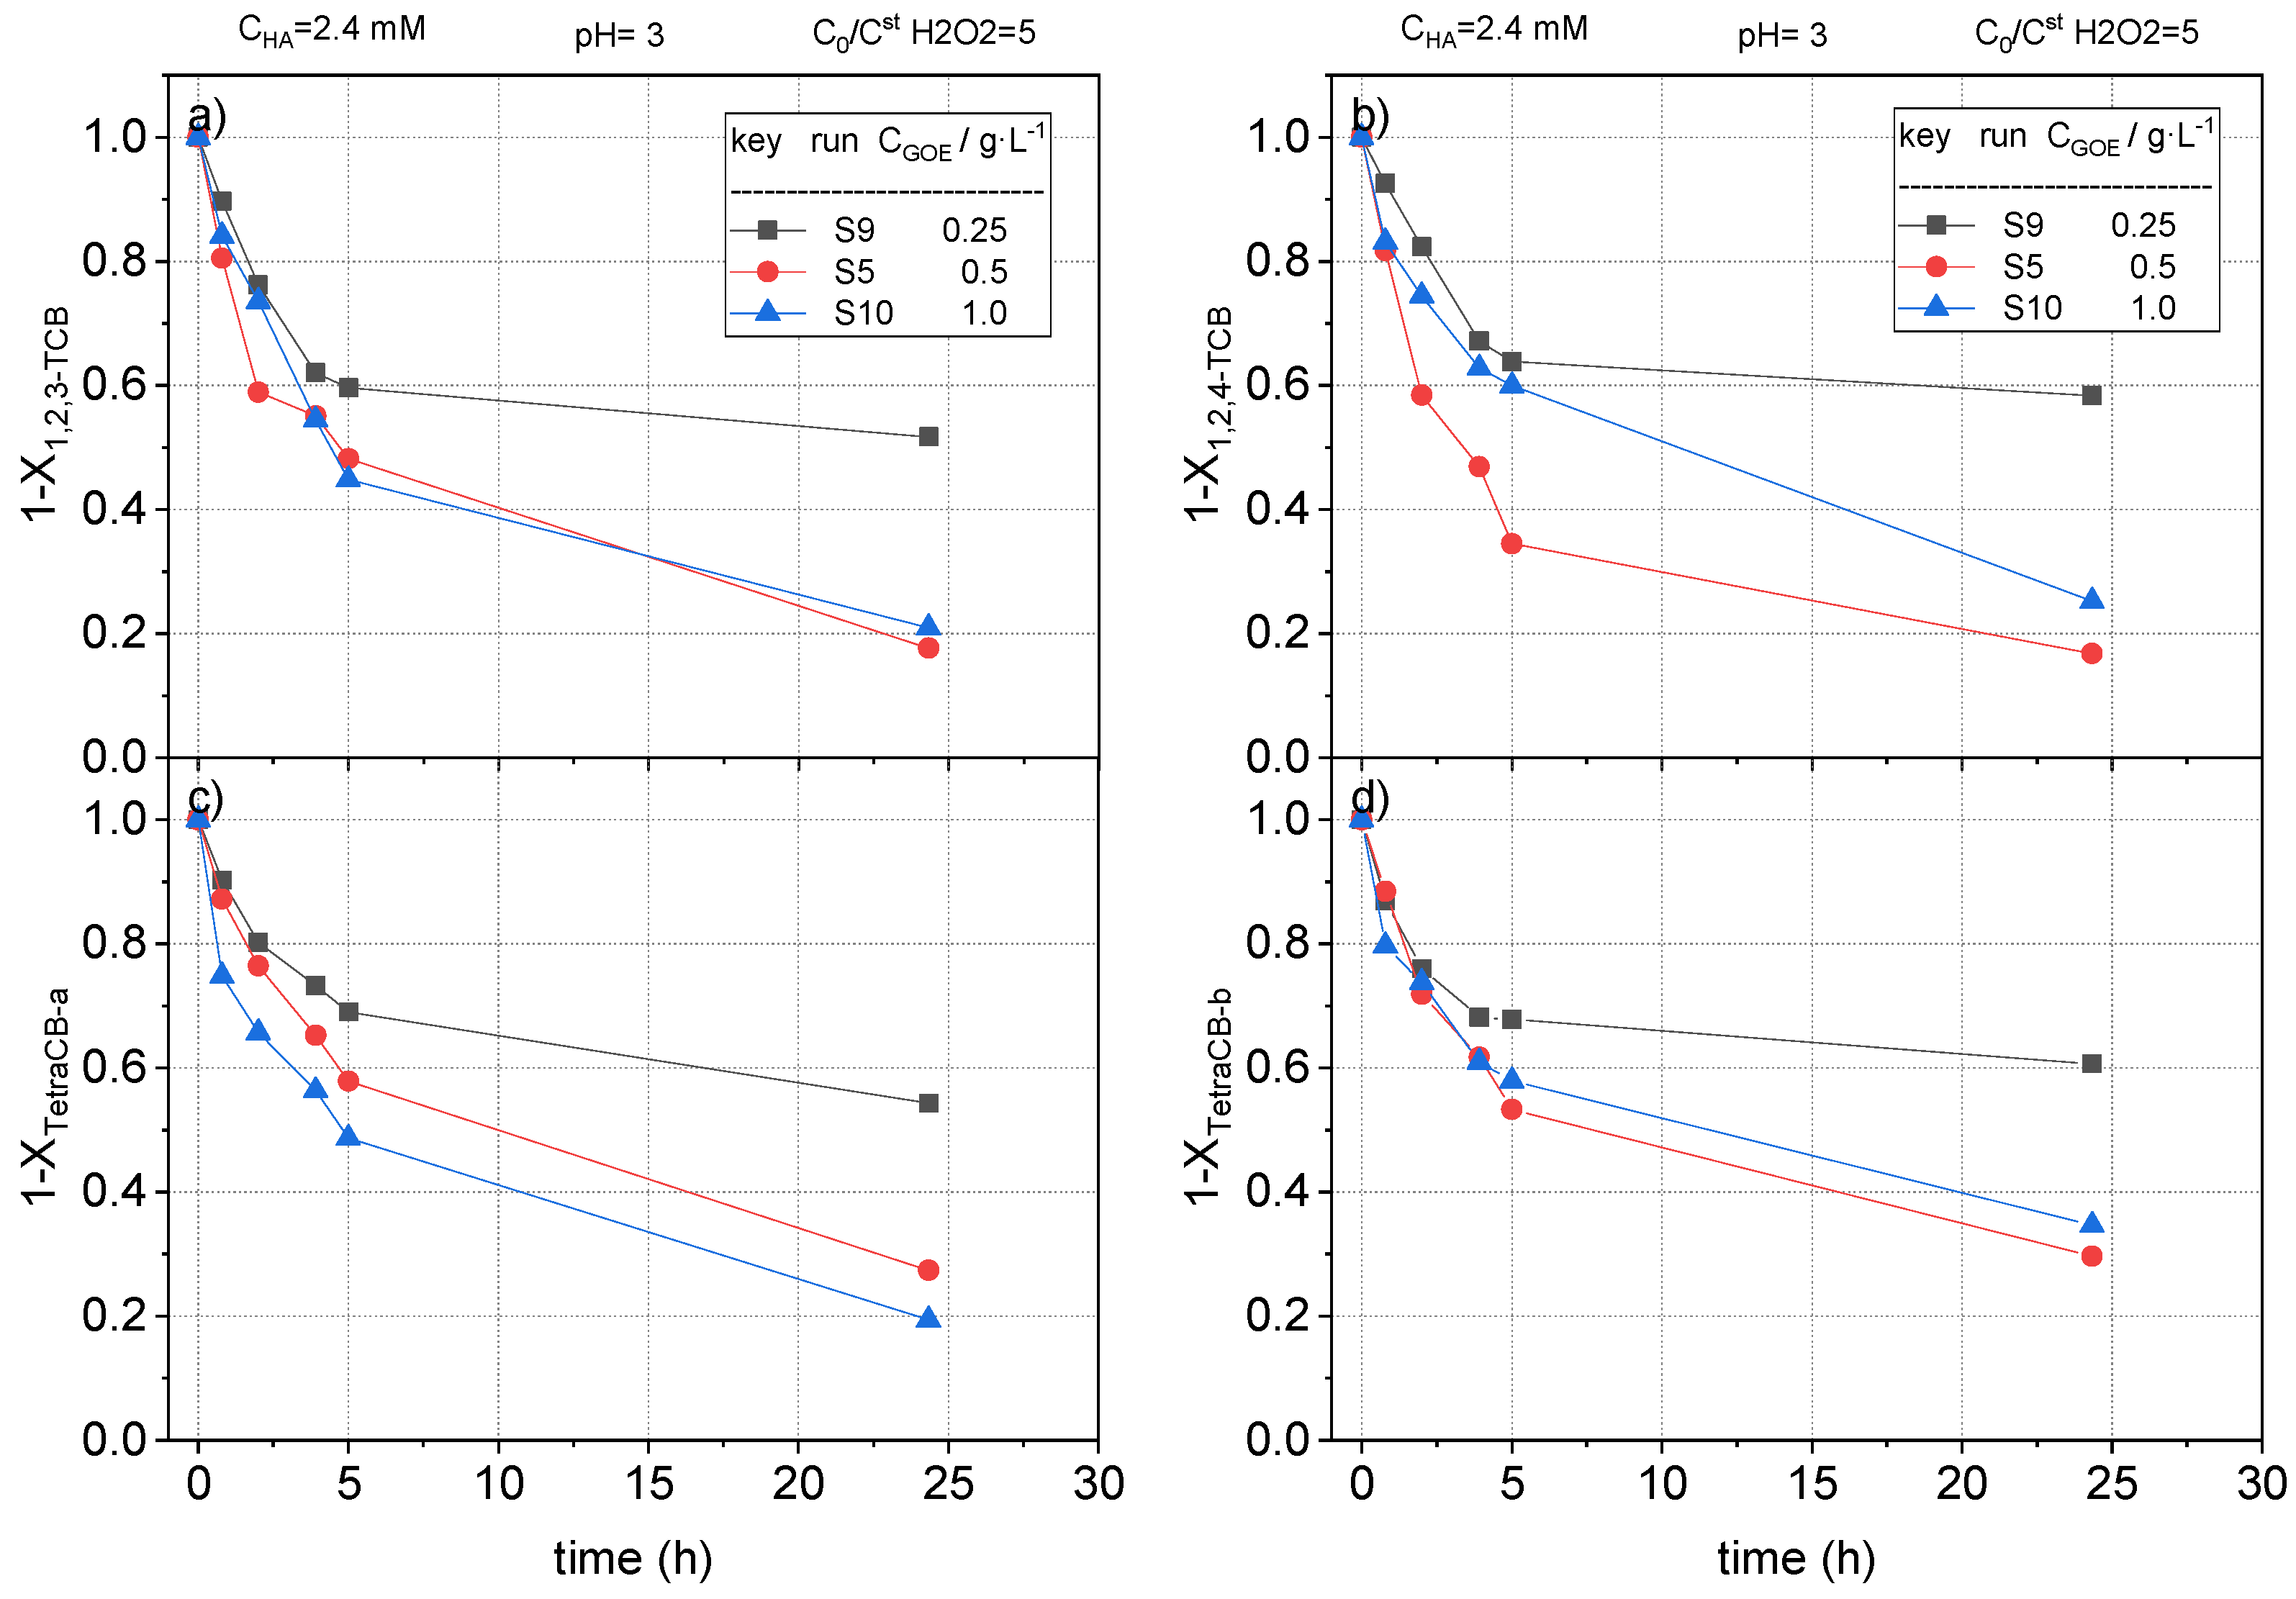
The fractional remaining concentration of nCBs measured in runs S5, S9, and S10 are plotted in Figure 12, Figure 13 and Figure 14. As expected, when 0.25 g L−1 of goethite was used, the conversion of CB, DCB, TCBS, and TetraCB isomers was lower than those obtained with a catalyst concentration of 0.5 g L−1. Surprisingly, an increase in the concentration of goethite from 0.5 to 1 g·L−1 did not produce an improvement in the removal of COCs. When the catalyst concentration is higher than a critical value in slurry reactors it is common that the slurry formed is not well mixed and the catalyst agglomerates at the bottom of the reactor, resulting in a defective contact between the solid and the aqueous phase. In our work, this effect was noticed at values of 1 g/L or higher of the iron mineral. This fact has also been reported in literature, where an optimal catalyst concentration in slurry systems was found [48]. However, it should be considered that the optimal value for catalyst loading to avoid agglomeration and defective liquid–solid contact will depend on the reactor construction and the agitation system used.
3. Methods
3.1. Reagents and Catalyst
Chlorobenzene (CB), 1,2-dicholorobenzene (1,2-DCB), 1,3-dicholorobenzene (1,3-DCB), 1,4-dicholorobenzene (1,3-DCB), 1,2,3-trichlorobenzene (1,2,3-TCB), 1,2,3,4-tetrachlorobenzene (1,2,3,4-TetraCB), 1,2,3,5-tetrachlorobenzene (1,2,3,5-TetraCB), and 1,2,3,4-tetrachlorobenzene (1,2,3,4-TetraCB), all of analytical quality, were purchased from Sigma-Aldrich (Darmstadt, Germany) and dissolved in n-hexane to prepare the standards used in the calibration curves of these compounds. Bicyclohexyl, also purchased from Sigma-Aldrich (Darmstadt, Germany), was selected as the internal standard (ISTD). The polluted water used in this work was prepared by spiking milli-Q water with chlorobenzenes (nCBs, being n = mono, di, tri, and tetra). The concentration of each compound, summarized in Table 2, was selected to simulate the concentration range found in the groundwater of the hot spots where these compounds were usually dumped [49]. As can be seen, 1,3 DCB has a lower concentration than 1,2 and 1,4 DCB in accordance with the occurrence of these compounds noticed in groundwaters. The concentration of COCs used in the spiked water also considered that the solubility of each nCB in aqueous phase decreases with the number of chlorine atoms in the molecule. The theoretical stoichiometric dosage of H2O2 required for the mineralization of each compound is also given in this table. As can be seen, the total amount of H2O2 required for the complete oxidation of COCs was 3.24 mmol L−1 (0.11 g L−1).
Hydrogen peroxide (33 wt%), employed as an oxidant, was supplied by Sigma-Aldrich; hydroxylamine, used to enhance the reduction of Fe (III) to Fe (II) in the Fenton redox cycle, was added as hydroxylammonium sulfate (HAS), being supplied by Acros Organics (Geel, Belgium).
Goethite, used as a catalyst in CWPO reactions, was supplied by Sigma-Aldrich (Darmstadt, Germany). Goethite is a soil mineral compounded by Fe(III), being one of the most thermodynamically stable iron oxides. It presents an orthorhombic structure, where the iron atoms are in the center of an the octahedral formed by and anions, and the molecular formula is Fe(III)OOH [50,51,52]. A specific surface area (SBET) of 10.24 m2 g−1 was measured by the N2 adsorption–desorption isotherms at 77 K (Figure 15). The total iron content of the catalyst was determined by spectroscopy of atomic emission at 259.94 nm. Previously, 0.5 g of the catalyst was dissolved in 15 mL of chlorhydric acid (Sigma-Aldrich, Darmstadt, Germany 35 wt%), finding that the iron mass percentage in the goethite was 57.3 wt%. Other metals were also measured by atomic emission spectrometry, but only a small amount of potassium (<0.01%) was found. Therefore, the Fe(III)OOH percentage in goethite can be calculated as 91.3 wt%. The corresponding mass percentages of oxygen and hydrogen happens to be 33.2 wt% and 1.03 wt%, respectively. About 8.6 wt% of the mineral mass could not be identified but it did not correspond with transition metals.
Other reagents used in the present work were: titanium oxysulfate, ferric sulfate heptahydrate, n-hexane, and cyclohexanone (Sigma-Aldrich), carbonate, bicarbonate, H2SO4, acetone, nitrite, and nitrate (for Ion Chromatography analyses).
3.2. Blank Experiments
The leaching of iron from the heterogeneous catalyst (0.5 g L−1 of goethite) was evaluated in the seven runs gathered as B1a–g in Table 1. A concentrated solution of hydroxylamine sulfate (HAS) in water (400 g/L) was used to achieve the desired hydroxylammonium (HA, Sigma-Aldrich Darmstadt, Germany) concentration in the reaction media. It must be considered that each mol of HAS yields 2 moles of HA. A pH range from 1 to 7 was investigated and leached iron was measured in the batch reactor after 48 h at room temperature. Previously to the leached iron quantification, the goethite was separated from the aqueous phase using a nylon filter (0.22 μm).
In order to discriminate the interaction among the oxidant, the reductant, HA, and the catalyst in the absence of pollutants, a set of control experiments were carried out using milli-Q water without pollutants. The experimental conditions of these runs (B2, B3, and B4) are summarized in Table 1. These runs were carried out at room temperature (22 °C) in a well-mixed batch reactor of 250 mL using a magnetic plate, IKA C-MG HS 7 (Staufen, Germany). A stirring speed of 500 rpm was selected for the blank runs because almost the same HA conversions were obtained in run B4 at 400, 500, and 600 rpm.
Reaction samples were taken at different times to follow the evolution of the reagents in the aqueous phase.
3.3. CWPO Experiments
The effect of the initial pH value, as well as the oxidant (H2O2), reductant (HAS), and catalyst (goethite) concentration on the nCBs removal was investigated (runs S1 to S10, Table 1). Runs were carried out by duplicate with the standard deviation being lower than 5% in all cases.
A volume of 0.4 mL of an aqueous solution containing AS and H2O2 was added to 19.6 mL of the polluted water in a cap-sealed vial (20 mL) without headspace, in order to minimize the evaporation of CBs during the reaction time. The concentration of reagents (H2O2 and HAS) in the 0.4 mL volume was selected to achieve the corresponding concentration of each run (conditions collected in Table 1) in the final reaction volume (20 mL). The corresponding amount of catalyst was added at zero time. Several vials were prepared for each reaction and a vial was sacrificed at each reaction time. The vials were agitated using a rotatory agitator (Labolan, ref 51752, Navarra, Spain). The agitation speed was fixed to 90% of the maximum speed of the rotatory agitator employed. No differences were found in the pollutant conversion obtained in run S5 in the range of 80% to 100% of the maximum rotatory speed
As the addition of HAS acidified the pH of the spiked water, the pH of the polluted water and the HAS solution was adjusted before these solutions were mixed. To do this, H2SO4 and NaOH were used when necessary.
As can be seen in Table 1, the influence of pH was tested in runs S1 a, b, c and S5. Runs S2–S6 were carried out to study the influence of the hydroxylamine concentration (in the range of 0.6 to 4.9 mmol L−1) on the nCBs abatement. Runs S5, S7, and S8 were carried out using different doses of hydrogen peroxide in a range of 1–10 times the theoretical stoichiometric amount, calculated for the complete mineralization to carbon dioxide, water and chloride of the nCBs (Table 2). Finally, the influence of the solid catalyst concentration on the removal of CBs was tested in runs S5, S9, and S10 within the range 1–0.25 g L−1. Operation conditions of run S5 were selected as the central values for the study of other variables than H2O2.
A blank experiment with the polluted water in the absence of the reagents (H2O2 and HA) and the catalyst (goethite) was also carried out (by triplicate).
3.4. Analytical Methods
Firstly, COCs were identified by gas chromatography (Agilent 6890N, Santa Clara, CA, USA) coupled to a mass spectrometry detector (GC/MS). The concentration of nCBs in the aqueous phase during the experiments was determined by extracting 10 mL of the reaction mixture with 5 mL of n-hexane by the agitation during 2 min and after 10 min of settlement. It was experimentally confirmed that more than 95% of the COCs in the aqueous phase were extracted to the organic phase by this procedure. Both phases were separated by decantation and the concentration of nCBs in the organic phase was measured using a gas chromatograph coupled with a flame ionization detector (GC/FID) and an electron capture detector (ECD). On the other hand, the catalyst was separated from the aqueous phase using a nylon filter (0.22 μm). After that, the concentration of hydrogen peroxide, chloride, carboxylic acids, and iron was determined.
GC/MSD analysis: COCs were identified by gas chromatography (Agilent 6890N, Santa Clara, CA, USA) coupled to a mass spectrometry detector (Agilent MSD 5975B, Santa Clara, CA, USA), which operates under a vacuum. A column HP-5MS (30 m × 0.25 mm ID × 0.25 µm) was used as stationary phase. A flow rate of 1.7 mL min−1 of helium was used as the carrier gas and 1 µL of liquid samples was injected. The GC injection port temperature was set to 250 °C and a programed-temperature gradient was used for the GC oven, starting at 80 °C, increasing the temperature at a rate of 18 °C min-1 up to 180 °C, and then keeping it constant for 15 min.
GC/ECD-FID analysis: The quantification of nCBs was carried out using an Agilent 6890 gas chromatograph (Santa Clara, CA, USA) with FID and ECD detectors. An HP-5MS column (30 m × 0.25 mm ID × 0.25 µm) was also used. The same conditions as for the gas GC/MSD analysis (carrier gas, injector temperature, and oven program) were selected. The output flow of the capillary column was split (1:1), using FID and ECD detectors simultaneously. More details of the experimental procedure can be found elsewhere [18].
The concentration of hydrogen peroxide was determined by colorimetric titration with a BOECO S-20 UV–Vis (Hamburg, Germany) spectrophotometer at 410 nm (Eisenberg, 1943), while the pH evolution was measured using a Basic 20-CRISON pH (Barcelona, Spain) electrode. Ionic compounds such as carboxylic acids, nitrate, and chloride, coming from the oxidation of the starting compounds, were measured by ion chromatography (Metrohm 761 Compact IC, Gallen, Suiza) with anionic chemical suppression and a conductivity detector. A Metrosep (Gallen, Suiza) A SUPP5 5-250 column (25 cm length, 4 mm diameter) was used as stationary phase and an aqueous solution (0.7 mL min−1) of Na2CO3 (3.2 mM) and NaHCO3 (1 mM) as the mobile phase.
The total iron content in the aqueous solution was measured by spectroscopy of atomic emission (AES MP-4100 Agilent Technology, Santa Clara, CA, USA). Aqueous solutions with different concentration of ferric sulfate (Sigma-Aldrich Darmstadt, Germany) were measured at a weight length of 259.94 nm, a nebulizer pressure of 100 kPa, and a viewing position of 10 to calibrate.
The specific surface area (SBET) value of the fresh catalyst was obtained from the N2 adsorption/desorption isotherm at 77 K using a Micromeritics Tristar (Norcross, GA, USA) apparatus with the sample previously outgassed overnight at 150 °C to a reduced pressure <10−3 torr in order to ensure a dry clean surface.
The HA concentration in the aqueous phase was determined by derivatization of this compound with cyclohexanone. Cyclohexanone reacts with HA in the aqueous phase to produce cyclohexanone oxime, which was quantified by GC/FID. The reaction was carried out adding 1.5 g of cyclohexanone to 3 mL of the aqueous phase. After 15 min of reaction time at 40 °C, the cyclohexanone oxime formed was quantified in the organic phase, composed of the non-reacted cyclohexanone and the cyclohexanone oxime, by GC/FID. To do this, a calibration curve using different concentrations of HA in water was previously accomplished.
4. Conclusions
It has been probed that goethite is an effective and stable catalyst in the CWPO of several COCs such as chlorobenzene, di, tri and tetrachlorobenzene isomers at room conditions. These chlorinated compounds are common pollutants found in aqueous phase because they are often used in the manufacture of a high number of chemicals.
It was confirmed that the addition of hydroxylamine (as hydroxylammonium sulfate) greatly enhances the chlorobenzenes conversion with time. This can be explained because hydroxylamine reduces Fe (III) in the goethite surface to Fe (II) and the reduced iron catalyzes faster (than Fe (III)) than the decomposition of hydrogen peroxide, yielding hydroxyl radicals. On the other hand, hydroxylamine competes with the pollutants for the oxidant and its consumption slows down the iron redox cycle and therefore, the pollutant removal rate. The only byproduct detected from hydroxylamine oxidation at the condition tested was nitrate ion.
The oxidation of COCs (around 90% at the selected conditions: 2.4 mM of HA, 10 times the stoichiometric H2O2 amount, 2.5 h) results in their dehalogenation (confirmed by the chlorine balance) and only short chain organic acids (mainly acetic acid) were detected as oxidation byproducts, meaning that this treatment leads to the detoxification of the polluted water. The oxidation rate follows the subsequent order: CBs > DCBs >> TCBS = TetraCBs, the catalyst not being regioselective. A positive effect of hydrogen peroxide and hydroxylamine concentrations on the reaction rate, and an optimal value of catalyst concentration (0.5 g L−1) was found.
Author Contributions
A.S. and A.R. achieved the funding acquisition for this study, A.S. and C.M.D. made intellectual contributions, especially with the conceptualization and the methodology used. D.L. conceived and performed the experiments and wrote the original draft. All the authors have been also involved in drafting and revising the manuscript, so that everyone has given final approval of the current version to be published in Catalysts Journal.
Funding
This research received no external funding.
Acknowledgements
This work was supported by Regional Government of Madrid, project CARESOIL (S2018/EMT-4317), and from the Spanish Ministry of Economy, Industry and Competitiveness, projects CTM2016-77151-C2-1-R.
Conflicts of Interest
The authors declare no conflict of interest.
Notation
Acronyms
1,2 DCB = 1,2-dicholorbenzene
1,2,3 TCB = 1,2,3-tricholorbenzene
1,2,4 TCB = 1,2,4-tricholorbenzene
1,3 DCB = 1,3-dicholorbenzene
1,4 DCB = 1,4-dicholorbenzene
AOPs = Advanced oxidation processes
AES = atomic emission spectroscopy
B# = number of blank experiments
CB = monochlorobenzene
= chloride
COCs = chlorinated organic compounds
CWPO = catalytic wet peroxide oxidation
FID = flame ionization detector
GC = gas chromatography
GOE = goethite
HA = hydroxylamine
HCHs = hexachlorocyclohexanes
IC = ion chromatography
MS = mass spectrometry detector
nCBS = chlorobenzenes (n = mono, di, tri, tetra)
POPs = persistent organic compounds
S# = number of experiments using spiked water
TetraCB-a = tetrachlorobenzenes-a
TetraCB-b = tetrachlorobenzenes-b
Symbols
Cj = concentration of compound j, mM
n = number of clorines in nCBS
P = pressure, bar
= specific surface area
T = temperature, °C
t = time, min or h
V = adsorbed volume,
Xj = conversion compound j
Yj = yield compound j
Subscripts
0 = initial
j = compounds
Superscripts
St = stoichiometric
References
- Weber, R.; Watson, A.; Forter, M.; Oliaei, F. Persistent organic pollutants and landfills—A review of past experiences and future challenges. Waste Manag. Res. 2011, 29, 107–121. [Google Scholar] [CrossRef] [PubMed]
- Schulze, S.; Zahn, D.; Montes, R.; Rodil, R.; Quintana, J.B.; Knepper, T.P.; Reemtsma, T.; Berger, U. Occurrence of emerging persistent and mobile organic contaminants in European water samples. Water Res. 2019, 153, 80–90. [Google Scholar] [CrossRef]
- Li, Z.J.; Jennings, A. Worldwide Regulations of Standard Values of Pesticides for Human Health Risk Control: A Review. Int. J. Environ. Res. Public Health 2017, 14, 826. [Google Scholar] [CrossRef] [PubMed]
- Kumar, R.; Mukherji, S. Threat Posed by Persistent Organochlorine Pesticides and their Mobility in the Environment. Curr. Org. Chem. 2018, 22, 954–972. [Google Scholar] [CrossRef]
- Weber, R.; Gaus, C.; Tysklind, M.; Johnston, P.; Forter, M.; Hollert, H.; Heinisch, E.; Holoubek, I.; Lloyd-Smith, M.; Masunaga, S.; et al. Dioxin- and POP-contaminated sites-contemporary and future relevance and challenges. Enviro. Sci. Pollut. Res. 2008, 15, 363–393. [Google Scholar] [CrossRef]
- Moeck, C.; Radny, D.; Huggenberger, P.; Affolter, A.; Auckenthaler, A.; Hollender, J.; Berg, M.; Schirmer, M. Spatial distribution of anthropogenic inputs into groundwater: A case study. Grundwasser 2018, 23, 297–309. [Google Scholar] [CrossRef]
- Pirsaheb, M.; Hossini, H.; Asadi, F.; Janjani, H. A systematic review on organochlorine and organophosphorus pesticides content in water resources. Toxin Rev. 2017, 36, 210–221. [Google Scholar] [CrossRef]
- Wang, M.J.; Jones, K.C. Behavior and fate of chlorobenzenes (cbs) introduced into soil-plant systems by sewage-sludge application—A review. Chemosphere 1994, 28, 1325–1360. [Google Scholar] [CrossRef]
- van Wijk, D.; Cohet, E.; Gard, A.; Caspers, N.; van Ginkel, C.; Thompson, R.; de Rooij, C.; Garny, V.; Lecloux, A. 1,2,4-trichlorobenzene marine risk assessment with special emphasis on the Osparcom region North Sea. Chemosphere 2006, 62, 1294–1310. [Google Scholar] [CrossRef]
- Djohan, D.; Yu, Q.; Connell, D.W. Partition isotherms of chlorobenzenes in a sediment-water system. Water Air Soil Pollut. 2005, 161, 157–173. [Google Scholar] [CrossRef]
- Lecloux, A.J. Scientific activities of Euro Chlor in monitoring and assessing naturally and man-made organohalogens. Chemosphere 2003, 52, 521–529. [Google Scholar] [CrossRef]
- Van Wijk, D.; Thompson, R.S.; De Rooij, C.; Garny, V.; Lecloux, A.; Kanne, R. 1,2-Dichlorobenzene marine risk assessment with special reference to the OSPARCOM region: North Sea. Environ. Monit. Assess. 2004, 97, 87–102. [Google Scholar] [CrossRef] [PubMed]
- Boutonnet, J.C.; Thompson, R.S.; De Rooij, C.; Garny, V.; Lecloux, A.; Van Wijk, D. 1,4-Dichlorobenzene marine risk assessment with special reference to the OSPARCOM region: North Sea. Environ. Monit. Assess. 2004, 97, 103–117. [Google Scholar] [CrossRef] [PubMed]
- Van Wijk, D.; Thompson, R.S.; De Rooij, C.; Garny, V.; Lecloux, A.; Kanne, R. Monochlorobenzene Marine Risk Assessment with Special Reference to the Osparcom Region: North Sea. Environ. Monit. Assess. 2004, 97, 69–86. [Google Scholar] [CrossRef] [PubMed]
- Schroll, R.; Brahushi, F.; Dörfler, U.; Kühn, S.; Fekete, J.; Munch, J.C. Biomineralisation of 1,2,4-trichlorobenzene in soils by an adapted microbial population. Environ. Pollut. 2004, 127, 395–401. [Google Scholar] [CrossRef]
- Li, J.-H.; Sun, X.-F.; Yao, Z.-T.; Zhao, X.-Y. Remediation of 1,2,3-trichlorobenzene contaminated soil using a combined thermal desorption–molten salt oxidation reactor system. Chemosphere 2014, 97, 125–129. [Google Scholar] [CrossRef]
- Zhang, T.; Li, X.; Min, X.; Fang, T.; Zhang, Z.; Yang, L.; Liu, P. Acute toxicity of chlorobenzenes in Tetrahymena: Estimated by microcalorimetry and mechanism. Environ. Toxicol. Pharmacol. 2012, 33, 377–385. [Google Scholar] [CrossRef]
- Santos, A.; Fernandez, J.; Guadaño, J.; Lorenzo, D.; Romero, A. Chlorinated organic compounds in liquid wastes (DNAPL) from lindane production dumped in landfills in Sabiñanigo (Spain). Environ. Pollut. 2018, 242, 1616–1624. [Google Scholar] [CrossRef]
- Mercado, D.F.; Weiss, R.G. Polydimethylsiloxane as a Matrix for the Stabilization and Immobilization of Zero-Valent Iron Nanoparticles. Applications to Dehalogenation of Environmentally Deleterious Molecules. J. Braz. Chem. Soc. 2018, 29, 1427–1439. [Google Scholar] [CrossRef]
- Wan, X.; Liu, Y.; Chai, X.-S.; Li, Y.; Guo, C. A quint-wavelength UV spectroscopy for simultaneous determination of dichlorobenzene, chlorobenzene, and benzene in simulated water reduced by nanoscale zero-valent Fe/Ni bimetal. Spectrochimica Acta Part a-Molecular and Biomolecular Spectroscopy 2017, 181, 55–59. [Google Scholar] [CrossRef]
- Zhang, X.; Wu, Y.Q. Application of coupled zero-valent iron/biochar system for degradation of chlorobenzene-contaminated groundwater. Water Sci. Technol. 2017, 75, 571–580. [Google Scholar] [CrossRef]
- Dominguez, C.M.; Romero, A.; Fernandez, J.; Santos, A. In situ chemical reduction of chlorinated organic compounds from lindane production wastes by zero valent iron microparticles. J. Water Process Eng. 2018, in press. [Google Scholar] [CrossRef]
- Lhotský, O.; Krákorová, E.; Mašín, P.; Žebrák, R.; Linhartová, L.; Křesinová, Z.; Kašlík, J.; Steinová, J.; Rødsand, T.; Filipová, A.; et al. Pharmaceuticals, benzene, toluene and chlorobenzene removal from contaminated groundwater by combined UV/H2O2 photo-oxidation and aeration. Water Res. 2017, 120, 245–255. [Google Scholar] [CrossRef] [PubMed]
- Saharan, V.K.; Pinjari, D.V.; Gogate, P.R.; Pandit, A.B. Chapter 3—Advanced Oxidation Technologies for Wastewater Treatment: An Overview. In Industrial Wastewater Treatment, Recycling and Reuse; Ranade, V.V., Bhandari, V.M., Eds.; Butterworth-Heinemann: Oxford, UK, 2014; pp. 141–191. [Google Scholar]
- Dilmeghani, M.; Zahir, K.O. Kinetics and mechanism of chlorobenzene degradation in aqueous samples using advanced oxidation processes. J. Environ. Qual. 2001, 30, 2062–2070. [Google Scholar] [CrossRef] [PubMed]
- Santos, A.; Fernandez, J.; Rodriguez, S.; Dominguez, C.M.; Lominchar, M.A.; Lorenzo, D.; Romero, A. Abatement of chlorinated compounds in groundwater contaminated by HCH wastes using ISCO with alkali activated persulfate. Sci. Total Environ. 2018, 615, 1070–1077. [Google Scholar] [CrossRef] [PubMed]
- Sedlak, D.L.; Andren, A.W. Oxidation of chlorobenzene with Fenton’s reagent. Environ. Sci. Technol. 1991, 25, 777–782. [Google Scholar] [CrossRef]
- Pagano, M.; Volpe, A.; Lopez, A.; Mascolo, G.; Ciannarella, R. Degradation of chlorobenzene by Fenton-like processes using zero-valent iron in the presence of Fe3+ and Cu2+. Environ. Technol. 2011, 32, 155–165. [Google Scholar] [CrossRef] [PubMed]
- Kuang, Y.; Wang, Q.P.; Chen, Z.L.; Megharaj, M.; Naidu, R. Heterogeneous Fenton-like oxidation of monochlorobenzene using green synthesis of iron nanoparticles. J. Colloid Interface Sci. 2013, 410, 67–73. [Google Scholar] [CrossRef] [PubMed]
- Santos, A.; Rodríguez, S.; Pardo, F.; Romero, A. Use of Fenton reagent combined with humic acids for the removal of PFOA from contaminated water. Sci. Total Environ. 2016, 563–564, 657–663. [Google Scholar] [CrossRef]
- Karthikeyan, S.; Boopathy, R.; Gupta, V.K.; Sekaran, G. Preparation, characterizations and its application of heterogeneous Fenton catalyst for the treatment of synthetic phenol solution. J. Mol. Liq. 2013, 177, 402–408. [Google Scholar] [CrossRef]
- Hou, X.; Huang, X.; Jia, F.; Ai, Z.; Zhao, J.; Zhang, L. Hydroxylamine Promoted Goethite Surface Fenton Degradation of Organic Pollutants. Environ. Sci. Technol. 2017, 51, 5118–5126. [Google Scholar] [CrossRef] [PubMed]
- Neyens, E.; Baeyens, J. A review of classic Fenton’s peroxidation as an advanced oxidation technique. J. Hazard. Mater. 2003, 98, 33–50. [Google Scholar] [CrossRef]
- Munoz, M.; Domínguez, P.; de Pedro, Z.M.; Casas, J.A.; Rodriguez, J.J. Naturally-occurring iron minerals as inexpensive catalysts for CWPO. Appl. Catal. B Environ. 2017, 203, 166–173. [Google Scholar] [CrossRef] [Green Version]
- Baloyi, J.; Ntho, T.; Moma, J. Synthesis and application of pillared clay heterogeneous catalysts for wastewater treatment: A review. RSC Adv. 2018, 8, 5197–5211. [Google Scholar] [CrossRef]
- Ren, M.; Qian, X.F.; Fang, M.Y.; Yue, D.T.; Zhao, Y.X. Ferric (hydr)oxide/mesoporous carbon composites as Fenton-like catalysts for degradation of phenol. Res. Chem. Intermed. 2018, 44, 4103–4117. [Google Scholar] [CrossRef]
- Wang, H.; Jiang, H.; Wang, S.; Shi, W.B.; He, J.C.; Liu, H.; Huang, Y.M. Fe3O4-MWCNT magnetic nanocomposites as efficient peroxidase mimic catalysts in a Fenton-like reaction for water purification without pH limitation. RSC Adv. 2014, 4, 45809–45815. [Google Scholar] [CrossRef]
- Watts, R.J.; Jones, A.P.; Chen, P.H.; Kenny, A. Mineral-catalyzed Fenton-like oxidation of sorbed chlorobenzenes. Water Environ. Res. 1997, 69, 269–275. [Google Scholar] [CrossRef]
- Kwan, W.P.; Voelker, B.M. Rates of hydroxyl radical generation and organic compound oxidation in mineral-catalyzed Fenton-like systems. Environ. Sci. Technol. 2003, 37, 1150–1158. [Google Scholar] [CrossRef]
- Chen, L.W.; Huang, Y.M.; Zhang, J.; Wu, B.C.; Wang, P. Enhancement on Fenton system by N-substituted hydroxylamines. Abstr. Pap. Am. Chem. Soc. 2016, 252, 1155. [Google Scholar]
- Chen, L.W.; Ma, J.; Li, X.C.; Guan, Y.H. Effect of common cations, anions and organics on the Fenton-hydroxylamine system. Abstr. Pap. Am. Chem. Soc. 2012, 243, 1155. [Google Scholar]
- Chen, L.W.; Ma, J.; Li, X.C.; Zhang, J.; Fang, J.Y.; Guan, Y.H.; Xie, P.C. Strong Enhancement on Fenton Oxidation by Addition of Hydroxylamine to Accelerate the Ferric and Ferrous Iron Cycles. Environ. Sci. Technol. 2011, 45, 3925–3930. [Google Scholar] [CrossRef] [PubMed]
- Fayazi, M.; Taher, M.A.; Afzali, D.; Mostafavi, A. Enhanced Fenton-like degradation of methylene blue by magnetically activated carbon/hydrogen peroxide with hydroxylamine as Fenton enhancer. J. Mol. Liq. 2016, 216, 781–787. [Google Scholar] [CrossRef]
- Ding, Y.B.; Huang, W.; Ding, Z.Q.; Nie, G.; Tang, H.Q. Dramatically enhanced Fenton oxidation of carbamazepine with easily recyclable microscaled CuFeO2 by hydroxylamine: Kinetic and mechanism study. Sep. Purif. Technol. 2016, 168, 223–231. [Google Scholar] [CrossRef]
- Bengtsson, G.; Fronæus, S.; Bengtsson-Kloo, L. The kinetics and mechanism of oxidation of hydroxylamine by iron(iii). J. Chem. Soc. Dalton Trans. 2002, 2548–2552. [Google Scholar] [CrossRef]
- Dominguez, C.M.; Oturan, N.; Romero, A.; Santos, A.; Oturan, M.A. Lindane degradation by electrooxidation process: effect of electrode materials on oxidation and mineralization kinetics. Water Res. 2018, 35, 220–230. [Google Scholar] [CrossRef] [PubMed]
- Han, D.H.; Wan, J.Q.; Ma, Y.W.; Wang, Y.; Huang, M.Z.; Chen, Y.M.; Li, D.Y.; Guan, Z.Y.; Li, Y. Enhanced decolorization of Orange G in a Fe(II)-EDDS activated persulfate process by accelerating the regeneration of ferrous iron with hydroxylamine. Chem. Eng. J. 2014, 256, 316–323. [Google Scholar] [CrossRef]
- Dominguez, C.M.; Romero, A.; Santos, A. Improved Etherification of Glycerol with Tert-Butyl Alcohol by the Addition of Dibutyl Ether as Solvent. Catalysts 2019, 9, 378. [Google Scholar] [CrossRef]
- Fernández, J.; Arjol, M.; Cacho, C. POP-contaminated sites from HCH production in Sabiñánigo, Spain. Environ. Sci. Pollut. Res. 2013, 20, 1937–1950. [Google Scholar] [CrossRef]
- Cornell, R.M.; Schwertmann, U. The Iron Oxides: Structure, Properties, Reactions, Occurrences and Uses; John Wiley & Sons: Hoboken, NJ, USA, 2003. [Google Scholar]
- Wang, Y.; Gao, Y.; Chen, L.; Zhang, H. Goethite as an efficient heterogeneous Fenton catalyst for the degradation of methyl orange. Catal. Today 2015, 252, 107–112. [Google Scholar] [CrossRef]
- Liu, H.B.; Chen, T.H.; Frost, R.L. An overview of the role of goethite surfaces in the environment. Chemosphere 2014, 103, 1–11. [Google Scholar] [CrossRef]
Figure 1.
Hydroxylamine conversion in runs B2, B3, and B4 after 300 min of reaction time (, and , pH = 3).
Figure 1.
Hydroxylamine conversion in runs B2, B3, and B4 after 300 min of reaction time (, and , pH = 3).

Figure 2.
Hydroxylamine (HA) and hydrogen peroxide conversion vs. reaction time (run B4) (, and , pH = 3).
Figure 2.
Hydroxylamine (HA) and hydrogen peroxide conversion vs. reaction time (run B4) (, and , pH = 3).

Figure 3.
Nitrogen yield to nitrates in the oxidation of hydroxylamine (, and , pH = 3).

Figure 4.
Conversion of chlorobenzene vs. initial pH at 300 min using and , and .

Figure 5.
Remaining fractional chlorobenzene concentration ) vs. reaction time at pH0 = 3, and , at room temperature (controlled at 22 °C). Conversions obtained after addition of further aliquots of HA (+2.4 mM) in run S5 at 2.5 h are shown with open symbols.
Figure 5.
Remaining fractional chlorobenzene concentration ) vs. reaction time at pH0 = 3, and , at room temperature (controlled at 22 °C). Conversions obtained after addition of further aliquots of HA (+2.4 mM) in run S5 at 2.5 h are shown with open symbols.

Figure 6.
Remaining fractional concentration of (a) 1,2-dichlorobenzene ); (b) 1,3-dichlorobenzene ); and (c) 1,4-dichlorobenzene ) vs. reaction time at pH0 = 3, and , at room temperature (controlled at 22 °C). Conversions obtained after addition of further aliquots of HA (+2.4 mM) in run S5 at 2.5 h are shown with open symbols.

Figure 7.
Remaining fractional concentration of (a) 1,2,3-trichlorobenzene ); (b) 1,2,4-trichlorobenzene ); (c) tetrachlorobenzene-a ); (d) tetrachlorobenzene-b ) vs. reaction time at pH0 = 3, and , at room temperature (controlled at 22 °C). Conversions obtained after addition of further aliquots of HA (+2.4 mM) in run S5 at 2.5 h are shown with open symbols.

Figure 8.
Predicted and experimental chloride concentration vs. reaction time (run S5), at pH0 = 3 and , at room temperature (controlled at 22 °C).
Figure 8.
Predicted and experimental chloride concentration vs. reaction time (run S5), at pH0 = 3 and , at room temperature (controlled at 22 °C).

Figure 9.
Remaining fractional chlorobenzene concentration ) vs. reaction time using different doses of hydrogen peroxide in a range of 1–10 times the theoretical stoichiometric amount for the complete mineralization of the nCBs at pH0 = 3, , and , at room temperature (controlled at 22 °C).
Figure 9.
Remaining fractional chlorobenzene concentration ) vs. reaction time using different doses of hydrogen peroxide in a range of 1–10 times the theoretical stoichiometric amount for the complete mineralization of the nCBs at pH0 = 3, , and , at room temperature (controlled at 22 °C).

Figure 10.
Remaining fractional concentration of (a) 1,2-dichlorobenzene ); (b) 1,3-dichlorobenzene ); and (c) 1.4-dichlorobenzene ) vs. reaction time using different doses of hydrogen peroxide in a range of 1–10 times the theoretical stoichiometric amount for the complete mineralization of the CBs at pH0 = 3, , and , at room temperature (controlled at 22 °C).

Figure 11.
Remaining fractional concentration of (a) 1,2,3-trichlorobenzene ); (b) 1,2,4-trichlorobenzene ); (c) tetrachlorobenzene-a ); and (d) tetrachlorobenzene-b ) vs. reaction time using different doses of hydrogen peroxide in a range of 1–10 times the theoretical stoichiometric amount for the complete mineralization of the CHBs at pH0 = 3, , and , at room temperature (controlled at 22 °C).

Figure 12.
Remaining fractional chlorobenzene concentration ) at different goethite concentrations vs. reaction time at pH0 = 3, , at room temperature (controlled at 22 °C).
Figure 12.
Remaining fractional chlorobenzene concentration ) at different goethite concentrations vs. reaction time at pH0 = 3, , at room temperature (controlled at 22 °C).

Figure 13.
Remaining fractional concentration of (a) 1,2-dichlorobenzene ); (b) 1,3-dichlorobenzene ); and (c) 1,4-dichlorobenzene ) vs. reaction time at pH0 = 3, , at room temperature (controlled at 22 °C).
Figure 13.
Remaining fractional concentration of (a) 1,2-dichlorobenzene ); (b) 1,3-dichlorobenzene ); and (c) 1,4-dichlorobenzene ) vs. reaction time at pH0 = 3, , at room temperature (controlled at 22 °C).

Figure 14.
Remaining fractional concentration of (a) 1,2,3-trichlorobenzene ); (b) 1,2,4-trichlorobenzene ); (c) tetrachlorobenzene-a ); and (d) tetrachlorobenzene-b ) vs. reaction time at pH0 = 3, , at room temperature (controlled at 22 °C).
Figure 14.
Remaining fractional concentration of (a) 1,2,3-trichlorobenzene ); (b) 1,2,4-trichlorobenzene ); (c) tetrachlorobenzene-a ); and (d) tetrachlorobenzene-b ) vs. reaction time at pH0 = 3, , at room temperature (controlled at 22 °C).

Figure 15.
N2 adsorption–desorption isotherm of goethite at 77 K, used as a solid catalyst.


Table 1.
Experimental conditions of the runs carried out. Variables: initial concentration of hydroxylamine (), theoretical stoichiometric amount of hydrogen peroxide for the complete mineralization of the chlorobenzenes (nCBs; n = mono, di, tri, tetra). (), goethite concentration (), pH using either milliQ or spiked water with chlorinated organic compounds (COCs).
| pH0 | ∑COCs | ||||
|---|---|---|---|---|---|
| B1 a–g* | 0 | 0 | 0.5 | 1–7 | 0 |
| B2 | 2.4 | 0 | 0.5 | 3 | |
| B3 | 2.4 | 5 | 0 | 3 | |
| B4 | 2.4 | 5 | 0.5 | 3 | |
| S1 a, b, c | 2.4 | 5 | 0.5 | 7, 5, 2 | 31.73 |
| S2 | 0 | 5 | 0.5 | 3 | |
| S3 | 0.6 | 31.73 | |||
| S4 | 1.2 | ||||
| S5 | 2.4 | ||||
| S6 | 4.9 | ||||
| S7 | 2.4 | 1 | 0.5 | 3 | 31.73 |
| S8 | 10 | ||||
| S9 | 2.4 | 5 | 0.25 | 3 | 31.73 |
| S10 | 1 |
* A total of seven experiments were carried out in the run gathered as B1.
Table 2.
Initial concentration of chlorobenzene compounds (nCBs) in the spiked water.
| COCs | Chemical | Acronym | Initial Concentration | Initial Concentration | (mM) a |
|---|---|---|---|---|---|
| Formula | (mg L−1) | (mM) | |||
| chlorobenzene | C6H5Cl | CB | 16.29 | 0.145 | 2.030 |
| 1,3-dichlorobenzene | C6H4Cl2 | 1,3 DCB | 0.33 | 0.002 | 0.026 |
| 1,4-dichlorobenzene | C6H4Cl2 | 1,4 DCB | 4.77 | 0.032 | 0.416 |
| 1,2-dichlorobenzene | C6H4Cl2 | 1,2 DCB | 4.64 | 0.032 | 0.416 |
| 1,2,4-trichlorobenzene | C6H3Cl3 | 1,2,4 TCB | 3.86 | 0.021 | 0.252 |
| 1,2,3-trichlorobenzene | C6H3Cl3 | 1,2,3 TCB | 0.75 | 0.004 | 0.048 |
| 1,2,4,5 tetrachlorobenzene | C6H2Cl4 | TetraCB-a | 0.41 | 0.002 | 0.020 |
| 1,2,3,4 tetrachlorobenzene | C6H2Cl4 | TetraCB-b | 0.68 | 0.003 | 0.030 |
a Theoretical stoichiometric dosage of H2O2 required for the mineralization of each compound.
© 2019 by the authors. Licensee MDPI, Basel, Switzerland. This article is an open access article distributed under the terms and conditions of the Creative Commons Attribution (CC BY) license (http://creativecommons.org/licenses/by/4.0/).
Share and Cite
MDPI and ACS Style
Lorenzo, D.; Dominguez, C.M.; Romero, A.; Santos, A. Wet Peroxide Oxidation of Chlorobenzenes Catalyzed by Goethite and Promoted by Hydroxylamine. Catalysts 2019, 9, 553. https://0-doi-org.brum.beds.ac.uk/10.3390/catal9060553
AMA Style
Lorenzo D, Dominguez CM, Romero A, Santos A. Wet Peroxide Oxidation of Chlorobenzenes Catalyzed by Goethite and Promoted by Hydroxylamine. Catalysts. 2019; 9(6):553. https://0-doi-org.brum.beds.ac.uk/10.3390/catal9060553
Chicago/Turabian StyleLorenzo, David, Carmen M. Dominguez, Arturo Romero, and Aurora Santos. 2019. "Wet Peroxide Oxidation of Chlorobenzenes Catalyzed by Goethite and Promoted by Hydroxylamine" Catalysts 9, no. 6: 553. https://0-doi-org.brum.beds.ac.uk/10.3390/catal9060553
Note that from the first issue of 2016, this journal uses article numbers instead of page numbers. See further details here.