Enhanced Photocatalytic and Antibacterial Performance of ZnO Nanoparticles Prepared by an Efficient Thermolysis Method

 ,
,  ,
,
Abstract
:
1. Introduction
2. Results and Discussion
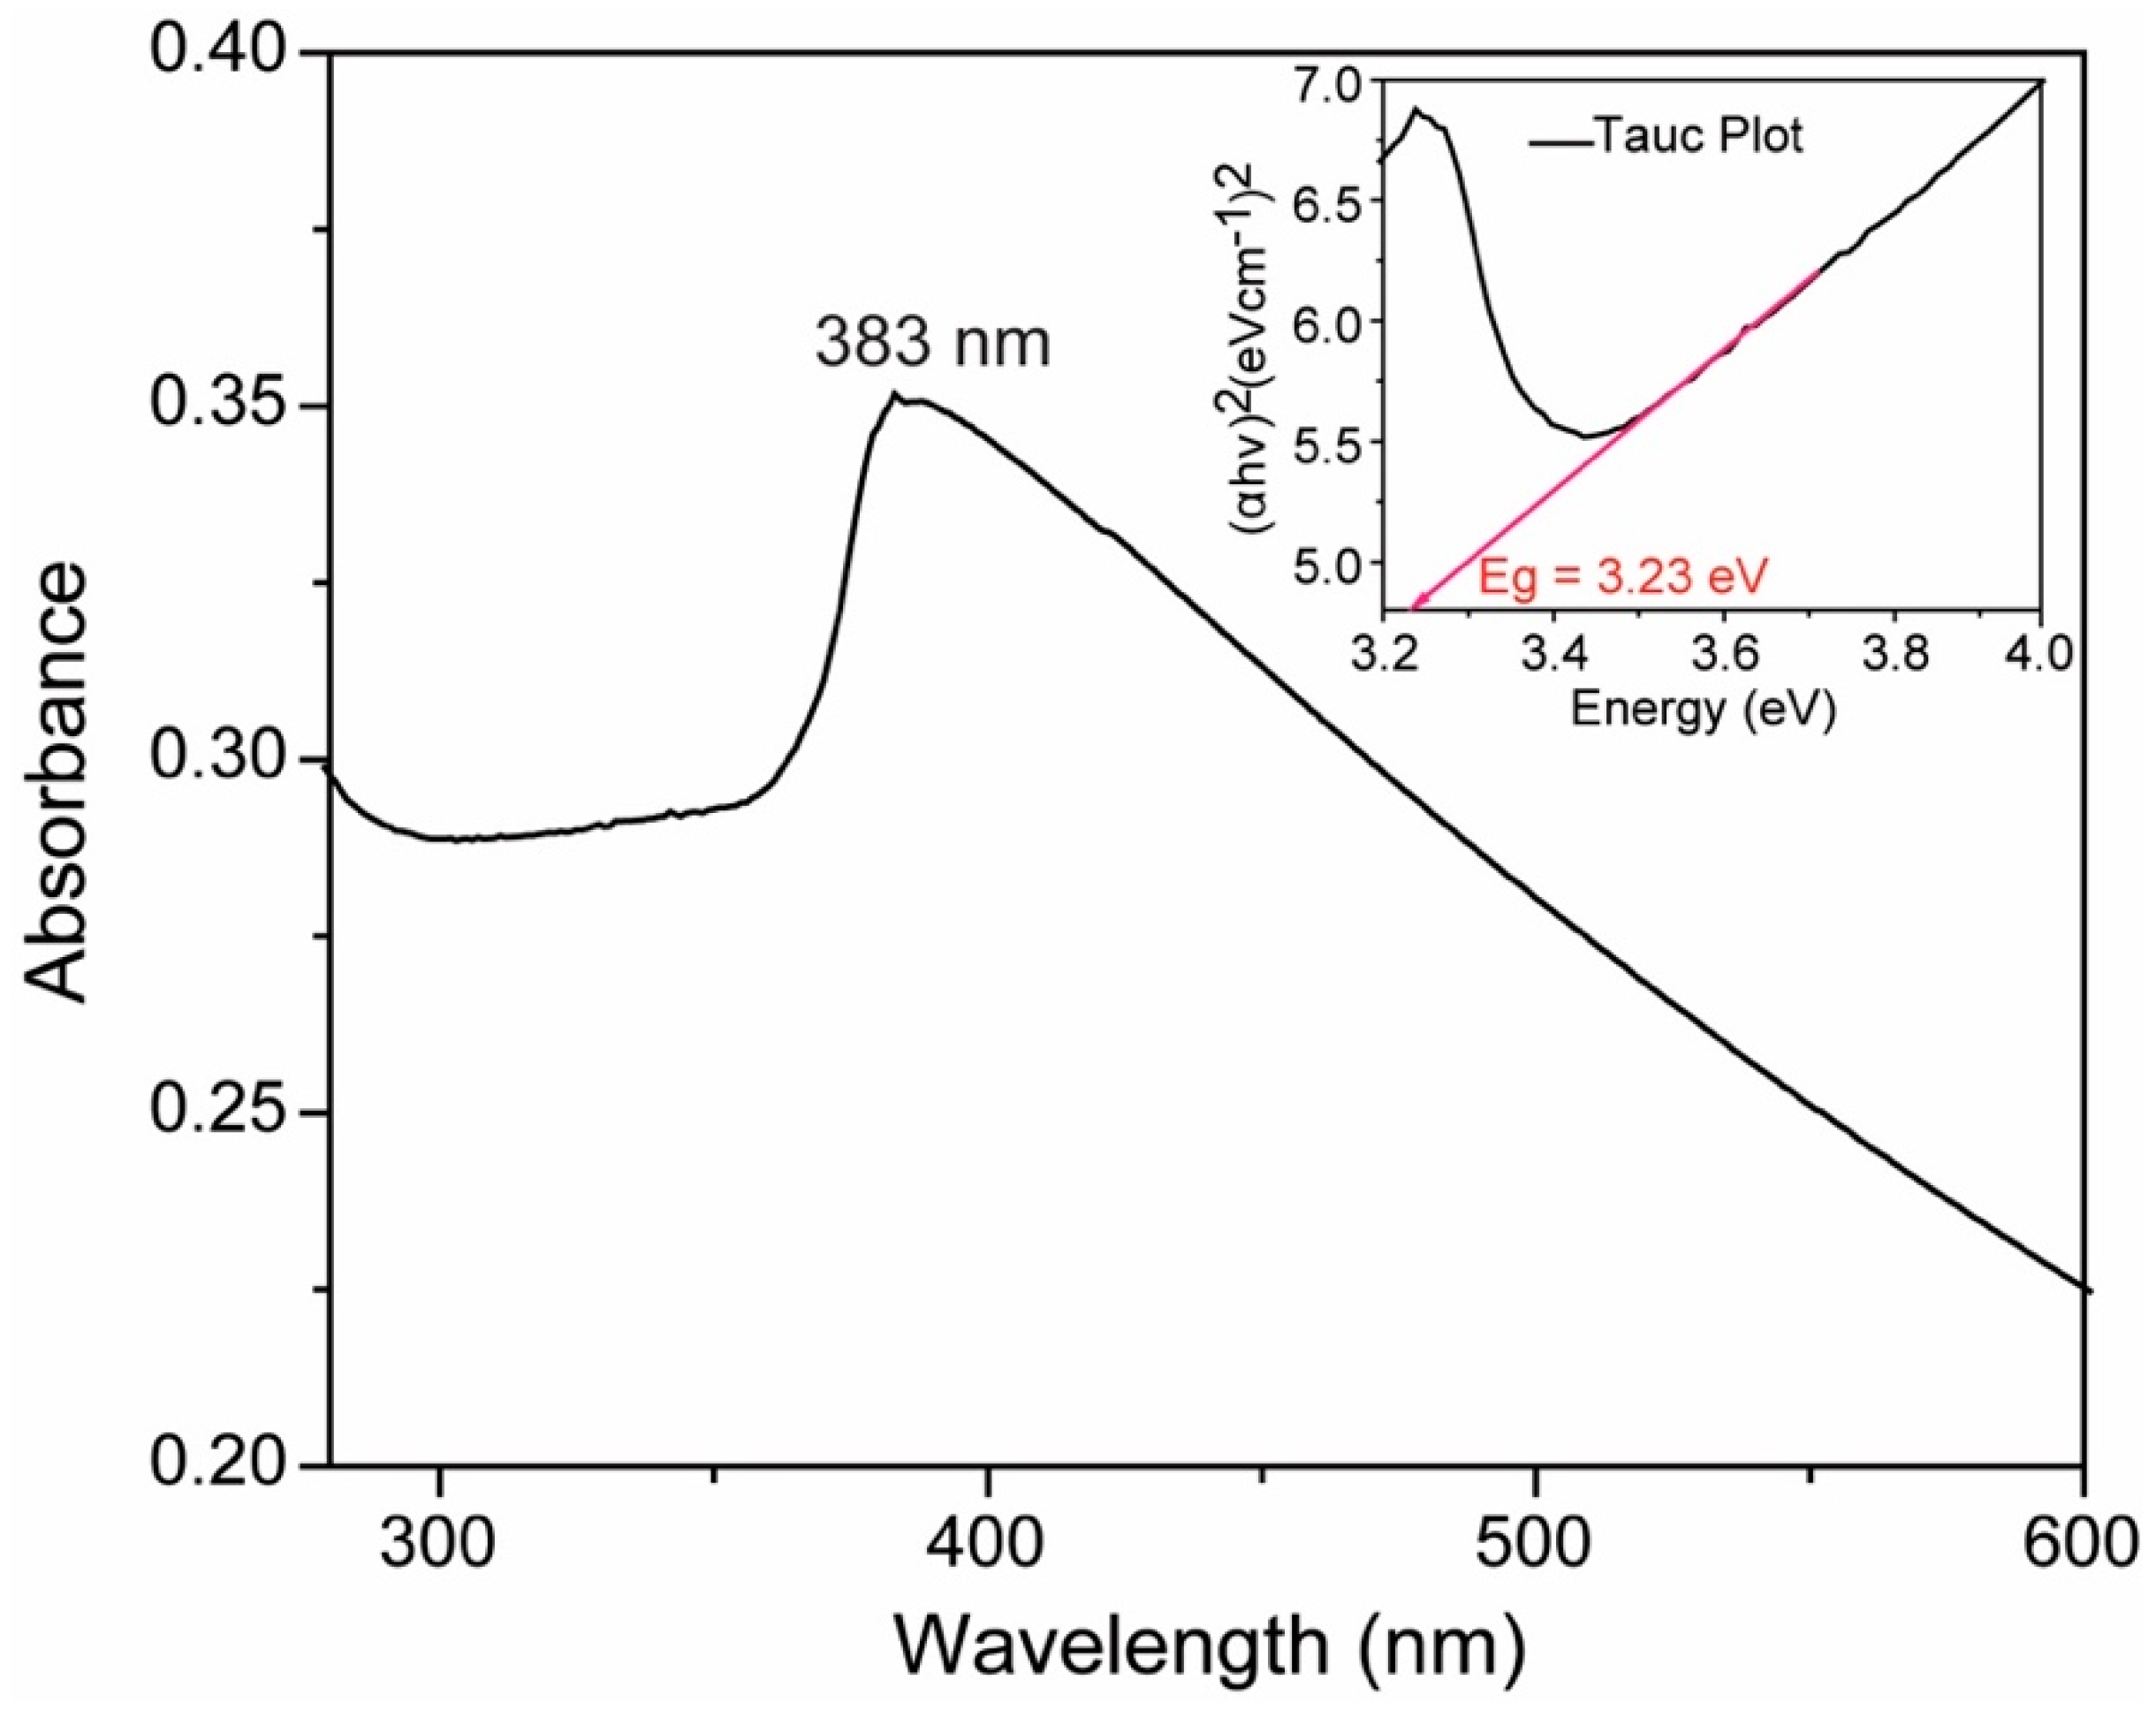
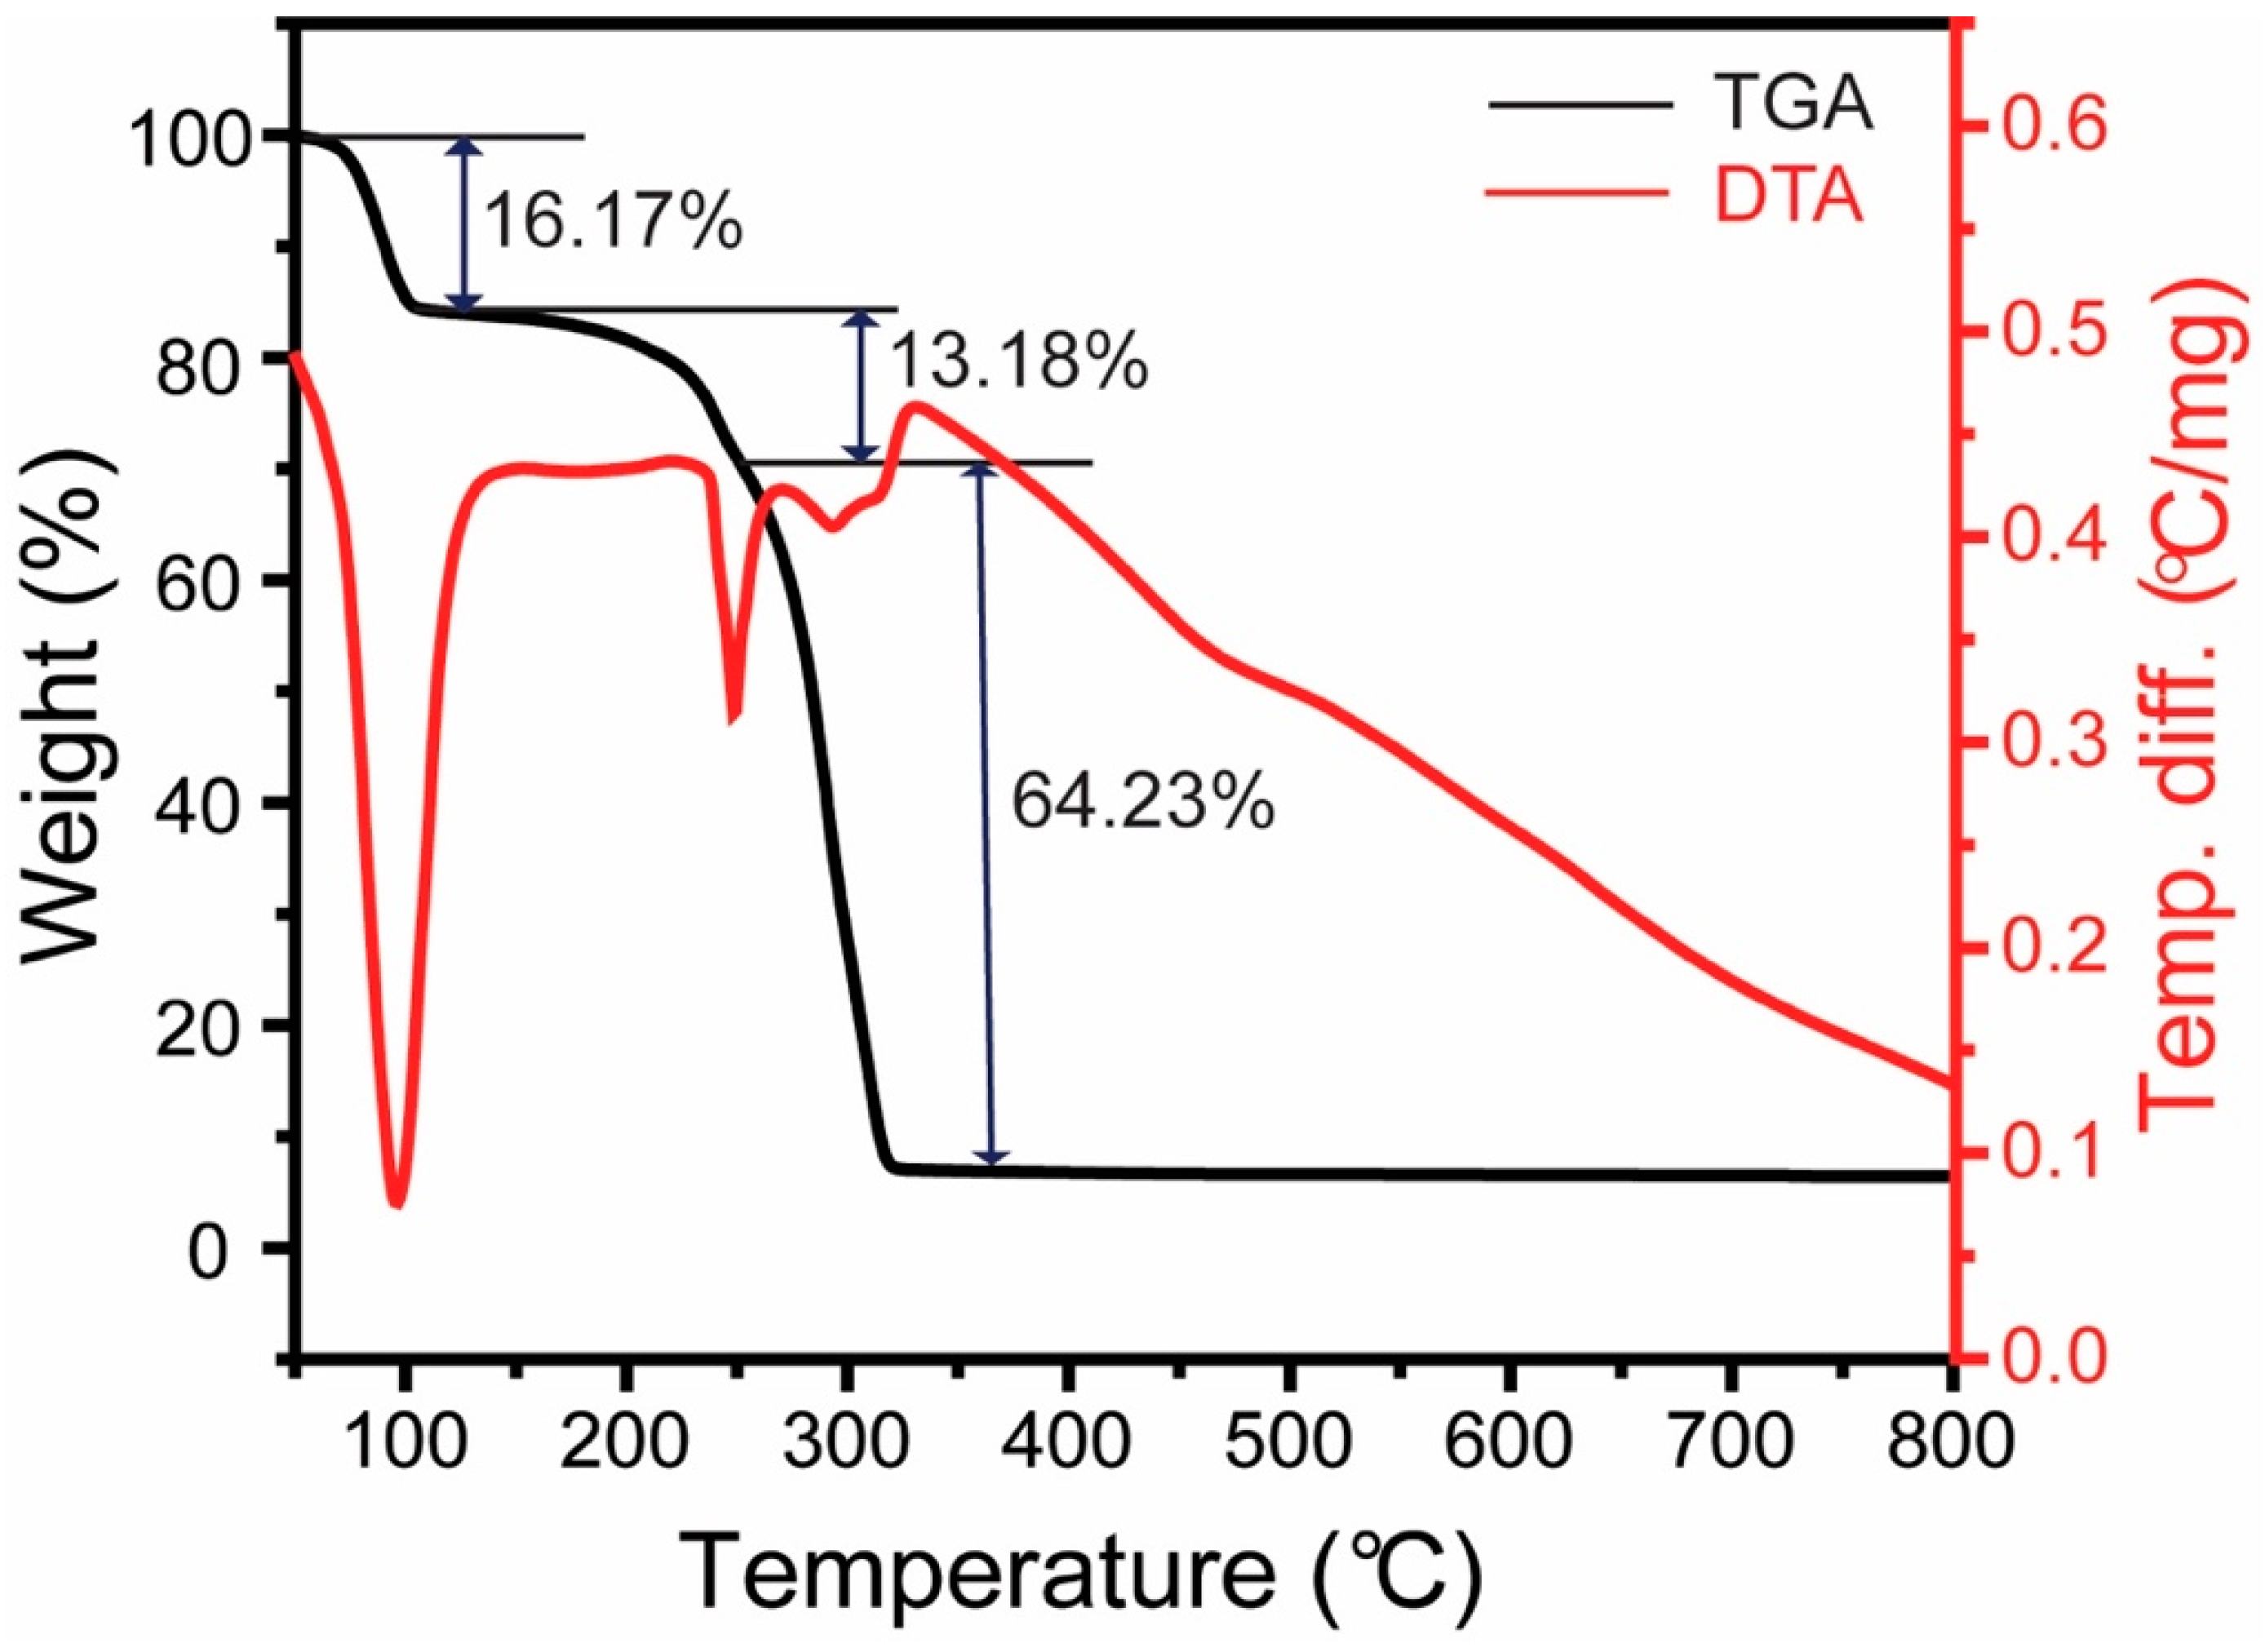
2.1. Structure, Morphology, and Composition of the Prepared ZnO-NPs
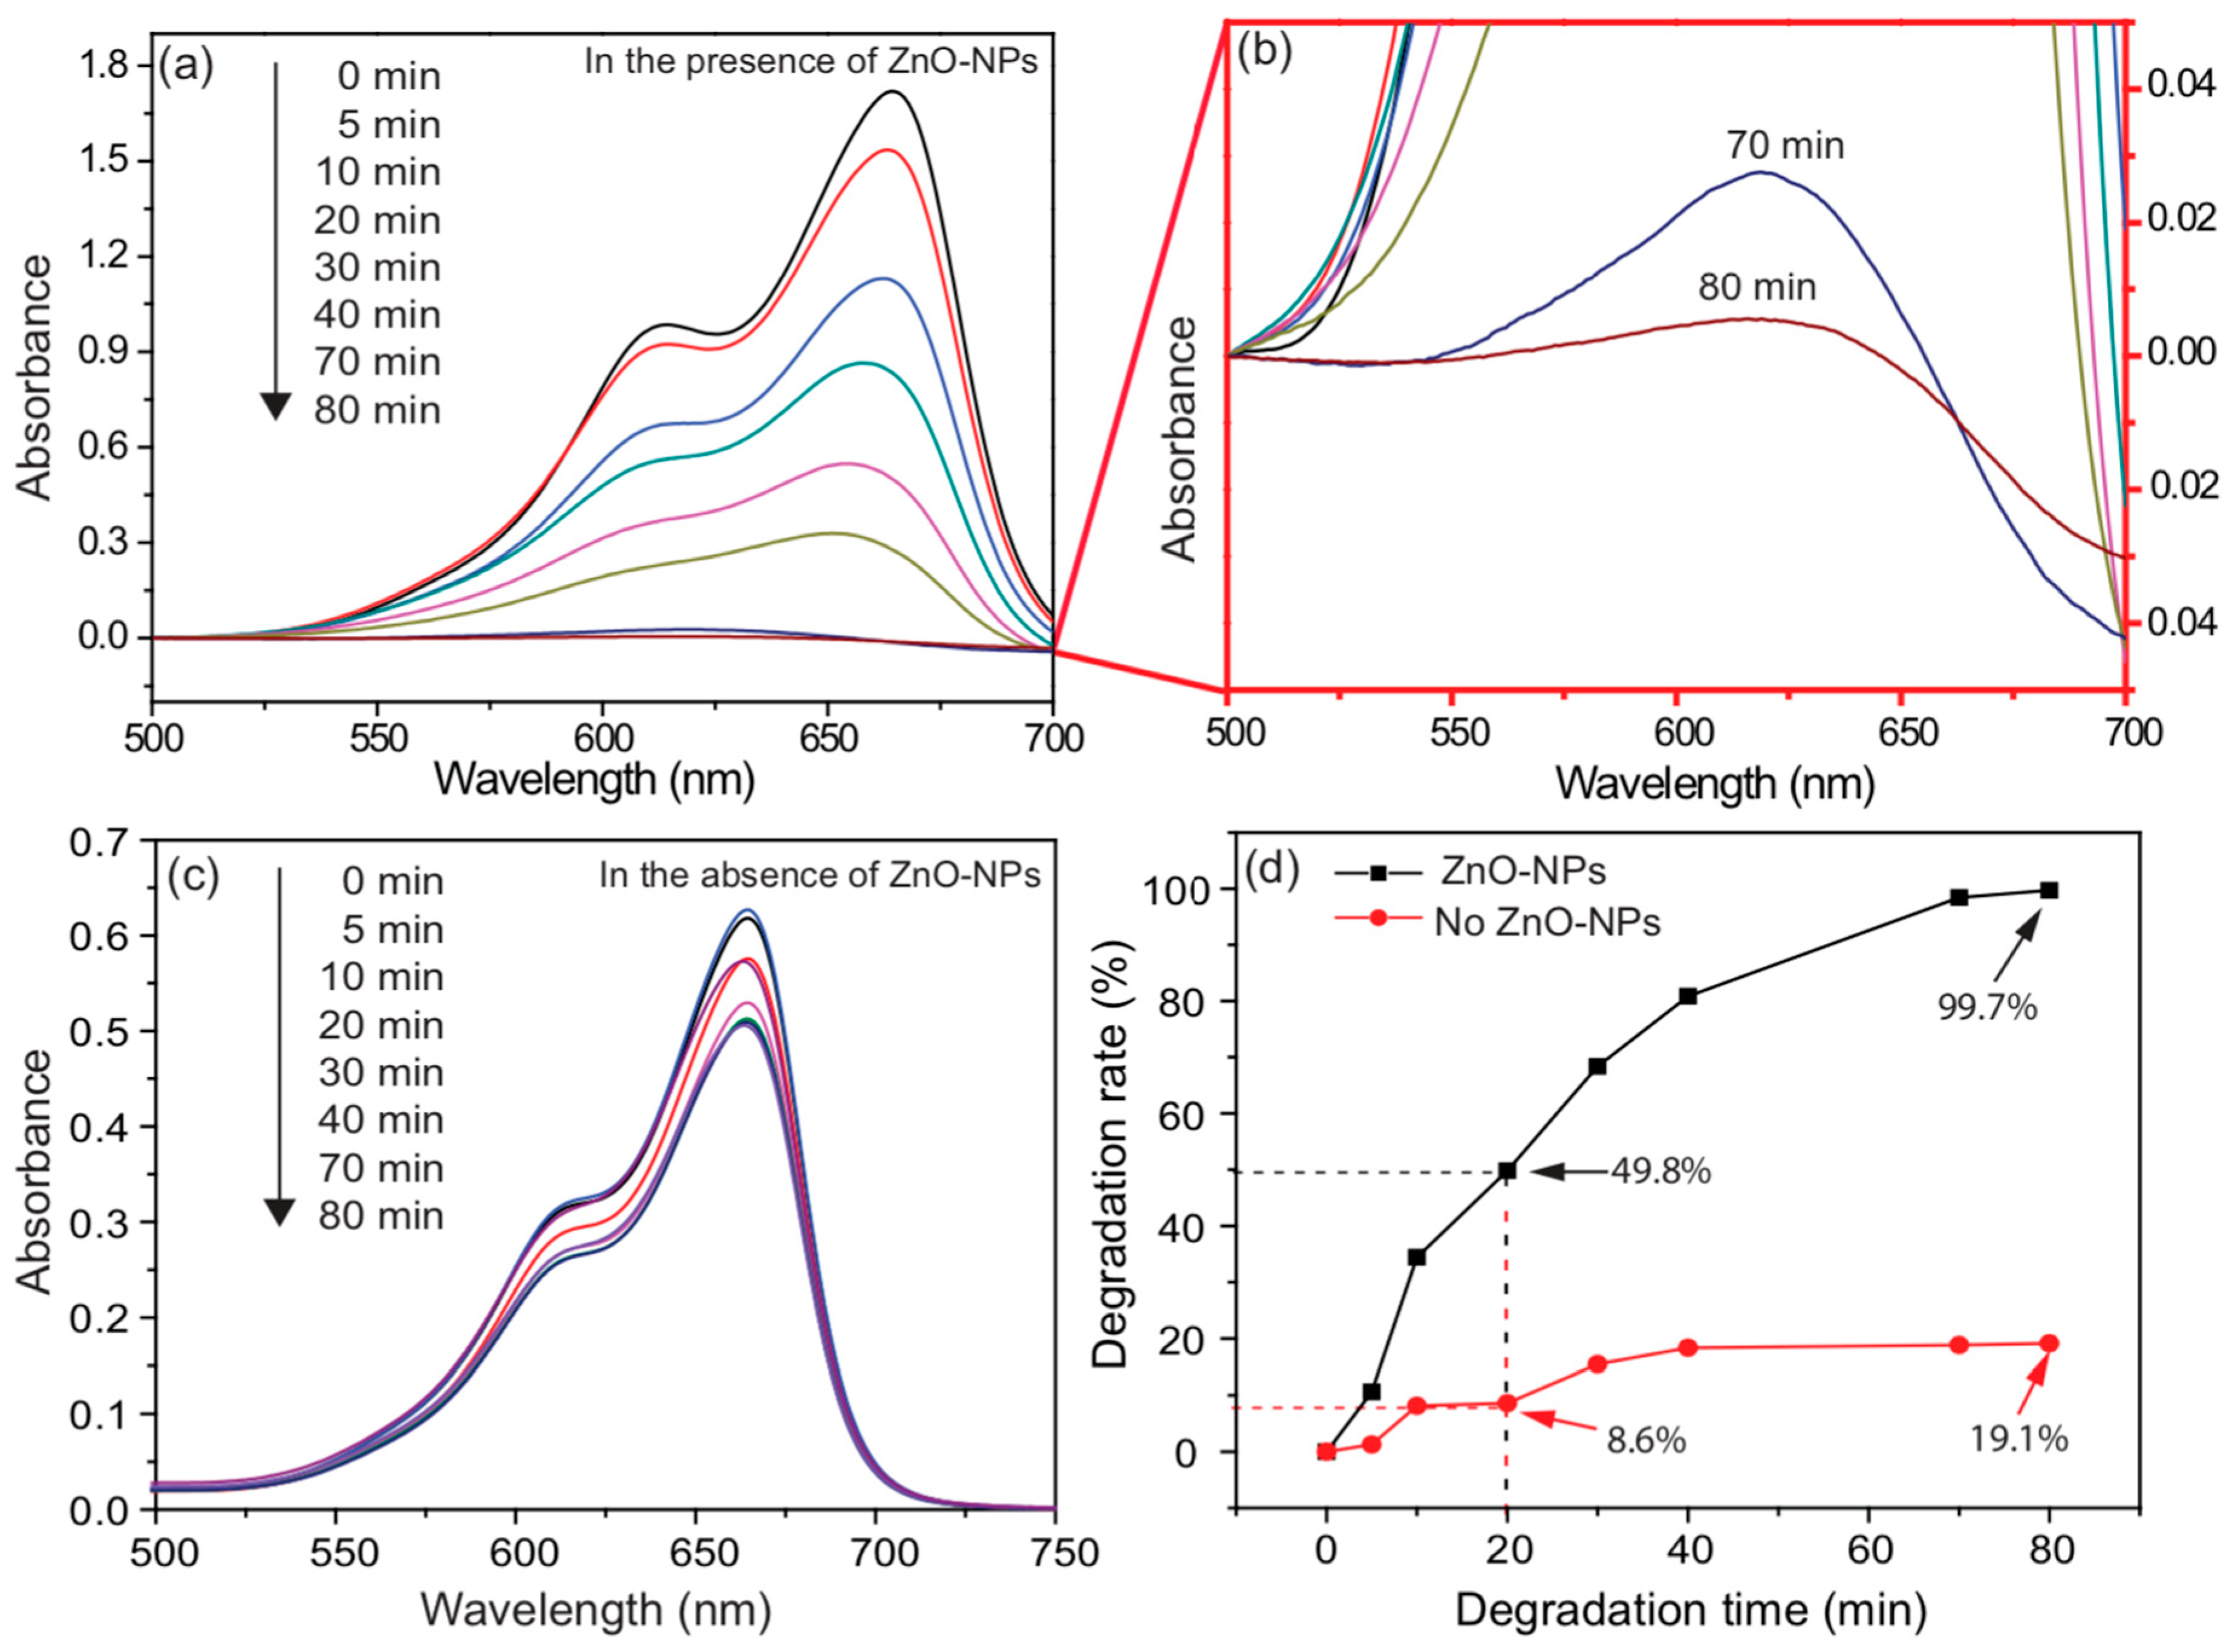
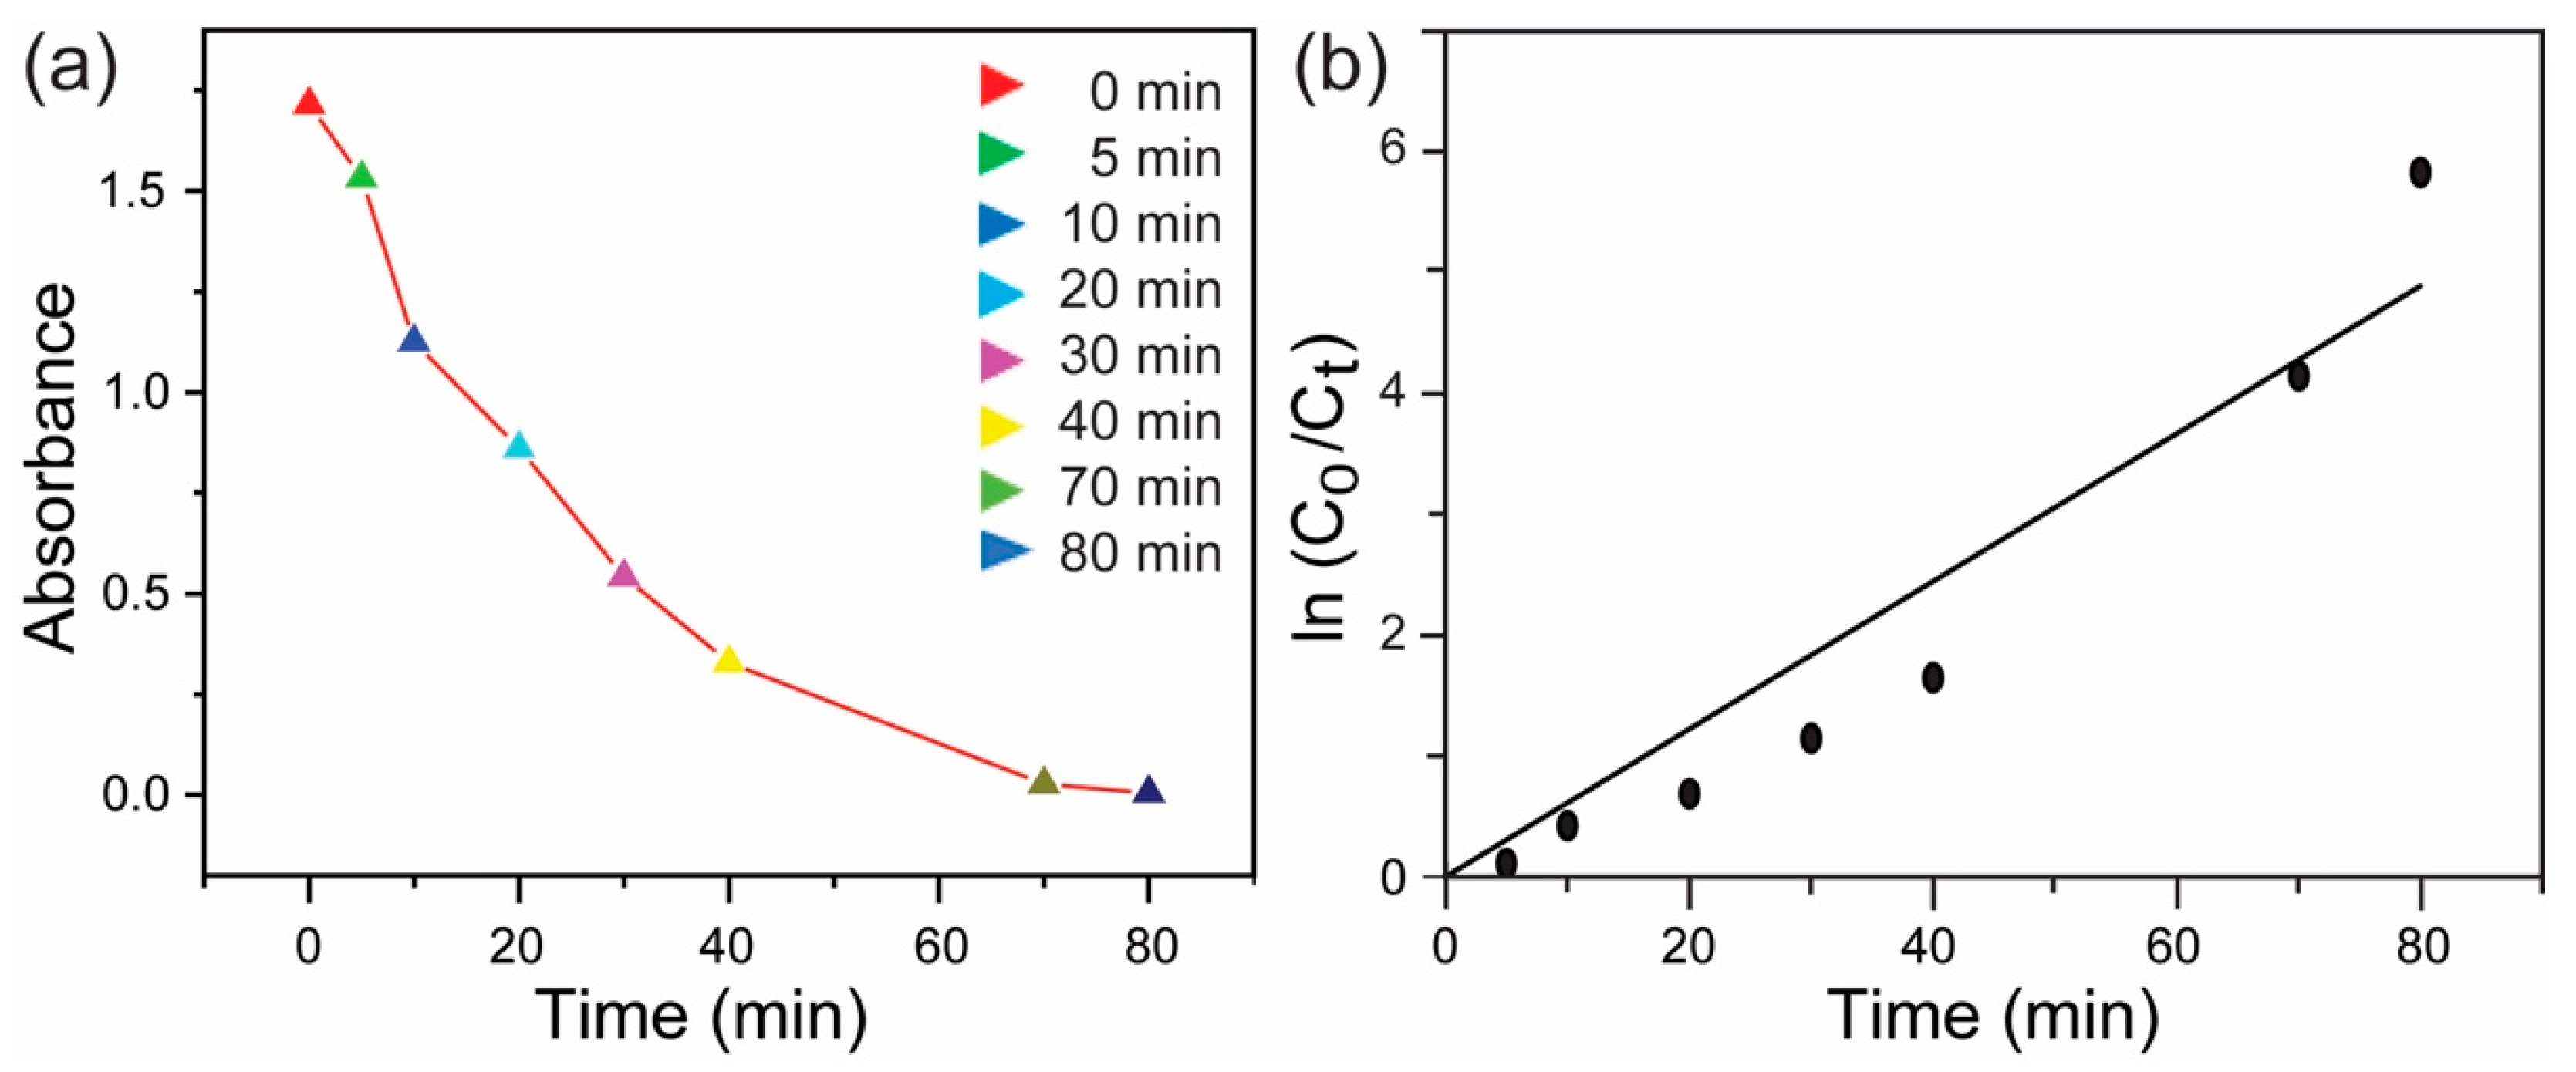
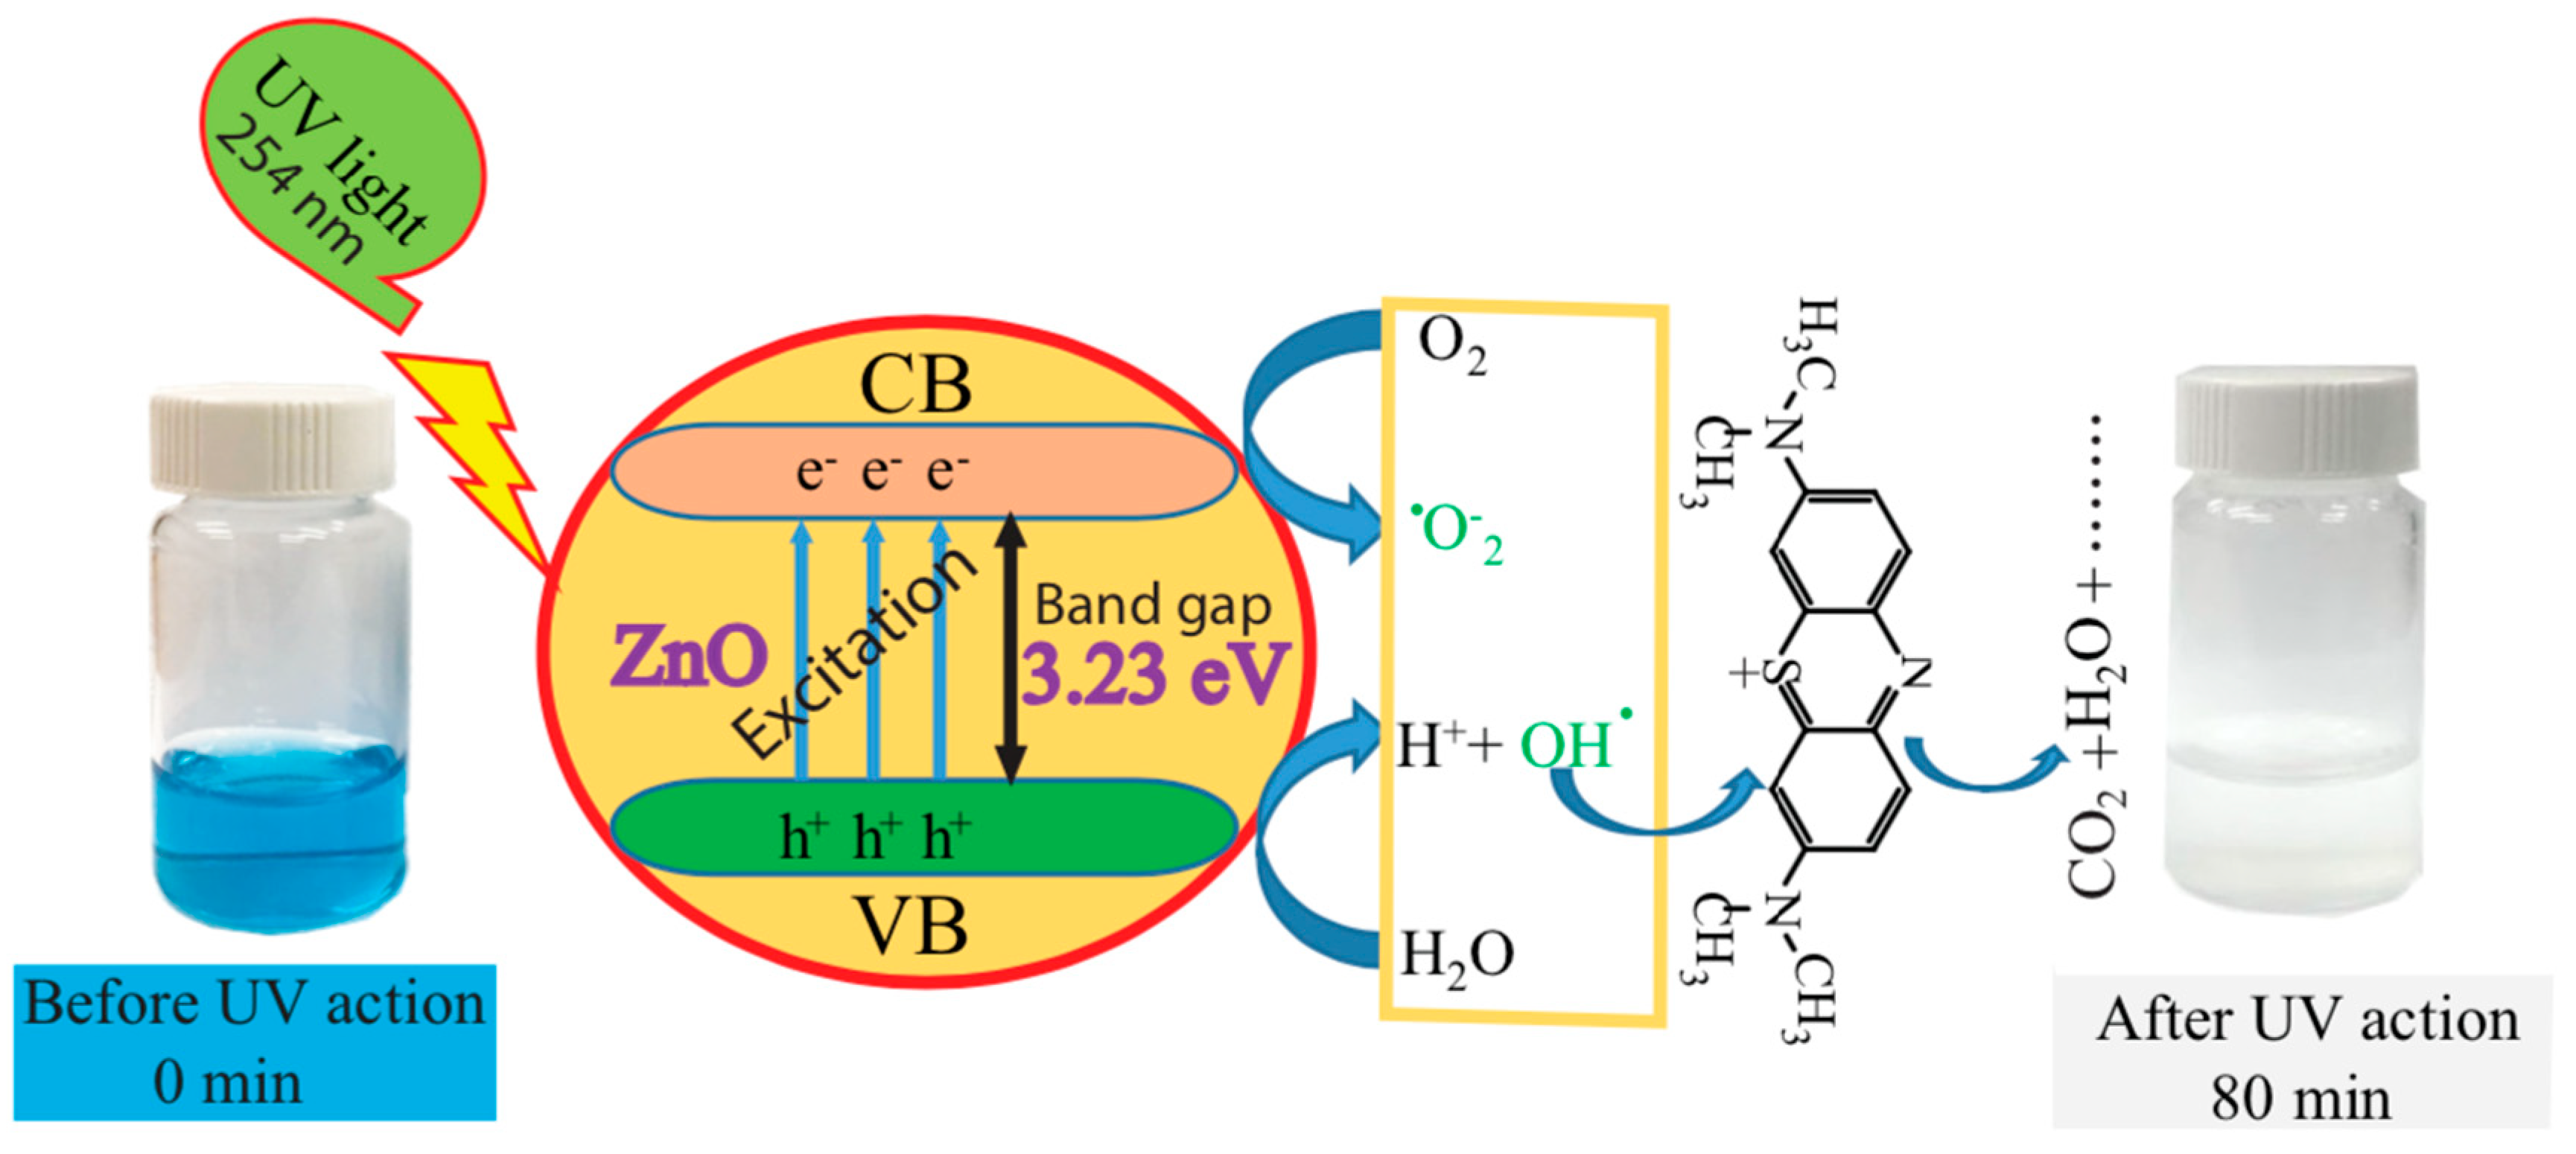
2.2. Photocatalytic Performance of the Prepared ZnO-NPs
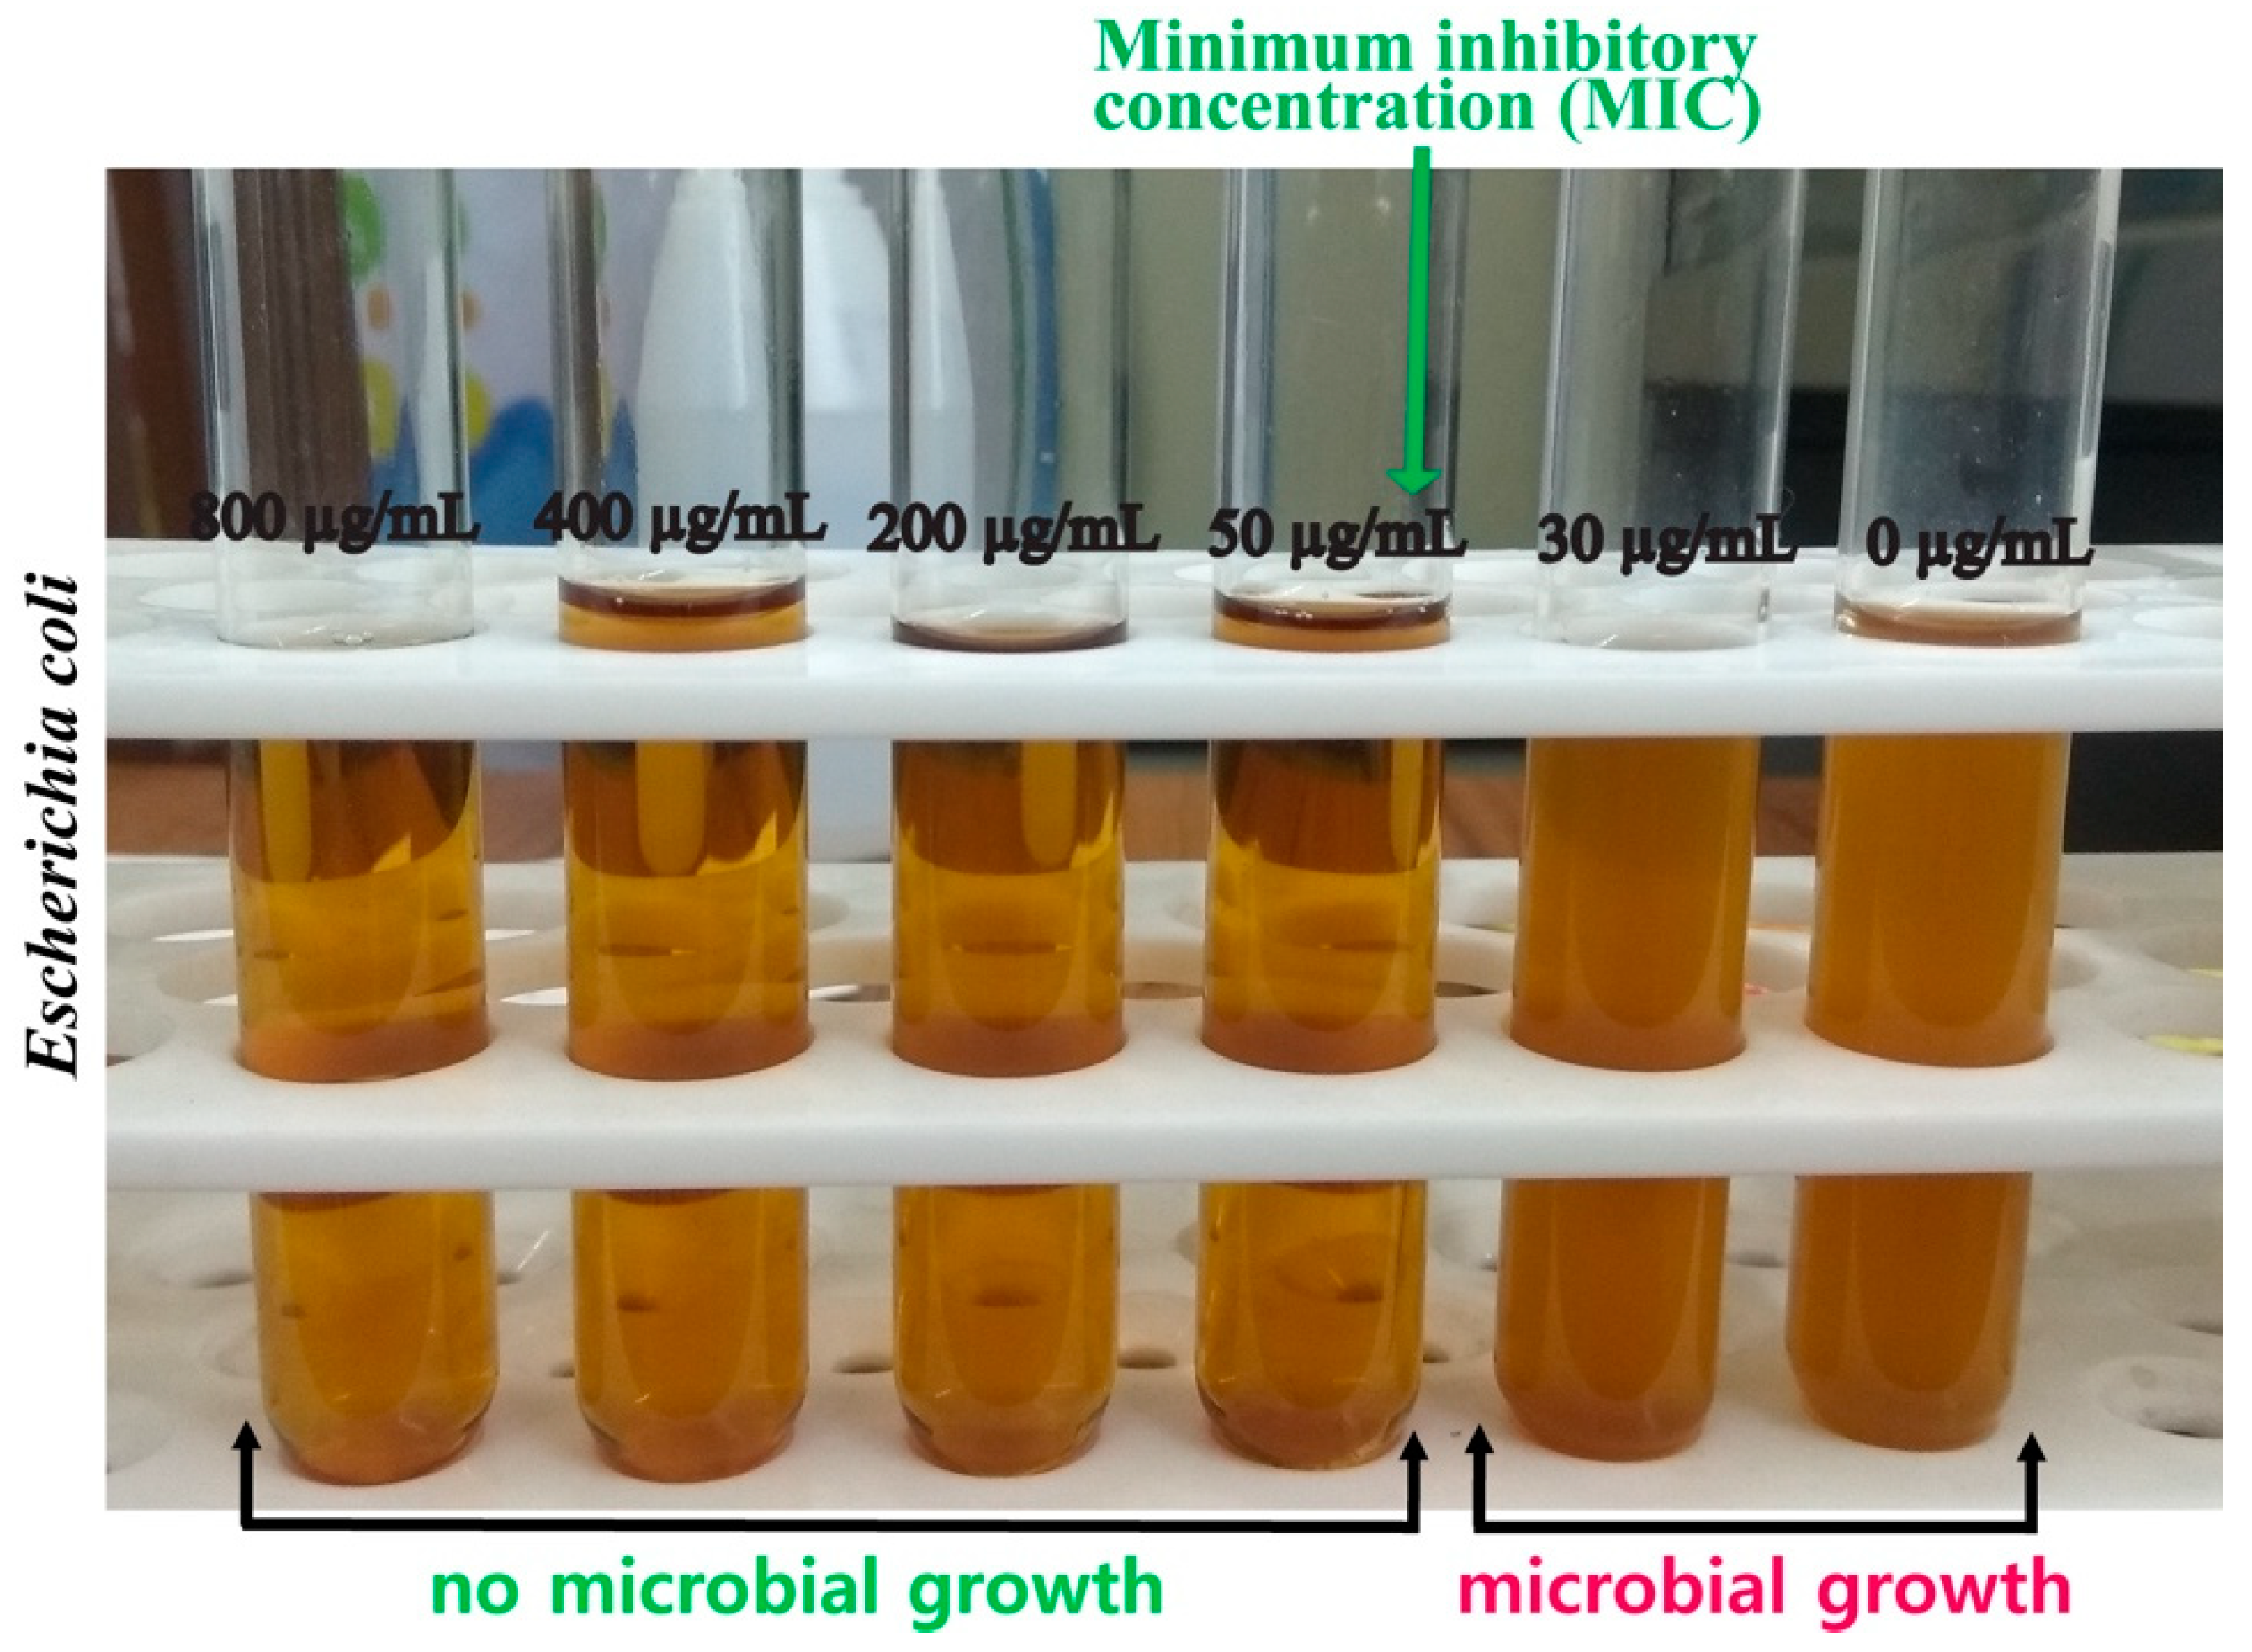
2.3. Antibacterial Performance of the Prepared ZnO-NPs
3. Experimental
3.1. Materials
3.2. Preparation of ZnO-NPs
3.3. Characterization of the Structure and Composition of the Prepared ZnO-NPs
3.4. Photocatalytic Performance
3.5. Antibacterial Screening
4. Conclusions
Supplementary Materials
Author Contributions
Funding
Conflicts of Interest
References
- Etacheri, V.; Roshan, R.; Kumar, V. Mg-doped ZnO nanoparticles for efficient sunlight-driven photocatalysis. ACS Appl. Mater. Interfaces 2012, 4, 2717–2725. [Google Scholar] [CrossRef] [PubMed]
- Zheng, Y.; Fu, L.; Han, F.; Wang, A.; Cai, W.; Yu, J.; Yang, J.; Peng, F. Green biosynthesis and characterization of zinc oxide nanoparticles using Corymbia citriodora leaf extract and their photocatalytic activity. Green Chem. Chem. Lett. Rev. 2015, 8, 59–63. [Google Scholar] [CrossRef]
- Vlad, S.; Tanase, C.; Macocinschi, D.; Ciobanu, C.; Balaes, T.; Filip, D.; Gostin, I.N.; Gradinaru, L.M. Antifungal behaviour of polyurethane membranes with zinc oxide nanoparticles. Dig. J. Nanomater. Biostruct. 2012, 7, 51–58. [Google Scholar]
- Akbar, A.; Sadiq, M.B.; Ali, I.; Muhammad, N.; Rehman, Z.; Khan, M.N.; Muhammad, J.; Khan, S.A.; Rehman, F.U.; Anal, A.K. Synthesis and antimicrobial activity of zinc oxide nanoparticles against foodborne pathogens Salmonella typhimurium and Staphylococcus aureus. Biocat. Agri. Biotech. 2019, 17, 36–42. [Google Scholar] [CrossRef]
- Jiang, W.T.; Wu, C.T.; Sung, Y.H.; Wu, J.J. Room-temperature fast construction of outperformed ZnO nanoarchitectures on nanowire-array templates for dye-sensitized solar cells. ACS Appl. Mater. Interfaces 2013, 5, 911–917. [Google Scholar] [CrossRef] [PubMed]
- Seager, C.H.; Warren, W.L.; Tallant, D.R.; Voigt, J.A. Correlation between photoluminescence and oxygen vacancies in ZnO phosphors. Appl. Phys. Lett. 1996, 68, 403–405. [Google Scholar]
- Wu, J.J.; Liu, S.C. Low-temperature growth of well-aligned ZnO nanorods by chemical vapor deposition. Adv. Mater. 2002, 14, 215–218. [Google Scholar] [CrossRef]
- Guo, L.; Ji, Y.L.; Xu, H. Regularly shaped, single-crystalline ZnO nanorods with wurtzite structure. J. Am. Chem. Soc. 2002, 124, 14864–14865. [Google Scholar] [CrossRef]
- Marı´, B.; Mollar, M.; Mechkour, A.; Hartiti, B.; Perales, M.; Cembrero, L. Optical properties of nanocolumnar ZnO crystals. Microelectron. J. 2004, 35, 79–82. [Google Scholar] [CrossRef]
- Yousefi, R.; Farid, J.-S.; Cheraghizade, M.; Sara, K.-G.; Sáaedi, A.; Huang, N.M.; Basirun, W.J.; Azarang, M. Enhanced visible-light photocatalytic activity of strontium-doped zinc oxide nanoparticles. Mater. Sci. Semi. Proc. 2015, 32, 152–159. [Google Scholar] [CrossRef]
- Kislov, N.; Lahiri, J.; Verma, H.; Goswami, D.Y.; Stefanakos, E.; Batzill, M. Photocatalytic degradation of methyl orange over single crystalline ZnO: Orientation dependence of photoactivity and photostability of ZnO. Langmuir 2009, 25, 3310–3315. [Google Scholar] [CrossRef] [PubMed]
- Bu, Y.; Chen, Z.; Li, W.; Hou, B. Highly efficient photocatalytic performance of graphene–ZnO quasi-shell-core composite material. ACS Appl. Mater. Interfaces 2013, 5, 12361–12368. [Google Scholar] [CrossRef] [PubMed]
- Hossain, M.M.; Ku, B.-C.; Hahn, J.R. Synthesis of an efficient white-light photocatalyst composite of graphene and ZnO nanoparticles: Application to methylene blue dye decomposition. App. Surf. Sci. 2015, 354, 55–65. [Google Scholar] [CrossRef]
- Sharma, D.; Rajput, J.; Kaith, B.S.; Kaur, M.; Sharma, S. Synthesis of ZnO nanoparticles and study of their antibacterial and antifungal properties. Thin Solid Films 2010, 5, 191224–191229. [Google Scholar] [CrossRef]
- JCPDS. Powder Diffraction File, Alphabetical Index, Inorganic Compounds, International Centre for Diffraction Data. Newtown Square, PA, USA, 1977. Available online: http://www.icdd.com (accessed on 15 July 2019).
- Moharram, A.H.; Mansour, S.A.; Hussein, M.A.; Rashad, M. Direct precipitation and characterization of ZnO nanoparticles. J. Nanomat. 2014, 2014, 1–5. [Google Scholar] [CrossRef]
- Umara, A.; Rahman, M.M.; Al-Hajry, A.; Hahn, Y.-B. Highly-sensitive cholesterol biosensor based on well-crystallized flower-shaped ZnO nanostructures. Talanta 2009, 78, 284–289. [Google Scholar] [CrossRef]
- Vaseem, M.; Lee, K.-M.; Shin, J.-K.; Hahn, Y.B. Synthesis of ZnO nanoparticles and their ink-jetting behavior. J. Nanosci. Nanotechnol. 2012, 12, 2380–2386. [Google Scholar] [CrossRef]
- Hossain, M.M.; Hossain, S.; Seungbae, S.; Hahn, J.R. In situ fabrication of a thermally stable and highly porous conductive solar light-driven ZnO-CNT fiber photocatalyst. RSC Adv. 2016, 6, 71450–71460. [Google Scholar] [CrossRef]
- Zak, A.K.; Youefi, R.; Majid, W.H.A.; Muhamad, M.R. Facile synthesis and X-ray peak broadening studies of Zn1−xMgxO nanoparticles. Ceram. Int. 2012, 38, 2056–2064. [Google Scholar]
- Arii, T.; Kishi, A. The effect of humidity on thermal process of zinc acetate. Thermochim. Acta 2003, 400, 175–185. [Google Scholar] [CrossRef]
- Yang, C.; Li, Q.; Tang, L.; Xin, K.; Bai, A.; Yu, Y. Synthesis, photocatalytic activity, and photogenerated hydroxyl radicals of monodisperse colloidal ZnO nanospheres. Appl. Surf. Sci. 2015, 357, 1928–1938. [Google Scholar] [CrossRef]
- Fu, L.; Fu, Z. Plectranthus amboinicus leaf extract-assisted biosynthesis of ZnO nanoparticles and their photocatalytic activity. Ceram. Int. 2015, 41, 2492–2496. [Google Scholar] [CrossRef]
- Nava, O.J.; Soto-Robles, C.A.; Gomez-Gutierrez, C.M.; Vilchis-Nestor, A.R.; Castro-Beltran, A.; Olivas, A.; Luque, P.A. Fruit peel extract mediated green synthesis of zinc oxide nanoparticles. J. Molec. Struct. 2017, 1147, 1–6. [Google Scholar] [CrossRef]
- Azarang, M.; Shuhaimi, A.; Yousefi, R.; Jahromi, S.P. One-pot sol–gel synthesis of reduced graphene oxide uniformly decorated zinc oxide nanoparticles in starch environment for highly efficient photodegradation of methylene blue. RSC Adv. 2015, 5, 21888–21896. [Google Scholar] [CrossRef]
- Ren, C.; Yang, B.; Wu, M.; Xu, J.; Fu, Z.; Lv, Y.; Guo, T.; Zhao, Y.; Zhu, C. Synthesis of Ag/ZnO nanorods array with enhanced photocatalytic performance. J. Hazard. Mater. 2010, 182, 123–129. [Google Scholar] [CrossRef]
- Li, J.; Yan, J.; Liu, C.; Dong, L.; Lv, H.; Sun, W.; Xing, S. Manipulation on ZnO heterostructures: from binary ZnO–Ag to ternary ZnO–Ag–polypyrrole. Cryst. Eng. Comm. 2014, 16, 10943–10948. [Google Scholar] [CrossRef]
- Wang, L.; Chang, L.; Zhao, B.; Yuan, Z.; Shao, G.; Zheng, W. Systematic investigation on morphologies, forming mechanism, photocatalytic and photoluminescent properties of zno nanostructures constructed in ionic liquids. Inorg. Chem. 2008, 47, 1443–1452. [Google Scholar] [CrossRef] [PubMed]
- Li, D.; Huang, J.-F.; Cao, L.Y.; LI, J.-Y.; OuYang, H.-B.; Yao, C.-Y. Microwave hydrothermal synthesis of Sr2+ doped ZnO crystallites with enhanced photocatalytic properties. Ceram. Int. 2014, 40, 2647–2653. [Google Scholar] [CrossRef]
- Zhang, Q.; Chou, T.P.; Russo, B.; Jenekhe, S.A.; Cao, G. Polydisperse aggregates of ZnO nanocrystallites: A method for energy-conversion-efficiency enhancement in dye-sensitized solar cells. Adv. Funct. Mater. 2008, 18, 1654–1660. [Google Scholar] [CrossRef]
- Houas, A.; Lachheb, H.; Ksibi, M.; Elaloui, E.; Guillard, C.; Herrmann, J.-M. Photocatalytic degradation pathway of methylene blue in water. Appl. Catal. B 2001, 31, 145–157. [Google Scholar] [CrossRef]
- Zong, Y.; Li, Z.; Wang, X.; Ma, J.; Men, Y. Synthesis and high photocatalytic activity of Eu-doped ZnO nanoparticles. Ceram. Int. 2014, 40, 10375–10382. [Google Scholar] [CrossRef]
- French, G.L. Bactericidal agents in the treatment of MRSA infections-the potential role of daptomycin. J. Antimicrob. Chemother. 2006, 58, 1107–1117. [Google Scholar] [CrossRef] [PubMed]
- Ansari, M.A.; Khan, H.M.; Khan, A.A.; Sultan, A.; Azam, A. Synthesis and characterization of the antibacterial potential of ZnO nanoparticles against extended-spectrum β-lactamases-producing Escherichia coli and Klebsiella pneumoniae isolated from a tertiary care hospital of North India. Appl. Microbiol. Biotechnol. 2012, 94, 467–477. [Google Scholar] [CrossRef] [PubMed]
- Zhang, L.; Jiang, Y.; Ding, Y.; Povey, M.; York, D. Investigation into the antibacterial behaviour of suspensions of ZnO nanoparticles (ZnO nanofluids). J. Nanopart. Res. 2007, 9, 479–489. [Google Scholar] [CrossRef]
- Shankar, S.; Rhim, J.-W. Facile approach for large-scale production of metal and metal oxide nanoparticles and preparation of antibacterial cotton pads. Carbohydr. Polym. 2017, 163, 137–145. [Google Scholar] [CrossRef] [PubMed]
- Zhou, G.; Li, Y.; Xiao, W.; Zhang, L.; Zuo, Y.; Xue, J.; Jansen, J.A. Synthesis, characterization, and antibacterial activities of a novel nanohydroxyapatite/zinc oxide complex. J. Biomed. Mater. Res. Part A 2008, 85, 929–937. [Google Scholar] [CrossRef]
- Raghupathi, K.R.; Koodali, R.T.; Manna, A.C. Size-dependent bacterial growth inhibition and mechanism of antibacterial activity of zinc oxide nanoparticles. Langmuir 2011, 27, 4020–4028. [Google Scholar] [CrossRef]
- Padmavathy, N.; Vijayaraghavan, R. Enhanced bioactivity of ZnO nanoparticles—An antimicrobial study. Sci. Technol. Adv. Mater. 2008, 9, 035004. [Google Scholar] [CrossRef]
- Schilling, K.; Bradford, B.; Castelli, D.; Dufour, E.; Nash, J.F.; Pape, W.; Schulte, S.; Ian Tooley, I.; Bosch, J.V.D.; Schellauf, F. Human safety review of “nano” titanium dioxide and zinc oxide. Photochem. Photobiol. Sci. 2010, 9, 495–509. [Google Scholar] [CrossRef]
- Akhtar, M.J.; Ahamed, M.; Kumar, S.; Khan, M.M.; Ahmad, J.; Alrokayan, S.A. Zinc oxide nanoparticles selectively induce apoptosis in human cancer cells through reactive oxygen species. Int. J. Nanomed. 2012, 7, 845–857. [Google Scholar] [Green Version]
- Wu, W.; Samet, J.M.; Peden, D.B.; Bromberg, P.A. Phosphorylation of p65 is required for zinc oxide nanoparticle-induced interleukin 8 expression in human bronchial epithelial cells. Environ. Health Perspect. 2010, 118, 982–987. [Google Scholar] [CrossRef]
- Kocbek, P.; Teskac, K.; Kreft, M.E.; Kristl, J. Toxicological aspects of long-term treatment of keratinocytes with ZnO and TiO2 nanoparticles. Small 2010, 6, 1908–1917. [Google Scholar] [CrossRef]
- Meyer, K.; Rajanahalli, P.; Ahamed, M.; Rowe, J.J.; Hong, Y. ZnO nanoparticles induce apoptosis in human dermal fibroblasts via p53 and p38 pathways. Toxicol. In Vitro 2011, 25, 1721–1726. [Google Scholar] [CrossRef]


| Catalyst | Preparation Method | Dye | Degradation Time (min) | Efficiency of Degradation (%) | Ref. |
|---|---|---|---|---|---|
| ZnO | Biological | Methyl red | 180 | 92.5 | [23] |
| ZnO | Biological | Methylene blue | 90 | 83.45 | [2] |
| ZnO | Biological | Methylene blue | 180 | 97 | [24] |
| Bare ZnO | Chemical | Methylene blue | 120 | 37 | [25] |
| Sr-doped ZnO | Chemical | Methylene blue | 120 | 78.5 | [10] |
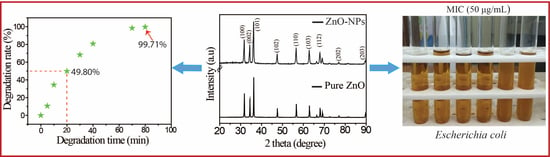
| ZnO | Thermal | Methylene blue | 80 | 99.71 | this work |
© 2019 by the authors. Licensee MDPI, Basel, Switzerland. This article is an open access article distributed under the terms and conditions of the Creative Commons Attribution (CC BY) license (http://creativecommons.org/licenses/by/4.0/).
Share and Cite
Hanif, M.A.; Lee, I.; Akter, J.; Islam, M.A.; Zahid, A.A.S.M.; Sapkota, K.P.; Hahn, J.R. Enhanced Photocatalytic and Antibacterial Performance of ZnO Nanoparticles Prepared by an Efficient Thermolysis Method. Catalysts 2019, 9, 608. https://0-doi-org.brum.beds.ac.uk/10.3390/catal9070608
Hanif MA, Lee I, Akter J, Islam MA, Zahid AASM, Sapkota KP, Hahn JR. Enhanced Photocatalytic and Antibacterial Performance of ZnO Nanoparticles Prepared by an Efficient Thermolysis Method. Catalysts. 2019; 9(7):608. https://0-doi-org.brum.beds.ac.uk/10.3390/catal9070608
Chicago/Turabian StyleHanif, Md. Abu, Insup Lee, Jeasmin Akter, Md. Akherul Islam, Ali A. S. M. Zahid, Kamal Prasad Sapkota, and Jae Ryang Hahn. 2019. "Enhanced Photocatalytic and Antibacterial Performance of ZnO Nanoparticles Prepared by an Efficient Thermolysis Method" Catalysts 9, no. 7: 608. https://0-doi-org.brum.beds.ac.uk/10.3390/catal9070608