
Genome-Wide Characterization of R2R3-MYB Transcription Factors in Pitaya Reveals a R2R3-MYB Repressor HuMYB1 Involved in Fruit Ripening through Regulation of Betalain Biosynthesis by Repressing Betalain Biosynthesis-Related Genes

 , , , and
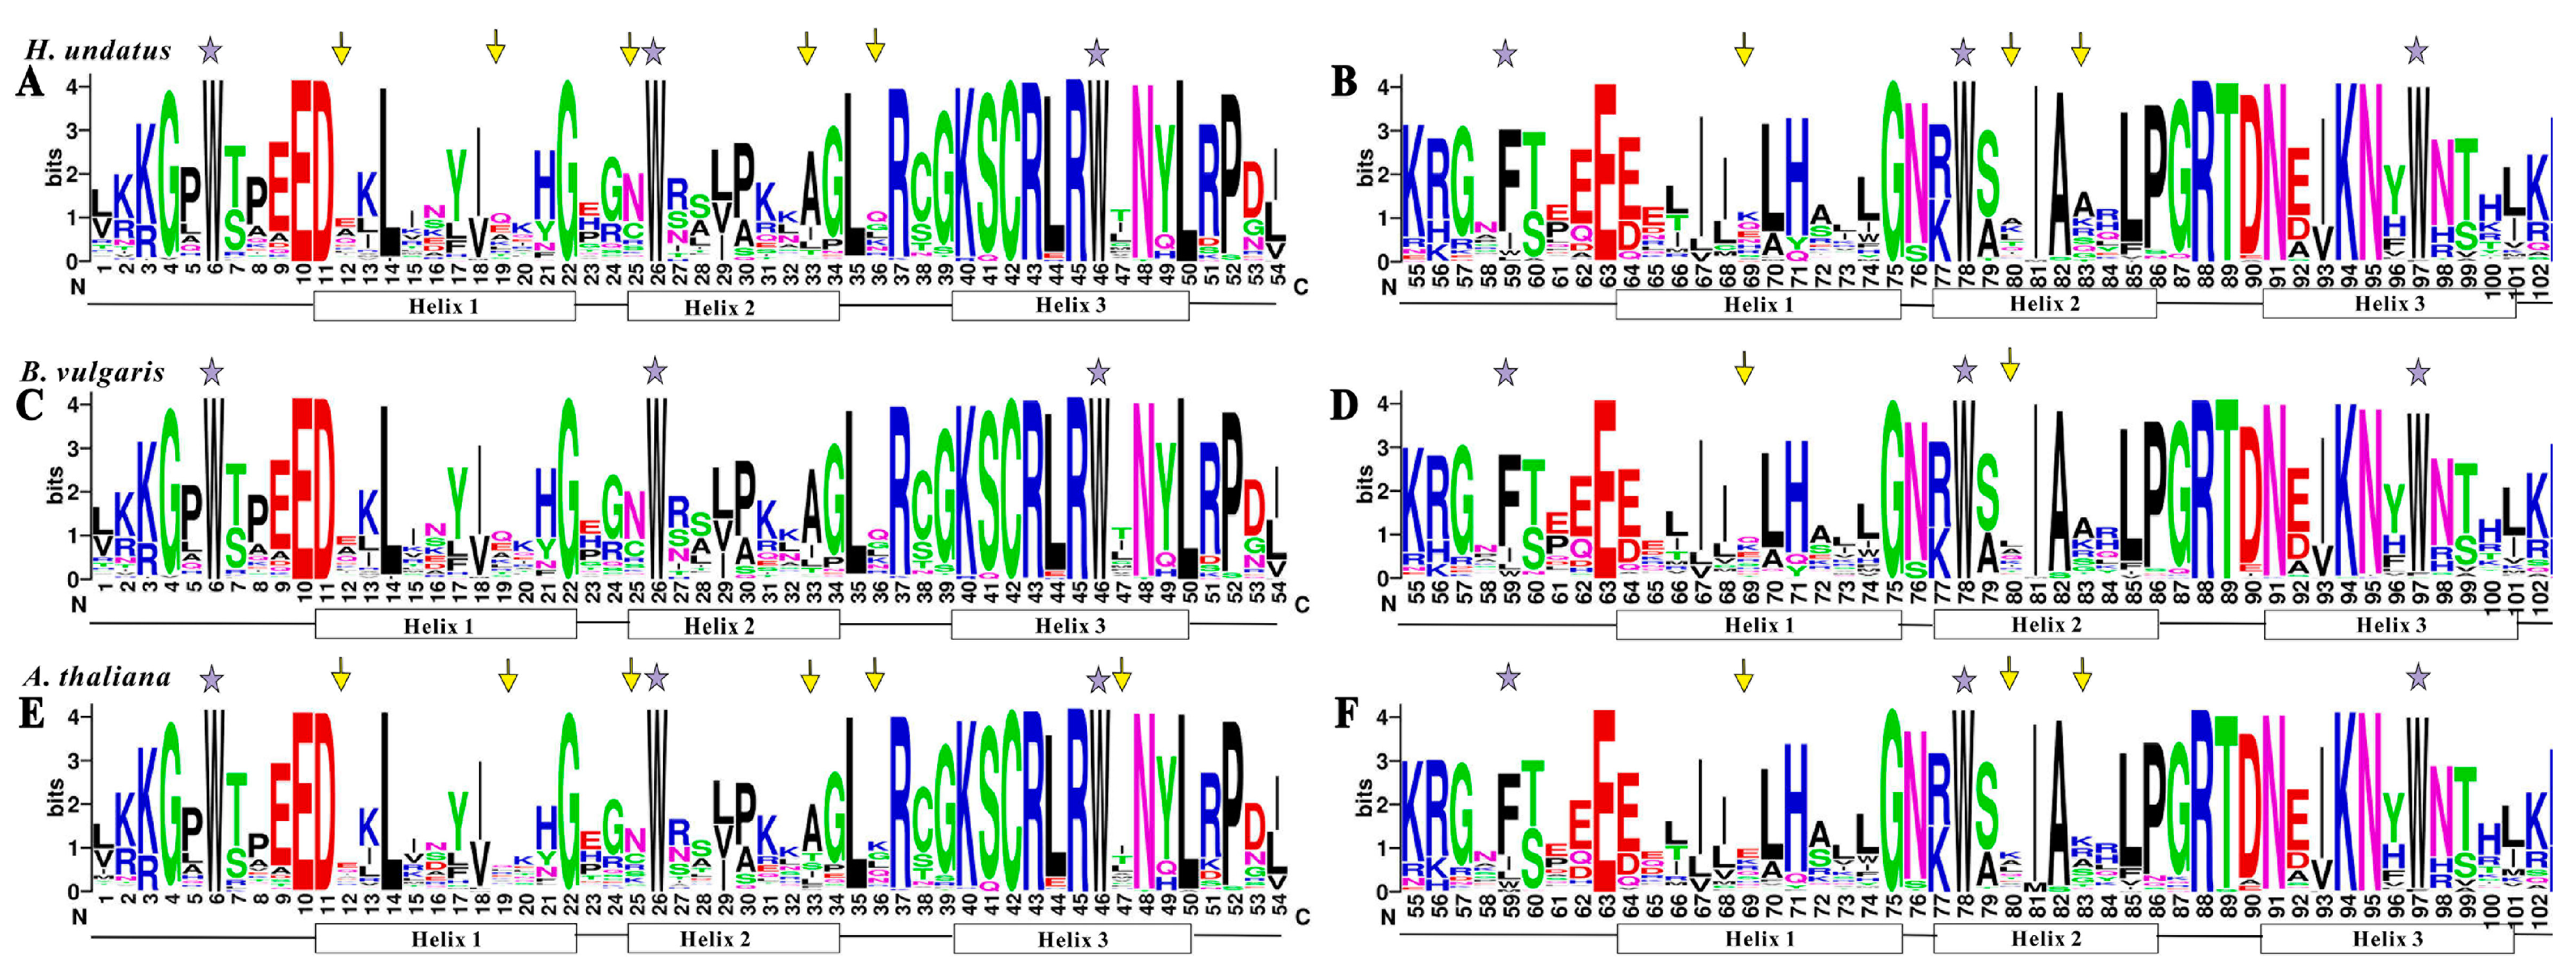
Abstract
:1. Introduction
2. Materials and Methods
2.1. Identification and Sequence Analyses of Pitaya R2R3-MYB Subfamily
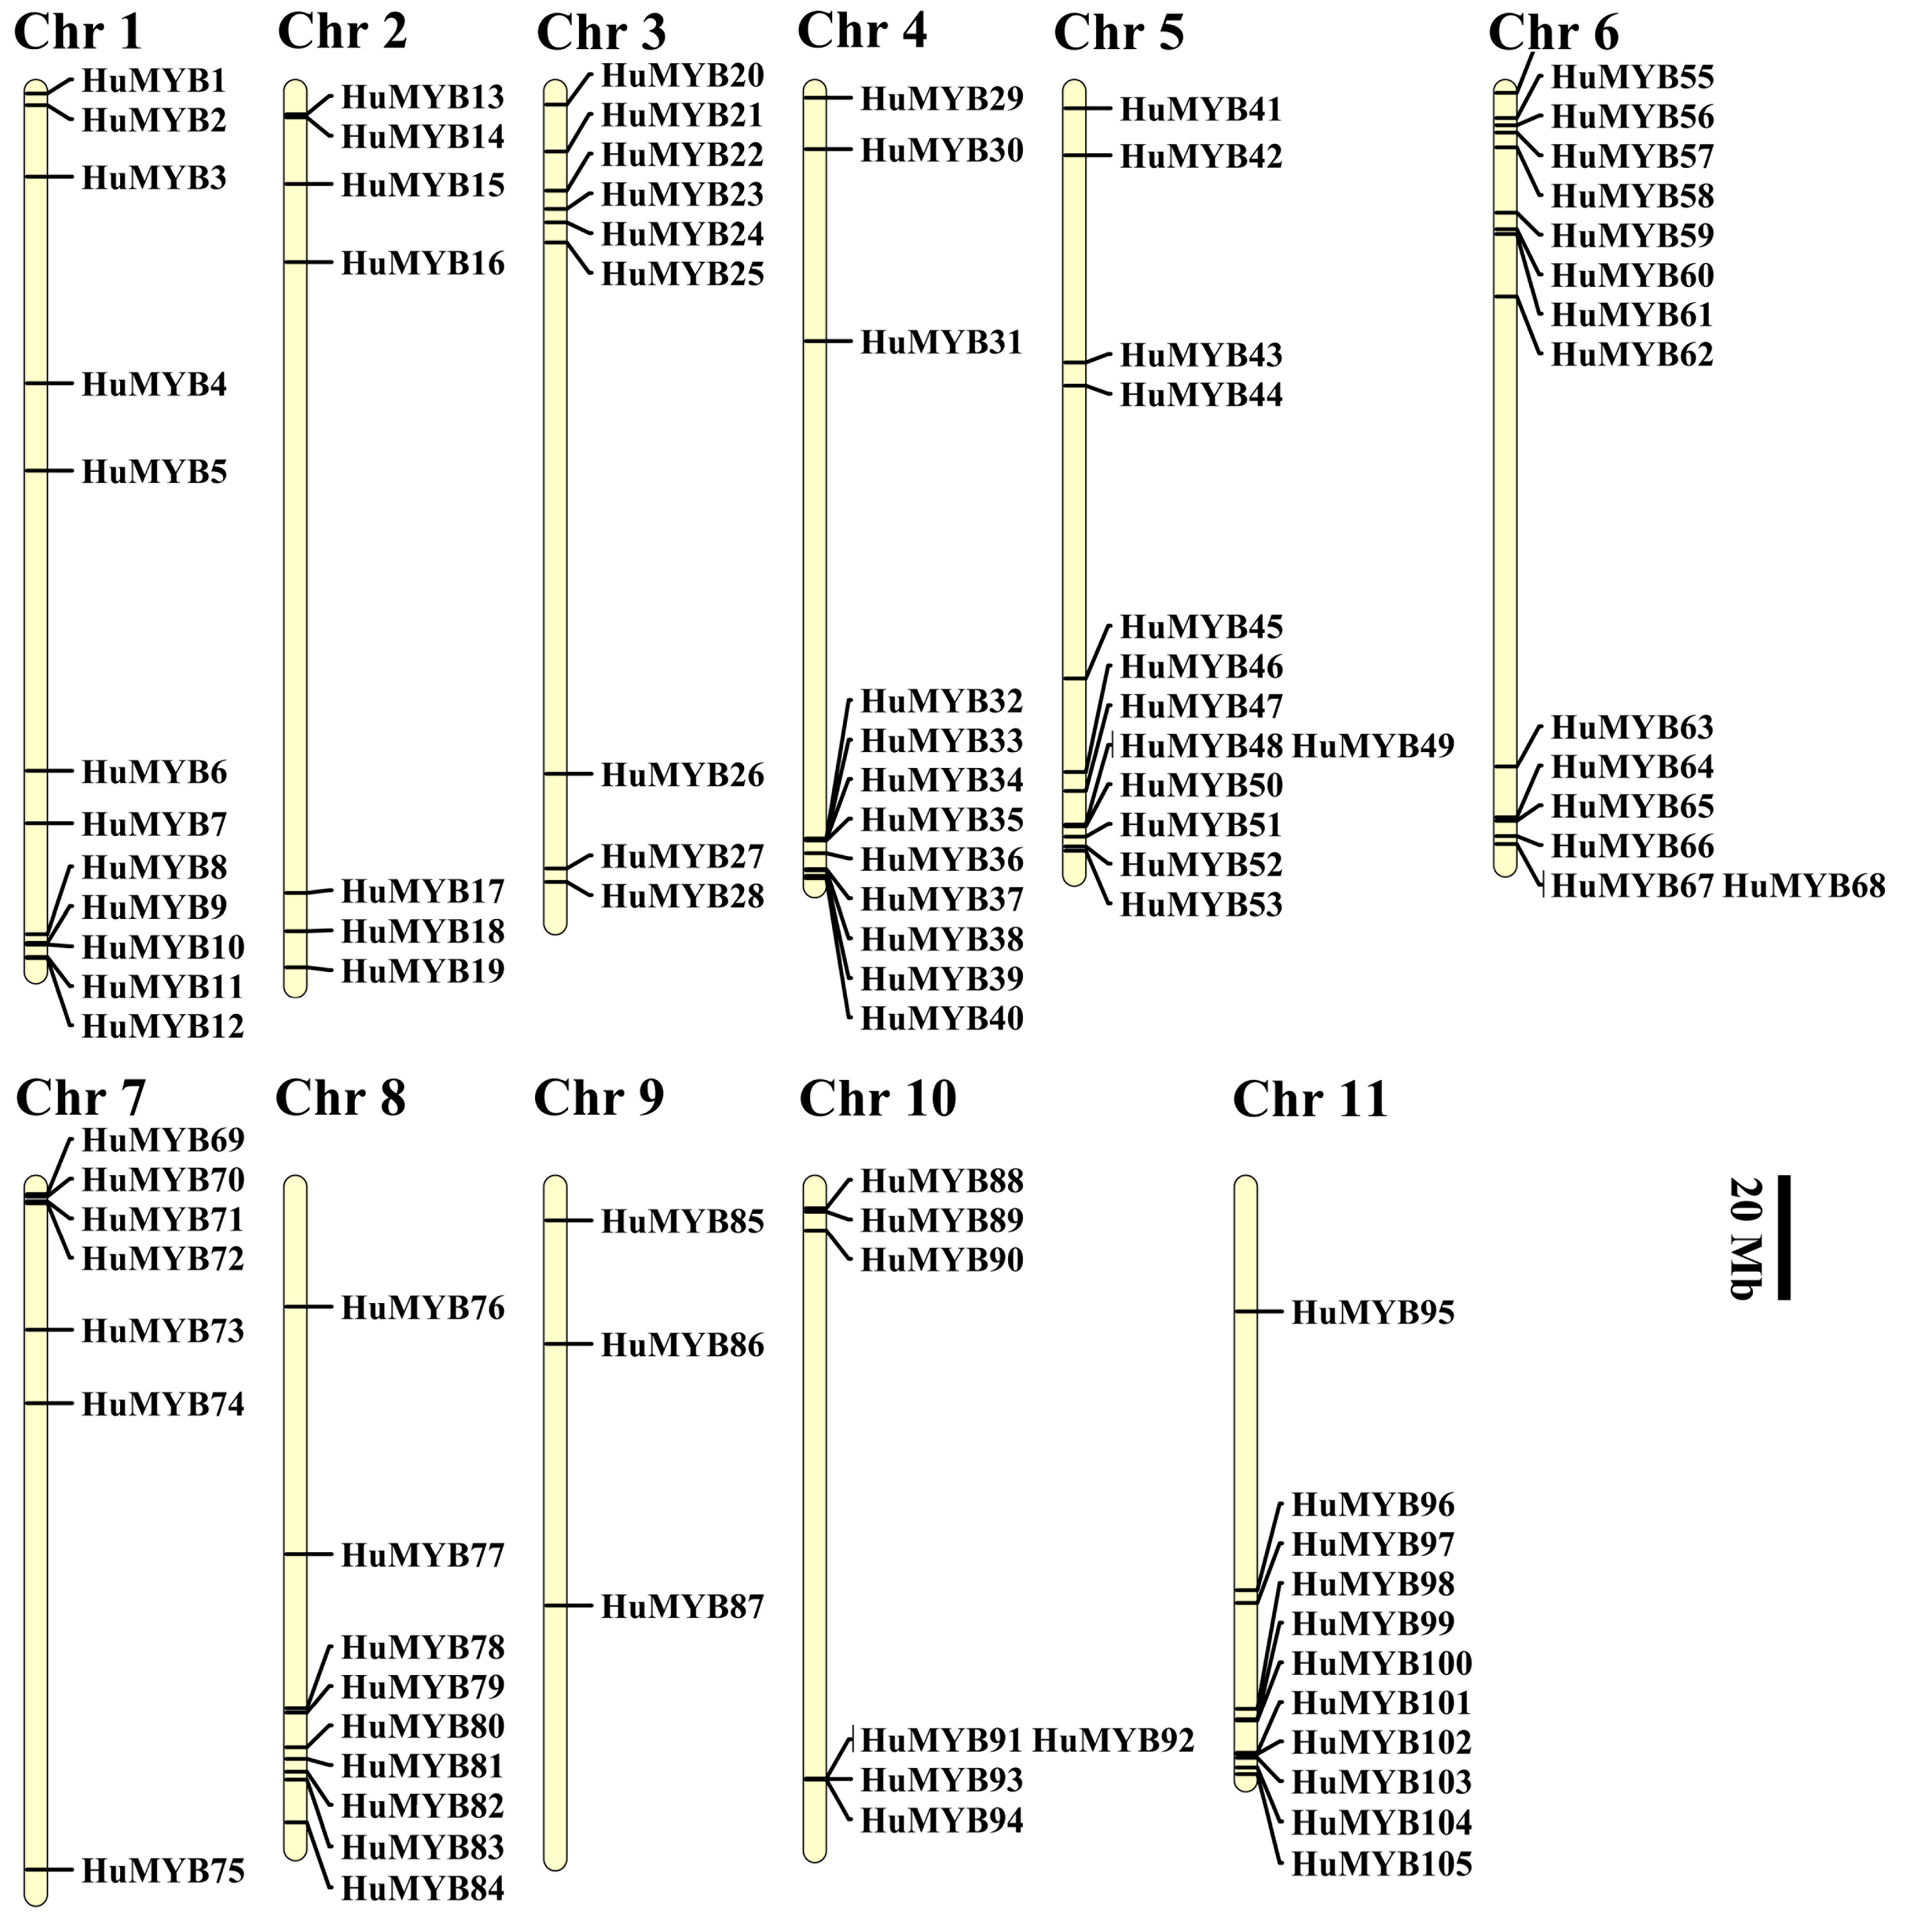
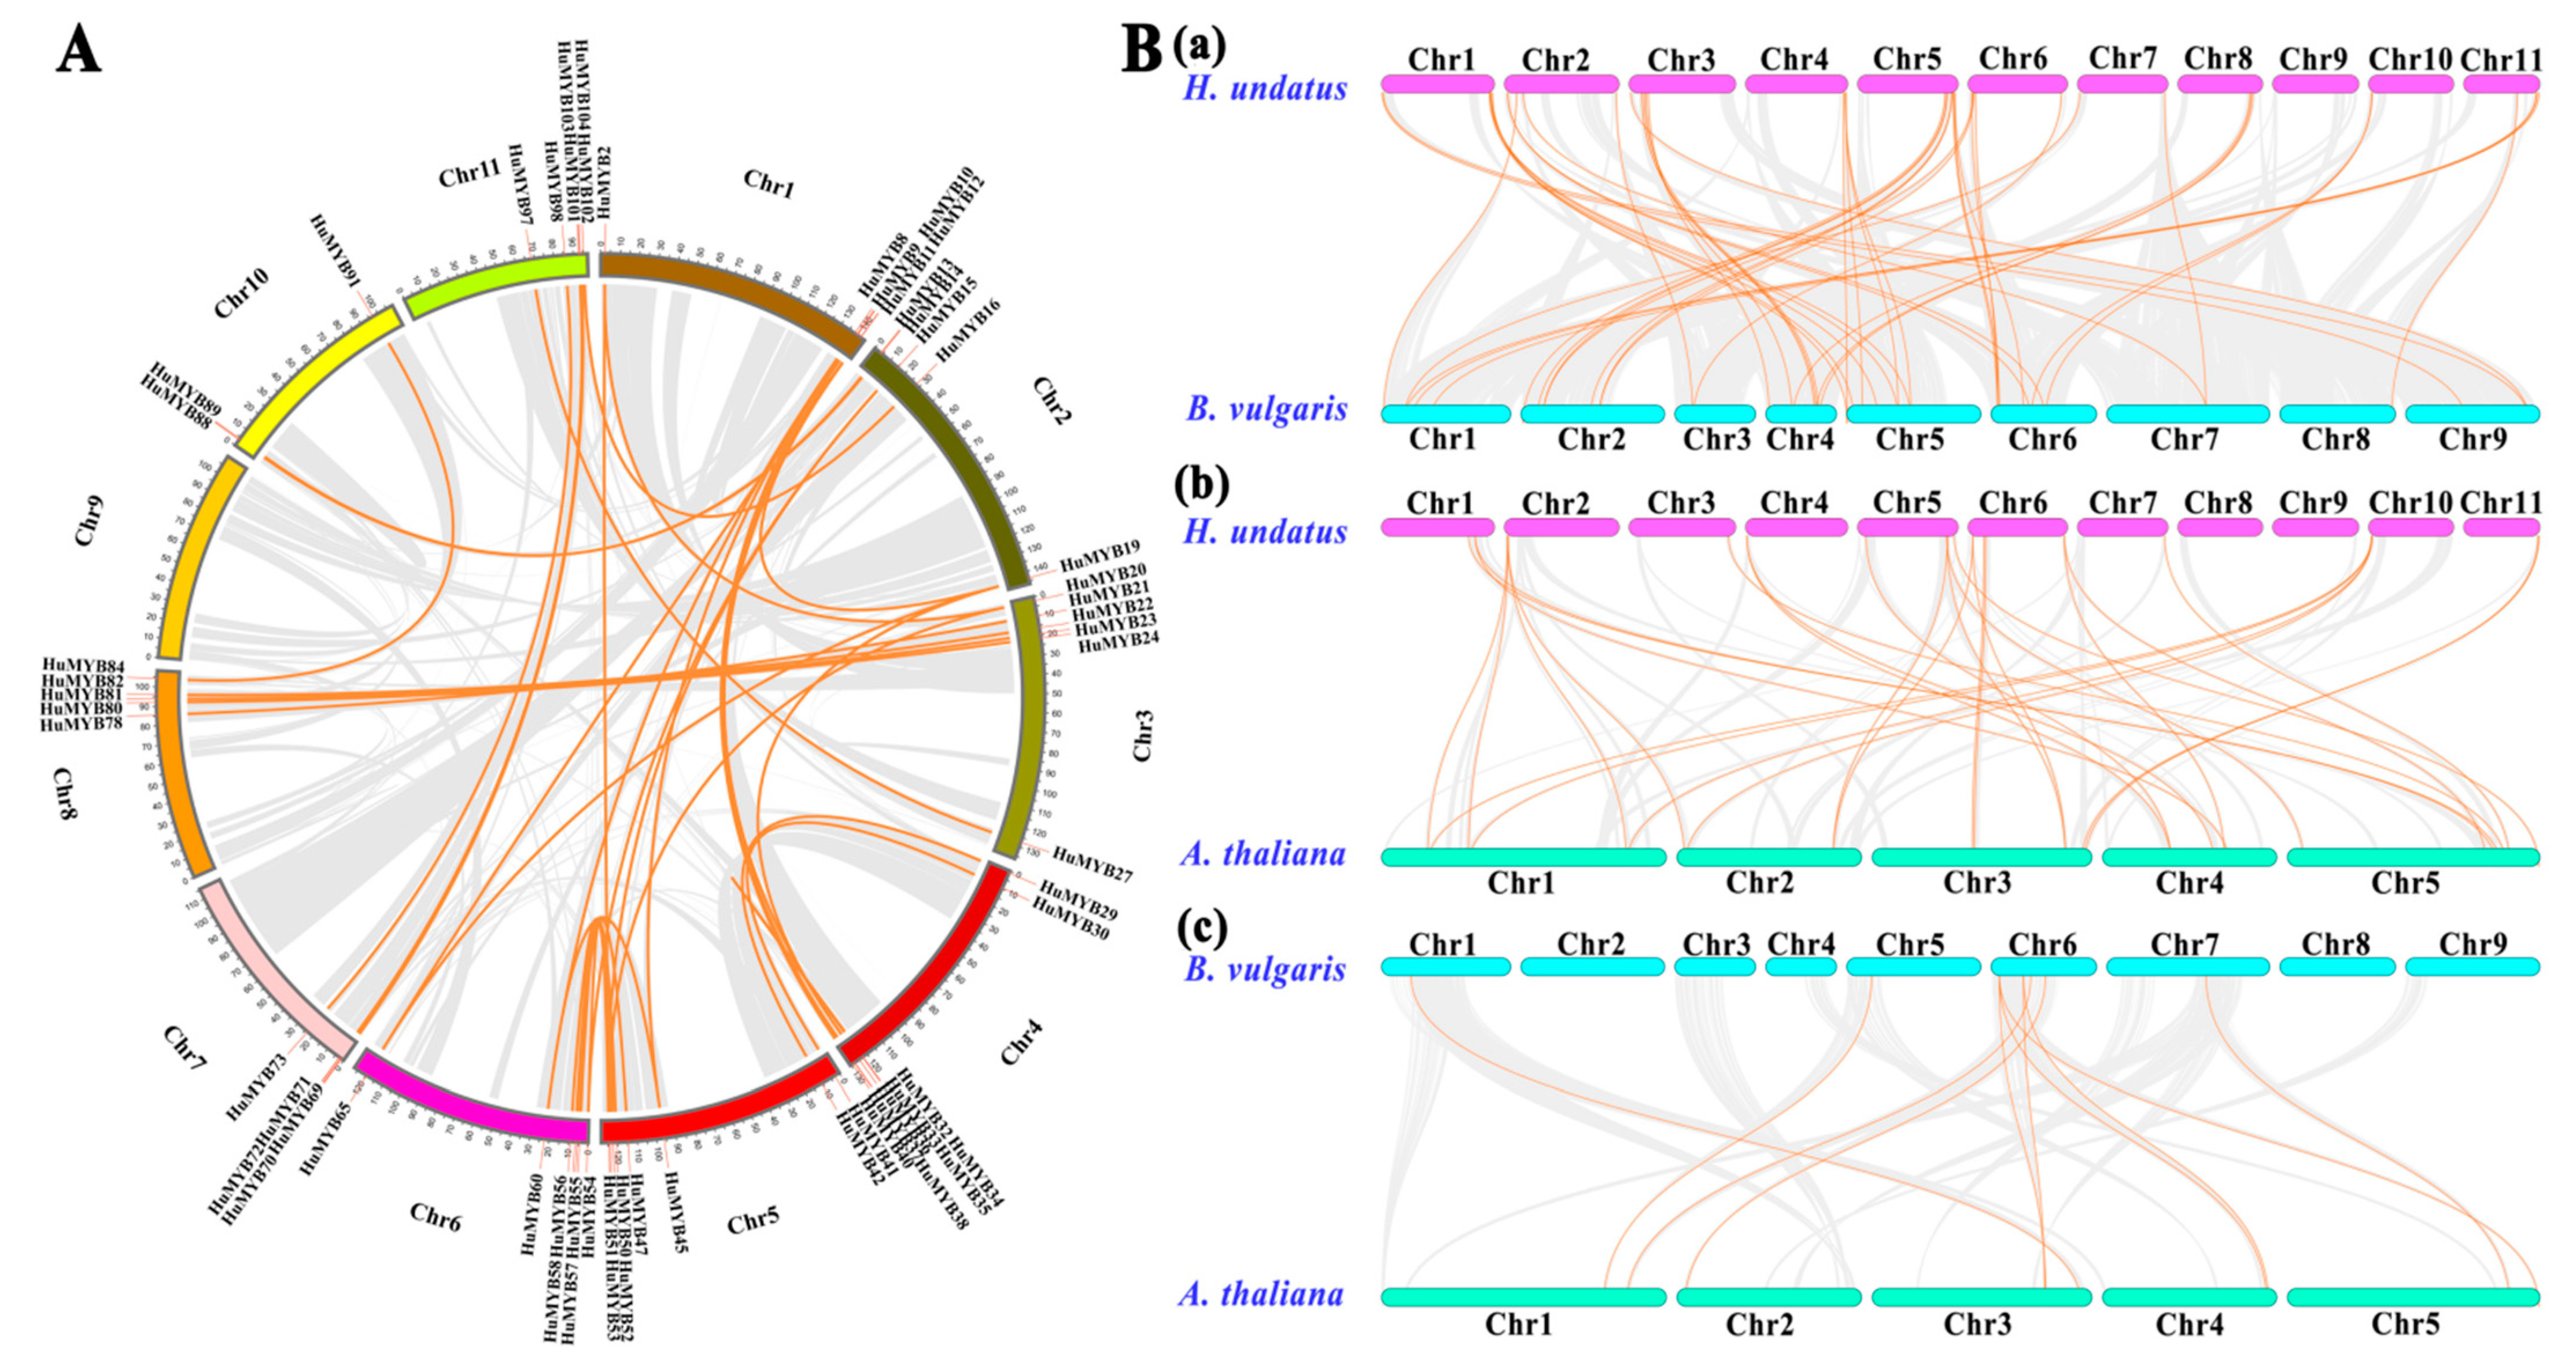
2.2. Chromosomal Locations and Synteny Analyses of Pitaya R2R3-MYB Members
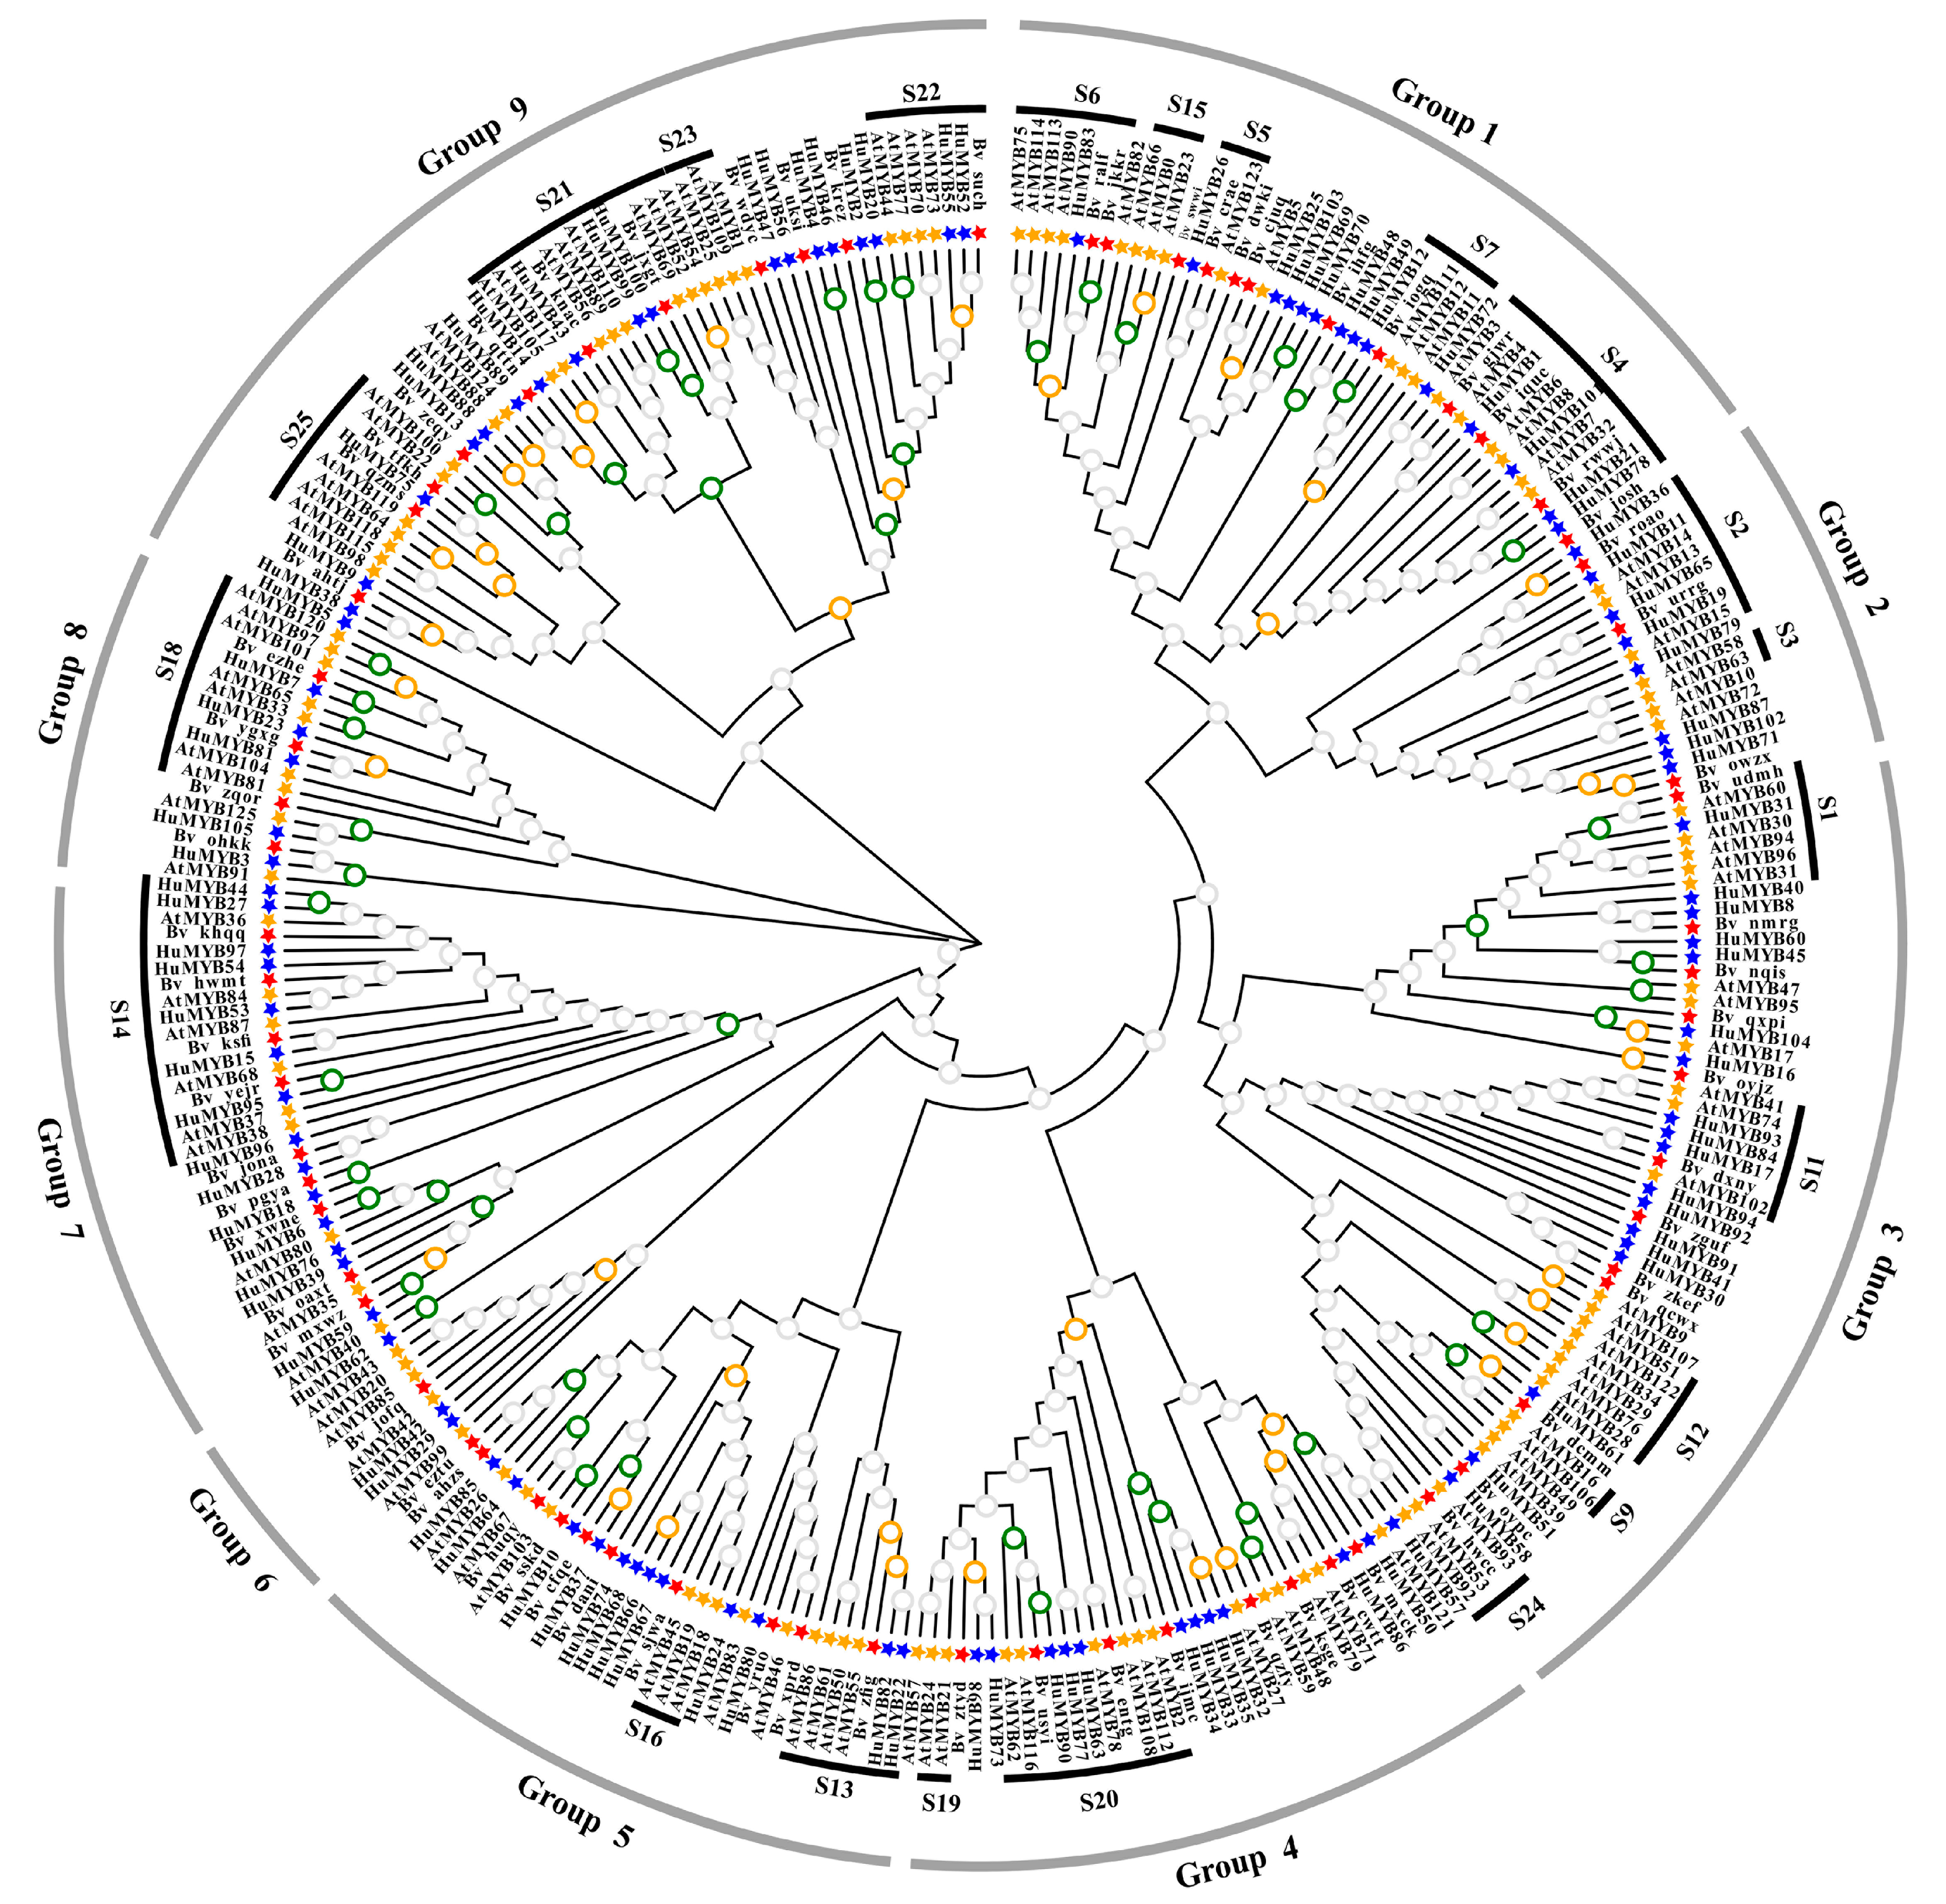
2.3. Phylogenetic Analyses of Pitaya R2R3-MYB Members
2.4. Plant Materials
2.5. Measurement of Betalain Contents
2.6. Gene Expression Analyses and Cloning
2.7. Subcellular Localization Analyses
2.8. Transcriptional Activation Analyses in Yeast Cells
2.9. Dual-Luciferase Transient Expression Assay
3. Results
3.1. Identification of R2R3-MYB Genes from H. undatus
3.2. Genomic Location of HuMYBs
3.3. Synteny Analyses of Pitaya R2R3-MYB Subfamily
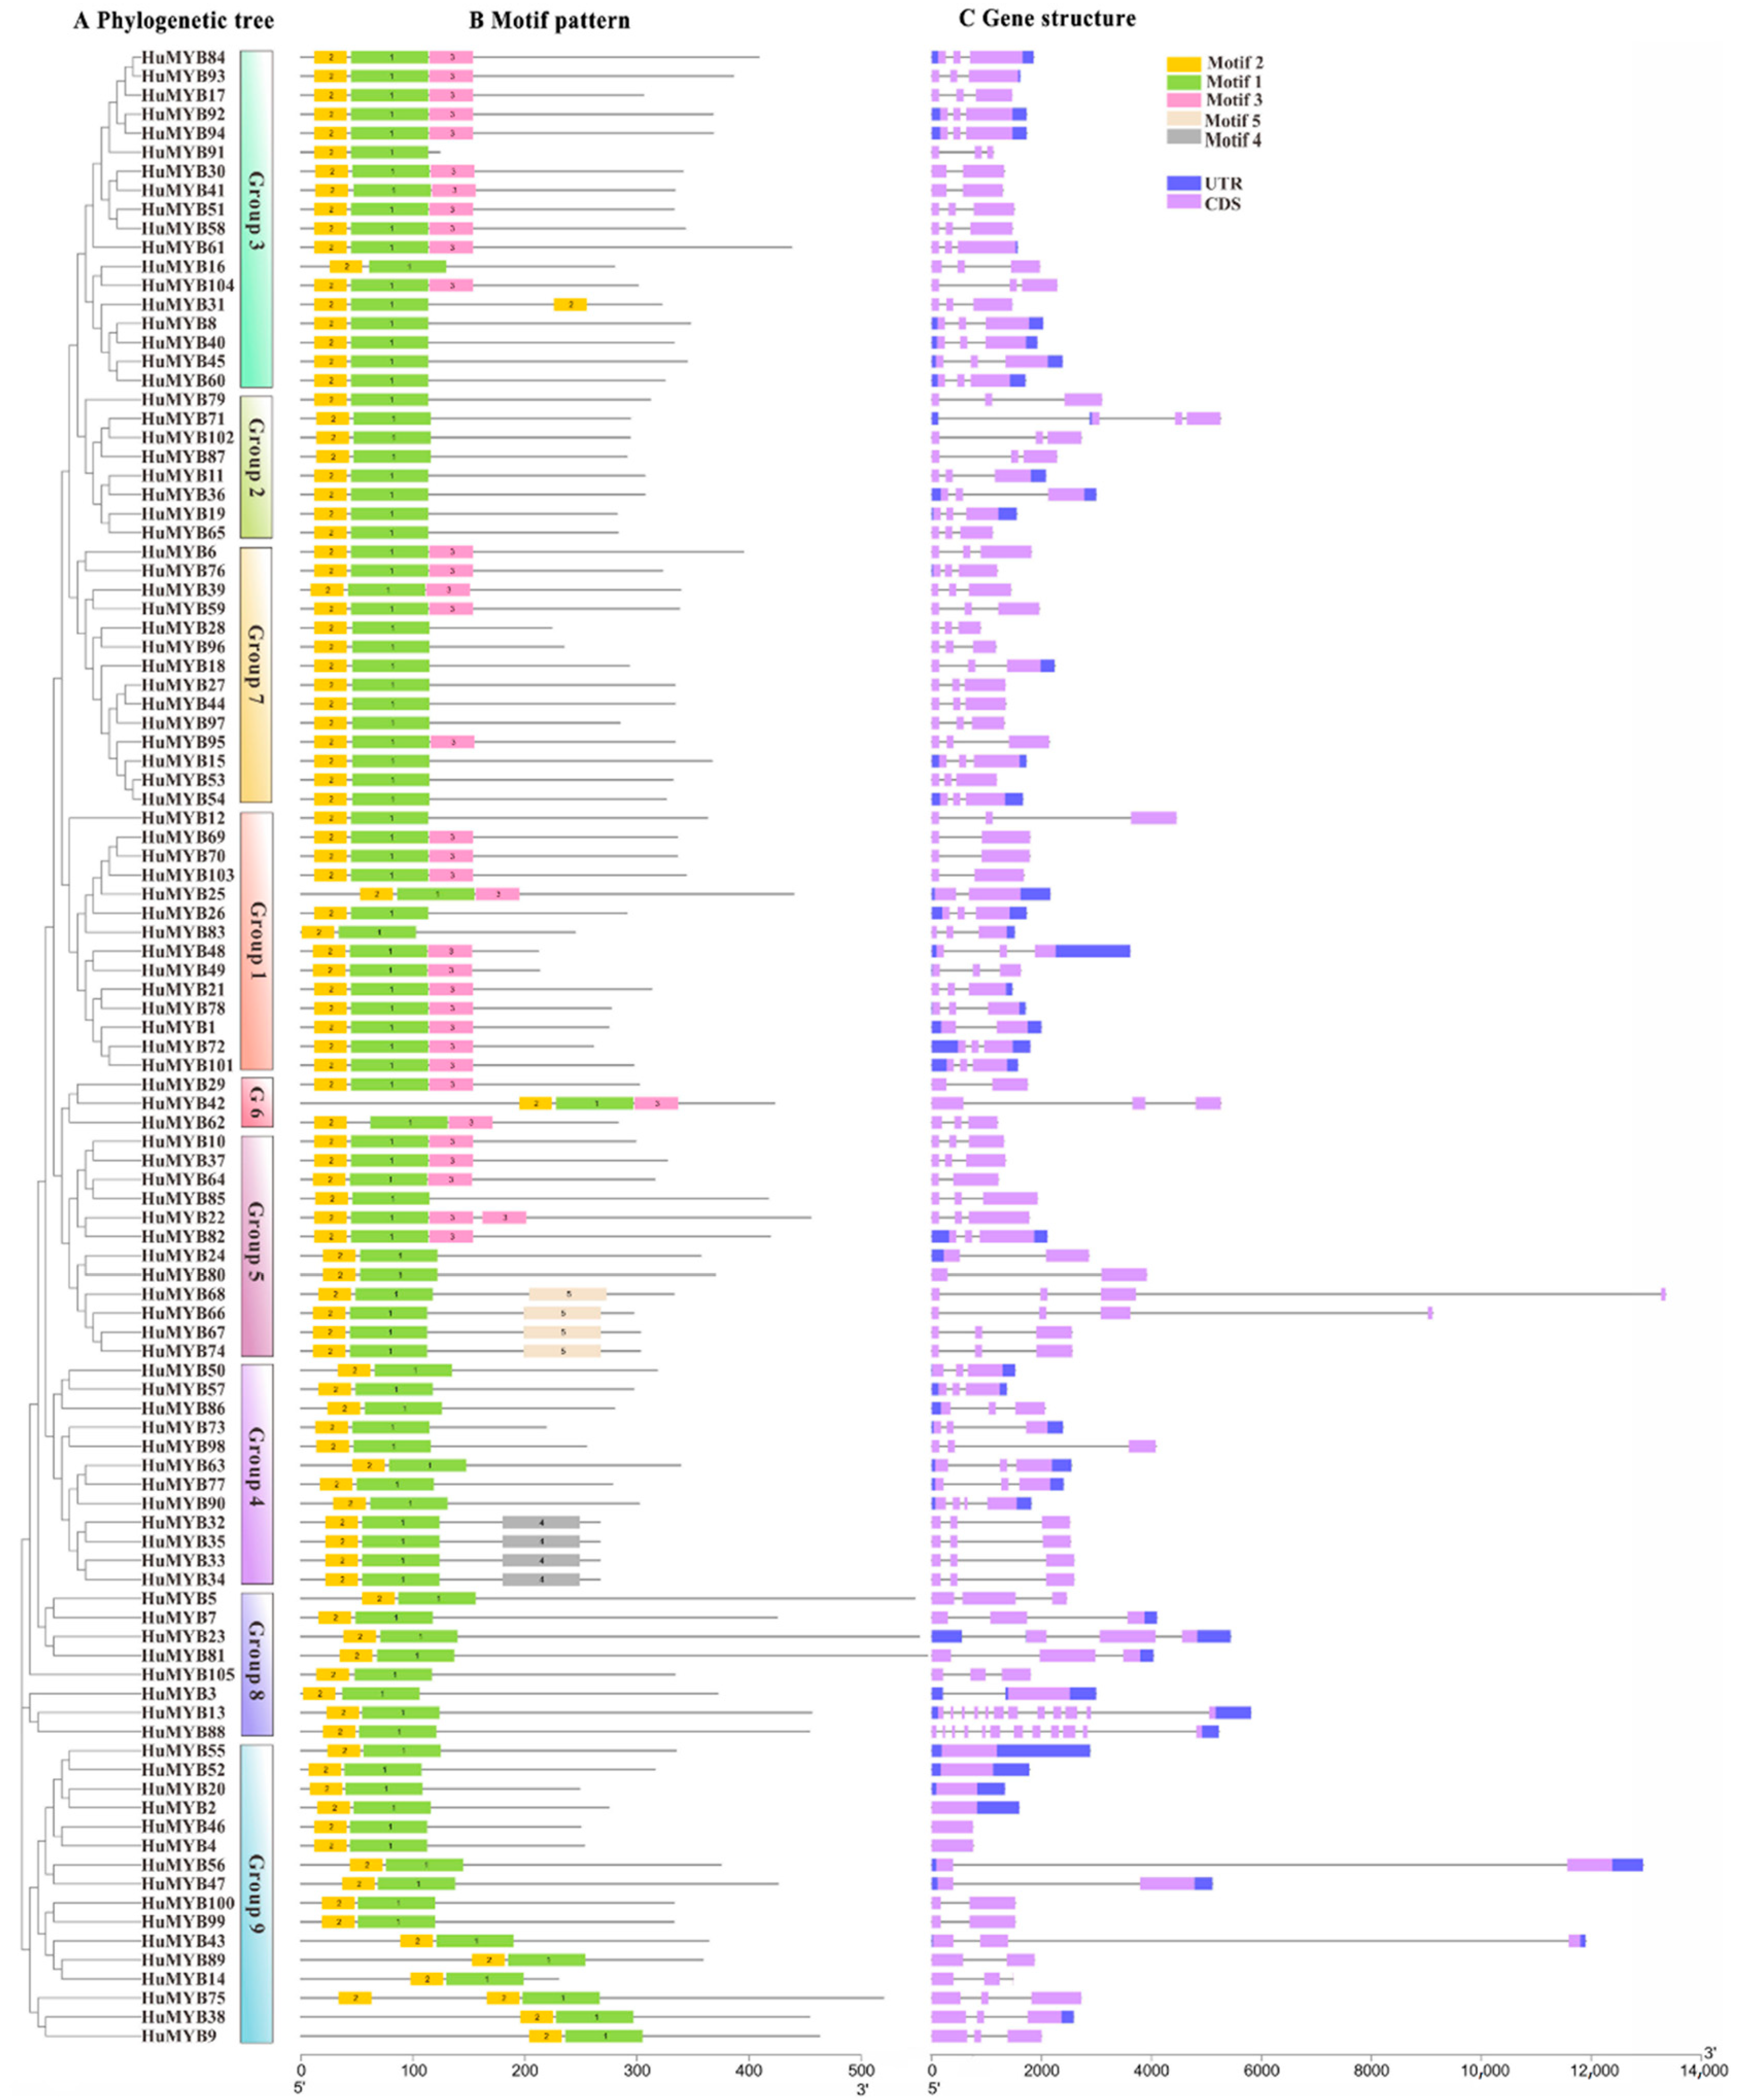
3.4. Phylogenetic, Gene Structure and Motif Composition Analyses of R2R3-MYBs
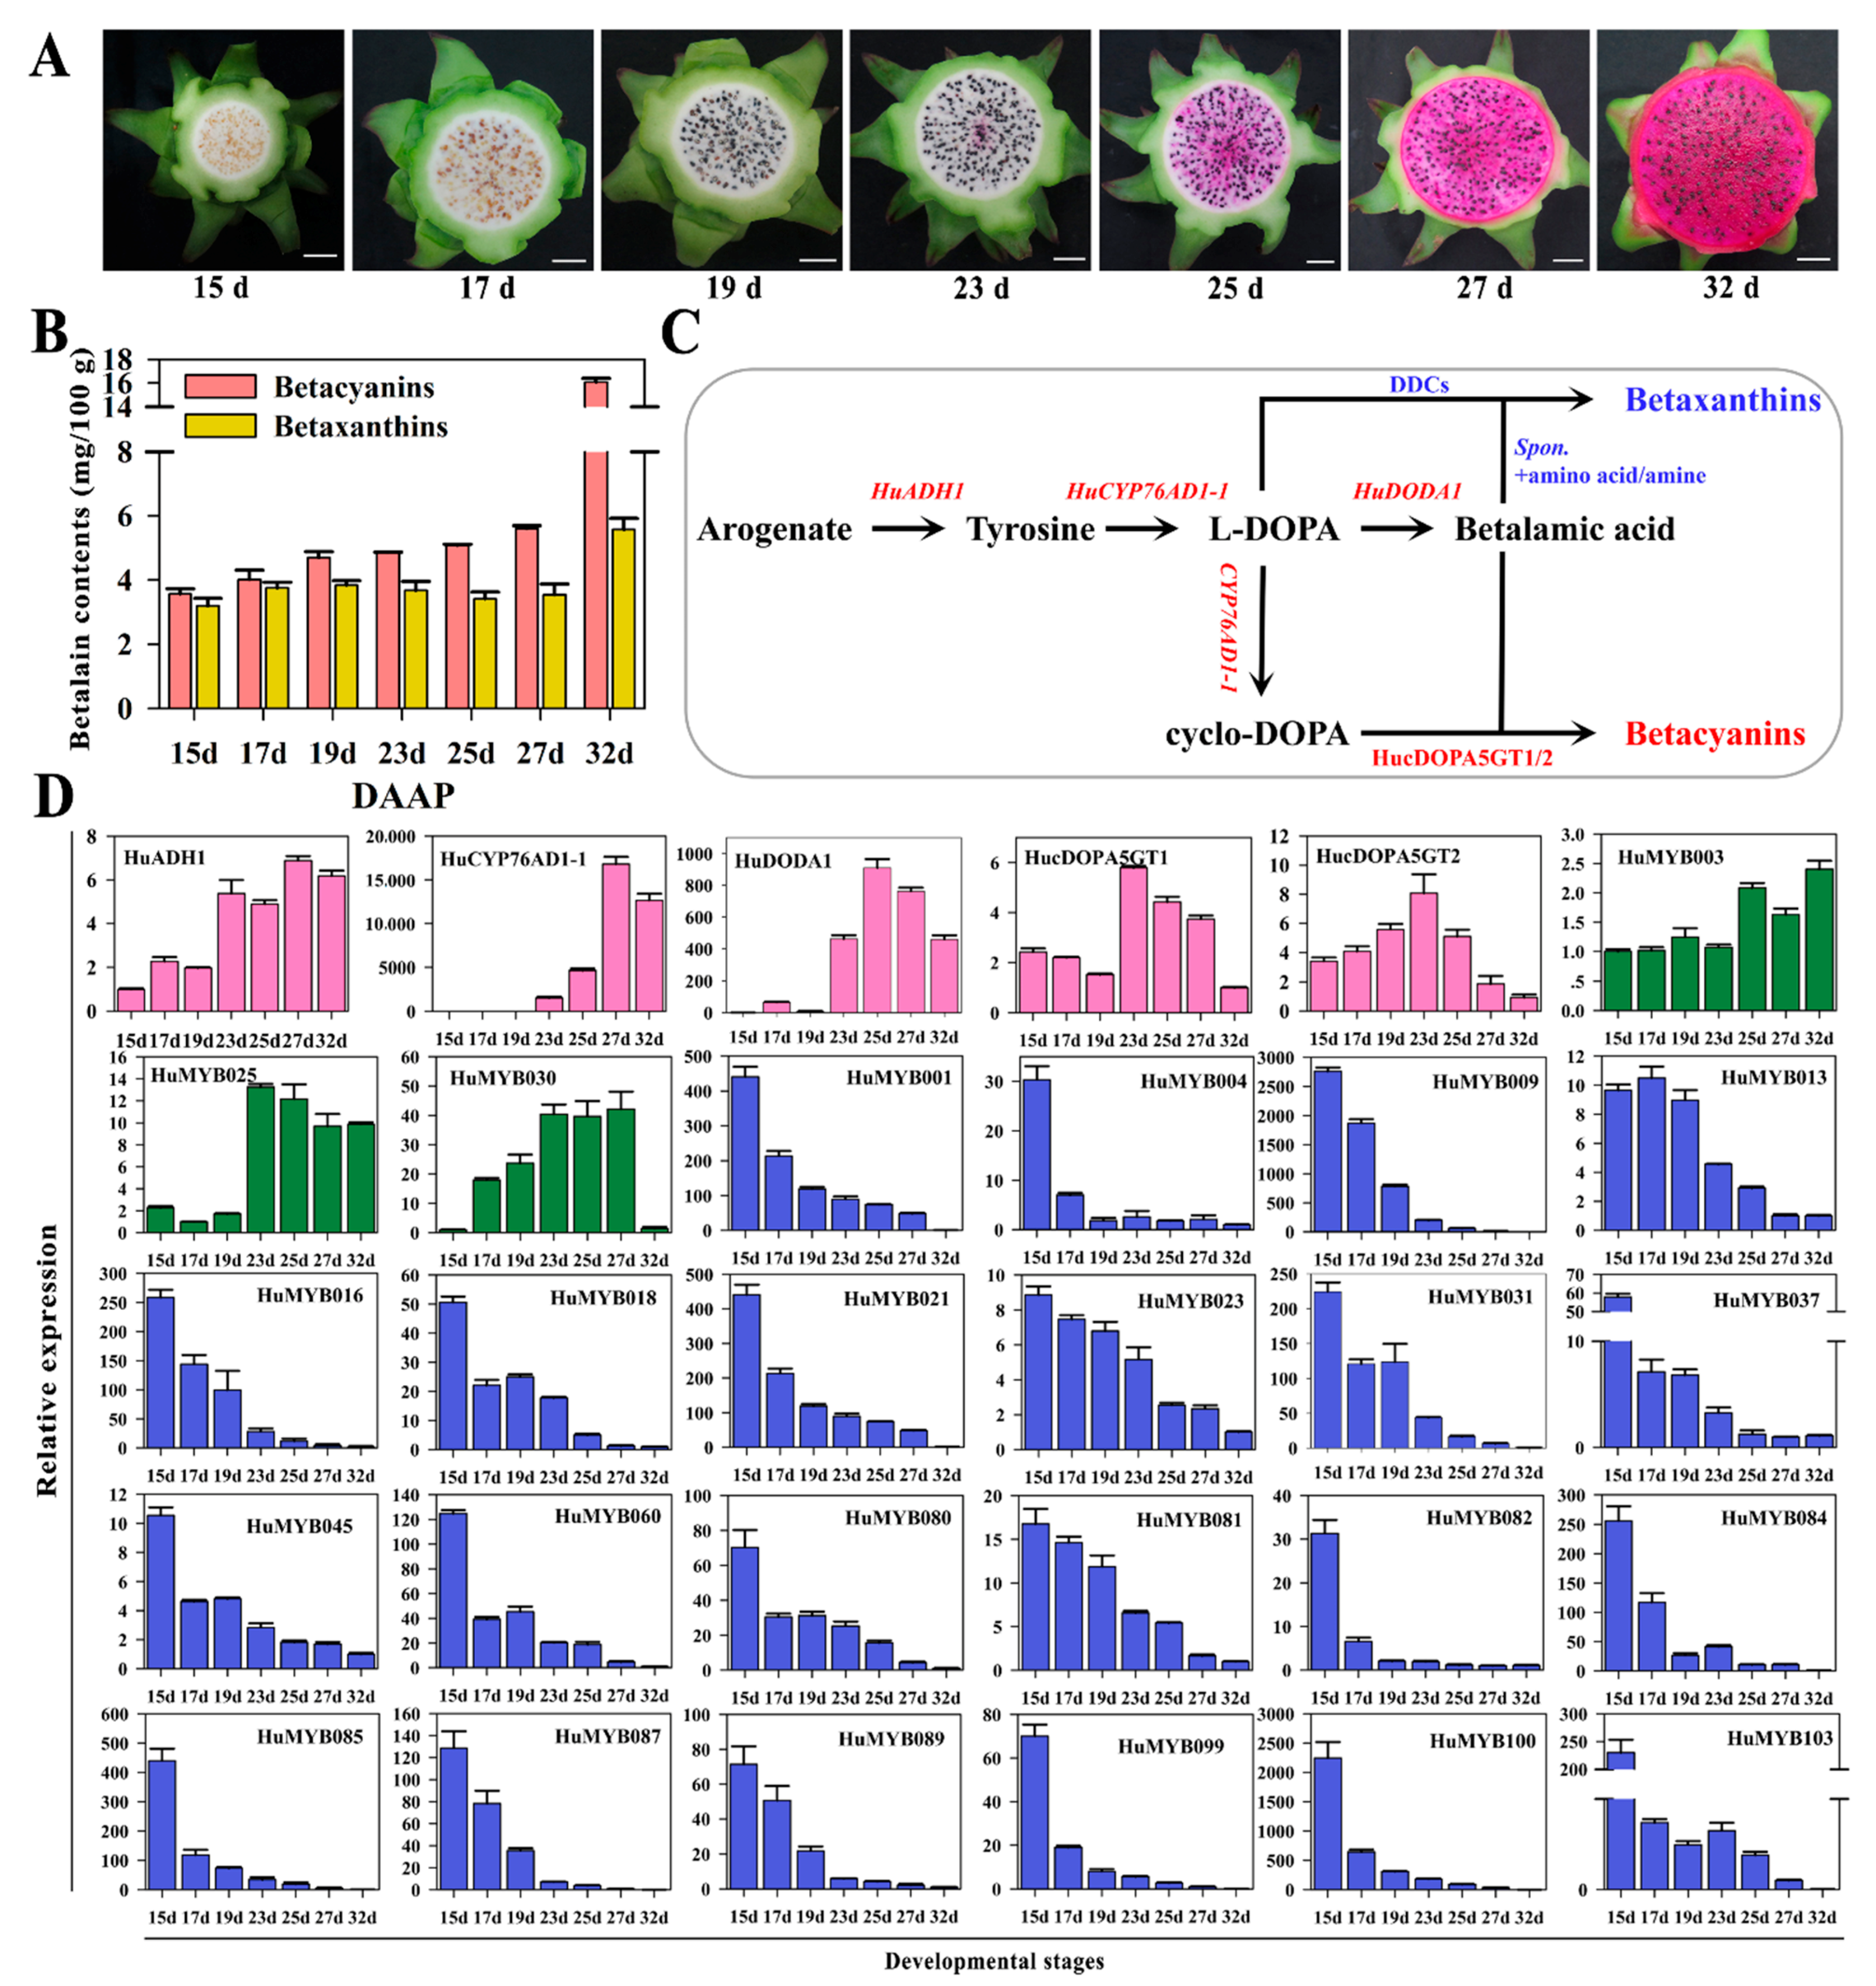
3.5. Betalain Measurement and Expression Analyses of R2R3-MYBs during Pitaya Fruit Ripening
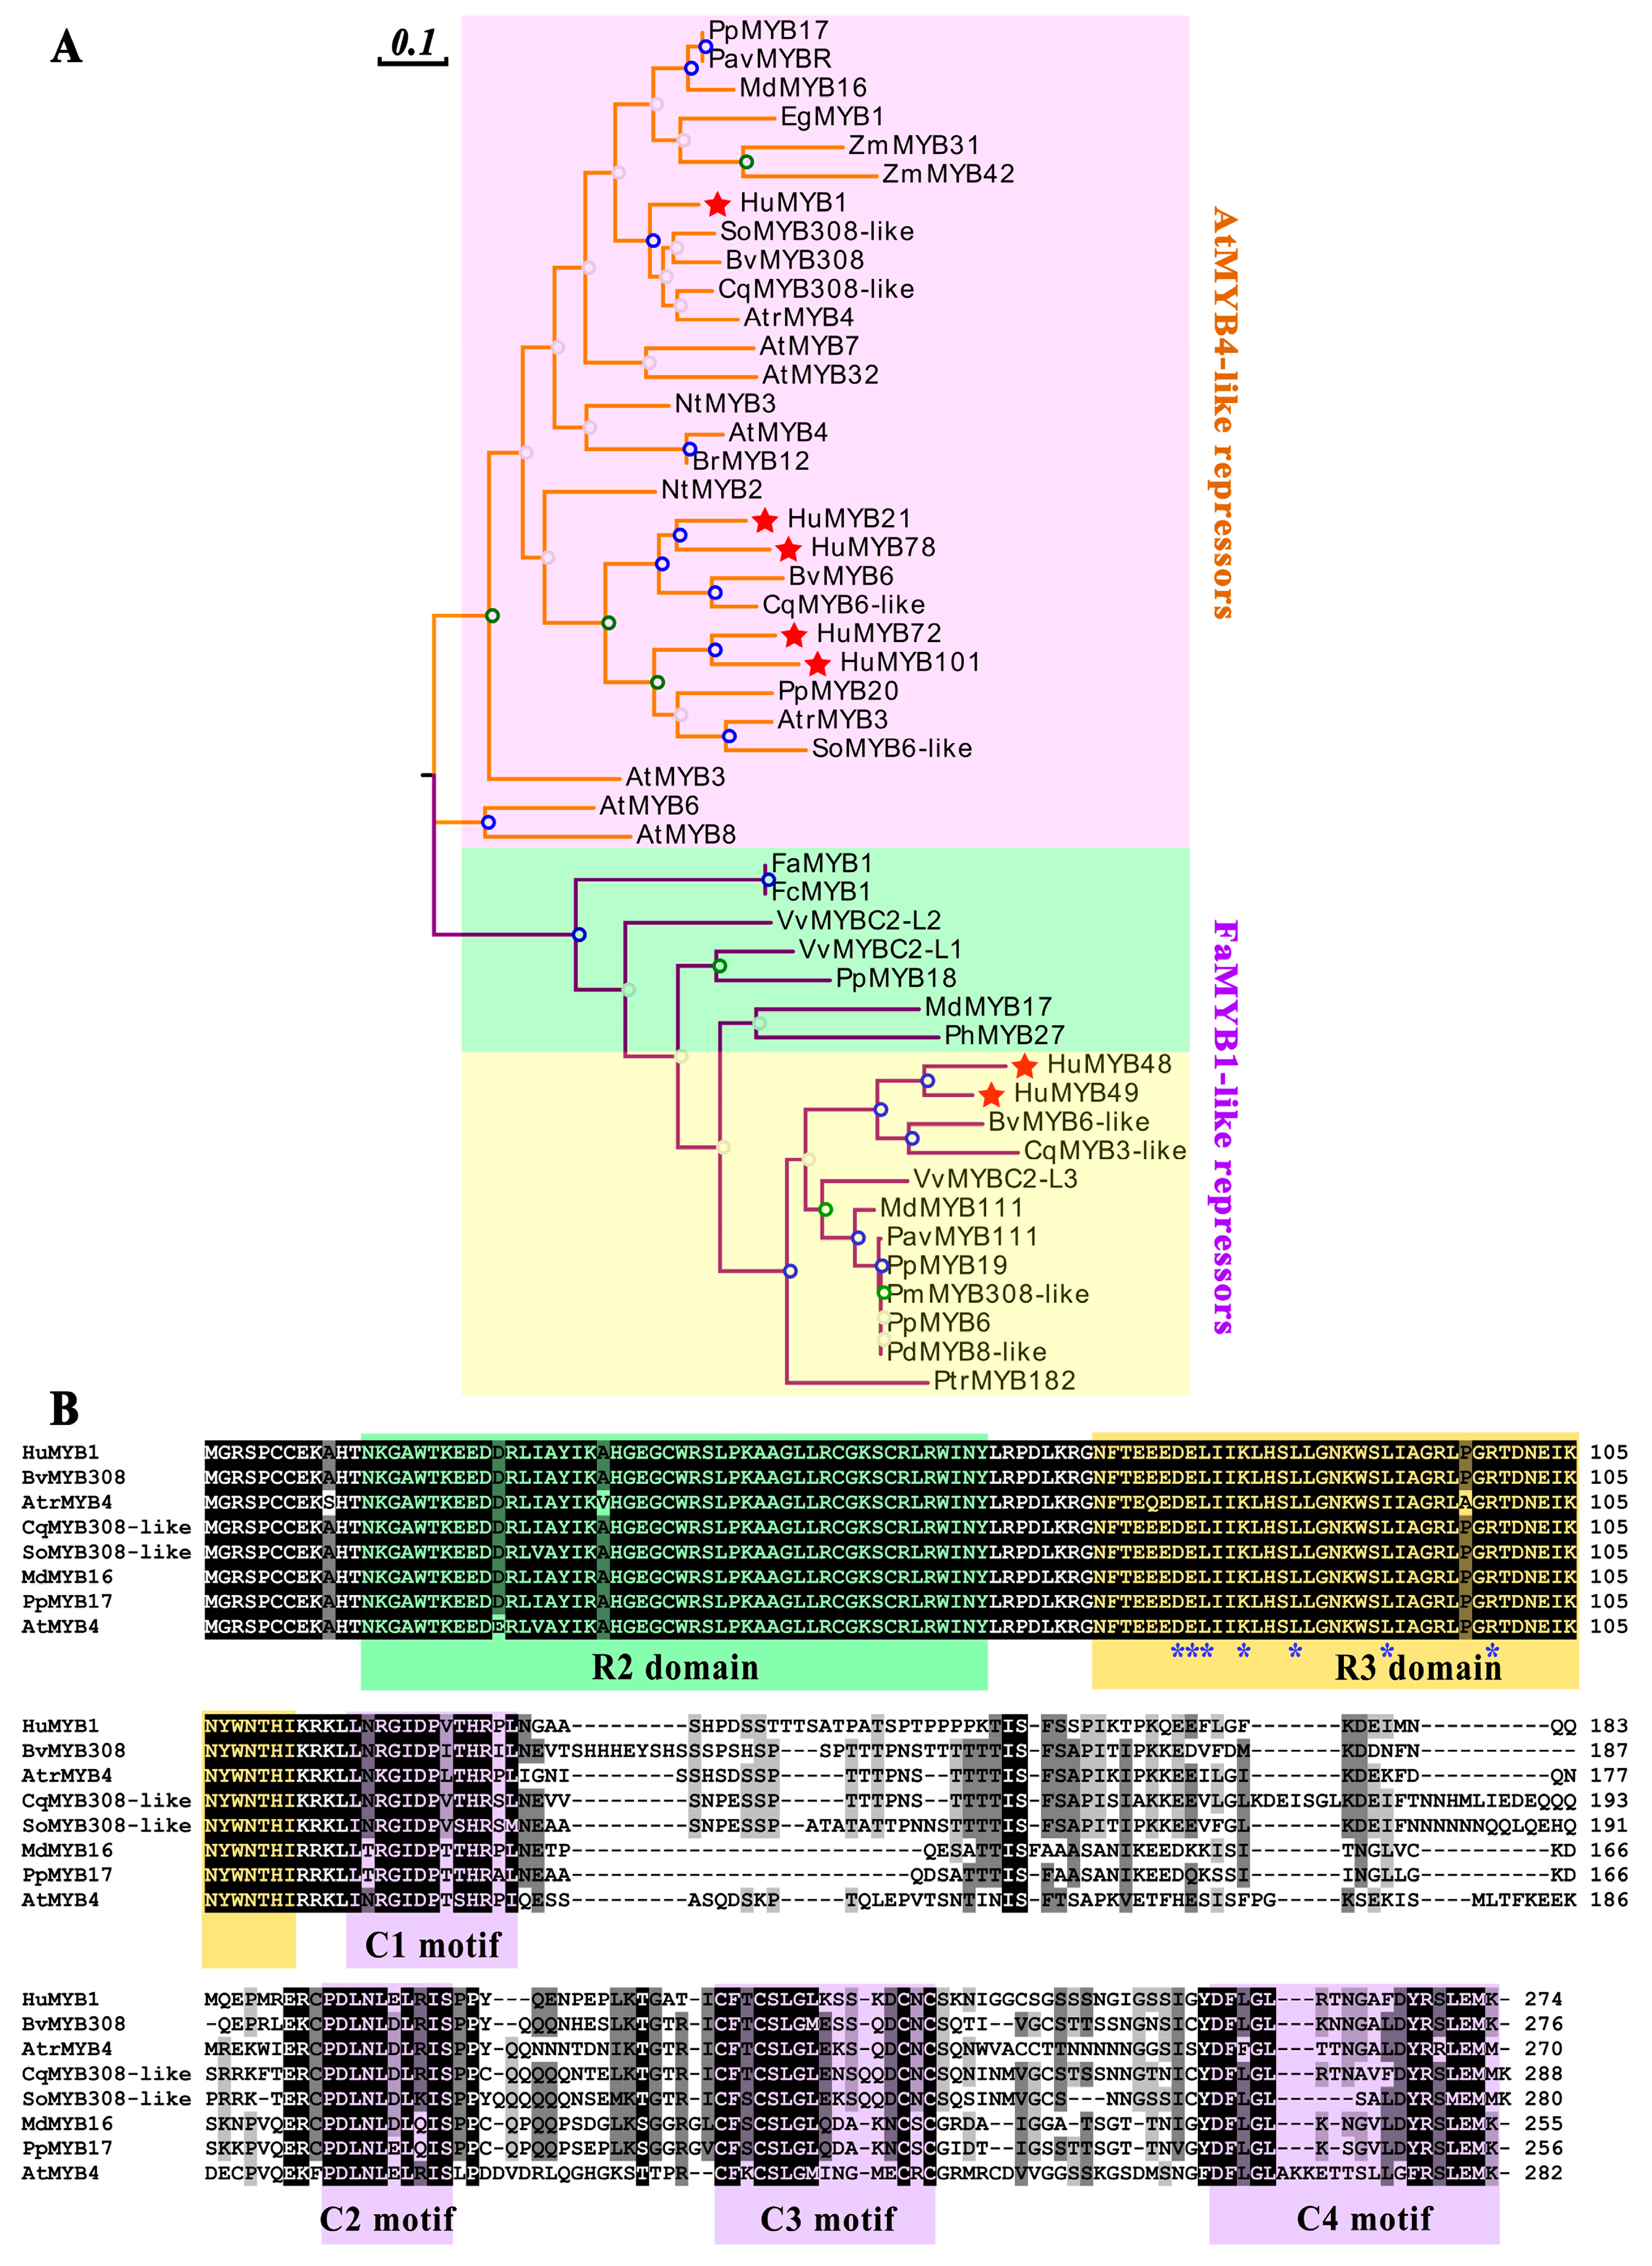
3.6. Phylogenetic and Sequence Analyses of Pitaya 2R-MYB Repressors
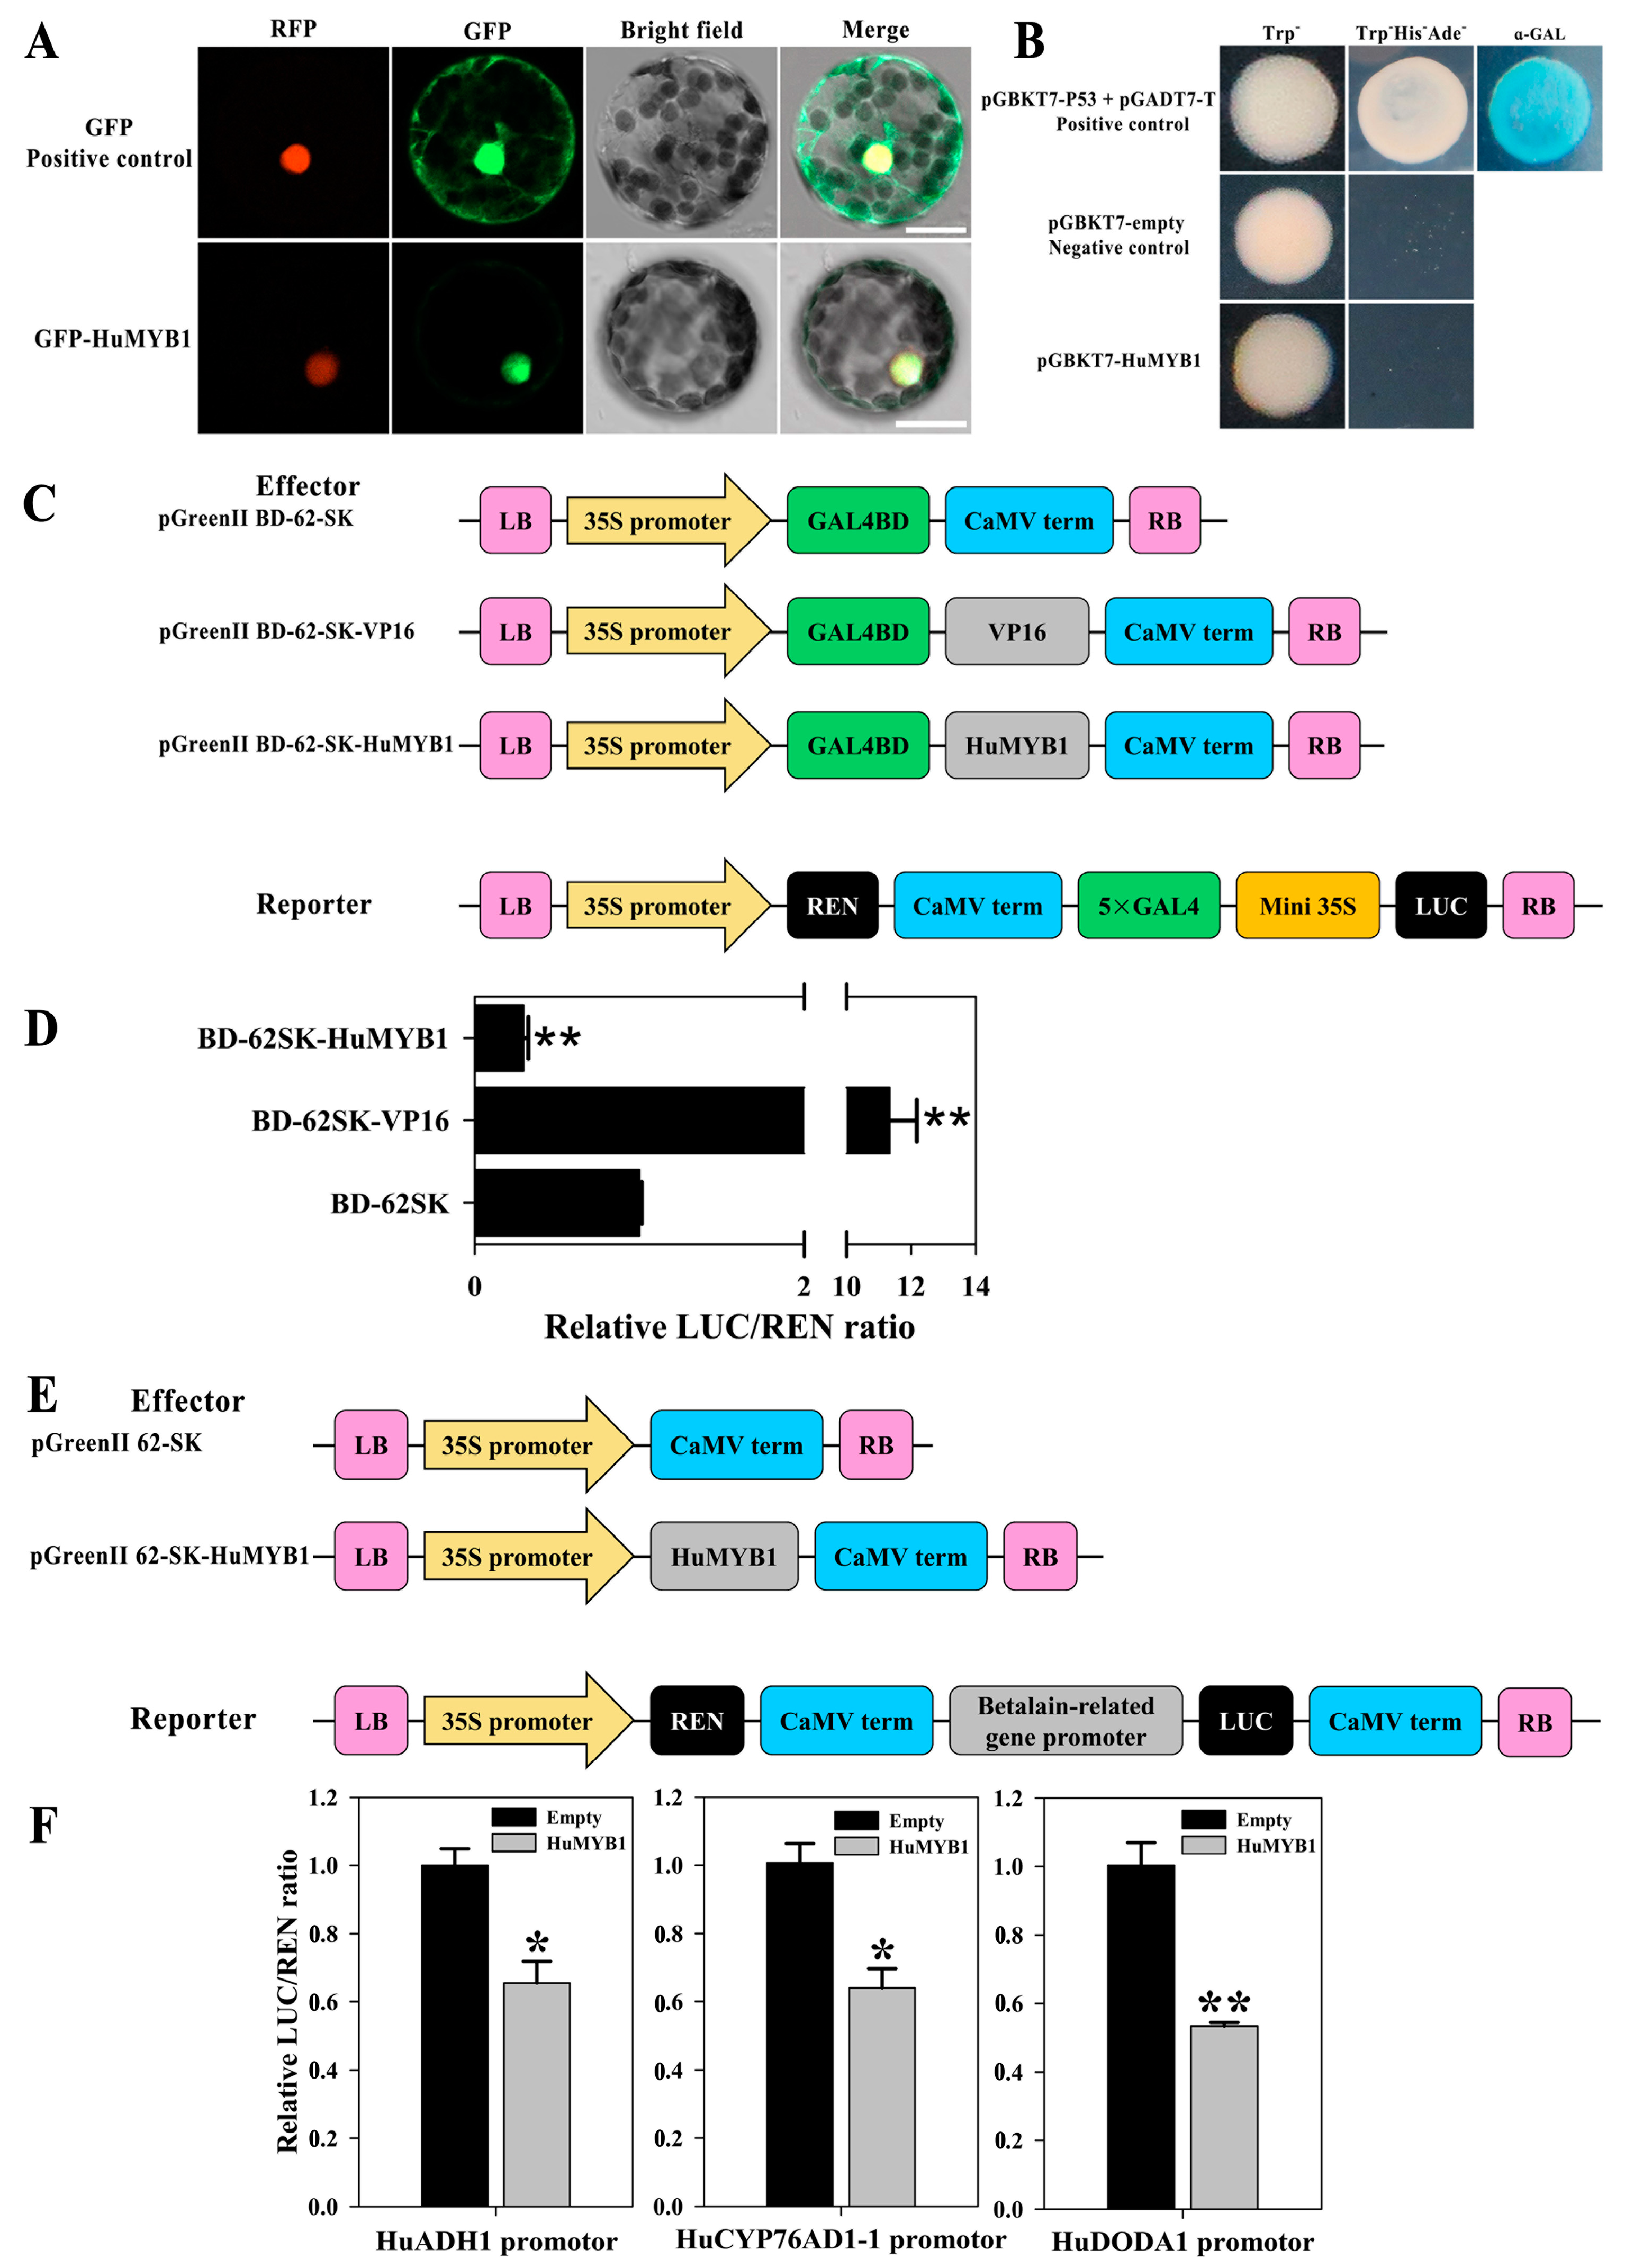
3.7. HuMYB1 Is a Nucleus-Localized Transcription Repressor
3.8. HuMYB1 Inhibited the Transcription of Three Betalain Biosynthesis-Related Genes
4. Discussion
5. Conclusions
Supplementary Materials
Author Contributions
Funding
Institutional Review Board Statement
Informed Consent Statement
Data Availability Statement
Conflicts of Interest
References
- Liu, L.S.; White, M.J.; Macrae, T.H. Transcription factors and their genes in higher plants: Functional domains, evolution and regulation. Eur. J. Biochem. 1999, 262, 247–257. [Google Scholar] [CrossRef]
- Jia, L.; Clegg, M.T.; Jiang, T. Evolutionary dynamics of the DNA-binding domains in putative R2R3-MYB genes identified from rice subspecies indica and japonica genomes. Plant Physiol. 2004, 134, 575–585. [Google Scholar] [CrossRef] [Green Version]
- Dubos, C.; Stracke, R.; Grotewold, E.; Weisshaar, B.; Martin, C.; Lepiniec, L. MYB transcription factors in Arabidopsis. Trends Plant Sci. 2010, 15, 573–581. [Google Scholar] [CrossRef]
- Rosinski, J.A.; Atchley, W.R. Molecular evolution of the Myb family of transcription factors: Evidence for polyphyletic origin. J. Mol. Evol. 1998, 46, 74–83. [Google Scholar] [CrossRef]
- Jiang, C.; Gu, J.; Chopra, S.; Gu, X.; Peterson, T. Ordered origin of the typical two- and three-repeat Myb genes. Gene 2004, 326, 13–22. [Google Scholar] [CrossRef] [PubMed]
- Du, H.; Liang, Z.; Zhao, S.; Nan, M.G.; Tran, L.S.; Lu, K.; Huang, Y.B.; Li, J.N. The evolutionary history of R2R3-MYB proteins across 50 eukaryotes: New insights into subfamily classification and expansion. Sci. Rep. 2015, 5, 11037. [Google Scholar] [CrossRef] [Green Version]
- Jiang, C.K.; Rao, G.Y. Insights into the diversification and evolution of R2R3-MYB transcription factors in plants. Plant Physiol. 2020, 183, 637–655. [Google Scholar] [CrossRef] [PubMed]
- Klempnauer, K.H.; Gonda, T.J.; Bishop, J.M. Nucleotide sequence of the retroviral leukemia gene v-myb and its cellular progenitor c-myb: The architecture of a transduced oncogene. Cell 1982, 31, 453–463. [Google Scholar] [CrossRef]
- Paz-Ares, J.; Ghosal, D.; Wienand, U.; Peterson, P.A.; Saedler, H. The regulatory c1 locus of Zea mays encodes a protein with homology to myb proto-oncogene products and with structural similarities to transcriptional activators. EMBO J. 1987, 6, 3553–3558. [Google Scholar] [CrossRef]
- Matus, J.T.; Aquea, F.; Arce-Johnson, P. Analysis of the grape MYB R2R3 subfamily reveals expanded wine quality-related clades and conserved gene structure organization across Vitis and Arabidopsis genomes. BMC Plant Biol. 2008, 8, 83. [Google Scholar] [CrossRef] [Green Version]
- Cao, Z.H.; Zhang, S.Z.; Wang, R.K.; Zhang, R.F.; Hao, Y.J. Genome wide analysis of the apple MYB transcription factor family allows the identification of MdoMYB121 gene confering abiotic stress tolerance in plants. PLoS ONE 2013, 8, e69955. [Google Scholar] [CrossRef] [PubMed]
- Li, W.; Ding, Z.; Ruan, M.; Yu, X.; Peng, M.; Liu, Y. Kiwifruit R2R3-MYB transcription factors and contribution of the novel AcMYB75 to red kiwifruit anthocyanin biosynthesis. Sci. Rep. 2017, 7, 16861. [Google Scholar] [CrossRef] [Green Version]
- Liu, C.; Xie, T.; Chen, C.; Luan, A.; Long, J.; Li, C.; Ding, Y.; He, Y. Genome-wide organization and expression profiling of the R2R3-MYB transcription factor family in pineapple (Ananas comosus). BMC Genom. 2017, 18, 503. [Google Scholar] [CrossRef] [Green Version]
- Xu, Q.; He, J.; Dong, J.; Hou, X.; Zhang, X. Genomic survey and expression profiling of the MYB gene family in watermelon. Hortic. Plant J. 2018, 4, 1–15. [Google Scholar] [CrossRef]
- Pucker, B.; Pandey, A.; Weisshaar, B.; Stracke, R. The R2R3-MYB gene family in banana (Musa acuminata): Genome-wide identification, classification and expression patterns. PLoS ONE 2020, 15, e0239275. [Google Scholar] [CrossRef]
- Stracke, R.; Holtgräwe, D.; Schneider, J.; Pucker, B.; Sörensen, T.R.; Weisshaar, B. Genome-wide identification and characterisation of R2R3-MYB genes in sugar beet (Beta vulgaris). BMC Plant Biol. 2014, 14, 249. [Google Scholar] [CrossRef] [PubMed] [Green Version]
- Hatlestad, G.J.; A Akhavan, N.; Sunnadeniya, R.M.; Elam, L.; Cargile, S.; Hembd, A.; González, A.; McGrath, J.M.; Lloyd, A.M. The beet Y locus encodes an anthocyanin MYB-like protein that activates the betalain red pigment pathway. Nat. Genet. 2014, 47, 92–96. [Google Scholar] [CrossRef] [PubMed]
- Ibrahim, S.R.M.; Mohamed, G.A.; Khedr, A.; Zayed, M.; El-Kholy, A.A.E.S. Genus Hylocereus: Beneficial phytochemicals, nutritional importance, and biological relevance—A review. J. Food Biochem. 2018, 42, e12491. [Google Scholar] [CrossRef]
- Hatlestad, G.J.; Sunnadeniya, R.M.; A Akhavan, N.; González, A.; Goldman, I.L.; McGrath, J.M.; Lloyd, A.M. The beet R locus encodes a new cytochrome P450 required for red betalain production. Nat. Genet. 2012, 44, 816–820. [Google Scholar] [CrossRef] [PubMed]
- Lopez-Nieves, S.; Yang, Y.; Timoneda, A.; Wang, M.; Feng, T.; Smith, S.A.; Brockington, S.F.; Maeda, H.A. Relaxation of tyrosine pathway regulation underlies the evolution of betalain pigmentation in Caryophyllales. New Phytol. 2018, 217, 896–908. [Google Scholar] [CrossRef] [PubMed] [Green Version]
- Brockington, S.F.; Yang, Y.; Gandia-Herrero, F.; Covshoff, S.; Hibberd, J.M.; Sage, R.F.; Wong, G.K.S.; Moore, M.; Smith, S. Lineage-specific gene radiations underlie the evolution of novel betalain pigmentation in Caryophyllales. New Phytol. 2015, 207, 1170–1180. [Google Scholar] [CrossRef] [PubMed]
- Bean, A.; Sunnadeniya, R.; Akhavan, N.; Campbell, A.; Brown, M.; Lloyd, A. Gain-of-function mutations in beet DODA2 identify key residues for betalain pigment evolution. New Phytol. 2018, 219, 287–296. [Google Scholar] [CrossRef] [PubMed] [Green Version]
- Timoneda, A.; Feng, T.; Sheehan, H.; Walker-Hale, N.; Pucker, B.; Lopez-Nieves, S.; Guo, R.; Brockington, S. The evolution of betalain biosynthesis in Caryophyllales. New Phytol. 2019, 224, 71–85. [Google Scholar] [CrossRef] [PubMed] [Green Version]
- Gengatharan, A.; Dykes, G.A.; Choo, W.S. Betalains: Natural plant pigments with potential application in functional foods. LWT-Food Sci.Technol. 2015, 64, 645–649. [Google Scholar] [CrossRef]
- Polturak, G.; Aharoni, A. Advances and future directions in betalain metabolic engineering. New Phytol. 2019, 224, 1472–1478. [Google Scholar] [CrossRef] [PubMed] [Green Version]
- Bateman, A.; Coin, L.; Durbin, R.; Finn, R.D.; Hollich, V.; Griffits-Jones, S.; Khanna, A.; Marshall, M.; Moxon, S.; Sonnhammer, E.L.L.; et al. The Pfam protein families database. Nucleic Acids Res. 2004, 32, D138–D141. [Google Scholar] [CrossRef]
- Chen, J.; Xie, F.; Cui, Y.; Chen, C.; Lu, W.; Hu, X.; Hua, Q.; Zhao, J.; Wu, Z.; Gao, D.; et al. A chromosome-scale genome sequence of pitaya (Hylocereus undatus) provides novel insights into the genome evolution and regulation of betalain biosynthesis. Hortic. Res. 2021, 8, 1–15. [Google Scholar] [CrossRef]
- Chen, C.; Chen, H.; Zhang, Y.; Thomas, H.R.; Frank, M.H.; He, Y.; Xia, R. TBtools: An integrative toolkit developed for interactive analyses of big biological data. Mol. Plant 2020, 13, 1194–1202. [Google Scholar] [CrossRef]
- Wang, Y.; Tang, H.; DeBarry, J.; Tan, X.; Li, J.; Wang, X.; Lee, T.H.; Jin, H.; Marler, B.; Guo, H.; et al. MCScanX: A toolkit for detection and evolutionary analysis of gene synteny and collinearity. Nucleic Acids Res. 2012, 40, e49. [Google Scholar] [CrossRef] [Green Version]
- Hua, Q.; Chen, C.; Tel-Zur, N.; Wang, H.; Wu, J.; Chen, J.; Zhang, Z.; Zhao, J.; Hu, G.; Qin, Y. Metabolomic characterization of pitaya fruit from three red-skinned cultivars with different pulp colors. Plant Physiol. Biochem. 2018, 126, 117–125. [Google Scholar] [CrossRef]
- Chen, C.; Wu, J.; Hua, Q.; Tel-Zur, N.; Xie, F.; Zhang, Z.; Chen, J.; Zhang, R.; Hu, G.; Zhao, J.; et al. Identification of reliable reference genes for quantitative real-time PCR normalization in pitaya. Plant Methods 2019, 15, 1–12. [Google Scholar] [CrossRef] [Green Version]
- Livak, K.J.; Schmittgen, T.D. Analysis of relative gene expression data using real-time quantitative PCR and the 2−ΔΔCT method. Methods 2001, 25, 402–408. [Google Scholar] [CrossRef]
- Lai, B.; Du, L.; Liu, R.; Hu, B.; Su, W.; Qin, Y.; Zhao, J.; Wang, H.; Hu, G. Two LcbHLH transcription factors interacting with LcMYB1 in regulating late structural genes of anthocyanin biosynthesis in nicotiana and Litchi chinensis during anthocyanin accumulation. Front. Plant Sci. 2016, 7, 166. [Google Scholar] [CrossRef] [Green Version]
- Yang, Y.; Shan, W.; Kuang, J.; Chen, J.; Lu, W. Four HD-ZIPs are involved in banana fruit ripening by activating the transcription of ethylene biosynthetic and cell wall-modifying genes. Plant Cell Rep. 2019, 39, 351–362. [Google Scholar] [CrossRef]
- Rotman, N.; Durbarry, A.; Wardle, A.; Yang, W.C.; Chaboud, A.; Faure, J.E.; Berger, F.; Twell, D. A novel class of MYB factors controls sperm-cell formation in plants. Curr. Biol. 2005, 15, 244–248. [Google Scholar] [CrossRef] [PubMed] [Green Version]
- Li, C.; Lu, S. Genome-wide characterization and comparative analysis of R2R3-MYB transcription factors shows the complexity of MYB-associated regulatory networks in Salvia miltiorrhiza. BMC Genom. 2014, 15, 277. [Google Scholar] [CrossRef] [PubMed] [Green Version]
- Wang, Z.; Tang, J.; Hu, R.; Wu, P.; Hou, X.; Song, X.; Xiong, A. Genome-wide analysis of the R2R3-MYB transcription factor genes in Chinese cabbage (Brassica rapa ssp. pekinensis) reveals their stress and hormone responsive patterns. BMC Genom. 2015, 16, 17–21. [Google Scholar] [CrossRef] [PubMed] [Green Version]
- Wilkins, O.; Nahal, H.; Foong, J.; Provart, N.J.; Campbell, M.M. Expansion and diversification of the Populus R2R3-MYB family of transcription factors. Plant Physiol. 2009, 149, 981–993. [Google Scholar] [CrossRef] [PubMed] [Green Version]
- Soler, M.; Camargo, E.L.O.; Carocha, V.; Cassan-Wang, H.; San Clemente, H.; Savelli, B.; Hefer, C.A.; Paiva, J.A.P.; Myburg, A.A.; Grima-Pettenati, J. The eucalyptus grandis R2R3-MYB transcription factor family: Evidence for woody growth-related evolution and function. New Phytol. 2015, 206, 1364–1377. [Google Scholar] [CrossRef]
- Cannon, S.B.; Mitra, A.; Baumgarten, A.; Young, N.D.; May, G. The roles of segmental and tandem gene duplication in the evolution of large gene families in Arabidopsis thaliana. BMC Plant Biol. 2004, 4, 10. [Google Scholar] [CrossRef] [PubMed] [Green Version]
- Yu, J.; Wang, J.; Lin, W.; Li, S.G.; Li, H.; Zhou, J.; Ni, P.; Dong, W.; Hu, S.; Zeng, C.; et al. The genomes of Oryza sativa: A history of duplications. PLoS Biol. 2005, 3, 266–281. [Google Scholar] [CrossRef] [Green Version]
- Romano, J.M.; Dubos, C.; Prouse, M.B.; Wilkins, O.; Hong, H.; Poole, M.; Kang, K.Y.; Li, E.; Douglas, C.J.; Western, T.L.; et al. AtMYB61, an R2R3-MYB transcription factor, functions as a pleiotropic regulator via a small gene network. New Phytol. 2012, 195, 774–786. [Google Scholar] [CrossRef]
- Cheng, M.; Huang, Z.; Hua, Q.; Shan, W.; Kuang, J.; Lu, W.; Qin, Y.; Chen, J. The WRKY transcription factor HpWRKY44 regulates CytP450-like1 expression in red pitaya fruit (Hylocereus polyrhizus). Hortic. Res. 2017, 4, 17039. [Google Scholar] [CrossRef] [PubMed] [Green Version]
- Agarwal, T.; Grotewold, E.; Doseff, A.I.; Gray, J. MYB31/MYB42 syntelogs exhibit divergent regulation of phenylpropanoid genes in maize, sorghum and rice. Sci. Rep. 2016, 6, 28502. [Google Scholar] [CrossRef] [PubMed] [Green Version]
- Anwar, M.; Wang, G.; Wu, J.; Waheed, S.; Allan, A.C.; Zeng, L. Ectopic overexpression of a novel R2R3-MYB, NtMYB2 from Chinese narcissus represses anthocyanin biosynthesis in tobacco. Molecules 2018, 23, 781. [Google Scholar] [CrossRef] [Green Version]
- Zhou, H.; Peng, Q.; Zhao, J.; Owiti, A.; Ren, F.; Liao, L.; Wang, L.; Deng, X.; Jiang, Q.; Han, Y. Multiple R2R3-MYB transcription factors involved in the regulation of anthocyanin accumulation in peach flower. Front. Plant Sci. 2016, 7, 1557. [Google Scholar] [CrossRef]
- Ma, D.; Reichelt, M.; Yoshida, K.; Gershenzon, J.; Constabel, C.P. Two R2R3-MYB proteins are broad repressors of flavonoid and phenylpropanoid metabolism in poplar. Plant J. 2018, 96, 949–965. [Google Scholar] [CrossRef] [Green Version]
- Cavallini, E.; Matus, J.T.; Finezzo, L.; Zenoni, S.; Loyola, R.; Guzzo, F.; Schlechter, R.; Ageorges, A.; Arce-Johnson, P.; Tornielli, G.B. The phenylpropanoid pathway is controlled at different branches by a set of R2R3-MYB C2 repressors in grapevine. Plant Physiol. 2015, 167, 1448–1470. [Google Scholar] [CrossRef]
- Jin, H.; Cominelli, E.; Bailey, P.; Parr, A.; Mehrtens, F.; Jones, J.; Tonelli, C.; Weisshaar, B.; Martin, C. Transcriptional repression by AtMYB4 controls production of UV-protecting sunscreens in Arabidopsis. EMBO J. 2000, 19, 6150–6161. [Google Scholar] [CrossRef] [Green Version]
- Kagale, S.; Links, M.; Rozwadowski, K. Genome-wide analysis of ethylene-responsive element binding factor-associated amphiphilic repression motif-containing transcriptional regulators in Arabidopsis. Plant Physiol. 2010, 152, 1109–1134. [Google Scholar] [CrossRef] [PubMed] [Green Version]
- Kranz, H.D.; Denekamp, M.; Greco, R.; Jin, H.; Leyva, A.; Meissner, R.C.; Petroni, K.; Urzainqui, A.; Bevan, M.; Martin, C.; et al. Towards functional characterisation of the members of the R2R3-MYB gene family from Arabidopsis thaliana. Plant J. 1998, 16, 263–276. [Google Scholar] [CrossRef]
- Colquhoun, T.A.; Verdonk, J.; Schimmel, B.; Tieman, D.M.; Underwood, B.A.; Clark, D.G. Petunia floral volatile benzenoid/phenylpropanoid genes are regulated in a similar manner. Phytochemistry 2010, 71, 158–167. [Google Scholar] [CrossRef] [PubMed]
- Chen, L.; Hu, B.; Qin, Y.; Hu, G.; Zhao, J. Advance of the negative regulation of anthocyanin biosynthesis by MYB transcription factors. Plant Physiol. Biochem. 2019, 136, 178–187. [Google Scholar] [CrossRef]
- He, Q.; Jones, D.C.; Li, W.; Xie, F.; Ma, J.; Sun, R.; Wang, Q.; Zhu, S.; Zhang, B. Genome-wide identification of R2R3-MYB genes and expression analyses during abiotic stress in Gossypium raimondii. Sci. Rep. 2016, 6, 22980. [Google Scholar] [CrossRef] [PubMed] [Green Version]
- Tanaka, Y.; Sasaki, N.; Ohmiya, A. Biosynthesis of plant pigments: Anthocyanins, betalains and carotenoids. Plant J. 2008, 54, 733–749. [Google Scholar] [CrossRef] [PubMed]
- Fujita, Y.; Fujita, M.; Satoh, R.; Maruyama, K.; Parvez, M.M.; Seki, M.; Hiratsu, K.; Ohme-Takagi, M.; Shinozaki, K.; Yamaguchi-Shinozaki, K. AREB1 is a transcription activator of novel ABRE-dependent ABA signaling that enhances drought stress tolerance in Arabidopsis. Plant Cell 2005, 17, 3470–3488. [Google Scholar] [CrossRef] [Green Version]
- Ezer, D.; Shepherd, S.J.; Brestovitsky, A.; Dickinson, P.; Cortijo, S.; Charoensawan, V.; Box, M.S.; Biswas, S.; Jaeger, K.E.; Wigge, P.A. The G-Box transcriptional regulatory code in Arabidopsis. Plant Physiol. 2017, 175, 628–640. [Google Scholar] [CrossRef] [Green Version]
- Chakraborty, M.; Gangappa, S.N.; Maurya, J.P.; Sethi, V.; Srivastava, A.K.; Singh, A.; Dutta, S.; Ojha, M.; Gupta, N.; Sengupta, M.; et al. Functional interrelation of MYC2 and HY5 plays an important role in Arabidopsis seedling development. Plant J. 2019, 99, 1080–1097. [Google Scholar] [CrossRef]
- An, J.; Yao, J.; Xu, R.; You, C.; Wang, X.; Hao, Y. Apple bZIP transcription factor MdbZIP44 regulates abscisic acid-promoted anthocyanin accumulation. Plant Cell Environ. 2018, 41, 2678–2692. [Google Scholar] [CrossRef]
- Sun, Q.; Jiang, S.; Zhang, T.; Xu, H.; Fang, H.; Zhang, J.; Su, M.; Wang, Y.; Zhang, Z.; Wang, N.; et al. Apple NAC transcription factor MdNAC52 regulates biosynthesis of anthocyanin and proanthocyanidin through MdMYB9 and MdMYB11. Plant Sci. 2019, 289, 110286. [Google Scholar] [CrossRef]
- Wang, L.; Tang, W.; Hu, Y.; Zhang, Y.; Sun, J.; Guo, X.; Lu, H.; Yang, Y.; Fang, C.; Niu, X.; et al. A MYB/bHLH complex regulates tissue-specific anthocyanin biosynthesis in the inner pericarp of red-centered kiwifruit Actinidia chinensis cv. Hongyang. Plant J. 2019, 99, 359–378. [Google Scholar] [CrossRef] [PubMed]
- Peng, Y.; Thrimawithana, A.H.; Cooney, J.M.; Jensen, D.J.; Espley, R.V.; Allan, A.C. The proanthocyanin-related transcription factors MYBC1 and WRKY44 regulate branch points in the kiwifruit anthocyanin pathway. Sci. Rep. 2020, 10, 14161. [Google Scholar] [CrossRef] [PubMed]


Publisher’s Note: MDPI stays neutral with regard to jurisdictional claims in published maps and institutional affiliations. |
© 2021 by the authors. Licensee MDPI, Basel, Switzerland. This article is an open access article distributed under the terms and conditions of the Creative Commons Attribution (CC BY) license (https://creativecommons.org/licenses/by/4.0/).
Share and Cite
Xie, F.; Hua, Q.; Chen, C.; Zhang, Z.; Zhang, R.; Zhao, J.; Hu, G.; Chen, J.; Qin, Y. Genome-Wide Characterization of R2R3-MYB Transcription Factors in Pitaya Reveals a R2R3-MYB Repressor HuMYB1 Involved in Fruit Ripening through Regulation of Betalain Biosynthesis by Repressing Betalain Biosynthesis-Related Genes. Cells 2021, 10, 1949. https://0-doi-org.brum.beds.ac.uk/10.3390/cells10081949
Xie F, Hua Q, Chen C, Zhang Z, Zhang R, Zhao J, Hu G, Chen J, Qin Y. Genome-Wide Characterization of R2R3-MYB Transcription Factors in Pitaya Reveals a R2R3-MYB Repressor HuMYB1 Involved in Fruit Ripening through Regulation of Betalain Biosynthesis by Repressing Betalain Biosynthesis-Related Genes. Cells. 2021; 10(8):1949. https://0-doi-org.brum.beds.ac.uk/10.3390/cells10081949
Chicago/Turabian StyleXie, Fangfang, Qingzhu Hua, Canbin Chen, Zhike Zhang, Rong Zhang, Jietang Zhao, Guibing Hu, Jianye Chen, and Yonghua Qin. 2021. "Genome-Wide Characterization of R2R3-MYB Transcription Factors in Pitaya Reveals a R2R3-MYB Repressor HuMYB1 Involved in Fruit Ripening through Regulation of Betalain Biosynthesis by Repressing Betalain Biosynthesis-Related Genes" Cells 10, no. 8: 1949. https://0-doi-org.brum.beds.ac.uk/10.3390/cells10081949