
From Microspikes to Stress Fibers: Actin Remodeling in Breast Acini Drives Myosin II-Mediated Basement Membrane Invasion

 , , and
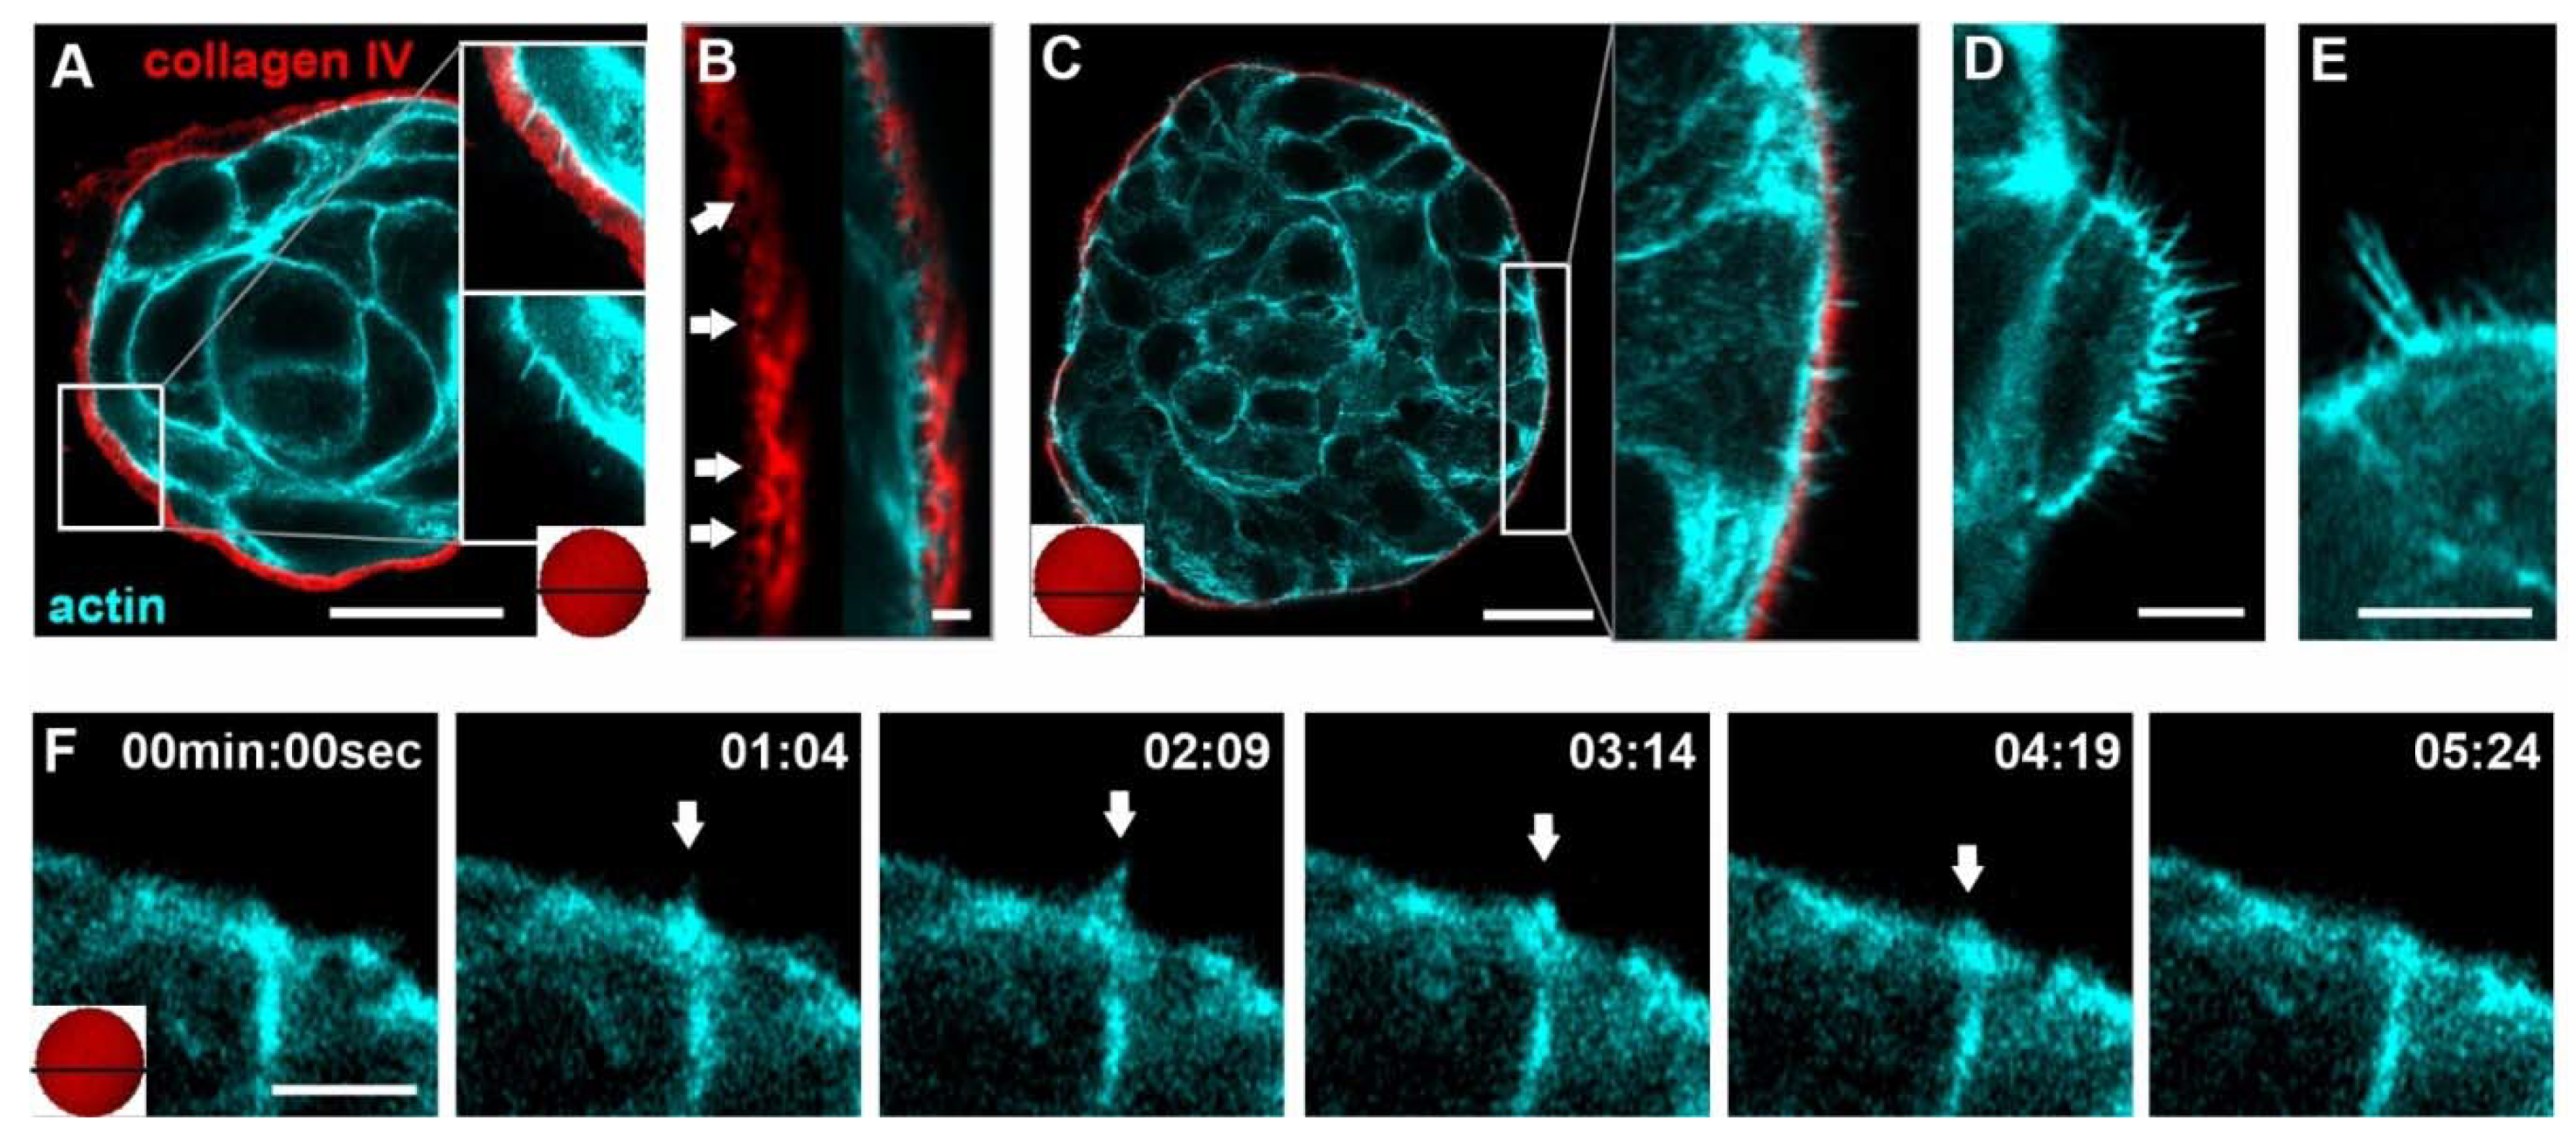
Abstract
:1. Introduction
2. Materials and Methods
2.1. Cell Maintenance
2.2. MCF10A Morphogenesis and Isolation from EHS Matrix
2.3. Preparation and EHS-Protein Coating of Elastomeric Substrates
2.4. Biochemical Treatments
2.5. Immunofluorescence (IF) Staining
2.6. Confocal Microscopy
2.7. Actin Structure Analysis and Quantification
2.8. Traction Force Microscopy
2.9. Statistical Analyses
3. Results
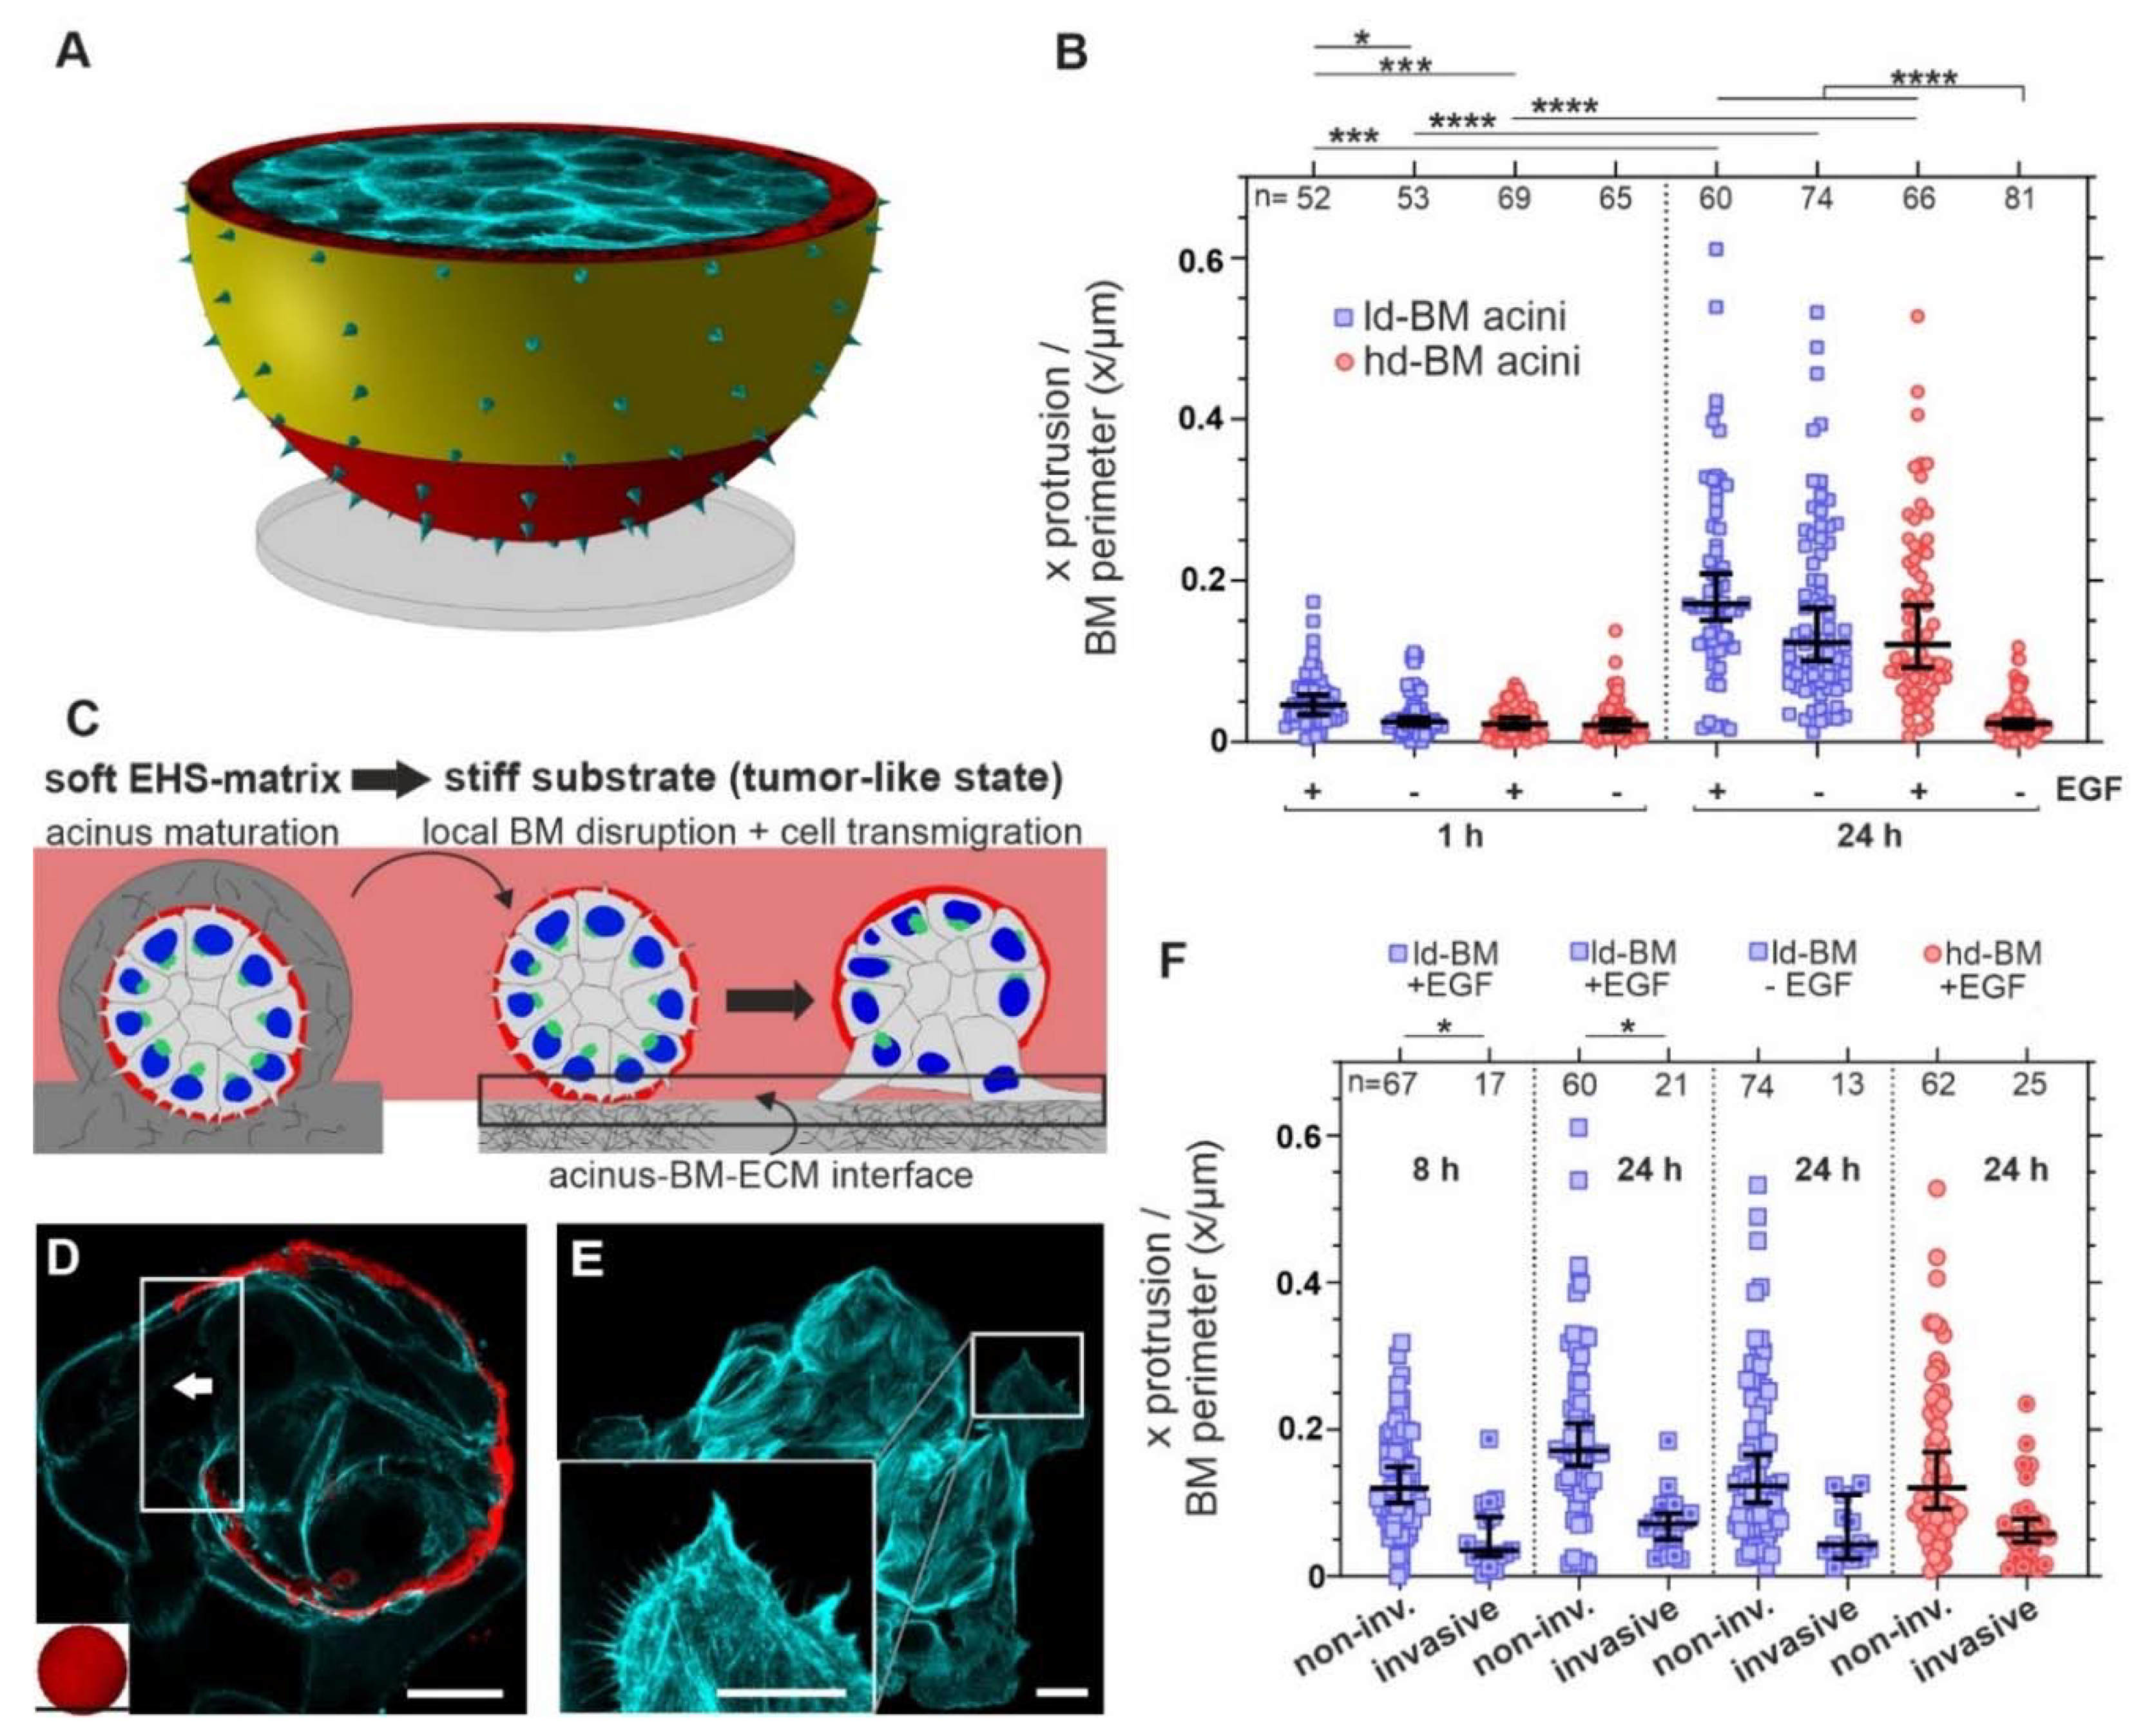
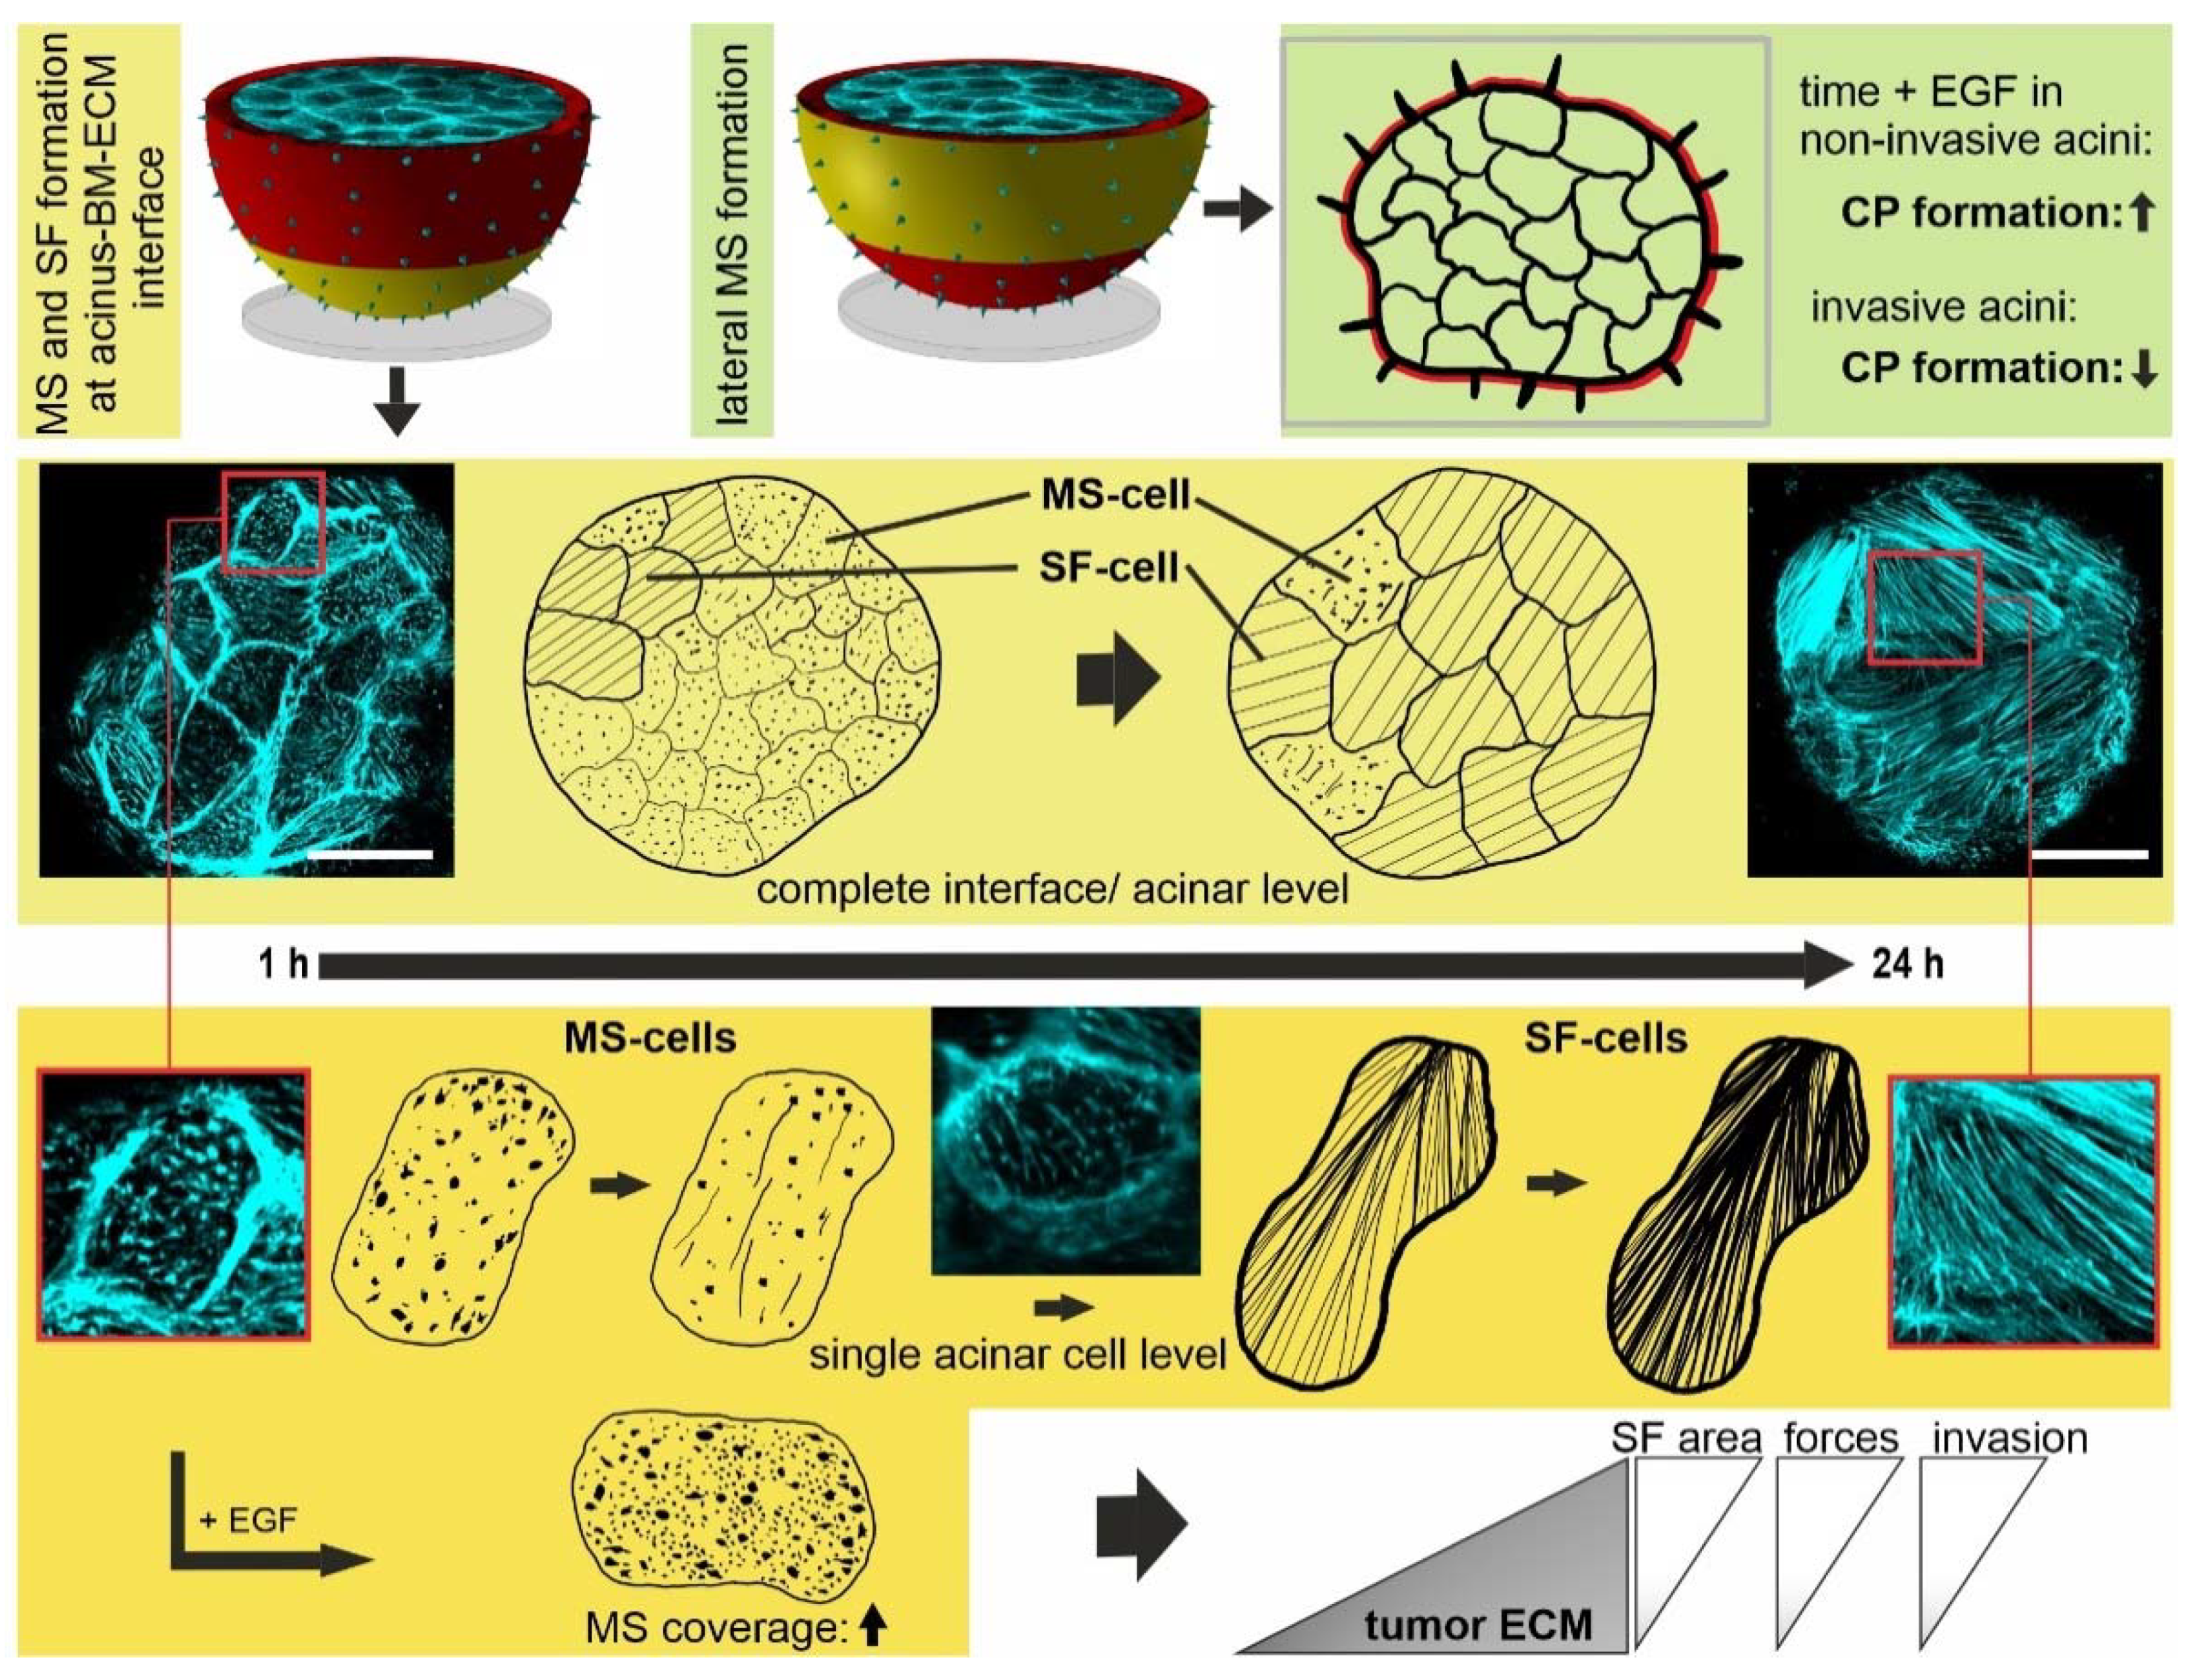
3.1. Tumor-like EGF and Substrate Stiffness Induce BM-Piercing Microspikes
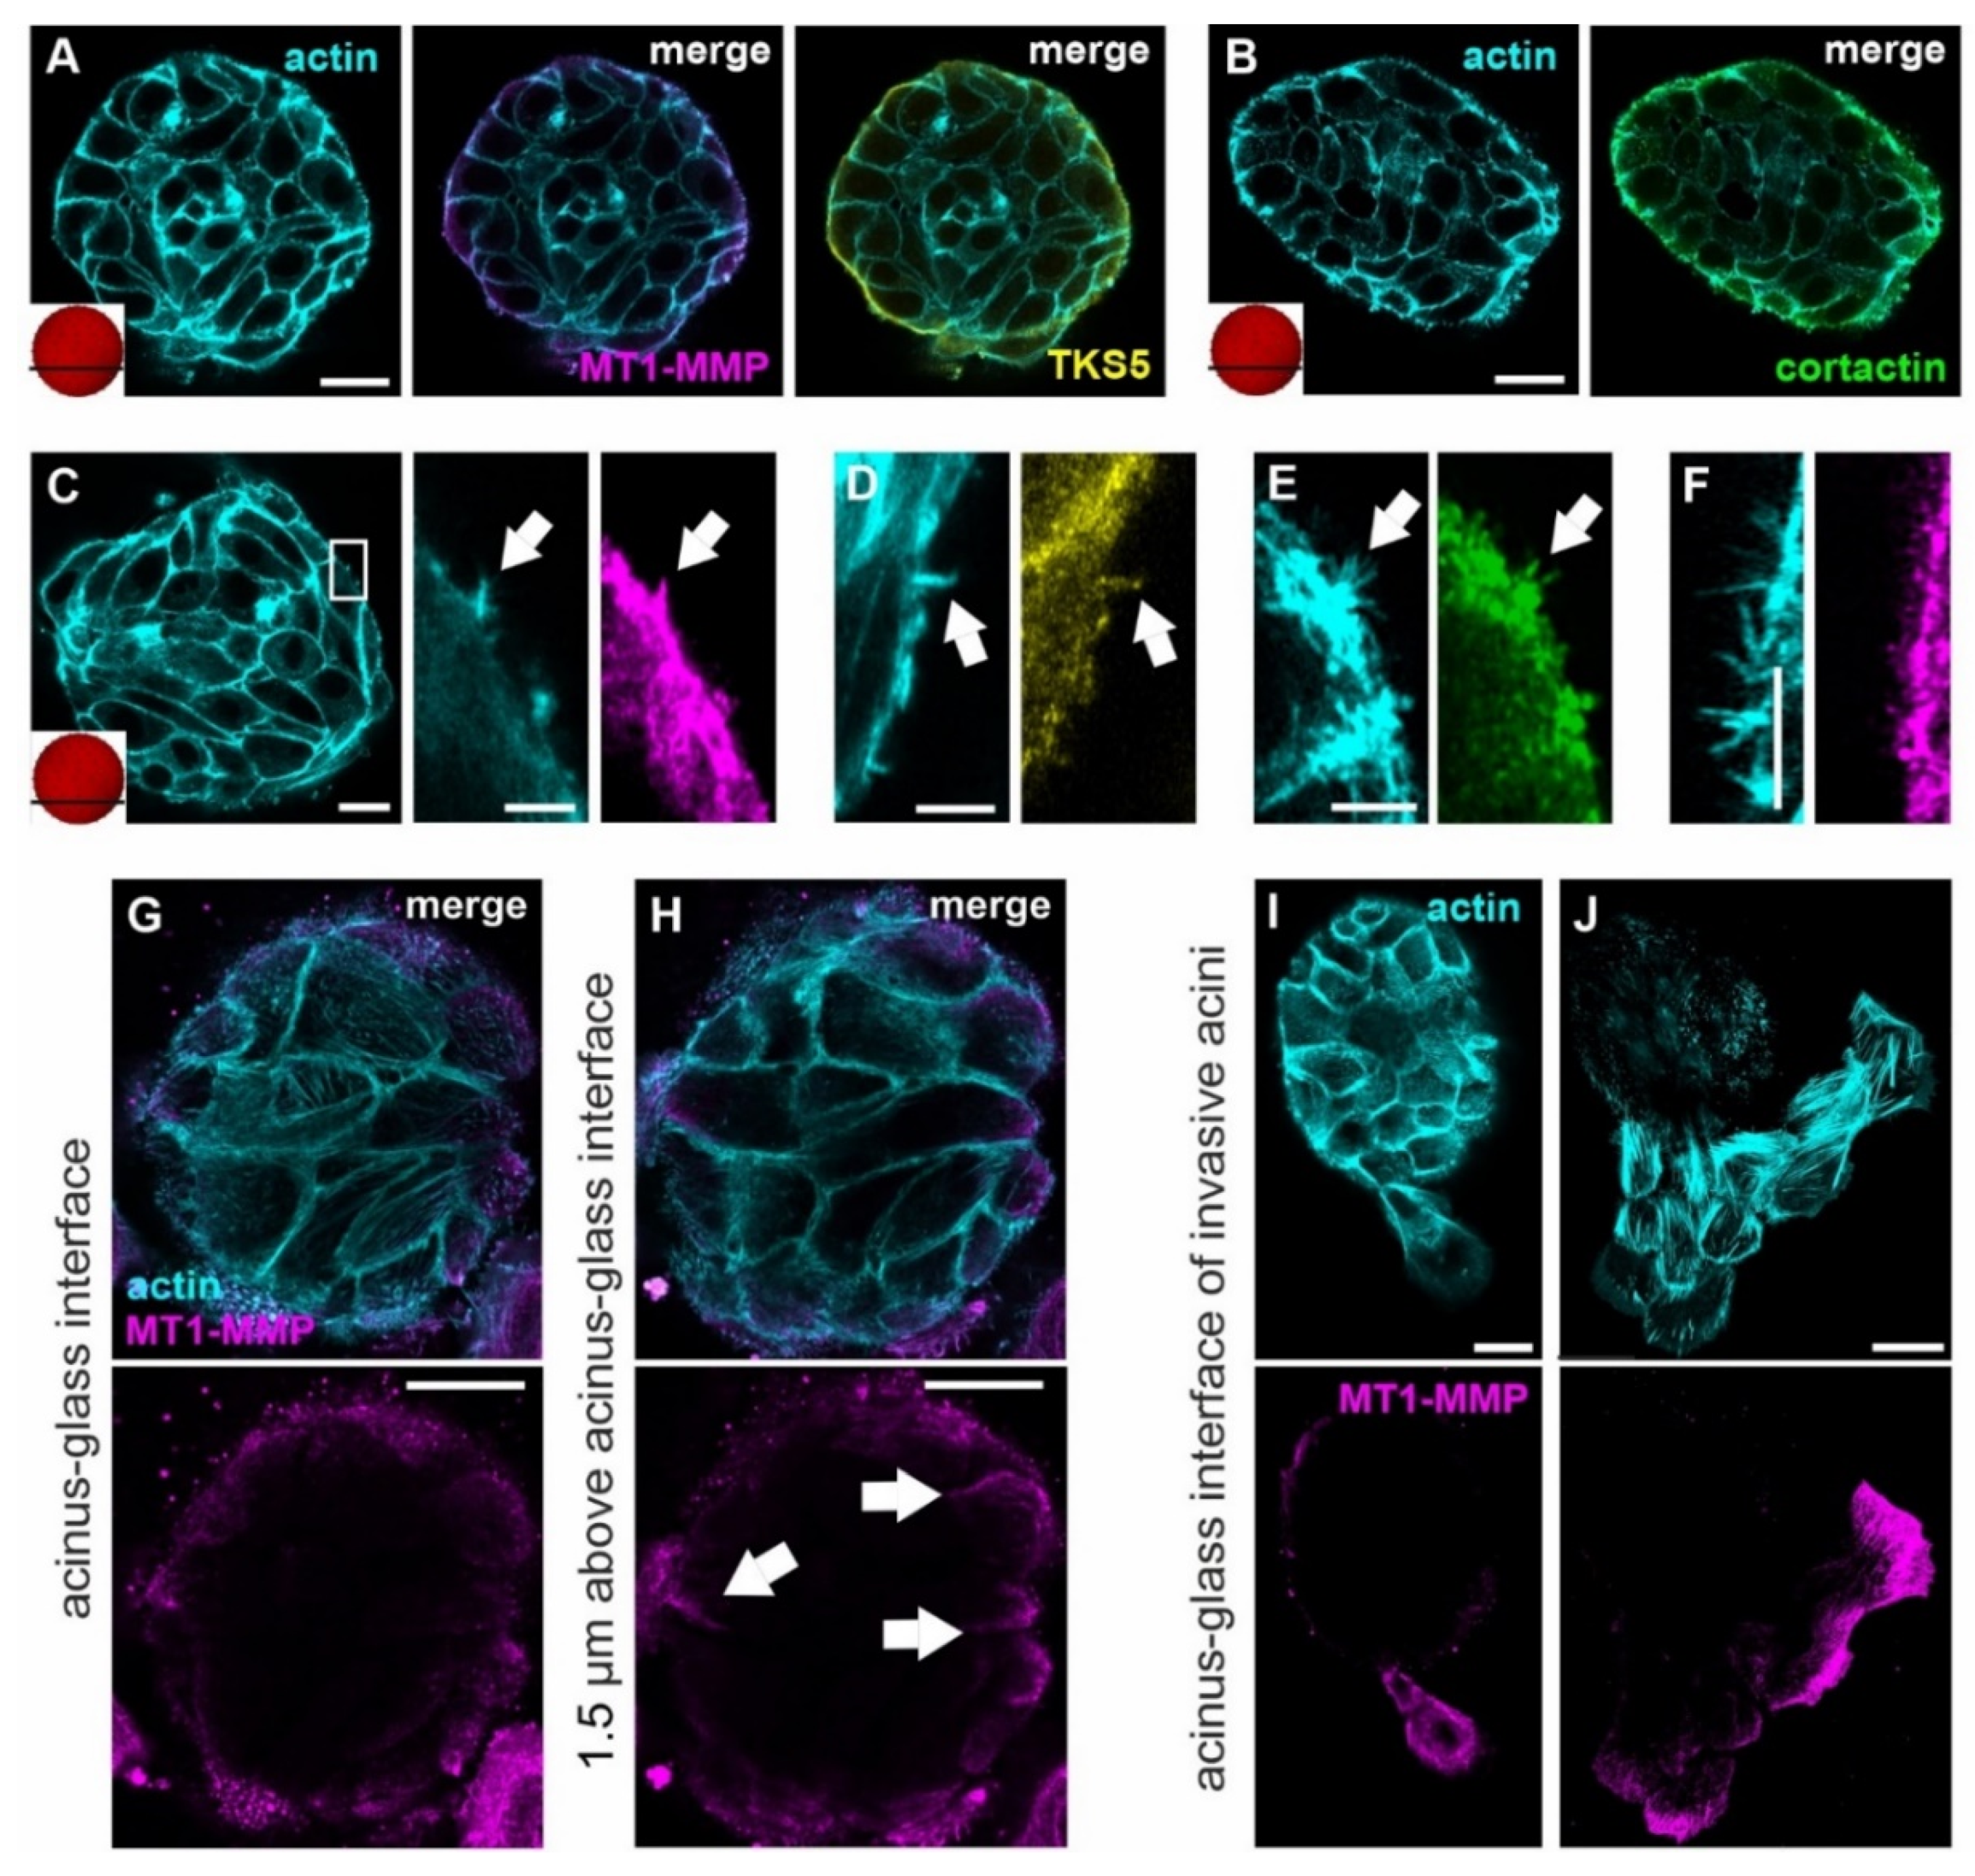
3.2. Invasive Acini Switch from Non-Proteolytic to Proteolytic Invadopodia
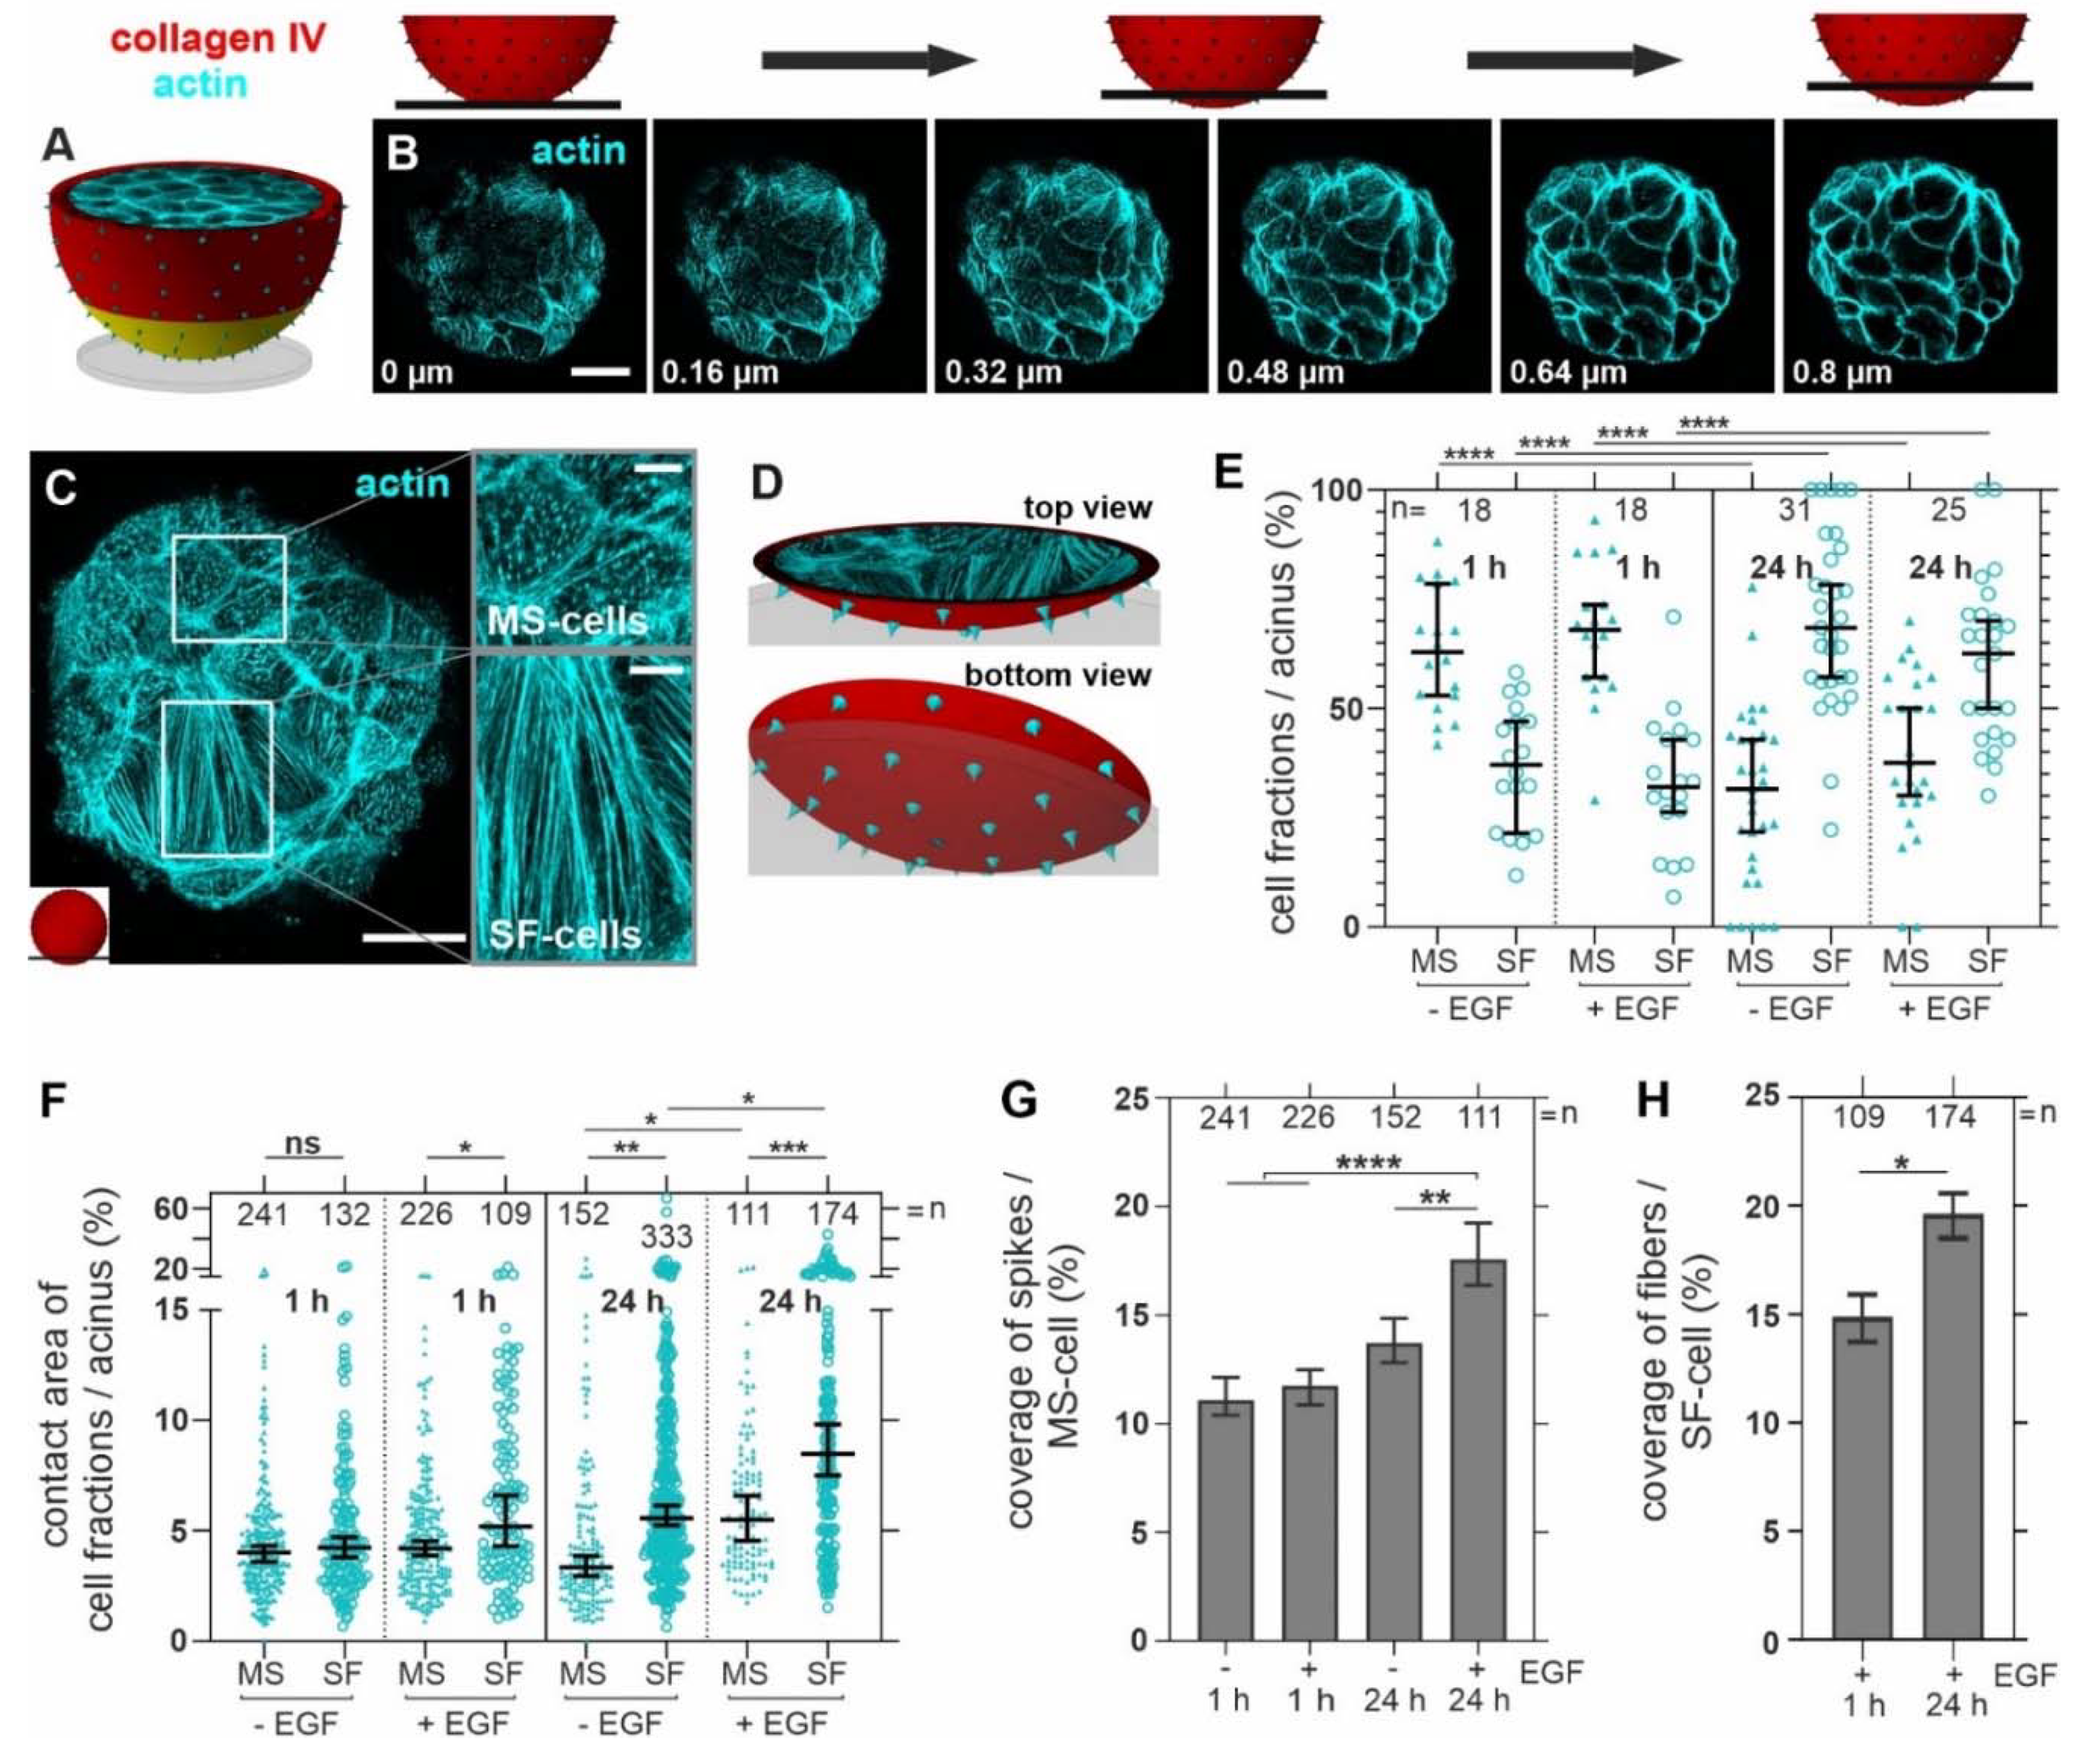
3.3. Breast Acini Switch Cytoskeletal Organization at Sites of Potential BM-Invasion
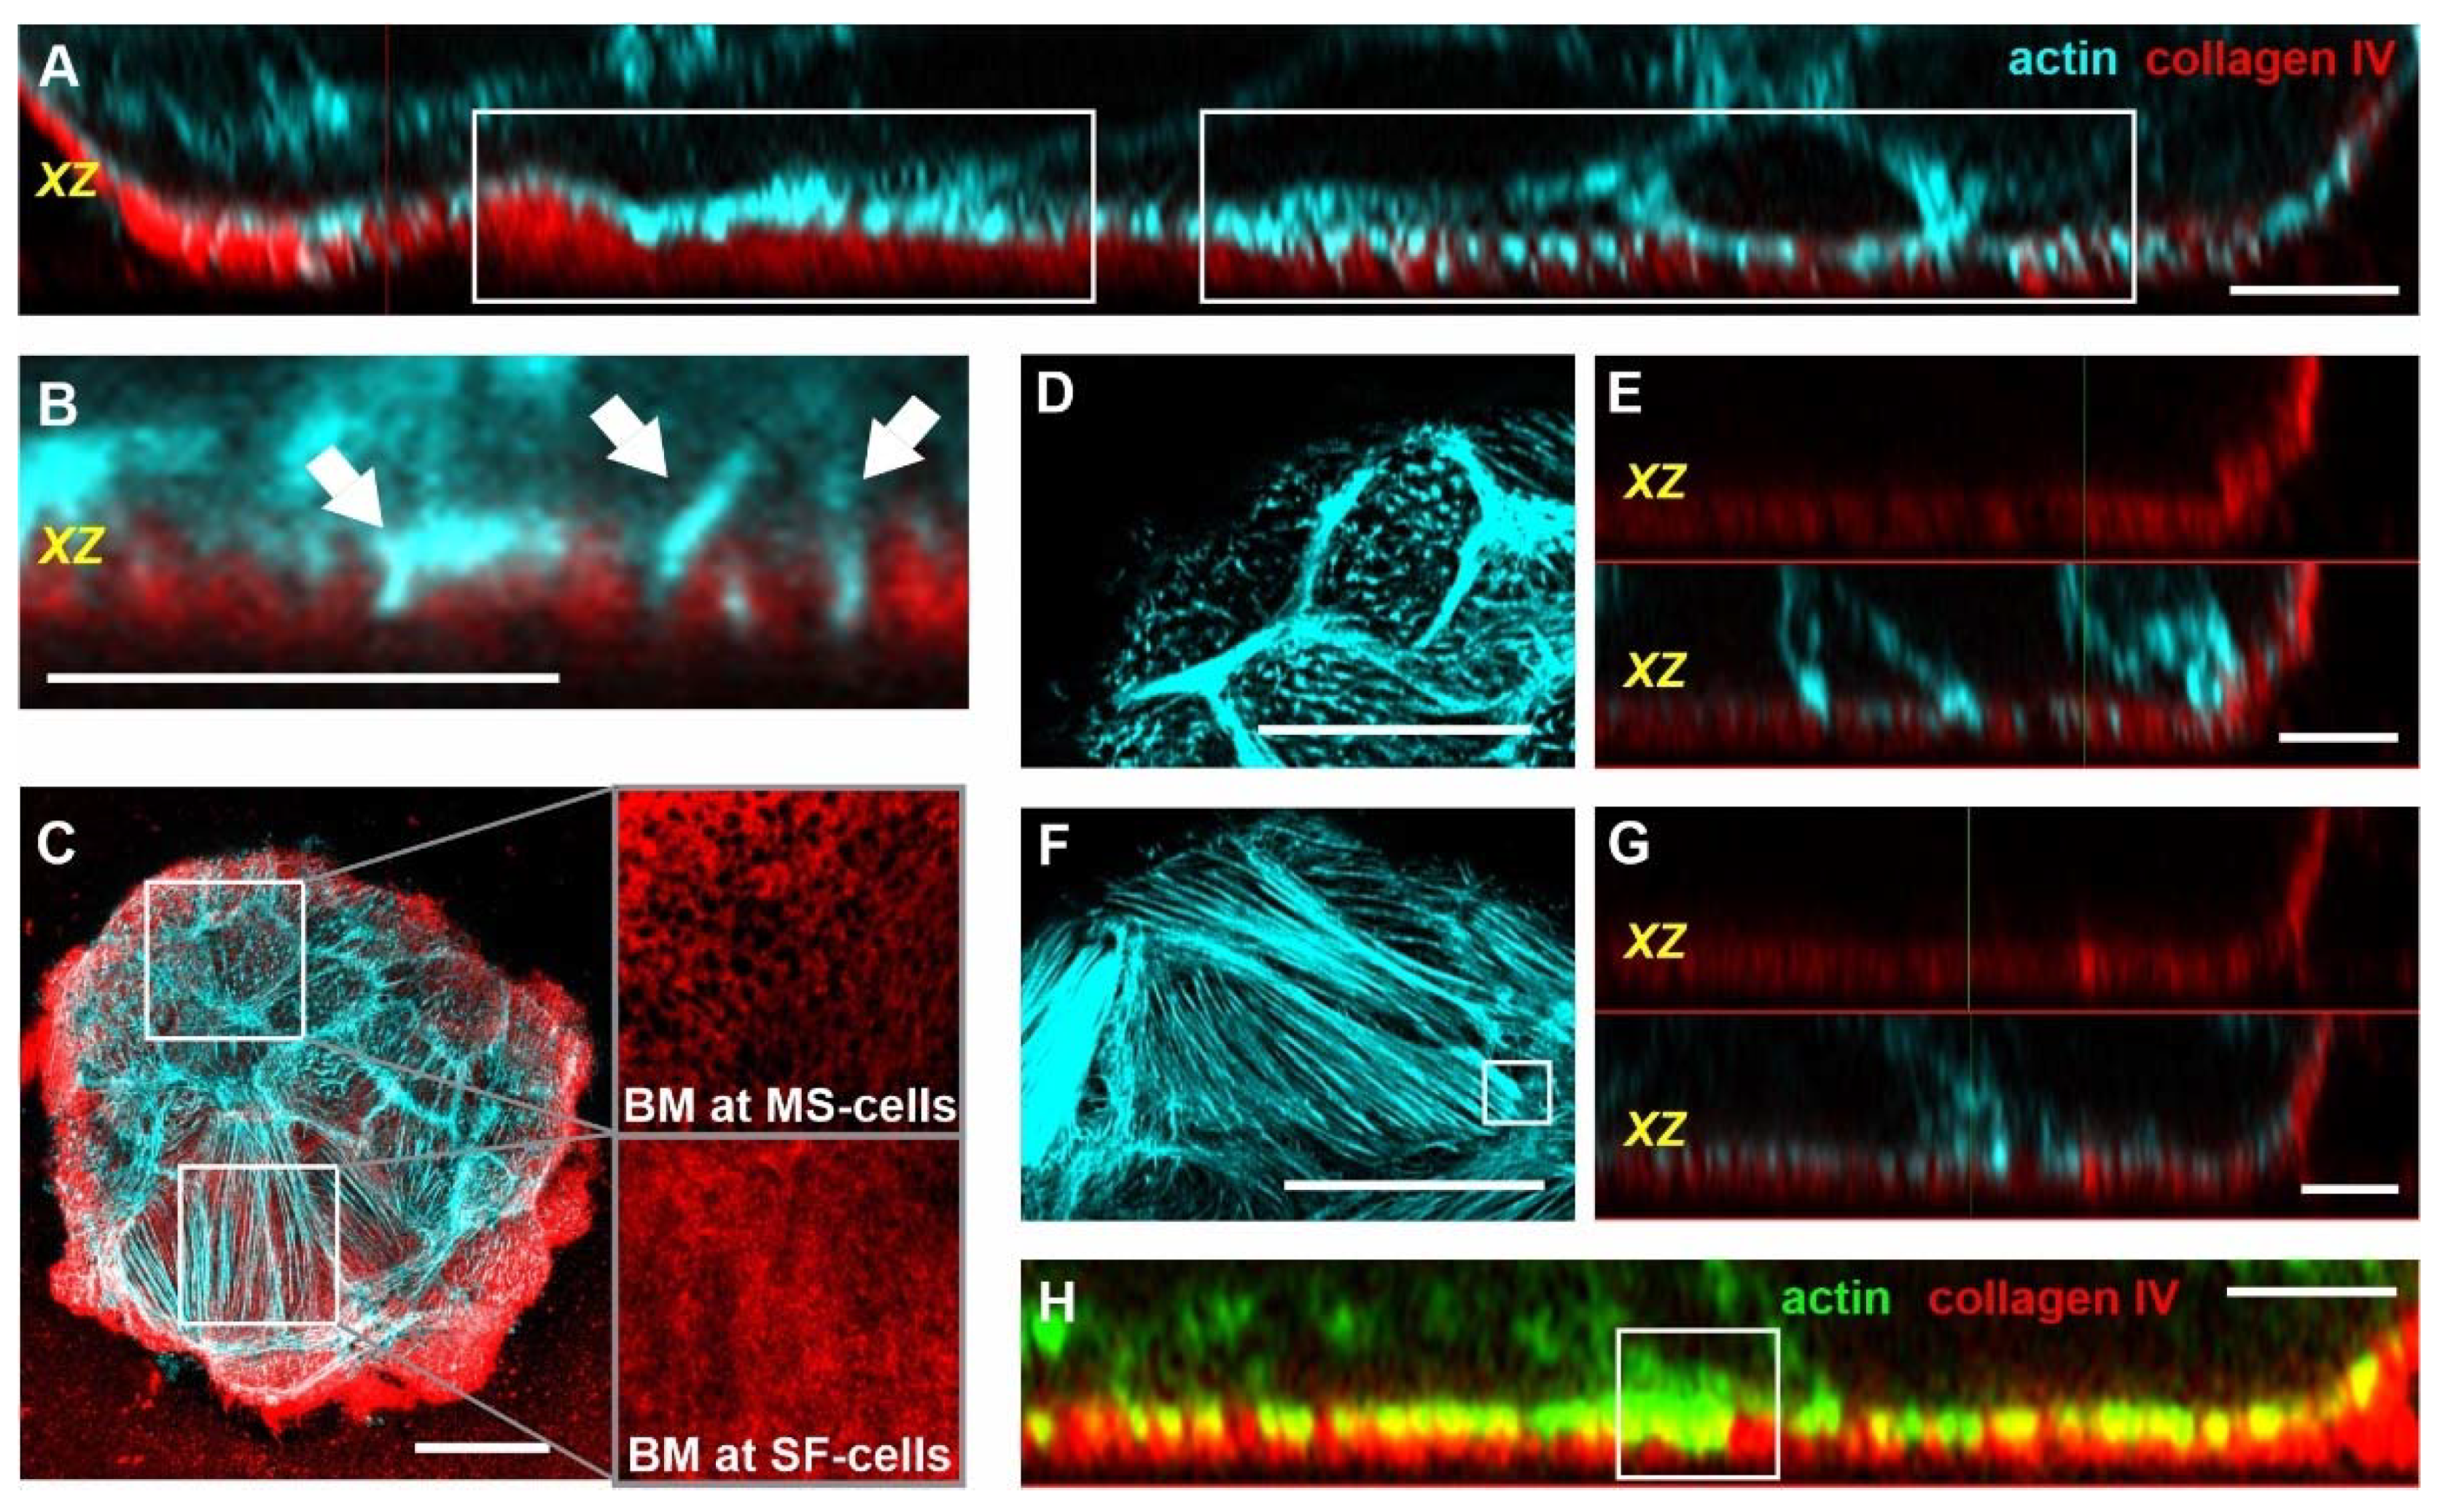
3.4. Actin Microspikes and Stress Fibers Interact with the BM Scaffold
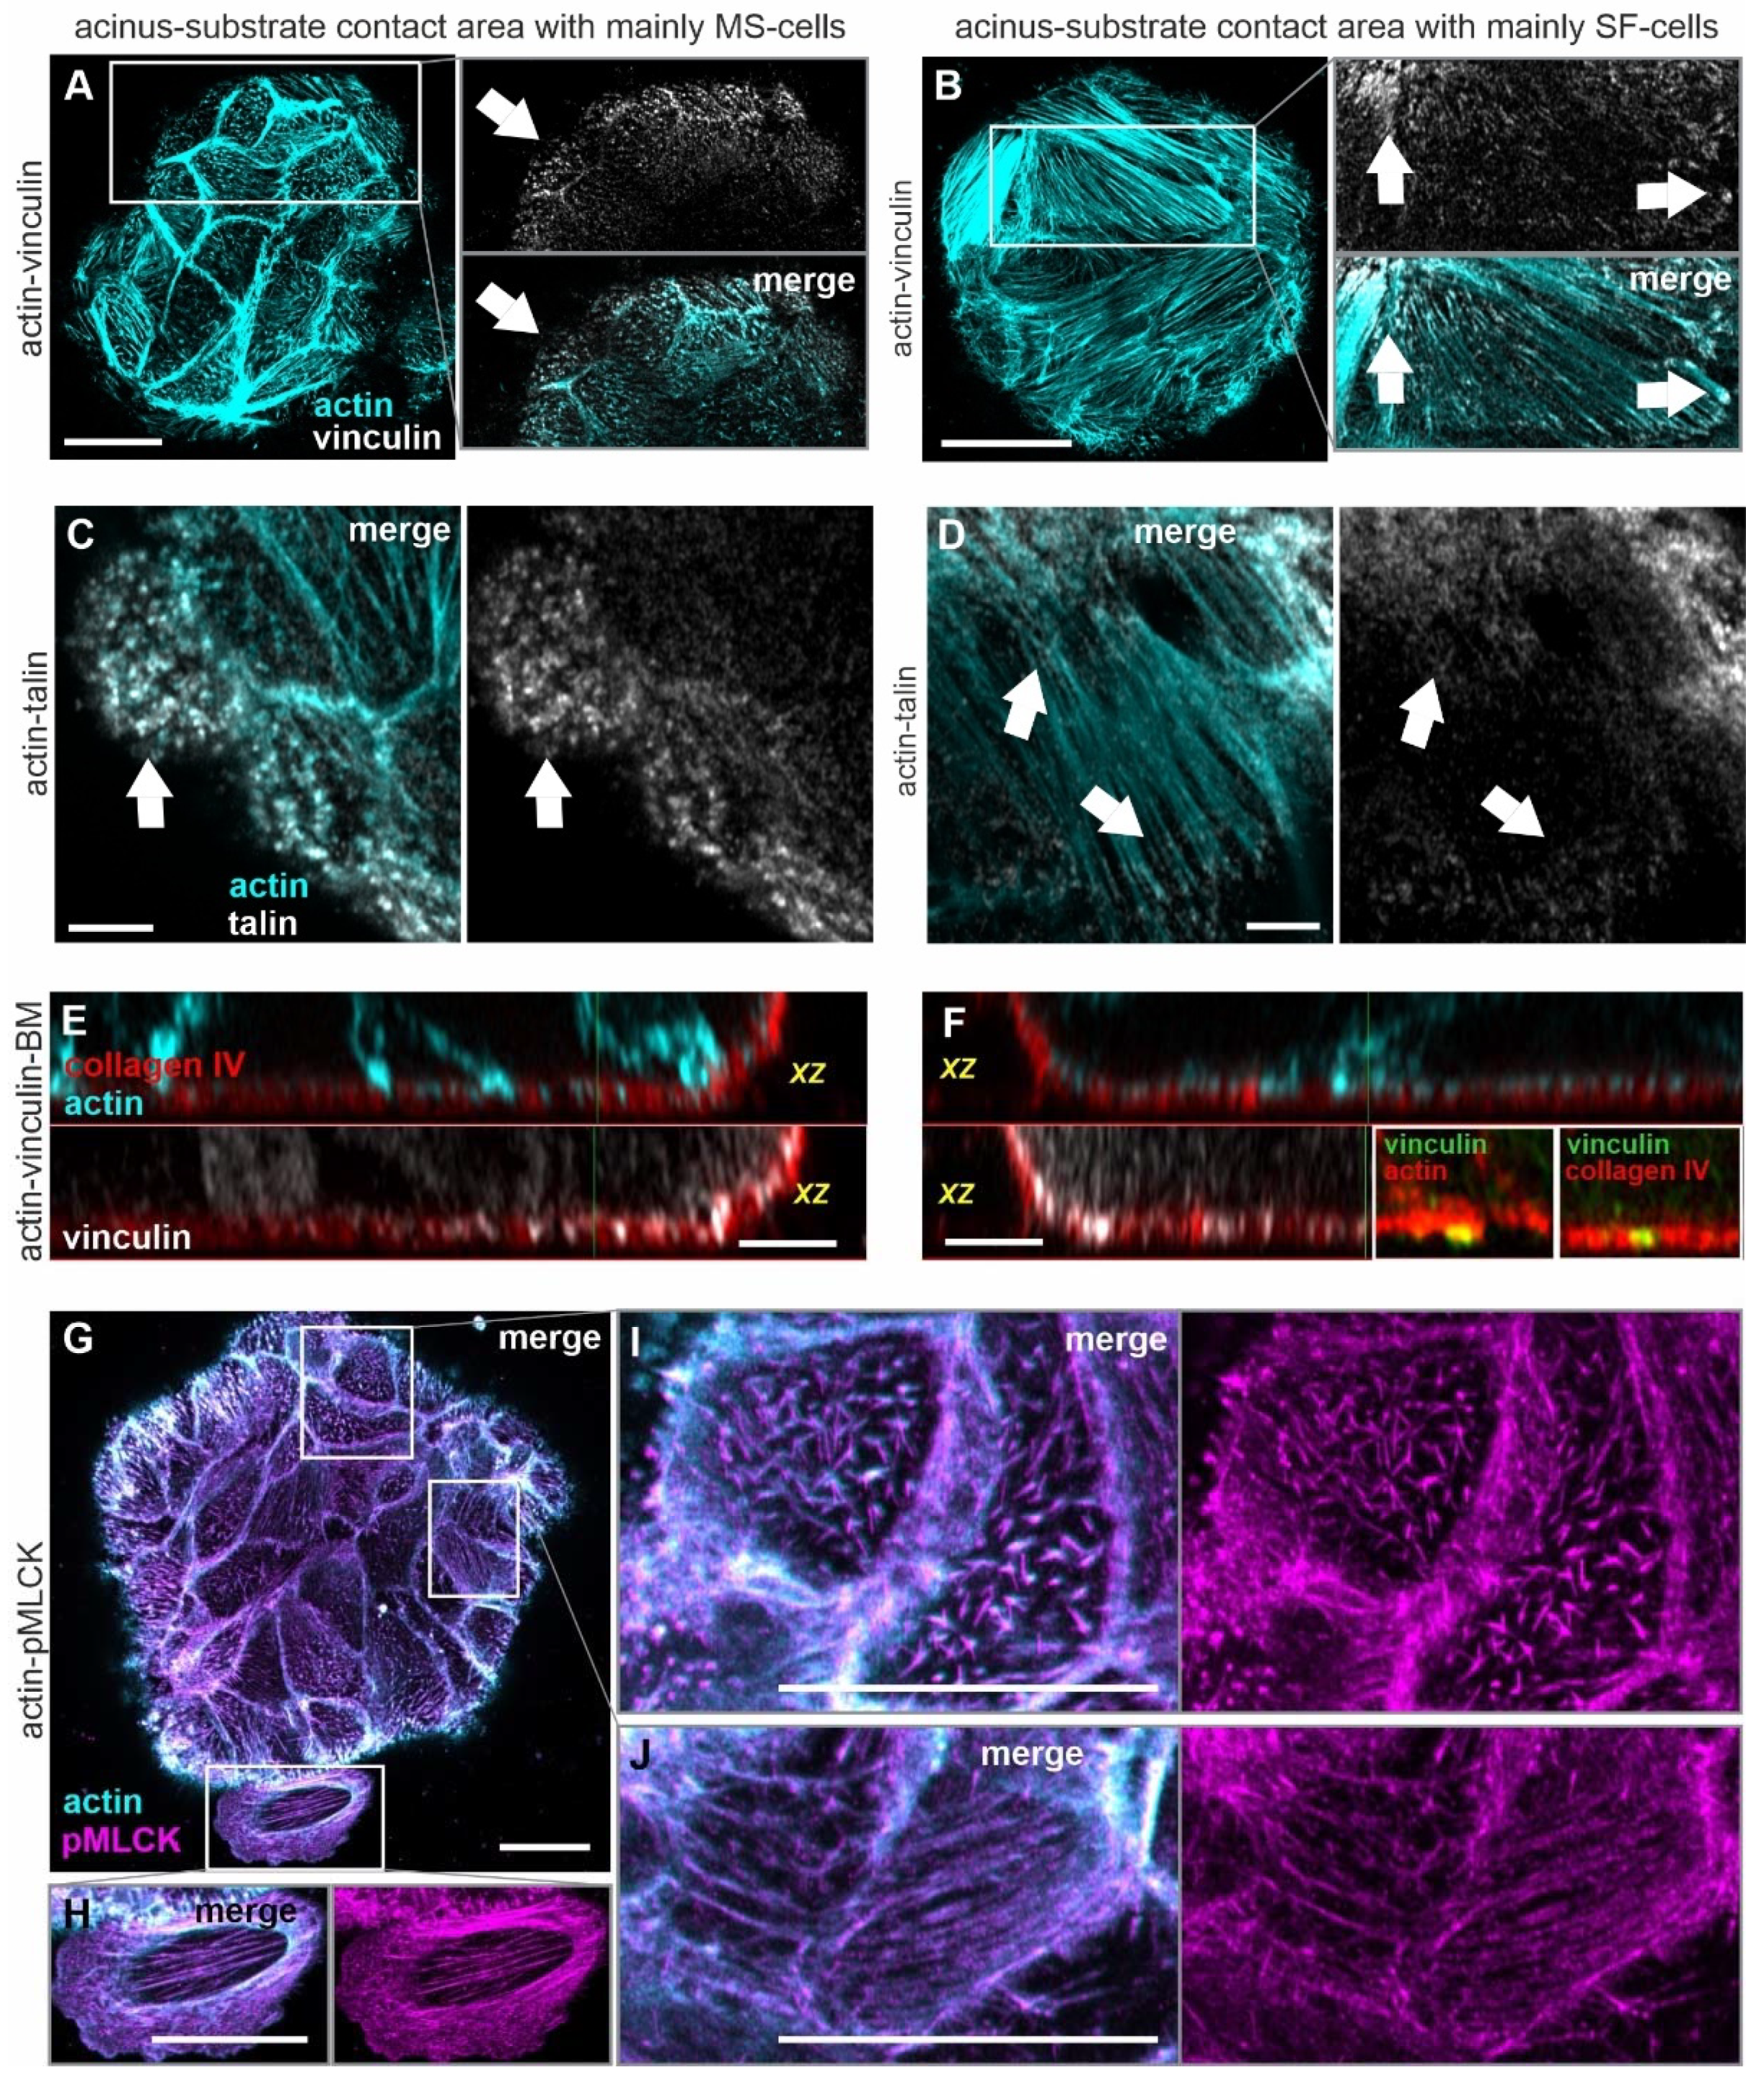
3.5. Acinar Cells Adhere to the BM and the ECM by Force-Transmitting FAs
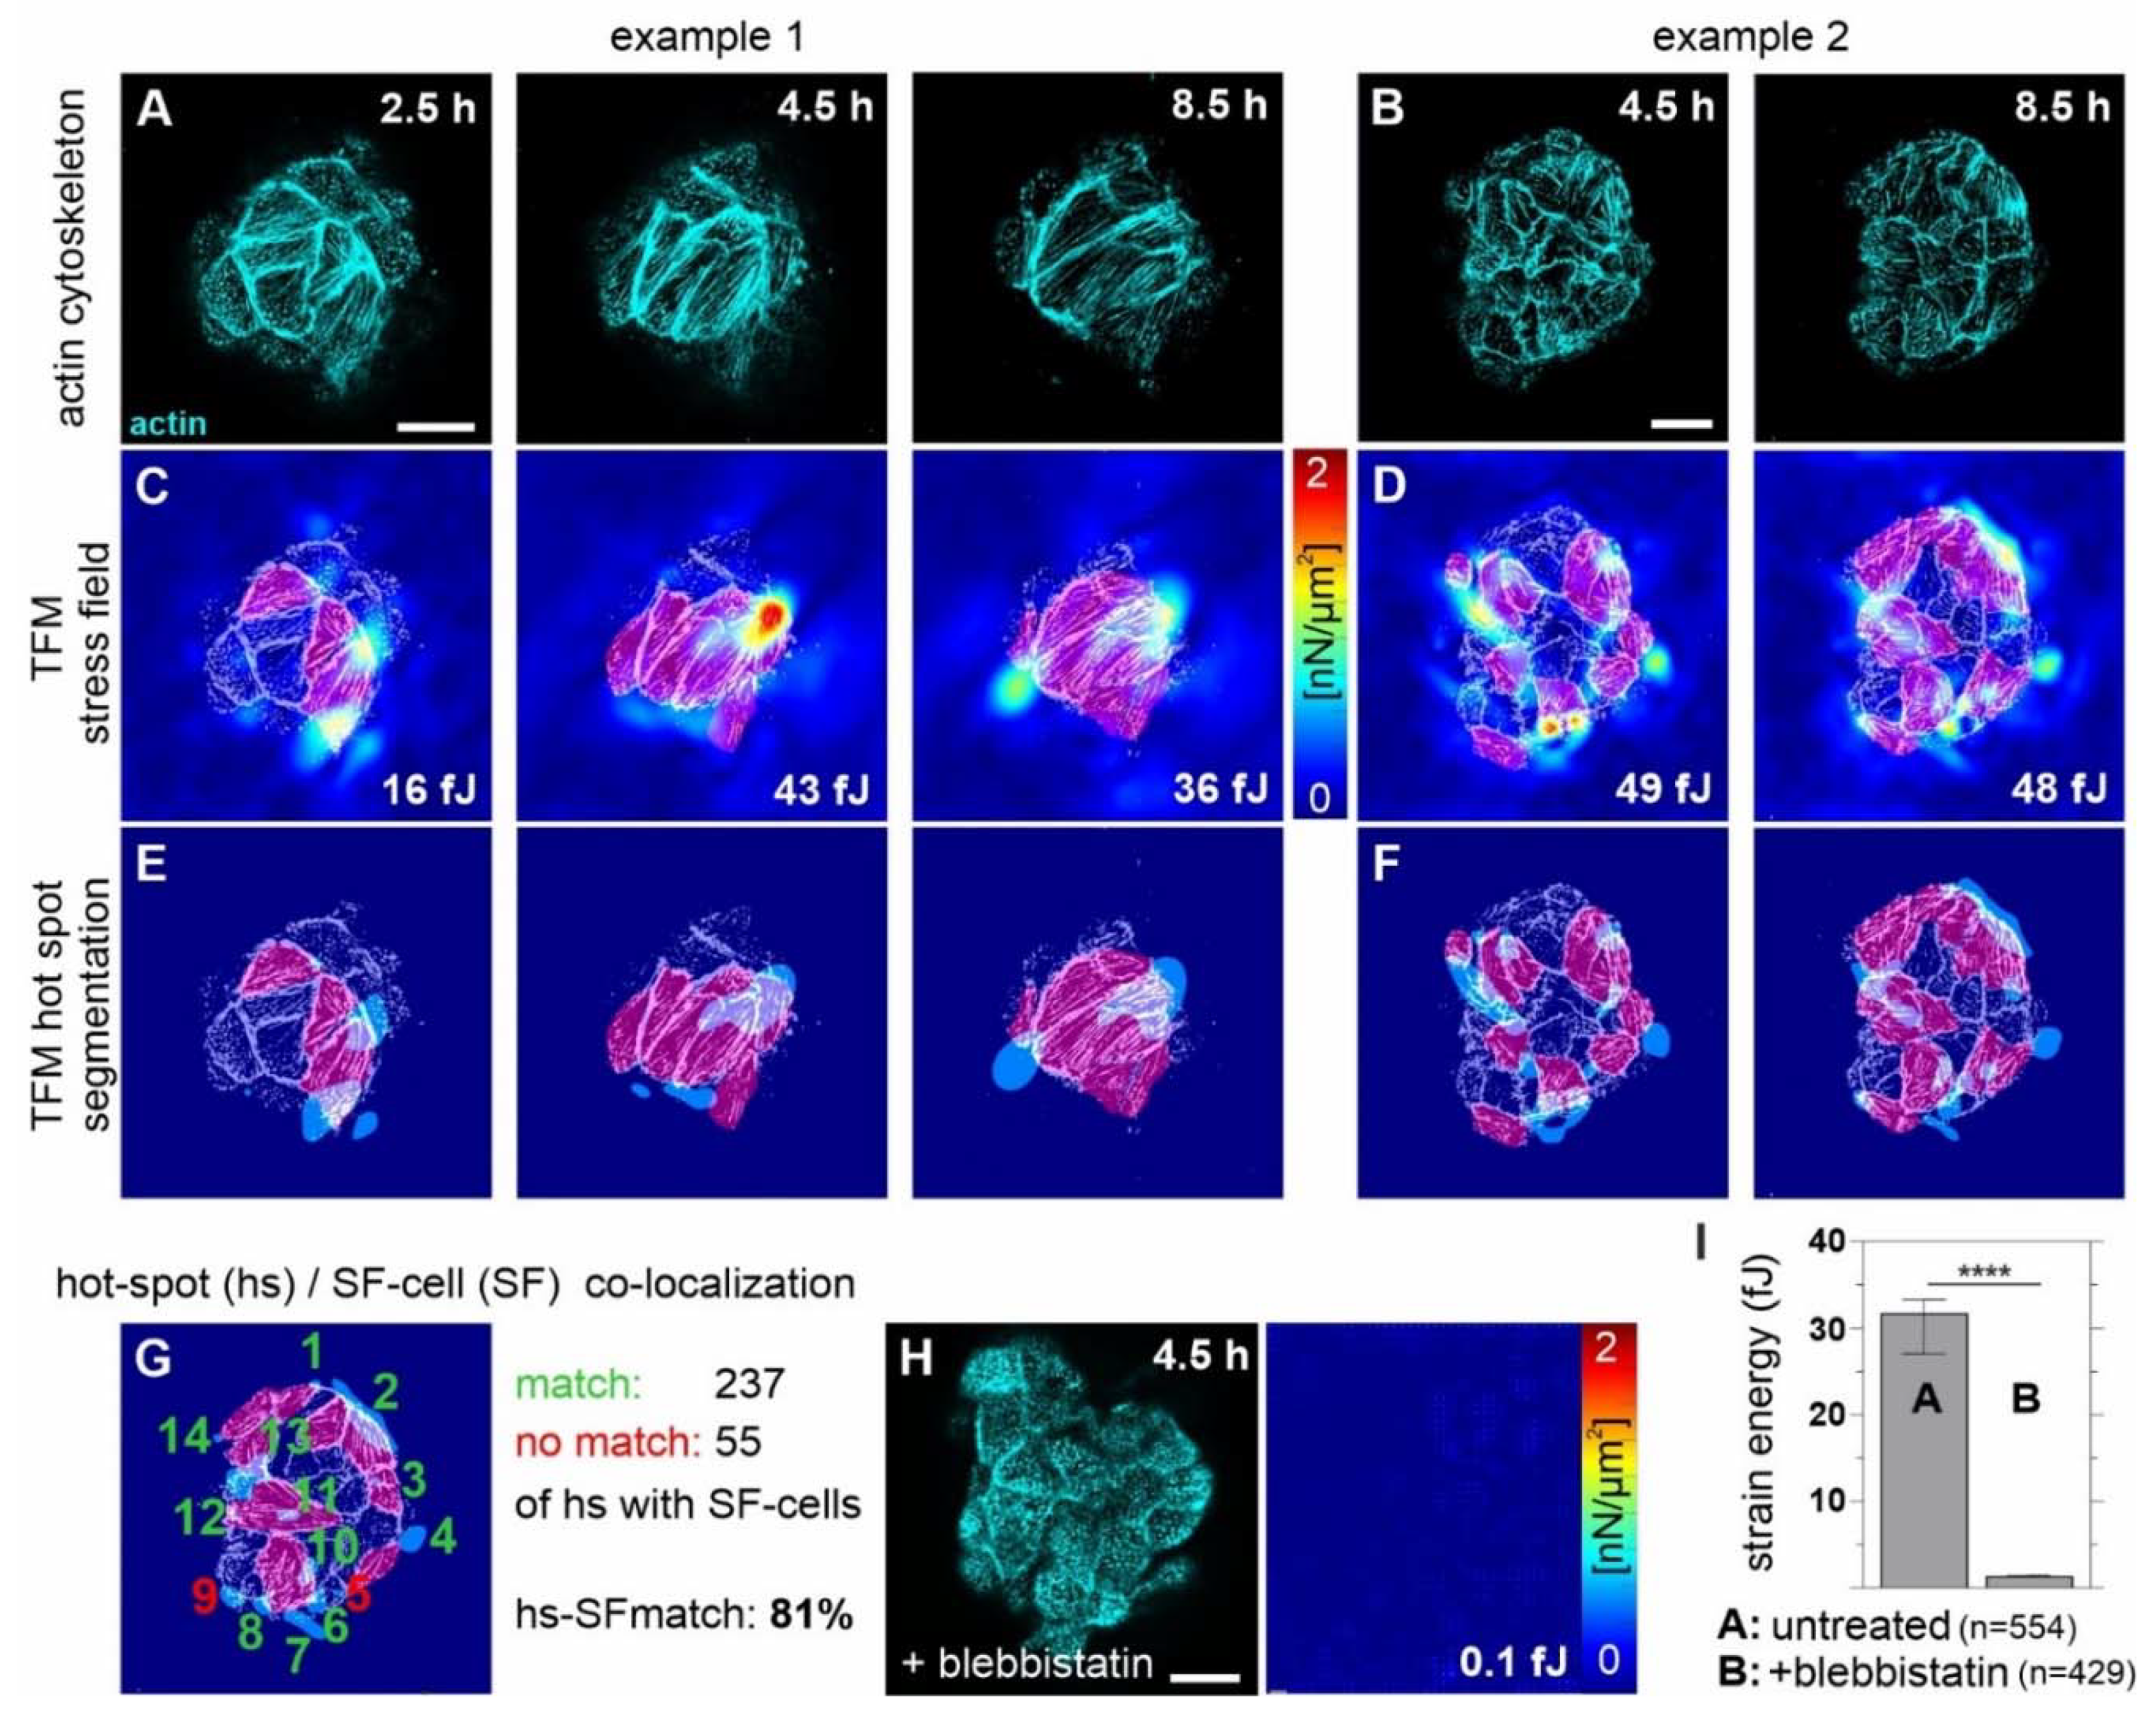
3.6. Tumor ECM-Induced SF Cell Formation Drives Myosin II-Mediated BM Stress
4. Discussion
5. Conclusions
Supplementary Materials
Author Contributions
Funding
Institutional Review Board Statement
Informed Consent Statement
Data Availability Statement
Acknowledgments
Conflicts of Interest
Abbreviations
| BM | Basement membrane |
| CI | confidence interval |
| CP | cell protrusion |
| ECM | extracellular matrix |
| EGF | epidermal growth factor |
| FA | focal adhesion |
| FC | fold change |
| HD | hemidesmosomes |
| ld/hd-BM | low/highly-developed basement membrane |
| MMP | matrix metalloprotease |
| MS | microspike |
| pMLCK | phosphorylated myosin light chain kinase |
| SF | stress fiber |
| TFM | traction force microscopy |
References
- Kelley, L.C.; Chi, Q.; Cáceres, R.; Hastie, E.; Schindler, A.J.; Jiang, Y.; Matus, D.Q.; Plastino, J.; Sherwood, D.R. Adaptive F-Actin Polymerization and Localized ATP Production Drive Basement Membrane Invasion in the Absence of MMPs. Dev. Cell 2019, 48, 313–328.e8. [Google Scholar] [CrossRef] [Green Version]
- Chang, J.; Chaudhuri, O. Beyond proteases: Basement membrane mechanics and cancer invasion. J. Cell Biol. 2019, 218, 2456–2469. [Google Scholar] [CrossRef] [Green Version]
- Rowe, R.G.; Weiss, S.J. Breaching the basement membrane: Who, when and how? Trends Cell Biol. 2008, 18, 560–574. [Google Scholar] [CrossRef]
- Gaiko-Shcherbak, A.; Fabris, G.; Dreissen, G.; Merkel, R.; Hoffmann, B.; Noetzel, E. The acinar cage: Basement membranes determine molecule exchange and mechanical stability of human breast cell acini. PLoS ONE 2015, 10, e0145174. [Google Scholar] [CrossRef] [PubMed] [Green Version]
- Fabris, G.; Lucantonio, A.; Hampe, N.; Noetzel, E.; Hoffmann, B.; DeSimone, A.; Merkel, R. Nanoscale Topography and Poroelastic Properties of Model Tissue Breast Gland Basement Membranes. Biophys. J. 2018, 115, 1–13. [Google Scholar] [CrossRef] [PubMed] [Green Version]
- Gaiko-Shcherbak, A.; Eschenbruch, J.; Kronenberg, N.M.; Teske, M.; Wolters, B.; Springer, R.; Gather, M.C.; Merkel, R.; Hoffmann, B.; Noetzel, E. Cell Force-Driven Basement Membrane Disruption Fuels EGF- and Stiffness-Induced Invasive Cell Dissemination from Benign Breast Gland Acini. Int. J. Mol. Sci. 2021, 22, 3962. [Google Scholar] [CrossRef]
- Lamouille, S.; Xu, J.; Derynck, R. Molecular mechanisms of epithelial-mesenchymal transition. Nat. Rev. Mol. Cell Biol. 2014, 15, 178–196. [Google Scholar] [CrossRef] [Green Version]
- Haynes, J.; Srivastava, J.; Madson, N.; Wittmann, T.; Barber, D.L. Dynamic actin remodeling during epithelial-mesenchymal transition depends on increased moesin expression. Mol. Biol. Cell 2011, 22, 4750–4764. [Google Scholar] [CrossRef] [PubMed]
- Zhitnyak, I.Y.; Rubtsova, S.N.; Litovka, N.I.; Gloushankova, N.A. Early Events in Actin Cytoskeleton Dynamics and E-Cadherin-Mediated Cell-Cell Adhesion during Epithelial-Mesenchymal Transition. Cells 2020, 9, 578. [Google Scholar] [CrossRef] [Green Version]
- Gupta, M.; Doss, B.; Lim, C.T.; Voituriez, R.; Ladoux, B. Single cell rigidity sensing: A complex relationship between focal adhesion dynamics and large-scale actin cytoskeleton remodeling. Cell Adhes. Migr. 2016, 10, 554–567. [Google Scholar] [CrossRef] [Green Version]
- Geiger, B.; Spatz, J.P.; Bershadsky, A.D. Environmental sensing through focal adhesions. Nat. Rev. Mol. Cell Biol. 2009, 10, 21–33. [Google Scholar] [CrossRef] [PubMed]
- Jacquemet, G.; Hamidi, H.; Ivaska, J. Filopodia in cell adhesion, 3D migration and cancer cell invasion. Curr. Opin. Cell Biol. 2015, 36, 23–31. [Google Scholar] [CrossRef] [Green Version]
- Murphy, D.A.; Courtneidge, S.A. The ‘ins’ and ‘outs’ of podosomes and invadopodia: Characteristics, formation and function. Nat. Rev. Mol. Cell Biol. 2011, 12, 413–426. [Google Scholar] [CrossRef] [Green Version]
- Lohmer, L.L.; Kelley, L.C.; Hagedorn, E.J.; Sherwood, D.R. Invadopodia and basement membrane invasion in vivo. Cell Adhes. Migr. 2014, 8, 246–255. [Google Scholar] [CrossRef]
- Williams, K.C.; Cepeda, M.A.; Javed, S.; Searle, K.; Parkins, K.M.; Makela, A.V.; Hamilton, A.M.; Soukhtehzari, S.; Kim, Y.; Tuck, A.B.; et al. Invadopodia are chemosensing protrusions that guide cancer cell extravasation to promote brain tropism in metastasis. Oncogene 2019, 38, 3598–3615. [Google Scholar] [CrossRef] [Green Version]
- Bowden, E.T.; Barth, M.; Thomas, D.; Glazer, R.I.; Mueller, S.C. An invasion-related complex of cortactin, paxillin and PKCmu associates with invadopodia at sites of extracellular matrix degradation. Oncogene 1999, 18, 4440–4449. [Google Scholar] [CrossRef] [PubMed] [Green Version]
- Seals, D.F.; Azucena, E.F., Jr.; Pass, I.; Tesfay, L.; Gordon, R.; Woodrow, M.; Resau, J.H.; Courtneidge, S.A. The adaptor protein Tks5/Fish is required for podosome formation and function, and for the protease-driven invasion of cancer cells. Cancer Cell 2005, 7, 155–165. [Google Scholar] [CrossRef] [Green Version]
- Artym, V.V.; Zhang, Y.; Seillier-Moiseiwitsch, F.; Yamada, K.M.; Mueller, S.C. Dynamic interactions of cortactin and membrane type 1 matrix metalloproteinase at invadopodia: Defining the stages of invadopodia formation and function. Cancer Res. 2006, 66, 3034–3043. [Google Scholar] [CrossRef] [PubMed] [Green Version]
- Dalaka, E.; Kronenberg, N.M.; Liehm, P.; Segall, J.E.; Prystowsky, M.B.; Gather, M.C. Direct measurement of vertical forces shows correlation between mechanical activity and proteolytic ability of invadopodia. Sci. Adv. 2020, 6, eaax6912. [Google Scholar] [CrossRef] [PubMed] [Green Version]
- Jerrell, R.J.; Parekh, A. Cellular traction stresses mediate extracellular matrix degradation by invadopodia. Acta Biomater. 2014, 10, 1886–1896. [Google Scholar] [CrossRef] [PubMed] [Green Version]
- Northcott, J.M.; Dean, I.S.; Mouw, J.K.; Weaver, V.M. Feeling Stress: The Mechanics of Cancer Progression and Aggression. Front. Cell Dev. Biol. 2018, 6, 1–12. [Google Scholar] [CrossRef] [PubMed]
- Jacquemet, G.; Green, D.M.; Bridgewater, R.E.; von Kriegsheim, A.; Humphries, M.J.; Norman, J.C.; Caswell, P.T. RCP-driven alpha5beta1 recycling suppresses Rac and promotes RhoA activity via the RacGAP1-IQGAP1 complex. J. Cell Biol. 2013, 202, 917–935. [Google Scholar] [CrossRef] [PubMed] [Green Version]
- Caswell, P.T.; Zech, T. Actin-Based Cell Protrusion in a 3D Matrix. Trends Cell Biol. 2018, 28, 823–834. [Google Scholar] [CrossRef] [PubMed]
- Li, A.; Dawson, J.C.; Forero-Vargas, M.; Spence, H.J.; Yu, X.; König, I.; Anderson, K.; Machesky, L.M. The Actin-Bundling Protein Fascin Stabilizes Actin in Invadopodia and Potentiates Protrusive Invasion. Curr. Biol. 2010, 20, 339–345. [Google Scholar] [CrossRef] [Green Version]
- Tolde, O.; Rösel, D.; Veselý, P.; Folk, P.; Brábek, J. The structure of invadopodia in a complex 3D environment. Eur. J. Cell Biol. 2010, 89, 674–680. [Google Scholar] [CrossRef]
- Hersch, N.; Wolters, B.; Dreissen, G.; Springer, R.; Kirchgessner, N.; Merkel, R.; Hoffmann, B. The constant beat: Cardiomyocytes adapt their forces by equal contraction upon environmental stiffening. Biol. Open 2013, 2, 351–361. [Google Scholar] [CrossRef] [Green Version]
- Ulbricht, A.; Eppler, F.J.; Tapia, V.E.; Van Der Ven, P.F.M.; Hampe, N.; Hersch, N.; Vakeel, P.; Stadel, D.; Haas, A.; Saftig, P.; et al. Cellular mechanotransduction relies on tension-induced and chaperone-assisted autophagy. Curr. Biol. 2013, 23, 430–435. [Google Scholar] [CrossRef] [PubMed] [Green Version]
- Otsu, N. A Treshhold selection method from gray-level histograms. IEEE Trans. Syst. Man. Cybern. 1979, 9, 62–66. [Google Scholar] [CrossRef] [Green Version]
- Ahrens, D.; Rubner, W.; Springer, R.; Hampe, N.; Gehlen, J.; Magin, T.M.; Hoffmann, B.; Merkel, R. A combined afm and lateral stretch device enables microindentation analyses of living cells at high strains. Methods Protoc. 2019, 2, 43. [Google Scholar] [CrossRef] [PubMed] [Green Version]
- Merkel, R.; Kirchgessner, N.; Cesa, C.M.; Hoffmann, B. Cell force microscopy on elastic layers of finite thickness. Biophys. J. 2007, 93, 3314–3323. [Google Scholar] [CrossRef] [Green Version]
- Butler, J.P.; Tolic-Norrelykke, I.M.; Fabry, B.; Fredberg, J.J. Traction fields, moments, and strain energy that cells exert on their surroundings. Am. J. Physiol. Cell Physiol. 2002, 282, C595–C605. [Google Scholar] [CrossRef] [PubMed] [Green Version]
- Houben, S.; Kirchgeßner, N.; Merkel, R. Estimating force fields of living cells—Comparison of several regularization schemes combined with automatic parameter choice. In Proceedings of the DAGM German Conference on Pattern Recognition, Darmstadt, Germany, 22–24 September 2010. [Google Scholar]
- Hebner, C.; Weaver, V.M.; Debnath, J. Modeling morphogenesis and oncogenesis in three-dimensional breast epithelial cultures. Annu. Rev. Pathol. 2008, 3, 313–339. [Google Scholar] [CrossRef] [PubMed]
- Wang, H.; Lacoche, S.; Huang, L.; Xue, B.; Muthuswamy, S.K. Rotational motion during three-dimensional morphogenesis of mammary epithelial acini relates to laminin matrix assembly. Proc. Natl. Acad. Sci. USA 2013, 110, 163–168. [Google Scholar] [CrossRef] [Green Version]
- Schafer, C.; Borm, B.; Born, S.; Mohl, C.; Eibl, E.M.; Hoffmann, B. One step ahead: Role of filopodia in adhesion formation during cell migration of keratinocytes. Exp. Cell Res. 2009, 315, 1212–1224. [Google Scholar] [CrossRef]
- Gagliardi, P.A.; Puliafito, A.; Blasio, L.; Chianale, F.; Somale, D.; Seano, G.; Bussolino, F.; Primo, L. Real-time monitoring of cell protrusion dynamics by impedance responses. Sci. Rep. 2015, 5, 10206. [Google Scholar] [CrossRef] [Green Version]
- Wu, C. Focal Adhesion: A Focal Point in Current Cell Biology and Molecular Medicine. Cell Adhes. Migr. 2007, 1, 13–18. [Google Scholar] [CrossRef] [Green Version]
- Stowers, R.S.; Allen, S.C.; Sanchez, K.; Davis, C.L.; Ebelt, N.D.; Van Den Berg, C.; Suggs, L.J. Extracellular Matrix Stiffening Induces a Malignant Phenotypic Transition in Breast Epithelial Cells. Cell. Mol. Bioeng. 2017, 10, 114–123. [Google Scholar] [CrossRef] [PubMed]
- Busco, G.; Cardone, R.A.; Greco, M.R.; Bellizzi, A.; Colella, M.; Antelmi, E.; Mancini, M.T.; Dell’Aquila, M.E.; Casavola, V.; Paradiso, A.; et al. NHE1 promotes invadopodial ECM proteolysis through acidification of the peri-invadopodial space. FASEB J. 2010, 24, 3903–3915. [Google Scholar] [CrossRef]
- Masuda, H.; Zhang, D.; Bartholomeusz, C.; Doihara, H.; Hortobagyi, G.N.; Ueno, N.T. Role of epidermal growth factor receptor in breast cancer. Breast Cancer Res. Treat. 2012, 136, 331–345. [Google Scholar] [CrossRef] [Green Version]
- Zhou, Z.N.; Sharma, V.P.; Beaty, B.T.; Roh-Johnson, M.; Peterson, E.A.; Van Rooijen, N.; Kenny, P.A.; Wiley, H.S.; Condeelis, J.S.; Segall, J.E. Autocrine HBEGF expression promotes breast cancer intravasation, metastasis and macrophage-independent invasion in vivo. Oncogene 2014, 33, 3784–3793. [Google Scholar] [CrossRef] [Green Version]
- Jacquemet, G.; Paatero, I.; Carisey, A.F.; Padzik, A.; Orange, J.S.; Hamidi, H.; Ivaska, J. FiloQuant reveals increased filopodia density during breast cancer progression. J. Cell Biol. 2017, 216, 3387–3403. [Google Scholar] [CrossRef] [Green Version]
- Kelley, L.C.; Lohmer, L.L.; Hagedorn, E.J.; Sherwood, D.R. Traversing the basement membrane in vivo: A diversity of strategies. J. Cell Biol. 2014, 204, 291–302. [Google Scholar] [CrossRef] [PubMed] [Green Version]
- Itoh, Y.; Seiki, M. MT1-MMP: A potent modifier of pericellular microenvironment. J. Cell. Physiol. 2006, 206, 1–8. [Google Scholar] [CrossRef]
- Ferrari, R.; Martin, G.; Tagit, O.; Guichard, A.; Cambi, A.; Voituriez, R.; Vassilopoulos, S.; Chavrier, P. MT1-MMP directs force-producing proteolytic contacts that drive tumor cell invasion. Nat. Commun. 2019, 10, 1–15. [Google Scholar] [CrossRef]
- Paz, H.; Pathak, N.; Yang, J. Invading one step at a time: The role of invadopodia in tumor metastasis. Oncogene 2014, 33, 4193–4202. [Google Scholar] [CrossRef] [PubMed] [Green Version]
- Eckert, M.A.; Lwin, T.M.; Chang, A.T.; Kim, J.; Danis, E.; Ohno-Machado, L.; Yang, J. Twist1-induced invadopodia formation promotes tumor metastasis. Cancer Cell 2011, 19, 372–386. [Google Scholar] [CrossRef] [Green Version]
- Oser, M.; Yamaguchi, H.; Mader, C.C.; Bravo-Cordero, J.J.; Arias, M.; Chen, X.; Desmarais, V.; van Rheenen, J.; Koleske, A.J.; Condeelis, J. Cortactin regulates cofilin and N-WASp activities to control the stages of invadopodium assembly and maturation. J. Cell Biol. 2009, 186, 571–587. [Google Scholar] [CrossRef] [PubMed] [Green Version]
- Linder, S.; Wiesner, C.; Himmel, M. Degrading devices: Invadosomes in proteolytic cell invasion. Annu. Rev. Cell Dev. Biol. 2011, 27, 185–211. [Google Scholar] [CrossRef]
- Thiery, J.P.; Acloque, H.; Huang, R.Y.; Nieto, M.A. Epithelial-mesenchymal transitions in development and disease. Cell 2009, 139, 871–890. [Google Scholar] [CrossRef]
- Cáceres, R.; Bojanala, N.; Kelley, L.C.; Dreier, J.; Manzi, J.; Di, F. Forces drive basement membrane invasion in Caenorhabditis elegans. Proc. Natl. Acad. Sci. USA 2018, 115, 11537–11542. [Google Scholar] [CrossRef] [Green Version]
- Martino, F.; Perestrelo, A.R.; Vinarský, V.; Pagliari, S.; Forte, G. Cellular mechanotransduction: From tension to function. Front. Physiol. 2018, 9, 824. [Google Scholar] [CrossRef]
- Pozzi, A.; Yurchenco, P.D.; Iozzo, R.V. The nature and biology of basement membranes. Matrix Biol. 2017, 57–58, 1–11. [Google Scholar] [CrossRef] [Green Version]
- Ramovs, V.; Te Molder, L.; Sonnenberg, A. The opposing roles of laminin-binding integrins in cancer. Matrix Biol. 2017, 57–58, 213–243. [Google Scholar] [CrossRef] [PubMed]
- Correia, A.L.; Bissell, M.J. The tumor microenvironment is a dominant force in multidrug resistance. Drug Resist. Updates 2012, 15, 39–49. [Google Scholar] [CrossRef] [Green Version]
- Hotulainen, P.; Lappalainen, P. Stress fibers are generated by two distinct actin assembly mechanisms in motile cells. J. Cell Biol. 2006, 173, 383–394. [Google Scholar] [CrossRef] [Green Version]
- Cao, X.; Voss, C.; Zhao, B.; Kaneko, T.; Li, S.S.C. Differential regulation of the activity of deleted in liver cancer 1 (DLC1) by tensins controls cell migration and transformation. Proc. Natl. Acad. Sci. USA 2012, 109, 1455–1460. [Google Scholar] [CrossRef] [Green Version]
- Chrzanowska-Wodnicka, M.; Burridge, K. Rho-stimulated contractility drives the formation of stress fibers and focal adhesions. J. Cell Biol. 1996, 133, 1403–1415. [Google Scholar] [CrossRef] [Green Version]
- Chen, C.; Tao, T.; Wen, C.; He, W.Q.; Qiao, Y.N.; Gao, Y.Q.; Chen, X.; Wang, P.; Chen, C.P.; Zhao, W.; et al. Myosin light chain kinase (MLCK) regulates cell migration in a myosin regulatory light chain phosphorylation-independent mechanism. J. Biol. Chem. 2014, 289, 28478–28488. [Google Scholar] [CrossRef] [PubMed] [Green Version]
- Webb, D.J.; Donais, K.; Whitmore, L.A.; Thomas, S.M.; Turner, C.E.; Parsons, J.T.; Horwitz, A.F. FAK-Src signalling through paxillin, ERK and MLCK regulates adhesion disassembly. Nat. Cell Biol. 2004, 6, 154–161. [Google Scholar] [CrossRef] [PubMed]
- Chang, T.T.; Thakar, D.; Weaver, V.M. Force-dependent breaching of the basement membrane. Matrix Biol. 2017, 57–58, 178–189. [Google Scholar] [CrossRef] [PubMed] [Green Version]


Publisher’s Note: MDPI stays neutral with regard to jurisdictional claims in published maps and institutional affiliations. |
© 2021 by the authors. Licensee MDPI, Basel, Switzerland. This article is an open access article distributed under the terms and conditions of the Creative Commons Attribution (CC BY) license (https://creativecommons.org/licenses/by/4.0/).
Share and Cite
Eschenbruch, J.; Dreissen, G.; Springer, R.; Konrad, J.; Merkel, R.; Hoffmann, B.; Noetzel, E. From Microspikes to Stress Fibers: Actin Remodeling in Breast Acini Drives Myosin II-Mediated Basement Membrane Invasion. Cells 2021, 10, 1979. https://0-doi-org.brum.beds.ac.uk/10.3390/cells10081979
Eschenbruch J, Dreissen G, Springer R, Konrad J, Merkel R, Hoffmann B, Noetzel E. From Microspikes to Stress Fibers: Actin Remodeling in Breast Acini Drives Myosin II-Mediated Basement Membrane Invasion. Cells. 2021; 10(8):1979. https://0-doi-org.brum.beds.ac.uk/10.3390/cells10081979
Chicago/Turabian StyleEschenbruch, Julian, Georg Dreissen, Ronald Springer, Jens Konrad, Rudolf Merkel, Bernd Hoffmann, and Erik Noetzel. 2021. "From Microspikes to Stress Fibers: Actin Remodeling in Breast Acini Drives Myosin II-Mediated Basement Membrane Invasion" Cells 10, no. 8: 1979. https://0-doi-org.brum.beds.ac.uk/10.3390/cells10081979