
Effects of One-Day Application of Levodopa/Carbidopa/Entacapone versus Levodopa/Carbidopa/Opicapone in Parkinson’s Disease Patients


Abstract
:
1. Introduction
2. Subjects and Methods
2.1. Subjects
2.2. Design
2.3. Statistical Analysis
2.4. Blood Sampling
2.5. Ethics
3. Results
3.1. L-dopa
3.2. OMD in Plasma
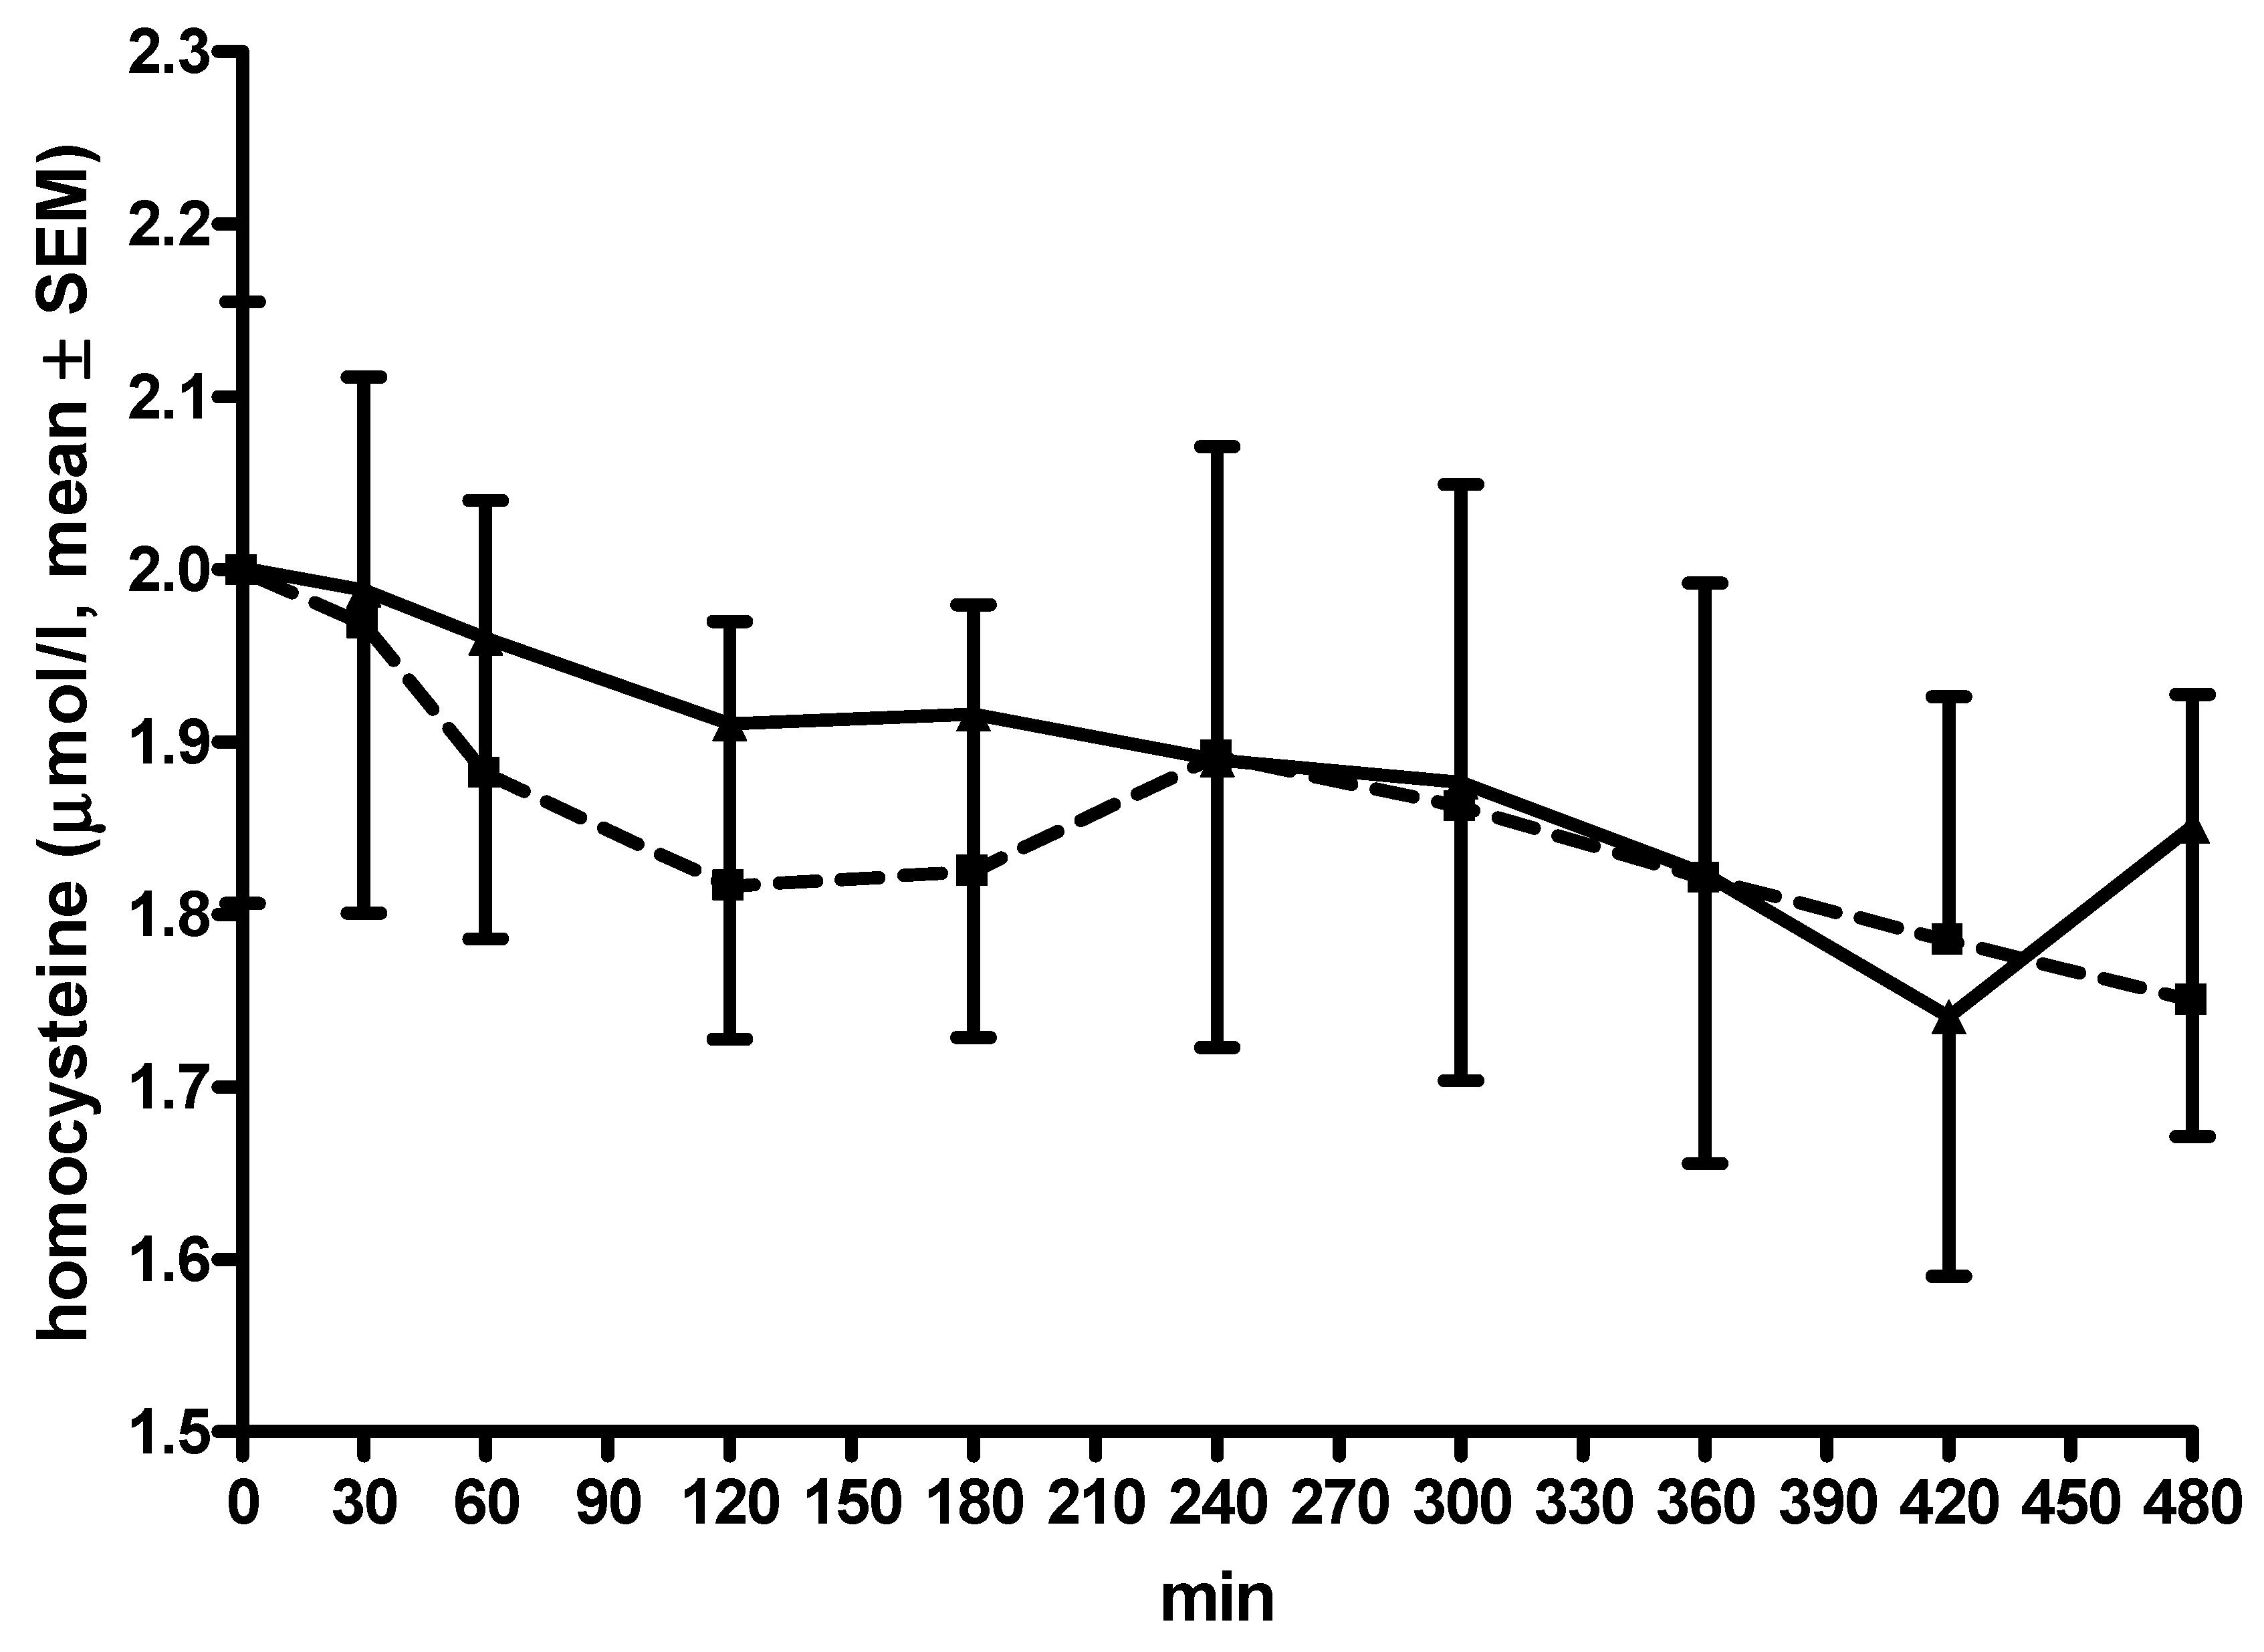
3.3. Thcys in Plasma
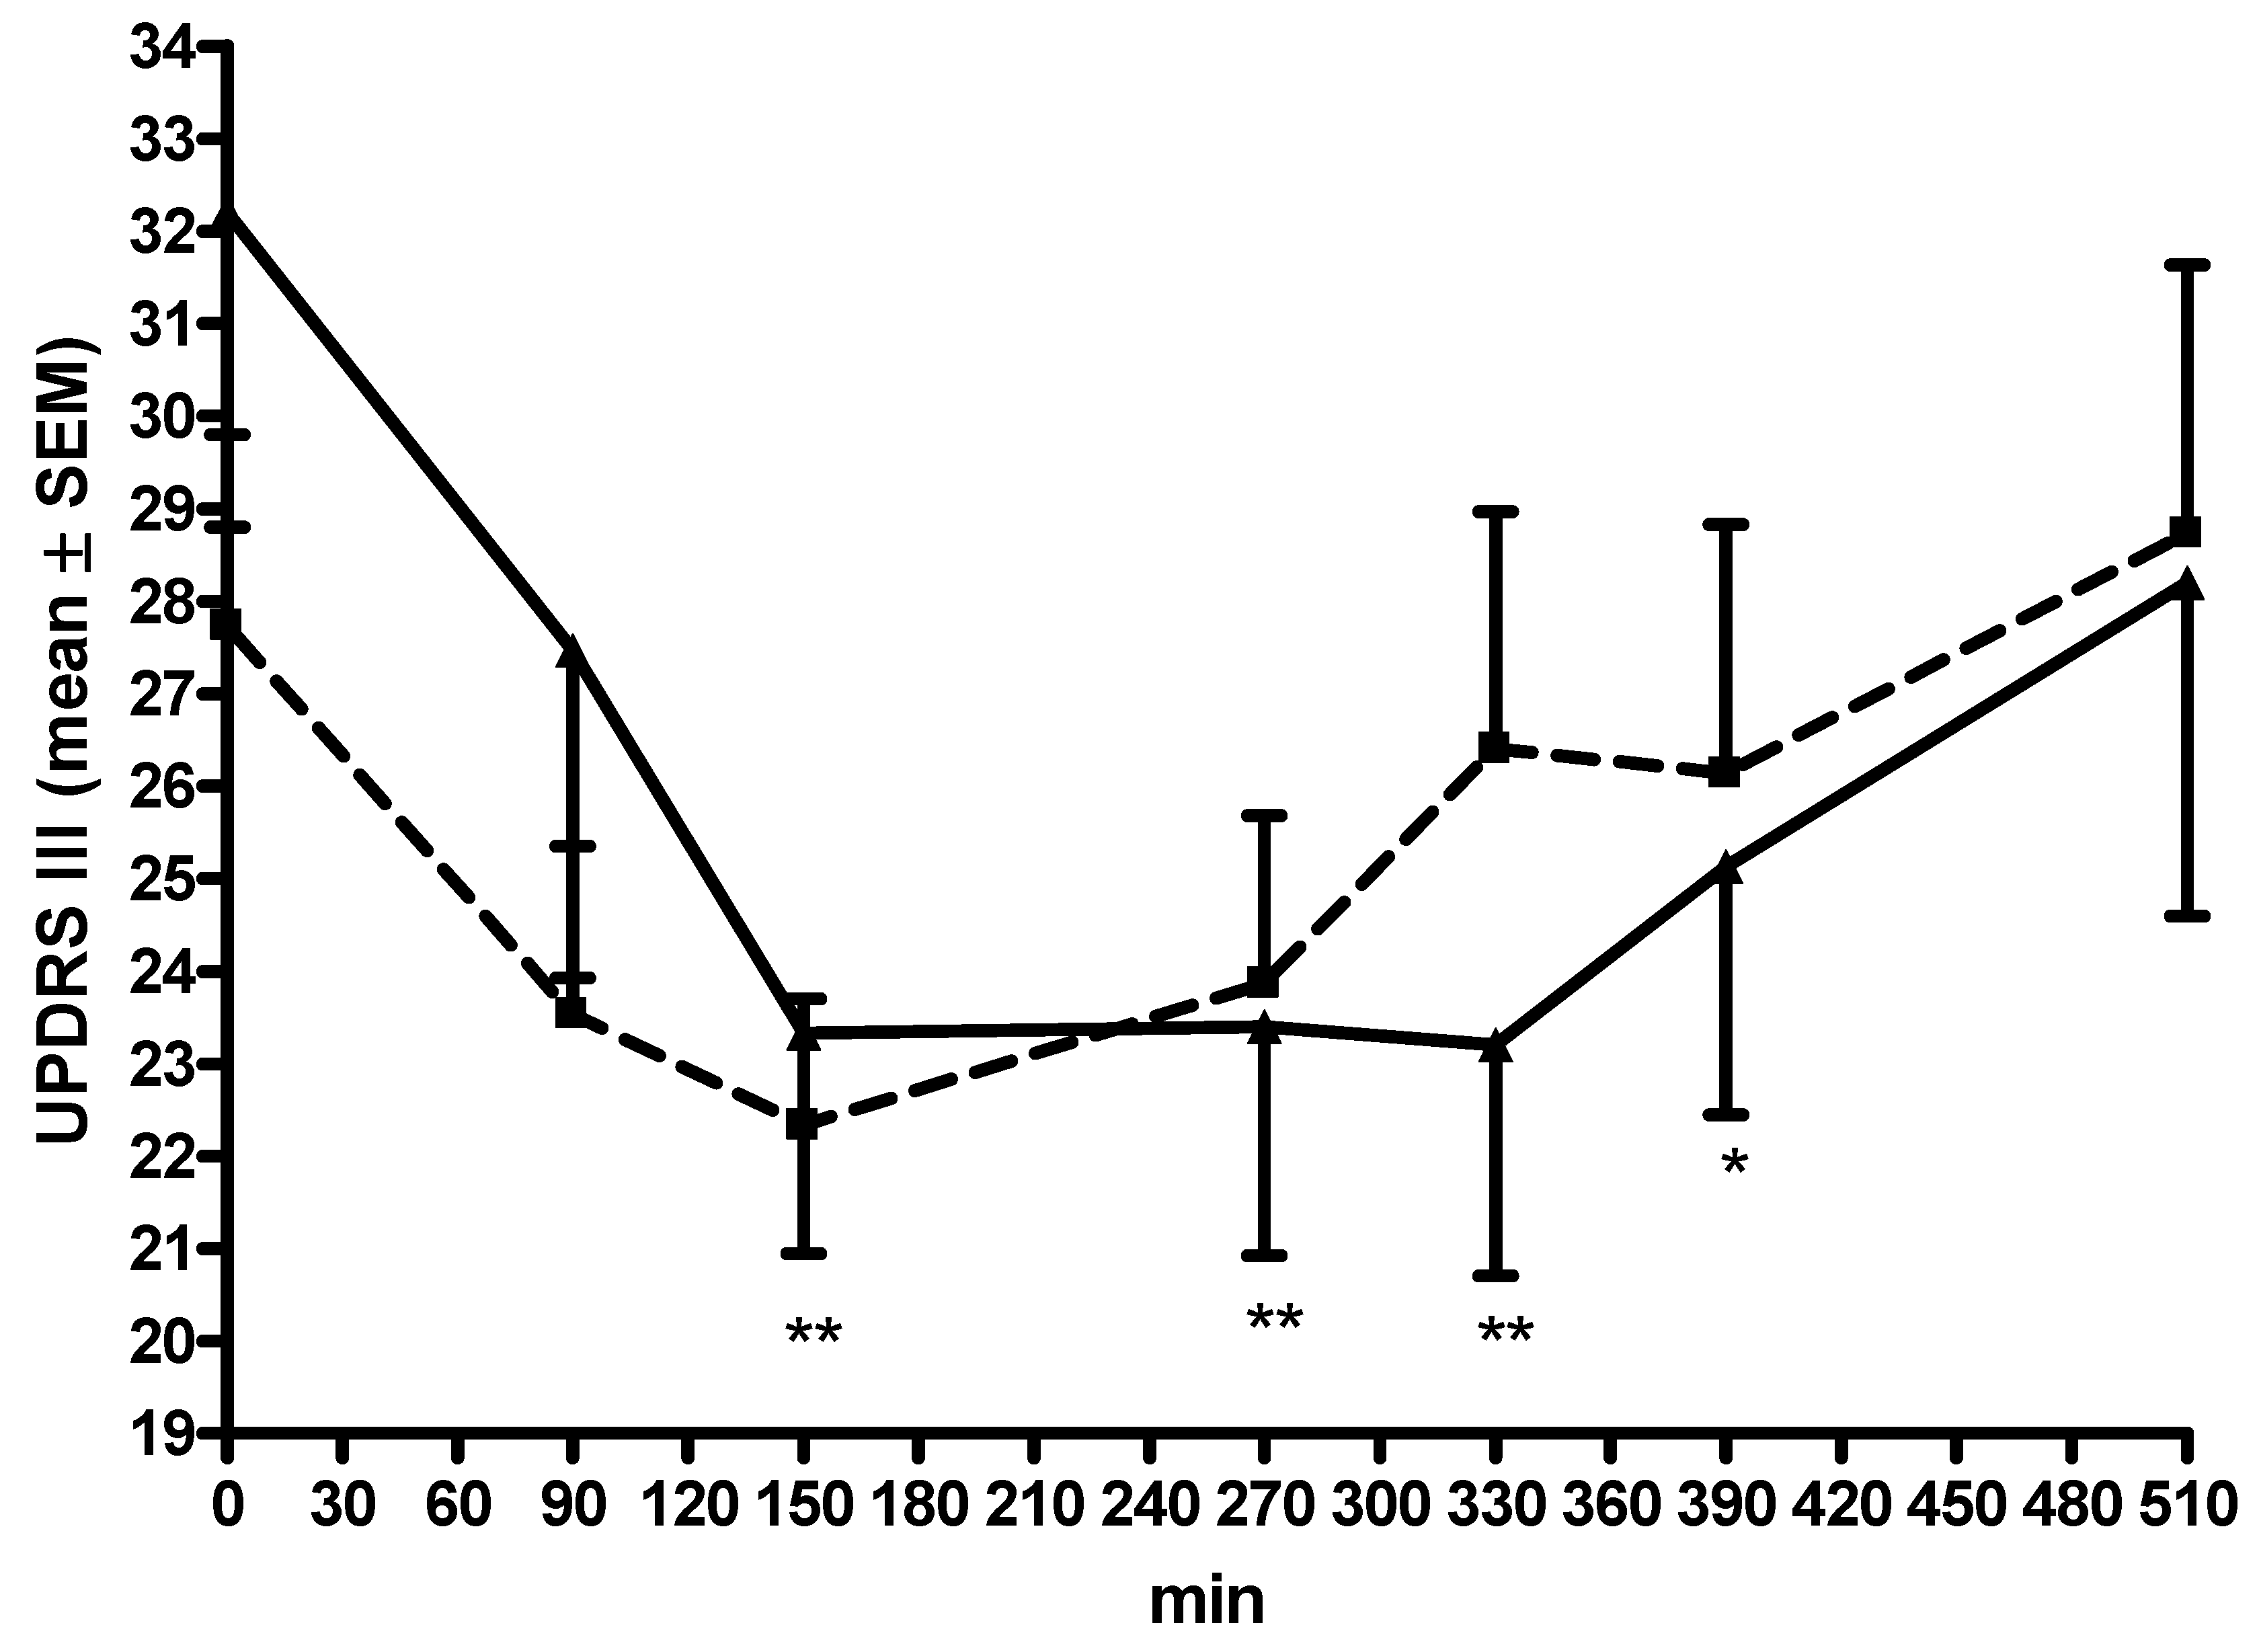
3.4. UPDRS III
4. Discussion
Author Contributions
Funding
Institutional Review Board Statement
Informed Consent Statement
Data Availability Statement
Acknowledgments
Conflicts of Interest
References
- Fahn, S.; Oakes, D.; Shoulson, I.; Kieburtz, K.; Lang, A.E.; Olanow, C.W.; Tanner, C.M.; Marek, K. Levodopa and the progression of Parkinson’s disease. N. Engl. J. Med. 2004, 351, 2498–2508. [Google Scholar] [PubMed]
- Müller, T. Catechol-O-methyltransferase inhibitors in Parkinson’s disease. Drugs 2015, 75, 157–174. [Google Scholar] [CrossRef] [PubMed]
- Block, G.; Liss, C.; Reines, S.; Irr, J.; Nibbelink, D. Comparison of immediate-release and controlled release carbidopa/levodopa in Parkinson’s disease. A multicenter 5-year study. The CR First Study Group. Eur. Neurol. 1997, 37, 23–27. [Google Scholar] [CrossRef] [PubMed]
- Brooks, D.J.; Sagar, H. Entacapone is beneficial in both fluctuating and non-fluctuating patients with Parkinson’s disease: A randomised, placebo controlled, double blind, six month study. J. Neurol. Neurosurg. Psychiatry 2003, 74, 1071–1079. [Google Scholar] [CrossRef] [Green Version]
- Ferreira, J.J.; Lees, A.; Rocha, J.F.; Poewe, W.; Rascol, O.; Soares-da-Silva, P. Long-term efficacy of opicapone in fluctuating Parkinson’s disease patients: A pooled analysis of data from two phase 3 clinical trials and their open-label extensions. Eur. J. Neurol. 2019, 26, 953–960. [Google Scholar] [CrossRef]
- Rocha, J.F.; Nunes, T.; Vaz-da-Silva, M.; Machado, R.; Wright, L.C.; Falcao, A.; Almeida, L.; Soares-da-Silva, P. Pharmacokinetics, pharmacodynmics and tolerability of opicapone, a novel COMT inhibitor, during multiple dose rise regimen in healthy male subjects. Parkinsonism. Relat. Disord. 2012, 18S2, S81–S159. [Google Scholar]
- Rocha, J.-F.; Falcão, A.; Santos, A.; Pinto, R.; Lopes, N.; Nunes, T.; Wright, L.C.; Vaz-Da-Silva, M.; Soares-Da-Silva, P. Effect of opicapone and entacapone upon levodopa pharmacokinetics during three daily levodopa administrations. Eur. J. Clin. Pharmacol. 2014, 70, 1059–1071. [Google Scholar] [CrossRef]
- Almeida, L.; Rocha, J.F.; Falcão, A.; Palma, P.N.; Loureiro, A.L.; Pinto, R.; Bonifácio, M.J.; Wright, L.C.; Nunes, T.; Soares-da-Silva, P. Pharmacokinetics, pharmacodynamics and tolerability of opicapone, a novel catechol-O-methyltransferase inhibitor, in healthy subjects: Prediction of slow enzyme-inhibitor complex dissociation of a short-living and very long-acting inhibitor. Clin. Pharm. 2013, 52, 139–151. [Google Scholar] [CrossRef]
- Kuoppamäki, M.; Korpela, K.; Marttila, R.; Kaasinen, V.; Hartikainen, P.; Lyytinen, J.; Kaakkola, S.; Hänninen, J.; Löyttyniemi, E.; Kailajärvi, M.; et al. Comparison of pharmacokinetic profile of levodopa throughout the day between levodopa/carbidopa/entacapone and levodopa/carbidopa when administered four or five times daily. Eur. J. Clin. Pharmacol. 2009, 65, 443–455. [Google Scholar] [CrossRef] [Green Version]
- Müller, T.; Erdmann, C.; Muhlack, S.; Bremen, D.; Przuntek, H.; Woitalla, D. Inhibition of catechol-O-methyltransferase contributes to more stable levodopa plasma levels. Mov. Disord. 2006, 21, 332–336. [Google Scholar] [CrossRef]
- Nutt, J.G.; Woodward, W.R.; Gancher, S.T.; Merrick, D. 3-O-methyldopa and the response to levodopa in Parkinson’s disease. Ann. Neurol. 1987, 21, 584–588. [Google Scholar] [CrossRef] [PubMed]
- Müller, T.; Muhlack, S. Peripheral COMT inhibition prevents levodopa associated homocysteine increase. J. Neural. Transm. 2009, 116, 1253–1256. [Google Scholar] [CrossRef] [PubMed]
- Müller, T.; Kuhn, W. Homocysteine levels after acute levodopa intake in patients with Parkinson’s disease. Mov. Disord. 2009, 24, 1339–1343. [Google Scholar] [CrossRef] [PubMed]
- Müller, T.; Muhlack, S. Acute homocysteine rise after repeated levodopa application in patients with Parkinson’s disease. Parkinsonism. Relat. Disord. 2010, 16, 688–689. [Google Scholar] [CrossRef]
- Fahn, S.; Elton, R.; Members of the UPDRS Development Committee. Unified Parkinson’s Disease Rating Scale. In Recent Developments in Parkinson’s Disease; Fahn, S., Marsden, C.D., Calne, D.B., Goldstein, M., Eds.; Macmillan Health Care Information: Florham Park, NJ, USA, 1987; Volume 2, pp. 153–163. [Google Scholar]
- Loewen, G.; LeWitt, P.; Olanow, C.; Kieburtz, K.D.; Liang, G.S.; Jimenez, R.; Olson, K.; Roberts, E. Pharmacokinetics of opicapone and effect on COMT and levodopa pharmacokinetics in patients with Parkinson’s disease. Parkinsonism & Related Disorders. J. Mov. Disord. 2019, 34, S7. [Google Scholar]
- Müller, T.; Erdmann, C.; Muhlack, S.; Bremen, D.; Przuntek, H.; Goetze, O.; Woitalla, D. Pharmacokinetic behaviour of levodopa and 3-O-methyldopa after repeat administration of levodopa/carbidopa with and without entacapone in patients with Parkinson’s disease. J. Neural. Transm. 2006, 113, 1441–1448. [Google Scholar] [CrossRef]
- Müller, T.; Thiede, H.M. Bound, free, and total L-dopa measurement in plasma of Parkinson’s disease patients. J. Neural. Transm. 2019, 126, 1417–1420. [Google Scholar] [CrossRef]
- Ruottinen, H.M.; Rinne, U.K. Entacapone prolongs levodopa response in a one month double blind study in parkinsonian patients with levodopa related fluctuations. J. Neurol. Neurosurg. Psychiatry 1996, 60, 36–40. [Google Scholar] [CrossRef] [Green Version]
- Hauser, R.A.; Panisset, M.; Abbruzzese, G.; Mancione, L.; Dronamraju, N.; Kakarieka, A.; on behalf of the FIRST-STEP Study Group. Double-blind trial of levodopa/carbidopa/entacapone versus levodopa/carbidopa in early Parkinson’s disease. Mov. Disord. 2009, 24, 541–550. [Google Scholar] [CrossRef]
- Stocchi, F.; Rascol, O.; Kieburtz, K.; Poewe, W.; Jankovic, J.; Tolosa, E.; Barone, P.; Lang, A.; Olanow, C.W. Initiating levodopa/carbidopa therapy with and without entacapone in early Parkinson disease: The STRIDE-PD study. Ann. Neurol. 2010, 68, 18–27. [Google Scholar] [CrossRef]
- Müller, T.; Woitalla, D.; Muhlack, S. Inhibition of catechol-O-methyltransferase modifies acute homocysteine rise during repeated levodopa application in patients with Parkinson’s disease. Naunyn. Schmiedebergs Arch. Pharmacol. 2011, 383, 627–633. [Google Scholar] [CrossRef] [PubMed]
- Mattson, M.P. Methylation and acetylation in nervous system development and neurodegenerative disorders. Ageing Res. Rev. 2003, 2, 329–342. [Google Scholar] [CrossRef]
- Schade, S.; Mollenhauer, B.; Trenkwalder, C. Levodopa Equivalent Dose Conversion Factors: An Updated Proposal Including Opicapone and Safinamide. Mov. Disord. Clin. Pract. 2020, 7, 343–345. [Google Scholar] [CrossRef] [PubMed]
- Müller, T.; Kohlhepp, W. Hypomethylation in Parkinson’s disease: An epigenetic drug effect? Mov. Disord. 2016, 31, 605. [Google Scholar] [CrossRef]


| Age | 64.67 ± 8.47 years |
| Sex | 14 men, 1 woman |
| Time since diagnosis | 10 ± 3.58 years |
| Height | 178.6 ± 10.2 cm |
| Body weight | 92.56 ± 14.67 kg |
| UPDRS I | 2.8 ± 1.59 |
| UPDRS II | 13.8 ± 4.83 |
| UPDRS III | 31.6 ± 9.63 |
| UPDRS IV | 4.8 ± 1.18 |
| UPDRS total | 52.8 ± 12.87 |
| Daily oral L-dopa/carbidopa (benserazide) dose | 444.4 ± 133.5 mg |
| Safinamide 100 mg | 2 patients |
| Selegiline 5 mg | 1 patient |
| Rasagiline 1 mg | 4 patients |
| Piribedil | 2 patients 150 mg, 1 patient 50 mg |
| Pramipexol | 4 patients 3.15 mg, 1 patient 1.57 mg |
| Rotigotine | 2 patients 8 mg, 1 patient 6 mg |
| Ropinirole | 2 patients 4 mg, 1 patient 8 mg |
| Amantadine | 3 patients 200 mg |
| LD/CD/OP | LD/CD/EN | ||
|---|---|---|---|
| L-dopa | p | ||
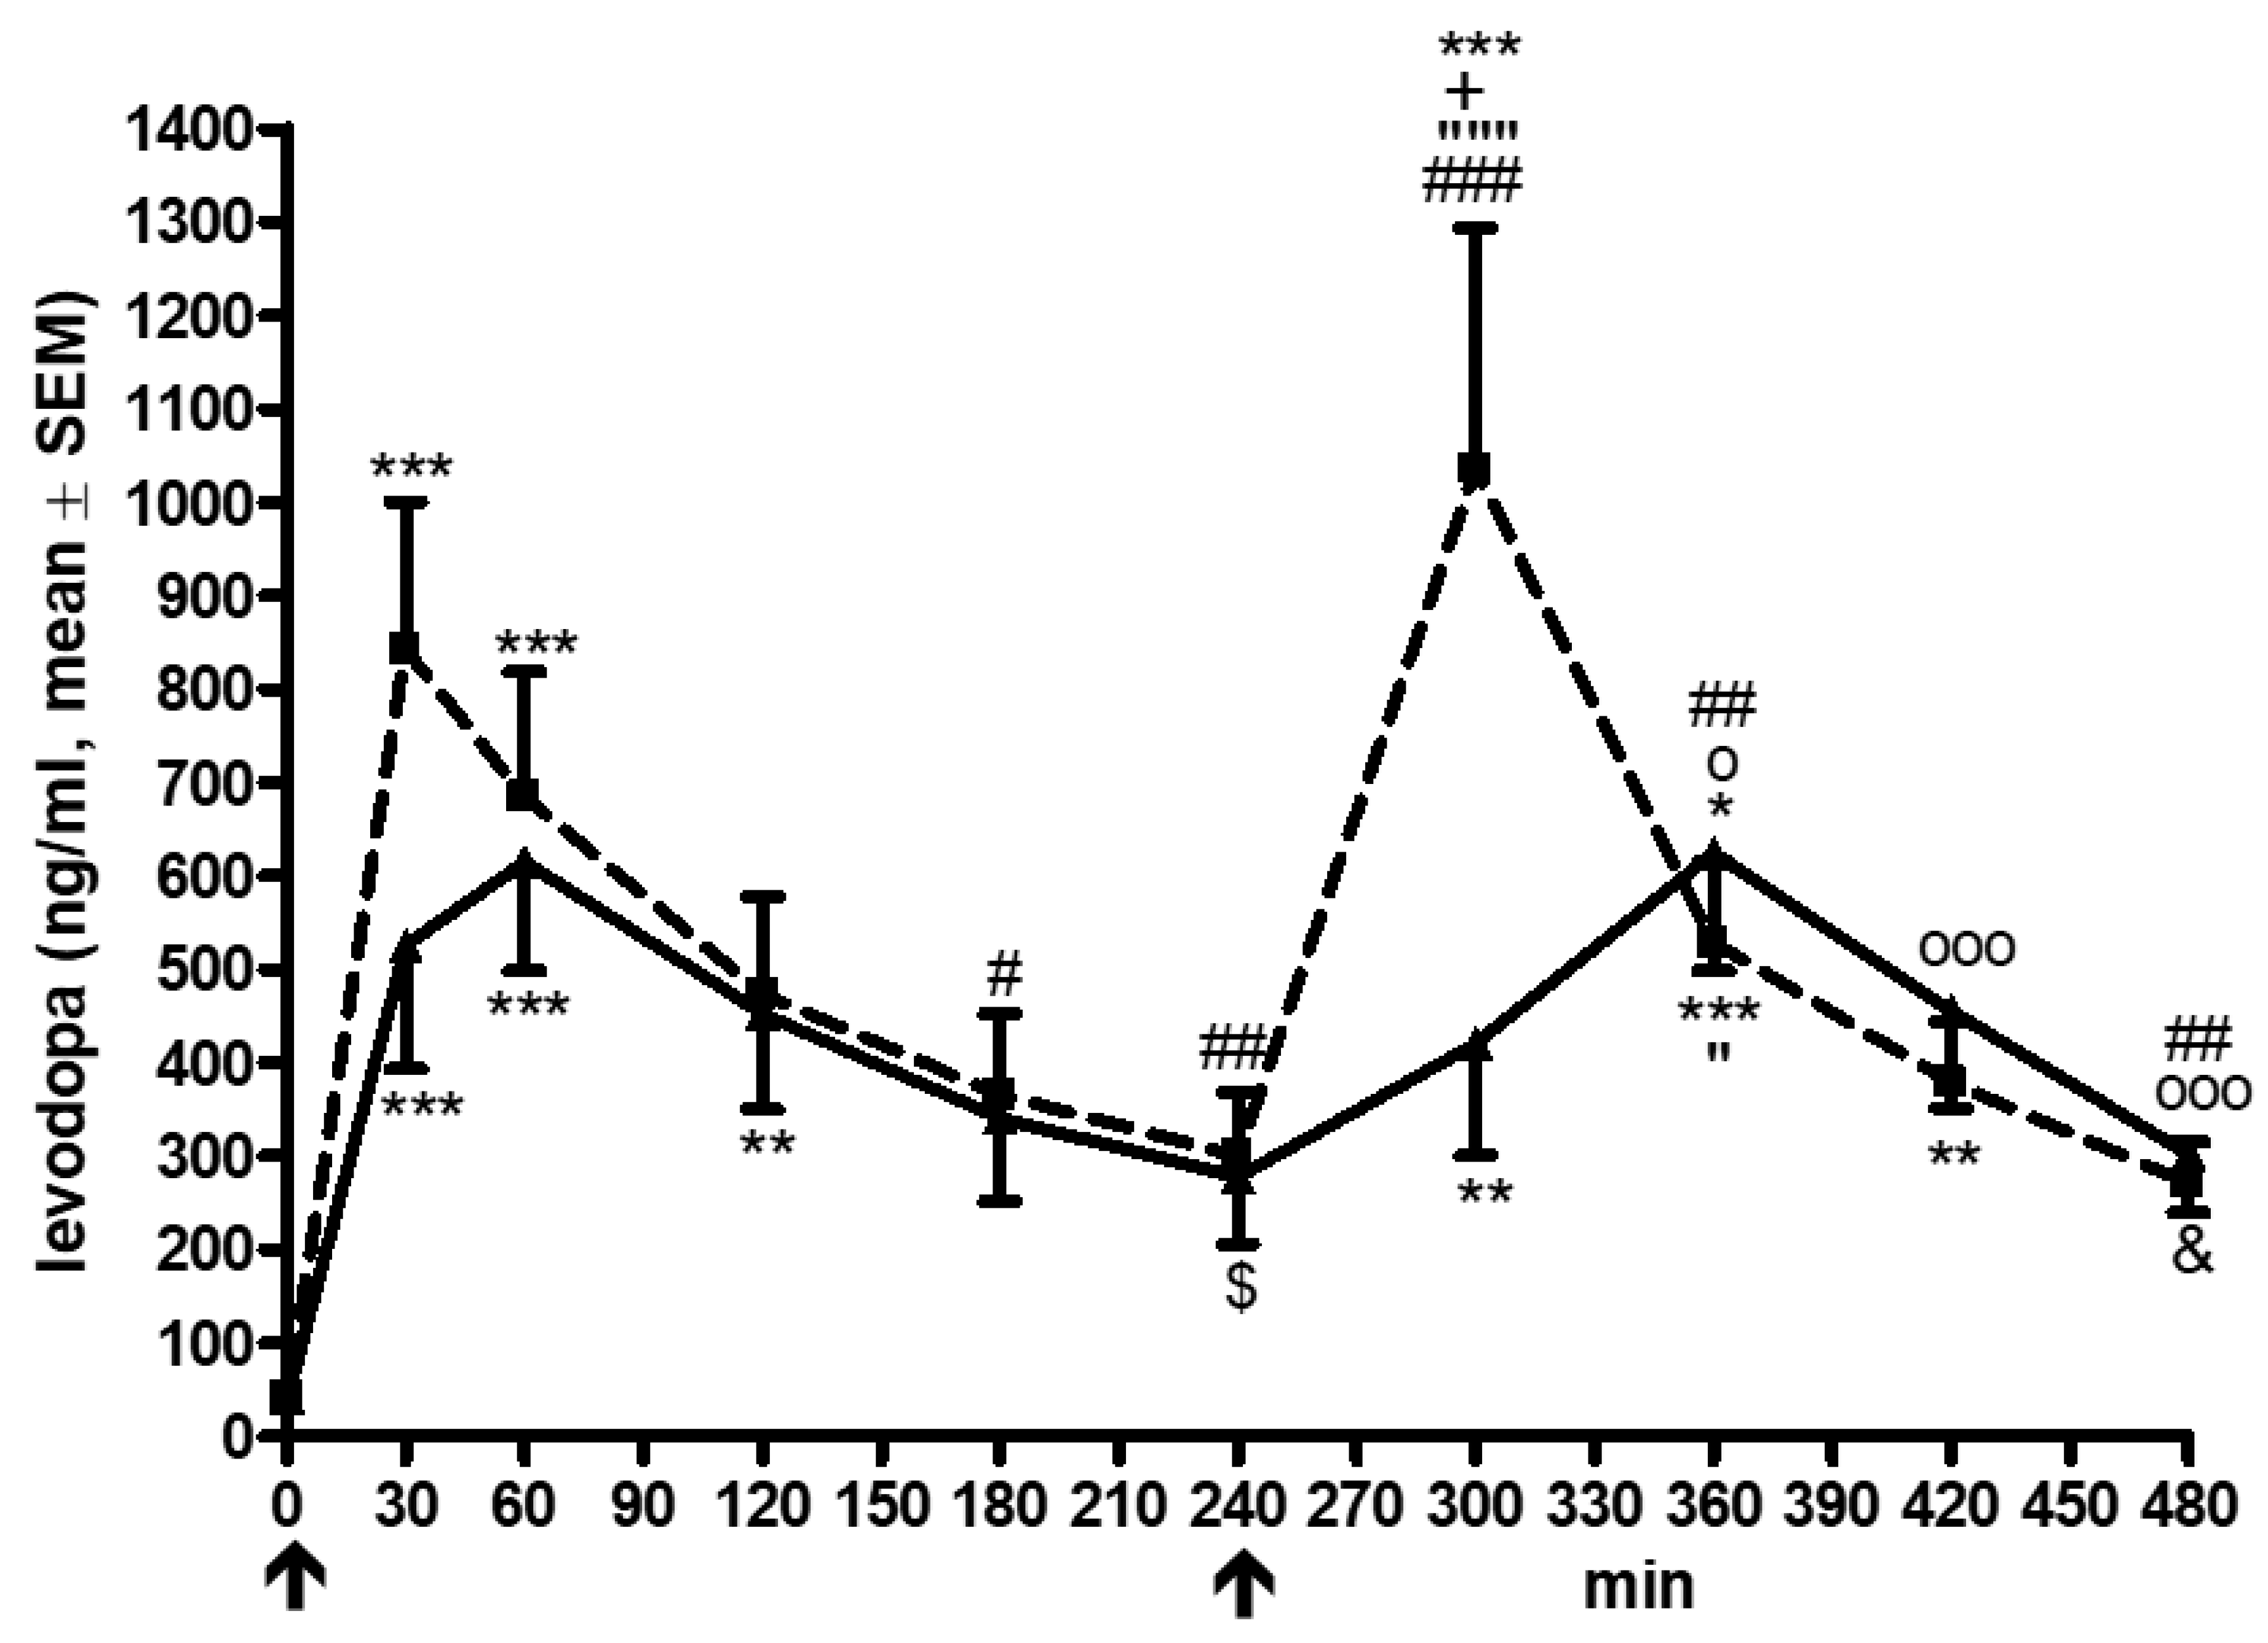
| Raw values L-dopa | 511.3 ± 46.25 | 405.7 ± 33.56 | 0.0029 |
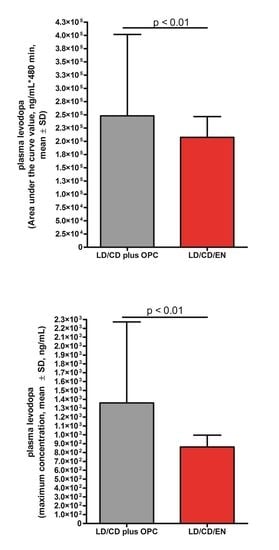
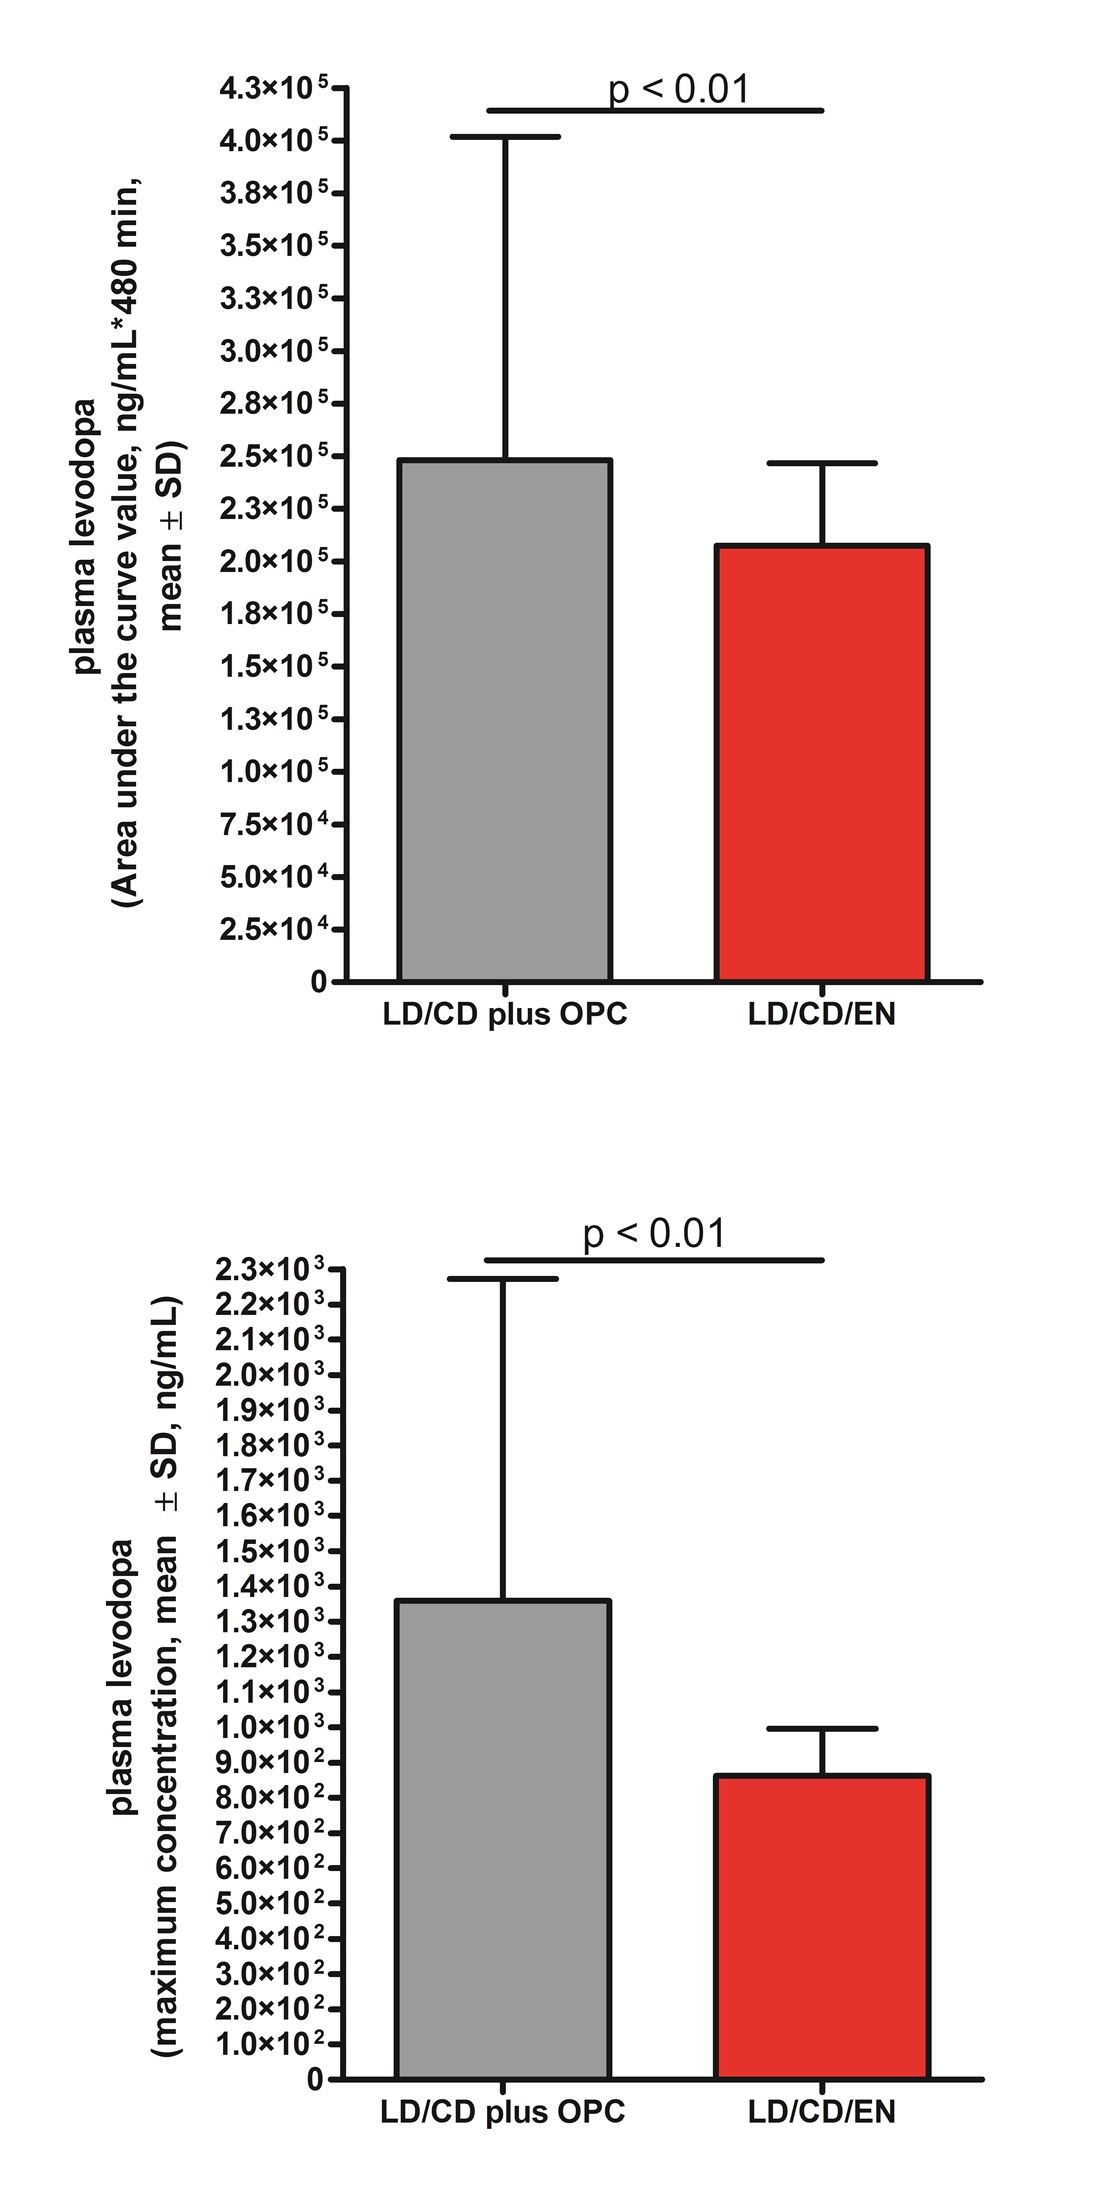
| AUC | 249,810 ± 39,025 | 207,467 ± 39,191 | 0.0014 |
| Cmax | 1370 ± 235.5 | 910.3 ± 142.5 | 0.0063 |
| 1st period: Cmax-Cmin | 628.1 ± 108.8 | 495.1 ± 89.14 | ns |
| 2nd period: Cmax-Cmin | 820.3 ± 223.9 | 333.6 ± 67.43 | 0.019 |
| FI: 1st interval | 1.77 ± 0.11 | 1.96 ± 0.09 | ns |
| FI: 2nd interval | 1.56 ± 0.24 | 1.15 ± 0.18 | ns |
| FI: whole interval | 2.56 ± 0.24 | 2.36 ± 0.22 | ns |
| 3-OMD | |||
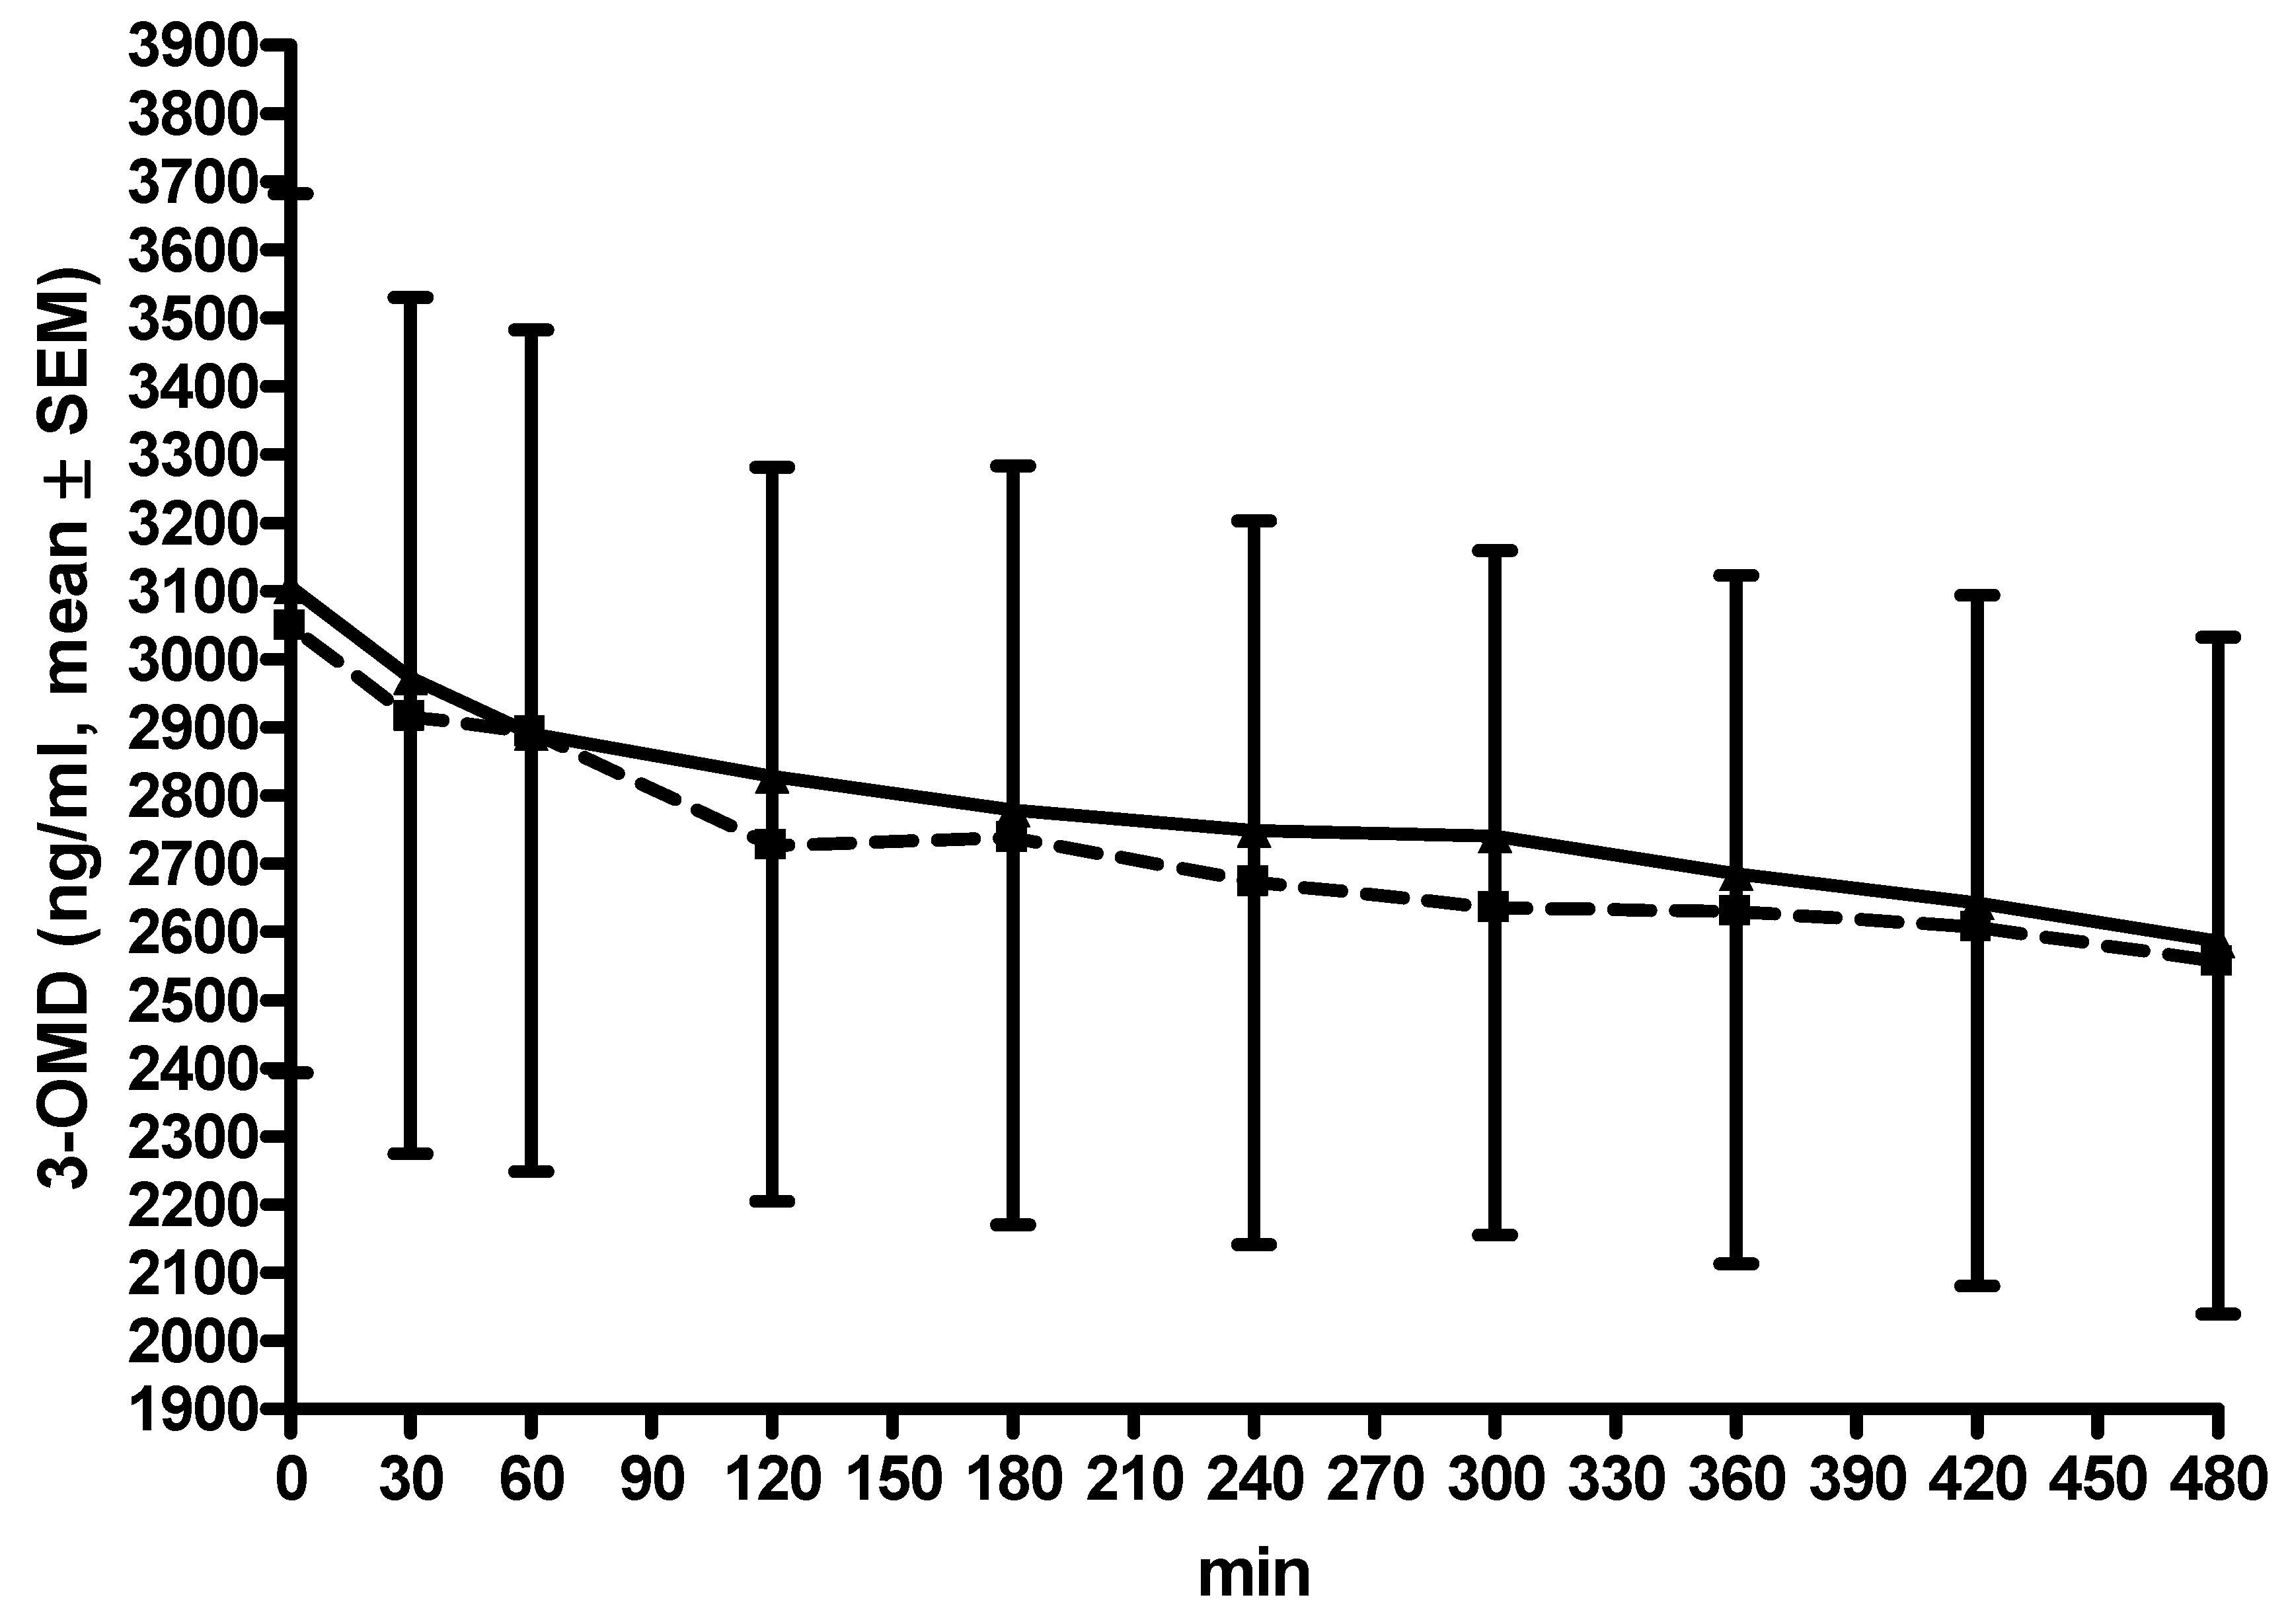
| AUC | 1.301e + 006 ± 256,335 | 1.329e + 006 ± 290,178 | ns |
| Cmax | 3151 ± 612.9 | 3219 ± 690.7 | ns |
| thcys | |||
| AUC | 886.2 ± 74.84 | 902.8 ± 81.11 | ns |
| Cmax | 2.213 ± 0.1921 | 2.169 ± 0.1935 | ns |
| UPDRS III | |||
| AUC | 12,831 ± 938.6 | 13,061 ± 1321 | ns |
| CminUPDRS | 19.33 ± 1.472 | 20 ± 2.348 | ns |
Publisher’s Note: MDPI stays neutral with regard to jurisdictional claims in published maps and institutional affiliations. |
© 2022 by the authors. Licensee MDPI, Basel, Switzerland. This article is an open access article distributed under the terms and conditions of the Creative Commons Attribution (CC BY) license (https://creativecommons.org/licenses/by/4.0/).
Share and Cite
Müller, T.; Schlegel, E.; Zingler, S.; Thiede, H.M. Effects of One-Day Application of Levodopa/Carbidopa/Entacapone versus Levodopa/Carbidopa/Opicapone in Parkinson’s Disease Patients. Cells 2022, 11, 1511. https://0-doi-org.brum.beds.ac.uk/10.3390/cells11091511
Müller T, Schlegel E, Zingler S, Thiede HM. Effects of One-Day Application of Levodopa/Carbidopa/Entacapone versus Levodopa/Carbidopa/Opicapone in Parkinson’s Disease Patients. Cells. 2022; 11(9):1511. https://0-doi-org.brum.beds.ac.uk/10.3390/cells11091511
Chicago/Turabian StyleMüller, Thomas, Eugen Schlegel, Stephanie Zingler, and Hans Michael Thiede. 2022. "Effects of One-Day Application of Levodopa/Carbidopa/Entacapone versus Levodopa/Carbidopa/Opicapone in Parkinson’s Disease Patients" Cells 11, no. 9: 1511. https://0-doi-org.brum.beds.ac.uk/10.3390/cells11091511