Physiological Expression of Ion Channel Receptors in Human Periodontal Ligament Stem Cells
by
 , , ,
, , ,
Luigi Chiricosta
1 ,
,
Francesca Diomede
2,
Oriana Trubiani
2,
Placido Bramanti
1 and
Emanuela Mazzon
1,* 1
IRCCS Centro Neurolesi “Bonino-Pulejo”, 98124 Messina, Italy
2
Department of Medical, Oral and Biotechnological Sciences, University “G. d’Annunzio” Chieti-Pescara, 66100 Chieti, Italy
*
Author to whom correspondence should be addressed.
Cells 2019, 8(3), 219; https://0-doi-org.brum.beds.ac.uk/10.3390/cells8030219
Submission received: 23 January 2019
/
Revised: 19 February 2019
/
Accepted: 1 March 2019
/
Published: 6 March 2019
(This article belongs to the Special Issue Stem Cell Therapy in Oral and Maxillofacial Region)
Abstract
:The etiopathogenesis of neurodegenerative diseases is characterized by the death of neurons. Human periodontal ligament stem cells (hPDLSCs), coming from neuronal crest, can potentially become neuronal cells because of their embryologic origin. In this study, we performed an RNA-seq analysis of hPDLSCs in order to determine whether their transcriptomic profile revealed genes encoded for ion channel receptors. Next, each found gene was enriched by the information of pathways stored in the Reactome database. Our results show that the hPDLSCs express GABBR1 and GABBR2, CHRNA1, GRINA genes, respectively associated with GABAB, NMDA and nACh receptors. In particular, the two subunits of GABAB receptor are expressed in hPDLSCs. Further, the proteic extract for GABABR1, GABABR2 and AChRα1 confirmed their expression in hPDLSCs. Our results show that hPDLSCs express physiologically genes associated with ion channel receptors maintaining multipotent features which are useful for neurogenesis.
1. Introduction
The embryonic head development, together to dental structure formation, is founded on a complex and delicate process directed by a specific, hierarchically-defined genetic program [1]. Teeth are ectodermal appendages whose development is influenced by reciprocal interactions between the surface epithelium (ectoderm) and the underlying neural crest-derived mesenchyme. These interactions are arbitrated by several conserved signaling pathways, such as: Wnt, bone morphogenetic protein (BMP), fibroblast growth factor (FGF), sonic hedgehog (SHH), and ectodysplasin A (EDA) [2]. The neural crest (NC), the embryonic structure present in vertebrates, is indicated as a “fourth germ layer”; it is constituted from multipotent cells, named neural crest cells (NCCs), which are able to differentiate into a surprising array of adult structures. NCCs are a transient multipotent stem cell population that originally appears at the junction of the epidermal and neural ectoderm by reciprocal interactions between these tissues and by signals from the mesoderm [3]. During neurulation process, NCCs begin to delaminate from the dorsal region of the neural epithelium, going toward epithelial-mesenchymal transition [4]. Subsequently, they migrate into their destination in the embryo to generate various groups of cells, including: sensory, autonomic, and enteric ganglia within the peripheral nervous system; and the adrenal medulla, melanocytes, in addition to skeletal, connective, adipose, and endocrine cells [5]. Actually, several studies indicate that NCCs play a crucial role in embryonic development, representing a likely stem cell population that may be an innovative approach in the regeneration of a large repertoire of tissues as well as neuronal cells [6,7,8]. In fact, unfortunately, for most diseases which affect the Central Nervous System (CNS), no treatment exists. When it does exist, it is typically just either a temporary or a palliative solution. For this reason, studies focused on replacing lost neuronal cells by unspecialized cells, like stem cells, are increasing [9,10,11]. Neural crest stem cells could be particularly well-suited to replace nervous system cells. In order to become neuronal cells, they have to express some proteins on their membranes which are able to bind to neurotransmitter molecules like the gamma-Aminobutyric acid (GABA), glutamate or the acetylcholine. These proteins are called neurotransmitter receptors; they are essential for the transmission of signals between cells. Neurotransmitter receptors are classified in ligand-gated ion channels (or ionotropic) and metabotropic receptors. The ionotropic receptors directly allow the flow of ions (Na+, K+, Ca2+, Cl−) through the membrane cell when the neurotransmitter binds them. Typical receptors of this class are nicotinic acetylcholine (nAChR), GABAA, α-amino-3-hydroxy-5-methyl-4-isoxazolepropionic (AMPA), (2S,3S,4S)-3-(Carboxymethyl)-4-(prop-1-en-2-yl)pyrrolidine-2-carboxylic acid (Kainate), and N-methyl-d-aspartate (NMDA) receptors. Typical metabotropic receptors are muscarinic acetylcholine (mAChR), metabotropic glutamate (mGluR), GABAB receptors. When a neurotransmitter saturates a receptor, the associated G protein complex changes conformation, and a secondary message is released. The focus of this paper is to evaluate whether hPDLSCs express physiologically genes encoded for ion channel receptors. Using the Next Generation Sequencing (NGS) technology, our study performed a transcriptomic analysis of a cluster of hPDLSCs from healthy control individuals. The expressed genes were enriched by the information of the cellular pathways in the Reactome database [12].
2. Materials and Methods
2.1. Cell Isolation
hPDLSCs were isolated from periodontal tissue of three different healthy males of 35–40 years of age. None of them was a smoker. The Medical School “G. d’Annunzio” University, Chieti, Italy, received the approval by the Ethical Committee about cell isolation and culture protocol (number 266/17 April 2014). Before tissue collection, the individuals taking part in the project gave informed consent. The experiments followed the pertinent guidelines and regulations. The hPDLSCs were isolated according to Dominici, M [13]. The surface of the coronal root was scraped using a Gracey’s curette [14]. The undifferentiated cells were then cultured through Mesenchymal Stem Cell Growth Medium Chemically Defined (MSCGM-CD) (Lonza, Basel, Switzerland) and preserved at 37 °C in an incubator with a 5% CO2 concentration in the air.
2.2. Cells Culture
The hPDLSCs were cultured according to the method described by Seo B. [15]. They grew in a 25 cm2 flask with a MSCGM-CD that was changed every two days. The cells at passage 2 were then used for the following experiments. The morphological evaluation of the cells was made by microscopy DMIL to detect a toluidine blue solution (Leica Microsystem, Milan, Italy) [16].
The human dermal fibroblasts (type DPK-SKDF-H), used as a control, were donated by the Department of Biomedical and Dental Sciences and Morphofunctional Images of University of Messina and acquired from Dominion Pharmakine (Bizkaia, Spain). The DPK-SKDF-H were cultured in a Dulbecco’s Minimal Essential Medium (DMEM) to which were added 10% Fetal Bovine Serum (FBS), penicillin/streptomycin (100 units/mL, 100 µg/mL) and L-glutamine (2 mmol/L) inside a 75 cm2 plastic flask. They were then incubated at 37 °C in humidified air with 5% CO2.
2.3. Cytofluorimetric Evaluation
Five lots of 105 hPDLSCs were placed in a 6-well tissue culture plate and incubated with 1 µg of the specific antibody, conjugated with fluorescein isothiocyanate (FITC), phycoerythrin (PE), allophycocyanin (APC), phycoerythrin-cyanine 5.5 (PE Cy5.5), or Alexa Fluor 488 for 30 min at 4 °C in the dark. The hPDLSCs were stained using the following antibodies: anti-CD29, anti-CD44, anti-CD45, anti-CD105 (Ancell, Bayport, MN, USA); anti-CD14 (Milteny Biotec, Bergisch Gladbach, Germany); anti-CD73, anti-CD90, anti-OCT3/4, anti-Sox2 and anti-SSEA4 (Becton Dickinson, BD, San Jose, CA, USA); anti-CD34 (Beckman Coulter, Fullerton, CA, USA). After incubation, the cells were acquired with a flow cytometer (FACSCaliburTM; Becton Dickinson, BD, San Jose, CA, USA). Data were analyzed by the FlowJo software v8.8.6 (TreeStar, Ashland, OR, USA).
2.4. MTT Assay
The viability of the hPDLSCs was determined using the 3-(4,5-dimethylthiazolyl-2)-2,5-diphenyltetrazoliumbromide (MTT) method. Two lots of 103 cells/well were placed in a 96-well tissue culture plate and incubated at 37 °C for 24, 48, 72 h and 1 week. At each time point, MTT solution (20 µL) (Promega, Milan, Italy) was added to each well to detect the metabolic activity of the cells [17,18].
2.5. Mesengenic Differentiation
The hPDLSCs were induced to osteogenic and adipogenic differentiation commitment, as previously reported by Cianci et al. [19]. Briefly, at the end of differentiation process, the cells were stained with Alizarin Red S (Sigma-Aldrich, Milan, Italy) and Adipo Oil Red (Lonza, Basel, Switzerland) solution to evaluate the osteogenic and adipogenic differentiation, respectively, and observed by means of light microscopy, Leica DMIL (Leica Microsystem, Milan, Italy) [20].
2.6. Statistical Analysis
Data were analyzed using GraphPad Prism 6.0 (GraphPad Software, La Jolla, CA, USA). The statistical analyses were performed with the ANOVA test. The p-value threshold used to validate the analysis is 0.05.
2.7. RNA Isolation and Real Time-PCR Analysis
To assess osteogenic and adipogenic differentiation ability of PDLSCs, the total RNA was isolated using the Total RNA Purification Kit (NorgenBiotek Corp., Ontario, CA, USA) according to the manufacturer’s instructions. The RNA was extracted from a pool of 5 × 10⁵ hPDLSCs. M-MLV Reverse Transcriptase reagents (Applied Biosystems) were used to generate cDNA. Real-Time PCR was carried out with the Mastercycler ep realplex real-time PCR system (Eppendorf, Hamburg, Germany). hPDLSCs expression of Runt-related transcription factor-2 (RUNX-2) and AlkalinPhospatase (ALP) was evaluated after 28 days in osteogenic differentiated culture, the expression of Fatty Acid Binding Protein 4 (FABP4) and Peroxisome Proliferator-Activated Receptor γ (PPARγ) were analysed after 28 days of adipogenic differentiation culture. Commercially available TaqMan Gene Expression Assays (RUNX-2 Hs00231692_m1; ALP Hs01029144_m1; FABP4 Hs01086177_m1; PPARγ Hs01115513_m1) and the TaqMan Universal PCR Master Mix (Applied Biosystems, Foster City, CA, USA) were used according to standard protocols. Beta-2 microglobulin (B2M Hs99999907_m1) (Applied Biosystems, Foster City, CA, USA) was used for template normalization [21]. RT-PCR was performed in three independent experiments; duplicate determinations were carried out for each sample.
2.8. Scanning Electron Microscopy
The hPDLSCs at second passage were fixed for 4 h at 4 °C in 4% glutaraldehyde in 0.05 M phosphate buffer (pH 7.4), and subsequently dehydrated in increasing ethanol concentrations and then critical-point dried. Samples were then mounted onto aluminum stubs and gold-coated in an Emitech K550 (Emitech Ltd., Ashford, UK) sputter-coater before imaging by means Zeiss SEM EVO 50 (Zeiss, Jena, Germany) [22].
2.9. Immunofluorescence
In order to evaluate the positivity to the neuronal marker, the hPDLSCs were incubated with primary monoclonal antibodies: anti human p75 (1:200, rabbit) (Santa Cruz Biotechnology Inc., Santa Cruz, CA, USA) and nestin (1:200, rabbit) (Santa Cruz Biotechnology Inc., Santa Cruz, CA, USA). As secondary antibody we used Alexa Fluor 568 red fluorescence conjugated (1:200) (Molecular ProbesTM, InvitrogenTM, Eugene, OR, USA). Alexa Fluor 488 phalloidin green fluorescence conjugate (1:200, Molecular ProbesTM, InvitrogenTM, Eugene, OR, USA) was used to stain cytoskeleton actin and TO-PRO-3 (1:200, Molecular ProbesTM, InvitrogenTM, Eugene, OR, USA) to stain nuclei. Stained cells were observed using confocal laser scanning microscopy (LSM800 META, Zeiss, Oberkochen, Germany) [23].
2.10. RNA-Seq Preparation
The Reliaprep RNA cell Miniprep System (Promega, USA) was used to extract the total RNA from all of the samples. Each of them was treated with 0.1% of DMSO. The TruSeq RNA Access library kit protocol (Illumina, San Diego, CA, USA) was followed. From the total RNA, 40 ng were extracted and fragmented through a thermal cycler for 8 min at 94 °C. The achieved fragments, >200 nt, were used to synthesize a first strand of cDNA using the activity of the reverse transcriptase SuperScript II (Invitrogen, Carlsbad, CA, USA). The Second Strand Marking Master Mix was used to obtain the double strand of the cDNA. The incubation ran for 1 h at 16 °C. The reaction mix was eliminated by AMPure XP beads purification. Fragment adhenilation was performed at 3′ ends in order to ligate the complementary adapters, thereby avoiding huge chimera development. The identification of the samples and their preparation for flow cell hybridization was performed by the ligation of Adapter-Indexes to the fragment of cDNA. A first step of clean-up was run before the PCR amplification (denaturation: 30 s at 98 °C; 15 cycles: 10 s at 98 °C, 30 s at 60 °C, 30 s at 72 °C; extension: 5 min at 72 °C). The regions of interest are selected and enriched via a first reaction of hybridization (10 min at 95 °C, un minute of incubation per 18 cycles, 90 min at 58 °C). The procedure allowed us to mix the exome capture probes with the cDNA library. Starting from 200 ng of each library, the result is a pool of libraries which were differently indexed. The purification of the pool was obtained by streptavidin conjugated magnetic beads. Then, subsequent hybridization and purification were performed. A second PCR amplification was done following the same protocol as that of the first one, except for the cycles (just 10 instead of 15). The process ended with a clean-up. The Bioanalyzer instrument (Agilent High Sensitivity DNA Kit, Richardson, TX, USA) was used to validate the quality of the library. The validation of the quantity was made using Real-Time PCR (KAPA Library Quantification Kit-Illumina/ABI Prism@) (Kaba Biosystem, Inc. Wilmington, MA, USA). A denaturation step through 2N NaOH was performed, and then it was diluted until it reached a concentration of 12 pM. The MiSeq Instrument (Illumina, San Diego, CA, USA) was used to sequencing (by single read setting) using MiSeq Reagent Kit v3 for 150 cycles.
2.11. RNA-seq Data Processing and Gene Analysis
The MiSeq instrument provides multiplexed samples in “bcl” format. The CASAVA software (version 1.8) was used to convert these data in demultiplexed “Fastq” files, one for each sample. Then, the quality of the reads was checked using the fastQC software. The reads were trimmed of the adapters by Trimmomatic [24]. Finally, the reads are aligned to the reference genome “homo sapiens UCSC hg19” using STAR RNA-seq aligner [25]. All the transcripts which were common among the samples were then collected together using Cufflinks [26]. The set of genes that transcribed the found transcripts were used for the study. The whole gene list was inserted as file in the “Analysis” tools section of the Reactome database. From this list, a subset of 64 genes included in the “Neuronal System” pathways were studied. A deeper inspection of each of these genes showed that SAT1 was identified by a UNIPROT [27] entry that is related to SLC38A1 gene, and P3H3 is identified by a UNIPROT linked to GNB3. Finally, SAT1, P3H3 and HSPA8 genes are excluded from the analysis. By a literature inspection, were searched for genes encoded for proteins associated with ion channel receptors and present in this list of genes. GABAergic, Glutamatergic and Cholinergic pathway associations were found. The genes in the GABAergic subpathways are expressed in GABAergic “GABA receptor activation” and “GABA synthesis, release, reuptake and degradation”, while for Glutamatergic ones, “Glutamate binding, activation of AMPA receptors and synaptic plasticity”, “Activation of kainate receptors upon glutamate binding”, “Glutamate Neurotransmitter Release Cycle”, “Astrocytic Glutamate-Glutamine Uptake and Metabolism”, “Activation of NMDA receptors and postsynpatic events”, as well for Cholinergic “Acetylcholine Neurotransmitter Release Cycle” and “Activation of Nicotinic Acetylcholine Receptors”.
2.12. Western Blot Analysis
The proteins were collected from hPDLSCs as previously described [9]. In parallel, the proteins from DPK-SKDF-H were also collected and used as a control. Protein concentrations were measured using Bradford assay (Bio-Rad Laboratories, Inc., Hercules, CA, USA). Twenty-five µg of proteins were heated for 5 min at 95 °C and resolved by SDS-polyacrylamide gel electrophoresis (SDS-PAGE), and then transferred onto a PVDF membrane (Amersham Hybond, GE Healthcare Life Sciences, Milan, Italy). Membranes were blocked with 5% skim milk in Phosphate Buffered Saline (PBS) for 1 h at room temperature. Afterwards, the membranes were incubated overnight at 4 °C with the following primary antibodies: GABAB R1 (1:500; Santa Cruz Biotechnology, Dallas, TX, USA), GABAB R2 (1:500; Santa Cruz Biotechnology, Dallas, TX, USA) and AChRα1 (1:500; Santa Cruz Biotechnology, Dallas, TX, USA). After washing the membranes with PBS 1X, they were incubated with horse radish peroxidase (HRP)-conjugated anti-mouse or anti-rat IgG secondary antibodies (1:2000; Santa Cruz Biotechnology, Dallas, TX, USA) for 1 h at room temperature. The membranes were also incubated with an antibody for glyceraldehyde 3-phosphate dehydrogenase (GAPDH) HRP Conjugated (1:1000, Cell Signaling Technology, Danvers, USA). The bands were analyzed through an enhanced chemiluminescence system (Luminata Western HRP Substrates; Millipore, Burlington, MA, USA), and the protein bands were acquired through ChemiDoc™ MP System (Bio-Rad Laboratories Inc., Hercules, CA, USA).
3. Results
3.1. Cytofluorimetric Analysis
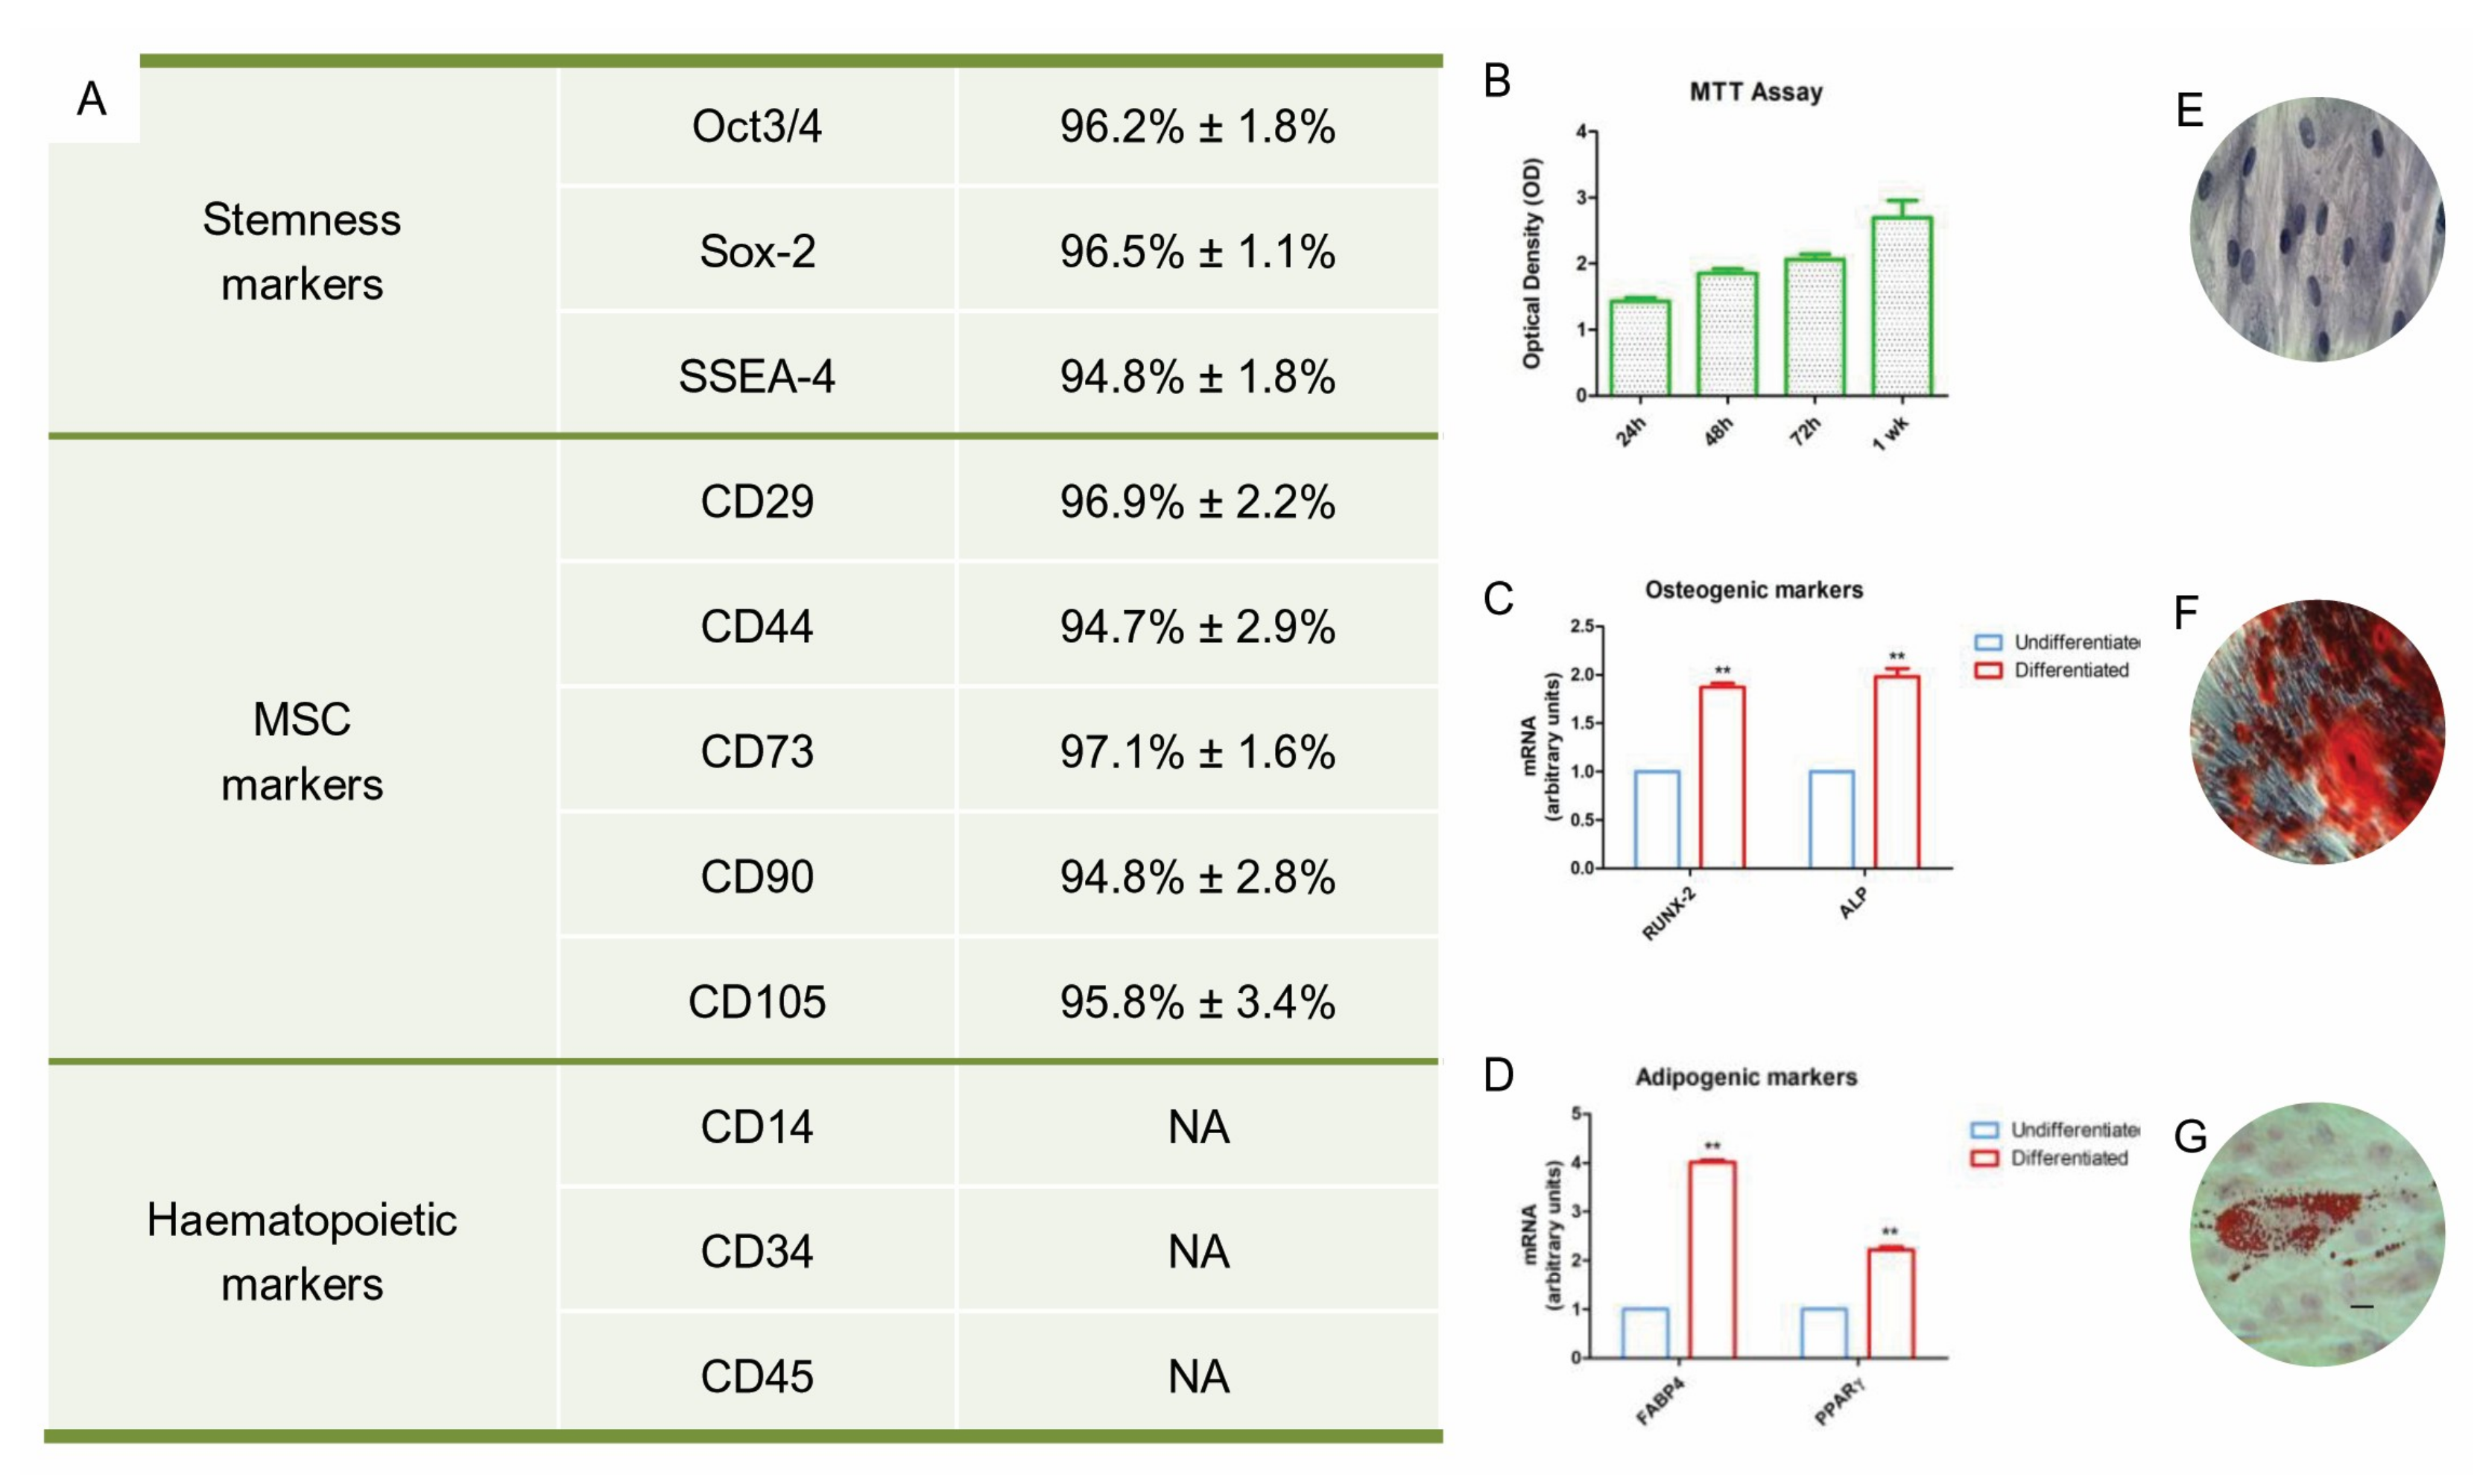
The phenotype of the hPDLSCs was confirmed by flow cytometric analysis. The cells showed a positivity for OCT3/4, SSEA4, SOX2, CD29, CD44, CD73, CD90 and CD105. They were negative for haematopoietic markers such as CD14, CD34 and CD45 (Figure 1A).
3.2. MTT Assay Analysis
In order to access to the proliferation rate of the hPDLSCs, an MTT assay analysis was performed. The proliferative rate was detected at 24 h, 48 h, 72 h and after 1 week of culture, as shown in the Figure 1B. The proliferation rate grew according to a logarithmic pathway.
3.3. Mesengenic Differentiation and Genetic Evaluation
To evaluate osteogenic differentiation, hPDLSCs were stained with an Alizarin Red S solution. Calcium precipitates were detected in hPDLSCs culture after 28 days of incubation (Figure 1F). The adipogenic differentiation was evaluated using lineage Oil-red O solution staining; cells showed lipid droplets at the cytoplasmic level (Figure 1G). To confirm the osteogenic and adipogenic commitment, RT-PCR was performed. RUNX2, ALP, PPARγ and FAPB4 markers were expressed in hPDLSCs maintained under differentiation (Figure 1C,D). Both mesengenic differentiations showed statistically significant differences between undifferentiated and differentiated cells.
3.4. Scanning Electron Microscopy Analysis and Immunofluorescence
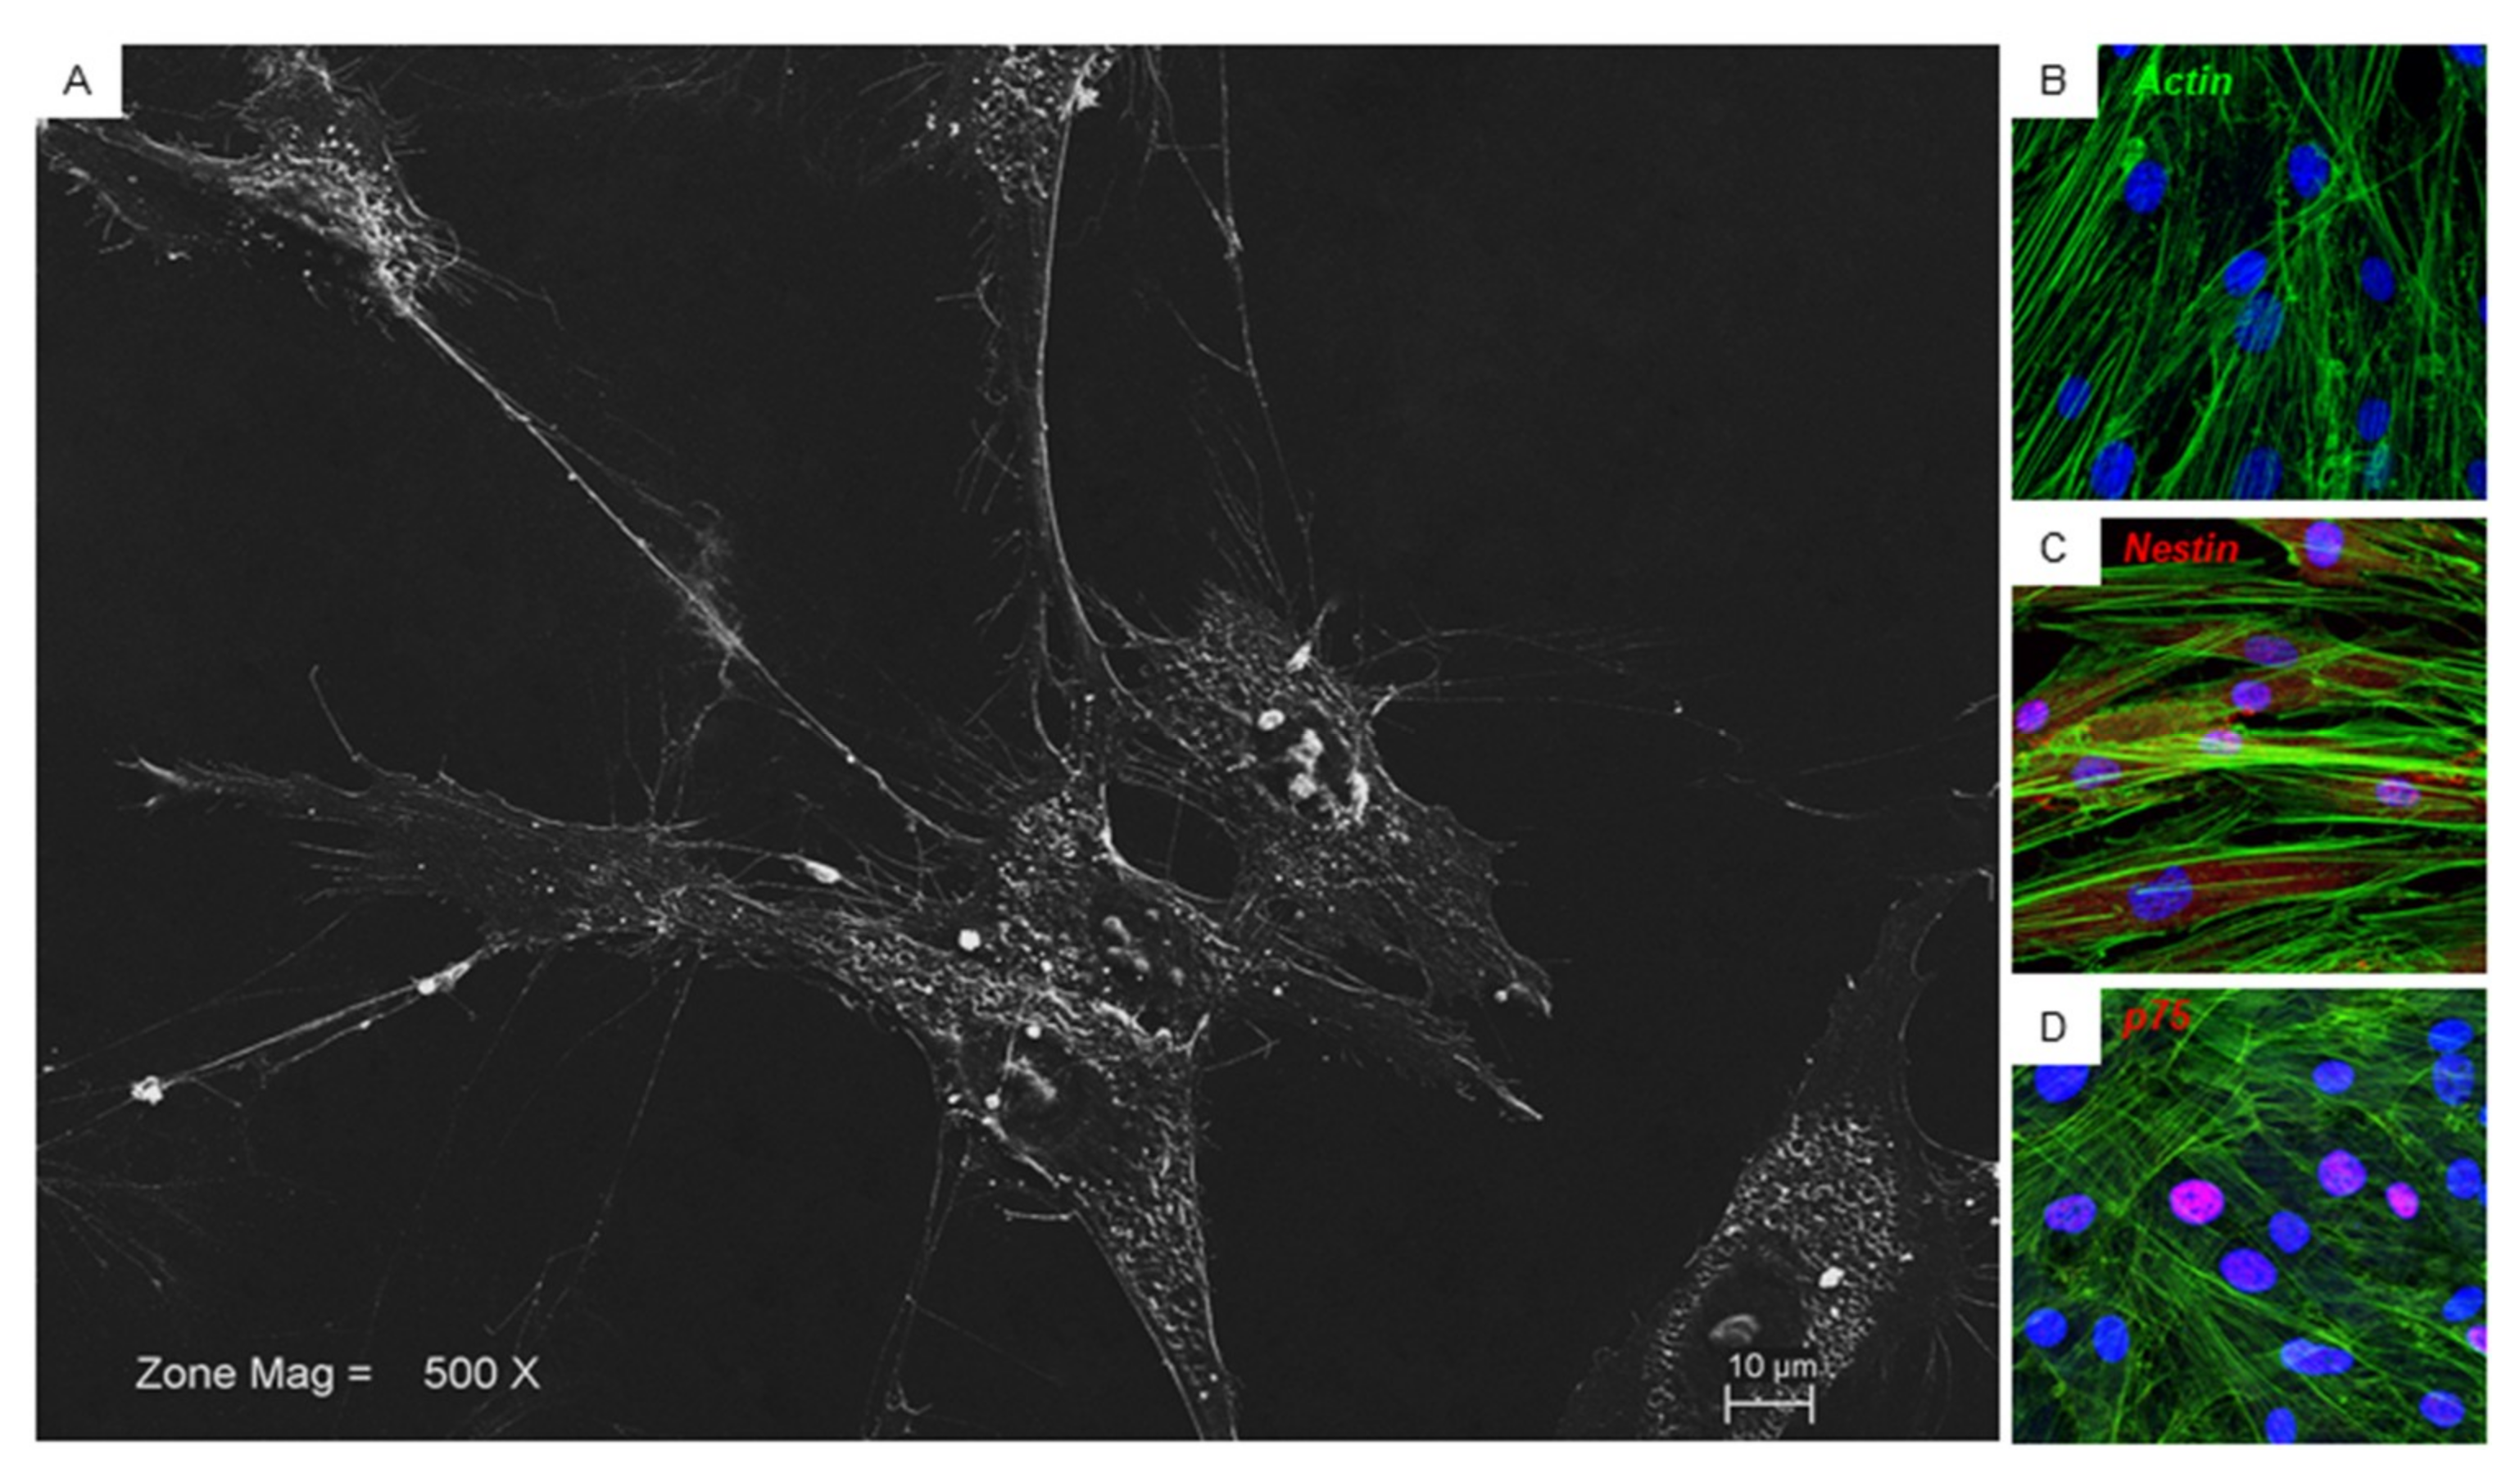
Glass adherent cells showed at SEM analysis a fibroblast like morphological shape with ovoidal nuclei and two or more nucleoli are visible. Long cytoplasmic processes make contact with neighboring cells (Figure 2A). Confocal microscopy observation showed the same morphological aspects (Figure 2B). Immunofluorescence of the hPDLSCs was performed in order to observe the expression of specific neurogenic markers. It showed a positivity for nestin at cytoplasmic level and for p75 localized at the nuclear level (Figure 2C,D).
3.5. Reactome and Pathway Analysis
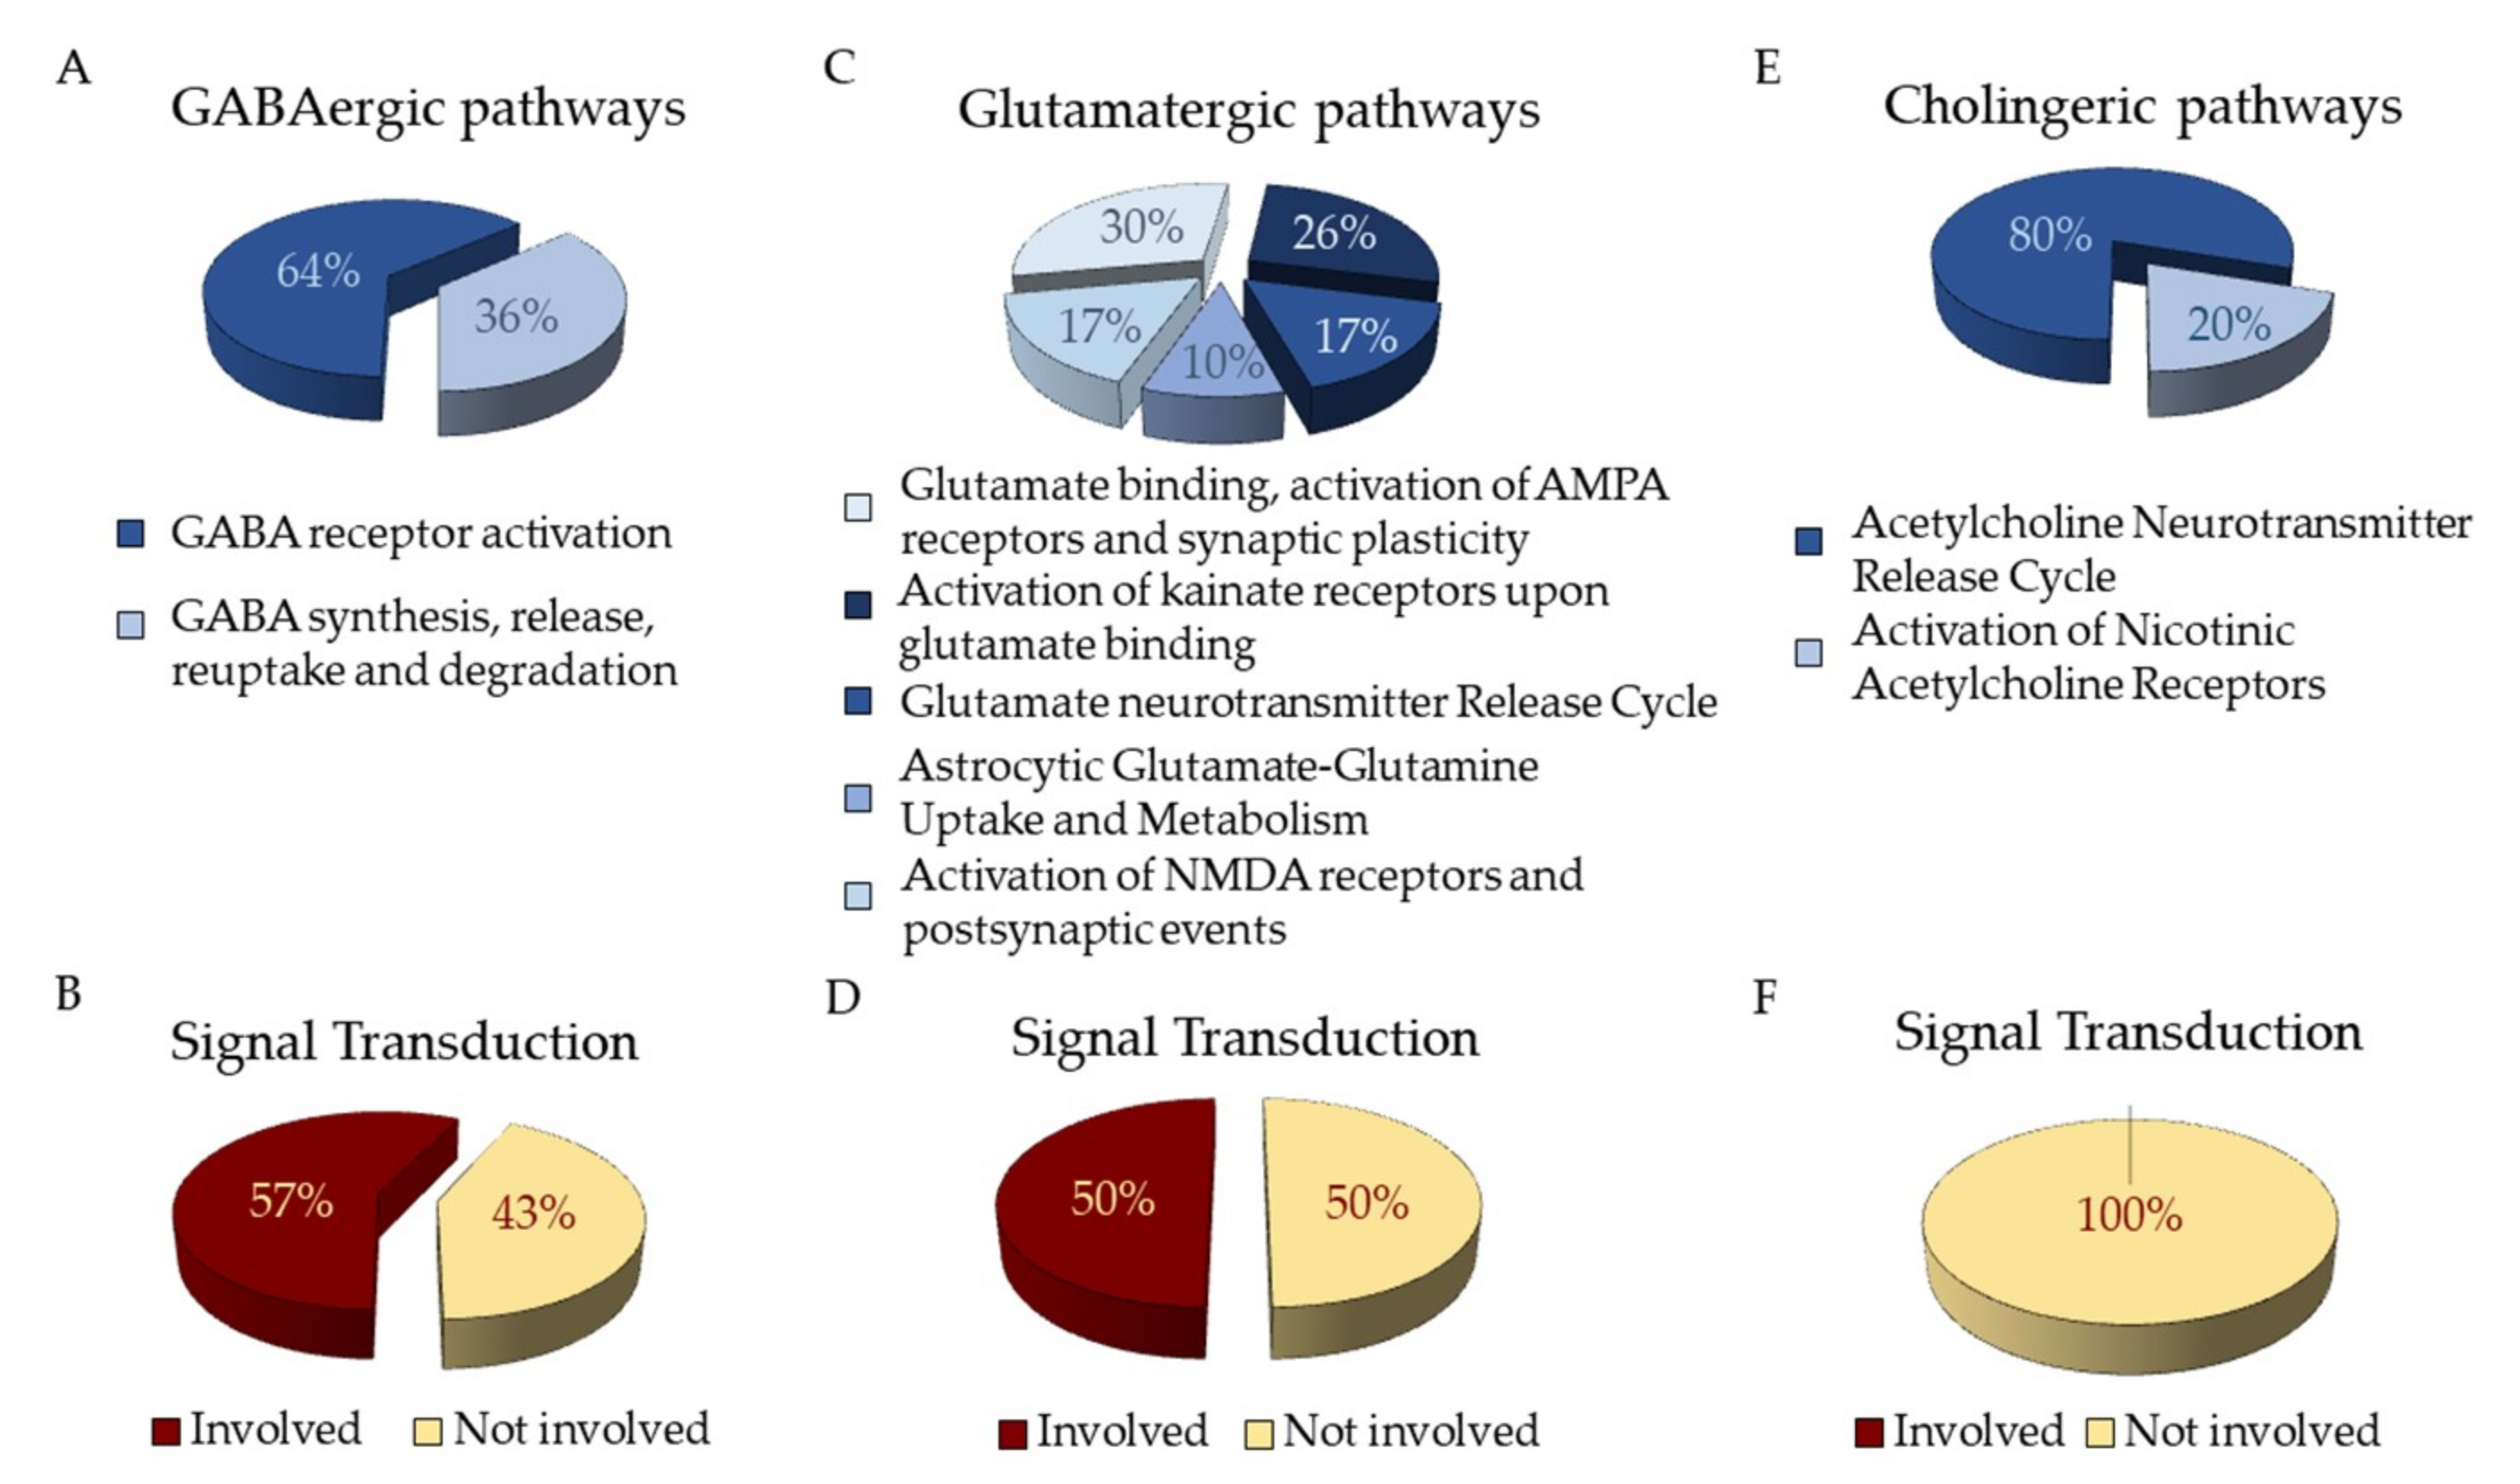
The NGS analysis returns files in Fastq format containing the sequenced reads of our cDNA pool. The genes obtained after the NGS analysis were studied by the “Analysis” tool in the Reactome database that recognizes 2905 genes. Sixty-four of these genes are part of “Neuronal System” pathway. The analysis of hPDLSCs transcriptomic profile reveals genes related to ion channel receptors for GABAB (GABBR1 and GABBR2), acetylcholine (CHRNA1) and glutamate (GRINA) (Table 1). Genes are distributed as shown in Fig 3. The pathways related to GABA neurotransmitters are “GABA receptor activation” and “GABA synthesis, release, reuptake and degradation” (Figure 3A). Among those, 3 genes encoded for Adenylate Cyclase proteins act as Signal Transductors in the “Inhibition of adenylate cyclase pathways” that is directly linked to “Neuronal system”. (Figure 3B). The pathways related to glutamate are collected in “Glutamate binding, activation of AMPA receptors and synaptic plasticity”, “Activation of kainate receptors upon glutamate binding”, “Glutamate Neurotransmitter Release Cycle”, “Astrocytic Glutamate-Glutamine Uptake and Metabolism” and “Activation of NMDA receptors and postsynpatic events” (Figure 3C). Among those genes, 17 are involved in “Signal Transduction” (Figure 3D). The pathways related to acethylcoline are inside “Acetylcholine Neurotransmitter Release Cycle” and “Activation of Nicotinic Acetylcholine Receptors” (Figure 3E). None of the genes in these pathways is involved also in “Signal Transduction” (Figure 3F).
3.6. Western Blot Results
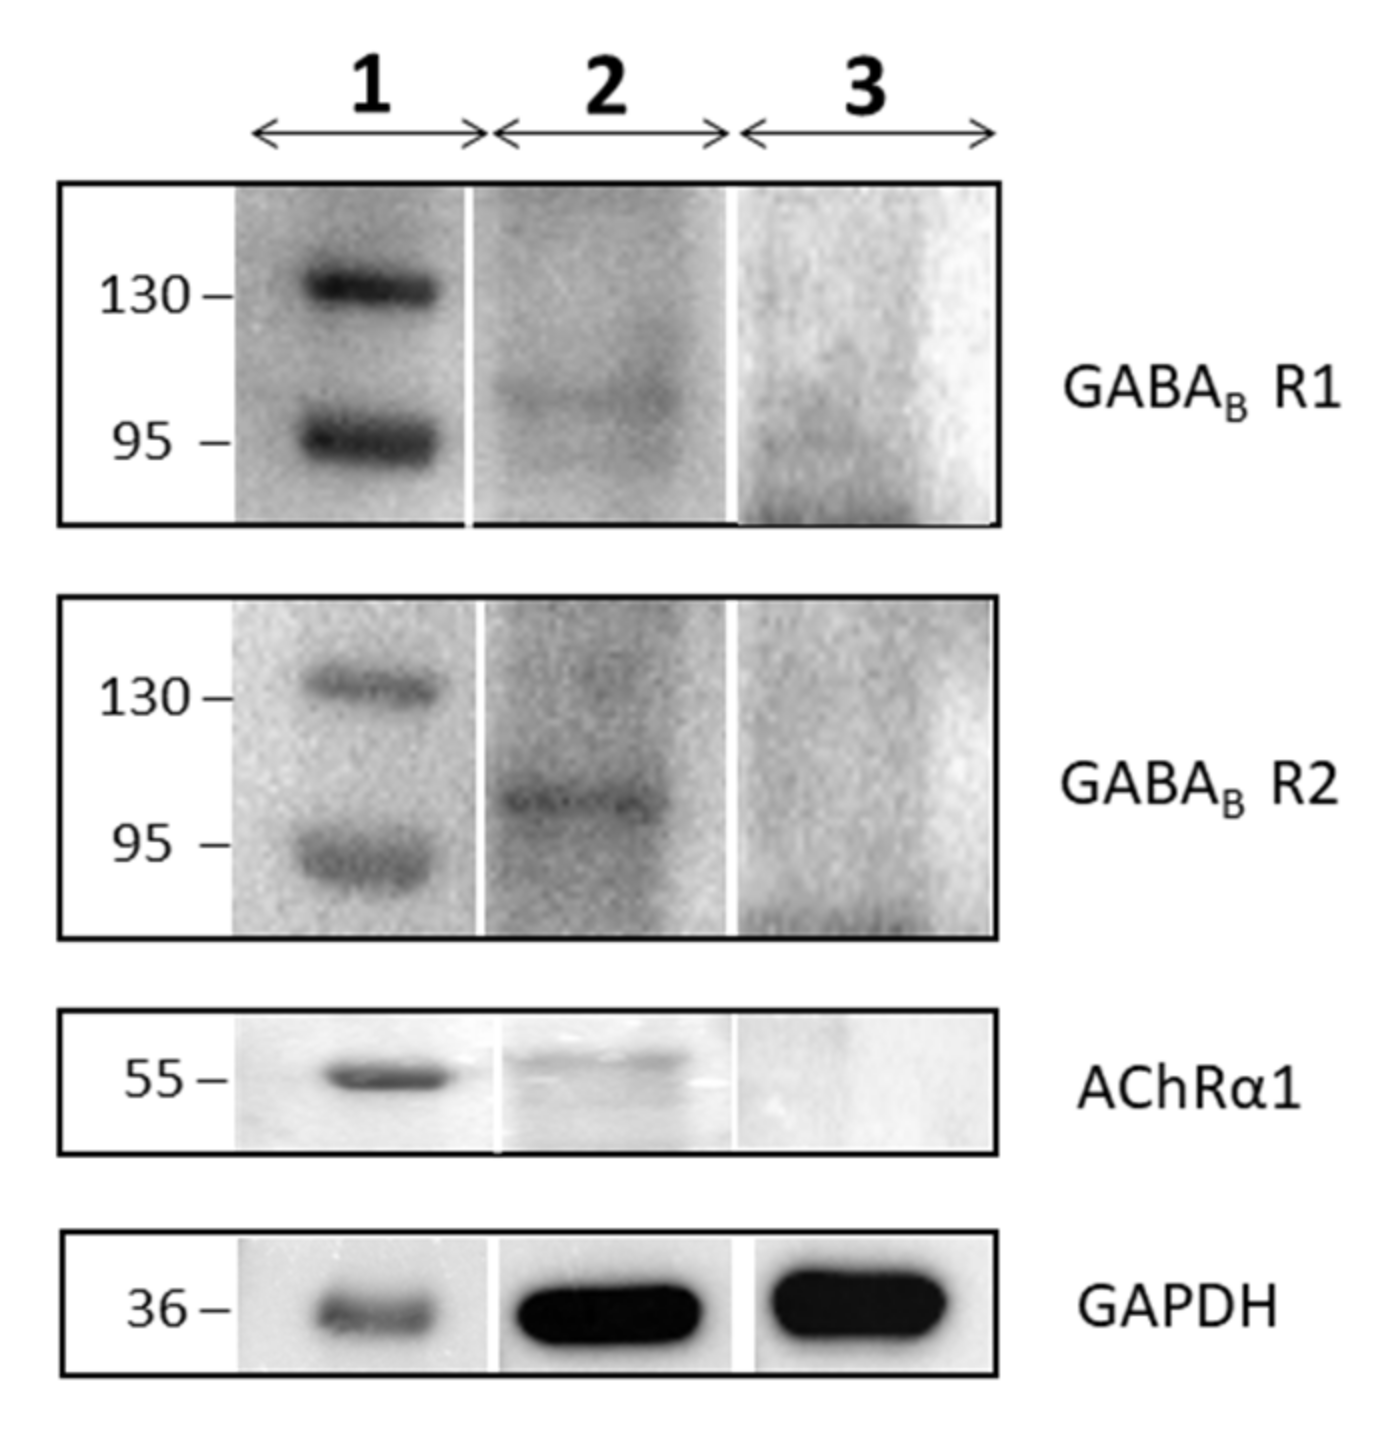
Western Blot analysis was used to confirm the expression of the GABAB and Acetylcholine receptors. As shown in Figure 4, the proteic extract of hPDLSCs expresses GABABR1, GABABR2 and AChRα1. In contrast, the proteic extract of DPK-SKDF-H does not express these receptors.
4. Discussion
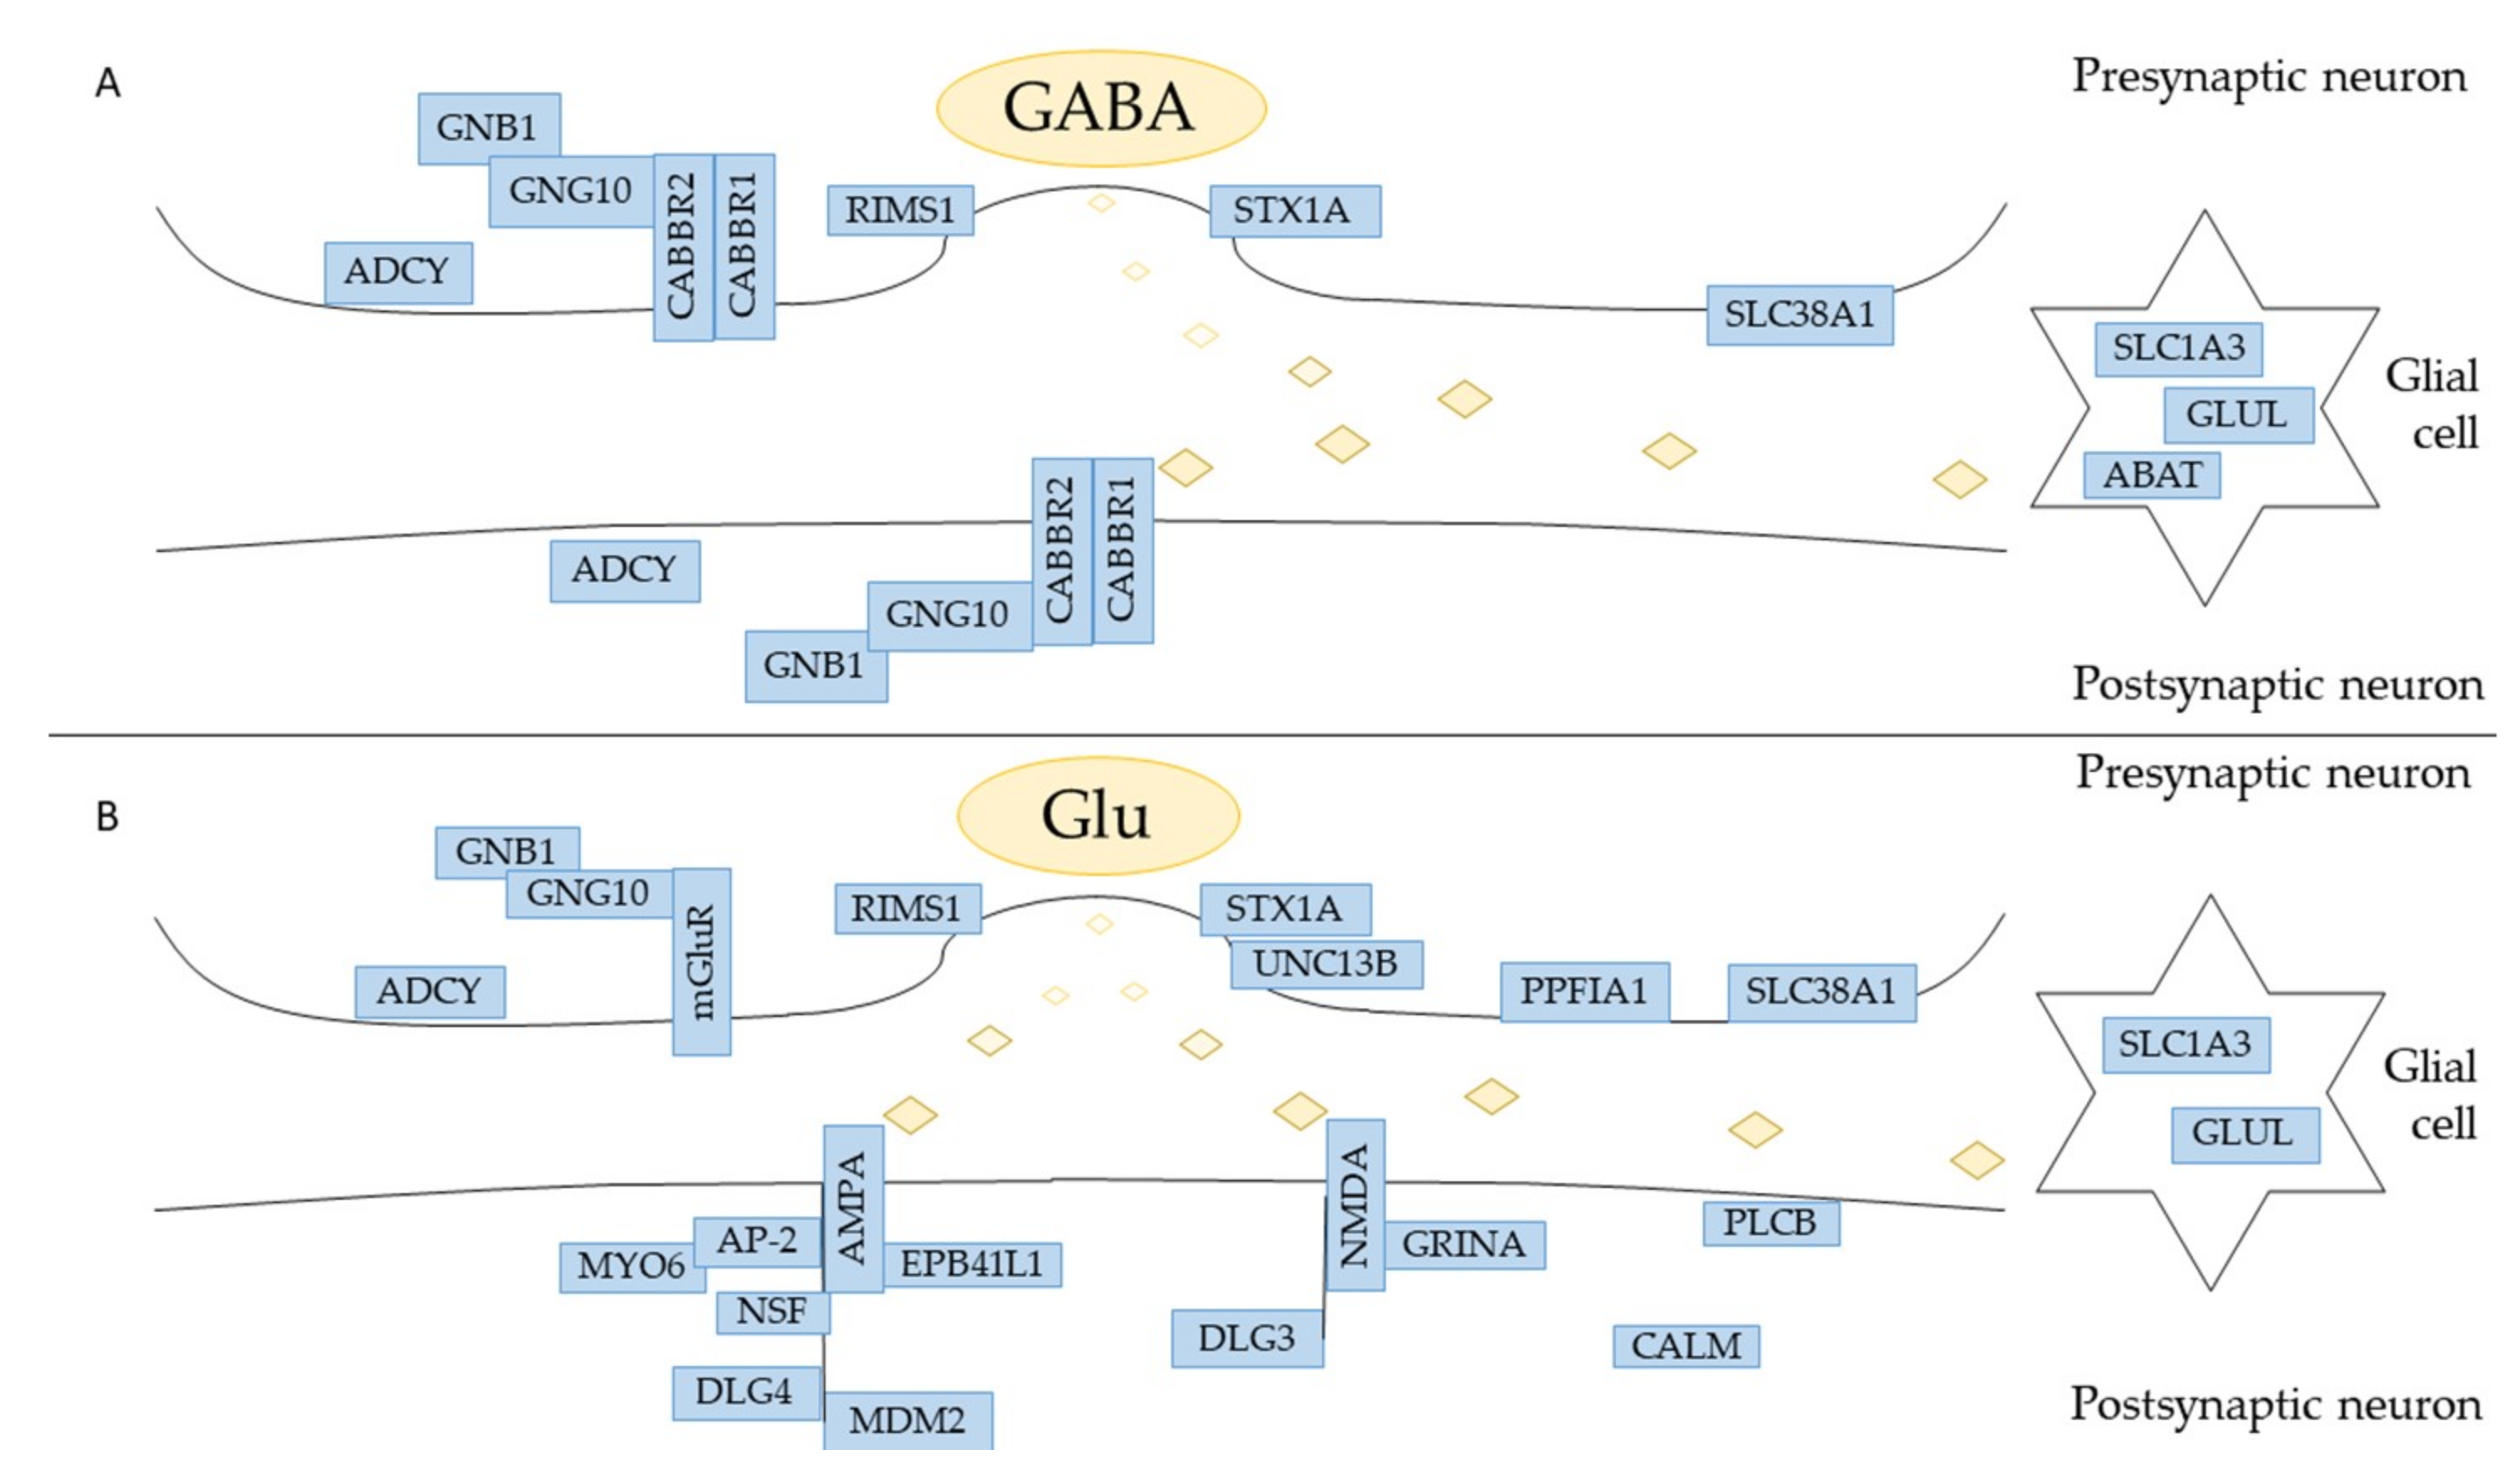
The etiopathogenesis of the neurodegenerative diseases is linked to the death of cells in nervous tissue. Their incidence is growing and stem cells are recently receiving attention from researchers because they can potentially replace damaged nervous cells. In particular, the hPDLSCs are becoming important because there is no ethical concern associated with their usage, they are easy to retrieve, derive from neural crest origin, and they can differentiate into mesengenic and neurogenic lineages. [28,29,30]. Indeed, the hPDLSCs cultured in basal medium spontaneously express neural markers as Nestin and GAP-43. Nestin is a protein belonging to class VI of intermediate filaments, expressed in stem/progenitor cells in the mammalian CNS during development [31,32]. In order to better understand the multipotent state of hPDLSCs, their physiological expression of ion channels receptors was investigated. The transcriptomic profile of the hPDLSCs was retrieved by three control individuals taking advantage of NGS technology. The RNA-seq analysis reveals 4378 genes express. In order to investigate all the genes involved in the nervous system, a database containing biological pathways (Reactome) was used. The “Neuronal System” pathway counts 64 genes. The hPDLSCs physiologically express the genes GABBR1 and GABBR2, GRINA, CHRNA1 related respectively to GABAB, NMDA and nACh receptors (Figure 5). For this reason, we studied all of the subpathways in which they are involved. A Western Blot analysis of hPDLSCs confirmed the expression of the GABABR1, GABABR2 and AChRα1 proteins. In order to verify whether the expression of GABBR1 and GABBR2 is specific to the hPDLSCs, the lineage of fibroblasts DPK-SKDF-H was used as control. Our results showed that DPK-SKDF-H does not express proteins for these receptors (Figure 4). GABBR1 and GABBR2 are indirectly involved with ion channel membrane proteins through the guanine nucleotide-binding proteins (G proteins). In hPDLSCs, GNG10 and GNB1 genes are expressed, that encode for two subunits of G proteins. In particular, GNG10 encodes for a protein that directly interacts with GABBR2 subunit [33]. The G proteins complex promotes the flow of potassium and calcium ions and acts as an inhibitor for Adenylate Cyclase proteins. The hPDLSCs express the ADCY3, ADCY4 and ADCY9 genes, that encode respectively for Adenylate Cyclase type 3, type 4 and type 9 that catalyze ATP in cyclic adenosine monophospate (cAMP) [34]. Moreover, the hPDLSCs express also ABAT and GLUL genes that encode for proteins involved in the catabolism of GABA. ABAT encodes for the GABA-transaminase enzyme that converts GABA into succinic semialdehyde. The GLUL gene encodes for the glutamine synthetase enzyme that synthesizes L-glutamine in L-glutamate. SLC1A3 and SLC38A1 encode for carrier proteins. Specifically, the SLC1A3 gene encodes for amino acid transporter 1 protein, that is involved in the transport of the glutamate [35], whereas SLC38A1 encodes for the sodium-coupled neutral amino acid transporter 1, that has high affinity for glutamine [36]. In hPDLSCs, we also find RIMS1 and STX1A that are involved in the exocytosis of GABA. RIMS1 gene, that belongs to RAS superfamily, is involved in calcium channel modulation preparing the active zone of the synapsis for exocytosis [37]. The syntaxin-1A, protein encoded by STX1A, is characterized by a SNARE (SNAp REceptor) domain that allows the fusion to take place of the vesicles with the presynaptic membrane [38]. The hPDLSCs express also genes related to glutamate. Glutamate is a neurotransmitter that can be intercepted by metabotropic or ionotropic receptors.
Our results show that hPDLSCs only express the GRINA gene, a transmembrane NMDA subunit associated protein that binds the glutamate. Further, PLCB1 and PLCB3 are two genes that encode for Phospholipase C Beta proteins that allow to release the diacylglycerol (DAG), another secondary messenger [39]. The hPDLSCs express also several genes which encoded proteins are mainly located in the postsynaptic neurons. These proteins are involved in the maturation of the synapses and in the trafficking of the neurotransmitter. In hPDLSCs they are encoded by: AP-2 complex (AP2A1, AP2A2, AP2M1, AP2S1), MYO6, NSF, EPB41L1, CALM1, CALM2, DLG3, DLG4, MDMD2. The AP-2 complex, supported by the unconventional myosin VI (encoded by MYO6), reduces the excitatory stimuli by endocytosis of AMPA [40]. The NSF gene encodes for the Vesicle-Fusing. ATPase binds the subunit GluA2 of the AMPA receptor in order to facilitate the fusion of the membrane and the vesicle by the SNARE domain [41]. The trafficking of the receptor AMPA is also regulated by Band 4.1-like protein 1, encoded by EPB41L1 gene, that handles the long-term potential in the synapses mainly by palmitoylation and phosphorylation on GluR1 subunit [42]. Calmodulins are calcium-modulated proteins encoded by genes like CALM1 and CALM2. They are involved in the calcium homeostasis carrying it towards the endoplasmic reticulum or out of the cell [43]. DLG3 encodes for the protein Disks Large homolog 3 that stabilizes NMDA receptor [44] while DLG4 encodes for the protein Disks Large homolog 4 that interacts also with AMPA receptor [45]. The hPDLSCs express also MDM2, encoding for an E3 ubiquitin ligase, that indirectly causes the AMPA receptor endocytosis [46]. The transcriptomic profile of hPDLSCs also reveals a gene encoded for proteins located on presynaptic neurons like PPFIA1 and UNC13B. The PPFIA1 gene, encoded for Liprin-Alpha-1 protein, belongs to the protein family of liprins that is localized closed to cell focal adhesions. Liprins are involved in functional plasticity, the formation of the synapses and in axon guidance [47]. UNC13B is characterized by a SNARE domain that allows the docking to take place among the vesicle and the membrane aimed at the release of glutamate [48]. Only CHRNA1 gene, encoding for one of the five subunit of nAChr, is expressed in cholinergic synapses [49].
5. Conclusions
The RNA-seq analysis performed in this study reveals the expression of genes that encode for ionotropic and metabotropic receptors, along with proteins located in presynaptic and postsynaptic neurons. The hPDLSCs are known to differentiate in different neuronal cells. In our results, the expression of GABABR1, GABABR2 and AChRα1 suggests that a subpopulation of hPDLCSs differentiate in neurons.
Author Contributions
Conceptualization, L.C. and E.M.; methodology, F.D. and O.T.; software, L.C.; validation, O.T.; investigation, F.D.; data curation, L.C.; writing-review and editing, E.M.; supervision, P.B.; funding acquisition, P.B.
Funding
This research received no external funding.
Acknowledgments
This study was supported by current research fund 2018, Ministry of Health, Italy. We want to thank the department of Biomedical and Dental Sciences and Morphofunctional Images of University of Messina for the donation of the DPK-SKDF-H fibroblasts lineage.
Conflicts of Interest
The authors declare no conflict of interest.
References
- Mitsiadis, T.A.; Luder, H.U. Genetic basis for tooth malformations: From mice to men and back again. Clin. Genet. 2011, 80, 319–329. [Google Scholar] [CrossRef] [PubMed]
- Balic, A.; Thesleff, I. Tissue Interactions Regulating Tooth Development and Renewal. Curr. Top. Dev. Biol. 2015, 115, 157–186. [Google Scholar] [CrossRef] [PubMed]
- Selleck, M.A.; Scherson, T.Y.; Bronner-Fraser, M. Origins of neural crest cell diversity. Dev. Biol. 1993, 159, 1–11. [Google Scholar] [CrossRef]
- Duband, J.L.; Monier, F.; Delannet, M.; Newgreen, D. Epithelium-mesenchyme transition during neural crest development. Acta Anat. 1995, 154, 63–78. [Google Scholar] [CrossRef] [PubMed]
- Delfino-Machin, M.; Chipperfield, T.R.; Rodrigues, F.S.; Kelsh, R.N. The proliferating field of neural crest stem cells. Dev. Dyn. 2007, 236, 3242–3254. [Google Scholar] [CrossRef] [Green Version]
- Diomede, F.; Zini, N.; Pizzicannella, J.; Merciaro, I.; Pizzicannella, G.; D’Orazio, M.; Piattelli, A.; Trubiani, O. 5-Aza Exposure Improves Reprogramming Process Through Embryoid Body Formation in Human Gingival Stem Cells. Front. Genet. 2018, 9, 419. [Google Scholar] [CrossRef]
- Pizzicannella, J.; Diomede, F.; Merciaro, I.; Caputi, S.; Tartaro, A.; Guarnieri, S.; Trubiani, O. Endothelial committed oral stem cells as modelling in the relationship between periodontal and cardiovascular disease. J. Cell. Physiol. 2018, 233, 6734–6747. [Google Scholar] [CrossRef] [PubMed]
- Diomede, F.; Rajan, T.S.; Gatta, V.; D’Aurora, M.; Merciaro, I.; Marchisio, M.; Muttini, A.; Caputi, S.; Bramanti, P.; Mazzon, E.; et al. Stemness Maintenance Properties in Human Oral Stem Cells after Long-Term Passage. Stem Cells Int. 2017, 2017, 5651287. [Google Scholar] [CrossRef]
- Ballerini, P.; Diomede, F.; Petragnani, N.; Cicchitti, S.; Merciaro, I.; Cavalcanti, M.; Trubiani, O. Conditioned medium from relapsing-remitting multiple sclerosis patients reduces the expression and release of inflammatory cytokines induced by LPS-gingivalis in THP-1 and MO3.13 cell lines. Cytokine 2017, 96, 261–272. [Google Scholar] [CrossRef] [PubMed]
- Giacoppo, S.; Thangavelu, S.R.; Diomede, F.; Bramanti, P.; Conti, P.; Trubiani, O.; Mazzon, E. Anti-inflammatory effects of hypoxia-preconditioned human periodontal ligament cell secretome in an experimental model of multiple sclerosis: A key role of IL-37. FASEB J. 2017, 31, 5592–5608. [Google Scholar] [CrossRef]
- Rajan, T.S.; Giacoppo, S.; Trubiani, O.; Diomede, F.; Piattelli, A.; Bramanti, P.; Mazzon, E. Conditioned medium of periodontal ligament mesenchymal stem cells exert anti-inflammatory effects in lipopolysaccharide-activated mouse motoneurons. Exp. Cell Res. 2016, 349, 152–161. [Google Scholar] [CrossRef] [PubMed]
- Fabregat, A.; Jupe, S.; Matthews, L.; Sidiropoulos, K.; Gillespie, M.; Garapati, P.; Haw, R.; Jassal, B.; Korninger, F.; May, B.; et al. The Reactome Pathway Knowledgebase. Nucleic Acids Res. 2018, 46, D649–D655. [Google Scholar] [CrossRef] [PubMed]
- Dominici, M.; Le Blanc, K.; Mueller, I.; Slaper-Cortenbach, I.; Marini, F.; Krause, D.; Deans, R.; Keating, A.; Prockop, D.; Horwitz, E. Minimal criteria for defining multipotent mesenchymal stromal cells. The International Society for Cellular Therapy position statement. Cytotherapy 2006, 8, 315–317. [Google Scholar] [CrossRef] [PubMed]
- Diomede, F.; Caputi, S.; Merciaro, I.; Frisone, S.; D’Arcangelo, C.; Piattelli, A.; Trubiani, O. Pro-inflammatory cytokine release and cell growth inhibition in primary human oral cells after exposure to endodontic sealer. Int. Endod. J. 2014, 47, 864–872. [Google Scholar] [CrossRef] [PubMed]
- Seo, B.M.; Miura, M.; Gronthos, S.; Bartold, P.M.; Batouli, S.; Brahim, J.; Young, M.; Robey, P.G.; Wang, C.Y.; Shi, S. Investigation of multipotent postnatal stem cells from human periodontal ligament. Lancet 2004, 364, 149–155. [Google Scholar] [CrossRef]
- Trubiani, O.; Toniato, E.; Di Iorio, D.; Diomede, F.; Merciaro, I.; D’Arcangelo, C.; Caputi, S.; Oriana, T. Morphological analysis and interleukin release in human gingival fibroblasts seeded on different denture base acrylic resins. Int. J. Immunopathol. Pharmacol. 2012, 25, 637–643. [Google Scholar] [CrossRef] [PubMed]
- Cavalcanti, M.F.; Maria, D.A.; de Isla, N.; Leal-Junior, E.C.; Joensen, J.; Bjordal, J.M.; Lopes-Martins, R.A.; Diomede, F.; Trubiani, O.; Frigo, L. Evaluation of the Proliferative Effects Induced by Low-Level Laser Therapy in Bone Marrow Stem Cell Culture. Photomed. Laser Surg. 2015, 33, 610–616. [Google Scholar] [CrossRef] [PubMed]
- Gugliandolo, A.; Diomede, F.; Cardelli, P.; Bramanti, A.; Scionti, D.; Bramanti, P.; Trubiani, O.; Mazzon, E. Transcriptomic analysis of gingival mesenchymal stem cells cultured on 3D bioprinted scaffold: A promising strategy for neuroregeneration. J. Biomed. Mater. Res. Part A 2018, 106, 126–137. [Google Scholar] [CrossRef] [PubMed]
- Cianci, E.; Recchiuti, A.; Trubiani, O.; Diomede, F.; Marchisio, M.; Miscia, S.; Colas, R.A.; Dalli, J.; Serhan, C.N.; Romano, M. Human Periodontal Stem Cells Release Specialized Proresolving Mediators and Carry Immunomodulatory and Prohealing Properties Regulated by Lipoxins. Stem Cells Transl. Med. 2016, 5, 20–32. [Google Scholar] [CrossRef] [PubMed]
- Diomede, F.; Gugliandolo, A.; Scionti, D.; Merciaro, I.; Cavalcanti, M.F.X.B.; Mazzon, E.; Trubiani, O. Biotherapeutic Effect of Gingival Stem Cells Conditioned Medium in Bone Tissue Restoration. Int. J. Mol. Sci. 2018, 19, 329. [Google Scholar] [CrossRef] [PubMed]
- Pizzicannella, J.; Cavalcanti, M.; Trubiani, O.; Diomede, F. MicroRNA 210 Mediates VEGF Upregulation in Human Periodontal Ligament Stem Cells Cultured on 3DHydroxyapatite Ceramic Scaffold. Int. J. Mol. Sci. 2018, 19, 916. [Google Scholar] [CrossRef] [PubMed]
- Diomede, F.; Merciaro, I.; Martinotti, S.; Cavalcanti, M.F.; Caputi, S.; Mazzon, E.; Trubiani, O. miR-2861 is involved in osteogenic commitment of human periodontal ligament stem cells grown onto 3D scaffold. J. Biol. Regul. Homeost. Agents 2016, 30, 1009–1018. [Google Scholar] [PubMed]
- Diomede, F.; Zingariello, M.; Cavalcanti, M.; Merciaro, I.; Pizzicannella, J.; De Isla, N.; Caputi, S.; Ballerini, P.; Trubiani, O. MyD88/ERK/NFkB pathways and pro-inflammatory cytokines release in periodontal ligament stem cells stimulated by Porphyromonas gingivalis. Eur. J. Histochem. EJH 2017, 61, 2791. [Google Scholar] [CrossRef] [PubMed]
- Bolger, A.M.; Lohse, M.; Usadel, B. Trimmomatic: A flexible trimmer for Illumina sequence data. Bioinformatics 2014, 30, 2114–2120. [Google Scholar] [CrossRef] [PubMed]
- Dobin, A.; Davis, C.A.; Schlesinger, F.; Drenkow, J.; Zaleski, C.; Jha, S.; Batut, P.; Chaisson, M.; Gingeras, T.R. STAR: Ultrafast universal RNA-seq aligner. Bioinformatics 2013, 29, 15–21. [Google Scholar] [CrossRef] [PubMed]
- Trapnell, C.; Williams, B.A.; Pertea, G.; Mortazavi, A.; Kwan, G.; van Baren, M.J.; Salzberg, S.L.; Wold, B.J.; Pachter, L. Transcript assembly and quantification by RNA-Seq reveals unannotated transcripts and isoform switching during cell differentiation. Nat. Biotechnol. 2010, 28, 511–515. [Google Scholar] [CrossRef] [PubMed] [Green Version]
- UniProt Consortium T. UniProt: The universal protein knowledgebase. Nucleic Acids Res. 2018, 46, 2699. [Google Scholar] [CrossRef] [PubMed]
- Bueno, C.; Ramirez, C.; Rodriguez-Lozano, F.J.; Tabares-Seisdedos, R.; Rodenas, M.; Moraleda, J.M.; Jones, J.R.; Martinez, S. Human adult periodontal ligament-derived cells integrate and differentiate after implantation into the adult mammalian brain. Cell Transplant. 2013, 22, 2017–2028. [Google Scholar] [CrossRef] [PubMed]
- Widera, D.; Grimm, W.D.; Moebius, J.M.; Mikenberg, I.; Piechaczek, C.; Gassmann, G.; Wolff, N.A.; Thevenod, F.; Kaltschmidt, C.; Kaltschmidt, B. Highly efficient neural differentiation of human somatic stem cells, isolated by minimally invasive periodontal surgery. Stem Cells Dev. 2007, 16, 447–460. [Google Scholar] [CrossRef] [PubMed]
- Osathanon, T.; Manokawinchoke, J.; Nowwarote, N.; Aguilar, P.; Palaga, T.; Pavasant, P. Notch Signaling Is Involved in Neurogenic Commitment of Human Periodontal Ligament-Derived Mesenchymal Stem Cells. Stem Cells Dev. 2013, 22, 1220–1231. [Google Scholar] [CrossRef] [PubMed] [Green Version]
- Dell’Albani, P. Stem Cell Markers in Gliomas. Neurochem. Res. 2008, 33, 2407–2415. [Google Scholar] [CrossRef] [PubMed]
- Trubiani, O.; Guarnieri, S.; Diomede, F.; Mariggio, M.A.; Merciaro, I.; Morabito, C.; Cavalcanti, M.F.X.B.; Cocco, L.; Ramazzotti, G. Nuclear translocation of PKC alpha isoenzyme is involved in neurogenic commitment of human neural crest-derived periodontal ligament stem cells. Cell. Signal. 2016, 28, 1631–1641. [Google Scholar] [CrossRef] [PubMed]
- Hurowitz, E.H.; Melnyk, J.M.; Chen, Y.J.; Kouros-Mehr, H.; Simon, M.I.; Shizuya, H. Genomic characterization of the human heterotrimeric G protein alpha, beta, and gamma subunit genes. DNA Res. Int. J. Rapid Publ. Rep. Genes Genomes 2000, 7, 111–120. [Google Scholar]
- Frezza, E.; Martin, J.; Lavery, R. A molecular dynamics study of adenylyl cyclase: The impact of ATP and G-protein binding. PLoS ONE 2018, 13, e0196207. [Google Scholar] [CrossRef] [PubMed]
- Canul-Tec, J.C.; Assal, R.; Cirri, E.; Legrand, P.; Brier, S.; Chamot-Rooke, J.; Reyes, N. Structure and allosteric inhibition of excitatory amino acid transporter 1. Nature 2017, 544, 446–451. [Google Scholar] [CrossRef] [PubMed] [Green Version]
- Solbu, T.T.; Bjorkmo, M.; Berghuis, P.; Harkany, T.; Chaudhry, F.A. SAT1, A Glutamine Transporter, is Preferentially Expressed in GABAergic Neurons. Front. Neuroanat. 2010, 4, 1. [Google Scholar] [CrossRef] [PubMed]
- Kaeser, P.S.; Deng, L.; Fan, M.; Sudhof, T.C. RIM genes differentially contribute to organizing presynaptic release sites. Proc. Natl. Acad. Sci. USA 2012, 109, 11830–11835. [Google Scholar] [CrossRef] [PubMed] [Green Version]
- Bennett, M.K.; Garcia-Arraras, J.E.; Elferink, L.A.; Peterson, K.; Fleming, A.M.; Hazuka, C.D.; Scheller, R.H. The syntaxin family of vesicular transport receptors. Cell 1993, 74, 863–873. [Google Scholar] [CrossRef]
- Lyon, A.M.; Tesmer, J.J. Structural insights into phospholipase C-beta function. Mol. Pharmacol. 2013, 84, 488–500. [Google Scholar] [CrossRef] [PubMed]
- Osterweil, E.; Wells, D.G.; Mooseker, M.S. A role for myosin VI in postsynaptic structure and glutamate receptor endocytosis. J. Cell Biol. 2005, 168, 329–338. [Google Scholar] [CrossRef] [PubMed] [Green Version]
- Hanley, J.G. NSF binds calcium to regulate its interaction with AMPA receptor subunit GluR2. J. Neurochem. 2007, 101, 1644–1650. [Google Scholar] [CrossRef] [PubMed] [Green Version]
- Lin, D.T.; Makino, Y.; Sharma, K.; Hayashi, T.; Neve, R.; Takamiya, K.; Huganir, R.L. Regulation of AMPA receptor extrasynaptic insertion by 4.1N, phosphorylation and palmitoylation. Nat. Neurosci. 2009, 12, 879–887. [Google Scholar] [CrossRef] [PubMed] [Green Version]
- Chin, D.; Means, A.R. Calmodulin: A prototypical calcium sensor. Trends Cell Biol. 2000, 10, 322–328. [Google Scholar] [CrossRef]
- Chen, B.S.; Gray, J.A.; Sanz-Clemente, A.; Wei, Z.; Thomas, E.V.; Nicoll, R.A.; Roche, K.W. SAP102 mediates synaptic clearance of NMDA receptors. Cell Rep. 2012, 2, 1120–1128. [Google Scholar] [CrossRef] [PubMed]
- Xu, W. PSD-95-like membrane associated guanylate kinases (PSD-MAGUKs) and synaptic plasticity. Curr. Opin. Neurobiol. 2011, 21, 306–312. [Google Scholar] [CrossRef] [PubMed] [Green Version]
- Colledge, M.; Snyder, E.M.; Crozier, R.A.; Soderling, J.A.; Jin, Y.; Langeberg, L.K.; Lu, H.; Bear, M.F.; Scott, J.D. Ubiquitination regulates PSD-95 degradation and AMPA receptor surface expression. Neuron 2003, 40, 595–607. [Google Scholar] [CrossRef]
- Astro, V.; Tonoli, D.; Chiaretti, S.; Badanai, S.; Sala, K.; Zerial, M.; de Curtis, I. Liprin-alpha1 and ERC1 control cell edge dynamics by promoting focal adhesion turnover. Sci. Rep. 2016, 6, 33653. [Google Scholar] [CrossRef] [PubMed]
- Palfreyman, M.T.; Jorgensen, E.M. Unc13 Aligns SNAREs and Superprimes Synaptic Vesicles. Neuron 2017, 95, 473–475. [Google Scholar] [CrossRef] [PubMed]
- Carlson, A.B.; Kraus, G.P. Physiology, Cholinergic Receptors. In StatPearls; StatPearls Publishing LLC: Treasure Island, FL, USA, 2018. [Google Scholar]
Figure 1.
hPDLSCs characterization. (A) Flow cytometry of surface related markers at the 2nd passage. (B) MTT Graph showed the proliferation rate at different time of culture. (C) RT-PCR of osteogenic markers: RUNX2 and ALP. (D) RT-PCR of adipogenic markers: FAPB4 and PPARγ. (E) Plastic adherent hPDLSCs stained with Toluidine blue solution (F) Alizarin Red S staining of hPDLSCs after 28 days of differentiation. (G) Oil Red staining of hPDLSCs after 28 days of differentiation. Mag: 10× (E); 40× (F,G), bar: 10 µm. The ANOVA test (p-value threshold of 0.05) was used to perform the statistical analysis between osteogenic and adipogenic markers.

Figure 2.
hPDLSCs morphological features. (A) Glass adherent hPDLSCs observed at SEM. (B) hPDLSCs observed at CLSM, green fluorescent stained the cytoskeleton actin. (C) hPDLSCs showed a positivity for nestin (red fluorescent). (D) hPDLSCs showed a positivity for p75 (red fluorescent). Nuclei were stained with TOPRO (blue fluorescent). Bar: 10 µm.

Figure 3.
Distribution of genes express in hPDLSCs as identified in Reactome Database. (A) Distribution of genes related to GABAergic pathways (B) and their involvement in “Signal Transduction” pathway. (C) Distribution of genes related to Glutamatergic pathways (D) and their involvement in “Signal Transduction” pathway. (E) Distribution of genes related to Cholinergic pathways (F) and their involvement in “Signal Transduction” pathway.

Figure 4.
The image shows the Western Blot analysis for GABABR1, GABABR2, AChRα1 and GAPDH proteins about the hPDLSCs and the DPK-SKDF-H lineage. The column 1 represents the protein molecular weight markers, the column 2 the hPDLSCs and the column 3 the DPK-SKDF-H. The analysis shows the expression of the protein for each of them in hPDLSCs, but there is no expression in DPK-SKDF-H.

Figure 5.
Representation of the synapsis in which are involved GABA (A) and glutamate (B) neurotransmitter. In the figure, all the genes that were found in hPDLSCs are highlighted. For a better reading, the genes ADCY3, ADCY4 and ADCY9 are clustered in “ADCY”. The genes PLCB1 and PLCB3 are grouped in “PLCB”. The genes CALM1 and CALM2 are bundled in “CALM”.


Table 1.
Genes of our dataset included in Cholinergic, GABAergic, Glutamatergic REACTOME pathways.
| Genes | Protein Name (Uniprot) | Pathways | Signal Transduction |
|---|---|---|---|
| ABAT | 4-Aminobutyrate Aminotransferase | GABA | No |
| ADCY3 | Adenylate Cyclase type 3 | GABA, GL | Yes |
| ADCY4 | Adenylate Cyclase type 4 | GABA, GL | Yes |
| ADCY9 | Adenylate Cyclase type 9 | GABA, GL | Yes |
| AP2A1 | AP-2 complex subunit Alpha 1 | GL | Yes |
| AP2A2 | AP-2 complex subunit Alpha 2 | GL | Yes |
| AP2M1 | AP-2 complex subunit Mu 1 | GL | Yes |
| AP2S1 | AP-2 complex subunit Sigma 1 | GL | Yes |
| CALM1 | Calmodulin-1 | GL | Yes |
| CALM2 | Calmodulin-2 | GL | Yes |
| CHRNA1 | Acetylcholine Receptor subunit Alpha | CH | No |
| DLG3 | Disks Large homolog 3 | GL | Yes |
| DLG4 | Disks Large homolog 4 | GL | Yes |
| EPB41L1 | Band 4.1 Like protein 1 | GL | No |
| GABBR1 | Gamma-Aminobutyric Acid Type B Receptor Subunit 1 | GABA | Yes |
| GABBR2 | Gamma-Aminobutyric Acid Type B Receptor Subunit 2 | GABA | Yes |
| GLUL | Glutamine synthetase | GABA, GL | No |
| GNB1 | Guanine Nucleotide-binding protein G(I)/G(S)/G(T) subunit beta-1 | GABA, GL | Yes |
| GNG10 | Guanine Nucleotide-binding protein G(I)/G(S)/G(O) subunit gamma-10 | GABA, GL | Yes |
| MDM2 | E3 ubiquitin-protein ligase Mdm2 | GL | Yes |
| MYO6 | Unconventional myosin-VI | GL | No |
| NSF | Vesicle-fusing ATPase | GL | No |
| PLCB1 | 1-phosphatidylinositol 4,5-bisphosphate phosphodiesterase beta-1 | GL | Yes |
| PLCB3 | 1-phosphatidylinositol 4,5-bisphosphate phosphodiesterase beta-3 | GL | Yes |
| PPFIA1 | Liprin-Alpha-1 | CH, GL | No |
| RIMS1 | Regulating Synaptic Membrane Exocytosis 1 | CH, GABA, GL | No |
| SLC1A3 | Excitatory amino acid transporter 1 | GABA, GL | No |
| SLC38A1 | Sodium-coupled neutral amino acid transporter 1 | GABA, GL | No |
| STX1A | Syntaxin-1A | CH, GABA, GL | No |
| UNC13B | Protein Unc-13 Homolog B | GL, CH | No |
The acronym CH, GABA and GL stand respectively for Cholinergic, GABAergic and Glutamatergic pathways.
© 2019 by the authors. Licensee MDPI, Basel, Switzerland. This article is an open access article distributed under the terms and conditions of the Creative Commons Attribution (CC BY) license (http://creativecommons.org/licenses/by/4.0/).
Share and Cite
MDPI and ACS Style
Chiricosta, L.; Diomede, F.; Trubiani, O.; Bramanti, P.; Mazzon, E. Physiological Expression of Ion Channel Receptors in Human Periodontal Ligament Stem Cells. Cells 2019, 8, 219. https://0-doi-org.brum.beds.ac.uk/10.3390/cells8030219
AMA Style
Chiricosta L, Diomede F, Trubiani O, Bramanti P, Mazzon E. Physiological Expression of Ion Channel Receptors in Human Periodontal Ligament Stem Cells. Cells. 2019; 8(3):219. https://0-doi-org.brum.beds.ac.uk/10.3390/cells8030219
Chicago/Turabian StyleChiricosta, Luigi, Francesca Diomede, Oriana Trubiani, Placido Bramanti, and Emanuela Mazzon. 2019. "Physiological Expression of Ion Channel Receptors in Human Periodontal Ligament Stem Cells" Cells 8, no. 3: 219. https://0-doi-org.brum.beds.ac.uk/10.3390/cells8030219
Note that from the first issue of 2016, this journal uses article numbers instead of page numbers. See further details here.