miR-26a-5p is a Stable Reference Gene for miRNA Studies in Chondrocytes from Developing Human Cartilage


1
IRCCS Istituto Ortopedico Galeazzi, Laboratorio di Biotecnologie Applicate all’Ortopedia, I-20161 Milano, Italy
2
Department of Orthopaedics and Traumatology, University of Turin, I-10124 Torino, Italy
*
Author to whom correspondence should be addressed.
Cells 2019, 8(6), 631; https://0-doi-org.brum.beds.ac.uk/10.3390/cells8060631
Submission received: 17 May 2019
/
Revised: 18 June 2019
/
Accepted: 20 June 2019
/
Published: 22 June 2019
(This article belongs to the Collection Regulatory Functions of microRNAs)
Abstract
:miRNAs are emerging as key regulators of complex biological systems in several developmental processes. qRT-PCR is a powerful tool to quantitatively assess the profiles and modulation of miRNA expression. In the emerging field of cartilage maturation studies, from precursor to hypertrophic chondrocytes, few data about miRNA regulation are available, and no consensus on the best reference gene (RG) has been reached. This is a crucial pitfall since reliable outcomes depend on proper data normalization. The aim of this work was to identify reliable and stable miRNA RGs, basing the analysis on available high throughput qRT-PCR miRNA data (from the NCBI Gene Expression Omnibus database, GSE49152) obtained from human embryonic cartilage tissues enriched in the precursor, differentiated, and hypertrophic chondrocytes. Four normalization approaches were used, and the stability was quantified by combining BestKeeper, delta-Ct, geNorm, and NormFinder statistical tools. An integrated approach allowed to identify miR-26a-5p as the most stable RG and miR-212-3p as the worst one. RNU44, used in original dataset analysis, performed as second best RG. Applications of different normalization strategies significantly impacted the profiles and modulation of miRNA expression. Herein presented results point out the crucial need of a consensus on data normalization studies aimed at dissecting miRNA role in human cartilage development, to avoid the postulation of unreliable biological conclusions.
1. Introduction
Gene expression regulation is the biological foundation for the specification of every cell type, tissue, and organ in a multicellular organism. Together with transcriptional regulators, miRNAs have emerged as gene expression repressors directing the post-transcriptional modulation that underlies development [1]. miRNAs are evolutionary conserved, single-stranded, 21–24 nucleotide-long non-coding RNA molecules [2]. They are usually transcribed from DNA sequences first into primary miRNAs, then processed into precursor miRNAs and eventually mature molecules. The main mechanism of action is through direct interaction with 3′ untranslated region (3’ UTR) of target mRNAs, which induces mRNA degradation resulting in translational repression [3]. In addition, miRNAs may interact with 5′ UTR, coding sequence, gene promoters, and under certain conditions, they can also activate translation or regulate transcription [2]. To date, 2300 validated human miRNAs have been reported, and new miRNAs are still being discovered with their roles in gene regulation, starting to be fully deciphered [4].
miRNAs are involved in a variety of biological processes regulating human development in different districts. For some of them, a clear picture has been depicted [5]. As a striking example, for neural development, hundreds of miRNAs are involved in determining the fate of the two major cell types of the nervous system, neurons and glia, at both embryonic and early postnatal stages [6]. An advantage of the neural system is that these processes of neuro- and gliogenesis involve many intermediate cell types that have been exhaustively studied in terms of gene expression and non-coding RNAs regulation [7]. Similarly, in the bone system, the precise roles of many miRNAs have been fully deciphered, giving valuable insights into the treatment of developmental disorders of the skeleton [8]. On the contrary, despite an increasing amount of in vitro data, there is still limited information on the expression and function of specific miRNAs in human cartilage development in vivo.
During embryonic development, mesenchymal progenitor cells differentiate into chondrocytes to form cartilage templates for future bones and cartilage. Proliferating chondrocytes produce extracellular matrix, enriched in type II collagen and aggrecan. Further, they differentiate into hypertrophic chondrocytes that express type X collagen and undergo mineralization to be eventually replaced by mineralized bone, leading to longitudinal bone growth [9]. In this process, different signaling molecules and transcription factors have been shown to regulate the progression of chondrocyte-specific gene expression [10,11]. Regarding miRNAs, few data are available in the in vivo settings, and actual knowledge has predominantly come from studies in mice. let-7 miRNA is required for chondrocyte proliferation [12], whereas miR-140 modulates premature hypertrophic chondrocyte differentiation and delays differentiation of resting chondrocytes to proliferating chondrocytes [13,14]. Nevertheless, data of the human model depicting modulations or differences between cells at different stages of differentiation were missing.
To overcome the limitations of these studies, a pivotal work on miRNA expression patterns was performed by high-throughput qRT-PCR technique within human embryonic (gestational day 54–56) cartilage laser dissected fragments, containing either precursor (PC), differentiated (DC), or hypertrophic (HYP) chondrocytes (Gene Expression Omnibus database, GSE49152) [15]. This report was selected being unique in combining miRNA analysis and specific chondrocyte populations directly involved in regulating cartilage and long bone development. Authors were able to identify differentially expressed miRNAs predicted to regulate growth factors (vascular endothelial growth factor (VEGF), insulin-like growth factor-1 (IGF-1), transforming growth factor beta (TGF-β), bone morphogenetic protein (BMP), fibroblast growth factor (FGF)), Hedgehog and Wnt signaling pathways, and interleukin (IL)-8. Despite this fundamental milestone, only around 50 miRNAs were detectable in all the nine donors, leaving room for further studies aimed either at identifying those candidates that were missed for both technical or low expression reasons, or at studying dysregulation of miRNAs modulating developmental processes involved in skeletal disorders, such as osteoarthritis (OA), chondrodysplasias, or delayed endochondral fracture healing.
For a deep analysis of single or few miRNAs, a robust normalization strategy is a fundamental requisite. Therefore, mining qRT-PCR data of McAlinden dataset, through gold-standard statistical tools (BestKeeper [16], geNorm [17], NormFinder [18], and the comparative delta-Ct method [19]), the aim of this work was to identify stable miRNAs to be used as Reference Genes (RGs) in future studies dissecting these small RNAs involved in cartilage developmental or pathologic processes.
2. Results
2.1. miRNA Selection
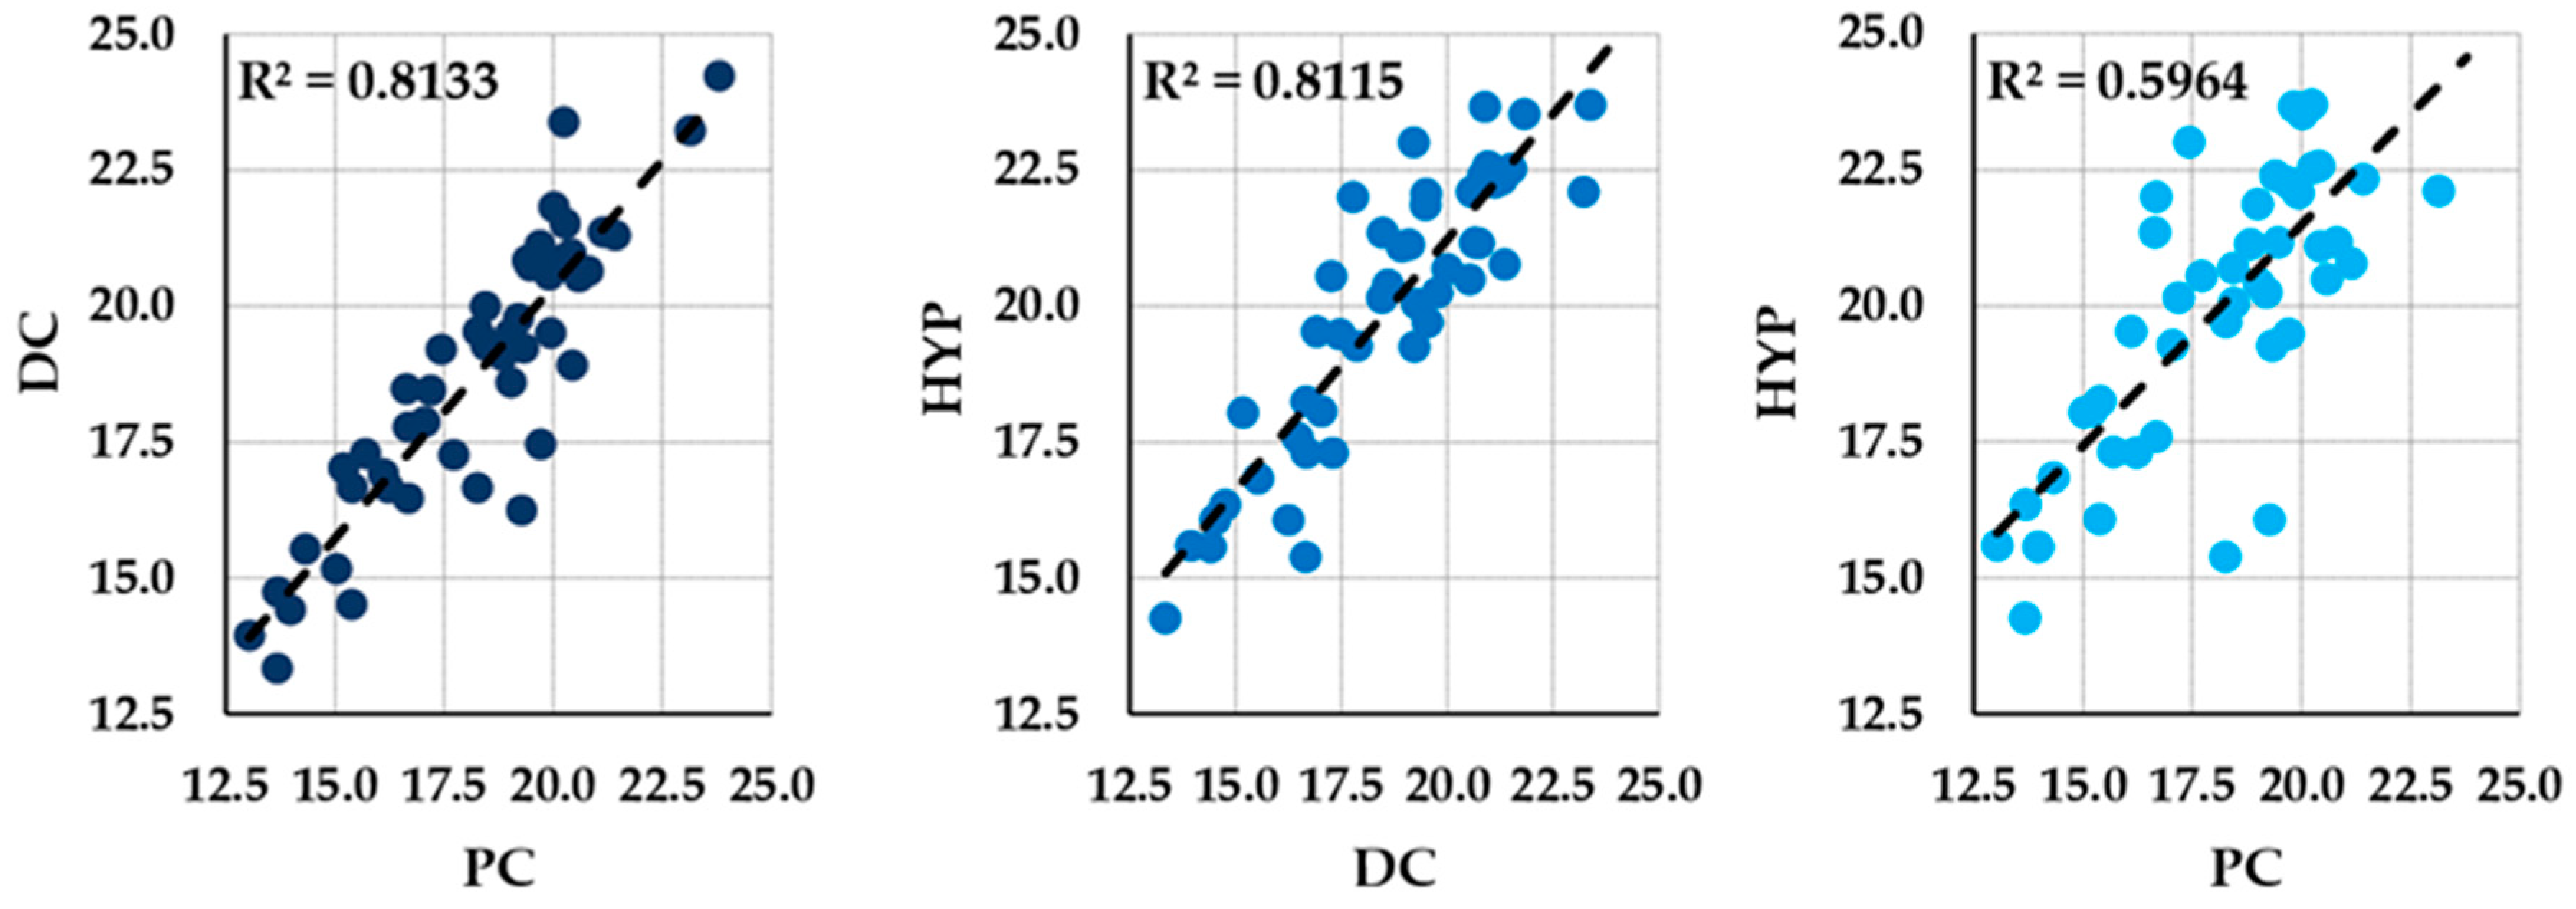
Mining qRT-PCR data, it was possible to identify 46 miRNAs with positive amplification values in all the 26 samples (8 PC, 9 DC, and 9 HYP). RNU44, used in McAlinden work as normalizer, was also always scored. The distribution of the quantification cycles (Ct) values of the selected reference genes over the whole sample sets is shown in Appendix A Table A1. miRNAs presented different expression values and variability levels in the three datasets. In PC chondrocytes, miR-26a-5p showed the largest expression (mean Ct = 13.04), while miR-362-3p was the least expressed (mean Ct = 23.80). In DC samples, miR-720 (mean Ct = 13.34) and miR-362-3p (mean Ct = 24.24) were poles apart. In HYP tissues, miR-720 (mean Ct = 14.26) was the most abundant, with miR-362-3p being again low expressed (mean Ct = 25.83). RNU44 was scored with low Ct values (mean Ct = 13.97 for PC, 14.42 for DC, and 15.57 for HYP). In terms of variability, miR-769-5p in PC, miR-202-3p in DC and HYP displayed the lowest standard deviation (SD), 0.51, 1.02, and 1.48, respectively. Eventually, correlation analysis was performed between each dataset. The analysis, shown in Figure 1, pointed out the existence of high correlation (R2 > 0.8) for PC/DC and DC/HYP when compared to one another, while PC and HYP had lower interrelationship (R2 = 0.6). This is in agreement with modulation of miRNA expression between precursor and hypertrophic chondrocytes, passing by an intermediate differentiation phase.
2.2. Candidate miRNA Ranking
We picked the 46 miRNAs, together with RNU44, and assessed their potential contribution as normalizers following BestKeeper, geNorm, and NormFinder applets and comparative delta-Ct method (Appendix A Table A4, Table A5, Table A6 and Table A7) and Figure 2 for the first fifteen miRNAs in the different rankings). BestKeeper was first used to calculate the Ct standard deviation (SD) in the three datasets. This application ranked: in PC, miR-769-5p (SD of 0.38) and miR-212-3p (5.25) as the best and worst performers, respectively; in DC, miR-202-3p (0.64) and miR-212-3p (3.42); in HYP, miR-373-3p (1.14) and miR-199a-3p (5.03). Based on fold change data, geNorm generated a stability value M by stepwise exclusion of the candidate genes: in PC, miR-296-5p/miR-331-3p as the most stable pair of miRNAs (M of 0.25) and miR-99b-5p (3.37) as the worst RG; in DC, miR-16-5p/miR-26a-5p (0.30) and miR-119a-3p (2.28); in HYP, miR-331-3p/miR-10b-3p (0.51) and miR-520b (3.31). The comparative delta-Ct method identified: in PC, RNU44 (SD of 2.40) and miR-99b-5p (6.85) as best and worst RGs; in DC, miR-331-3p (1.61) and miR-199a-3p (4.22); in HYP, miR-26a-5p (2.33) and miR-520b (6.63). Eventually, NormFinder ranked: in PC, miR-26b-5p (0.45) as the most accurate and miR-99b-5p (6.46) as the less reliable RG; in DC, miR-331-3p (0.18) and miR-199a-3p (4.08); in HYP, miR-26a-5p (0.27) and miR-520b (6.21). Further, because the four applets generated different rankings, a comprehensive stability value was generated (geomean). Following this computation, RNU44 (2.40) for PC, miR-331-3p (2.63) for DC, and miR-26a-5p (2.89) for HYP samples were proposed as the most stable RGs.
Since both single algorithms and overall ranking resulted in different reliable RGs for each dataset, all samples were scored together. In this condition, BestKeeper suggested miR-202-3p (1.04), geNorm miR-26a-5p/miR-331-3p couple (0.58), delta-Ct method miR-26a-5p (2.30), and NormFinder miR-26a-5p (0.56) as the most accurate RGs. The comprehensive ranking of gene stability obtained by combining the four analyses (geomean) assessed miR-26a-5p (1.86) as the most stable miRNA, followed by RNU44 (3.31) and miR-26b-5p (3.98). miR-212-3p was the least stable candidate.
2.3. Impact of Normalization Strategy on miRNA Profiling
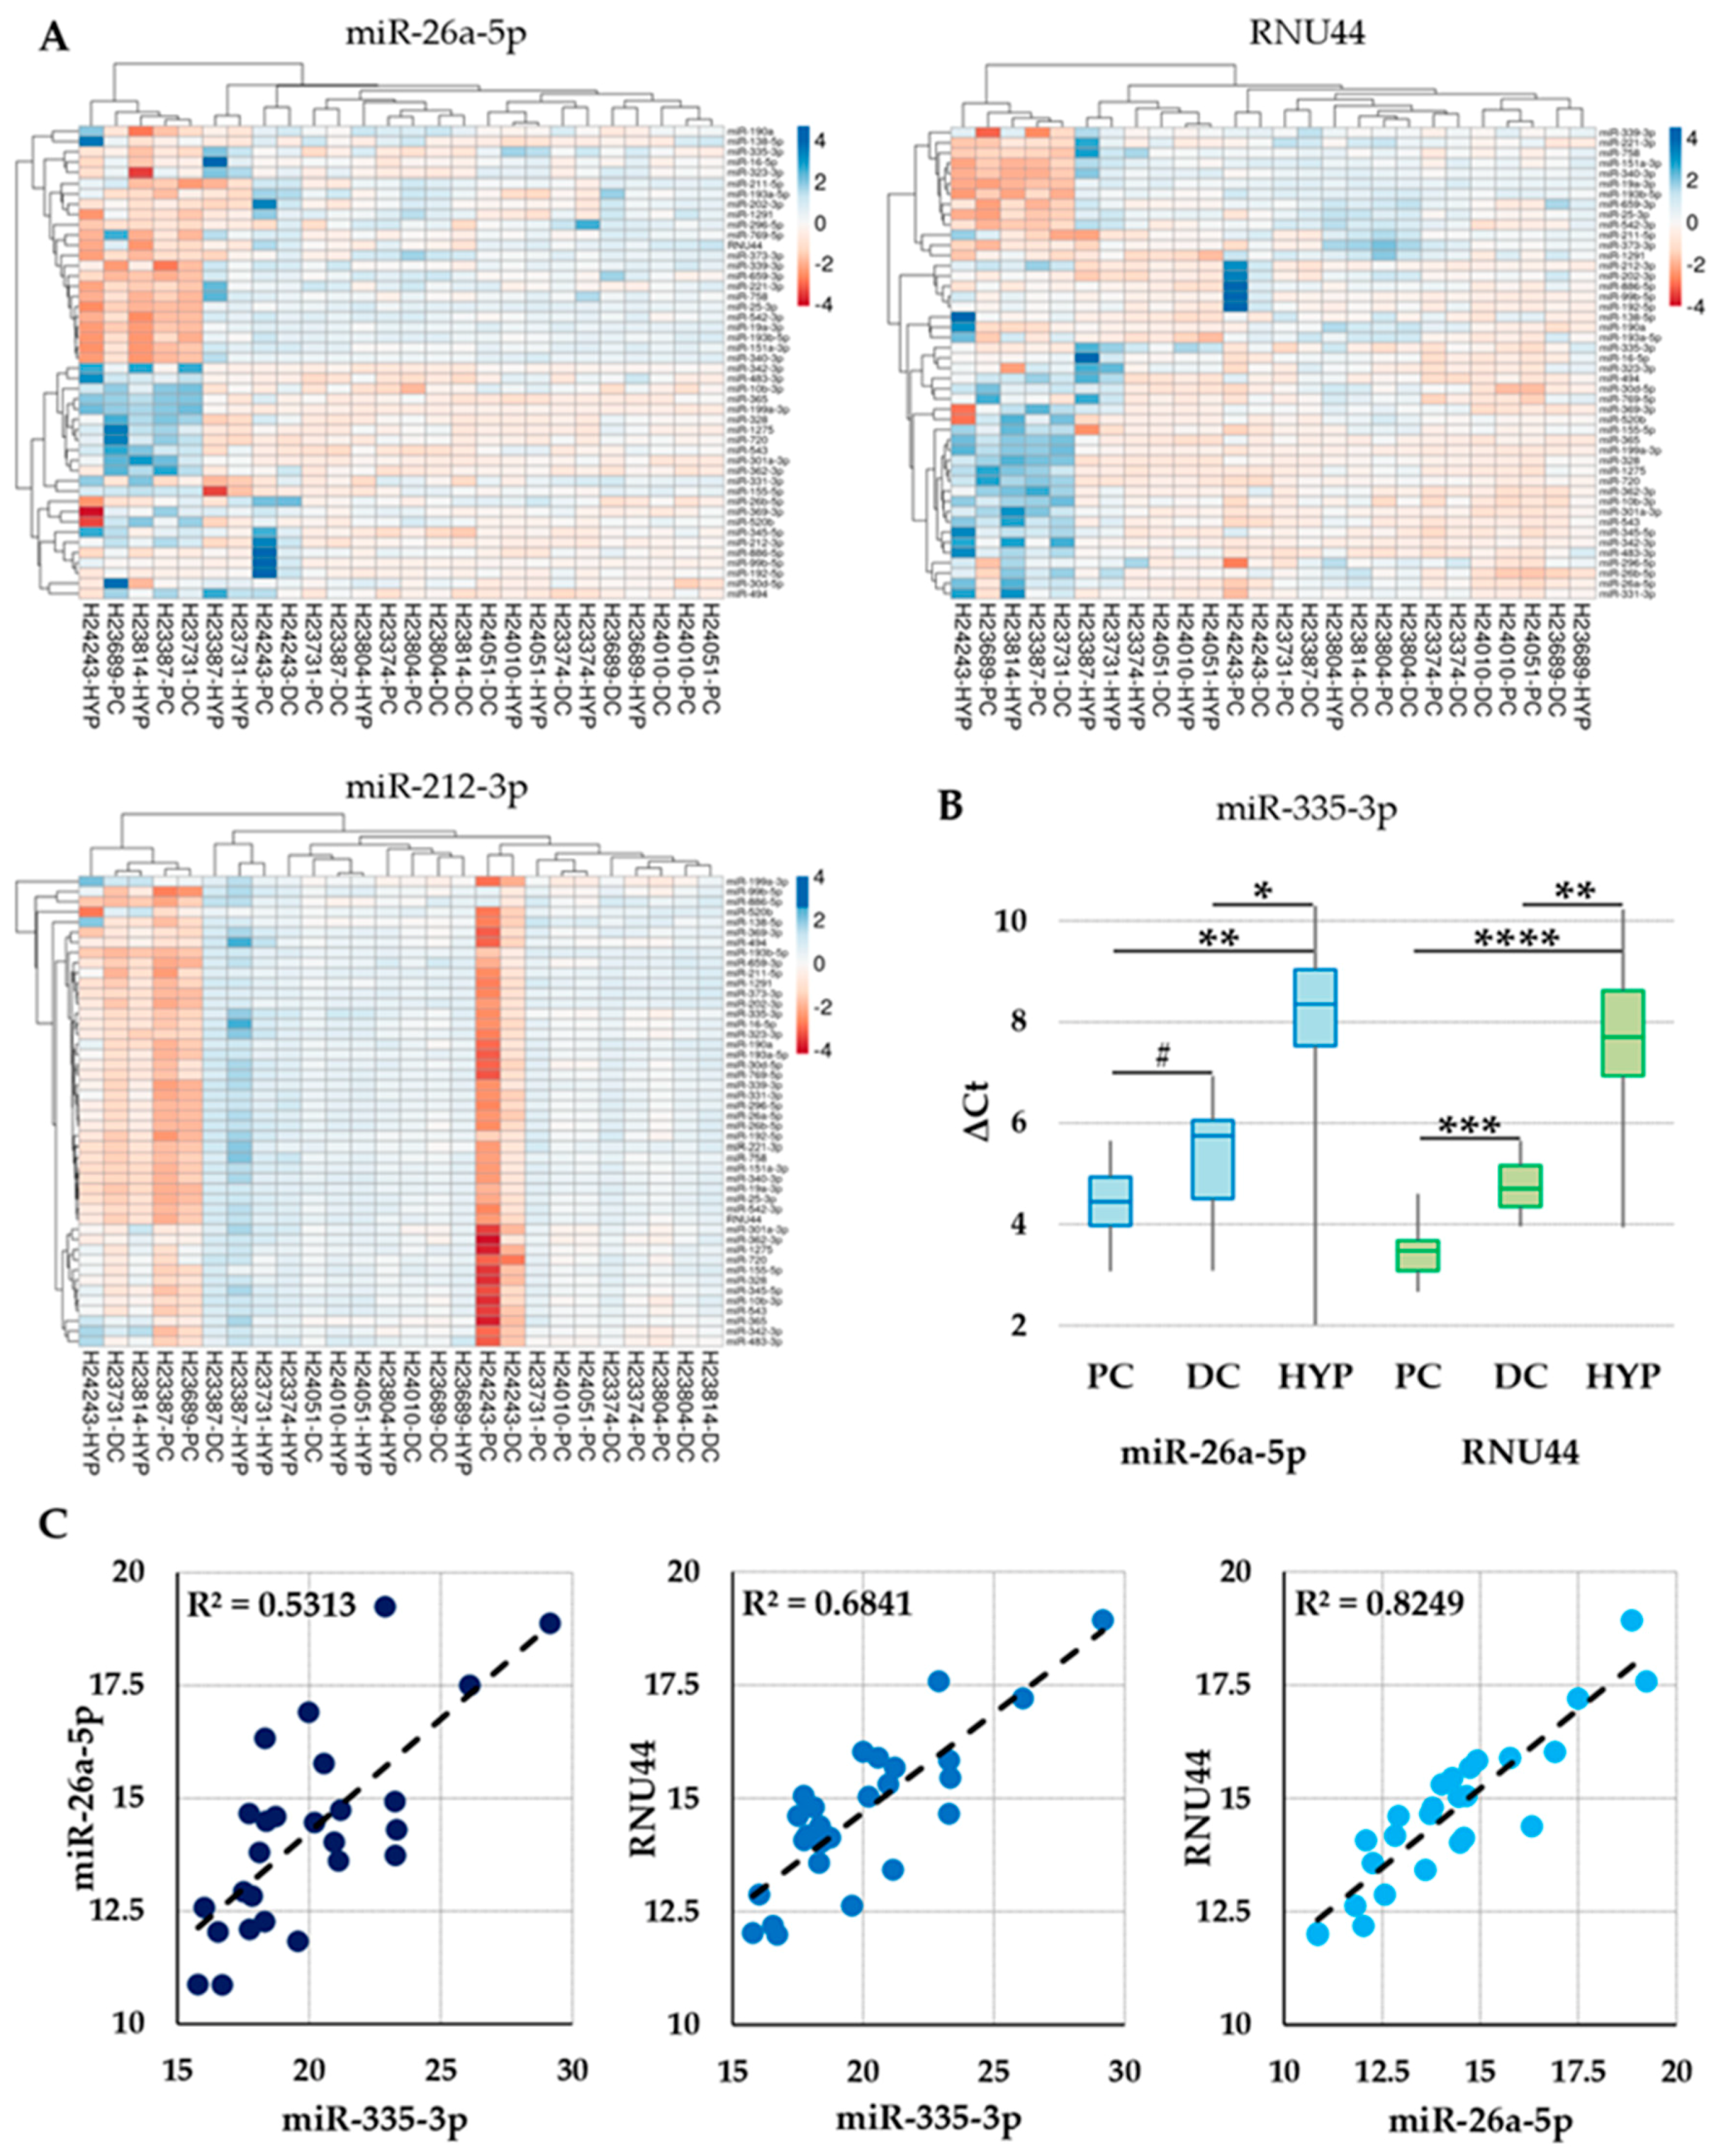
The effects of best/worst normalization strategies on target miRNA profiles were evaluated. The expression levels were computed using either the best (miR-26a-5p) or the worst (miR-212-3p) normalizers and compared with the results obtained with the normalization approach used in McAlinden analysis (RNU44) that also demonstrated its suitability in our ranking. Heat maps in Figure 3A clearly show that all three normalization approaches were able to cluster a group composed of H24243-HYP, H23689-PC, H23814-HYP, H23387-PC, and H23731-DC samples. The hierarchy in this group was maintained for miR-26a-5p and RNU44, while changed using miR-212-3p. Further, with the wrong normalization approach, an apparent and erroneous overexpression of almost all miRNAs in H24243-PC/DC samples emerged. Moreover, despite similar gross outcomes for the two most stable RGs, defined by the identification of those samples clearly different from the others, small rearrangement in both samples and miRNAs dendrograms could be observed, confirming that a most refined strategy allows identifying more specific co-regulation.
To evaluate the crucial impact of the best strategy on the reliable quantification of subtle discrepancies between cartilage regions, a more refined analysis was performed on miR-335-3p levels. miR-335-3p was selected since in McAlinden analysis, performed using RNU44, it was reported as significantly modulated within PC, DC, and HYP samples. In Figure 3B, it clearly appears that in a context of similar outcomes between the two approaches, the use of the most reliable miR-26a-5p does not allow scoring a significant (p-value ≤ 0.05) difference between PC and DC samples. To rule out this variation, correlation analysis for miR-26a-5p, RNU44, and miR-335-3p was performed across all samples. Interestingly, RNU44 and miR-335-3p showed a higher correlation coefficient (R2 = 0.68 vs. 0.53 for miR-26a-5p/miR-335-3p) (Figure 3C), leading to more homogenous ratios with reduced standard deviation and eventually higher statistical significance. Notably, the correlation between miR-26a-5p and RNU44 was high (0.82) as expected for RGs with similar stability profiles, again emphasizing that from small differences, major distortions may arise.
3. Discussion
The present work identified miR-26a-5p as a suitable RG for studies on miRNAs involved in and controlling the developmental process of human cartilage. By a multi-technique quantitative approach, we also demonstrated the good performance of the widely-used normalizer RNU44, in this specific experimental context. The application of different normalization strategies in the exemplary case of miR-335-3p assessment pointed out the criticality of the RG choice to obtain significant information on miRNA modulation in cartilage development.
Normalization strategy is an open question in studies assessing miRNA stability and comparison between samples from different sources or donors. Traditionally, in qRT-PCR studies, the relative quantification method is used, comparing expression levels of target miRNAs with the amount of an endogenous RG. In this context, small nuclear/nucleolar RNAs (snRNAs, e.g., RNU6, RNU44, or RNU48) have been commonly preferred [20]. This approach has some advantages, as well as important pitfalls. In fact, small RNA molecules, such as miRNAs and snRNAs, share similar features, such as stability and size. Further, snRNAs are ubiquitous and abundantly expressed, crucial traits for a reliable RG [21]. Nevertheless, snRNA biogenesis is mechanistically separated from miRNA biogenesis. As an example, RNU6 is not processed by the spliceosome but by the Drosha complex and does not mirror the physicochemical properties of miRNA molecules [22]. Therefore, the selection of the reference RNA on the class of RNAs being investigated is a fundamental issue, suggesting that reference miRNAs would be preferred for miRNAs.
To date, no universal miRNA RGs have been proposed due to high variability between donors, tissues, and developmental stages, making miRNA studies results largely incomparable [23]. Therefore, the selection of RGs that are reliable within the experimental condition under analysis is a pivotal pre-requisite. In this perspective, for large miRNA datasets, the global mean expression value normalization was proposed as highly effective, in terms of both reduction of technical variation and more accurate quantification of biological fluctuations [24]. However, when only a limited number of miRNA molecules are profiled, the selection of specific RGs is mandatory. To answer this need, the identification of invariant miRNAs by algorithms, specifically developed for RG evaluation and selection, resulted in a promising strategy [16,17,18,19].
In the field of developmental biology, such strategy has been successfully applied in a few studies in the plant or animal systems [25,26,27,28,29]. In human studies, a major issue is an availability of starting tissue material, especially when developmental studies are performed at embryonic stages. In the present work, the valuable data regarding miRNA expression in embryonic cartilage fragments, containing either precursor, differentiated, or hypertrophic chondrocytes [15] was mined. RNU44, used by McAlinden group as a normalizer for differentially-expressed miRNAs, was a reliable RG, ranking second when all samples were grouped, and always within the first ten positions in the separated cartilage regions. From our analysis, miR-26a-5p emerged as the most accurate RG, standing first for the analysis of all samples together, and in the top five for disjointed isolates. At present, no reports connecting miR-26a-5p and cartilage development are known, reinforcing its suitability as stable RG, although more focused studies are needed. In a wider context related to cartilage, in human chondrocytes, the downregulation of miR-26a-5p expression by IL-1b through nuclear factor kappa B (NF-kB) enhanced the production of OA-related nitric oxide synthase 2 (iNOS) protein, due to the ability of miR-26a-5p to directly target iNOS mRNA 3’UTR [30]. Therefore, although stable in developing cartilage, miR-26a-5p reliability as chondrocyte miRNA RG in adult tissues under inflammation or OA might be considered carefully, and our suggestion is to verify, through the herein proposed algorithms, a panel of miRNA RGs, if possible selected from studies in the same or similar field.
The marked differences in performance of the tested normalization strategies (miR-26a-5p/RNU44/miR-212-3p) had a significant impact on miRNAs profiling in the different regions of developing cartilage, possibly precluding accurate biological implications. Although all normalization strategies allowed to clearly distinguish a subgroup of markedly different samples, either best or worst RGs completely changed the arrangement of both sample and miRNA dendrograms (Figure 3A). Moreover, even using miR-26a-5p, it was not possible to clearly cluster PC, DC, and HYP regions. This may indicate that overall, or at least for the 46 scored miRNAs, no fingerprinting major transcriptional differences are present. In this context of global high similarity, few miRNAs may be crucial to support biological outcomes, and reliable and refined evaluation of small variations gets decisive, as shown for miR-335-3p, in assessing significant modulations.
In conclusion, this study pointed out for the first time the reliability of miR-26a-5p for future studies aimed at dissecting new or low abundant miRNAs regulation in different regions of human developing cartilage. The main limitation of the report is the lack of validation of the proposed analysis on independent samples. Therefore, future evaluation of miRNA expression from developing cartilage should be performed on the path of herein proposed candidates, possibly from multiple samples for each individual to reduce overall variability [31].
4. Materials and Methods
4.1. Data Retrieval and Ethics Statement
qRT-PCR data can be found in the GEO database [32], with the record GSE49152 [15]. Only miRNAs with reported Ct values in all samples were considered for the analysis (Appendix A Table A1, Table A2 and Table A3). For the donors, briefly, human, normal embryonic tissue samples (limbs) at gestational day 54–56 were obtained from nine donors, and laser capture microdissection was performed to obtain tissue from the precursor chondrocyte (PC), differentiated chondrocyte (DC), or hypertrophic chondrocyte (HYP) regions. After RNA extraction, TaqMan® OpenArray® technology was used to determine microRNA expression profiles starting from 30 ng total RNA for each sample (Thermo Fisher Scientific, Waltham, MA, USA). TaqMan® OpenArray® technology is a fixed-content panel containing 754 validated human TaqMan® MicroRNA Assays derived from Sanger miRBase release v.14. The panel is specifically designed to provide specificity for only the mature miRNA targets. TaqMan MicroRNA Assays incorporate a target-specific stem-loop reverse transcription primer allowing to work despite the short length of mature miRNAs (~22 nucleotides).
As stated in McAlinden work, the Human Research Protection Office (HRPO) at Washington University in St Louis reviewed the request to work with human embryonic tissue, and the original project was deemed exempt since it did not constitute human subjects research and receiving embryonic tissue from the University of Washington would not involve obtaining data through intervention or interaction with a living individual, and, other than gestational age, no identifying information was provided upon receipt of the tissue.
4.2. Assessment of RG Stability
Gene expression stability was evaluated according to four gold-standard statistical approaches: BestKeeper [16], geNorm [17], NormFinder [18], and the comparative delta-Ct method [19]. BestKeeper analysis uses Ct values directly, while geNorm, NormFinder, and delta-Ct method use transformed Ct values of (1 + E) − ΔCt. The ranking of the RGs according to their stability was generated by each algorithm, and a series of continuous integers starting from 1 was assigned to each RG. The overall performance of the miRNA RGs was evaluated by combining the results of the four approaches through a global ranking obtained as the geometric mean of the rankings given by each analysis [33,34].
4.3. Statistical Analyses
Statistical analyses were performed using GraphPad Prism Software version 5 (GraphPad, San Diego, CA, USA). Presence of outliers was scored by Grubbs’ test. When two sets of data (PCvsDC, PCvsHYP, DCvsHYP) were compared, as in McAlinden paper, the comparison was performed by using unpaired Student t-test. Significance level was set at p-value ≤ 0.05. Pearson correlation coefficient (R2) was estimated to determine the linear association between samples or miRNA Ct values. The outcome results were interpreted according to the degree of association [35].
Heatmaps were generated scoring Cycle relative threshold (Crt) values normalized both with stable miR-26a-5p/RNU44 and unstable miR-212-3pwith ClustVis package (https://biit.cs.ut.ee/clustvis/) [36]. After row centering, maps were generated using the following settings for both rows and columns clustering distance and method: correlation and average, respectively.
Author Contributions
Conceptualization, E.R.; methodology, E.R.; formal analysis, E.R., P.D.L.; data curation, E.R., P.D.L.; writing—original draft preparation, E.R.; writing—review and editing, L.d.G., A.M.; supervision, L.d.G.; project administration, L.d.G.; funding acquisition, L.d.G.
Funding
This paper was supported by the Italian Ministry of Health “Ricerca Corrente”.
Acknowledgments
Authors deeply thank all researchers at IRCCS Istituto Ortopedico Galeazzi, Laboratorio di Biotecnologie Applicate all’Ortopedia for discussions and suggestions.
Conflicts of Interest
The authors declare no conflict of interest.
Abbreviations
| qRT-PCR | Quantitative Real-Time Polymerase Chain Reaction |
| RG | Reference Gene |
| OA | Osteoarthritis |
| miRNA | microRNA |
| PC | precursor chondrocytes |
| DC | differentiated chondrocytes |
| HYP | hypertrophic chondrocytes |
| VEGF | vascular endothelial growth factor |
| IGF-1 | insulin-like growth factor-1 |
| TGF-β | transforming growth factor beta |
| BMP | bone morphogenetic protein |
| FGF | fibroblast growth factor |
Appendix A

Table A1.
Distribution of the quantification cycles (Crt) values across precursor chondrocytes (PC) samples.
Table A1.
Distribution of the quantification cycles (Crt) values across precursor chondrocytes (PC) samples.
| ID_REF | H23374 | H23387 | H23689 | H23731 | H23804 | H24010 | H24051 | H24243 | Mean | SD |
|---|---|---|---|---|---|---|---|---|---|---|
| miR-16-5p | 15.76 | 17.263 | 14.612 | 17.995 | 15.589 | 16.245 | 16.118 | 15.243 | 16.103 | 1.088 |
| miR-19a-3p | 17.769 | 12.165 | 8.759 | 18.885 | 16.404 | 17.197 | 17.497 | 16.911 | 15.698 | 3.434 |
| miR-25-3p | 16.781 | 13.398 | 10.264 | 17.825 | 16.354 | 16.019 | 16.226 | 14.745 | 15.202 | 2.398 |
| miR-26a-5p | 13.795 | 14.585 | 10.863 | 14.655 | 12.569 | 12.826 | 12.921 | 12.091 | 13.038 | 1.281 |
| miR-26b-5p | 15.127 | 15.954 | 11.639 | 15.812 | 13.683 | 13.633 | 14.025 | 14.717 | 14.324 | 1.407 |
| miR-30d-5p | 18.15 | 18.348 | 18.033 | 18.384 | 16.167 | 15.424 | 15.907 | 16.049 | 17.058 | 1.275 |
| miR-99b-5p | 13.355 | 14.608 | 11.317 | 14.06 | 12.283 | 12.488 | 12.877 | 32.047 | 15.379 | 6.813 |
| miR-190a | 22.433 | 19.043 | 16.729 | 22.04 | 21.151 | 20.133 | 20.519 | 20.133 | 20.273 | 1.802 |
| miR-192-5p | 19.521 | 20.214 | 17.789 | 21.362 | 18.292 | 19.292 | 19.359 | 30.646 | 20.809 | 4.122 |
| miR-211-5p | 16.856 | 14.045 | 15.184 | 16.354 | 17.323 | 16.399 | 16.815 | 16.893 | 16.234 | 1.088 |
| miR-212-3p | 15.3 | 25.443 | 21.018 | 14.492 | 15.321 | 15.068 | 15.161 | 32.376 | 19.272 | 6.565 |
| miR-221-3p | 21.038 | 16.549 | 12.994 | 23.498 | 21.289 | 19.233 | 20.512 | 18.489 | 19.200 | 3.251 |
| miR-296-5p | 17.126 | 16.506 | 12.682 | 16.368 | 15.281 | 15.512 | 15.894 | 13.817 | 15.398 | 1.479 |
| miR-301a-3p | 17.437 | 24.183 | 20.688 | 17.512 | 15.668 | 15.564 | 15.632 | 15.073 | 17.720 | 3.183 |
| miR-328 | 16.275 | 20.79 | 17.911 | 16.196 | 15.318 | 15.291 | 15.35 | 16.314 | 16.681 | 1.871 |
| miR-331-3p | 14.993 | 14.602 | 11.136 | 15.003 | 13.6 | 13.86 | 14.027 | 12.325 | 13.693 | 1.352 |
| miR-369-3p | 22.2 | 25.225 | 19.24 | 22.316 | 20.755 | 19.644 | 20.457 | 21.571 | 21.426 | 1.897 |
| miR-373-3p | 20.872 | 17.352 | 13.565 | 18.928 | 20.73 | 18.879 | 19.095 | 16.799 | 18.278 | 2.374 |
| miR-365 | 18.866 | 26.069 | 22.047 | 20.417 | 18.557 | 18.724 | 18.712 | 20.156 | 20.444 | 2.572 |
| miR-520b | 22.805 | 24.426 | 24.831 | 22.453 | 24.983 | 21.584 | 21.652 | 22.462 | 23.150 | 1.393 |
| miR-542-3p | 21.685 | 18.276 | 15.802 | 22.499 | 20.563 | 19.7 | 20.214 | 20.529 | 19.909 | 2.082 |
| miR-659-3p | 24.314 | 15.082 | 11.816 | 22.937 | 24.641 | 19.723 | 20.466 | 22.921 | 20.238 | 4.603 |
| miR-758 | 19.959 | 17.303 | 15.235 | 22.147 | 20.961 | 21.27 | 20.411 | 21.351 | 19.830 | 2.357 |
| miR-769-5p | 20.453 | 20.809 | 20.585 | 21.329 | 19.666 | 20.208 | 20.169 | 20.087 | 20.413 | 0.506 |
| miR-362-3p | 21.876 | 31.59 | 27.068 | 23.274 | 21.24 | 21.177 | 21.92 | 22.259 | 23.801 | 3.678 |
| miR-339-3p | 21.266 | 16.579 | 13.694 | 22.451 | 20.253 | 22.428 | 21.516 | 22.011 | 20.025 | 3.193 |
| miR-335-3p | 18.111 | 18.732 | 15.78 | 17.727 | 16.023 | 17.845 | 17.513 | 17.737 | 17.434 | 1.016 |
| miR-345-5p | 18.021 | 20.615 | 17.911 | 19.548 | 17.585 | 18.684 | 18.124 | 20.252 | 18.843 | 1.152 |
| miR-886-5p | 18.156 | 15.614 | 14.222 | 18.138 | 16.017 | 15.215 | 14.268 | 34.51 | 18.268 | 6.736 |
| miR-323-3p | 17.171 | 19.577 | 15.798 | 18.177 | 16.057 | 17.305 | 17.291 | 16.15 | 17.191 | 1.253 |
| miR-151a-3p | 19.206 | 15.52 | 14.021 | 21.469 | 18.197 | 19.953 | 19.181 | 20.01 | 18.445 | 2.484 |
| miR-340-3p | 21.096 | 16.028 | 14.812 | 22.218 | 20.309 | 21.181 | 21.625 | 20.294 | 19.695 | 2.733 |
| miR-342-3p | 16.005 | 18.656 | 16.827 | 17.393 | 14.8 | 17.462 | 16.833 | 15.172 | 16.644 | 1.272 |
| miR-193a-5p | 20.281 | 19.074 | 16.07 | 21.22 | 20.044 | 19.475 | 19.573 | 20.068 | 19.476 | 1.518 |
| miR-138-5p | 20.323 | 17.887 | 16.26 | 22.691 | 20.647 | 20.028 | 20.853 | 19.036 | 19.716 | 1.972 |
| miR-199a-3p | 12.892 | 24.971 | 21.137 | 14.097 | 11.852 | 11.869 | 12.326 | 11.159 | 15.038 | 5.126 |
| miR-10b-3p | 18.889 | 23.797 | 20.055 | 20.166 | 16.796 | 18.28 | 19.337 | 18.034 | 19.419 | 2.088 |
| miR-483-3p | 16.064 | 20.652 | 18.422 | 16.133 | 14.348 | 16.081 | 16.253 | 15.515 | 16.684 | 1.958 |
| miR-202-3p | 20.34 | 19.782 | 16.845 | 20.327 | 20.869 | 20.395 | 20.38 | 25.763 | 20.588 | 2.442 |
| miR-494 | 18.156 | 24.034 | 20.525 | 19.472 | 18.219 | 19.466 | 18.362 | 21.292 | 19.941 | 2.000 |
| miR-193b-5p | 23.232 | 15.684 | 12.657 | 24.236 | 22.339 | 23.219 | 23.33 | 24.496 | 21.149 | 4.432 |
| miR-543 | 18.858 | 21.579 | 19.426 | 19.625 | 17.319 | 18.876 | 18.825 | 17.496 | 19.001 | 1.330 |
| miR-155-5p | 18.446 | 21.61 | 17.761 | 18.895 | 18.45 | 18.053 | 18.717 | 15.747 | 18.460 | 1.612 |
| miR-1291 | 20.252 | 17.87 | 16.122 | 20.902 | 20.273 | 19.908 | 18.814 | 20.51 | 19.331 | 1.631 |
| miR-1275 | 17.891 | 23.592 | 23.873 | 18.257 | 17.67 | 17.119 | 16.898 | 17.023 | 19.040 | 2.933 |
| miR-720 | 13.546 | 18.461 | 18.539 | 13.048 | 11.742 | 11.685 | 12.233 | 10.165 | 13.677 | 3.141 |
| RNU44 | 14.806 | 14.132 | 12.033 | 15.060 | 12.878 | 14.185 | 14.610 | 14.081 | 13.973 | 1.023 |
Table A2.
Distribution of the quantification cycles (Crt) values across differentiated chondrocytes (DC) samples.
Table A2.
Distribution of the quantification cycles (Crt) values across differentiated chondrocytes (DC) samples.
| ID_REF | H23374 | H23387 | H23689 | H23731 | H23804 | H23814 | H24010 | H24051 | H24243 | Mean | SD |
|---|---|---|---|---|---|---|---|---|---|---|---|
| miR-16-5p | 17.12 | 19.173 | 13.827 | 19.497 | 15.103 | 17.281 | 15.051 | 18.18 | 17.023 | 16.917 | 1.932 |
| miR-19a-3p | 19.173 | 19.646 | 14.969 | 14.039 | 15.501 | 18.006 | 16.431 | 19.486 | 18.396 | 17.294 | 2.108 |
| miR-25-3p | 18.26 | 19.566 | 14.254 | 15.571 | 15.876 | 18.407 | 15.604 | 18.32 | 17.383 | 17.027 | 1.762 |
| miR-26a-5p | 14.456 | 15.767 | 10.853 | 16.905 | 12.028 | 14.485 | 12.264 | 14.734 | 14.021 | 13.946 | 1.915 |
| miR-26b-5p | 16.067 | 17.028 | 11.617 | 18.668 | 13.406 | 16.199 | 13.601 | 16.473 | 16.741 | 15.533 | 2.200 |
| miR-30d-5p | 18.621 | 19.887 | 14.616 | 20.917 | 16.24 | 18.469 | 15.931 | 18.025 | 18.159 | 17.874 | 1.981 |
| miR-99b-5p | 14.476 | 15.482 | 10.879 | 17.203 | 11.883 | 14.102 | 12.509 | 14.976 | 19.153 | 14.518 | 2.604 |
| miR-190a | 23.051 | 22.927 | 16.937 | 22.253 | 21.262 | 22.594 | 19.881 | 21.78 | 22.958 | 21.516 | 1.997 |
| miR-192-5p | 21.866 | 21.433 | 17.511 | 22.669 | 18.409 | 20.227 | 18.215 | 21.526 | 23.971 | 20.647 | 2.206 |
| miR-211-5p | 17.132 | 16.976 | 14.709 | 14.849 | 16.078 | 17.864 | 16.124 | 17.551 | 18.711 | 16.666 | 1.346 |
| miR-212-3p | 14.613 | 13.779 | 12.999 | 24.595 | 13.138 | 14.085 | 13.629 | 16.116 | 23.3 | 16.250 | 4.472 |
| miR-221-3p | 20.669 | 23.643 | 15.289 | 17.863 | 18.2 | 21.544 | 17.989 | 22.264 | 20.454 | 19.768 | 2.622 |
| miR-296-5p | 18.069 | 18.4 | 14.146 | 18.503 | 14.95 | 16.135 | 15.305 | 17.273 | 17.175 | 16.662 | 1.597 |
| miR-301a-3p | 18.064 | 18.517 | 13.829 | 23.646 | 14.813 | 17.132 | 14.529 | 17.745 | 17.083 | 17.262 | 2.926 |
| miR-328 | 16.475 | 17.018 | 14.19 | 22.472 | 14.142 | 15.911 | 14.684 | 16.332 | 17.017 | 16.471 | 2.519 |
| miR-331-3p | 15.569 | 16.34 | 12.158 | 17.457 | 12.659 | 14.506 | 13.256 | 15.689 | 15.093 | 14.747 | 1.765 |
| miR-369-3p | 22.614 | 22.705 | 17.327 | 25.569 | 19.288 | 21.306 | 18.575 | 21.924 | 22.402 | 21.301 | 2.520 |
| miR-373-3p | 20.674 | 19.904 | 16.998 | 19.633 | 19.27 | 21.31 | 17.897 | 19.903 | 20.208 | 19.533 | 1.340 |
| miR-365 | 18.78 | 19.767 | 15.079 | 28.769 | 16.344 | 17.797 | 16.243 | 18.518 | 18.977 | 18.919 | 3.996 |
| miR-520b | 22.799 | 21.624 | 19.716 | 33.414 | 22.364 | 23.634 | 22.654 | 21.946 | 20.935 | 23.232 | 3.984 |
| miR-542-3p | 21.582 | 23.098 | 17.779 | 20.597 | 19.413 | 21.347 | 18.568 | 21.172 | 21.577 | 20.570 | 1.678 |
| miR-659-3p | 23.839 | 25.276 | 25.615 | 18.596 | 24.974 | 24.452 | 20.877 | 22.417 | 24.389 | 23.382 | 2.334 |
| miR-758 | 21.995 | 23.84 | 18.765 | 18.623 | 19.302 | 20.851 | 19.586 | 22.638 | 22.458 | 20.895 | 1.914 |
| miR-769-5p | 21.339 | 22.454 | 18.869 | 22.063 | 19.044 | 21.069 | 19.638 | 22.079 | 22.089 | 20.960 | 1.411 |
| miR-362-3p | 23.264 | 25.611 | 19.183 | 30.957 | 21.065 | 24.316 | 21.961 | 24.489 | 27.286 | 24.237 | 3.503 |
| miR-339-3p | 22.631 | 25.648 | 19.203 | 20.886 | 19.583 | 21.204 | 20.602 | 23.122 | 23.487 | 21.818 | 2.073 |
| miR-335-3p | 20.206 | 20.566 | 16.702 | 19.991 | 16.541 | 18.369 | 18.316 | 21.196 | 20.954 | 19.205 | 1.780 |
| miR-345-5p | 19.194 | 20.928 | 16.144 | 23.486 | 16.185 | 18.263 | 17.547 | 19.926 | 20.206 | 19.098 | 2.367 |
| miR-886-5p | 17.998 | 19.349 | 15.829 | 16.404 | 14.59 | 17.109 | 13.063 | 15.461 | 20.095 | 16.655 | 2.248 |
| miR-323-3p | 18.193 | 21.046 | 16.7 | 20.679 | 15.28 | 18.114 | 16.436 | 20.365 | 19.267 | 18.453 | 2.043 |
| miR-151a-3p | 21.498 | 22.716 | 17.214 | 18.35 | 17.951 | 20.003 | 18.789 | 21.554 | 21.878 | 19.995 | 1.991 |
| miR-340-3p | 22.248 | 23.312 | 18.799 | 18.859 | 19.4 | 21.991 | 20.369 | 23.269 | 21.824 | 21.119 | 1.802 |
| miR-342-3p | 17.528 | 19.571 | 14.822 | 30.514 | 14.624 | 16.711 | 16.143 | 18.977 | 17.413 | 18.478 | 4.811 |
| miR-193a-5p | 20.548 | 23.09 | 18.877 | 22.735 | 19.239 | 21.038 | 18.522 | 20.77 | 21.864 | 20.743 | 1.641 |
| miR-138-5p | 17.679 | 20.05 | 14.523 | 21.741 | 15.573 | 17.727 | 14.985 | 17.7 | 17.133 | 17.457 | 2.335 |
| miR-199a-3p | 14.285 | 15.795 | 10.526 | 28.462 | 11.458 | 14.423 | 12.243 | 14.979 | 14.41 | 15.176 | 5.279 |
| miR-10b-3p | 21.266 | 22.542 | 16.191 | 26.342 | 18.356 | 20.841 | 18.43 | 22.372 | 21.266 | 20.845 | 2.947 |
| miR-483-3p | 17.108 | 18.086 | 15.868 | 25.096 | 15.009 | 15.966 | 16.949 | 18.263 | 17.59 | 17.771 | 2.951 |
| miR-202-3p | 20.522 | 20.408 | 19.698 | 20.947 | 19.797 | 20.571 | 19.366 | 20.643 | 22.89 | 20.538 | 1.022 |
| miR-494 | 18.3 | 22.234 | 16.351 | 24.418 | 17.997 | 18.644 | 17.753 | 19.537 | 20.287 | 19.502 | 2.492 |
| miR-193b-5p | 22.426 | 24.428 | 19.749 | 14.727 | 21.926 | 22.503 | 20.477 | 22.748 | 23.226 | 21.357 | 2.849 |
| miR-543 | 19.725 | 20.497 | 16.45 | 24.05 | 16.957 | 19.71 | 18.215 | 20.644 | 19.111 | 19.484 | 2.255 |
| miR-155-5p | 19.397 | 19.848 | 16.905 | 23.729 | 17.946 | 19.621 | 18.419 | 19.466 | 18.209 | 19.282 | 1.923 |
| miR-1291 | 20.157 | 21.16 | 18.004 | 18.882 | 18.388 | 20.321 | 17.279 | 18.851 | 19.992 | 19.226 | 1.257 |
| miR-1275 | 18.413 | 19.438 | 17.212 | 23.706 | 17.532 | 17.948 | 16.416 | 18.798 | 17.974 | 18.604 | 2.107 |
| miR-720 | 14.054 | 14.578 | 10.717 | 19.77 | 11.537 | 12.671 | 11.917 | 13.545 | 11.266 | 13.339 | 2.746 |
| RNU44 | 15.035 | 15.900 | 11.991 | 16.028 | 12.189 | 14.030 | 13.579 | 15.677 | 15.308 | 14.415 | 1.552 |
Table A3.
Distribution of the quantification cycles (Crt) values across hypertrohic chondrocytes (HYP) samples.
Table A3.
Distribution of the quantification cycles (Crt) values across hypertrohic chondrocytes (HYP) samples.
| ID_REF | H23374 | H23387 | H23689 | H23731 | H23804 | H23814 | H24010 | H24051 | H24243 | Mean | SD |
|---|---|---|---|---|---|---|---|---|---|---|---|
| miR-16-5p | 18.528 | 28.879 | 16.163 | 21.854 | 16.735 | 17.016 | 17.585 | 18.541 | 20.45 | 19.528 | 3.951 |
| miR-19a-3p | 18.582 | 21.88 | 15.871 | 21.321 | 16.335 | 11.963 | 17.048 | 18.054 | 14.71 | 17.307 | 3.114 |
| miR-25-3p | 18.541 | 22.189 | 15.481 | 21.375 | 18.069 | 14.712 | 17.537 | 18.427 | 16.241 | 18.064 | 2.496 |
| miR-26a-5p | 14.922 | 18.867 | 11.822 | 17.5 | 13.602 | 16.324 | 13.73 | 14.296 | 19.241 | 15.589 | 2.549 |
| miR-26b-5p | 16.391 | 19.673 | 12.735 | 19.524 | 15.148 | 17.175 | 15.39 | 16.327 | 19.157 | 16.836 | 2.318 |
| miR-30d-5p | 18.549 | 23.304 | 15.538 | 21.844 | 18.124 | 18.559 | 17.22 | 17.752 | 22.519 | 19.268 | 2.651 |
| miR-99b-5p | 15.05 | 18.32 | 12.083 | 17.595 | 13.425 | 16.828 | 14.05 | 15.091 | 22.232 | 16.075 | 3.060 |
| miR-190a | 22.098 | 25.533 | 18.38 | 23.351 | 22.828 | 18.971 | 20.521 | 21.379 | 29.678 | 22.527 | 3.470 |
| miR-192-5p | 20.601 | 24.885 | 17.834 | 24.027 | 18.671 | 21.408 | 19.425 | 19.713 | 23.936 | 21.167 | 2.563 |
| miR-211-5p | 16.568 | 17.604 | 15.181 | 17.976 | 16.704 | 15.435 | 16.419 | 17.368 | 22.462 | 17.302 | 2.146 |
| miR-212-3p | 14.257 | 14.947 | 12.639 | 16.028 | 14.471 | 20.82 | 13.94 | 14.609 | 22.886 | 16.066 | 3.438 |
| miR-221-3p | 19.8 | 30.603 | 16.157 | 23.446 | 18.198 | 17.511 | 18.256 | 19.528 | 18.71 | 20.245 | 4.372 |
| miR-296-5p | 19.405 | 21.089 | 15.01 | 19.641 | 16.887 | 17.988 | 16.437 | 17.111 | 20.606 | 18.242 | 2.058 |
| miR-301a-3p | 19.532 | 23.071 | 15.956 | 21.837 | 17.489 | 27.545 | 17.101 | 18.399 | 23.971 | 20.545 | 3.819 |
| miR-328 | 16.474 | 19.028 | 14.579 | 18.042 | 15.126 | 21.652 | 15.36 | 15.923 | 22.1 | 17.587 | 2.812 |
| miR-331-3p | 16.127 | 18.497 | 12.725 | 17.333 | 13.622 | 18.226 | 14.236 | 15.254 | 21.06 | 16.342 | 2.683 |
| miR-369-3p | 21.945 | 27.602 | 18.699 | 25.399 | 21.518 | 23.821 | 20.73 | 21.763 | 19.457 | 22.326 | 2.841 |
| miR-373-3p | 19.909 | 21.263 | 17.472 | 21.982 | 20.496 | 17.689 | 18.828 | 19.719 | 19.944 | 19.700 | 1.506 |
| miR-365 | 19.141 | 24.593 | 15.782 | 20.998 | 17.907 | 26.623 | 16.523 | 17.53 | 30.747 | 21.094 | 5.145 |
| miR-520b | 22.05 | 21.389 | 20.184 | 23.525 | 22.721 | 33.405 | 21.016 | 21.654 | 12.988 | 22.104 | 5.230 |
| miR-542-3p | 22.391 | 27.024 | 19.535 | 24.99 | 21.464 | 18.687 | 20.502 | 21.687 | 22.607 | 22.099 | 2.605 |
| miR-659-3p | 22.515 | 30.9 | 23.112 | 26.067 | 25.795 | 18.229 | 21.82 | 22.5 | 22.353 | 23.699 | 3.541 |
| miR-758 | 27.024 | 33.204 | 20.866 | 27.259 | 21.531 | 17.753 | 21.544 | 23.32 | 20.466 | 23.663 | 4.709 |
| miR-769-5p | 22.031 | 27.52 | 19.756 | 24.831 | 20.807 | 21.286 | 20.802 | 21.854 | 24.272 | 22.573 | 2.478 |
| miR-362-3p | 24.469 | 27.73 | 21.842 | 27.93 | 23.975 | 30.514 | 23.431 | 24.455 | 28.147 | 25.833 | 2.832 |
| miR-339-3p | 22.62 | 28.911 | 20.67 | 25.379 | 21.062 | 22.864 | 21.405 | 22.889 | 25.914 | 23.524 | 2.705 |
| miR-335-3p | 23.272 | 29.163 | 19.571 | 26.107 | 21.129 | 18.335 | 23.277 | 23.334 | 22.887 | 23.008 | 3.258 |
| miR-345-5p | 19.747 | 24.72 | 17.445 | 22.648 | 18.367 | 21.434 | 18.755 | 19.531 | 27.505 | 21.128 | 3.302 |
| miR-886-5p | 16.516 | 20.772 | 13.932 | 17.941 | 14.419 | 13.708 | 12.258 | 13.314 | 15.626 | 15.387 | 2.665 |
| miR-323-3p | 19.445 | 26.756 | 17.451 | 24.573 | 17.575 | 14.899 | 19.091 | 19.708 | 21.803 | 20.145 | 3.695 |
| miR-151a-3p | 22.117 | 27.1 | 19.211 | 24.539 | 19.054 | 15.677 | 19.737 | 20.356 | 18.396 | 20.687 | 3.432 |
| miR-340-3p | 22.684 | 29.818 | 20.16 | 25.137 | 21.236 | 16.251 | 22.248 | 23.47 | 19.421 | 22.269 | 3.819 |
| miR-342-3p | 18.531 | 22.53 | 15.9 | 20.756 | 15.486 | 29.993 | 18.261 | 18.011 | 32.656 | 21.347 | 6.093 |
| miR-193a-5p | 20.491 | 24.301 | 18.297 | 22.426 | 19.566 | 21.331 | 18.856 | 19.258 | 25.898 | 21.158 | 2.599 |
| miR-138-5p | 17.91 | 21.729 | 15.212 | 19.901 | 16.63 | 17.693 | 15.111 | 16.293 | 34.84 | 19.480 | 6.148 |
| miR-199a-3p | 14.901 | 20.186 | 11.839 | 17.593 | 12.582 | 25.568 | 13.809 | 14.883 | 31 | 18.040 | 6.475 |
| miR-10b-3p | 21.556 | 24.427 | 18.741 | 24.167 | 18.979 | 23.849 | 20.676 | 21.789 | 27.299 | 22.387 | 2.795 |
| miR-483-3p | 20.301 | 22.767 | 19.374 | 21.706 | 18.339 | 23.61 | 19.891 | 20.168 | 31.851 | 22.001 | 4.051 |
| miR-202-3p | 19.543 | 22.099 | 18.483 | 21.209 | 19.729 | 20.273 | 19.692 | 20.053 | 23.314 | 20.488 | 1.477 |
| miR-494 | 19.363 | 30.249 | 18.016 | 26.464 | 19.706 | 22.744 | 19.094 | 19.281 | 23.698 | 22.068 | 4.112 |
| miR-193b-5p | 23.994 | 27.276 | 19.598 | 24.023 | 22.118 | 12.469 | 20.526 | 21.713 | 15.242 | 20.773 | 4.568 |
| miR-543 | 20.536 | 23.678 | 18.092 | 23.71 | 19.499 | 24.266 | 20.128 | 20.697 | 26.157 | 21.863 | 2.666 |
| miR-155-5p | 19.587 | 18.328 | 17.54 | 19.649 | 17.296 | 23.726 | 19.085 | 19.539 | 25.65 | 20.044 | 2.813 |
| miR-1291 | 18.728 | 22.494 | 17.419 | 21.682 | 18.98 | 19.234 | 17.506 | 17.481 | 19.804 | 19.259 | 1.824 |
| miR-1275 | 18.351 | 22.249 | 17.141 | 20.426 | 18.859 | 24.48 | 17.453 | 18.348 | 26.251 | 20.395 | 3.248 |
| miR-720 | 13.064 | 15.841 | 11.024 | 14.008 | 11.498 | 17.967 | 12.458 | 12.451 | 20.048 | 14.262 | 3.079 |
| RNU44 | 15.843 | 18.931 | 12.639 | 17.203 | 13.430 | 14.392 | 14.658 | 15.450 | 17.585 | 15.570 | 2.046 |
Table A4.
miRNA stability ranking in precursor chondrocytes (PC).
| Ranking | Geomean | BestKeeper | geNorm | delta-Ct | NormFinder | |||||
|---|---|---|---|---|---|---|---|---|---|---|
| 1 | RNU44 | 2.63 | miR-769-5p | 0.38 | miR-296-5p | miR-331-3p | 0.25 | RNU44 | 2.4 | miR-26b-5p | 0.452 |
| 2 | miR-335-3p | 3.6 | RNU44 | 0.76 | miR-26a-5p | 2.4 | miR-335-3p | 0.516 | ||
| 3 | miR-26b-5p | 3.81 | miR-335-3p | 0.77 | miR-26a-5p | 0.456 | miR-26b-5p | 2.41 | miR-345-5p | 0.594 |
| 4 | miR-26a-5p | 4.26 | miR-16-5p | 0.8 | miR-16-5p | 0.629 | miR-335-3p | 2.42 | RNU44 | 0.597 |
| 5 | miR-16-5p | 4.68 | miR-211-5p | 0.81 | miR-26b-5p | 0.711 | miR-16-5p | 2.42 | miR-26a-5p | 0.785 |
| 6 | miR-769-5p | 4.88 | miR-323-3p | 0.9 | RNU44 | 0.755 | miR-323-3p | 2.47 | miR-16-5p | 0.798 |
| 7 | miR-331-3p | 5.49 | miR-543 | 0.91 | miR-335-3p | 0.789 | miR-331-3p | 2.47 | miR-769-5p | 0.832 |
| 8 | miR-296-5p | 6.53 | miR-193a-5p | 0.95 | miR-323-3p | 0.809 | miR-193a-5p | 2.48 | miR-193a-5p | 0.96 |
| 9 | miR-323-3p | 7.14 | miR-155-5p | 0.96 | miR-769-5p | 0.875 | miR-769-5p | 2.48 | miR-323-3p | 0.97 |
| 10 | miR-345-5p | 7.75 | miR-345-5p | 0.97 | miR-342-3p | 0.954 | miR-345-5p | 2.52 | miR-331-3p | 1.055 |
| 11 | miR-193a-5p | 9.51 | miR-26a-5p | 0.98 | miR-543 | 1.003 | miR-296-5p | 2.55 | miR-296-5p | 1.217 |
| 12 | miR-543 | 11.25 | miR-342-3p | 0.99 | miR-345-5p | 1.043 | miR-1291 | 2.62 | miR-369-3p | 1.255 |
| 13 | miR-211-5p | 12.83 | miR-331-3p | 1 | miR-155-5p | 1.092 | miR-543 | 2.66 | miR-1291 | 1.272 |
| 14 | miR-342-3p | 13.23 | miR-26b-5p | 1.08 | miR-30d-5p | 1.14 | miR-190a | 2.66 | miR-30d-5p | 1.41 |
| 15 | miR-155-5p | 14.71 | miR-296-5p | 1.1 | miR-369-3p | 1.184 | miR-342-3p | 2.69 | miR-211-5p | 1.426 |
| 16 | miR-30d-5p | 15.2 | miR-30d-5p | 1.17 | miR-193a-5p | 1.23 | miR-369-3p | 2.72 | miR-543 | 1.458 |
| 17 | miR-1291 | 15.2 | miR-520b | 1.2 | miR-190a | 1.295 | miR-30d-5p | 2.72 | miR-342-3p | 1.462 |
| 18 | miR-369-3p | 15.87 | miR-190a | 1.26 | miR-1291 | 1.347 | miR-542-3p | 2.74 | miR-190a | 1.487 |
| 19 | miR-190a | 16.66 | miR-1291 | 1.3 | miR-211-5p | 1.397 | miR-211-5p | 2.78 | miR-542-3p | 1.647 |
| 20 | miR-542-3p | 20.34 | miR-328 | 1.33 | miR-542-3p | 1.443 | miR-155-5p | 2.8 | miR-155-5p | 1.712 |
| 21 | miR-138-5p | 22.15 | miR-202-3p | 1.36 | miR-138-5p | 1.477 | miR-138-5p | 2.81 | miR-138-5p | 1.792 |
| 22 | miR-328 | 22.2 | miR-369-3p | 1.4 | miR-10b-3p | 1.537 | miR-328 | 2.94 | miR-494 | 1.87 |
| 23 | miR-520b | 23.07 | miR-483-3p | 1.43 | miR-328 | 1.588 | miR-25-3p | 2.95 | miR-520b | 1.908 |
| 24 | miR-10b-3p | 23.96 | miR-10b-3p | 1.44 | miR-483-3p | 1.634 | miR-10b-3p | 3 | miR-328 | 1.914 |
| 25 | miR-494 | 25.17 | miR-542-3p | 1.49 | miR-520b | 1.675 | miR-758 | 3 | miR-202-3p | 1.957 |
| 26 | miR-483-3p | 26.09 | miR-138-5p | 1.49 | miR-494 | 1.715 | miR-494 | 3.03 | miR-10b-3p | 2.034 |
| 27 | miR-202-3p | 26.86 | miR-494 | 1.51 | miR-25-3p | 1.761 | miR-151a-3p | 3.06 | miR-758 | 2.059 |
| 28 | miR-25-3p | 26.87 | miR-373-3p | 1.78 | miR-373-3p | 1.805 | miR-483-3p | 3.06 | miR-25-3p | 2.106 |
| 29 | miR-758 | 27.45 | miR-758 | 1.78 | miR-758 | 1.847 | miR-520b | 3.06 | miR-151a-3p | 2.153 |
| 30 | miR-373-3p | 29.22 | miR-25-3p | 1.8 | miR-151a-3p | 1.887 | miR-373-3p | 3.14 | miR-483-3p | 2.154 |
| 31 | miR-151a-3p | 29.44 | miR-365 | 1.81 | miR-340-3p | 1.934 | miR-202-3p | 3.23 | miR-373-3p | 2.258 |
| 32 | miR-340-3p | 32.24 | miR-151a-3p | 1.9 | miR-202-3p | 1.983 | miR-340-3p | 3.28 | miR-365 | 2.544 |
| 33 | miR-365 | 32.95 | miR-340-3p | 2.14 | miR-221-3p | 2.037 | miR-365 | 3.35 | miR-340-3p | 2.567 |
| 34 | miR-221-3p | 34.73 | miR-1275 | 2.35 | miR-339-3p | 2.086 | miR-339-3p | 3.54 | miR-339-3p | 2.878 |
| 35 | miR-339-3p | 34.96 | miR-301a-3p | 2.36 | miR-19a-3p | 2.134 | miR-221-3p | 3.58 | miR-221-3p | 2.952 |
| 36 | miR-301a-3p | 36.49 | miR-221-3p | 2.39 | miR-365 | 2.186 | miR-19a-3p | 3.67 | miR-19a-3p | 3.098 |
| 37 | miR-19a-3p | 36.7 | miR-720 | 2.41 | miR-301a-3p | 2.262 | miR-301a-3p | 3.88 | miR-301a-3p | 3.339 |
| 38 | miR-1275 | 36.96 | miR-339-3p | 2.44 | miR-1275 | 2.332 | miR-1275 | 3.92 | miR-1275 | 3.346 |
| 39 | miR-720 | 38.49 | miR-192-5p | 2.6 | miR-720 | 2.399 | miR-720 | 4.08 | miR-720 | 3.574 |
| 40 | miR-362-3p | 40.5 | miR-19a-3p | 2.62 | miR-362-3p | 2.472 | miR-362-3p | 4.26 | miR-192-5p | 3.659 |
| 41 | miR-192-5p | 40.72 | miR-362-3p | 2.76 | miR-193b-5p | 2.562 | miR-192-5p | 4.5 | miR-362-3p | 3.775 |
| 42 | miR-193b-5p | 41.75 | miR-193b-5p | 3.49 | miR-659-3p | 2.652 | miR-193b-5p | 4.57 | miR-193b-5p | 4.137 |
| 43 | miR-659-3p | 42.75 | miR-659-3p | 3.52 | miR-192-5p | 2.739 | miR-659-3p | 4.79 | miR-659-3p | 4.331 |
| 44 | miR-199a-3p | 44 | miR-199a-3p | 4.01 | miR-199a-3p | 2.862 | miR-199a-3p | 5.67 | miR-199a-3p | 5.386 |
| 45 | miR-886-5p | 45 | miR-886-5p | 4.06 | miR-886-5p | 3.044 | miR-886-5p | 6.78 | miR-886-5p | 6.388 |
| 46 | miR-212-3p | 46.25 | miR-99b-5p | 4.17 | miR-212-3p | 3.212 | miR-212-3p | 6.85 | miR-212-3p | 6.407 |
| 47 | miR-99b-5p | 46.75 | miR-212-3p | 5.25 | miR-99b-5p | 3.367 | miR-99b-5p | 6.85 | miR-99b-5p | 6.463 |
Table A5.
miRNA stability ranking in differentiated chondrocytes (DC).
| Ranking | Geomean | BestKeeper | geNorm | delta-Ct | NormFinder | |||||
|---|---|---|---|---|---|---|---|---|---|---|
| 1 | miR-331-3p | 2.63 | miR-202-3p | 0.64 | miR-16-5p | miR-26a-5p | 0.302 | miR-331-3p | 1.61 | miR-331-3p | 0.179 |
| 2 | miR-26a-5p | 2.74 | miR-373-3p | 0.99 | miR-26a-5p | 1.63 | miR-26a-5p | 0.309 | ||
| 3 | miR-16-5p | 3.66 | miR-1291 | 1.05 | miR-30d-5p | 0.366 | miR-16-5p | 1.65 | miR-30d-5p | 0.398 |
| 4 | miR-30d-5p | 4.97 | miR-211-5p | 1.09 | miR-331-3p | 0.421 | miR-30d-5p | 1.66 | miR-16-5p | 0.414 |
| 5 | miR-296-5p | 6.51 | miR-769-5p | 1.18 | miR-26b-5p | 0.493 | miR-296-5p | 1.67 | miR-26b-5p | 0.474 |
| 6 | RNU44 | 6.96 | miR-155-5p | 1.26 | miR-296-5p | 0.564 | RNU44 | 1.68 | miR-296-5p | 0.492 |
| 7 | miR-769-5p | 7.09 | miR-193a-5p | 1.29 | RNU44 | 0.614 | miR-769-5p | 1.68 | RNU44 | 0.542 |
| 8 | miR-193a-5p | 8.21 | RNU44 | 1.3 | miR-769-5p | 0.652 | miR-26b-5p | 1.69 | miR-193a-5p | 0.574 |
| 9 | miR-26b-5p | 8.65 | miR-542-3p | 1.32 | miR-193a-5p | 0.692 | miR-193a-5p | 1.72 | miR-769-5p | 0.604 |
| 10 | miR-202-3p | 11.73 | miR-296-5p | 1.36 | miR-138-5p | 0.75 | miR-345-5p | 1.79 | miR-345-5p | 0.776 |
| 11 | miR-373-3p | 13.03 | miR-1275 | 1.36 | miR-345-5p | 0.798 | miR-138-5p | 1.82 | miR-369-3p | 0.832 |
| 12 | miR-155-5p | 13.07 | miR-331-3p | 1.42 | miR-543 | 0.832 | miR-369-3p | 1.83 | miR-138-5p | 0.848 |
| 13 | miR-138-5p | 13.34 | miR-190a | 1.44 | miR-369-3p | 0.858 | miR-543 | 1.83 | miR-323-3p | 0.871 |
| 14 | miR-345-5p | 13.7 | miR-26a-5p | 1.49 | miR-323-3p | 0.886 | miR-542-3p | 1.85 | miR-543 | 0.89 |
| 15 | miR-1291 | 14.39 | miR-16-5p | 1.5 | miR-155-5p | 0.928 | miR-323-3p | 1.85 | miR-192-5p | 1.013 |
| 16 | miR-543 | 14.63 | miR-25-3p | 1.51 | miR-494 | 0.968 | miR-335-3p | 1.88 | miR-335-3p | 1.029 |
| 17 | miR-542-3p | 14.9 | miR-30d-5p | 1.52 | miR-10b-3p | 1.006 | miR-192-5p | 1.93 | miR-542-3p | 1.078 |
| 18 | miR-369-3p | 15.77 | miR-335-3p | 1.53 | miR-1275 | 1.04 | miR-155-5p | 1.96 | miR-155-5p | 1.086 |
| 19 | miR-323-3p | 15.83 | miR-340-3p | 1.57 | miR-328 | 1.069 | miR-494 | 1.99 | miR-494 | 1.141 |
| 20 | miR-1275 | 16.98 | miR-328 | 1.58 | miR-301a-3p | 1.095 | miR-190a | 2.02 | miR-1275 | 1.243 |
| 21 | miR-335-3p | 17.64 | miR-543 | 1.6 | miR-335-3p | 1.13 | miR-1275 | 2.04 | miR-190a | 1.245 |
| 22 | miR-190a | 19.03 | miR-758 | 1.63 | miR-192-5p | 1.161 | miR-1291 | 2.04 | miR-10b-3p | 1.301 |
| 23 | miR-211-5p | 20.06 | miR-323-3p | 1.68 | miR-542-3p | 1.192 | miR-328 | 2.05 | miR-328 | 1.31 |
| 24 | miR-192-5p | 20.25 | miR-339-3p | 1.69 | miR-190a | 1.228 | miR-373-3p | 2.05 | miR-373-3p | 1.335 |
| 25 | miR-494 | 21.05 | miR-138-5p | 1.69 | miR-373-3p | 1.265 | miR-10b-3p | 2.06 | miR-1291 | 1.376 |
| 26 | miR-328 | 21.17 | miR-151a-3p | 1.71 | miR-1291 | 1.298 | miR-301a-3p | 2.13 | miR-202-3p | 1.399 |
| 27 | miR-10b-3p | 24.73 | miR-886-5p | 1.76 | miR-202-3p | 1.331 | miR-202-3p | 2.13 | miR-99b-5p | 1.422 |
| 28 | miR-25-3p | 25.42 | miR-26b-5p | 1.77 | miR-99b-5p | 1.362 | miR-339-3p | 2.17 | miR-301a-3p | 1.466 |
| 29 | miR-301a-3p | 27.27 | miR-483-3p | 1.81 | miR-339-3p | 1.396 | miR-25-3p | 2.17 | miR-339-3p | 1.607 |
| 30 | miR-339-3p | 27.7 | miR-19a-3p | 1.83 | miR-25-3p | 1.426 | miR-99b-5p | 2.2 | miR-25-3p | 1.669 |
| 31 | miR-340-3p | 29.6 | miR-192-5p | 1.83 | miR-151a-3p | 1.454 | miR-151a-3p | 2.2 | miR-151a-3p | 1.726 |
| 32 | miR-151a-3p | 29.67 | miR-659-3p | 1.83 | miR-758 | 1.487 | miR-758 | 2.34 | miR-720 | 1.75 |
| 33 | miR-758 | 29.8 | miR-345-5p | 1.83 | miR-340-3p | 1.515 | miR-720 | 2.34 | miR-886-5p | 1.884 |
| 34 | miR-99b-5p | 30.27 | miR-494 | 1.88 | miR-211-5p | 1.541 | miR-340-3p | 2.35 | miR-211-5p | 1.893 |
| 35 | miR-886-5p | 32.55 | miR-720 | 1.91 | miR-886-5p | 1.57 | miR-211-5p | 2.37 | miR-758 | 1.934 |
| 36 | miR-720 | 34.43 | miR-99b-5p | 1.94 | miR-221-3p | 1.602 | miR-886-5p | 2.46 | miR-340-3p | 1.945 |
| 37 | miR-483-3p | 35.74 | miR-369-3p | 1.94 | miR-19a-3p | 1.632 | miR-483-3p | 2.52 | miR-362-3p | 1.973 |
| 38 | miR-19a-3p | 36.81 | miR-301a-3p | 1.98 | miR-720 | 1.663 | miR-362-3p | 2.54 | miR-483-3p | 2.002 |
| 39 | miR-221-3p | 38.71 | miR-193b-5p | 2.03 | miR-362-3p | 1.702 | miR-221-3p | 2.58 | miR-221-3p | 2.162 |
| 40 | miR-362-3p | 39.41 | miR-10b-3p | 2.12 | miR-483-3p | 1.739 | miR-19a-3p | 2.63 | miR-19a-3p | 2.322 |
| 41 | miR-659-3p | 40.48 | miR-221-3p | 2.16 | miR-365 | 1.802 | miR-365 | 3.05 | miR-365 | 2.738 |
| 42 | miR-365 | 41.49 | miR-520b | 2.35 | miR-193b-5p | 1.882 | miR-520b | 3.58 | miR-520b | 3.301 |
| 43 | miR-193b-5p | 42.19 | miR-365 | 2.39 | miR-659-3p | 1.958 | miR-193b-5p | 3.75 | miR-659-3p | 3.54 |
| 44 | miR-520b | 42.49 | miR-362-3p | 2.55 | miR-520b | 2.035 | miR-659-3p | 3.77 | miR-212-3p | 3.565 |
| 45 | miR-342-3p | 45.25 | miR-342-3p | 3.03 | miR-342-3p | 2.118 | miR-342-3p | 3.82 | miR-193b-5p | 3.603 |
| 46 | miR-212-3p | 45.74 | miR-199a-3p | 3.09 | miR-212-3p | 2.196 | miR-212-3p | 3.9 | miR-342-3p | 3.64 |
| 47 | miR-199a-3p | 46.75 | miR-212-3p | 3.42 | miR-199a-3p | 2.282 | miR-199a-3p | 4.22 | miR-199a-3p | 4.076 |
Table A6.
miRNA stability ranking in hypertrophic chondrocytes (HYP).
| Ranking | Geomean | BestKeeper | geNorm | delta-Ct | NormFinder | |||||
|---|---|---|---|---|---|---|---|---|---|---|
| 1 | miR-26a-5p | 2.89 | miR-373-3p | 1.14 | miR-331-3p | miR-10b-3p | 0.512 | miR-26a-5p | 2.33 | miR-26a-5p | 0.274 |
| 2 | miR-192-5p | 4.68 | miR-202-3p | 1.15 | miR-192-5p | 2.36 | miR-192-5p | 0.28 | ||
| 3 | miR-26b-5p | 5.63 | miR-211-5p | 1.38 | miR-543 | 0.573 | miR-30d-5p | 2.38 | miR-30d-5p | 0.414 |
| 4 | miR-30d-5p | 6.43 | miR-1291 | 1.38 | miR-99b-5p | 0.669 | miR-26b-5p | 2.4 | miR-26b-5p | 0.512 |
| 5 | miR-331-3p | 6.72 | RNU44 | 1.62 | miR-26a-5p | 0.76 | miR-769-5p | 2.42 | miR-296-5p | 0.634 |
| 6 | miR-296-5p | 6.93 | miR-296-5p | 1.73 | miR-193a-5p | 0.818 | miR-193a-5p | 2.43 | miR-339-3p | 0.668 |
| 7 | miR-10b-3p | 7.57 | miR-26b-5p | 1.82 | miR-345-5p | 0.863 | miR-296-5p | 2.44 | RNU44 | 0.708 |
| 8 | RNU44 | 7.61 | miR-25-3p | 1.84 | miR-192-5p | 0.94 | RNU44 | 2.44 | miR-769-5p | 0.722 |
| 9 | miR-202-3p | 7.9 | miR-542-3p | 1.92 | miR-26b-5p | 0.996 | miR-339-3p | 2.45 | miR-193a-5p | 0.73 |
| 10 | miR-193a-5p | 8.06 | miR-769-5p | 1.98 | miR-30d-5p | 1.03 | miR-331-3p | 2.53 | miR-202-3p | 1.052 |
| 11 | miR-769-5p | 8.65 | miR-155-5p | 2.06 | miR-296-5p | 1.077 | miR-543 | 2.57 | miR-1291 | 1.086 |
| 12 | miR-373-3p | 9.56 | miR-886-5p | 2.07 | RNU44 | 1.125 | miR-10b-3p | 2.57 | miR-331-3p | 1.138 |
| 13 | miR-1291 | 9.96 | miR-193a-5p | 2.07 | miR-339-3p | 1.163 | miR-202-3p | 2.58 | miR-10b-3p | 1.198 |
| 14 | miR-543 | 10.04 | miR-26a-5p | 2.13 | miR-769-5p | 1.193 | miR-1291 | 2.59 | miR-543 | 1.21 |
| 15 | miR-339-3p | 10.29 | miR-192-5p | 2.13 | miR-202-3p | 1.224 | miR-99b-5p | 2.64 | miR-345-5p | 1.355 |
| 16 | miR-99b-5p | 12.45 | miR-339-3p | 2.14 | miR-1291 | 1.273 | miR-345-5p | 2.67 | miR-99b-5p | 1.364 |
| 17 | miR-211-5p | 13.21 | miR-331-3p | 2.17 | miR-328 | 1.337 | miR-542-3p | 2.78 | miR-886-5p | 1.652 |
| 18 | miR-345-5p | 15.23 | miR-30d-5p | 2.19 | miR-720 | 1.394 | miR-886-5p | 2.84 | miR-542-3p | 1.692 |
| 19 | miR-542-3p | 16.03 | miR-369-3p | 2.19 | miR-362-3p | 1.444 | miR-328 | 2.87 | miR-373-3p | 1.798 |
| 20 | miR-886-5p | 17.05 | miR-335-3p | 2.25 | miR-1275 | 1.491 | miR-373-3p | 2.94 | miR-362-3p | 1.816 |
| 21 | miR-25-3p | 19.89 | miR-10b-3p | 2.27 | miR-211-5p | 1.54 | miR-362-3p | 2.96 | miR-211-5p | 1.827 |
| 22 | miR-328 | 20.11 | miR-543 | 2.3 | miR-373-3p | 1.607 | miR-720 | 2.97 | miR-328 | 1.832 |
| 23 | miR-362-3p | 21.34 | miR-328 | 2.33 | miR-886-5p | 1.668 | miR-211-5p | 2.98 | miR-720 | 2.024 |
| 24 | miR-720 | 22.27 | miR-19a-3p | 2.36 | miR-542-3p | 1.718 | miR-1275 | 3.05 | miR-1275 | 2.139 |
| 25 | miR-369-3p | 24.39 | miR-99b-5p | 2.37 | miR-190a | 1.777 | miR-25-3p | 3.18 | miR-494 | 2.212 |
| 26 | miR-155-5p | 24.5 | miR-362-3p | 2.44 | miR-369-3p | 1.853 | miR-335-3p | 3.22 | miR-190a | 2.216 |
| 27 | miR-1275 | 24.83 | miR-720 | 2.46 | miR-25-3p | 1.919 | miR-190a | 3.25 | miR-369-3p | 2.253 |
| 28 | miR-335-3p | 25.93 | miR-190a | 2.51 | miR-494 | 1.979 | miR-369-3p | 3.26 | miR-16-5p | 2.366 |
| 29 | miR-190a | 26.48 | miR-212-3p | 2.57 | miR-335-3p | 2.037 | miR-16-5p | 3.28 | miR-25-3p | 2.37 |
| 30 | miR-494 | 30.46 | miR-659-3p | 2.59 | miR-323-3p | 2.087 | miR-494 | 3.28 | miR-335-3p | 2.427 |
| 31 | miR-16-5p | 30.85 | miR-151a-3p | 2.6 | miR-16-5p | 2.132 | miR-323-3p | 3.28 | miR-323-3p | 2.446 |
| 32 | miR-323-3p | 32.14 | miR-345-5p | 2.62 | miR-155-5p | 2.185 | miR-155-5p | 3.48 | miR-155-5p | 2.705 |
| 33 | miR-212-3p | 32.67 | miR-1275 | 2.63 | miR-301a-3p | 2.236 | miR-301a-3p | 3.54 | miR-301a-3p | 2.709 |
| 34 | miR-19a-3p | 33.43 | miR-340-3p | 2.67 | miR-212-3p | 2.284 | miR-212-3p | 3.58 | miR-212-3p | 2.914 |
| 35 | miR-151a-3p | 34.44 | miR-483-3p | 2.72 | miR-483-3p | 2.334 | miR-151a-3p | 3.6 | miR-483-3p | 3.007 |
| 36 | miR-301a-3p | 34.63 | miR-16-5p | 2.8 | miR-151a-3p | 2.395 | miR-483-3p | 3.68 | miR-151a-3p | 3.035 |
| 37 | miR-483-3p | 35.25 | miR-323-3p | 2.82 | miR-19a-3p | 2.452 | miR-19a-3p | 3.71 | miR-221-3p | 3.095 |
| 38 | miR-659-3p | 36.52 | miR-520b | 2.96 | miR-221-3p | 2.506 | miR-221-3p | 3.76 | miR-19a-3p | 3.15 |
| 39 | miR-221-3p | 37.99 | miR-221-3p | 3.01 | miR-659-3p | 2.559 | miR-659-3p | 3.87 | miR-659-3p | 3.267 |
| 40 | miR-340-3p | 38.41 | miR-301a-3p | 3.17 | miR-340-3p | 2.613 | miR-340-3p | 3.98 | miR-340-3p | 3.529 |
| 41 | miR-365 | 41.97 | miR-494 | 3.31 | miR-365 | 2.683 | miR-365 | 4.17 | miR-365 | 3.631 |
| 42 | miR-758 | 42.25 | miR-193b-5p | 3.39 | miR-758 | 2.753 | miR-758 | 4.45 | miR-758 | 4.031 |
| 43 | miR-193b-5p | 42.99 | miR-758 | 3.67 | miR-193b-5p | 2.849 | miR-193b-5p | 5.18 | miR-138-5p | 4.816 |
| 44 | miR-138-5p | 43.75 | miR-138-5p | 4.01 | miR-138-5p | 2.956 | miR-138-5p | 5.26 | miR-193b-5p | 4.893 |
| 45 | miR-520b | 44.57 | miR-365 | 4.15 | miR-342-3p | 3.061 | miR-342-3p | 5.28 | miR-342-3p | 4.979 |
| 46 | miR-342-3p | 45.25 | miR-342-3p | 4.7 | miR-199a-3p | 3.162 | miR-199a-3p | 5.45 | miR-199a-3p | 5.161 |
| 47 | miR-199a-3p | 46.25 | miR-199a-3p | 5.03 | miR-520b | 3.309 | miR-520b | 6.63 | miR-520b | 6.208 |
Table A7.
miRNA stability ranking in all samples (ALL).
| Ranking | Geomean | BestKeeper | geNorm | delta-Ct | NormFinder | |||||
|---|---|---|---|---|---|---|---|---|---|---|
| 1 | miR-26a-5p | 1.86 | miR-202-3p | 1.04 | miR-26a-5p | miR-331-3p | 0.579 | miR-26a-5p | 2.3 | miR-26a-5p | 0.555 |
| 2 | RNU44 | 3.31 | miR-211-5p | 1.06 | RNU44 | 2.32 | miR-26b-5p | 0.56 | ||
| 3 | miR-26b-5p | 3.98 | miR-1291 | 1.25 | miR-26b-5p | 0.714 | miR-26b-5p | 2.33 | RNU44 | 0.591 |
| 4 | miR-769-5p | 4.68 | RNU44 | 1.28 | miR-296-5p | 0.771 | miR-769-5p | 2.35 | miR-769-5p | 0.698 |
| 5 | miR-331-3p | 5.19 | miR-769-5p | 1.31 | RNU44 | 0.858 | miR-296-5p | 2.4 | miR-30d-5p | 0.823 |
| 6 | miR-296-5p | 6.12 | miR-373-3p | 1.37 | miR-769-5p | 0.93 | miR-30d-5p | 2.4 | miR-193a-5p | 0.836 |
| 7 | miR-30d-5p | 6.59 | miR-155-5p | 1.51 | miR-30d-5p | 0.97 | miR-331-3p | 2.42 | miR-296-5p | 0.897 |
| 8 | miR-193a-5p | 7.44 | miR-193a-5p | 1.52 | miR-193a-5p | 1.019 | miR-193a-5p | 2.42 | miR-331-3p | 0.921 |
| 9 | miR-1291 | 9.12 | miR-30d-5p | 1.57 | miR-345-5p | 1.09 | miR-345-5p | 2.48 | miR-345-5p | 0.98 |
| 10 | miR-202-3p | 9.41 | miR-296-5p | 1.59 | miR-543 | 1.139 | miR-543 | 2.55 | miR-543 | 1.254 |
| 11 | miR-211-5p | 10.81 | miR-542-3p | 1.65 | miR-10b-3p | 1.207 | miR-542-3p | 2.58 | miR-542-3p | 1.434 |
| 12 | miR-345-5p | 10.99 | miR-26a-5p | 1.67 | miR-323-3p | 1.306 | miR-1291 | 2.69 | miR-1291 | 1.447 |
| 13 | miR-543 | 11.58 | miR-331-3p | 1.69 | miR-16-5p | 1.375 | miR-10b-3p | 2.7 | miR-10b-3p | 1.551 |
| 14 | miR-542-3p | 11.68 | miR-26b-5p | 1.74 | miR-542-3p | 1.433 | miR-16-5p | 2.75 | miR-369-3p | 1.557 |
| 15 | miR-373-3p | 14.56 | miR-369-3p | 1.8 | miR-190a | 1.493 | miR-323-3p | 2.76 | miR-16-5p | 1.592 |
| 16 | miR-10b-3p | 15.37 | miR-328 | 1.83 | miR-1291 | 1.552 | miR-328 | 2.78 | miR-323-3p | 1.625 |
| 17 | miR-16-5p | 15.47 | miR-25-3p | 1.85 | miR-373-3p | 1.605 | miR-369-3p | 2.8 | miR-202-3p | 1.656 |
| 18 | miR-323-3p | 16.21 | miR-190a | 1.86 | miR-211-5p | 1.648 | miR-190a | 2.81 | miR-190a | 1.665 |
| 19 | miR-369-3p | 16.55 | miR-543 | 1.86 | miR-25-3p | 1.694 | miR-211-5p | 2.84 | miR-328 | 1.671 |
| 20 | miR-155-5p | 17.27 | miR-345-5p | 1.89 | miR-339-3p | 1.735 | miR-373-3p | 2.85 | miR-211-5p | 1.702 |
| 21 | miR-190a | 17.43 | miR-16-5p | 1.92 | miR-369-3p | 1.774 | miR-202-3p | 2.86 | miR-494 | 1.805 |
| 22 | miR-328 | 18.29 | miR-151a-3p | 2.01 | miR-202-3p | 1.813 | miR-25-3p | 2.92 | miR-373-3p | 1.811 |
| 23 | miR-25-3p | 20.53 | miR-339-3p | 2.02 | miR-328 | 1.857 | miR-155-5p | 2.93 | miR-155-5p | 1.893 |
| 24 | miR-339-3p | 22.69 | miR-323-3p | 2.09 | miR-155-5p | 1.892 | miR-339-3p | 2.94 | miR-339-3p | 1.953 |
| 25 | miR-494 | 25.65 | miR-340-3p | 2.09 | miR-494 | 1.933 | miR-494 | 2.94 | miR-25-3p | 2.064 |
| 26 | miR-151a-3p | 25.87 | miR-19a-3p | 2.13 | miR-335-3p | 1.973 | miR-151a-3p | 3.09 | miR-192-5p | 2.114 |
| 27 | miR-192-5p | 28.41 | miR-192-5p | 2.16 | miR-151a-3p | 2.011 | miR-335-3p | 3.13 | miR-335-3p | 2.214 |
| 28 | miR-335-3p | 28.54 | miR-520b | 2.19 | miR-340-3p | 2.058 | miR-1275 | 3.15 | miR-1275 | 2.287 |
| 29 | miR-340-3p | 29.31 | miR-1275 | 2.24 | miR-19a-3p | 2.104 | miR-192-5p | 3.17 | miR-151a-3p | 2.321 |
| 30 | miR-1275 | 29.43 | miR-10b-3p | 2.26 | miR-221-3p | 2.144 | miR-720 | 3.28 | miR-720 | 2.476 |
| 31 | miR-19a-3p | 31 | miR-720 | 2.26 | miR-758 | 2.186 | miR-340-3p | 3.33 | miR-362-3p | 2.508 |
| 32 | miR-720 | 31.21 | miR-758 | 2.32 | miR-192-5p | 2.226 | miR-362-3p | 3.33 | miR-301a-3p | 2.62 |
| 33 | miR-221-3p | 32.71 | miR-494 | 2.38 | miR-1275 | 2.276 | miR-301a-3p | 3.38 | miR-221-3p | 2.674 |
| 34 | miR-758 | 33.9 | miR-221-3p | 2.44 | miR-720 | 2.324 | miR-221-3p | 3.4 | miR-340-3p | 2.683 |
| 35 | miR-362-3p | 34.11 | miR-335-3p | 2.49 | miR-362-3p | 2.369 | miR-19a-3p | 3.43 | miR-19a-3p | 2.819 |
| 36 | miR-301a-3p | 35.12 | miR-886-5p | 2.59 | miR-301a-3p | 2.412 | miR-758 | 3.54 | miR-483-3p | 2.831 |
| 37 | miR-483-3p | 37.93 | miR-659-3p | 2.61 | miR-483-3p | 2.46 | miR-483-3p | 3.57 | miR-758 | 2.889 |
| 38 | miR-138-5p | 38.75 | miR-138-5p | 2.65 | miR-365 | 2.516 | miR-365 | 3.69 | miR-365 | 3.023 |
| 39 | miR-365 | 39.42 | miR-362-3p | 2.69 | miR-138-5p | 2.574 | miR-138-5p | 3.91 | miR-138-5p | 3.156 |
| 40 | miR-659-3p | 39.47 | miR-301a-3p | 2.78 | miR-659-3p | 2.643 | miR-659-3p | 4.24 | miR-99b-5p | 3.645 |
| 41 | miR-520b | 39.97 | miR-99b-5p | 2.79 | miR-342-3p | 2.716 | miR-342-3p | 4.32 | miR-659-3p | 3.731 |
| 42 | miR-99b-5p | 41.24 | miR-483-3p | 2.8 | miR-99b-5p | 2.79 | miR-99b-5p | 4.32 | miR-342-3p | 3.774 |
| 43 | miR-886-5p | 41.61 | miR-193b-5p | 2.98 | miR-193b-5p | 2.865 | miR-193b-5p | 4.6 | miR-886-5p | 4.167 |
| 44 | miR-342-3p | 42.22 | miR-365 | 3.01 | miR-886-5p | 2.946 | miR-886-5p | 4.74 | miR-193b-5p | 4.199 |
| 45 | miR-193b-5p | 43.25 | miR-342-3p | 3.28 | miR-520b | 3.031 | miR-520b | 4.89 | miR-520b | 4.31 |
| 46 | miR-199a-3p | 46.25 | miR-212-3p | 3.89 | miR-199a-3p | 3.121 | miR-199a-3p | 5.09 | miR-199a-3p | 4.736 |
| 47 | miR-212-3p | 46.75 | miR-199a-3p | 4.31 | miR-212-3p | 3.212 | miR-212-3p | 5.28 | miR-212-3p | 4.787 |
References
- Gebert, L.F.R.; MacRae, I.J. Regulation of microRNA function in animals. Nat. Rev. Mol. Cell Biol. 2019, 20, 21–37. [Google Scholar] [CrossRef] [PubMed]
- O’Brien, J.; Hayder, H.; Zayed, Y.; Peng, C. Overview of MicroRNA Biogenesis, Mechanisms of Actions, and Circulation. Front. Endocrinol. (Lausanne) 2018, 9, 402. [Google Scholar] [CrossRef] [PubMed] [Green Version]
- Ha, M.; Kim, V.N. Regulation of microRNA biogenesis. Nat. Rev. Mol. Cell Biol. 2014, 15, 509–524. [Google Scholar] [CrossRef] [PubMed]
- Alles, J.; Fehlmann, T.; Fischer, U.; Backes, C.; Galata, V.; Minet, M.; Hart, M.; Abu-Halima, M.; Grässer, F.A.; Lenhof, H.P.; et al. An estimate of the total number of true human miRNAs. Nucleic Acids Res. 2019, 47, 3353–3364. [Google Scholar] [CrossRef] [PubMed] [Green Version]
- Alberti, C.; Cochella, L. A framework for understanding the roles of miRNAs in animal development. Development 2017, 144, 2548–2559. [Google Scholar] [CrossRef] [Green Version]
- Rajman, M.; Schratt, G. MicroRNAs in neural development: from master regulators to fine-tuners. Development 2017, 144, 2310–2322. [Google Scholar] [CrossRef] [Green Version]
- Taverna, E.; Götz, M.; Huttner, W.B. The cell biology of neurogenesis: toward an understanding of the development and evolution of the neocortex. Annu. Rev. Cell Dev. Biol. 2014, 30, 465–502. [Google Scholar] [CrossRef]
- Papaioannou, G. miRNAs in Bone Development. Curr. Genomics 2015, 16, 427–434. [Google Scholar] [CrossRef] [Green Version]
- Mirzamohammadi, F.; Papaioannou, G.; Kobayashi, T. MicroRNAs in cartilage development, homeostasis, and disease. Curr. Osteoporos. Rep. 2014, 12, 410–419. [Google Scholar] [CrossRef]
- Liu, C.F.; Samsa, W.E.; Zhou, G.; Lefebvre, V. Transcriptional control of chondrocyte specification and differentiation. Semin. Cell Dev. Biol. 2017, 62, 34–49. [Google Scholar] [CrossRef]
- Nishimura, R.; Hata, K.; Takahata, Y.; Murakami, T.; Nakamura, E.; Yagi, H. Regulation of Cartilage Development and Diseases by Transcription Factors. J. Bone Metab. 2017, 24, 147–153. [Google Scholar] [CrossRef] [PubMed] [Green Version]
- Papaioannou, G.; Inloes, J.B.; Nakamura, Y.; Paltrinieri, E.; Kobayashi, T. let-7 and miR-140 microRNAs coordinately regulate skeletal development. Proc. Natl. Acad. Sci. USA 2013, 110, E3291–3300. [Google Scholar] [CrossRef] [PubMed]
- Yang, J.; Qin, S.; Yi, C.; Ma, G.; Zhu, H.; Zhou, W.; Xiong, Y.; Zhu, X.; Wang, Y.; He, L.; et al. MiR-140 is co-expressed with Wwp2-C transcript and activated by Sox9 to target Sp1 in maintaining the chondrocyte proliferation. FEBS Lett. 2011, 585, 2992–2997. [Google Scholar] [CrossRef] [PubMed]
- Nakamura, Y.; Inloes, J.B.; Katagiri, T.; Kobayashi, T. Chondrocyte-specific microRNA-140 regulates endochondral bone development and targets Dnpep to modulate bone morphogenetic protein signaling. Mol. Cell Biol. 2011, 31, 3019–3028. [Google Scholar] [CrossRef] [PubMed]
- McAlinden, A.; Varghese, N.; Wirthlin, L.; Chang, L.W. Differentially expressed microRNAs in chondrocytes from distinct regions of developing human cartilage. PLoS ONE 2013, 8, e75012. [Google Scholar] [CrossRef] [PubMed]
- Pfaffl, M.W.; Tichopad, A.; Prgomet, C.; Neuvians, T.P. Determination of stable housekeeping genes, differentially regulated target genes and sample integrity: BestKeeper--Excel-based tool using pair-wise correlations. Biotechnol. Lett. 2004, 26, 509–515. [Google Scholar] [CrossRef] [PubMed]
- Vandesompele, J.; De Preter, K.; Pattyn, F.; Poppe, B.; Van Roy, N.; De Paepe, A.; Speleman, F. Accurate normalization of real-time quantitative RT-PCR data by geometric averaging of multiple internal control genes. Genome Biol. 2002, 3, RESEARCH0034. [Google Scholar] [CrossRef]
- Andersen, C.L.; Jensen, J.L.; Ørntoft, T.F. Normalization of real-time quantitative reverse transcription-PCR data: a model-based variance estimation approach to identify genes suited for normalization, applied to bladder and colon cancer data sets. Cancer Res. 2004, 64, 5245–5250. [Google Scholar] [CrossRef] [PubMed]
- Silver, N.; Best, S.; Jiang, J.; Thein, S.L. Selection of housekeeping genes for gene expression studies in human reticulocytes using real-time PCR. BMC Mol. Biol. 2006, 7, 33. [Google Scholar] [CrossRef]
- Schwarzenbach, H.; da Silva, A.M.; Calin, G.; Pantel, K. Data Normalization Strategies for MicroRNA Quantification. Clin. Chem. 2015, 61, 1333–1342. [Google Scholar] [CrossRef]
- Kozera, B.; Rapacz, M. Reference genes in real-time PCR. J. Appl. Genet. 2013, 54, 391–406. [Google Scholar] [CrossRef] [Green Version]
- Lee, Y.; Ahn, C.; Han, J.; Choi, H.; Kim, J.; Yim, J.; Lee, J.; Provost, P.; Rådmark, O.; Kim, S.; et al. The nuclear RNase III Drosha initiates microRNA processing. Nature 2003, 425, 415–419. [Google Scholar] [CrossRef] [PubMed]
- Meyer, S.U.; Pfaffl, M.W.; Ulbrich, S.E. Normalization strategies for microRNA profiling experiments: A ’normal’ way to a hidden layer of complexity? Biotechnol. Lett. 2010, 32, 1777–1788. [Google Scholar] [CrossRef] [PubMed]
- Mestdagh, P.; Van Vlierberghe, P.; De Weer, A.; Muth, D.; Westermann, F.; Speleman, F.; Vandesompele, J. A novel and universal method for microRNA RT-qPCR data normalization. Genome Biol. 2009, 10, R64. [Google Scholar] [CrossRef] [PubMed]
- Machado, R.D.; Christoff, A.P.; Loss-Morais, G.; Margis-Pinheiro, M.; Margis, R.; Körbes, A.P. Comprehensive selection of reference genes for quantitative gene expression analysis during seed development in Brassica napus. Plant Cell Rep. 2015, 34, 1139–1149. [Google Scholar] [CrossRef] [PubMed]
- Lin, Y.L.; Lai, Z.X. Evaluation of suitable reference genes for normalization of microRNA expression by real-time reverse transcription PCR analysis during longan somatic embryogenesis. Plant Physiol. Biochem. 2013, 66, 20–25. [Google Scholar] [CrossRef] [PubMed]
- Zhu, X.; Li, Y.L.; Chen, D.X.; Wu, P.; Yi, T.; Chen, T.; Zhang, J.S.; Chu, W.Y. Selection of reference genes for microRNA quantitative expression analysis in Chinese perch, Siniperca chuatsi. Int. J. Mol. Sci. 2015, 16, 8310–8323. [Google Scholar] [CrossRef] [PubMed]
- Tang, F.; Chu, L.; Shu, W.; He, X.; Wang, L.; Lu, M. Selection and validation of reference genes for quantitative expression analysis of miRNAs and mRNAs in Poplar. Plant Methods 2019, 15, 35. [Google Scholar] [CrossRef]
- Yang, Y.; Li, Z.; Cao, J.; Li, Y.; Li, H.; Yang, Q.; Zhang, Q.; Liu, X. Identification and Evaluation of Suitable Reference Genes for Normalization of MicroRNA Expression in Helicoverpa armigera (Lepidoptera: Noctuidae) Using Quantitative Real-Time PCR. J. Insect. Sci. 2017, 17. [Google Scholar] [CrossRef]
- Rasheed, Z.; Al-Shobaili, H.A.; Rasheed, N.; Mahmood, A.; Khan, M.I. MicroRNA-26a-5p regulates the expression of inducible nitric oxide synthase via activation of NF-κB pathway in human osteoarthritis chondrocytes. Arch. Biochem. Biophys. 2016, 594, 61–67. [Google Scholar] [CrossRef]
- Tichopad, A.; Kitchen, R.; Riedmaier, I.; Becker, C.; Ståhlberg, A.; Kubista, M. Design and optimization of reverse-transcription quantitative PCR experiments. Clin. Chem. 2009, 55, 1816–1823. [Google Scholar] [CrossRef] [PubMed]
- Edgar, R.; Domrachev, M.; Lash, A.E. Gene Expression Omnibus: NCBI gene expression and hybridization array data repository. Nucleic Acids Res. 2002, 30, 207–210. [Google Scholar] [CrossRef] [PubMed] [Green Version]
- Ragni, E.; Perucca Orfei, C.; De Luca, P.; Colombini, A.; Viganò, M.; Lugano, G.; Bollati, V.; de Girolamo, L. Identification of miRNA Reference Genes in Extracellular Vesicles from Adipose Derived Mesenchymal Stem Cells for Studying Osteoarthritis. Int. J. Mol. Sci. 2019, 20, 1108. [Google Scholar] [CrossRef] [PubMed]
- Ragni, E.; De Luca, P.; Perucca Orfei, C.; Colombini, A.; Viganò, M.; Lugano, G.; Bollati, V.; de Girolamo, L. Insights into Inflammatory Priming of Adipose-Derived Mesenchymal Stem Cells: Validation of Extracellular Vesicles-Embedded miRNA Reference Genes as A Crucial Step for Donor Selection. Cells 2019, 8, 369. [Google Scholar] [CrossRef] [PubMed]
- Akoglu, H. User’s guide to correlation coefficients. Turk J. Emerg. Med. 2018, 18, 91–93. [Google Scholar] [CrossRef] [PubMed]
- Metsalu, T.; Vilo, J. ClustVis: A web tool for visualizing clustering of multivariate data using Principal Component Analysis and heatmap. Nucleic Acids Res. 2015, 43, W566–W570. [Google Scholar] [CrossRef] [PubMed]
Figure 1.
Pearson correlation scatter plots for the 46 miRNAs and RNU44 amplified from precursor (PC), differentiated (DC), and hypertrophic (HYP) tissues. x and y-axis indicate Ct values. R2 stands for the correlation coefficient, with values >0.8 meaning a very strong interrelationship and value <0.6 a fair one.

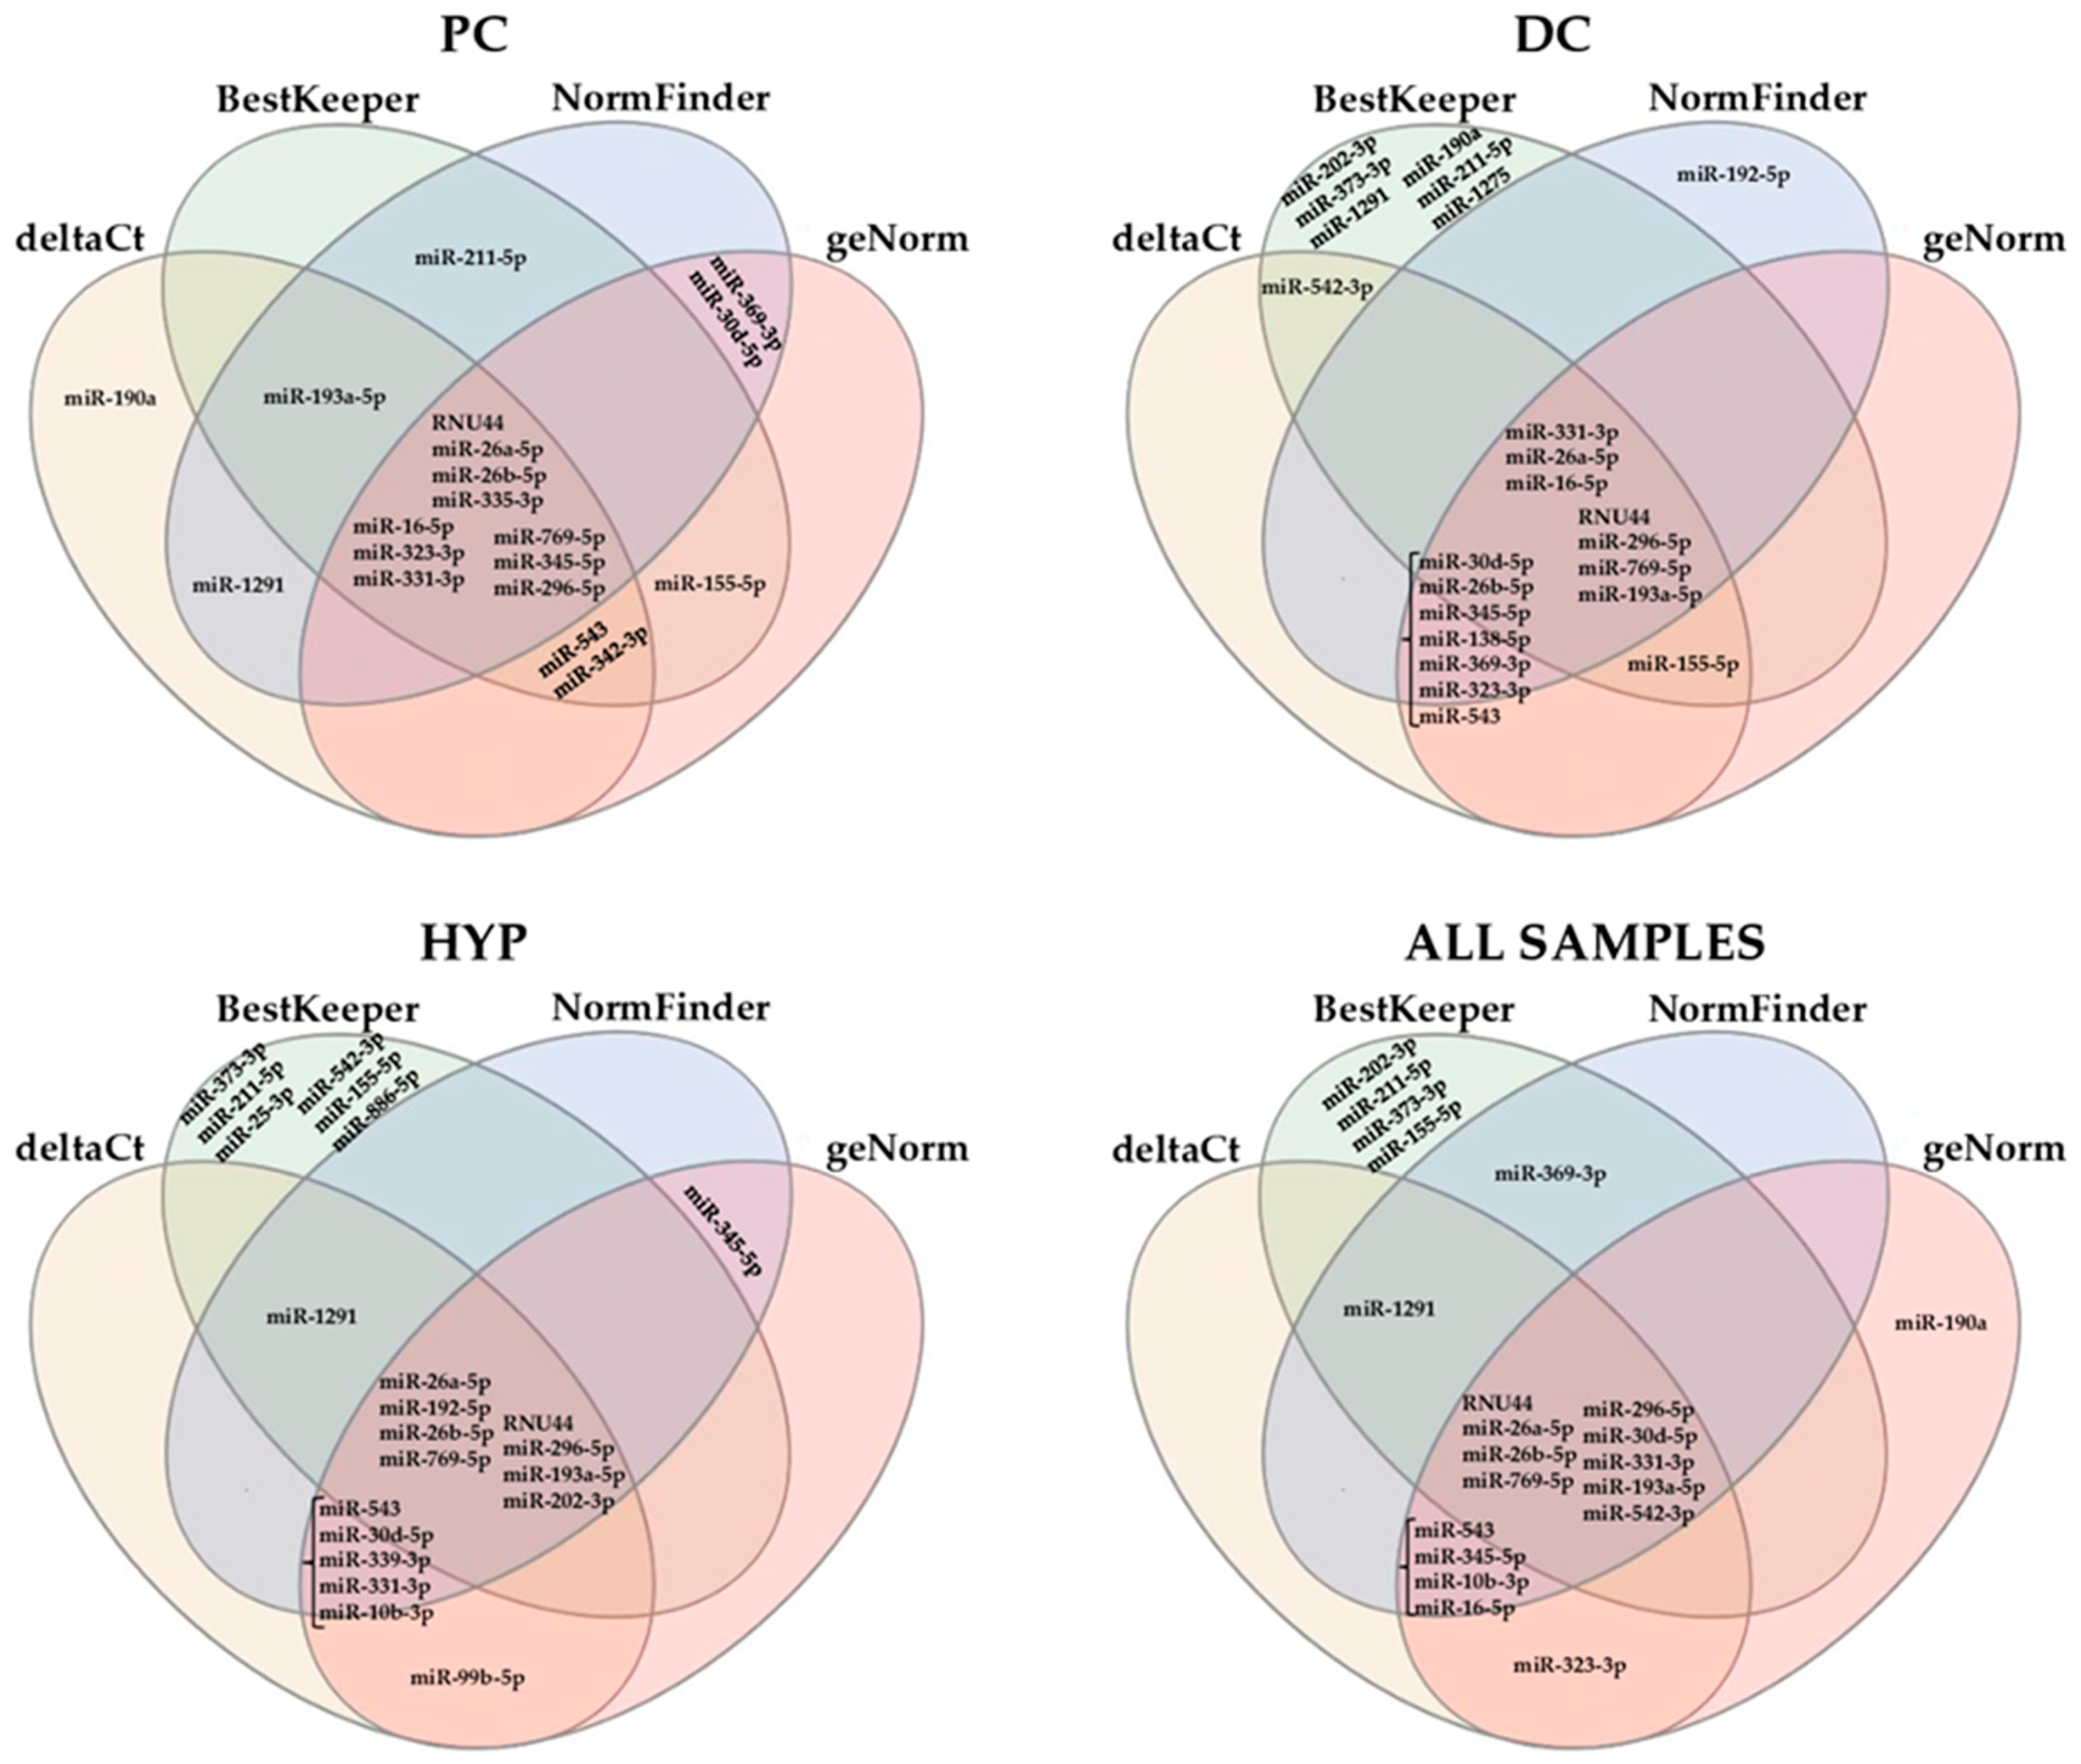
Figure 2.
Venn diagrams of the overlap of proposed miRNA reference genes (RGs) through the four algorithms. The most stable 15 miRNAs per each algorithm were considered. PC: precursor; DC: differentiated; HYP: hypertrophic.
Figure 2.
Venn diagrams of the overlap of proposed miRNA reference genes (RGs) through the four algorithms. The most stable 15 miRNAs per each algorithm were considered. PC: precursor; DC: differentiated; HYP: hypertrophic.

Figure 3.
Effect of normalization strategy on the miRNAs scored in the precursor (PC), differentiated (DC), and hypertrophic (HYP) tissues. (A) Heat maps of the assayed miRNAs across all samples after miR-26a-5p, RNU44, or miR-212-3p normalization. (B) Effect of miR-26a-5p or RNU44 normalization on miR-335-3p expression in PC, DC, and HYP samples. Values are shown as delta-Ct with respect to normalizing reference genes (RGs). # stands for p-value = 0.1, * for p-value ≤ 0.05, ** for p-value < 0.01, *** for p-value < 0.001, and **** for p-value < 0.0001. (C) Pearson correlation scatter plots for miR-335-3p and miR-26a-5p/RNU44 RGs. x and y-axis indicate Ct values.

© 2019 by the authors. Licensee MDPI, Basel, Switzerland. This article is an open access article distributed under the terms and conditions of the Creative Commons Attribution (CC BY) license (http://creativecommons.org/licenses/by/4.0/).
Share and Cite
MDPI and ACS Style
Ragni, E.; De Luca, P.; Marmotti, A.; de Girolamo, L. miR-26a-5p is a Stable Reference Gene for miRNA Studies in Chondrocytes from Developing Human Cartilage. Cells 2019, 8, 631. https://0-doi-org.brum.beds.ac.uk/10.3390/cells8060631
AMA Style
Ragni E, De Luca P, Marmotti A, de Girolamo L. miR-26a-5p is a Stable Reference Gene for miRNA Studies in Chondrocytes from Developing Human Cartilage. Cells. 2019; 8(6):631. https://0-doi-org.brum.beds.ac.uk/10.3390/cells8060631
Chicago/Turabian StyleRagni, Enrico, Paola De Luca, Antongiulio Marmotti, and Laura de Girolamo. 2019. "miR-26a-5p is a Stable Reference Gene for miRNA Studies in Chondrocytes from Developing Human Cartilage" Cells 8, no. 6: 631. https://0-doi-org.brum.beds.ac.uk/10.3390/cells8060631
Note that from the first issue of 2016, this journal uses article numbers instead of page numbers. See further details here.