Understanding the Modus Operandi of MicroRNA Regulatory Clusters

 , , , , , , and
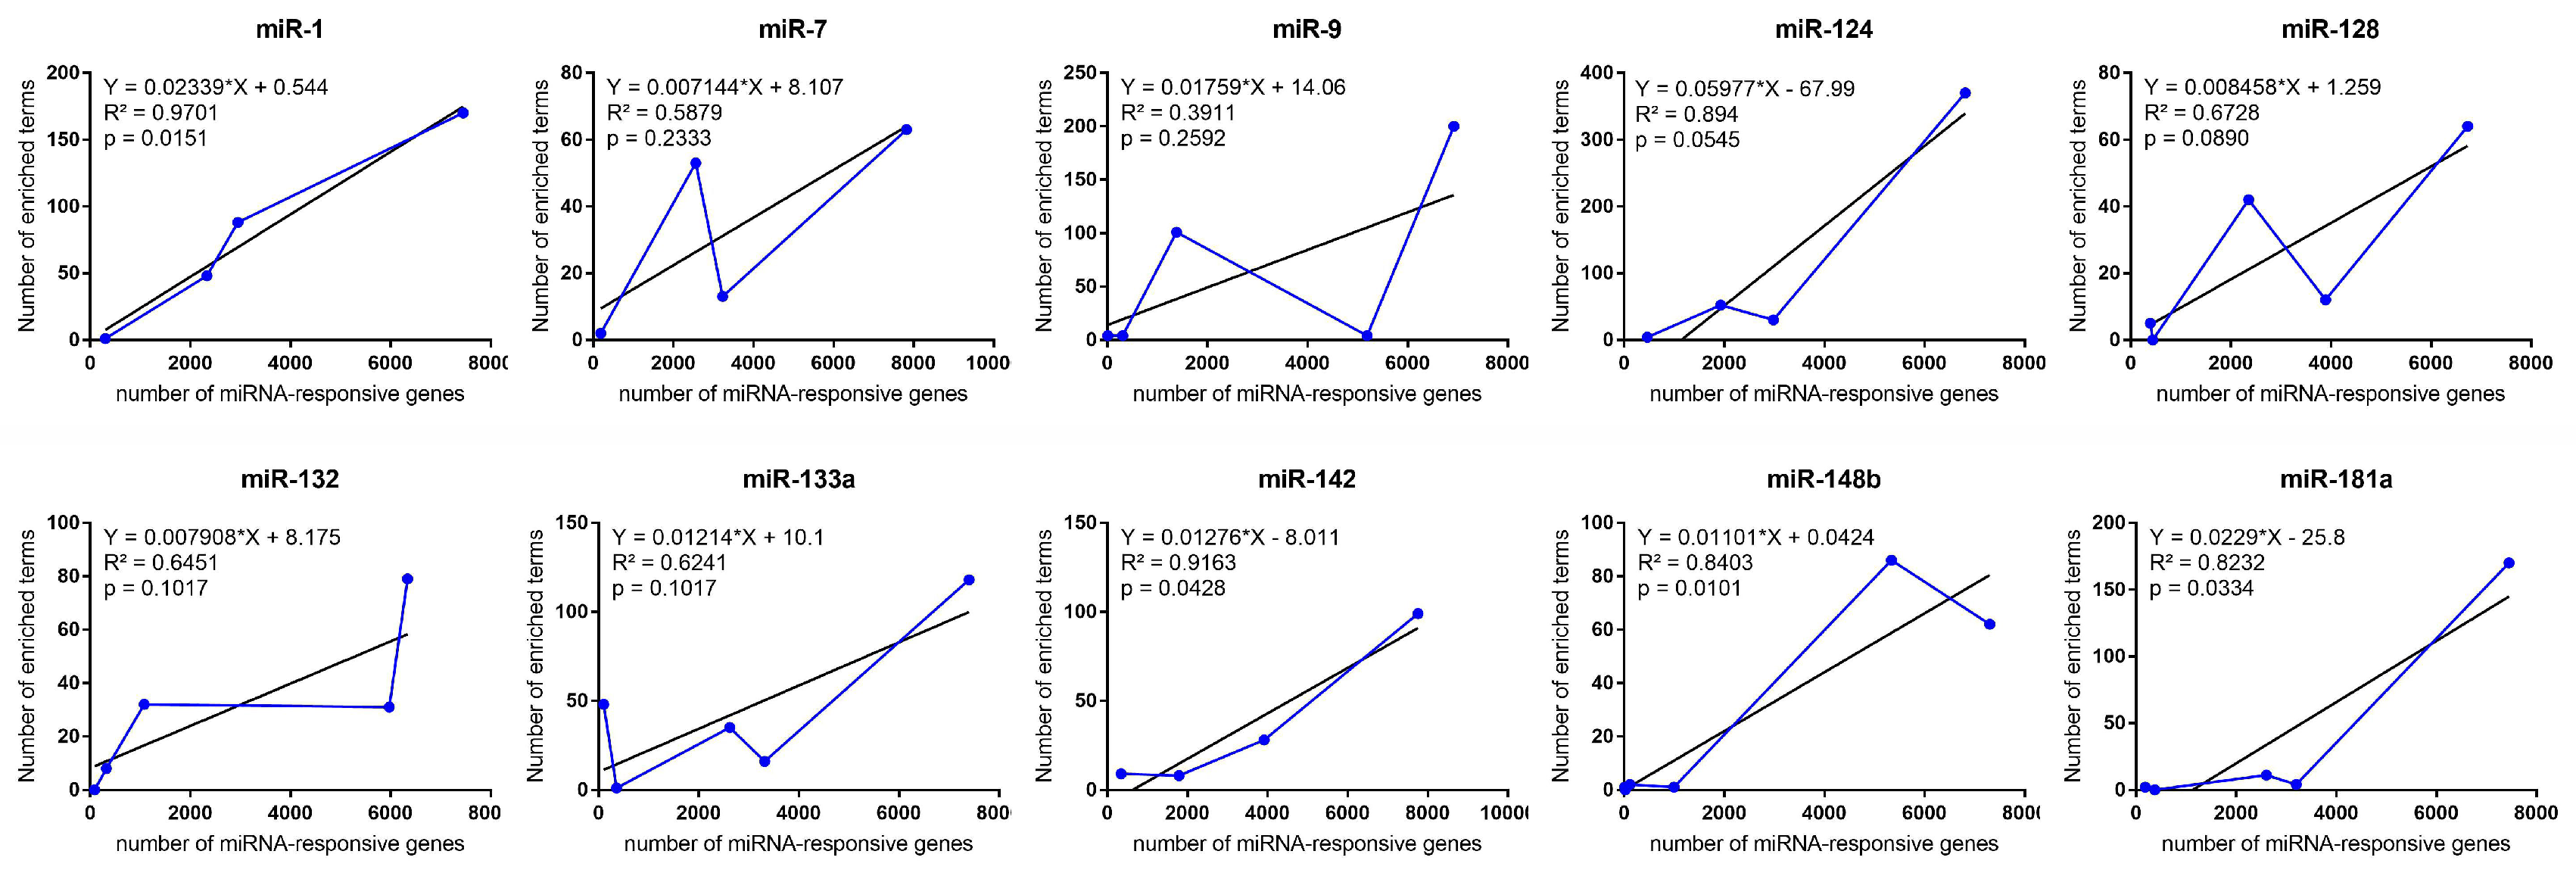
Abstract
:1. Introduction
2. Results
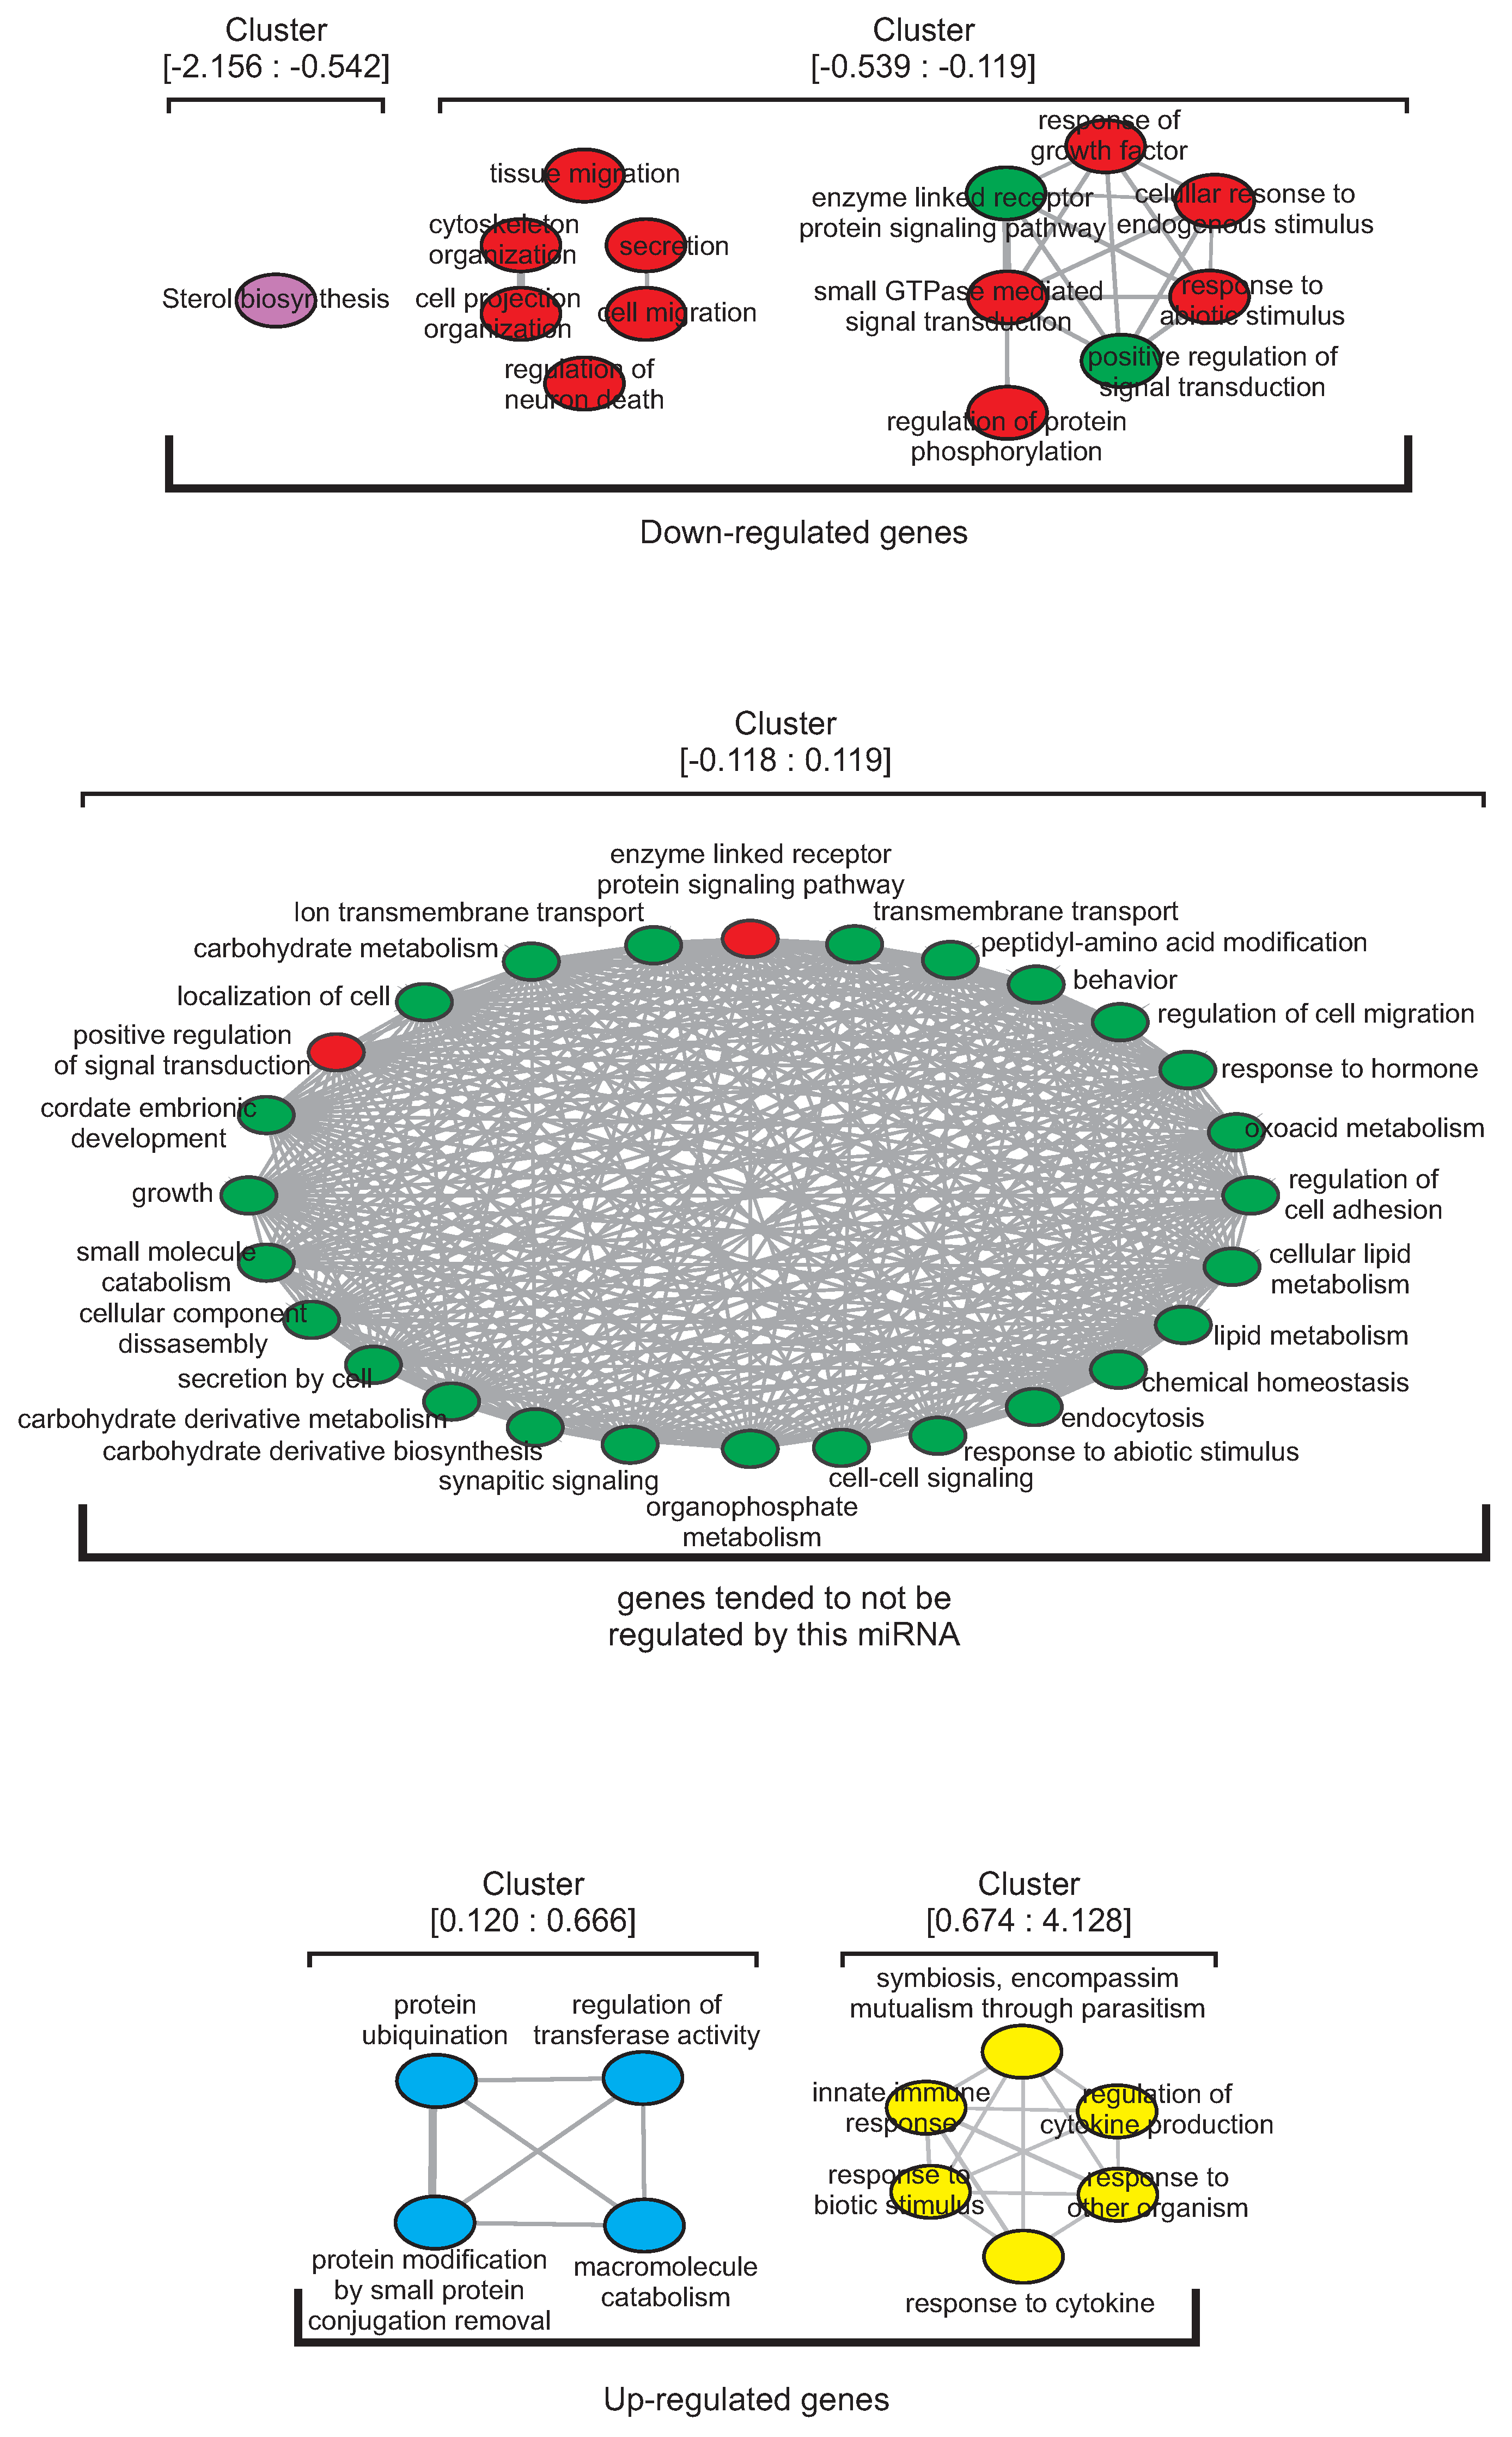
2.1. Functional Enrichment Terms Distribution Along miRNA-Responsive Gene Clusters
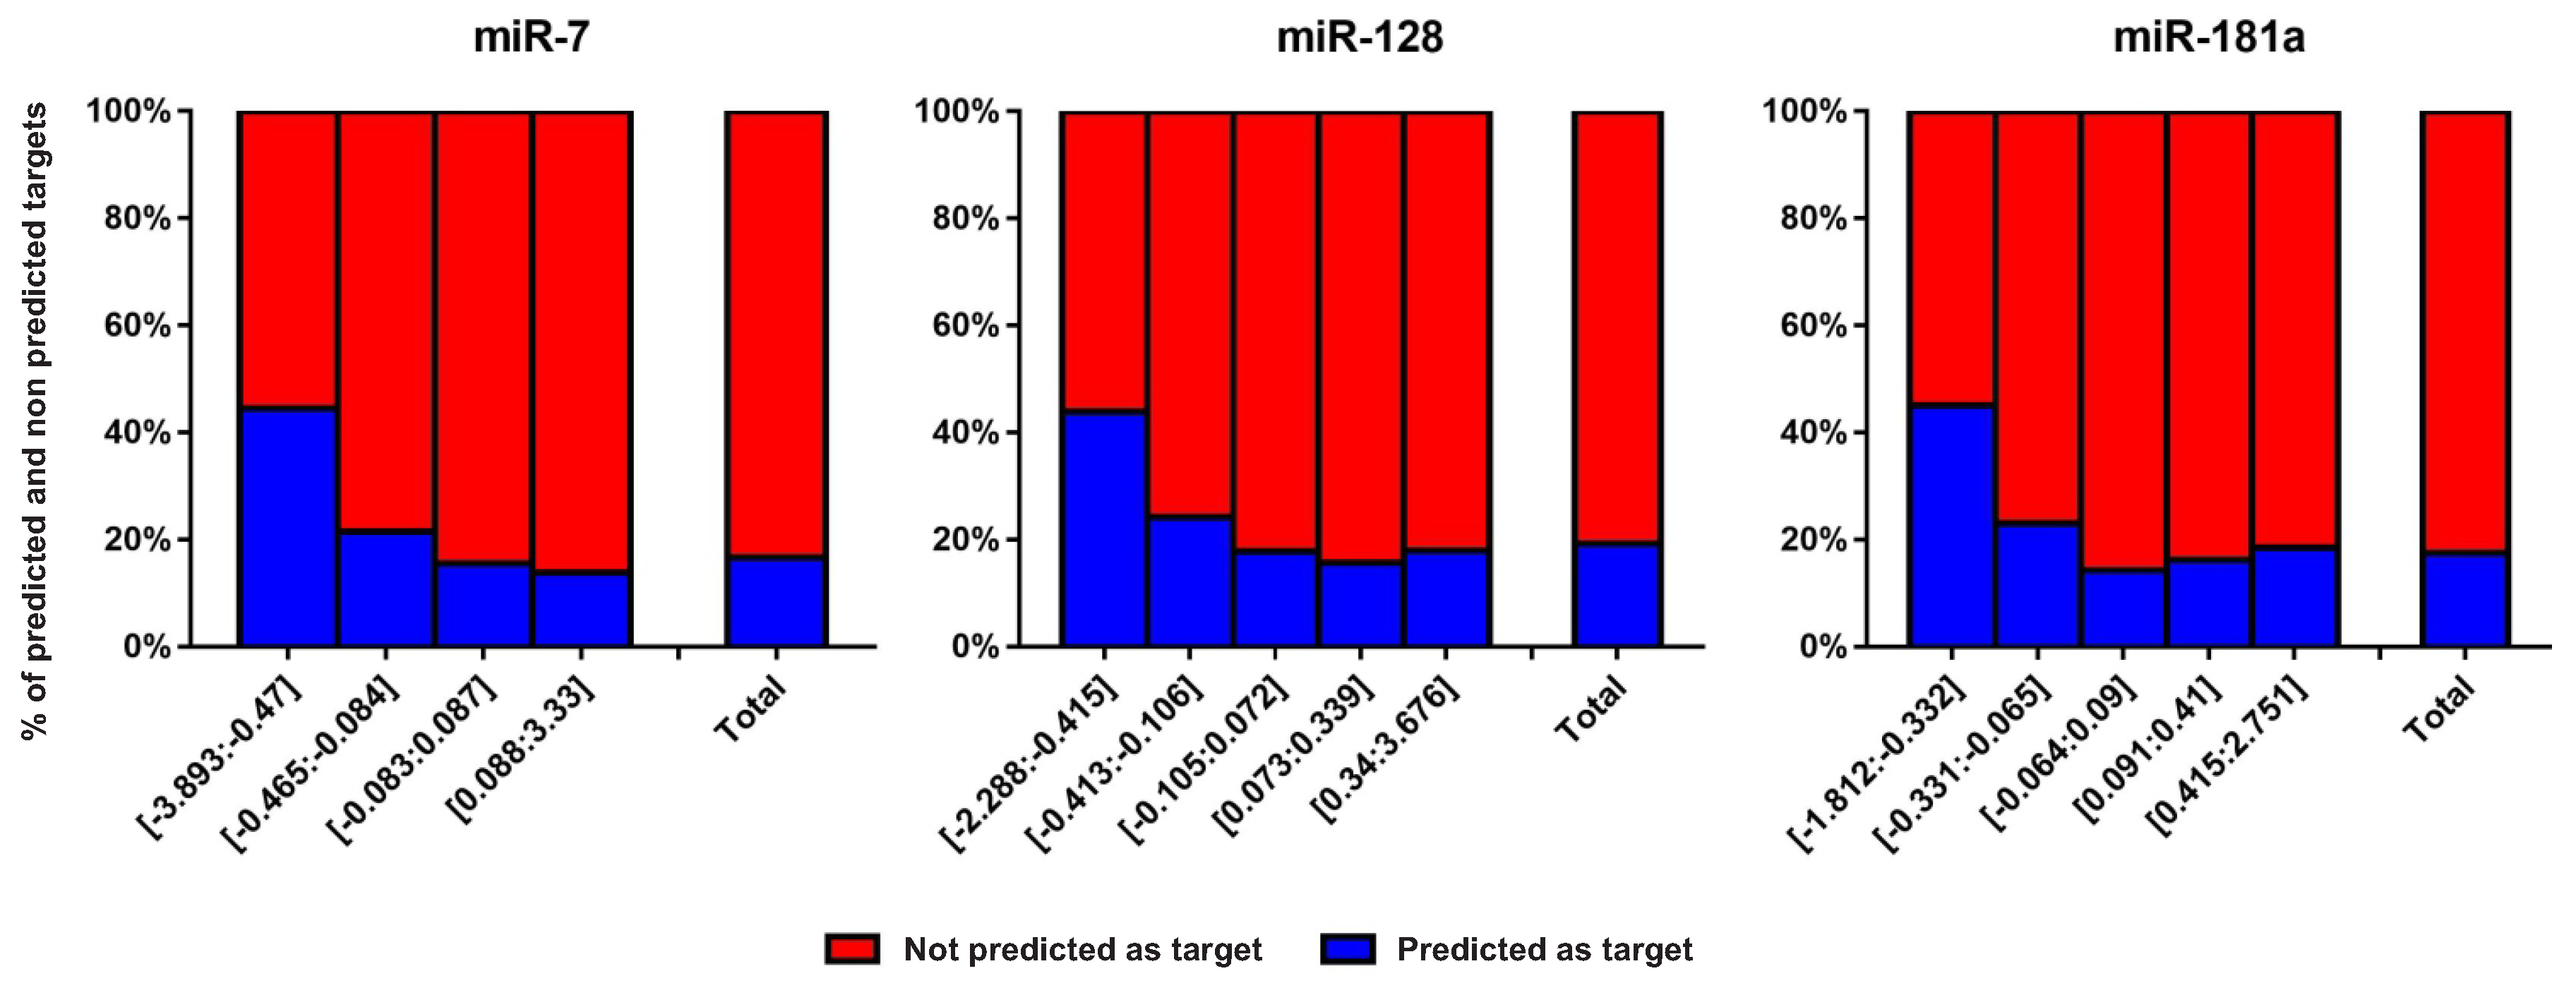
2.2. Protein-Coding Genes with Present/Absent Predicted miRNA Target Sites Inside miRNA-Responsive Gene Clusters
2.3. Conservation of miRNA Regulatory Clusters in Vertebrates
3. Discussion
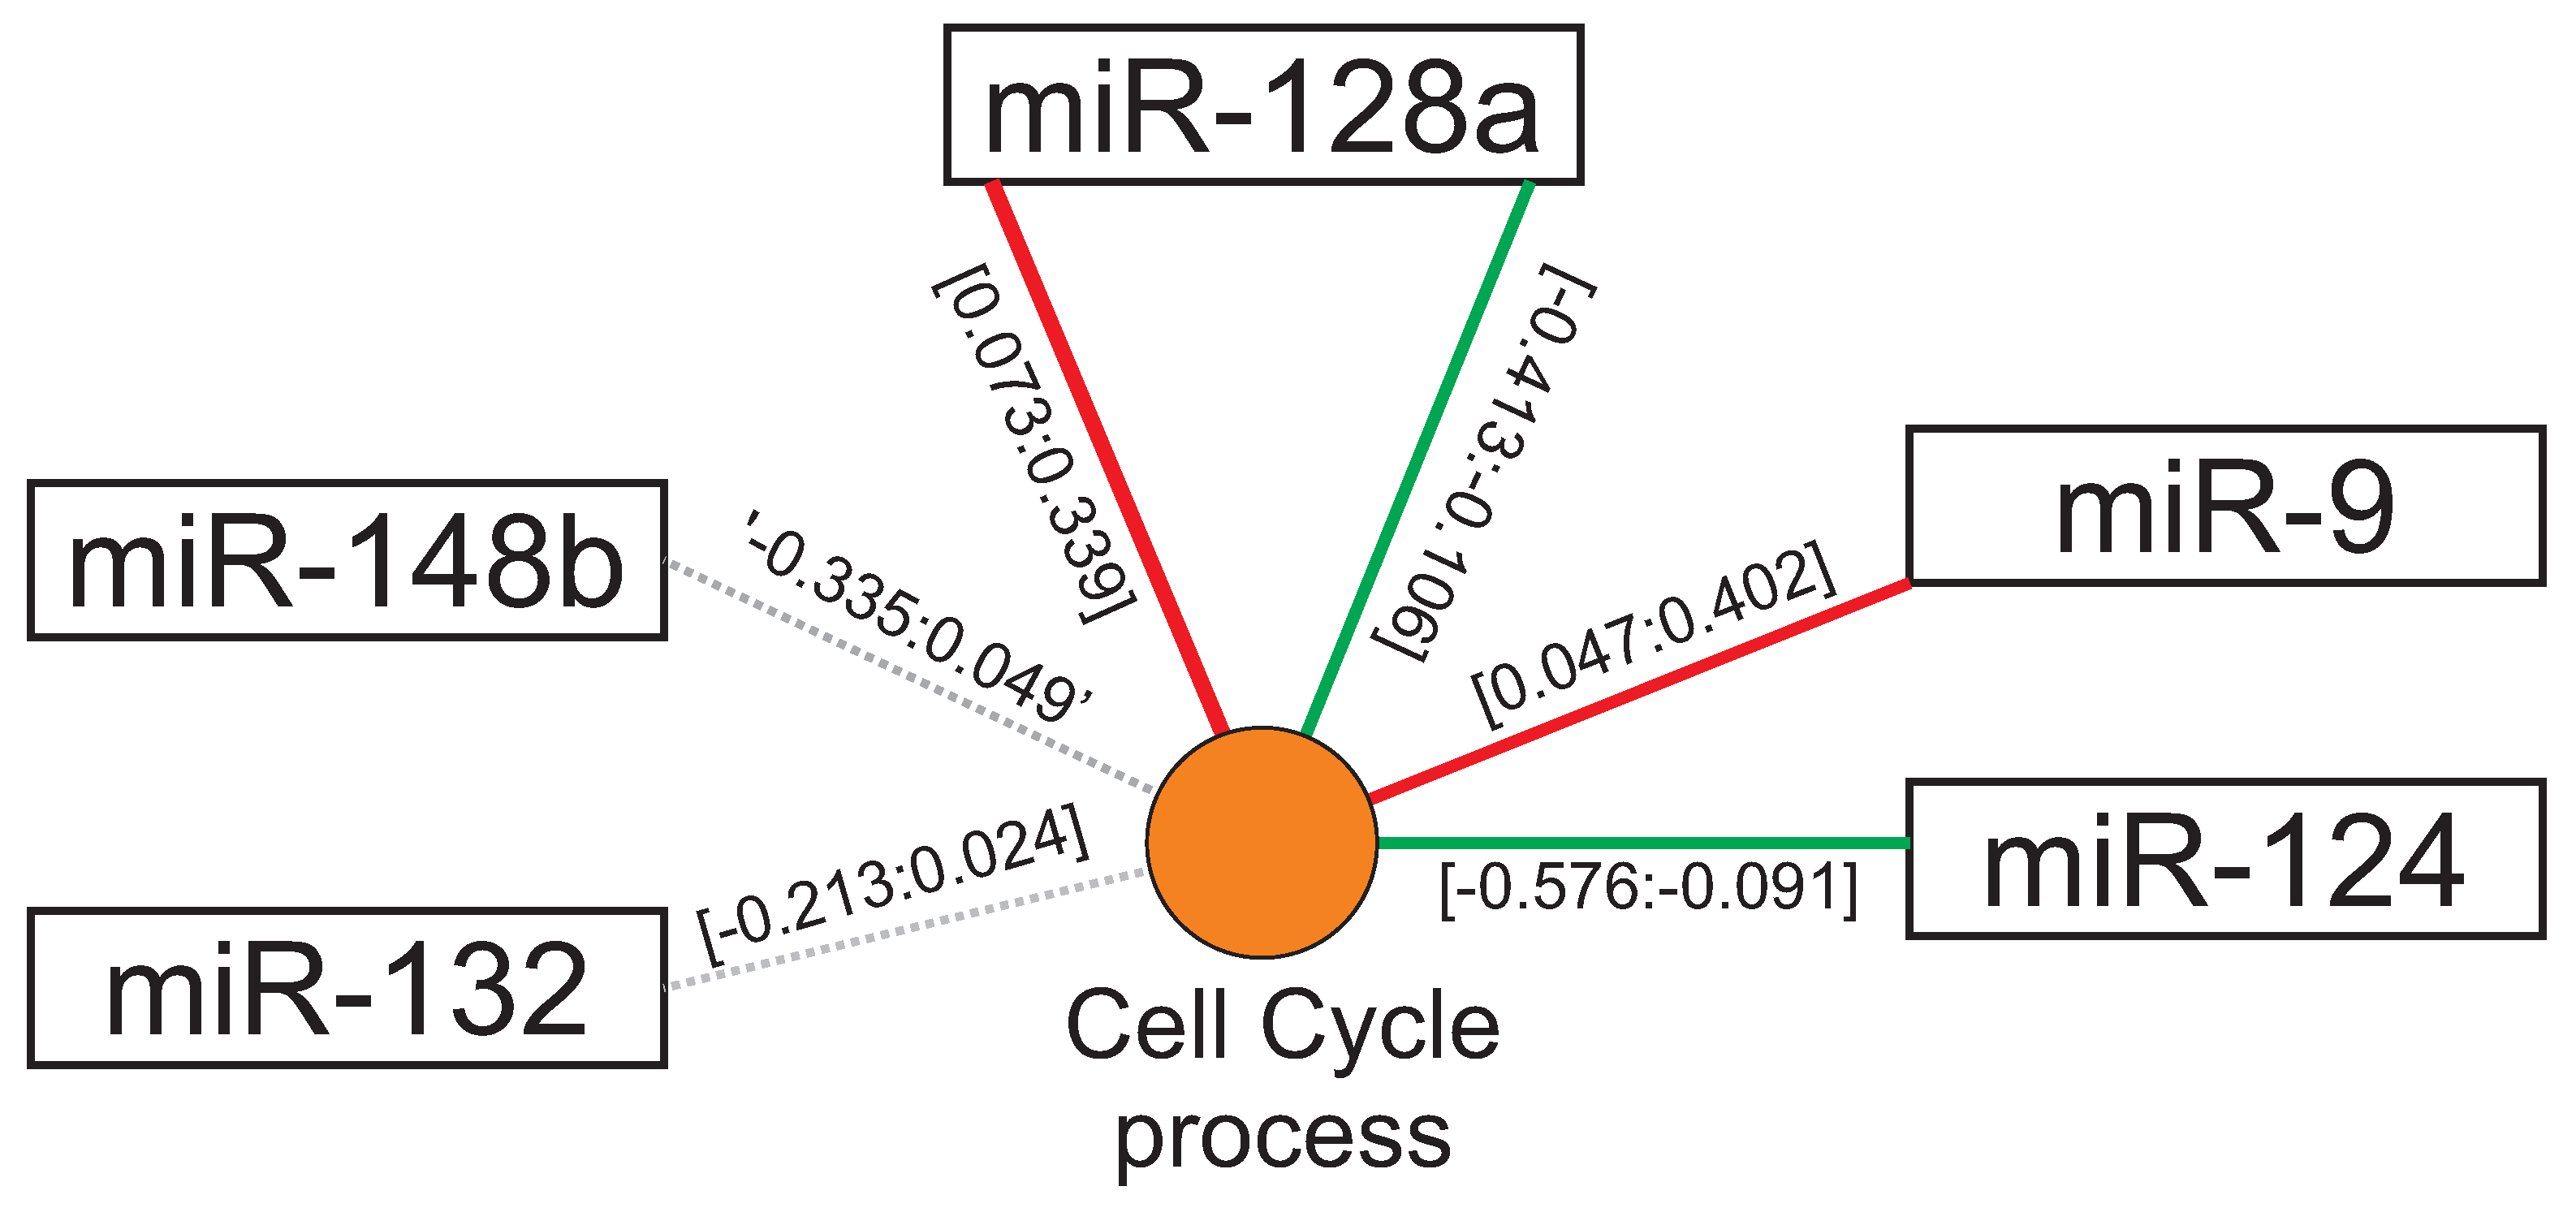
3.1. MiRNAs Regulatory Clusters Impact on Biological Functions
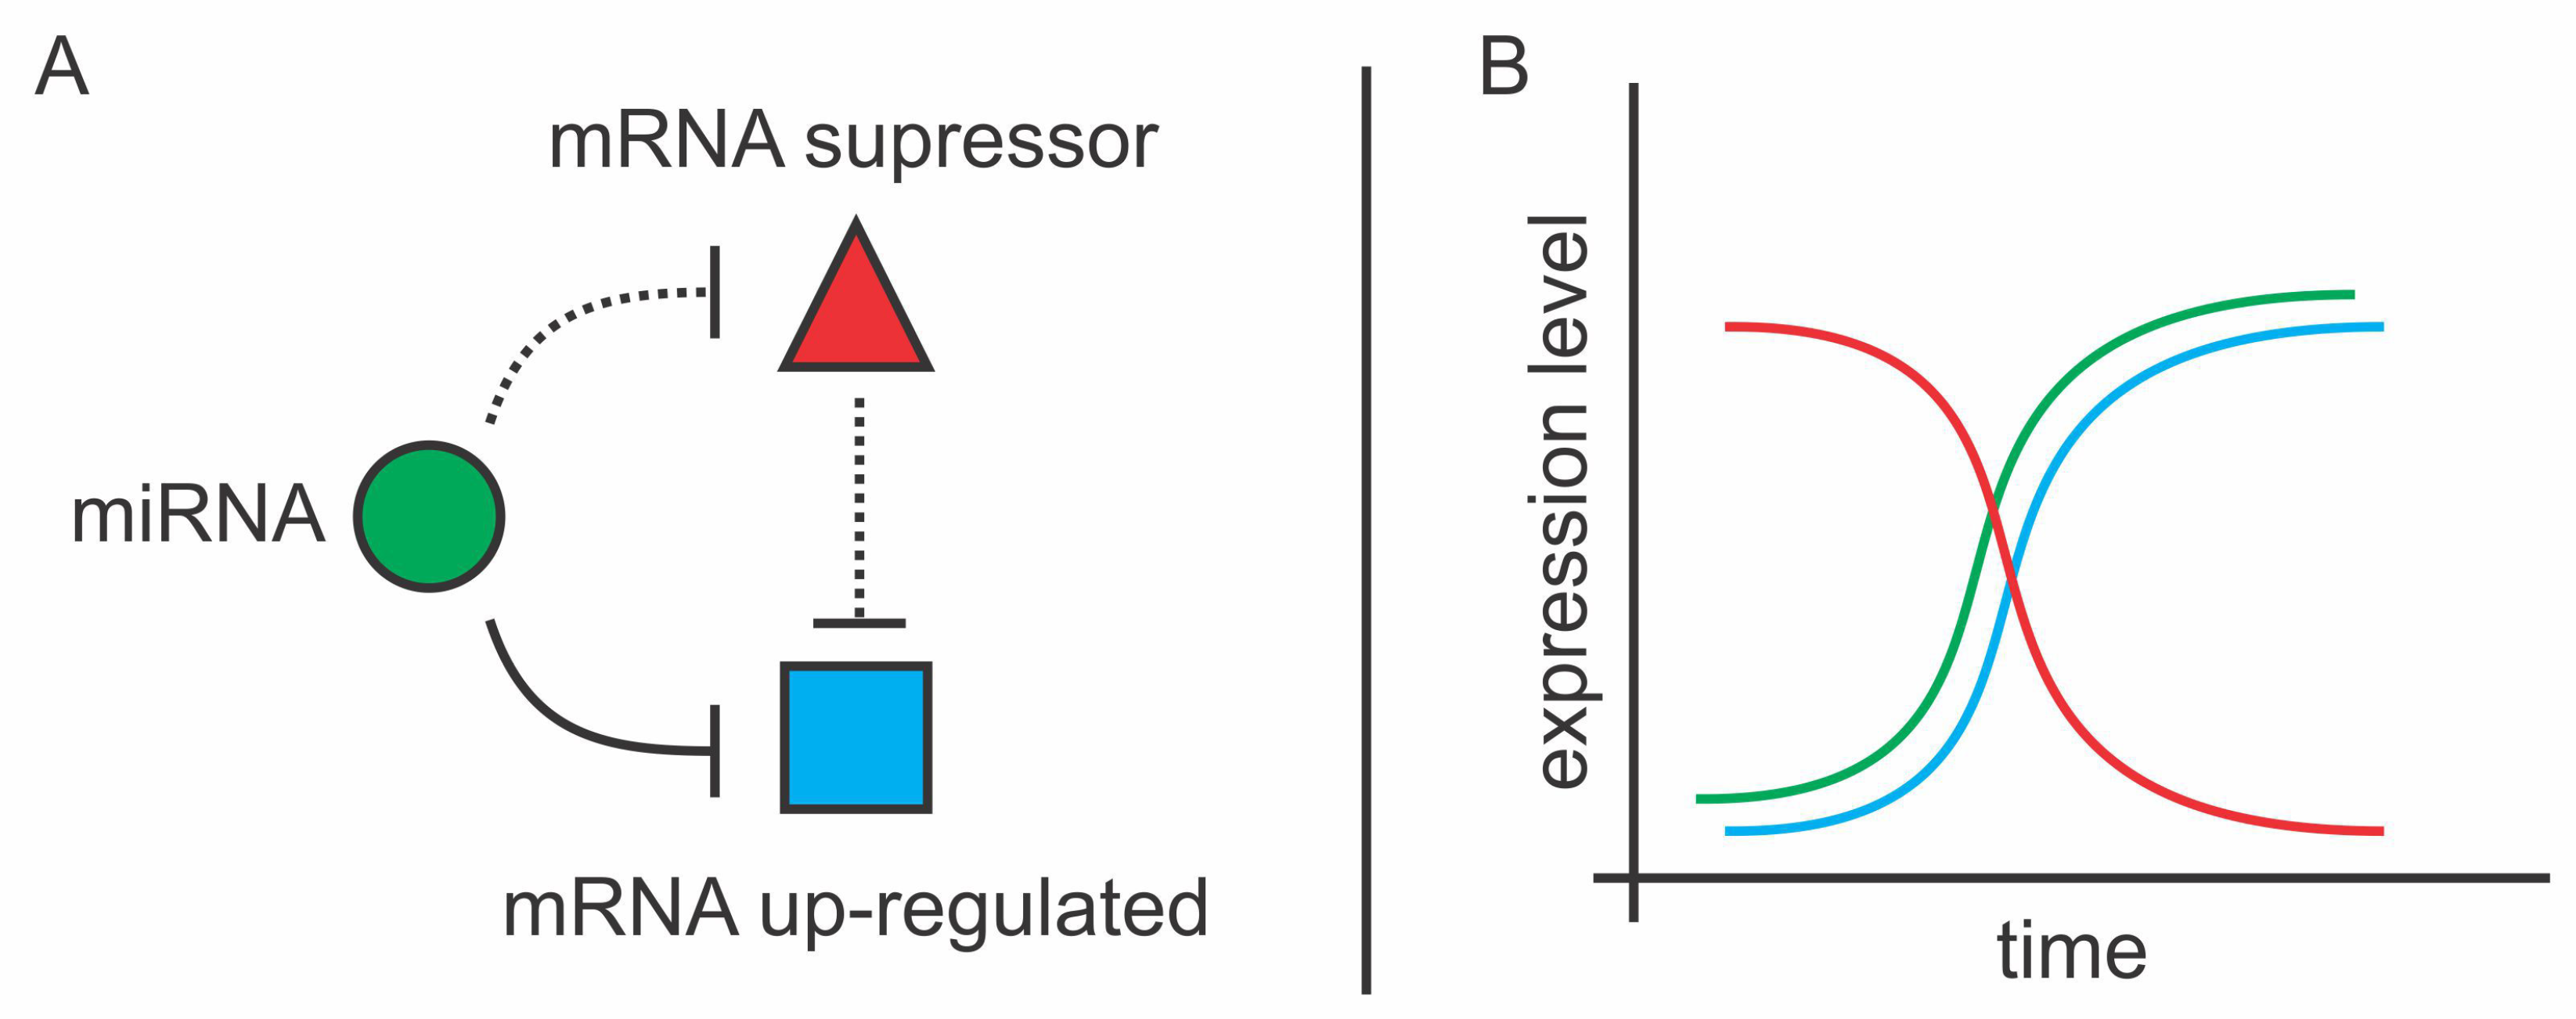
3.2. Beyond miRNA Pairing: Regulation of Non-Canonical Targets
3.3. How Do miRNAs Perform Cluster Regulation?
3.4. Future Perspectives
- -
- MiRNAs shares similar regulatory properties with several non-coding RNAs (ncRNAs), such as tRFs and other siRNAs. Studies focusing on identifying if regulatory clusters also occurs on other ncRNAs regulation could bring new insights on regulatory properties of non-coding RNAs.
- -
- Target prediction analysis suggests that the regulatory clusters are a conserved phenomenon. This allows in vivo experiments to be performed in model organisms, bringing novel possibilities for studying how regulatory clusters would respond in systemic environments.
- -
- Features of target binding sites may be largely relevant to the inception of regulatory clusters. However, our data shows that non-canonical and indirect interactions are part of miRNA regulation. Prospective high-throughput studies would benefit from this knowledge while performing functional enrichment analysis to map biological functions controlled by miRNAs.
4. Materials and Methods
4.1. Gene Expression Datasets Compilation
4.2. mRNA Fold-Changes Clustering
4.3. Functional Enrichment of mRNA Clusters
4.4. Generation of Random Sets and Chi-Squared () Test
4.5. Linear Regression Analysis
4.6. MiRNA Target Prediction
4.7. Evaluation of the Proportion of Predicted and Not Predicted mRNAs
4.8. Investigation of Validated miRNA Targets
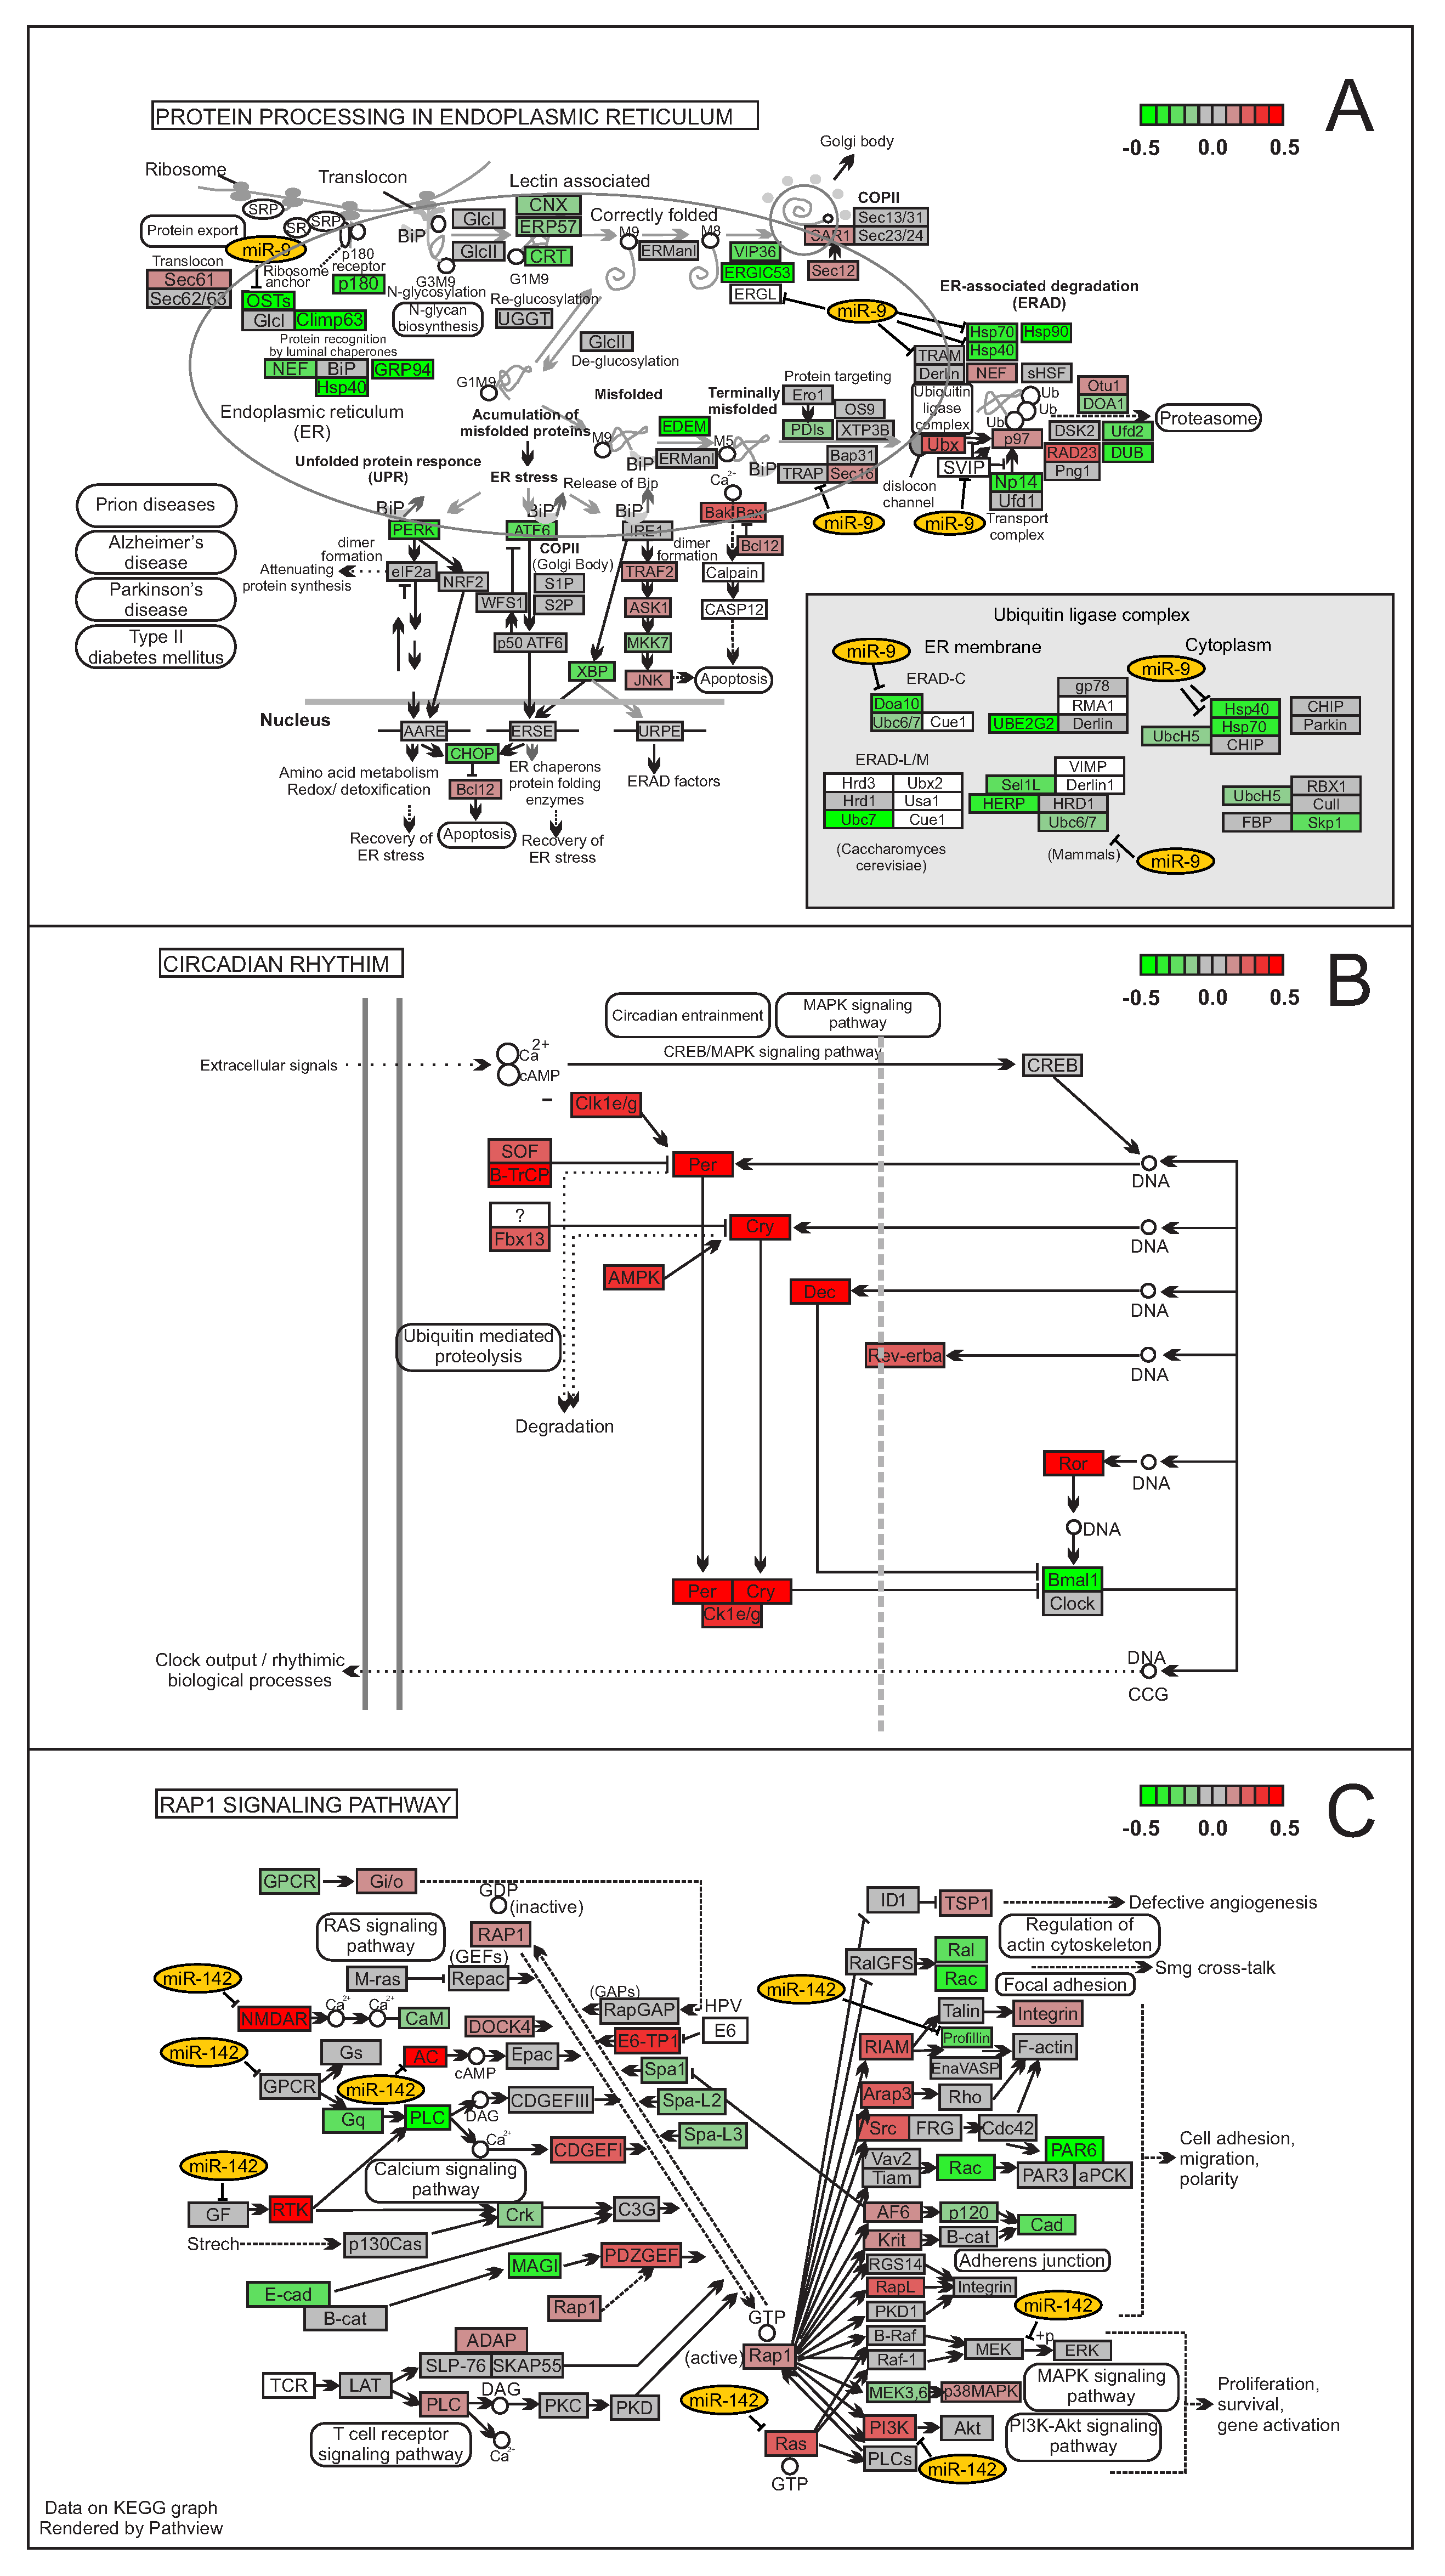
4.9. Analysis of Enriched Biological Pathways
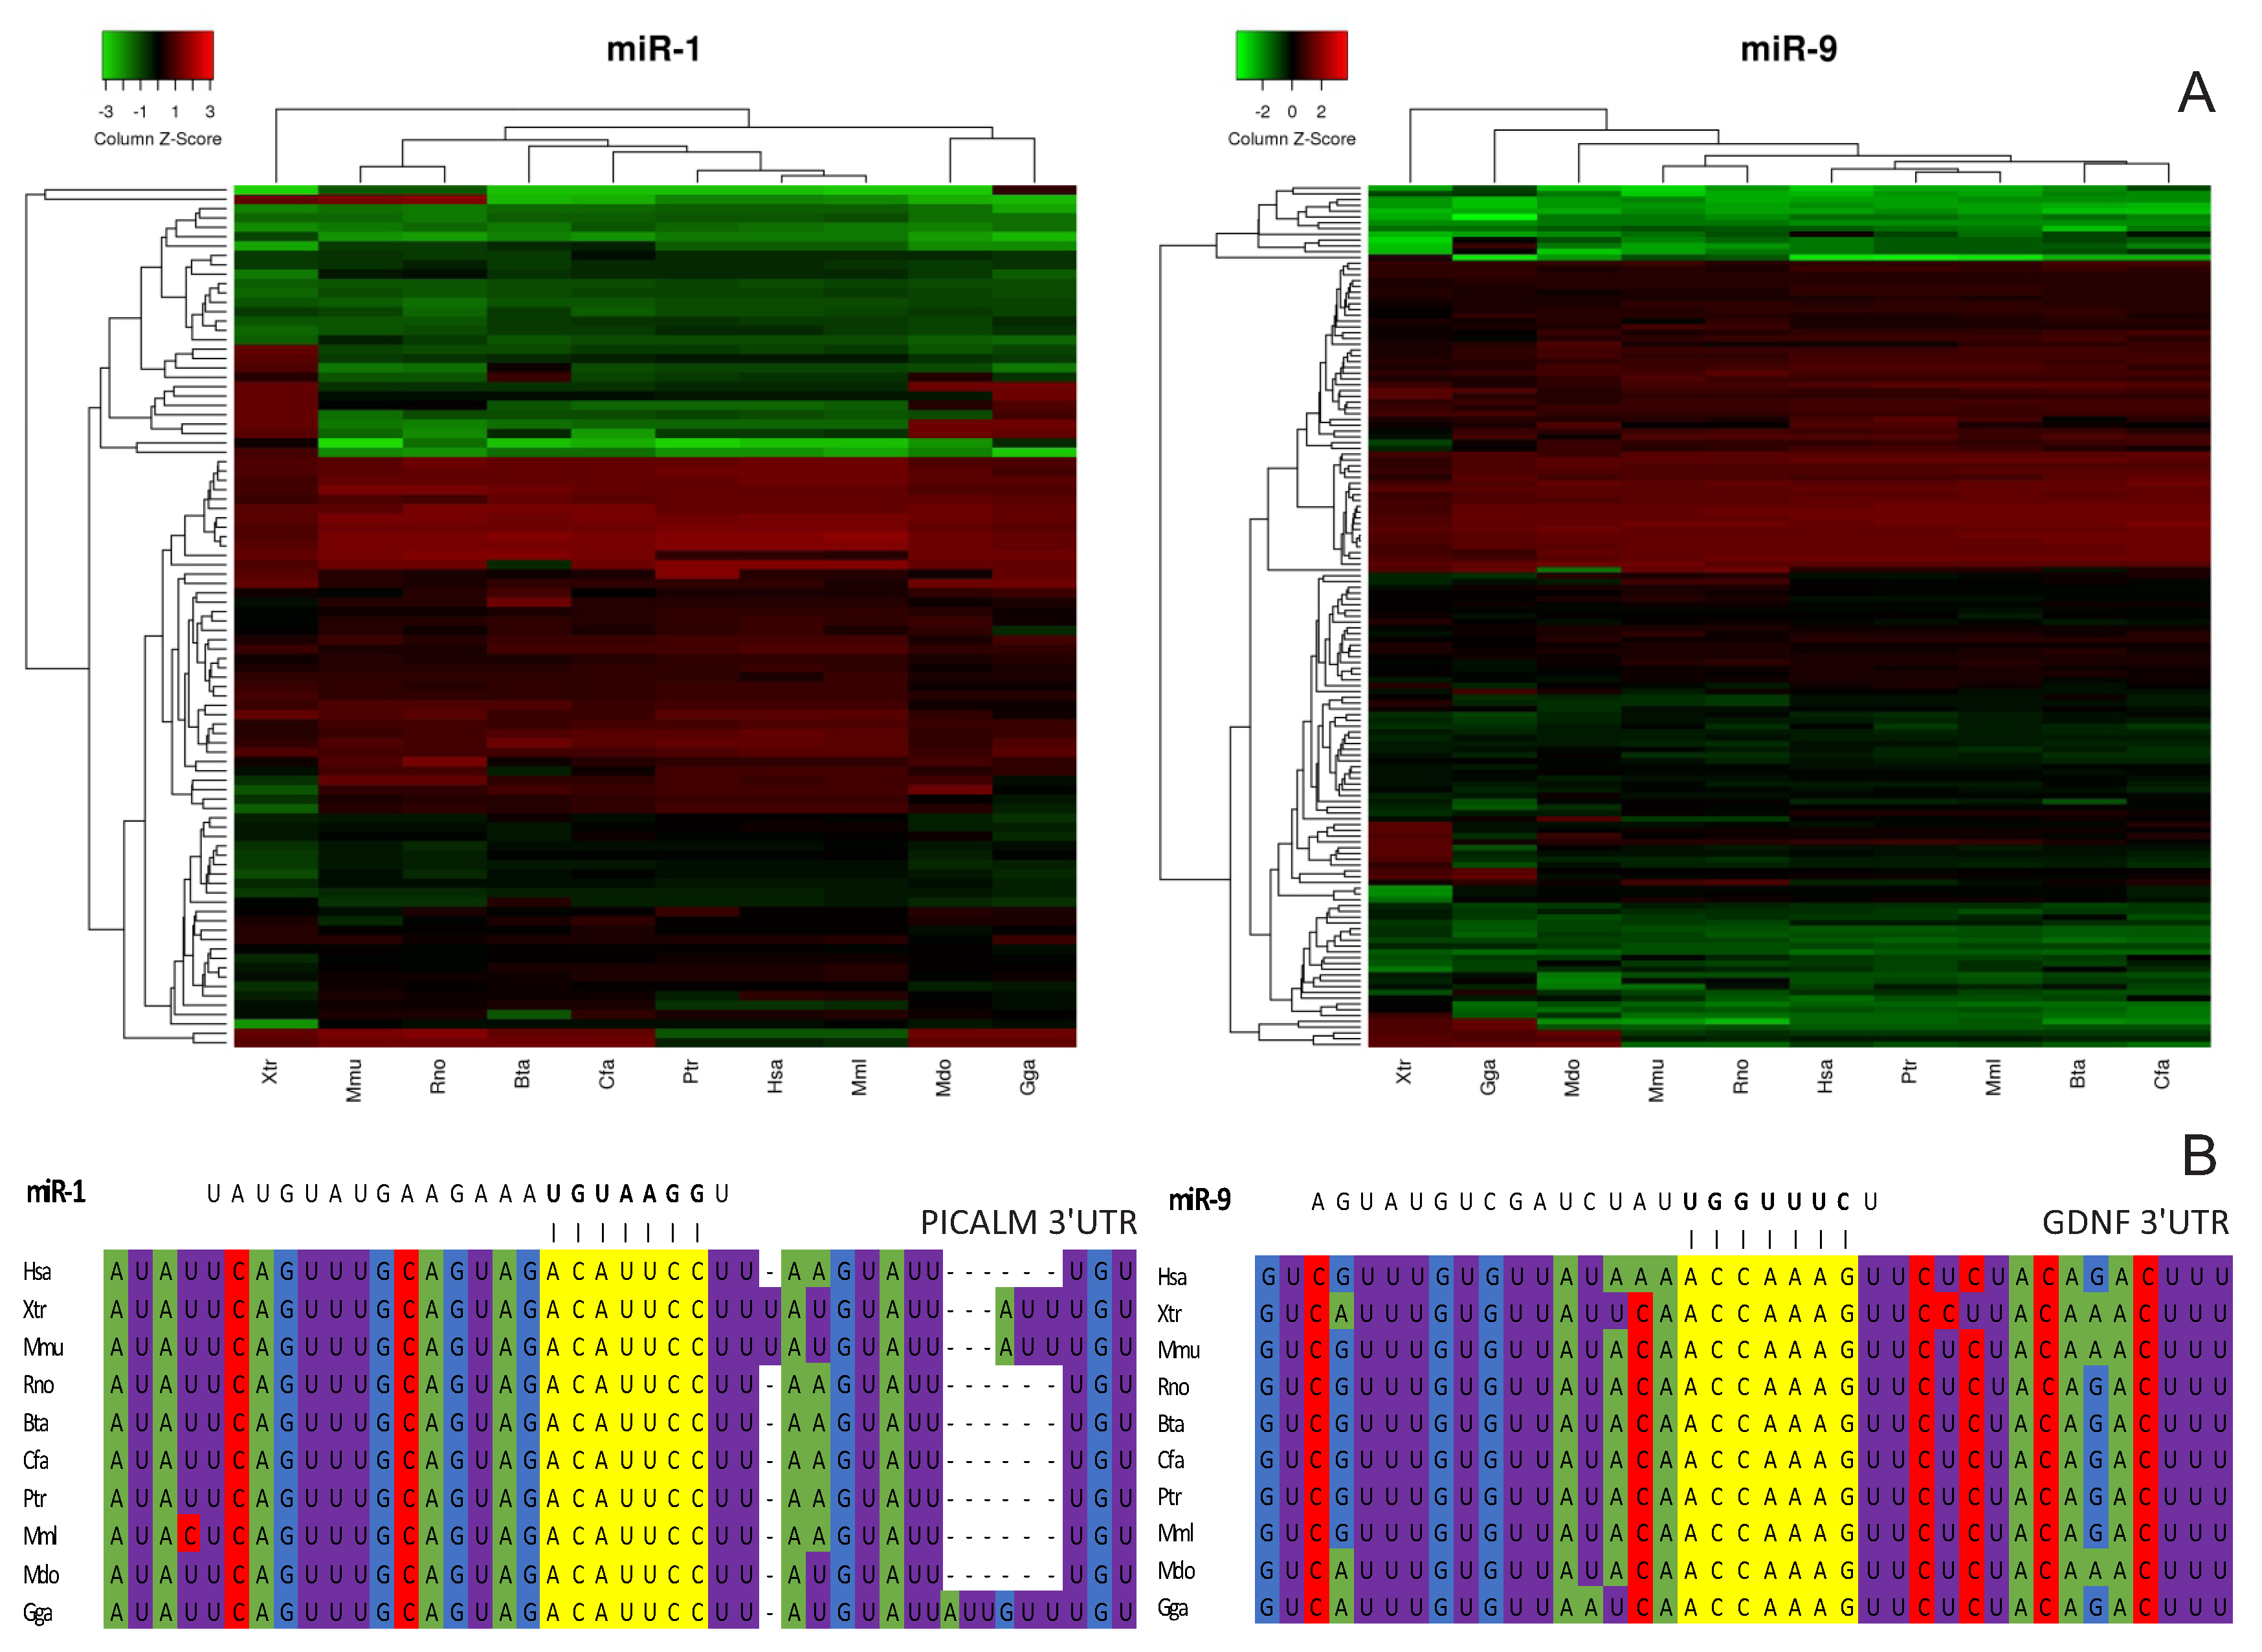
4.10. Evolutionary Conservation Analysis
5. Conclusions
Supplementary Materials
Author Contributions
Funding
Conflicts of Interest
Abbreviations
| BP | Biological Process |
| GO | Gene Ontology |
| mRNA | messenger RNA |
| miRNA | microRNA |
References
- Vidigal, J.A.; Ventura, A. The biological functions of miRNAs: lessons from in vivo studies. Trends Cell Biol. 2015, 25, 137–147. [Google Scholar] [CrossRef] [PubMed]
- Bartel, D.P. Metazoan MicroRNAs. Cell 2018, 173, 20–51. [Google Scholar] [CrossRef] [PubMed]
- Heimberg, A.M.; Sempere, L.F.; Moy, V.N.; Donoghue, P.C.J.; Peterson, K.J. MicroRNAs and the advent of vertebrate morphological complexity. Proc. Natl. Acad. Sci. USA 2008, 105, 2946–2950. [Google Scholar] [CrossRef] [PubMed] [Green Version]
- Christodoulou, F.; Raible, F.; Tomer, R.; Simakov, O.; Trachana, K.; Klaus, S.; Snyman, H.; Hannon, G.J.; Bork, P.; Arendt, D. Ancient animal microRNAs and the evolution of tissue identity. Nature 2010, 463, 1084. [Google Scholar] [CrossRef] [PubMed]
- Shenoy, A.; Blelloch, R.H. Regulation of microRNA function in somatic stem cell proliferation and differentiation. Nat. Rev. Mol. Cell Biol. 2014, 15, 565. [Google Scholar] [CrossRef] [PubMed]
- Reddy, K.B. MicroRNA (miRNA) in cancer. Cancer Cell Int. 2015, 15, 38. [Google Scholar] [CrossRef] [PubMed]
- Lai, E.C. Micro RNAs are complementary to 3’UTR sequence motifs that mediate negative post-transcriptional regulation. Nat. Genet. 2002, 30, 363. [Google Scholar] [CrossRef]
- Ameres, S.L.; Zamore, P.D. Diversifying microRNA sequence and function. Nat. Rev. Mol. Cell Biol. 2013, 14, 475. [Google Scholar] [CrossRef]
- Liu, B.; Li, J.; Cairns, M.J. Identifying miRNAs, targets and functions. Briefings Bioinform. 2012, 15, 1–19. [Google Scholar] [CrossRef]
- Soreq, H.; Barbash, S.; Shifman, S. Global Coevolution of Human MicroRNAs and Their Target Genes. Mol. Biol. Evol. 2014, 31, 1237–1247. [Google Scholar] [CrossRef] [Green Version]
- Brayn, I.M.; Koster, J.; Watters, K.M.; Terrile, M.; Domingo-Fernandéz, R.; Stallings, R.L.; Versteeg, R.; Bryan, K. Discovery and visualization of miRNA–mRNA functional modules within integrated data using bicluster analysis. Nucleic Acids Res. 2013, 42, e17. [Google Scholar] [CrossRef] [PubMed]
- Jayaswal, V.; Lutherborrow, M.; Ma, D.D.; Yang, Y.H. Identification of microRNA-mRNA modules using microarray data. BMC Genom. 2011, 12, 138. [Google Scholar] [CrossRef] [PubMed]
- Kertesz, M.; Iovino, N.; Unnerstall, U.; Gaul, U.; Segal, E. The role of site accessibility in microRNA target recognition. Nat. Genet. 2007, 39, 1278. [Google Scholar] [CrossRef] [PubMed]
- Jens, M.; Rajewsky, N. Competition between target sites of regulators shapes post-transcriptional gene regulation. Nat. Rev. Genet. 2015, 16, 113. [Google Scholar] [CrossRef] [PubMed]
- Garcia, D.M.; Baek, D.; Shin, C.; Bell, G.W.; Grimson, A.; Bartel, D.P. Weak seed-pairing stability and high target-site abundance decrease the proficiency of lsy-6 and other microRNAs. Nat. Struct. Mol. Biol. 2011, 18, 1139. [Google Scholar] [CrossRef]
- Agarwal, V.; Bell, G.W.; Nam, J.W.; Bartel, D.P. Predicting effective microRNA target sites in mammalian mRNAs. eLife 2015, 4, e05005. [Google Scholar] [CrossRef] [PubMed]
- Li, C.X.; Li, C.Q.; Xu, J.; Lv, J.Y.; Du, L.; Xu, L.D.; Shao, T.T.; Jiang, W.; Ma, Y.; Wang, Y.Y.; et al. MiRNA–miRNA synergistic network: construction via co-regulating functional modules and disease miRNA topological features. Nucleic Acids Res. 2010, 39, 825–836. [Google Scholar] [CrossRef]
- Park, C.; Young, D.; Sanders, K.M.; Ro, S.; Yan, W. Tissue-dependent paired expression of miRNAs. Nucleic Acids Res. 2007, 35, 5944–5953. [Google Scholar] [CrossRef]
- Tsykin, A.; Liu, B.; Kim, C.H.; Goodall, G.J.; Green, J.E.; Li, J.; Liu, L.; Zhu, M. Identifying functional miRNA–mRNA regulatory modules with correspondence latent dirichlet allocation. Bioinformatics 2010, 26, 3105–3111. [Google Scholar] [CrossRef]
- Oliveira, A.C.; Bovolenta, L.A.; Nachtigall, P.G.; Herkenhoff, M.E.; Lemke, N.; Pinhal, D. Combining Results from Distinct MicroRNA Target Prediction Tools Enhances the Performance of Analyses. Front. Genet. 2017, 8, 59. [Google Scholar] [CrossRef] [Green Version]
- Friedman, R.C.; Farh, K.K.H.; Burge, C.B.; Bartel, D.P. Most mammalian mRNAs are conserved targets of microRNAs. Genome Res. 2009, 19, 92–105. [Google Scholar] [CrossRef] [PubMed]
- Chen, K.; Rajewsky, N. The evolution of gene regulation by transcription factors and microRNAs. Nat. Rev. Genet. 2007, 8, 93. [Google Scholar] [CrossRef]
- Vourekas, A.; Alexiou, P.; Vrettos, N.; Maragkakis, M.; Mourelatos, Z. Sequence-dependent but not sequence-specific piRNA adhesion traps mRNAs to the germ plasm. Nature 2016, 531, 390. [Google Scholar] [CrossRef] [PubMed]
- Maute, R.L.; Schneider, C.; Sumazin, P.; Holmes, A.; Califano, A.; Basso, K.; Dalla-Favera, R. tRNA-derived microRNA modulates proliferation and the DNA damage response and is down-regulated in B cell lymphoma. Proc. Natl. Acad. Sci. USA 2013, 110, 1404–1409. [Google Scholar] [CrossRef] [PubMed] [Green Version]
- Dragomir, M.P.; Knutsen, E.; Calin, G.A. SnapShot: Unconventional miRNA Functions. Cell 2018, 174, 1038. [Google Scholar] [CrossRef] [PubMed]
- Fabbri, M.; Paone, A.; Calore, F.; Galli, R.; Gaudio, E.; Santhanam, R.; Lovat, F.; Fadda, P.; Mao, C.; Nuovo, G.J.; et al. MicroRNAs bind to Toll-like receptors to induce prometastatic inflammatory response. Proc. Natl. Acad. Sci. USA 2012, 109, E2110–E2116. [Google Scholar] [CrossRef] [Green Version]
- Lehmann, S.M.; Krüger, C.; Park, B.; Derkow, K.; Rosenberger, K.; Baumgart, J.; Trimbuch, T.; Eom, G.; Hinz, M.; Kaul, D.; et al. An unconventional role for miRNA: let-7 activates Toll-like receptor 7 and causes neurodegeneration. Nat. Neurosci. 2012, 15, 827. [Google Scholar] [CrossRef]
- Eiring, A.M.; Harb, J.G.; Neviani, P.; Garton, C.; Oaks, J.J.; Spizzo, R.; Liu, S.; Schwind, S.; Santhanam, R.; Hickey, C.J.; et al. miR-328 functions as an RNA decoy to modulate hnRNP E2 regulation of mRNA translation in leukemic blasts. Cell 2010, 140, 652–665. [Google Scholar] [CrossRef]
- Das, S.; Ferlito, M.; Kent, O.A.; Fox-Talbot, K.; Wang, R.; Liu, D.; Raghavachari, N.; Yang, Y.; Wheelan, S.J.; Murphy, E.; et al. Nuclear miRNA regulates the mitochondrial genome in the heart. Circ. Res. 2012, 110, 1596–1603. [Google Scholar] [CrossRef]
- Vasudevan, S.; Tong, Y.; Steitz, J.A. Switching from Repression to Activation: MicroRNAs Can Up-Regulate Translation. Science 2007, 318, 1931–1934. [Google Scholar] [CrossRef] [PubMed] [Green Version]
- Mortensen, R.D.; Serra, M.; Steitz, J.A.; Vasudevan, S. Posttranscriptional activation of gene expression in Xenopus laevis oocytes by microRNA–protein complexes (microRNPs). Proc. Natl. Acad. Sci. USA 2011, 108, 8281–8286. [Google Scholar] [CrossRef] [PubMed]
- Vasudevan, S. Posttranscriptional Upregulation by MicroRNAs. Wiley Interdiscip. Rev. RNA 2012, 3, 311–330. [Google Scholar] [CrossRef] [PubMed]
- Vaschetto, L.M. miRNA activation is an endogenous gene expression pathway. RNA Biol. 2018, 15, 826–828. [Google Scholar] [CrossRef]
- Huang, V.; Place, R.F.; Portnoy, V.; Wang, J.; Qi, Z.; Jia, Z.; Yu, A.; Shuman, M.; Yu, J.; Li, L.C. Upregulation of Cyclin B1 by miRNA and its implications in cancer. Nucleic Acids Res. 2011, 40, 1695–1707. [Google Scholar] [CrossRef] [PubMed] [Green Version]
- Ogawa, O.; Eccles, M.R.; Szeto, J.; McNoe, L.A.; Yun, K.; Maw, M.A.; Smith, P.J.; Reeve, A.E. Relaxation of insulin-like growth factor II gene imprinting implicated in Wilms’ tumour. Nature 1993, 362, 749. [Google Scholar] [CrossRef] [PubMed]
- Turner, M.; Jiao, A.; Slack, F.J. Autoregulation of lin-4 microRNA transcription by RNA activation (RNAa) in C. elegans. Cell Cycle 2014, 13, 772–781. [Google Scholar] [CrossRef] [PubMed]
- Zisoulis, D.G.; Kai, Z.S.; Chang, R.K.; Pasquinelli, A.E. Autoregulation of microRNA biogenesis by let-7 and Argonaute. Nature 2012, 486, 541. [Google Scholar] [CrossRef]
- Vera, J.; Lai, X.; Wolkenhauer, O. Understanding microRNA-mediated gene regulatory networks through mathematical modelling. Nucleic Acids Res. 2016, 44, 6019–6035. [Google Scholar] [CrossRef] [Green Version]
- Denzler, R.; McGeary, S.E.; Title, A.C.; Agarwal, V.; Bartel, D.P.; Stoffel, M. Impact of microRNA levels, target-site complementarity, and cooperativity on competing endogenous RNA-regulated gene expression. Mol. Cell 2016, 64, 565–579. [Google Scholar] [CrossRef]
- O’Brien, J.; Hayder, H.; Zayed, Y.; Peng, C. Overview of microrna biogenesis, mechanisms of actions, and circulation. Front. Endocrinol. 2018, 9, 402. [Google Scholar] [CrossRef]
- Barman, B.; Bhattacharyya, S.N. mRNA targeting to endoplasmic reticulum precedes ago protein interaction and microRNA (miRNA)-mediated translation repression in mammalian cells. J. Biol. Chem. 2015, 290, 24650–24656. [Google Scholar] [CrossRef] [PubMed]
- Nishi, K.; Takahashi, T.; Suzawa, M.; Miyakawa, T.; Nagasawa, T.; Ming, Y.; Tanokura, M.; Ui-Tei, K. Control of the localization and function of a miRNA silencing component TNRC6A by Argonaute protein. Nucleic Acids Res. 2015, 43, 9856–9873. [Google Scholar] [CrossRef]
- Gibbings, D.J.; Ciaudo, C.; Erhardt, M.; Voinnet, O. Multivesicular bodies associate with components of miRNA effector complexes and modulate miRNA activity. Nat. Cell Biol. 2009, 11, 1143. [Google Scholar] [CrossRef] [PubMed]
- Barrey, E.; Saint-Auret, G.; Bonnamy, B.; Damas, D.; Boyer, O.; Gidrol, X. Pre-microRNA and mature microRNA in human mitochondria. PLoS ONE 2011, 6, e20220. [Google Scholar] [CrossRef]
- Miao, L.; Yao, H.; Li, C.; Pu, M.; Yao, X.; Yang, H.; Qi, X.; Ren, J.; Wang, Y. A dual inhibition: microRNA-552 suppresses both transcription and translation of cytochrome P450 2E1. Biochim. Biophys. Acta 2016, 1859, 650–662. [Google Scholar] [CrossRef] [PubMed]
- Lee, J.H.; Daugharthy, E.R.; Scheiman, J.; Kalhor, R.; Yang, J.L.; Ferrante, T.C.; Terry, R.; Jeanty, S.S.; Li, C.; Amamoto, R.; et al. Highly multiplexed subcellular RNA sequencing in situ. Science 2014, 343, 1360–1363. [Google Scholar] [CrossRef] [PubMed]
- Jackson, A.L.; Bartz, S.R.; Schelter, J.; Kobayashi, S.V.; Burchard, J.; Mao, M.; Li, B.; Cavet, G.; Linsley, P.S. Expression profiling reveals off-target gene regulation by RNAi. Nat. Biotechnol. 2003, 21, 635. [Google Scholar] [CrossRef]
- Dai, Z.; Wu, R.; Zhao, Y.; Wang, K.; Huang, Y.; Yang, X.; Xie, Z.; Tu, C.; Ouyang, H.; Wang, T.; et al. Early lethality of shRNA-transgenic pigs due to saturation of microRNA pathways. J. Zhejiang Univ. Sci. B 2014, 15, 466–473. [Google Scholar] [CrossRef] [Green Version]
- Martí, E.; Estivill, X. Small non-coding RNAs add complexity to the RNA pathogenic mechanisms in trinucleotide repeat expansion diseases. Front. Mol. Neurosci. 2013, 6, 45. [Google Scholar] [CrossRef] [Green Version]
- Hall, M.; Frank, E.; Holmes, G.; Pfahringer, B.; Reutemann, P.; Witten, I.H. The WEKA Data Mining Software: An Update. SIGKDD Explor. Newsl. 2009, 11, 10–18. [Google Scholar] [CrossRef]
- Satopaa, V.; Albrecht, J.; Irwin, D.; Raghavan, B. Finding a Kneedle in a Haystack: Detecting Knee Points in System Behavior; Institute of Electrical and Electronics Engineers: Piscataway, NJ, USA, 2011; pp. 166–171. [Google Scholar]
- Kaimal, V.; Bardes, E.E.; Tabar, S.C.; Jegga, A.G.; Aronow, B.J. ToppCluster: A multiple gene list feature analyzer for comparative enrichment clustering and network-based dissection of biological systems. Nucleic Acids Res. 2010, 38, W96–W102. [Google Scholar] [CrossRef] [PubMed]
- Supek, F.; Bošnjak, M.; Škunca, N.; Šmuc, T. REVIGO Summarizes and Visualizes Long Lists of Gene Ontology Terms. PLoS ONE 2011, 6, e21800. [Google Scholar] [CrossRef] [PubMed]
- Shannon, P.; Markiel, A.; Ozier, O.; Baliga, N.S.; Wang, J.T.; Ramage, D.; Amin, N.; Schwikowski, B.; Ideker, T. Cytoscape: A Software Environment for Integrated Models of Biomolecular Interaction Networks. Genome Res. 2003, 13, 2498–2504. [Google Scholar] [CrossRef] [PubMed]
- Karagkouni, D.; Paraskevopoulou, M.D.; Chatzopoulos, S.; Vlachos, I.S.; Tastsoglou, S.; Kanellos, I.; Papadimitriou, D.; Kavakiotis, I.; Maniou, S.; Skoufos, G.; et al. DIANA-TarBase v8: A decade-long collection of experimentally supported miRNA–gene interactions. Nucleic Acids Res. 2017, 46, D239–D245. [Google Scholar] [CrossRef]
- Chou, C.H.; Shrestha, S.; Yang, C.D.; Chang, N.W.; Lin, Y.L.; Liao, K.W.; Huang, W.C.; Sun, T.H.; Tu, S.J.; Lee, W.H.; et al. miRTarBase update 2018: A resource for experimentally validated microRNA-target interactions. Nucleic Acids Res. 2017, 46, D296–D302. [Google Scholar] [CrossRef] [PubMed]
- Lee, Y.J.; Kim, V.; Muth, D.C.; Witwer, K.W. Validated microRNA target databases: An evaluation. Drug Dev. Res. 2015, 76, 389–396. [Google Scholar]
- Brouwer, C.; Luo, W. Pathview: An R/Bioconductor package for pathway-based data integration and visualization. Bioinformatics 2013, 29, 1830–1831. [Google Scholar] [CrossRef]
- Gentleman, R.C.; Carey, V.J.; Bates, D.M.; Bolstad, B.; Dettling, M.; Dudoit, S.; Ellis, B.; Gautier, L.; Ge, Y.; Gentry, J.; et al. Bioconductor: Open software development for computational biology and bioinformatics. Genome Biol. 2004, 5, R80. [Google Scholar] [CrossRef]


© 2019 by the authors. Licensee MDPI, Basel, Switzerland. This article is an open access article distributed under the terms and conditions of the Creative Commons Attribution (CC BY) license (http://creativecommons.org/licenses/by/4.0/).
Share and Cite
Oliveira, A.C.; Bovolenta, L.A.; Alves, L.; Figueiredo, L.; Ribeiro, A.O.; Campos, V.F.; Lemke, N.; Pinhal, D. Understanding the Modus Operandi of MicroRNA Regulatory Clusters. Cells 2019, 8, 1103. https://0-doi-org.brum.beds.ac.uk/10.3390/cells8091103
Oliveira AC, Bovolenta LA, Alves L, Figueiredo L, Ribeiro AO, Campos VF, Lemke N, Pinhal D. Understanding the Modus Operandi of MicroRNA Regulatory Clusters. Cells. 2019; 8(9):1103. https://0-doi-org.brum.beds.ac.uk/10.3390/cells8091103
Chicago/Turabian StyleOliveira, Arthur C., Luiz A. Bovolenta, Lucas Alves, Lucas Figueiredo, Amanda O. Ribeiro, Vinicius F. Campos, Ney Lemke, and Danillo Pinhal. 2019. "Understanding the Modus Operandi of MicroRNA Regulatory Clusters" Cells 8, no. 9: 1103. https://0-doi-org.brum.beds.ac.uk/10.3390/cells8091103