A Mathematical Model of Lysosomal Ion Homeostasis Points to Differential Effects of Cl− Transport in Ca2+ Dynamics

 , , and
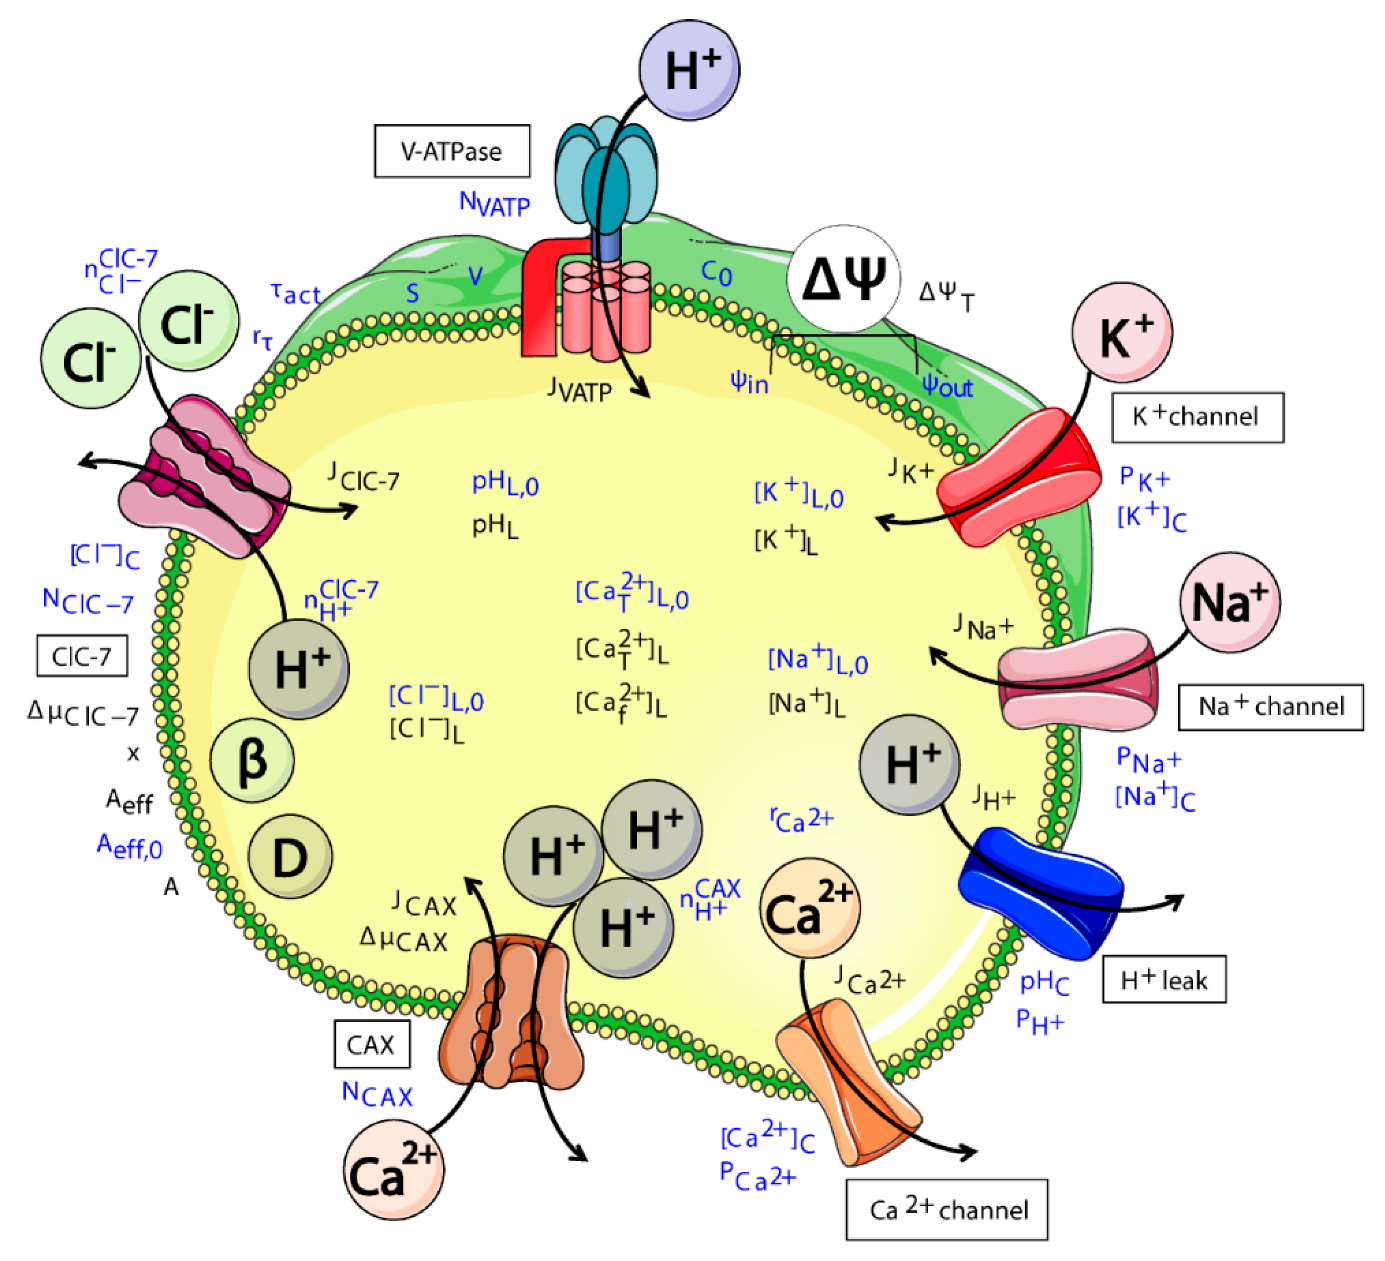
Abstract
:1. Introduction
2. Materials and Methods
2.1. Model Design
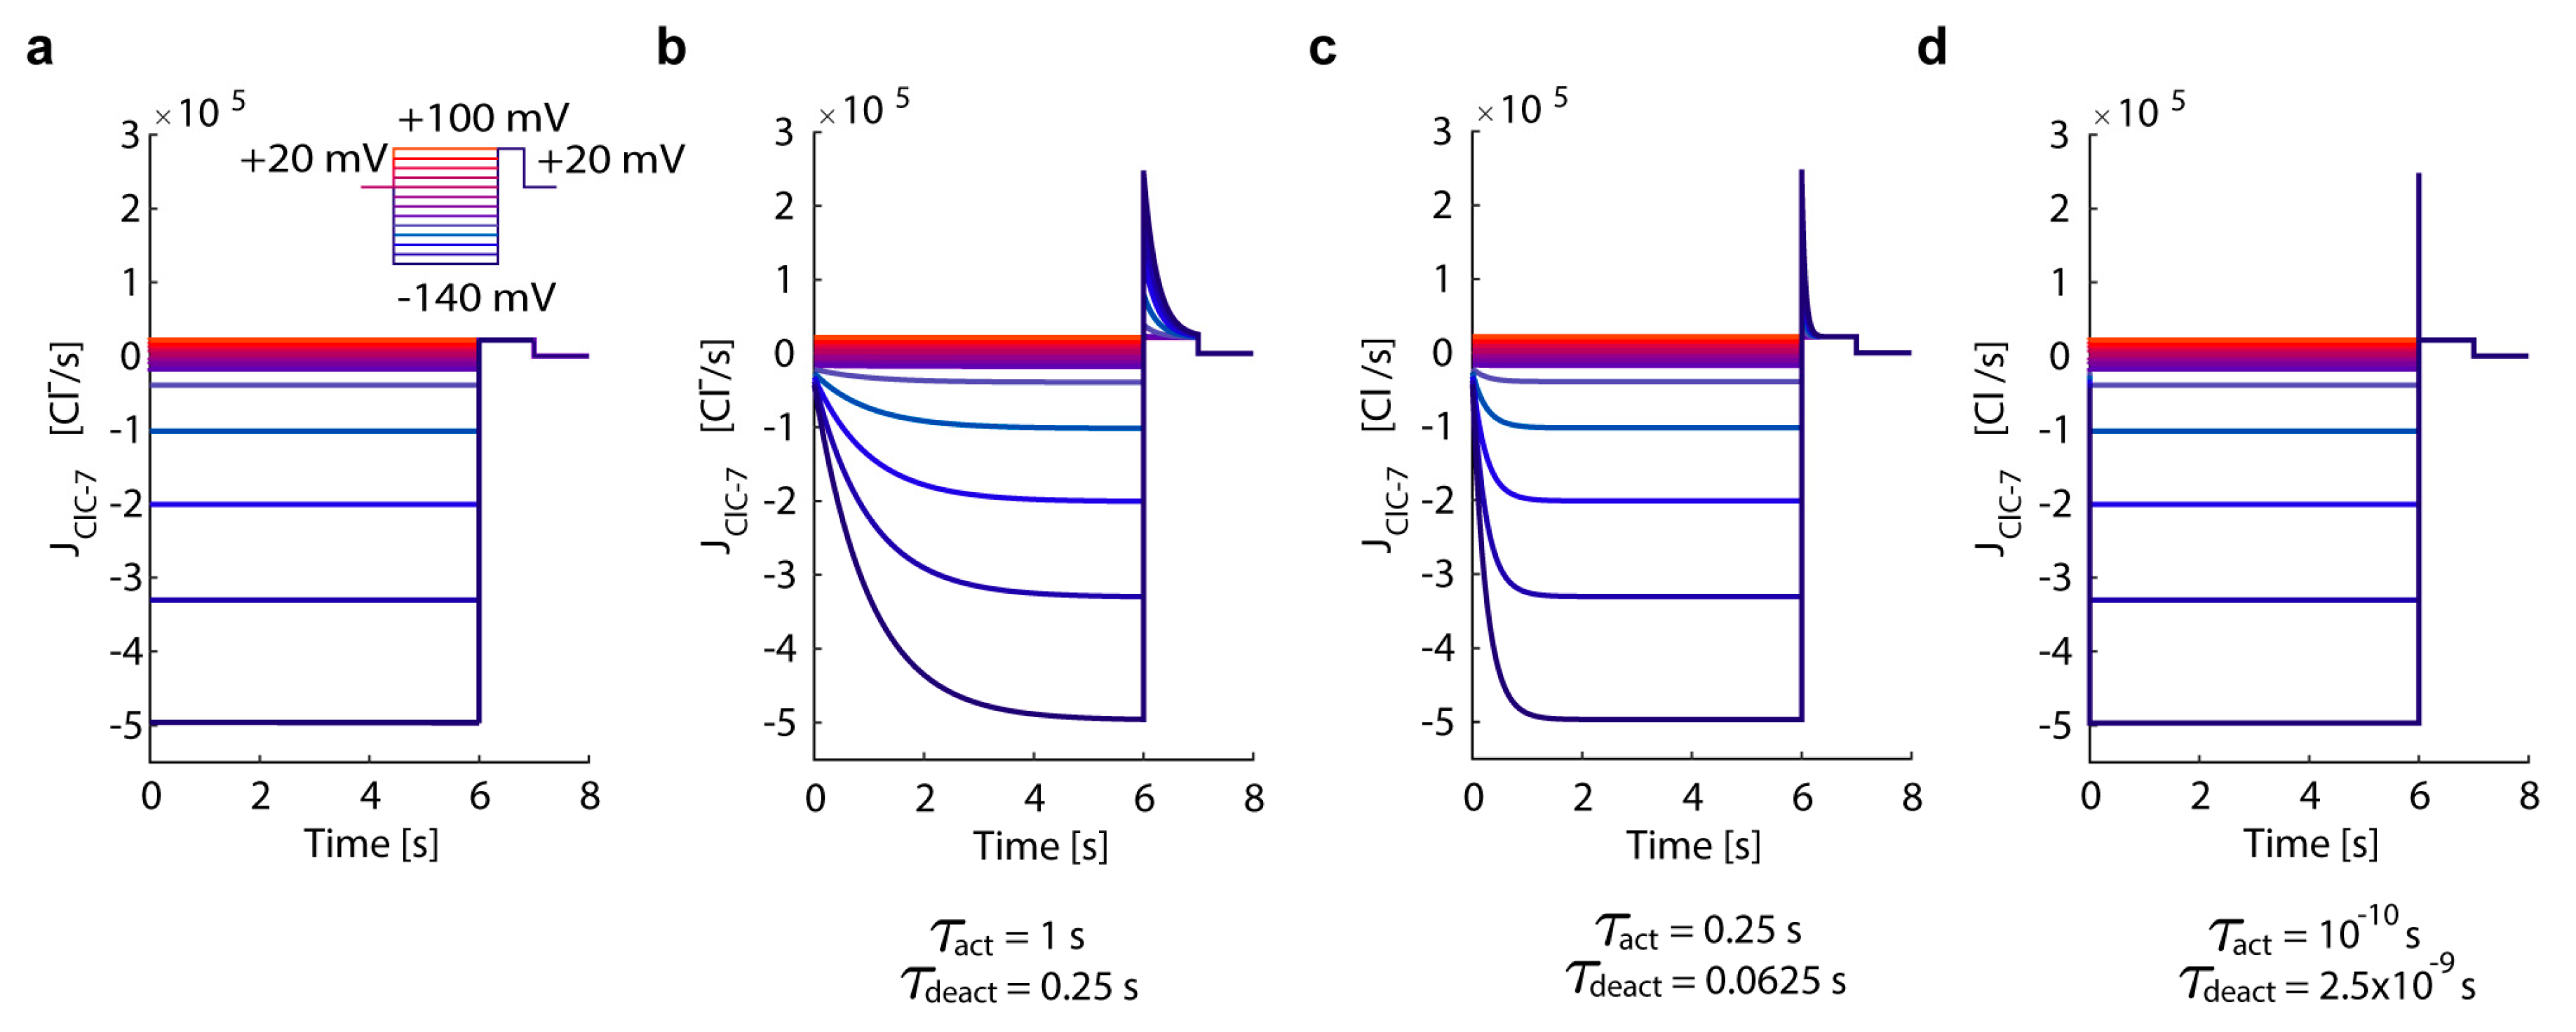
- ClC-7WT, which mimics a slowly voltage-gated antiporter [54] with delayed—not instantaneous—(de)activation kinetics.
- ClC-7fast, which mimics a ClC-7 antiporter with instantaneous (de)activation. This is an extreme scenario of the experimental observations, in which mutations accelerating the (de)activation kinetics also led to osteopetrosis [54].
- ClC-7unc, in which the chloride transport is mimicked by a passive chloride flux through a channel-like ClC-7 antiporter.
- ClC-7ko, which represents the absence of the antiporter.
2.2. Sensitivity Analysis
3. Results
3.1. In Silico Simulations Recapitulate Differential Voltage-Dependent Clc-7 Activation Kinetics
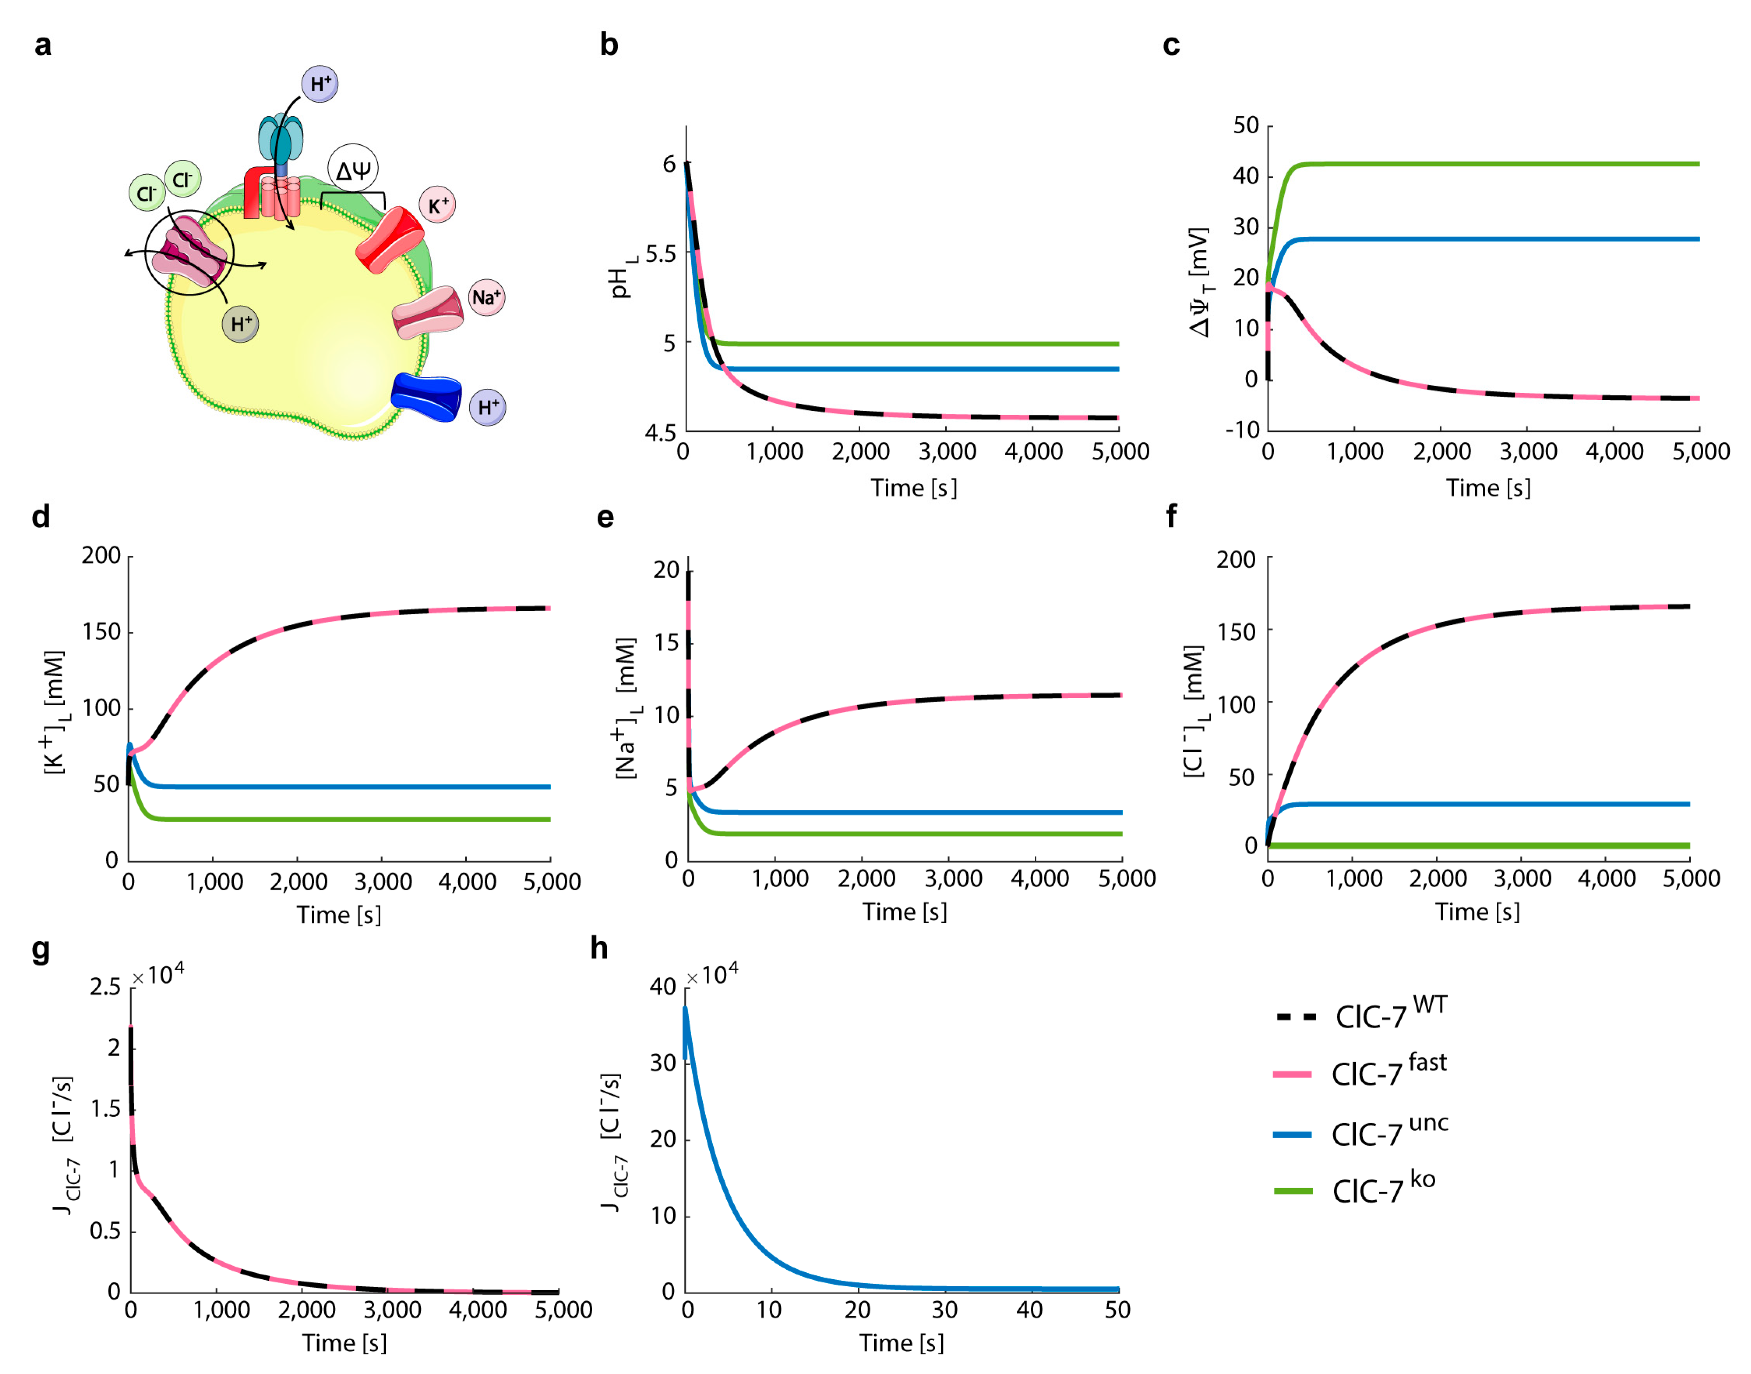
3.2. ClC-7 Activation Kinetics Do Not Affect Lysosomal Acidification
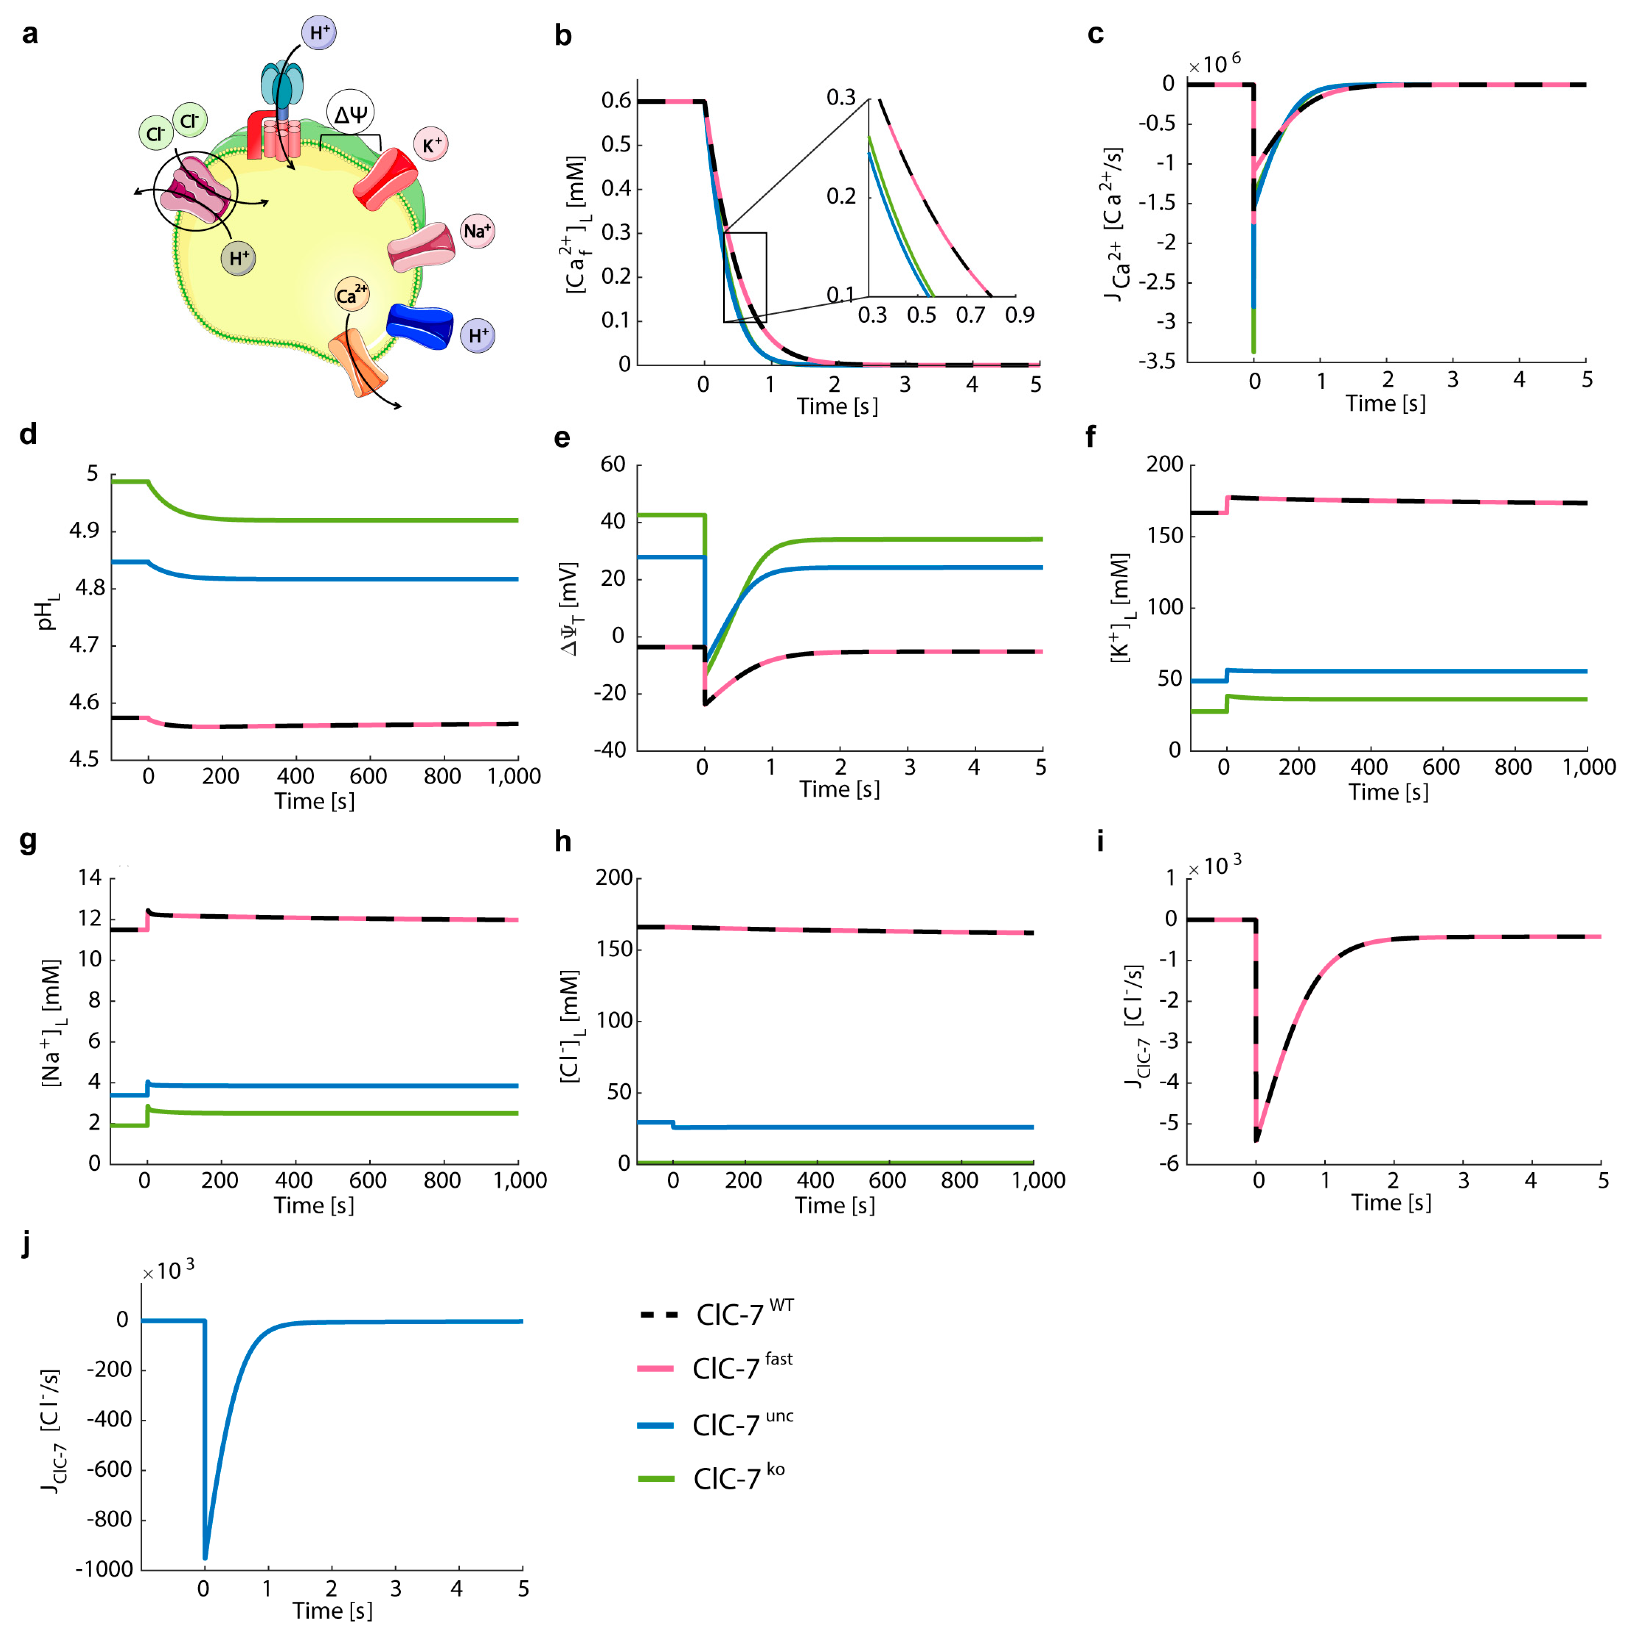
3.3. Perturbations on ClC-7 Differentially Affect Ca2+ Release
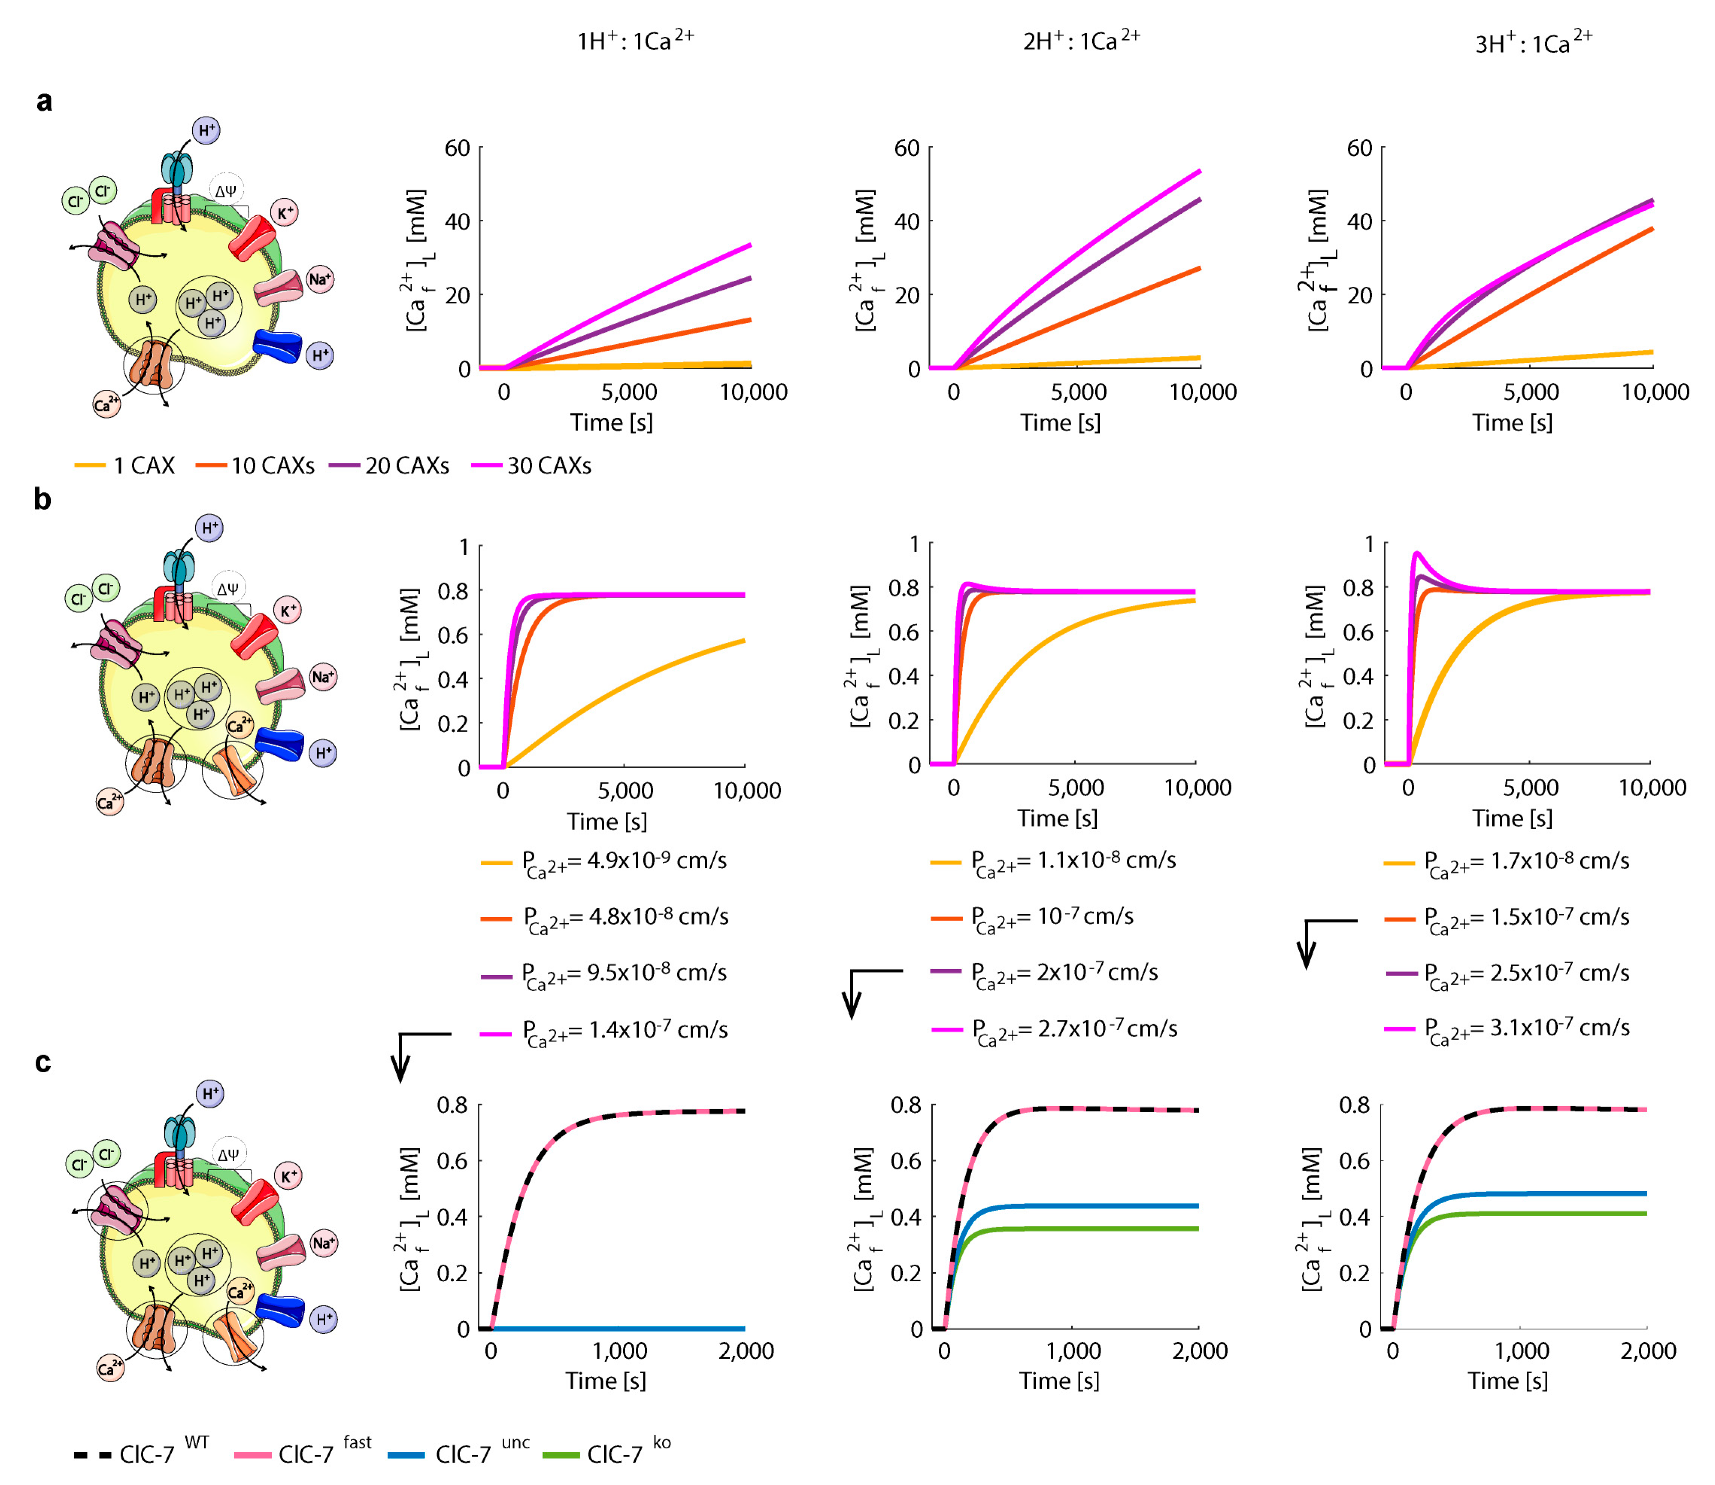
3.4. Chloride/Proton Exchanger Supports Lysosomal Ca2+ Uptake
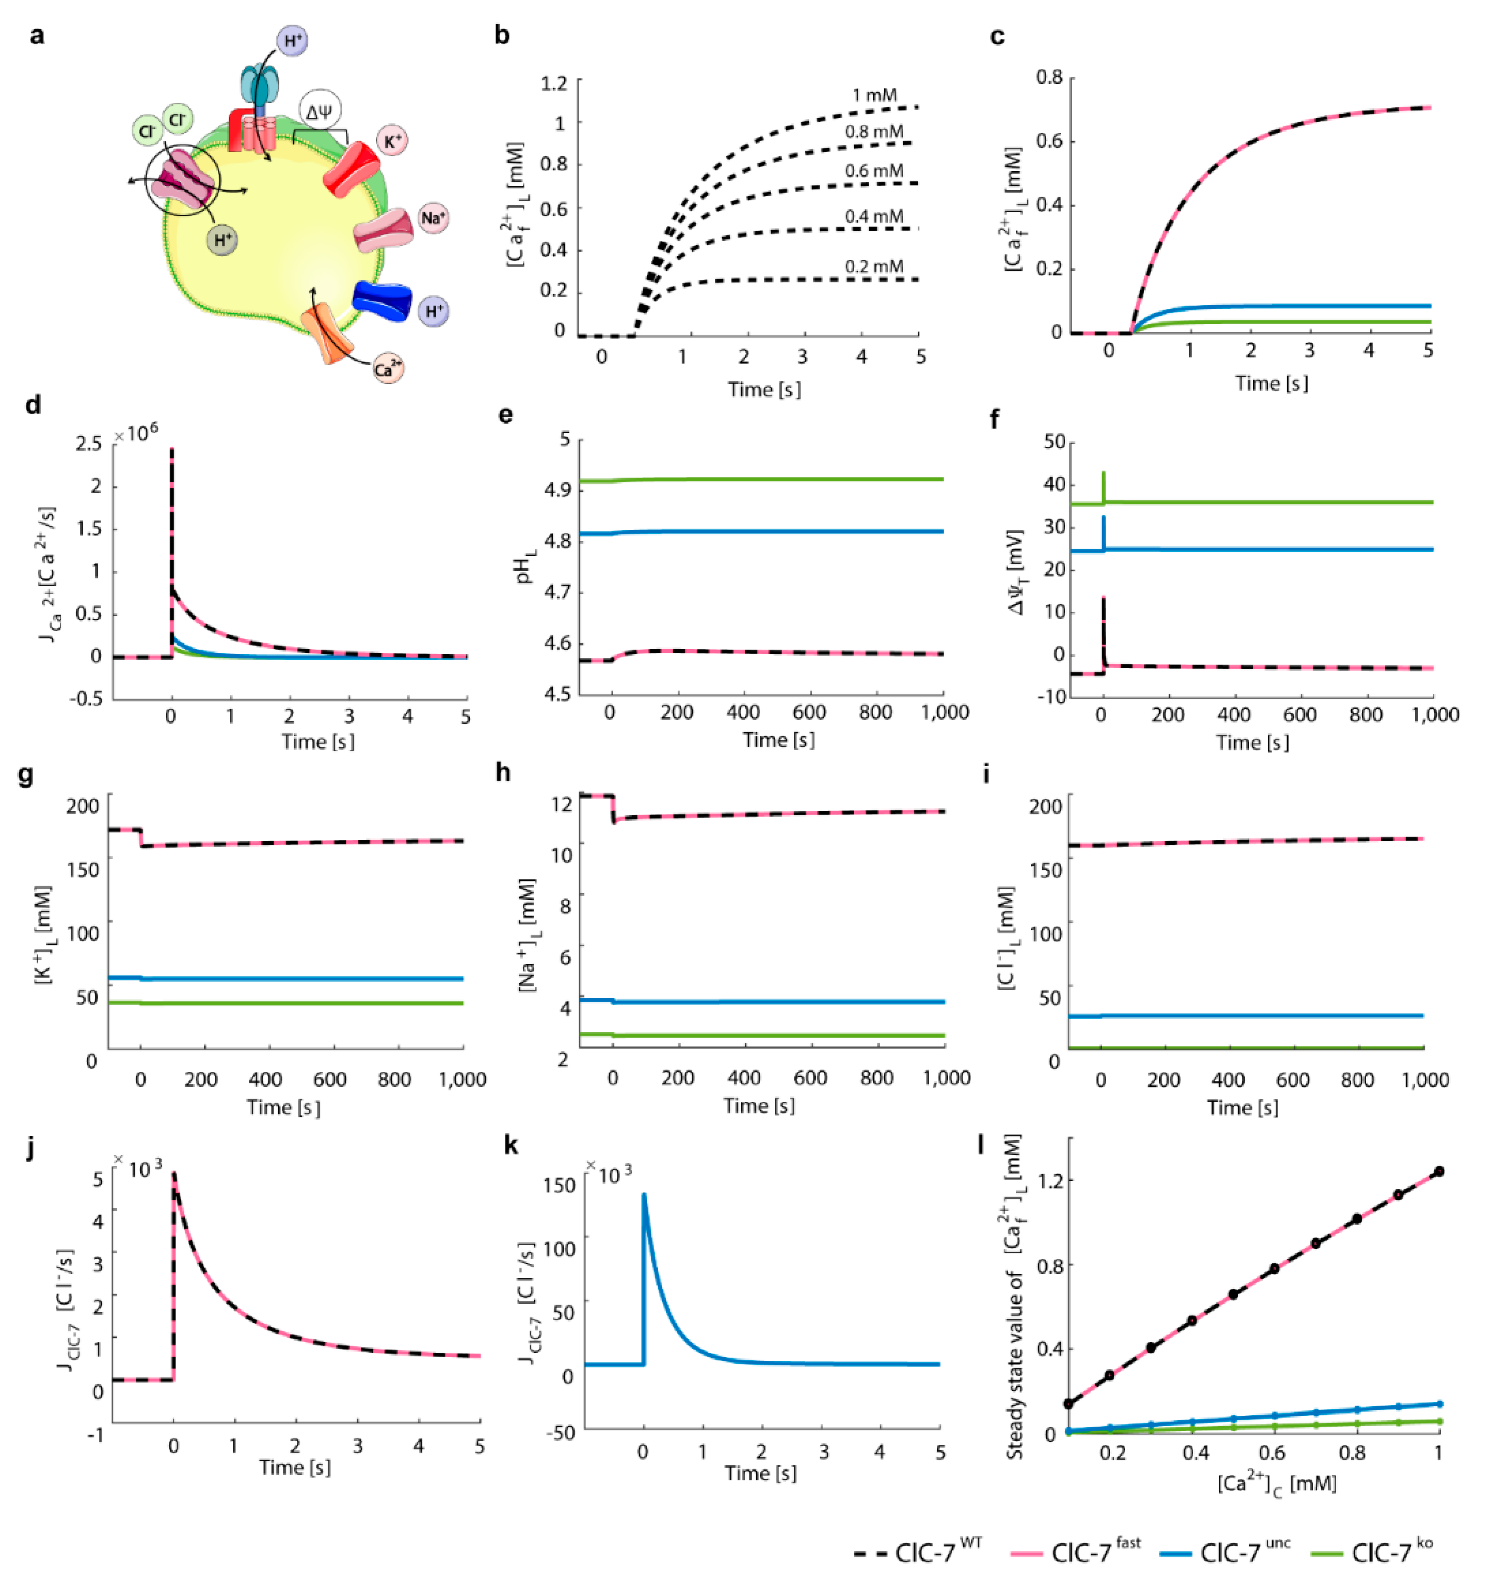
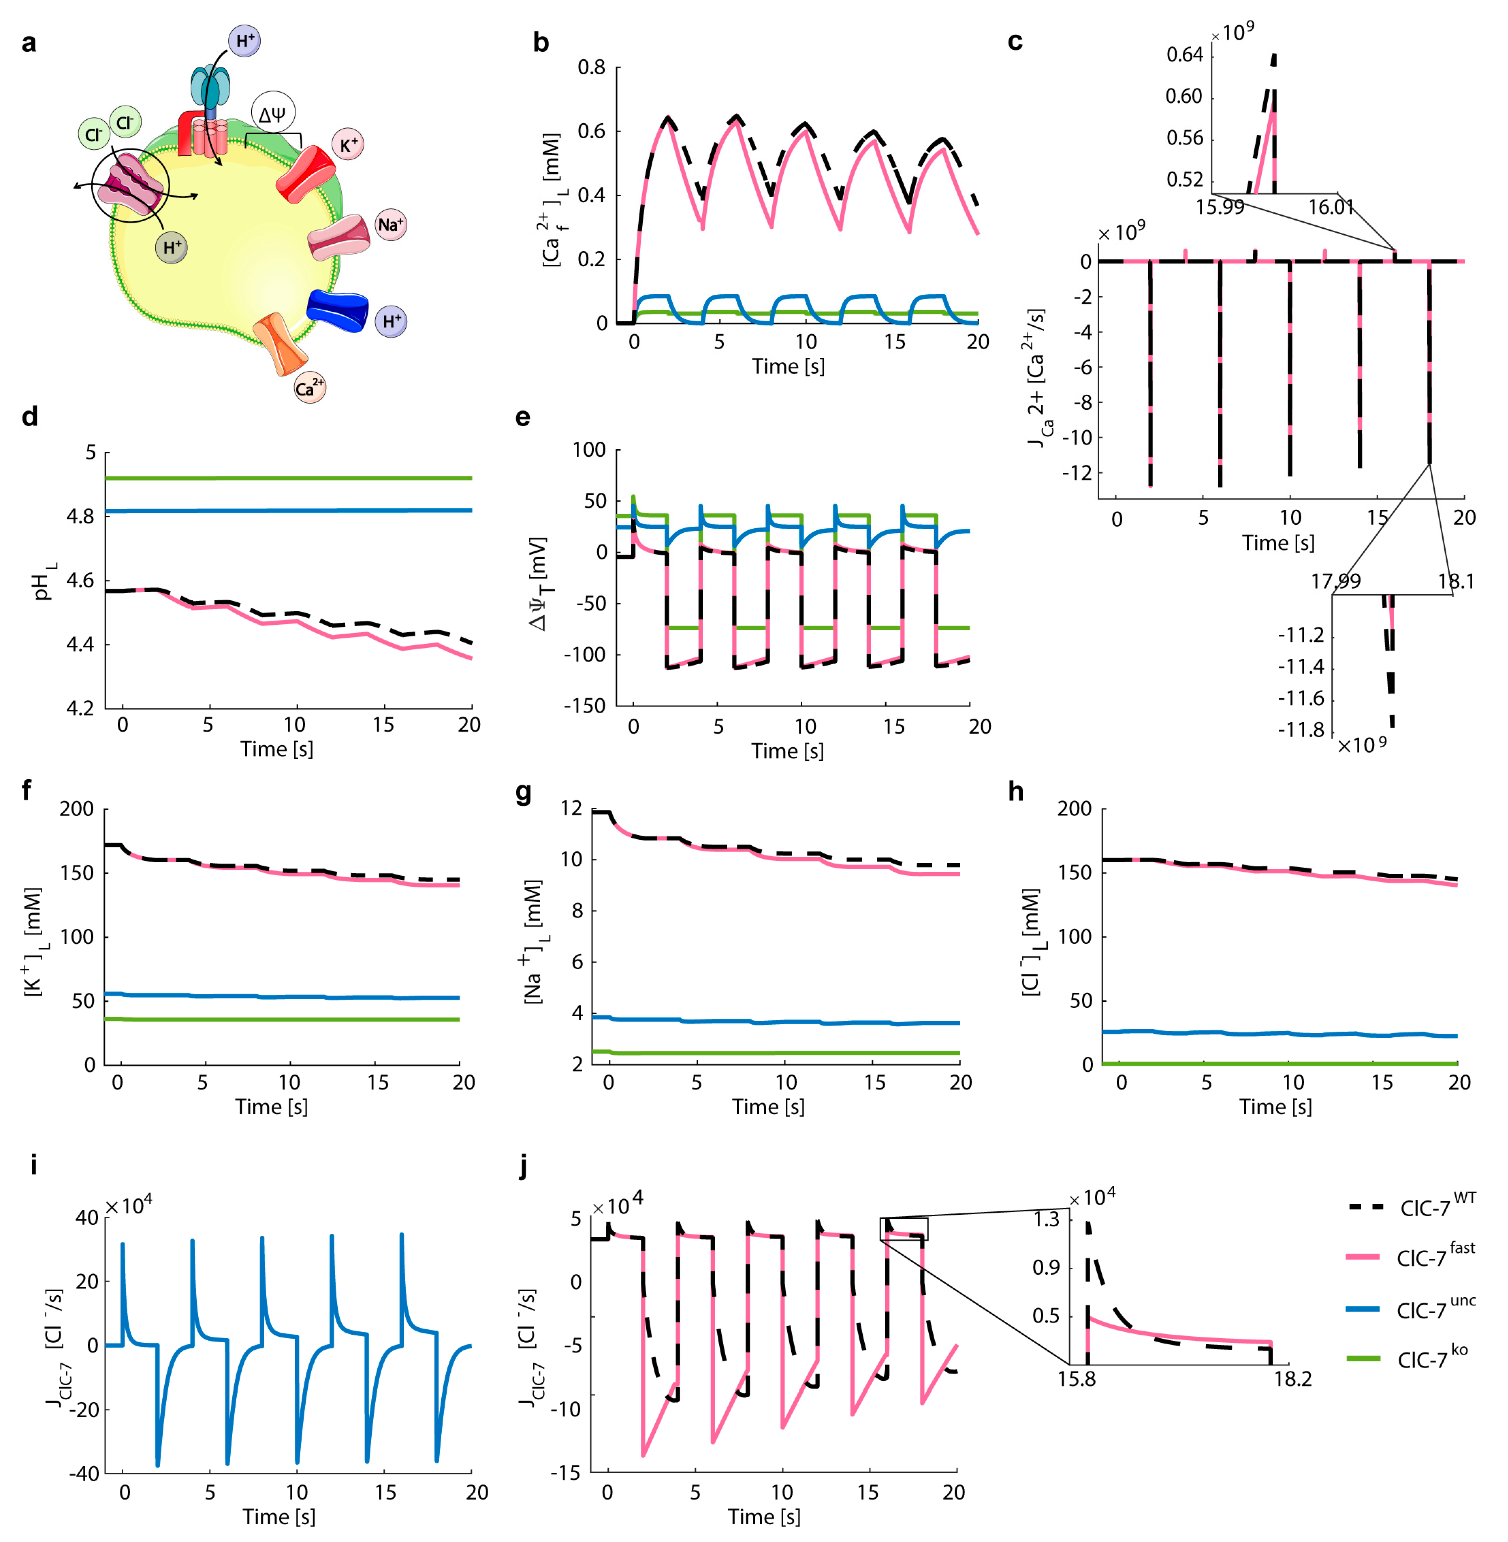
3.5. Lysosomal Chloride Transport Affects Ca2+ Dynamics
4. Discussion
Supplementary Materials
Author Contributions
Funding
Acknowledgments
Conflicts of Interest
References
- Wartosch, L.; Bright, N.A.; Luzio, J.P. Lysosomes. Curr. Biol. 2015, 25, R315–R316. [Google Scholar] [CrossRef] [PubMed] [Green Version]
- Saftig, P.; Klumperman, J. Lysosome biogenesis and lysosomal membrane proteins: Trafficking meets function. Nat. Rev. Mol. Cell Biol. 2009, 10, 623–635. [Google Scholar] [CrossRef] [PubMed]
- Settembre, C.; Fraldi, A.; Medina, D.L.; Ballabio, A. Signals from the lysosome: A control centre for cellular clearance and energy metabolism. Nat. Rev. Mol. Cell Biol. 2013, 14, 283–296. [Google Scholar] [CrossRef] [PubMed]
- Li, P.; Gu, M.; Xu, H. Lysosomal Ion Channels as Decoders of Cellular Signals. Trends Biochem. Sci. 2019, 44, 110–124. [Google Scholar] [CrossRef]
- Lawrence, R.E.; Zoncu, R. The lysosome as a cellular centre for signalling, metabolism and quality control. Nat. Cell Biol. 2019, 21, 133–142. [Google Scholar] [CrossRef]
- Lacombe, J.; Karsenty, G.; Ferron, M. Regulation of lysosome biogenesis and functions in osteoclasts. Cell Cycle 2013, 12, 2744–2752. [Google Scholar] [CrossRef] [Green Version]
- Pu, J.; Guardia, C.M.; Keren-Kaplan, T.; Bonifacino, J.S. Mechanisms and functions of lysosome positioning. J. Cell Sci. 2016, 129, 4329–4339. [Google Scholar] [CrossRef] [Green Version]
- Platt, F.M.; Boland, B.; van der Spoel, A.C. The cell biology of disease: Lysosomal storage disorders: The cellular impact of lysosomal dysfunction. J. Cell Biol. 2012, 199, 723–734. [Google Scholar] [CrossRef]
- Marques, A.R.A.; Saftig, P. Lysosomal storage disorders—Challenges, concepts and avenues for therapy: Beyond rare diseases. J. Cell Sci. 2019, 132. [Google Scholar] [CrossRef]
- Fraldi, A.; Klein, A.D.; Medina, D.L.; Settembre, C. Brain Disorders Due to Lysosomal Dysfunction. Annu. Rev. Neurosci. 2016, 39, 277–295. [Google Scholar] [CrossRef]
- Rebecca, V.W.; Nicastri, M.C.; McLaughlin, N.; Fennelly, C.; McAfee, Q.; Ronghe, A.; Nofal, M.; Lim, C.Y.; Witze, E.; Chude, C.I.; et al. A Unified Approach to Targeting the Lysosome’s Degradative and Growth Signaling Roles. Cancer Discov. 2017, 7, 1266–1283. [Google Scholar] [CrossRef]
- Davidson, S.M.; Vander Heiden, M.G. Critical Functions of the Lysosome in Cancer Biology. Annu. Rev. Pharmacol. Toxicol. 2017, 57, 481–507. [Google Scholar] [CrossRef]
- Long, J.E.; Drayson, M.T.; Taylor, A.E.; Toellner, K.M.; Lord, J.M.; Phillips, A.C. Morning vaccination enhances antibody response over afternoon vaccination: A cluster-randomised trial. Vaccine 2016, 34, 2679–2685. [Google Scholar] [CrossRef] [Green Version]
- Johnson, D.E.; Ostrowski, P.; Jaumouille, V.; Grinstein, S. The position of lysosomes within the cell determines their luminal pH. J. Cell Biol. 2016, 212, 677–692. [Google Scholar] [CrossRef] [Green Version]
- Walton, Z.E.; Patel, C.H.; Brooks, R.C.; Yu, Y.; Ibrahim-Hashim, A.; Riddle, M.; Porcu, A.; Jiang, T.; Ecker, B.L.; Tameire, F.; et al. Acid Suspends the Circadian Clock in Hypoxia through Inhibition of mTOR. Cell 2018, 174, 72–87.e32. [Google Scholar] [CrossRef] [PubMed] [Green Version]
- Xu, H.; Ren, D. Lysosomal physiology. Annu. Rev. Physiol. 2015, 77, 57–80. [Google Scholar] [CrossRef] [PubMed]
- Scott, C.C.; Gruenberg, J. Ion flux and the function of endosomes and lysosomes: pH is just the start: The flux of ions across endosomal membranes influences endosome function not only through regulation of the luminal pH. Bioessays 2011, 33, 103–110. [Google Scholar] [CrossRef] [PubMed]
- Marshansky, V.; Futai, M. The V-type H+-ATPase in vesicular trafficking: Targeting, regulation and function. Curr. Opin. Cell Biol. 2008, 20, 415–426. [Google Scholar] [CrossRef] [PubMed]
- Mindell, J.A. Lysosomal acidification mechanisms. Annu. Rev. Physiol. 2012, 74, 69–86. [Google Scholar] [CrossRef] [PubMed]
- Mellman, I.; Fuchs, R.; Helenius, A. Acidification of the endocytic and exocytic pathways. Annu. Rev. Biochem. 1986, 55, 663–700. [Google Scholar] [CrossRef] [PubMed]
- Van Dyke, R.W. Acidification of rat liver lysosomes: Quantitation and comparison with endosomes. Am. J. Physiol. 1993, 265, C901–C917. [Google Scholar] [CrossRef] [PubMed]
- Koivusalo, M.; Steinberg, B.E.; Mason, D.; Grinstein, S. In situ measurement of the electrical potential across the lysosomal membrane using FRET. Traffic 2011, 12, 972–982. [Google Scholar] [CrossRef] [PubMed]
- Saminathan, A.; Devany, J.; Pillai, K.S.; Veetil, A.T.; Schwake, M.; Krishnan, Y. A DNA-based voltmeter for organelles. bioRxiv 2019, 523019. [Google Scholar] [CrossRef] [Green Version]
- Cao, Q.; Zhong, X.Z.; Zou, Y.; Zhang, Z.; Toro, L.; Dong, X.P. BK Channels Alleviate Lysosomal Storage Diseases by Providing Positive Feedback Regulation of Lysosomal Ca2+ Release. Dev. Cell 2015, 33, 427–441. [Google Scholar] [CrossRef] [PubMed]
- Cang, C.; Zhou, Y.; Navarro, B.; Seo, Y.J.; Aranda, K.; Shi, L.; Battaglia-Hsu, S.; Nissim, I.; Clapham, D.E.; Ren, D. mTOR regulates lysosomal ATP-sensitive two-pore Na(+) channels to adapt to metabolic state. Cell 2013, 152, 778–790. [Google Scholar] [CrossRef]
- Wang, W.; Zhang, X.; Gao, Q.; Lawas, M.; Yu, L.; Cheng, X.; Gu, M.; Sahoo, N.; Li, X.; Li, P.; et al. A voltage-dependent K(+) channel in the lysosome is required for refilling lysosomal Ca(2+) stores. J. Cell Biol. 2017, 216, 1715–1730. [Google Scholar] [CrossRef]
- Luzio, J.P.; Pryor, P.R.; Bright, N.A. Lysosomes: Fusion and function. Nat. Rev. Mol. Cell Biol. 2007, 8, 622–632. [Google Scholar] [CrossRef]
- Morgan, A.J.; Platt, F.M.; Lloyd-Evans, E.; Galione, A. Molecular mechanisms of endolysosomal Ca2+ signalling in health and disease. Biochem. J. 2011, 439, 349–374. [Google Scholar] [CrossRef]
- Christensen, K.A.; Myers, J.T.; Swanson, J.A. pH-dependent regulation of lysosomal calcium in macrophages. J. Cell Sci. 2002, 115, 599–607. [Google Scholar]
- Patel, S.; Docampo, R. Acidic calcium stores open for business: Expanding the potential for intracellular Ca2+ signaling. Trends Cell Biol. 2010, 20, 277–286. [Google Scholar] [CrossRef]
- Melchionda, M.; Pittman, J.K.; Mayor, R.; Patel, S. Ca2+/H+ exchange by acidic organelles regulates cell migration in vivo. J. Cell Biol. 2016, 212, 803–813. [Google Scholar] [CrossRef] [PubMed] [Green Version]
- Garrity, A.G.; Wang, W.; Collier, C.M.; Levey, S.A.; Gao, Q.; Xu, H. The endoplasmic reticulum, not the pH gradient, drives calcium refilling of lysosomes. Elife 2016, 5. [Google Scholar] [CrossRef] [PubMed]
- Atakpa, P.; Thillaiappan, N.B.; Mataragka, S.; Prole, D.L.; Taylor, C.W. IP3 Receptors Preferentially Associate with ER-Lysosome Contact Sites and Selectively Deliver Ca(2+) to Lysosomes. Cell Rep. 2018, 25, 3180–3193.e3187. [Google Scholar] [CrossRef] [PubMed]
- Yang, J.; Zhao, Z.; Gu, M.; Feng, X.; Xu, H. Release and uptake mechanisms of vesicular Ca(2+) stores. Protein Cell 2019, 10, 8–19. [Google Scholar] [CrossRef] [PubMed]
- Di Paola, S.; Scotto-Rosato, A.; Medina, D.L. TRPML1: The Ca((2+))retaker of the lysosome. Cell Calcium 2018, 69, 112–121. [Google Scholar] [CrossRef] [PubMed]
- Morgan, A.J.; Davis, L.C.; Ruas, M.; Galione, A. TPC: The NAADP discovery channel? Biochem. Soc. Trans. 2015, 43, 384–389. [Google Scholar] [CrossRef] [PubMed]
- Tian, X.; Gala, U.; Zhang, Y.; Shang, W.; Nagarkar Jaiswal, S.; di Ronza, A.; Jaiswal, M.; Yamamoto, S.; Sandoval, H.; Duraine, L.; et al. A voltage-gated calcium channel regulates lysosomal fusion with endosomes and autophagosomes and is required for neuronal homeostasis. PLoS Biol. 2015, 13, e1002103. [Google Scholar] [CrossRef]
- Huang, P.; Zou, Y.; Zhong, X.Z.; Cao, Q.; Zhao, K.; Zhu, M.X.; Murrell-Lagnado, R.; Dong, X.P. P2X4 forms functional ATP-activated cation channels on lysosomal membranes regulated by luminal pH. J. Biol. Chem. 2014, 289, 17658–17667. [Google Scholar] [CrossRef]
- Steinberg, B.E.; Huynh, K.K.; Brodovitch, A.; Jabs, S.; Stauber, T.; Jentsch, T.J.; Grinstein, S. A cation counterflux supports lysosomal acidification. J. Cell Biol. 2010, 189, 1171–1186. [Google Scholar] [CrossRef] [Green Version]
- Wang, X.; Zhang, X.; Dong, X.P.; Samie, M.; Li, X.; Cheng, X.; Goschka, A.; Shen, D.; Zhou, Y.; Harlow, J.; et al. TPC proteins are phosphoinositide- activated sodium-selective ion channels in endosomes and lysosomes. Cell 2012, 151, 372–383. [Google Scholar] [CrossRef]
- Ruas, M.; Davis, L.C.; Chen, C.C.; Morgan, A.J.; Chuang, K.T.; Walseth, T.F.; Grimm, C.; Garnham, C.; Powell, T.; Platt, N.; et al. Expression of Ca(2)(+)-permeable two-pore channels rescues NAADP signalling in TPC-deficient cells. EMBO J. 2015, 34, 1743–1758. [Google Scholar] [CrossRef] [PubMed]
- Cang, C.; Aranda, K.; Seo, Y.J.; Gasnier, B.; Ren, D. TMEM175 Is an Organelle K(+) Channel Regulating Lysosomal Function. Cell 2015, 162, 1101–1112. [Google Scholar] [CrossRef] [PubMed]
- Bobak, N.; Feliciangeli, S.; Chen, C.C.; Ben Soussia, I.; Bittner, S.; Pagnotta, S.; Ruck, T.; Biel, M.; Wahl-Schott, C.; Grimm, C.; et al. Recombinant tandem of pore-domains in a Weakly Inward rectifying K(+) channel 2 (TWIK2) forms active lysosomal channels. Sci. Rep. 2017, 7, 649. [Google Scholar] [CrossRef] [PubMed]
- Saha, S.; Prakash, V.; Halder, S.; Chakraborty, K.; Krishnan, Y. A pH-independent DNA nanodevice for quantifying chloride transport in organelles of living cells. Nat. Nanotechnol. 2015, 10, 645–651. [Google Scholar] [CrossRef] [PubMed]
- Chakraborty, K.; Leung, K.; Krishnan, Y. High lumenal chloride in the lysosome is critical for lysosome function. Elife 2017, 6. [Google Scholar] [CrossRef] [PubMed] [Green Version]
- Stauber, T.; Jentsch, T.J. Chloride in vesicular trafficking and function. Annu. Rev. Physiol. 2013, 75, 453–477. [Google Scholar] [CrossRef] [PubMed]
- Kornak, U.; Kasper, D.; Bösl, M.R.; Kaiser, E.; Schweizer, M.; Schulz, A.; Friedrich, W.; Delling, G.; Jentsch, T.J. Loss of the ClC-7 chloride channel leads to osteopetrosis in mice and man. Cell 2001, 104, 205–215. [Google Scholar] [CrossRef]
- Kasper, D.; Planells-Cases, R.; Fuhrmann, J.C.; Scheel, O.; Zeitz, O.; Ruether, K.; Schmitt, A.; Poët, M.; Steinfeld, R.; Schweizer, M.; et al. Loss of the chloride channel ClC-7 leads to lysosomal storage disease and neurodegeneration. EMBO J. 2005, 24, 1079–1091. [Google Scholar] [CrossRef]
- Graves, A.R.; Curran, P.K.; Smith, C.L.; Mindell, J.A. The Cl−/H+ antiporter ClC-7 is the primary chloride permeation pathway in lysosomes. Nature 2008, 453, 788–792. [Google Scholar] [CrossRef]
- Stauber, T.; Weinert, S.; Jentsch, T.J. Cell biology and physiology of CLC chloride channels and transporters. Compr. Physiol. 2012, 2, 1701–1744. [Google Scholar]
- Jentsch, T.J.; Pusch, M. CLC Chloride Channels and Transporters: Structure, Function, Physiology, and Disease. Physiol. Rev. 2018, 98, 1493–1590. [Google Scholar] [CrossRef] [PubMed]
- Zifarelli, G. A tale of two CLCs: Biophysical insights toward understanding ClC-5 and ClC-7 function in endosomes and lysosomes. J. Physiol. 2015, 593, 4139–4150. [Google Scholar] [CrossRef] [PubMed]
- Weinert, S.; Jabs, S.; Supanchart, C.; Schweizer, M.; Gimber, N.; Richter, M.; Rademann, J.; Stauber, T.; Kornak, U.; Jentsch, T.J. Lysosomal pathology and osteopetrosis upon loss of H+-driven lysosomal Cl− accumulation. Science 2010, 328, 1401–1403. [Google Scholar] [CrossRef] [PubMed]
- Leisle, L.; Ludwig, C.F.; Wagner, F.A.; Jentsch, T.J.; Stauber, T. ClC-7 is a slowly voltage-gated 2Cl−/1H+-exchanger and requires Ostm1 for transport activity. EMBO J. 2011, 30, 2140–2152. [Google Scholar] [CrossRef] [PubMed]
- Lange, P.F.; Wartosch, L.; Jentsch, T.J.; Fuhrmann, J.C. ClC-7 requires Ostm1 as a β-subunit to support bone resorption and lysosomal function. Nature 2006, 440, 220–223. [Google Scholar] [CrossRef] [PubMed]
- Wartosch, L.; Fuhrmann, J.C.; Schweizer, M.; Stauber, T.; Jentsch, T.J. Lysosomal degradation of endocytosed proteins depends on the chloride transport protein ClC-7. FASEB J 2009, 23, 4056–4068. [Google Scholar] [CrossRef]
- Chalhoub, N.; Benachenhou, N.; Rajapurohitam, V.; Pata, M.; Ferron, M.; Frattini, A.; Villa, A.; Vacher, J. Grey-lethal mutation induces severe malignant autosomal recessive osteopetrosis in mouse and human. Nat. Med. 2003, 9, 399–406. [Google Scholar] [CrossRef] [PubMed]
- Pressey, S.N.; O’Donnell, K.J.; Stauber, T.; Fuhrmann, J.C.; Tyynela, J.; Jentsch, T.J.; Cooper, J.D. Distinct neuropathologic phenotypes after disrupting the chloride transport proteins ClC-6 or ClC-7/Ostm1. J. Neuropathol. Exp. Neurol. 2010, 69, 1228–1246. [Google Scholar] [CrossRef]
- Sartelet, A.; Stauber, T.; Coppieters, W.; Ludwig, C.F.; Fasquelle, C.; Druet, T.; Zhang, Z.; Ahariz, N.; Cambisano, N.; Jentsch, T.J.; et al. A missense mutation accelerating the gating of the lysosomal Cl-/H+-exchanger ClC-7/Ostm1 causes osteopetrosis with gingival hamartomas in cattle. Dis. Models Mech. 2014, 7, 119–128. [Google Scholar] [CrossRef]
- Barvencik, F.; Kurth, I.; Koehne, T.; Stauber, T.; Zustin, J.; Tsiakas, K.; Ludwig, C.F.; Beil, F.T.; Pestka, J.M.; Hahn, M.; et al. CLCN7 and TCIRG1 mutations differentially affect bone matrix mineralization in osteopetrotic individuals. J. Bone Miner. Res. 2014, 29, 982–991. [Google Scholar] [CrossRef]
- Grabe, M.; Oster, G. Regulation of organelle acidity. J. Gen. Physiol. 2001, 117, 329–344. [Google Scholar] [CrossRef] [PubMed]
- Ishida, Y.; Nayak, S.; Mindell, J.A.; Grabe, M. A model of lysosomal pH regulation. J. Gen. Physiol. 2013, 141, 705–720. [Google Scholar] [CrossRef] [PubMed] [Green Version]
- Rybak, S.L.; Lanni, F.; Murphy, R.F. Theoretical considerations on the role of membrane potential in the regulation of endosomal pH. Biophys. J. 1997, 73, 674–687. [Google Scholar] [CrossRef] [Green Version]
- Penny, C.J.; Kilpatrick, B.S.; Han, J.M.; Sneyd, J.; Patel, S. A computational model of lysosome-ER Ca2+ microdomains. J. Cell Sci. 2014, 127, 2934–2943. [Google Scholar] [CrossRef]
- Marcoline, F.V.; Ishida, Y.; Mindell, J.A.; Nayak, S.; Grabe, M. A mathematical model of osteoclast acidification during bone resorption. Bone 2016, 93, 167–180. [Google Scholar] [CrossRef]
- Stauber, T.; Jentsch, T.J. Sorting motifs of the endosomal/lysosomal CLC chloride transporters. J. Biol. Chem. 2010, 285, 34537–34548. [Google Scholar] [CrossRef]
- Ludwig, C.F.; Ullrich, F.; Leisle, L.; Stauber, T.; Jentsch, T.J. Common gating of both CLC transporter subunits underlies voltage-dependent activation of the 2Cl-/1H+ exchanger ClC-7/Ostm1. J. Biol. Chem. 2013, 288, 28611–28619. [Google Scholar] [CrossRef]
- Dong, X.P.; Cheng, X.; Mills, E.; Delling, M.; Wang, F.; Kurz, T.; Xu, H. The type IV mucolipidosis-associated protein TRPML1 is an endolysosomal iron release channel. Nature 2008, 455, 992–996. [Google Scholar] [CrossRef] [Green Version]
- Xu, H.; Delling, M.; Li, L.; Dong, X.; Clapham, D.E. Activating mutation in a mucolipin transient receptor potential channel leads to melanocyte loss in varitint-waddler mice. Proc. Natl. Acad. Sci. USA 2007, 104, 18321–18326. [Google Scholar] [CrossRef] [PubMed]
- Samtleben, S.; Jaepel, J.; Fecher, C.; Andreska, T.; Rehberg, M.; Blum, R. Direct imaging of ER calcium with targeted-esterase induced dye loading (TED). J. Vis. Exp. 2013, e50317. [Google Scholar] [CrossRef] [PubMed]
- Lopez Sanjurjo, C.I.; Tovey, S.C.; Taylor, C.W. Rapid recycling of Ca2+ between IP3-sensitive stores and lysosomes. PLoS ONE 2014, 9, e111275. [Google Scholar] [CrossRef] [PubMed]
- Lopez-Sanjurjo, C.I.; Tovey, S.C.; Prole, D.L.; Taylor, C.W. Lysosomes shape Ins(1,4,5)P3-evoked Ca2+ signals by selectively sequestering Ca2+ released from the endoplasmic reticulum. J. Cell Sci. 2013, 126, 289–300. [Google Scholar] [CrossRef] [PubMed]
- Schulz, P.; Werner, J.; Stauber, T.; Henriksen, K.; Fendler, K. The G215R mutation in the Cl−/H+-antiporter ClC-7 found in ADO II osteopetrosis does not abolish function but causes a severe trafficking defect. PLoS ONE 2010, 5, e12585. [Google Scholar] [CrossRef] [PubMed]
- Zanardi, I.; Zifarelli, G.; Pusch, M. An optical assay of the transport activity of ClC-7. Sci. Rep. 2013, 3, 1231. [Google Scholar] [CrossRef] [Green Version]
- Fuhr, L.; Abreu, M.; Pett, P.; Relogio, A. Circadian systems biology: When time matters. Comput. Struct. Biotechnol. J. 2015, 13, 417–426. [Google Scholar] [CrossRef] [Green Version]
- Mazzoccoli, G.; Mazza, T.; Vinciguerra, M.; Castellana, S.; Scarpa, M. The biological clock and the molecular basis of lysosomal storage diseases. JIMD Rep. 2015, 18, 93–105. [Google Scholar] [CrossRef]
- Morgan, A.J.; Galione, A. NAADP induces pH changes in the lumen of acidic Ca2+ stores. Biochem. J. 2007, 402, 301–310. [Google Scholar] [CrossRef]
- Leung, K.; Chakraborty, K.; Saminathan, A.; Krishnan, Y. A DNA nanomachine chemically resolves lysosomes in live cells. Nat. Nanotechnol. 2019, 14, 176–183. [Google Scholar] [CrossRef]
- Relogio, A.; Westermark, P.O.; Wallach, T.; Schellenberg, K.; Kramer, A.; Herzel, H. Tuning the mammalian circadian clock: Robust synergy of two loops. PLoS Comput. Biol. 2011, 7, e1002309. [Google Scholar] [CrossRef]
- Zhitomirsky, B.; Assaraf, Y.G. Lysosomes as mediators of drug resistance in cancer. Drug Resist. Updates 2016, 24, 23–33. [Google Scholar] [CrossRef]
- Halaby, R. Influence of lysosomal sequestration on multidrug resistance in cancer cells. Cancer Drug Resist. 2019, 2, 31–42. [Google Scholar] [CrossRef]
- de Klerk, D.J.; Honeywell, R.J.; Jansen, G.; Peters, G.J. Transporter and Lysosomal Mediated (Multi)drug Resistance to Tyrosine Kinase Inhibitors and Potential Strategies to Overcome Resistance. Cancers 2018, 10, 503. [Google Scholar] [CrossRef] [PubMed]
- Xu, H.; Wang, Z.; Mo, G.; Chen, H. Association between circadian gene CLOCK and cisplatin resistance in ovarian cancer cells: A preliminary study. Oncol. Lett. 2018, 15, 8945–8950. [Google Scholar] [CrossRef] [PubMed]
- Lin, H.H.; Farkas, M.E. Altered Circadian Rhythms and Breast Cancer: From the Human to the Molecular Level. Front. Endocrinol. 2018, 9, 219. [Google Scholar] [CrossRef] [PubMed]
- Igarashi, T.; Izumi, H.; Uchiumi, T.; Nishio, K.; Arao, T.; Tanabe, M.; Uramoto, H.; Sugio, K.; Yasumoto, K.; Sasaguri, Y.; et al. Clock and ATF4 transcription system regulates drug resistance in human cancer cell lines. Oncogene 2007, 26, 4749–4760. [Google Scholar] [CrossRef] [Green Version]
- Fu, L.; Kettner, N.M. The circadian clock in cancer development and therapy. Prog. Mol. Biol. Transl. Sci. 2013, 119, 221–282. [Google Scholar] [CrossRef]
- Narayanaswamy, N.; Chakraborty, K.; Saminathan, A.; Zeichner, E.; Leung, K.; Devany, J.; Krishnan, Y. A pH-correctable, DNA-based fluorescent reporter for organellar calcium. Nat. Methods 2019, 16, 95–102. [Google Scholar] [CrossRef]


© 2019 by the authors. Licensee MDPI, Basel, Switzerland. This article is an open access article distributed under the terms and conditions of the Creative Commons Attribution (CC BY) license (http://creativecommons.org/licenses/by/4.0/).
Share and Cite
Astaburuaga, R.; Quintanar Haro, O.D.; Stauber, T.; Relógio, A. A Mathematical Model of Lysosomal Ion Homeostasis Points to Differential Effects of Cl− Transport in Ca2+ Dynamics. Cells 2019, 8, 1263. https://0-doi-org.brum.beds.ac.uk/10.3390/cells8101263
Astaburuaga R, Quintanar Haro OD, Stauber T, Relógio A. A Mathematical Model of Lysosomal Ion Homeostasis Points to Differential Effects of Cl− Transport in Ca2+ Dynamics. Cells. 2019; 8(10):1263. https://0-doi-org.brum.beds.ac.uk/10.3390/cells8101263
Chicago/Turabian StyleAstaburuaga, Rosario, Orlando Daniel Quintanar Haro, Tobias Stauber, and Angela Relógio. 2019. "A Mathematical Model of Lysosomal Ion Homeostasis Points to Differential Effects of Cl− Transport in Ca2+ Dynamics" Cells 8, no. 10: 1263. https://0-doi-org.brum.beds.ac.uk/10.3390/cells8101263