Clusterin Attenuates Hepatic Fibrosis by Inhibiting Hepatic Stellate Cell Activation and Downregulating the Smad3 Signaling Pathway

 ,
,  and
and 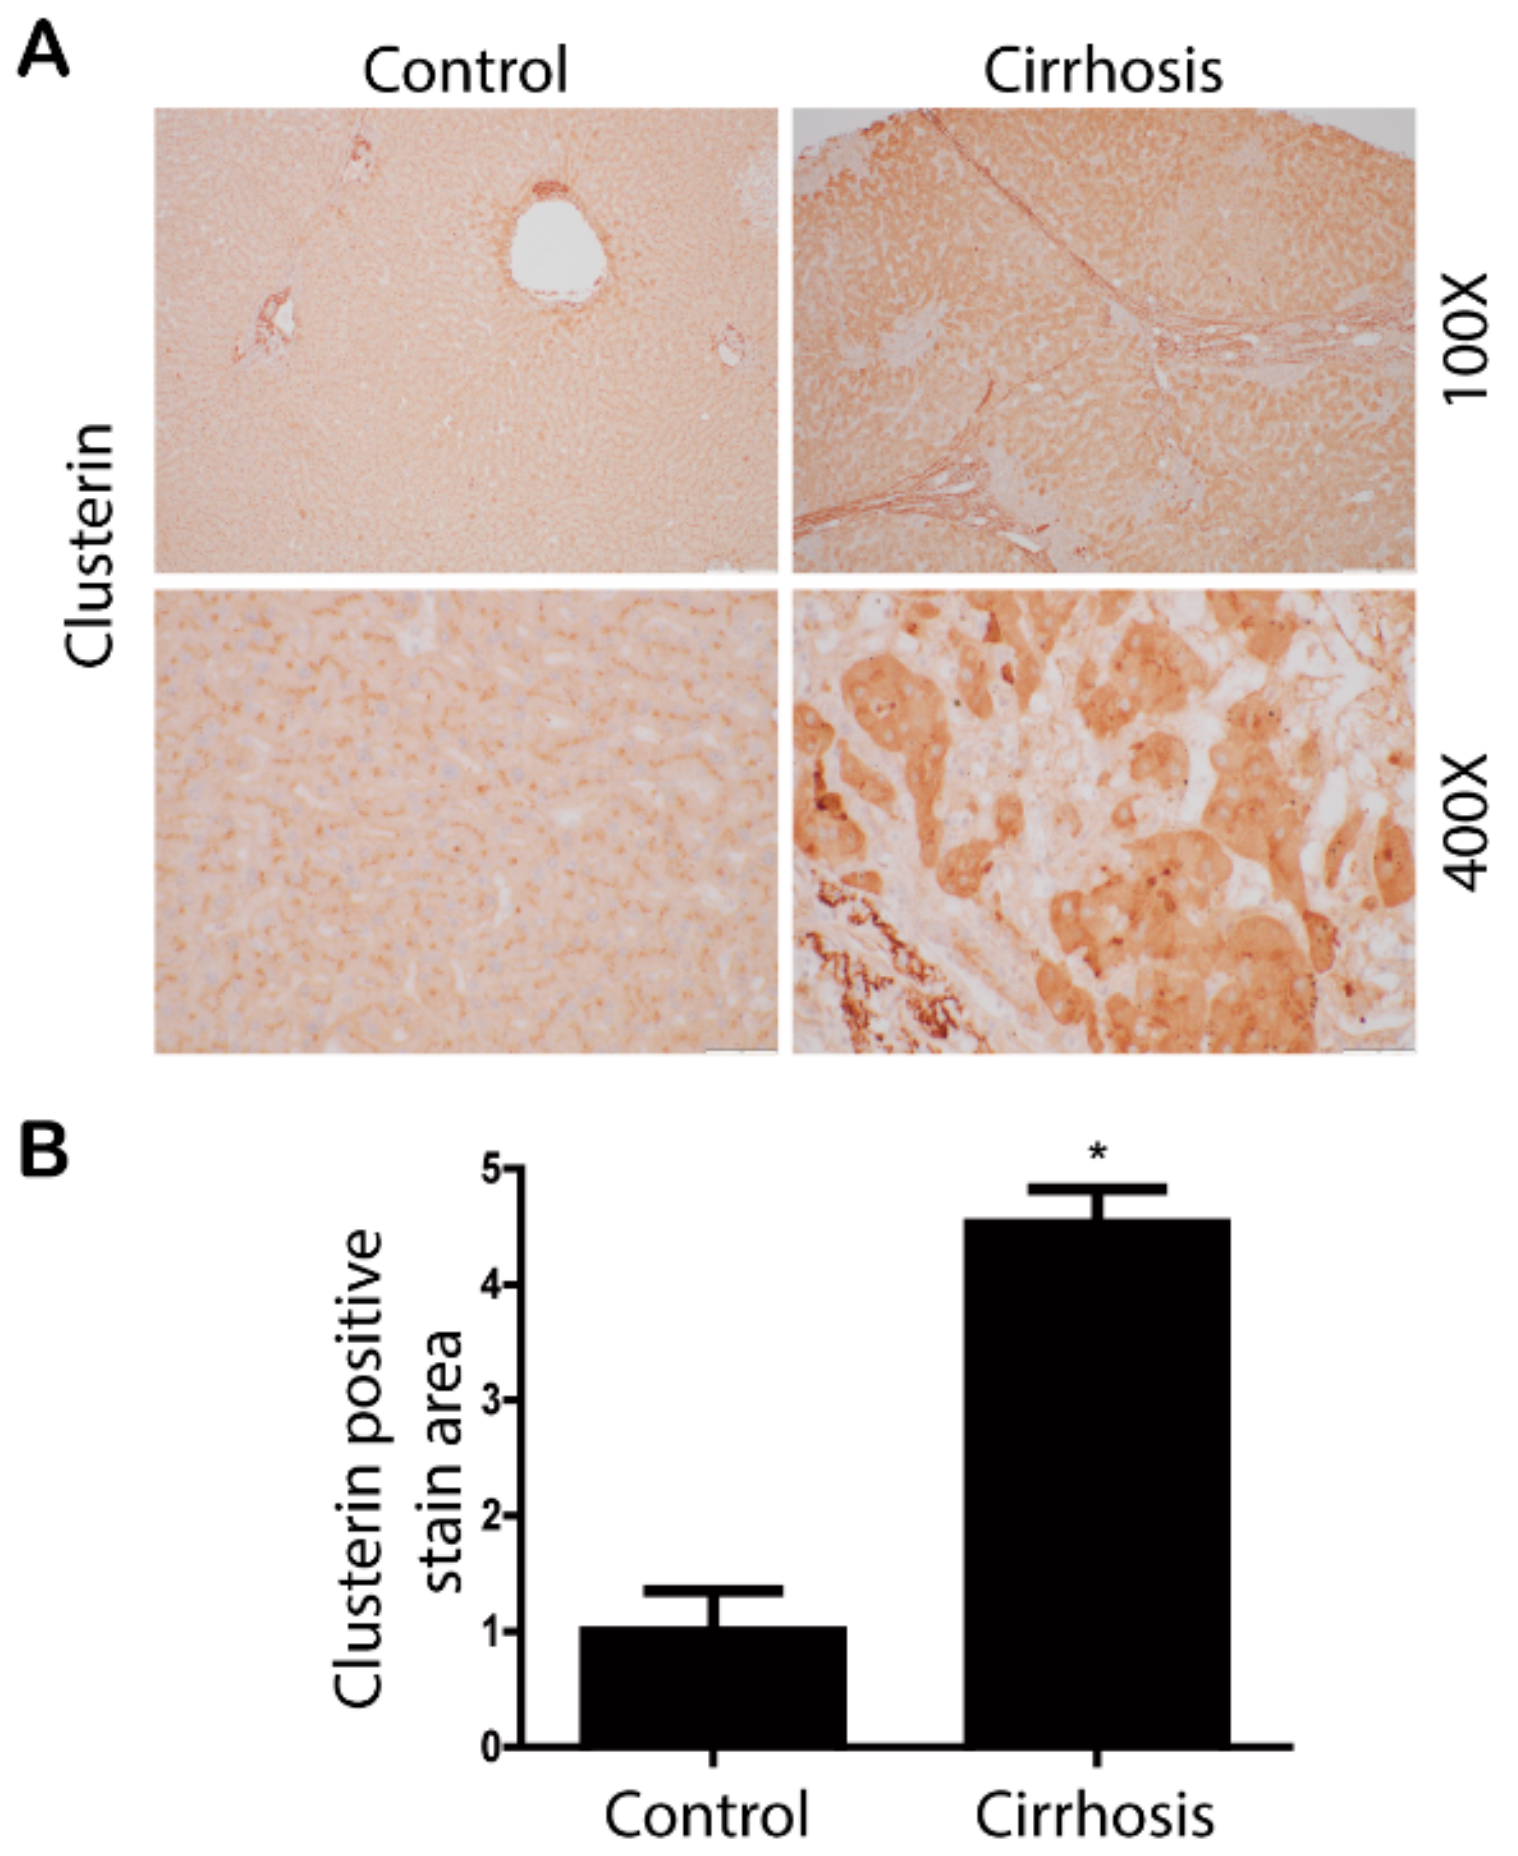
Abstract
:1. Introduction
2. Materials and Methods
2.1. Chemicals
2.2. Isolation of Primary HSCs
2.3. Animals
2.3.1. Animal Experiments 1 (TAA-Induced Liver Fibrosis Model)
2.3.2. Animal Experiments 2 (Bile Duct Ligation (BDL)-Induced Liver Fibrosis Model)
2.3.3. Animal Experiments 3 (High-Fat Diet Fed Mice)
2.4. Cell Culture
2.5. Generation of Recombinant Adenovirus
2.6. Quantitative Real-Time RT-PCR
2.7. Western Blotting
2.8. Immunohistochemical Analysis
2.9. Patients and Specimens
2.10. Statistical Analysis
3. Results
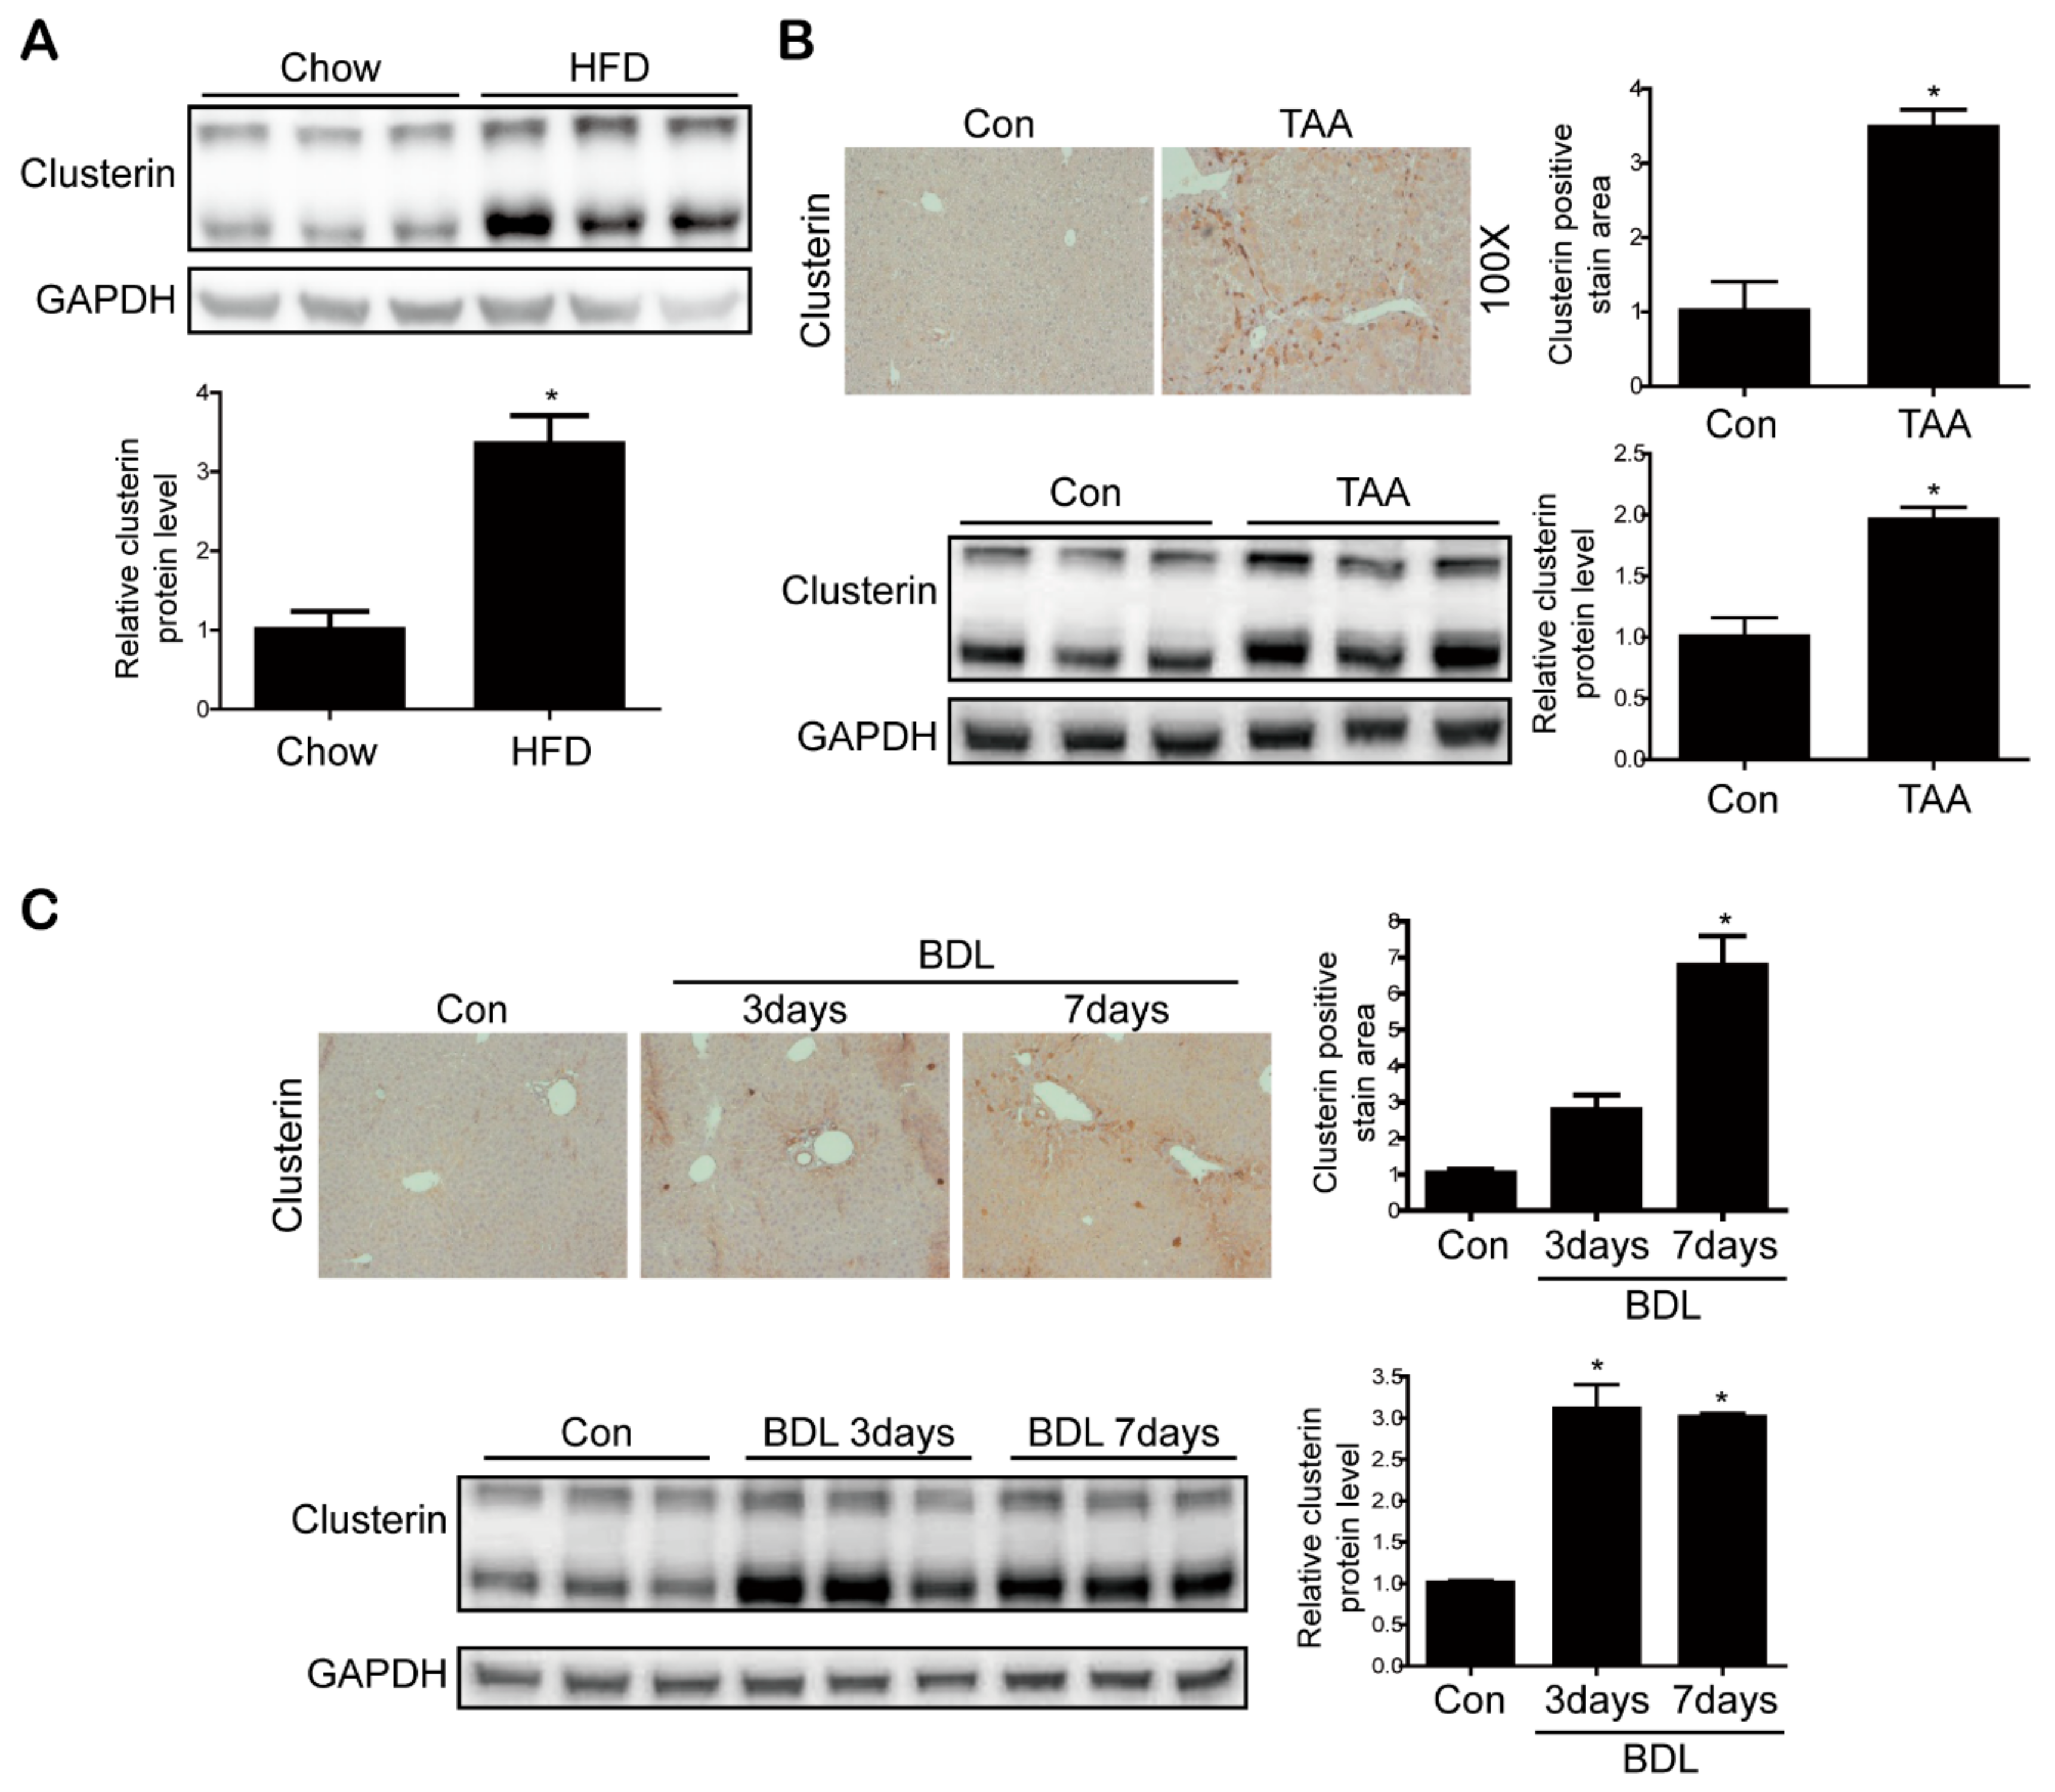
3.1. Clusterin Expression Is Elevated in the Fibrotic Liver
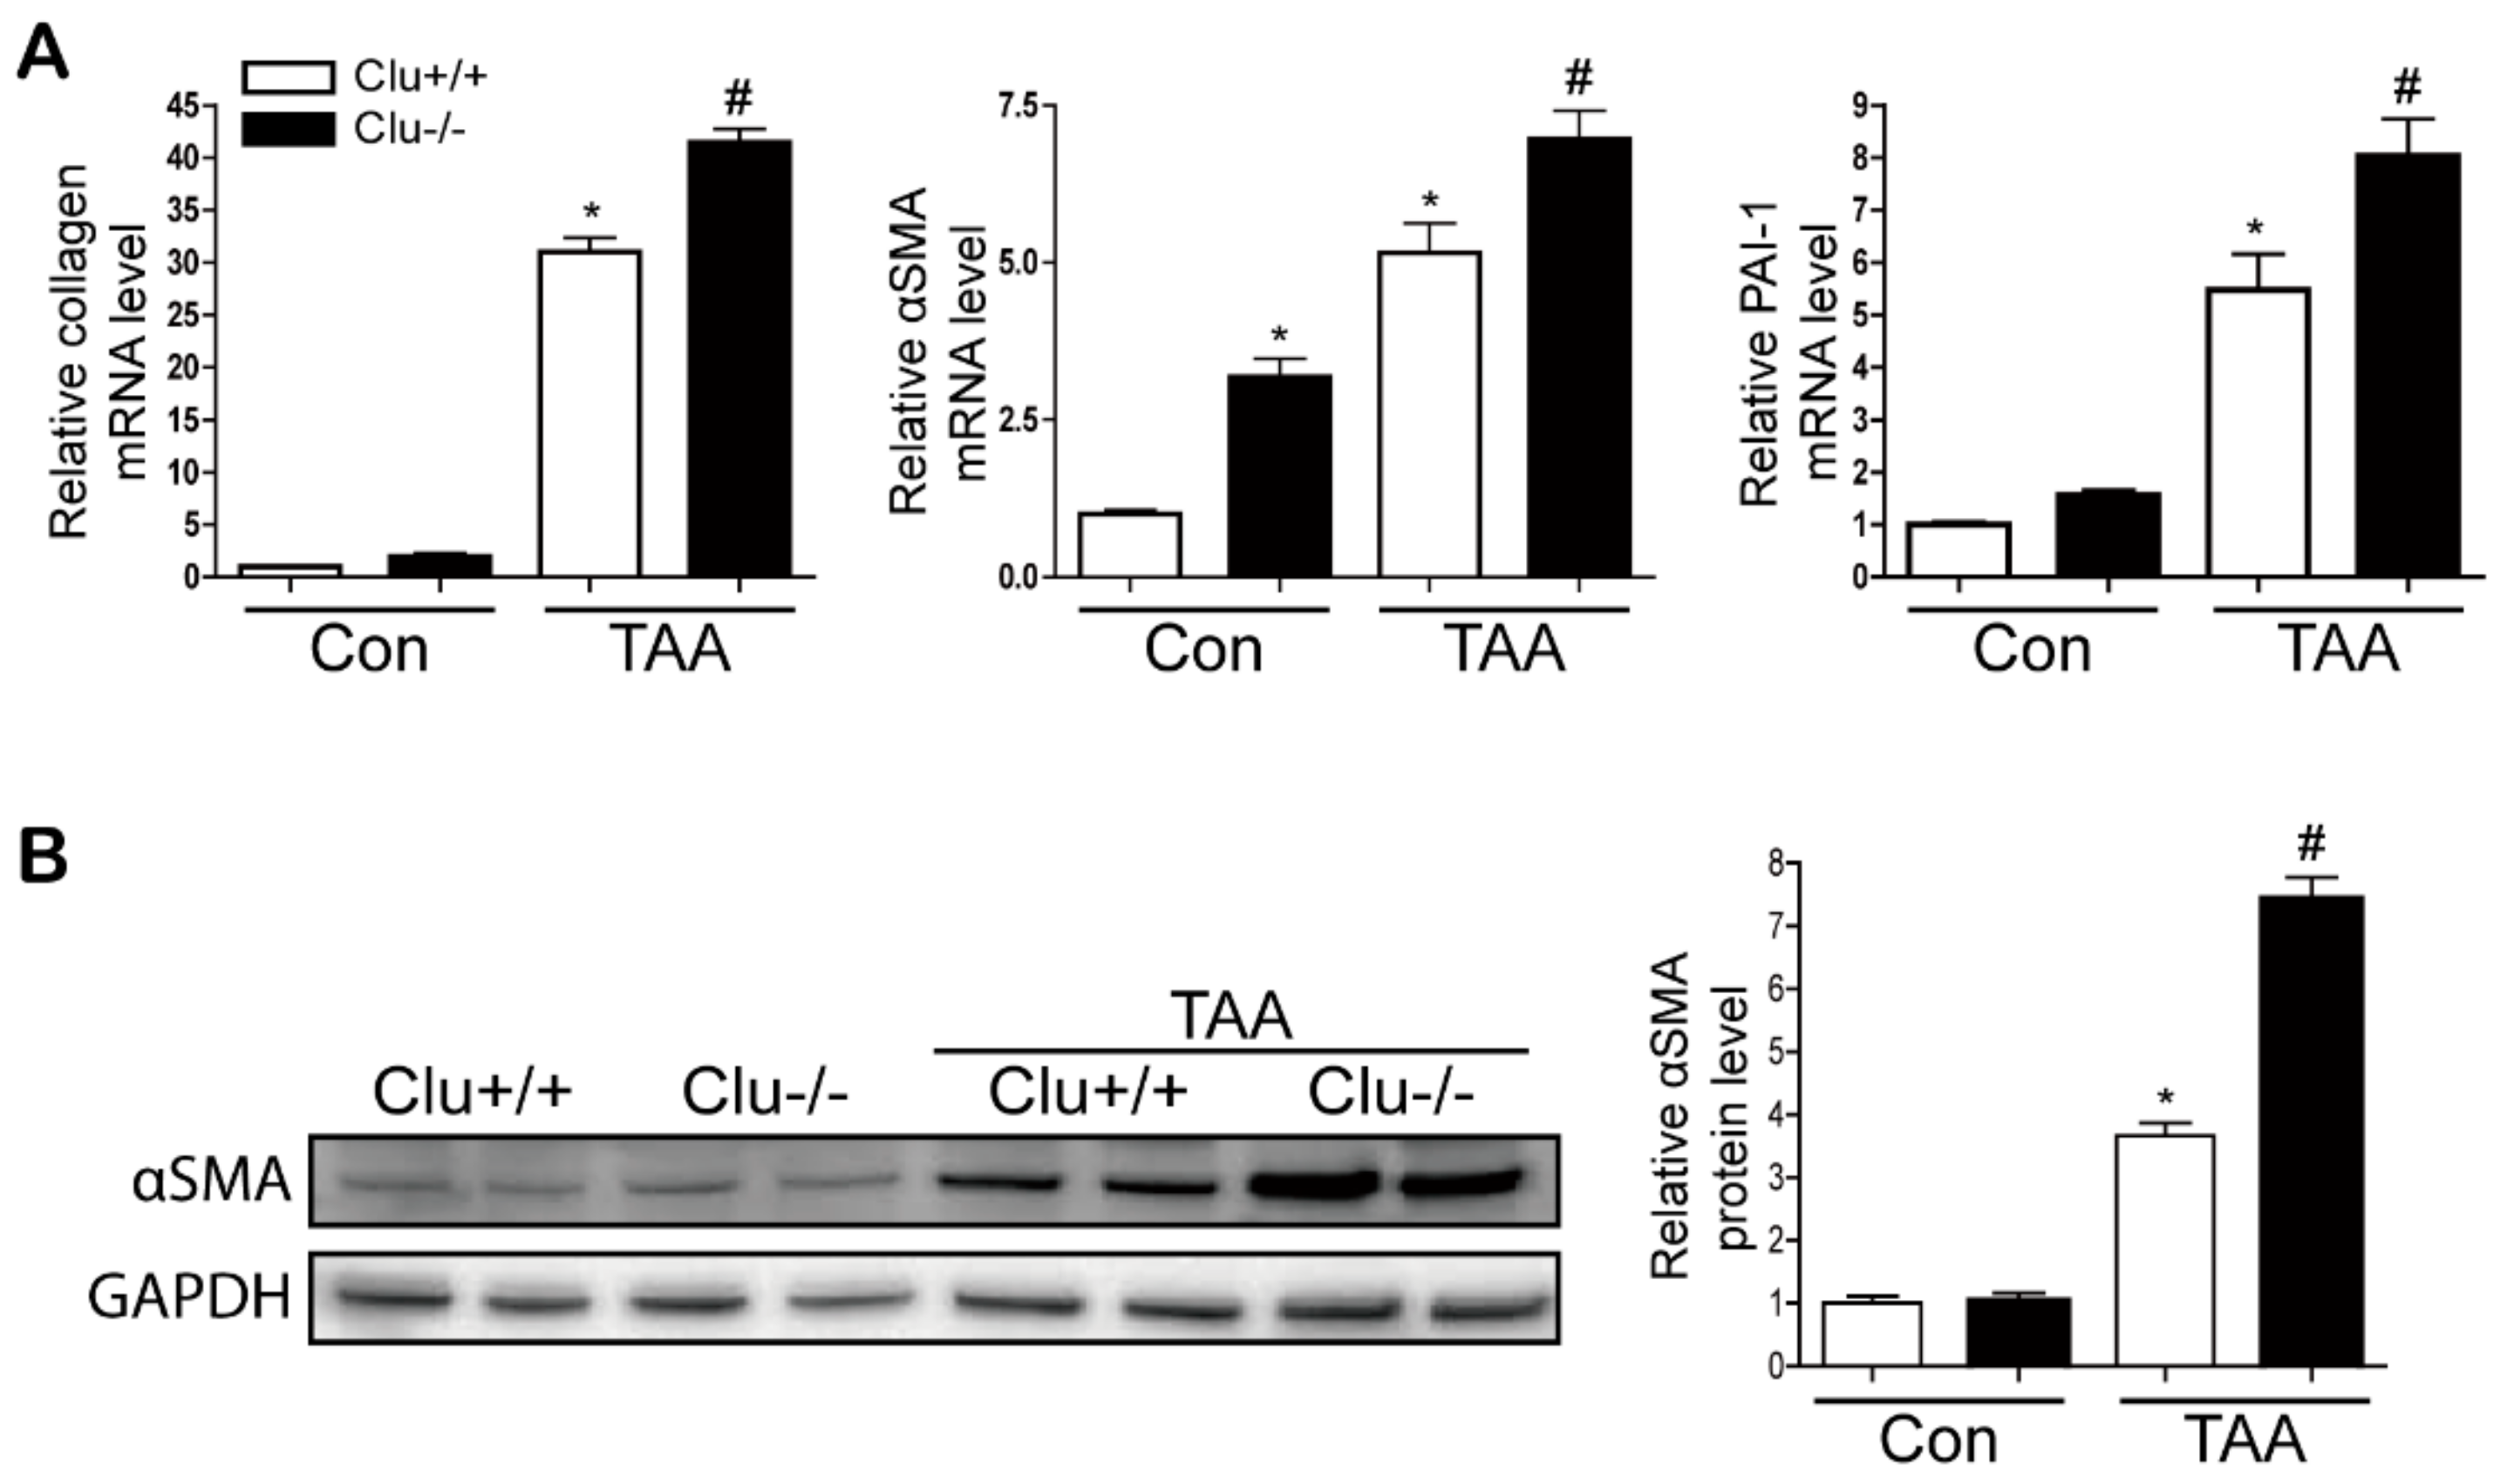
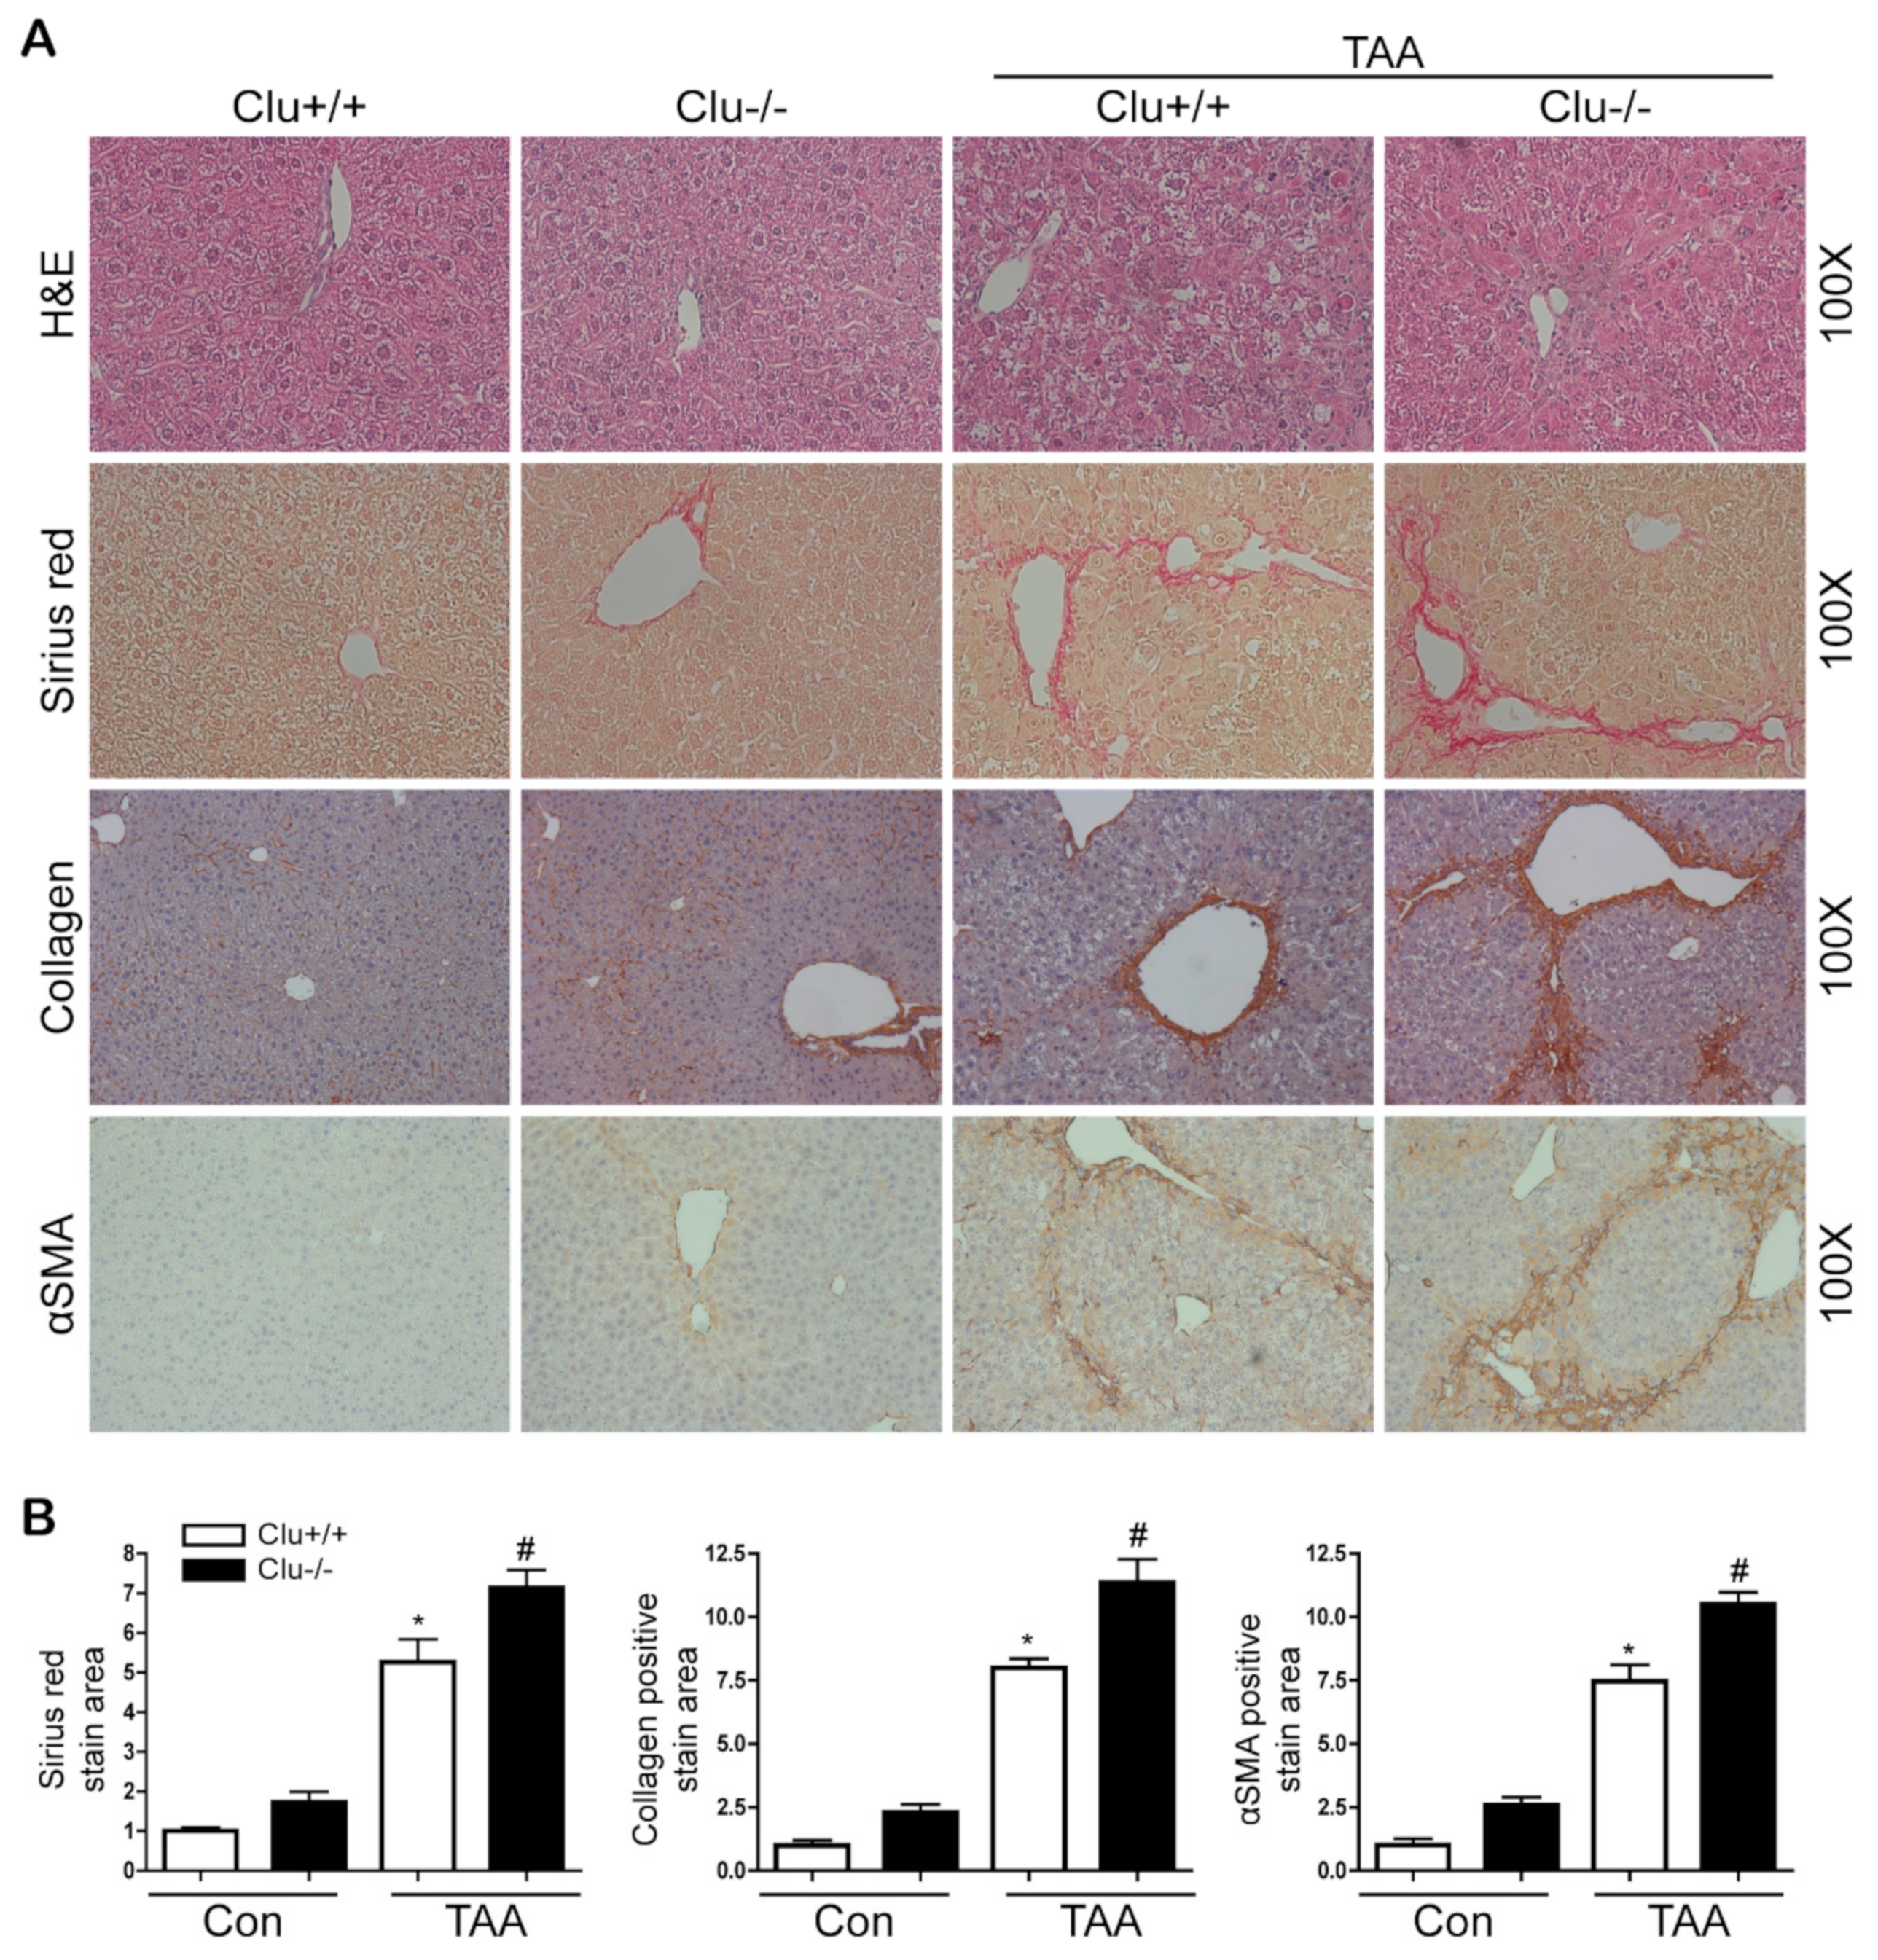
3.2. Loss of Clusterin Promotes Hepatic Fibrosis
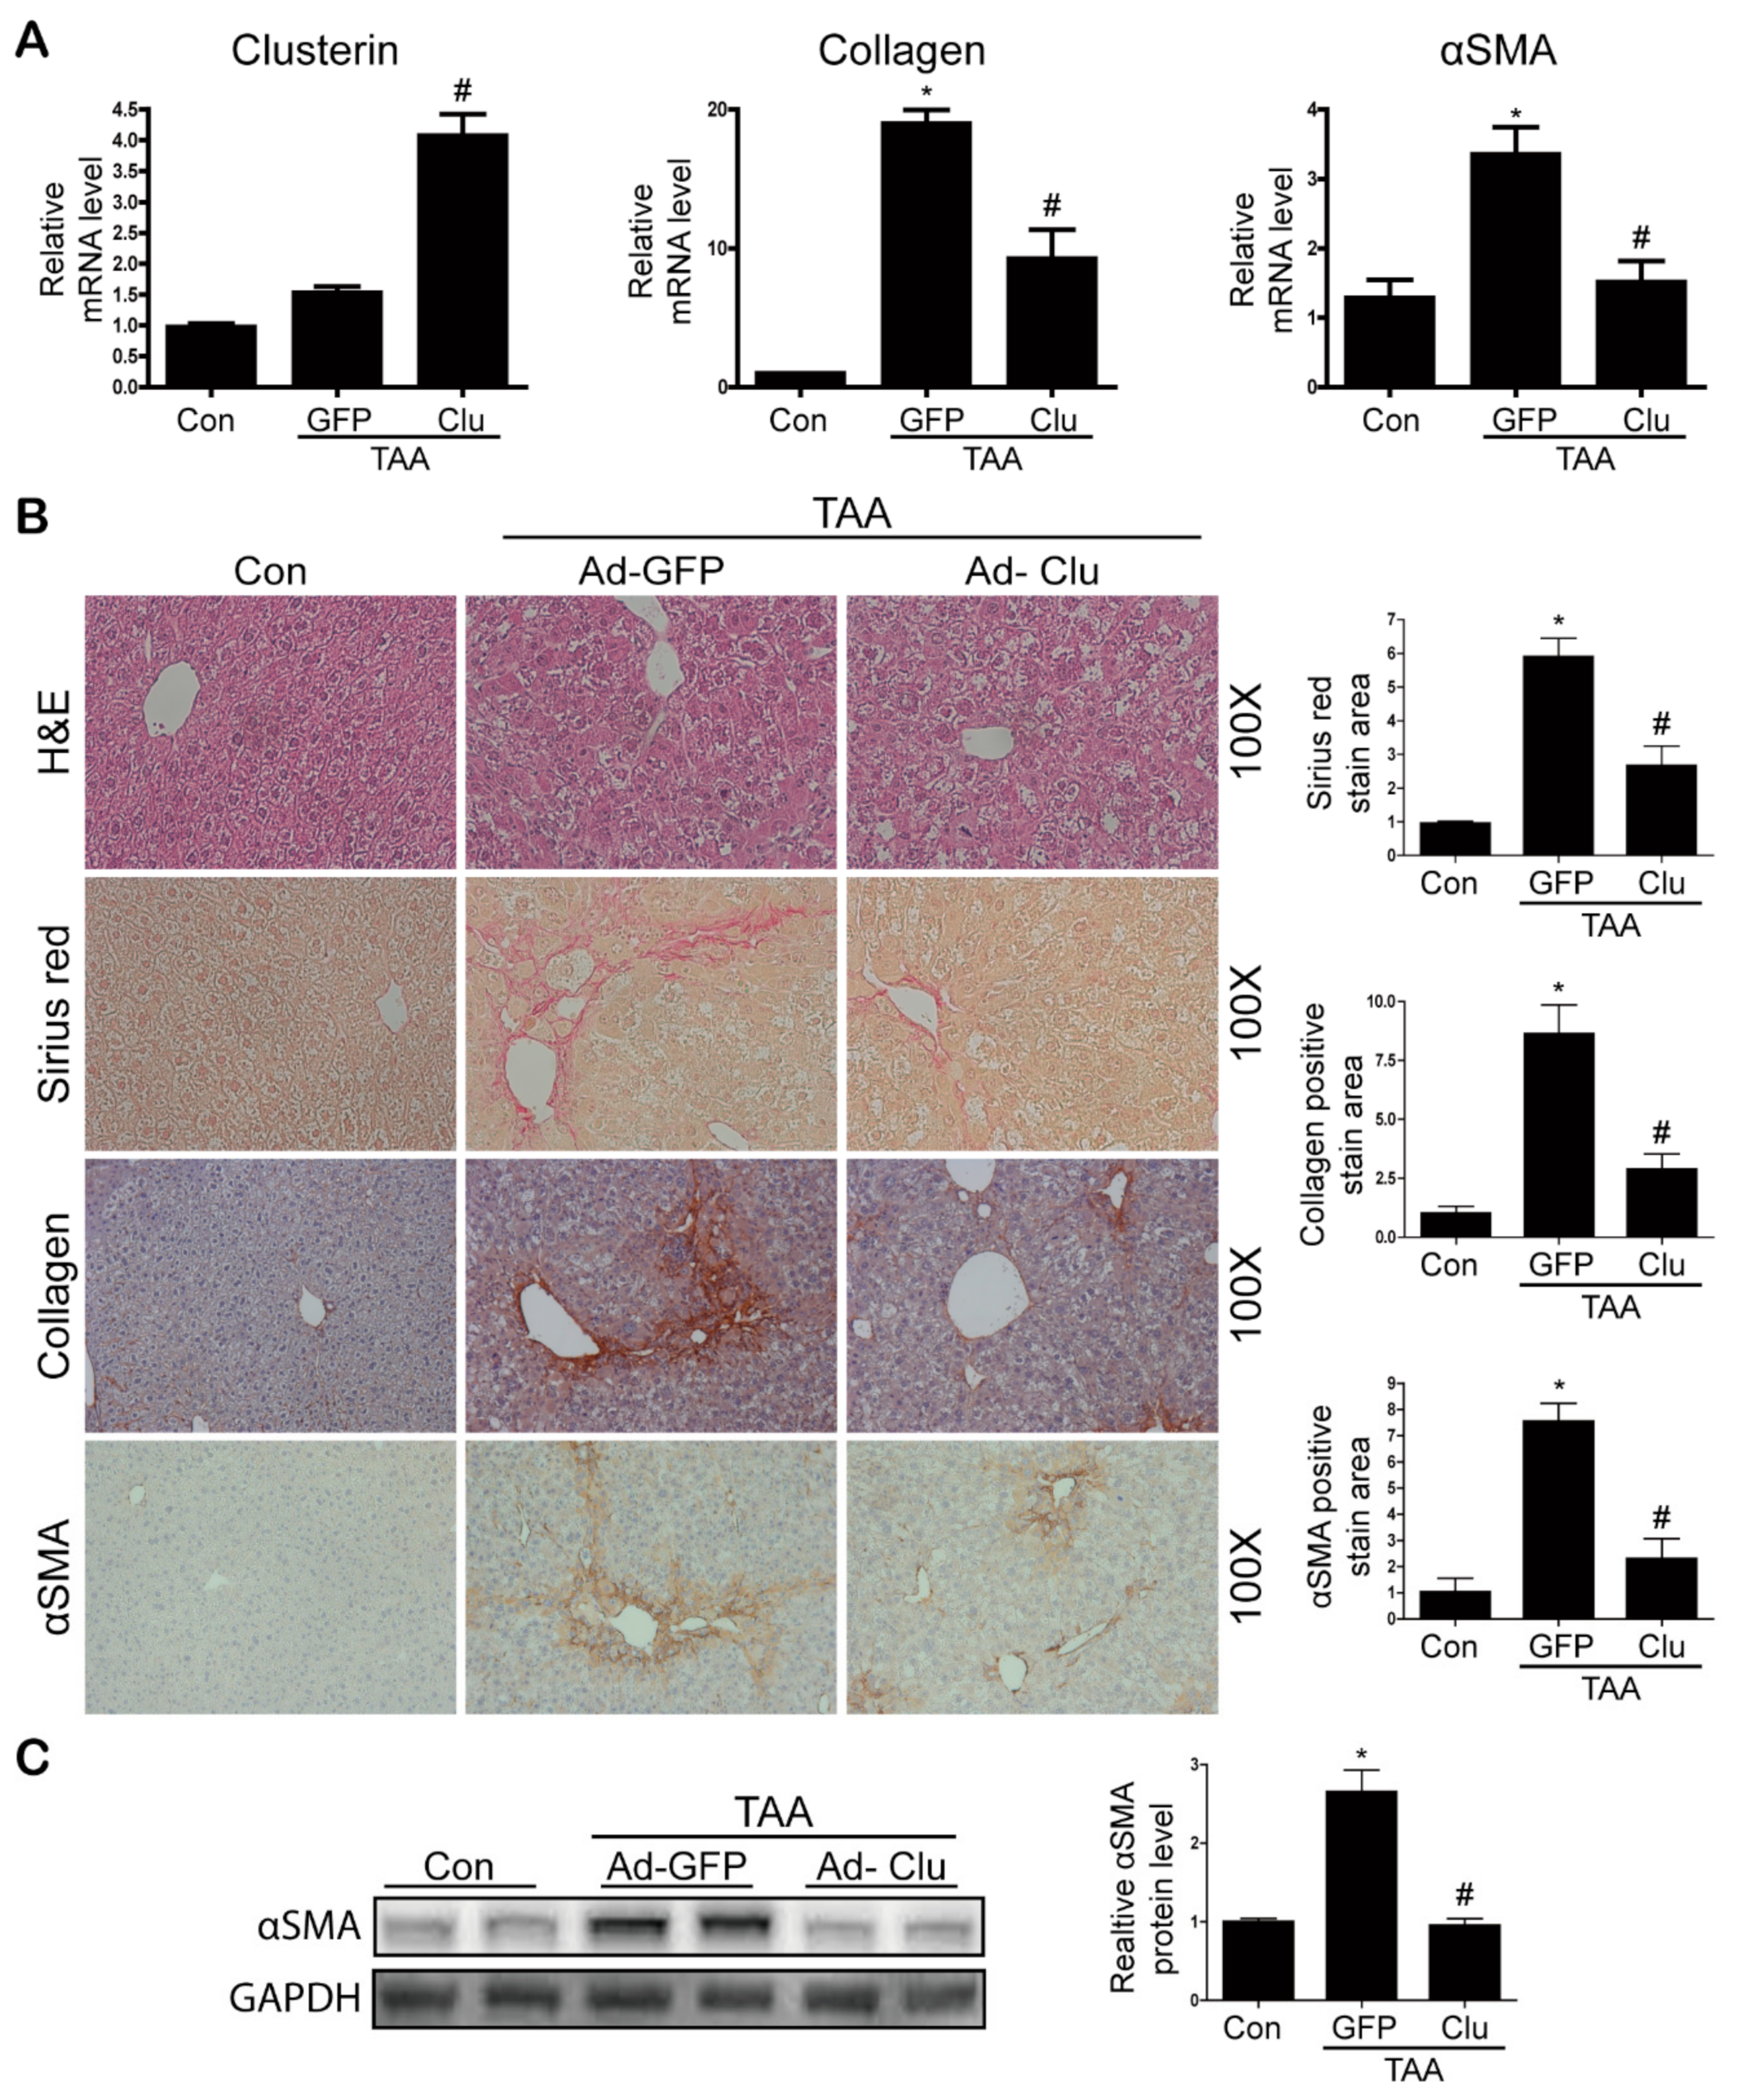
3.3. Clusterin Ameliorates TAA-Induced Hepatic Fibrosis
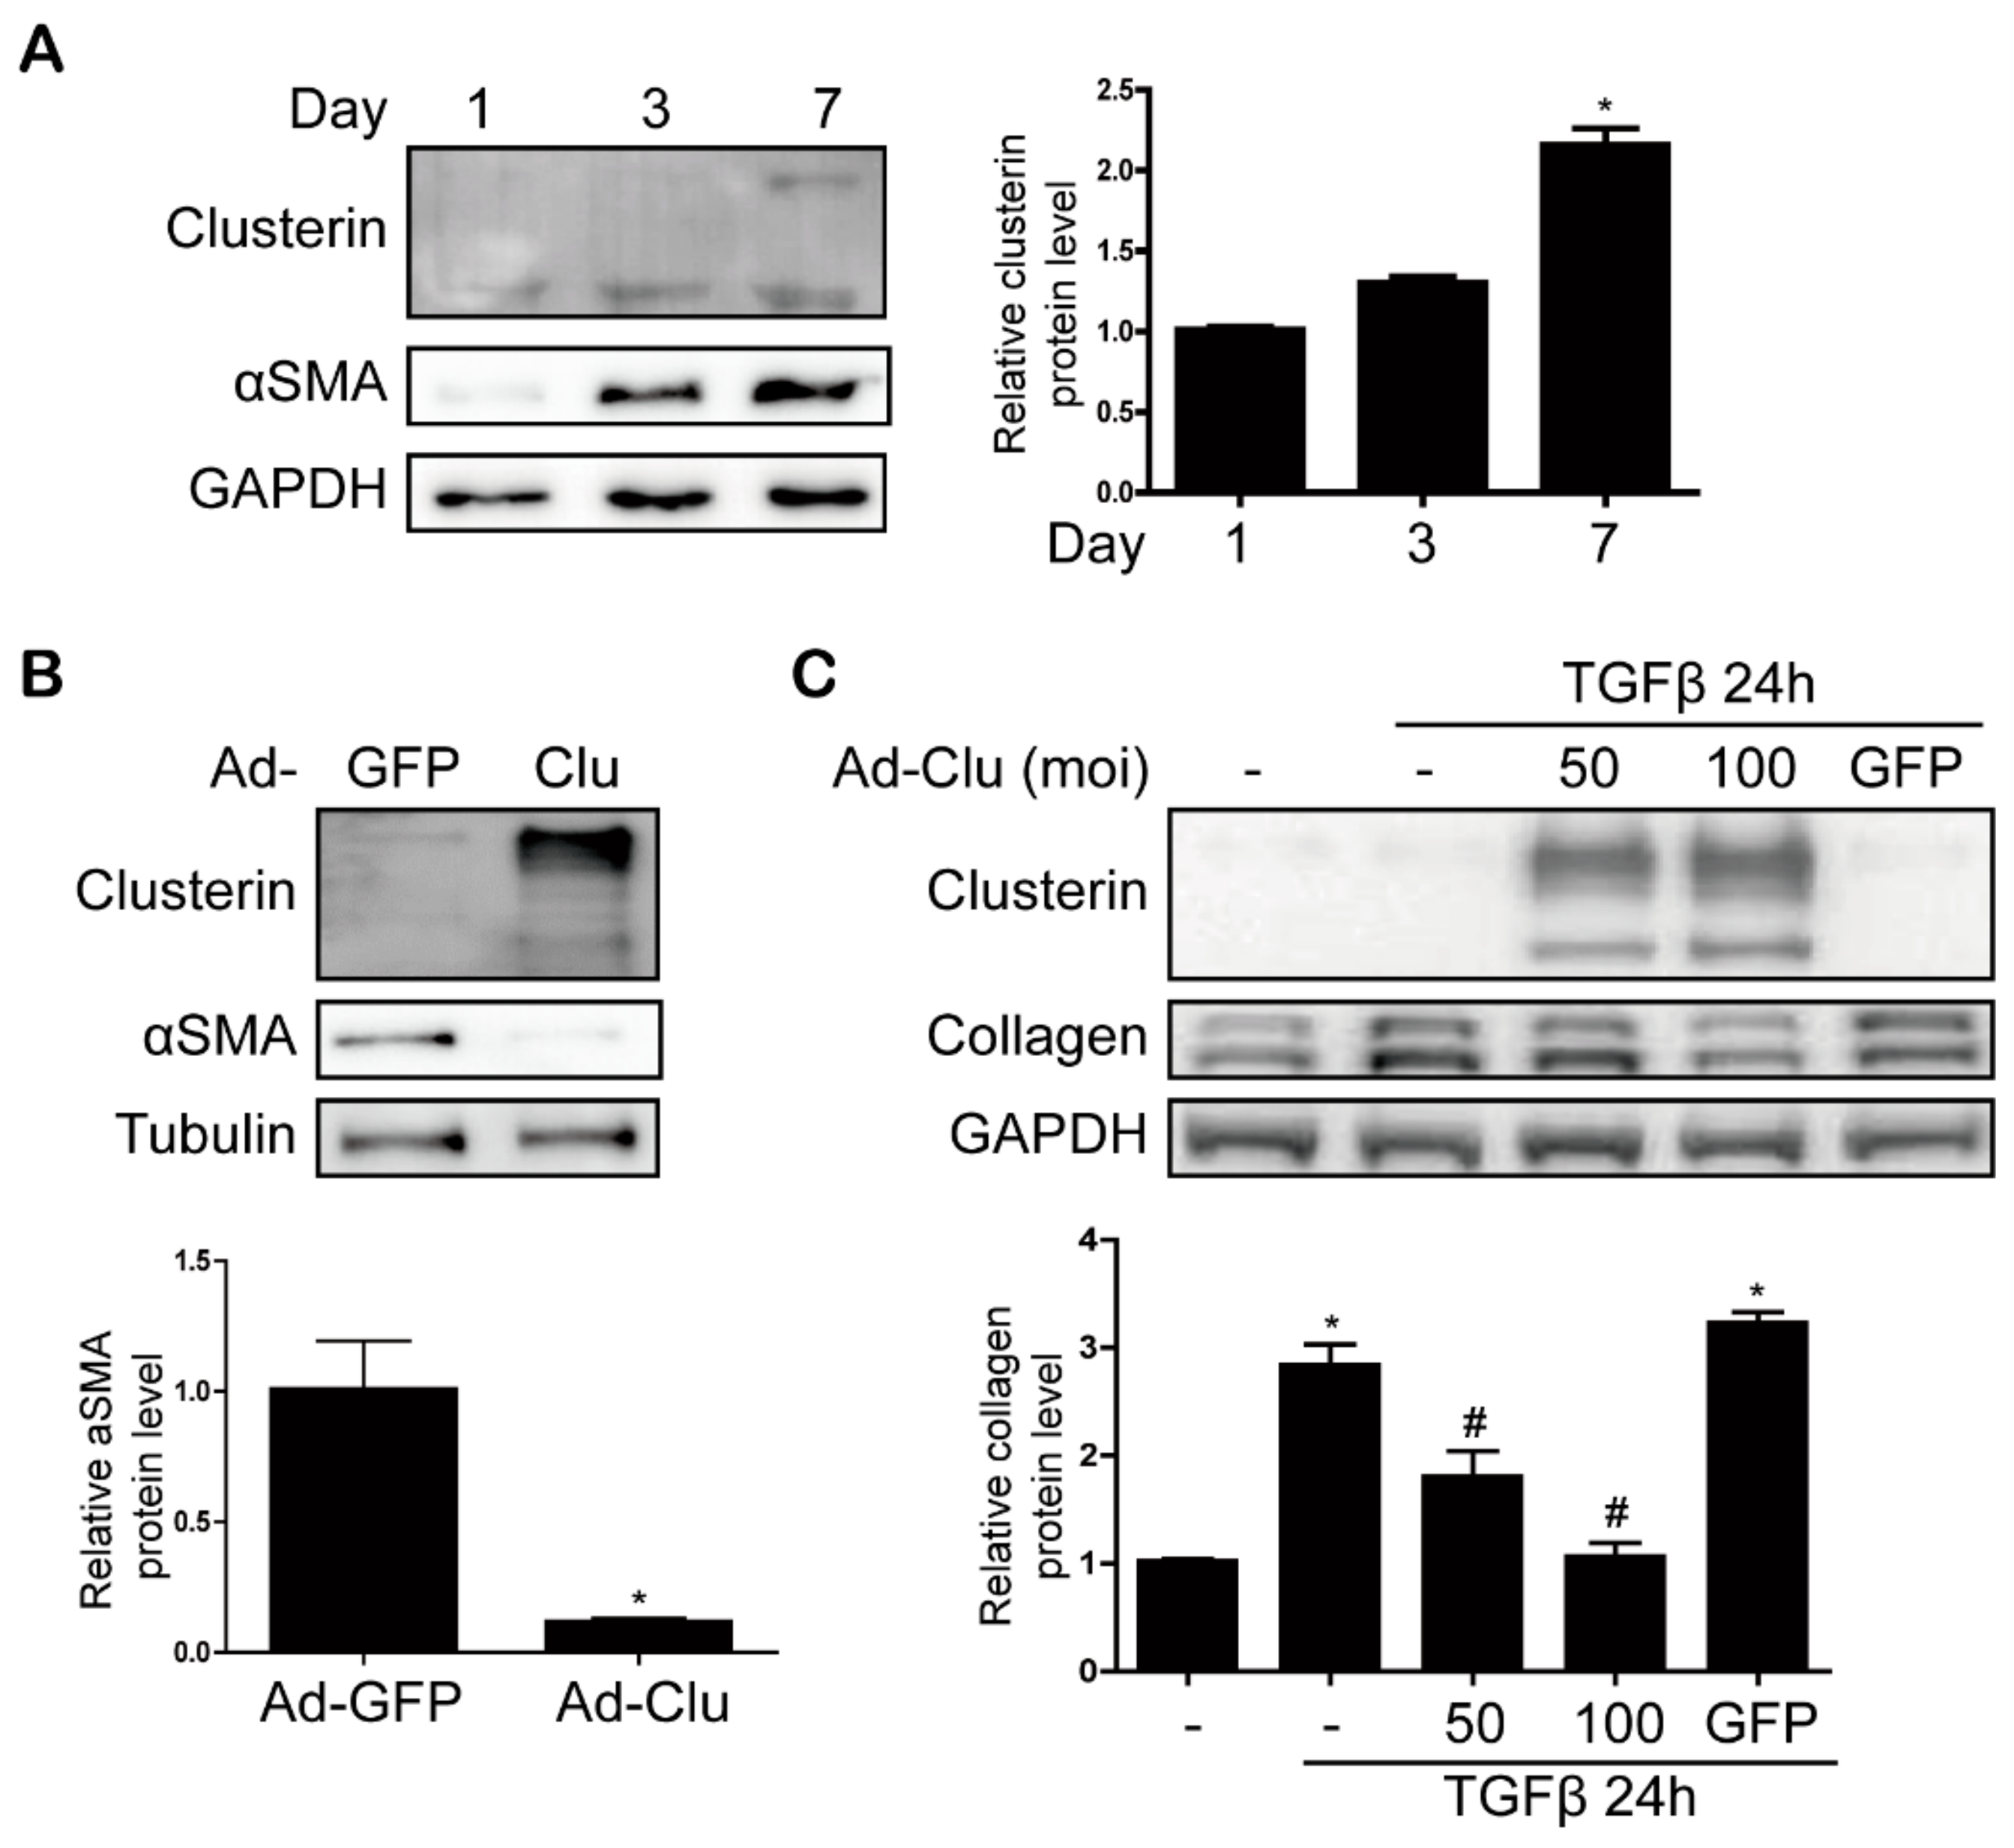
3.4. Clusterin Ameliorates HSC Activation
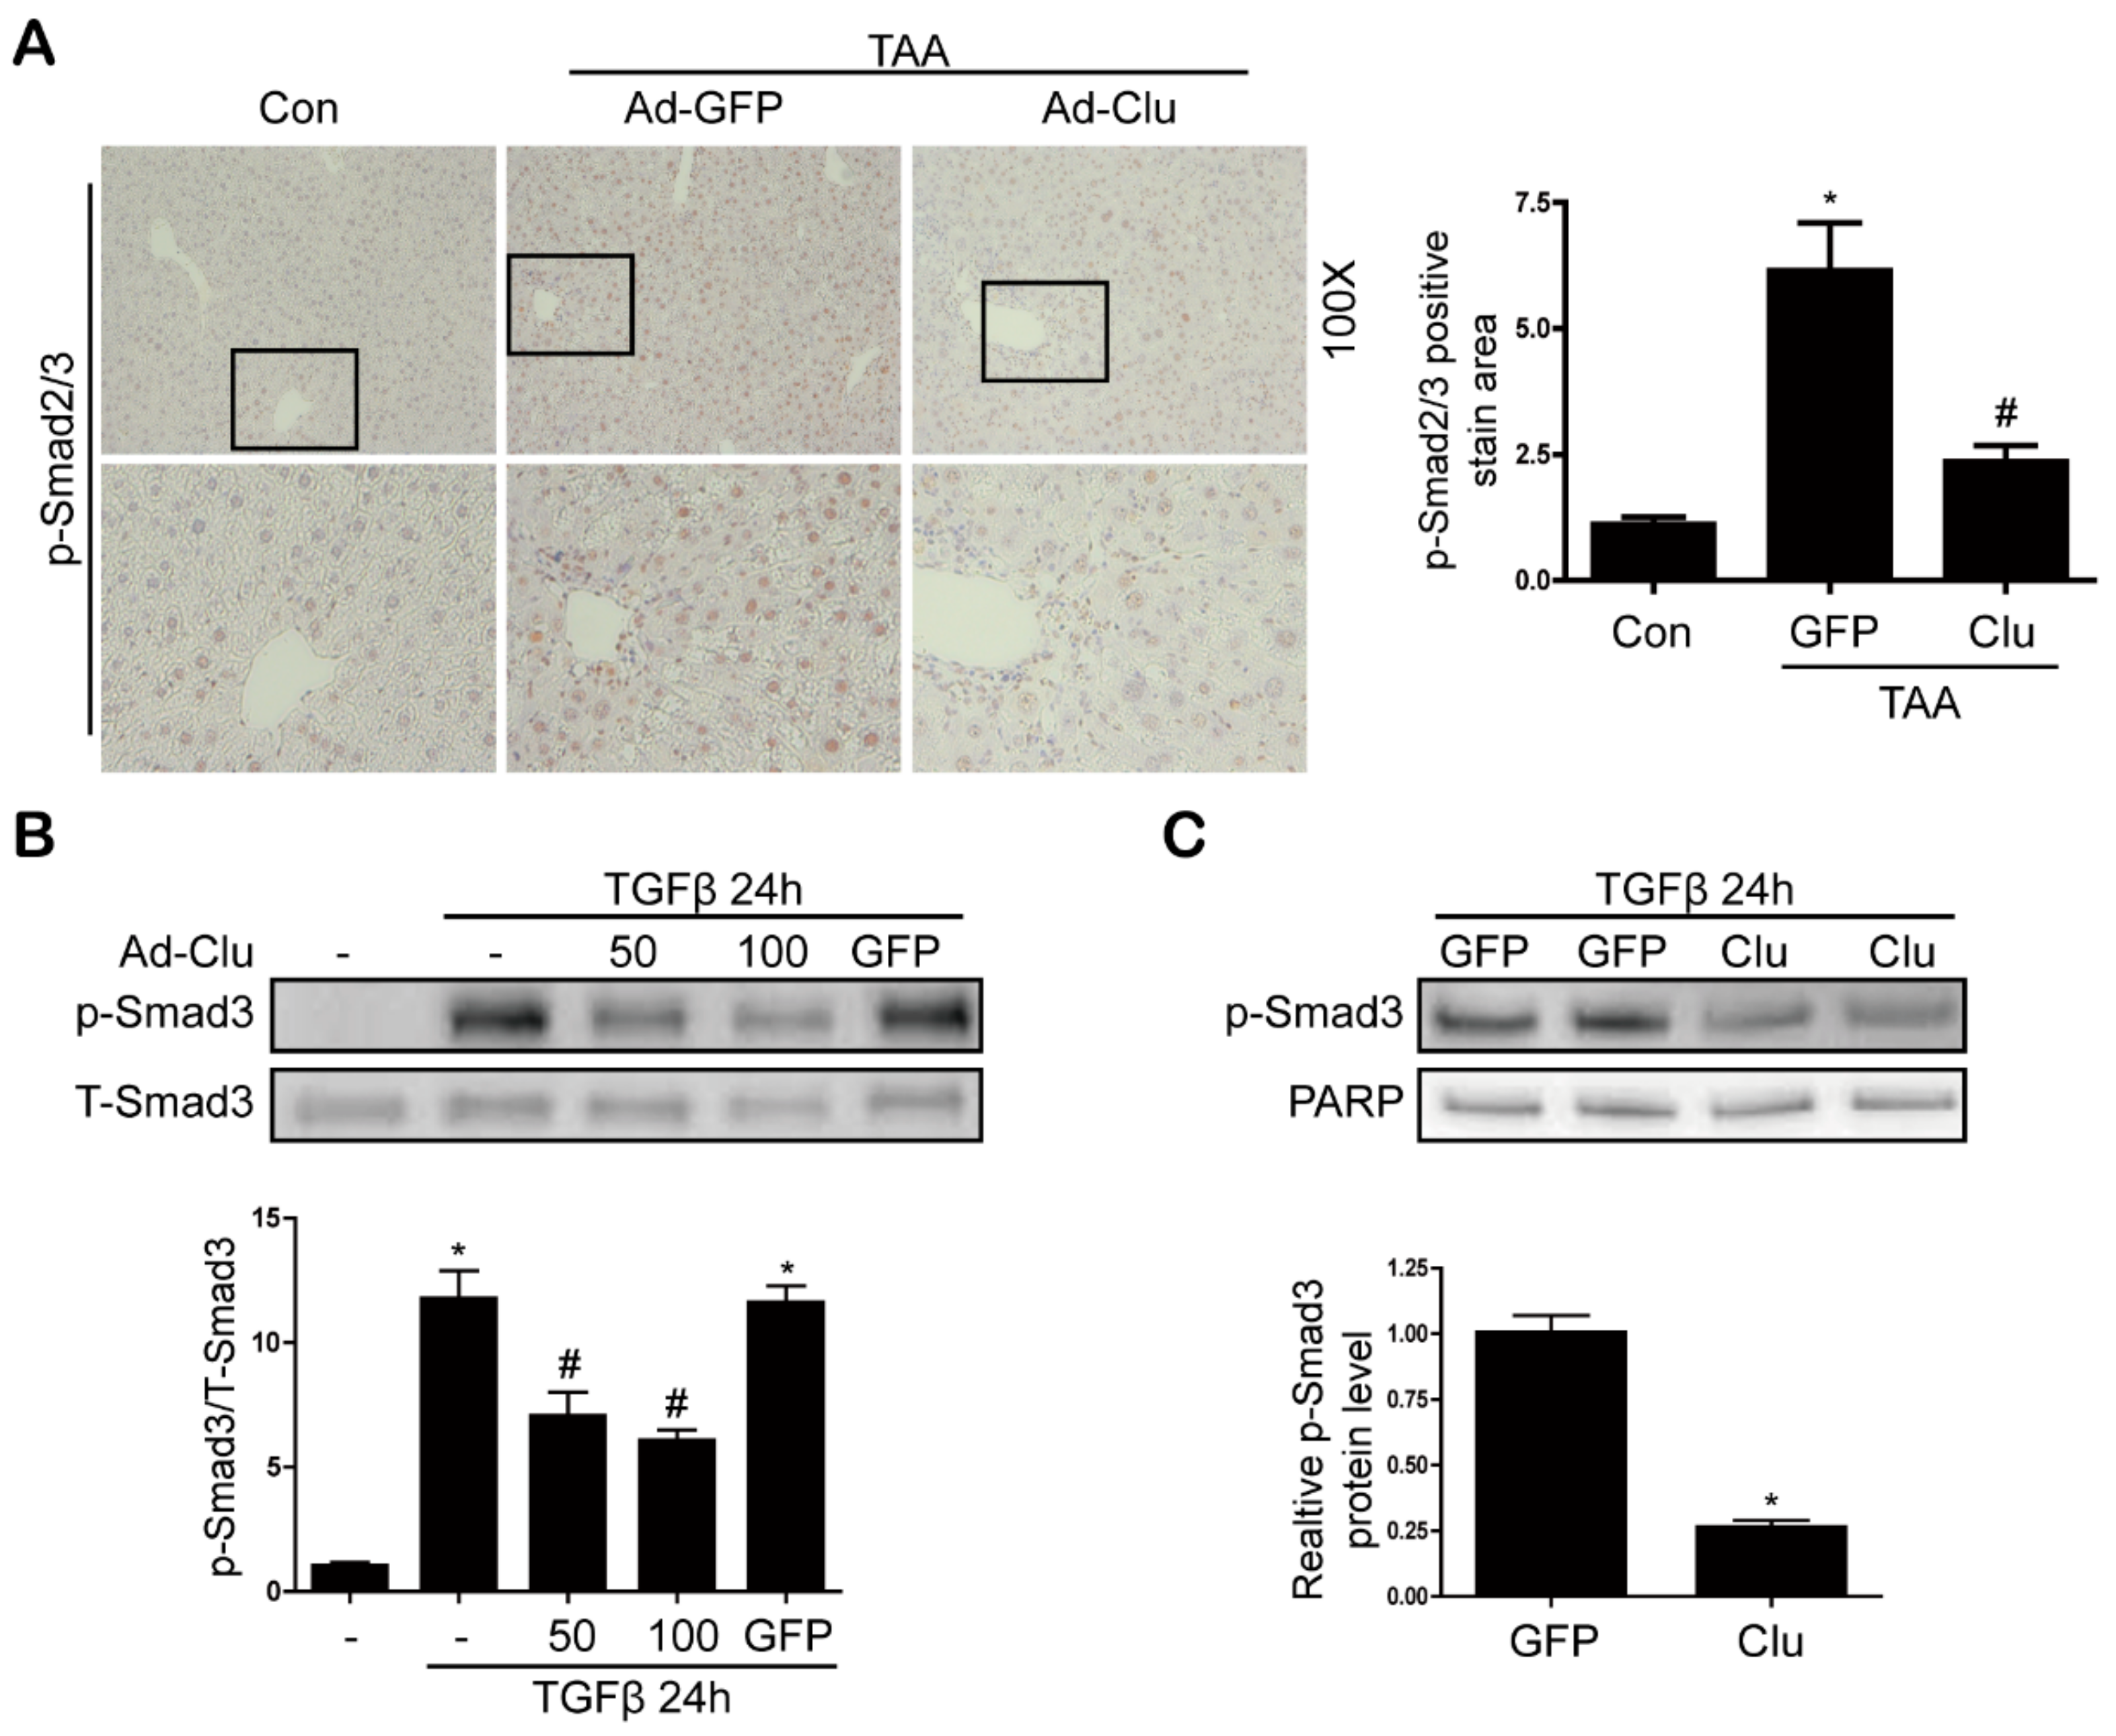
3.5. Clusterin Inhibits Smad3 Phosphorylation
4. Discussion
Supplementary Materials
Author Contributions
Funding
Conflicts of Interest
References
- Bataller, R.; Brenner, D.A. Liver fibrosis. J. Clin. Investig. 2005, 115, 209–218. [Google Scholar] [CrossRef] [PubMed]
- Jiao, J.; Friedman, S.L.; Aloman, C. Hepatic fibrosis. Curr. Opin. Gastroenterol. 2009, 25, 223–229. [Google Scholar] [CrossRef] [PubMed]
- Ellis, E.L.; Mann, D.A. Clinical evidence for the regression of liver fibrosis. J. Hepatol. 2012, 56, 1171–1180. [Google Scholar] [CrossRef] [PubMed]
- Ramachandran, P.; Iredale, J.P.; Fallowfield, J.A. Resolution of liver fibrosis: Basic mechanisms and clinical relevance. Semin. Liver Dis. 2015, 35, 119–131. [Google Scholar] [CrossRef]
- Bansal, M.B.; Chamroonkul, N. Antifibrotics in liver disease: Are we getting closer to clinical use? Hepatol. Int. 2019, 13, 25–39. [Google Scholar] [CrossRef]
- Parola, M.; Pinzani, M. Liver fibrosis: Pathophysiology, pathogenetic targets and clinical issues. Mol. Asp. Med. 2019, 65, 37–55. [Google Scholar] [CrossRef]
- Jones, S.E.; Jomary, C. Clusterin. Int. J. Biochem. Cell Biol. 2002, 34, 427–431. [Google Scholar] [CrossRef]
- Rosenberg, M.E.; Silkensen, J. Clusterin: Physiologic and pathophysiologic considerations. Int. J. Biochem. Cell Biol. 1995, 27, 633–645. [Google Scholar] [CrossRef]
- Aronow, B.J.; Lund, S.D.; Brown, T.L.; Harmony, J.A.; Witte, D.P. Apolipoprotein J expression at fluid-tissue interfaces: Potential role in barrier cytoprotection. Proc. Natl. Acad. Sci. USA 1993, 90, 725–729. [Google Scholar] [CrossRef]
- Jenne, D.E.; Tschopp, J. Molecular structure and functional characterization of a human complement cytolysis inhibitor found in blood and seminal plasma: Identity to sulfated glycoprotein 2, a constituent of rat testis fluid. Proc. Natl. Acad. Sci. USA 1989, 86, 7123–7127. [Google Scholar] [CrossRef]
- Zhou, W.; Guan, Q.; Kwan, C.C.; Chen, H.; Gleave, M.E.; Nguan, C.Y.; Du, C. Loss of clusterin expression worsens renal ischemia-reperfusion injury. Am. J. Physiol. Ren. Physiol. 2010, 298, F568–F578. [Google Scholar] [CrossRef] [PubMed]
- McLaughlin, L.; Zhu, G.; Mistry, M.; Ley-Ebert, C.; Stuart, W.D.; Florio, C.J.; Groen, P.A.; Witt, S.A.; Kimball, T.R.; Witte, D.P.; et al. Apolipoprotein J/clusterin limits the severity of murine autoimmune myocarditis. J. Clin. Investig. 2000, 106, 1105–1113. [Google Scholar] [CrossRef] [PubMed]
- Seo, H.Y.; Kim, M.K.; Jung, Y.A.; Jang, B.K.; Yoo, E.K.; Park, K.G.; Lee, I.K. Clusterin decreases hepatic SREBP-1c expression and lipid accumulation. Endocrinology 2013, 154, 1722–1730. [Google Scholar] [CrossRef] [PubMed]
- Park, J.S.; Shim, Y.J.; Kang, B.H.; Lee, W.K.; Min, B.H. Hepatocyte-specific clusterin overexpression attenuates diet-induced nonalcoholic steatohepatitis. Biochem. Biophys. Res. Commun. 2018, 495, 1775–1781. [Google Scholar] [CrossRef]
- Jung, G.-S.; Kim, M.-K.; Jung, Y.-A.; Kim, H.-S.; Park, I.-S.; Min, B.-H.; Lee, K.-U.; Kim, J.-G.; Park, K.-G.; Lee, I.-K. Clusterin attenuates the development of renal fibrosis. J. Am. Soc. Nephrol. 2012, 23, 73–85. [Google Scholar] [CrossRef]
- Dooley, S.; ten Dijke, P. TGF-β in progression of liver disease. Cell Tissue Res. 2012, 347, 245–256. [Google Scholar] [CrossRef]
- Leask, A.; Abraham, D.J. TGF-β signaling and the fibrotic response. FASEB J. 2004, 18, 816–827. [Google Scholar] [CrossRef]
- Aigelsreiter, A.; Janig, E.; Sostaric, J.; Pichler, M.; Unterthor, D.; Halasz, J.; Lackner, C.; Zatloukal, K.; Denk, H. Clusterin expression in cholestasis, hepatocellular carcinoma and liver fibrosis. Histopathology 2009, 54, 561–570. [Google Scholar] [CrossRef]
- Van Meer, L.; Moerland, M.; Cohen, A.F.; Burggraaf, J. Urinary kidney biomarkers for early detection of nephrotoxicity in clinical drug development. Br. J. Clin. Pharmacol. 2014, 77, 947–957. [Google Scholar] [CrossRef]
- Nafee, A.M.; Pasha, H.F.; Abd El Aal, S.M.; Mostafa, N.A. Clinical significance of serum clusterin as a biomarker for evaluating diagnosis and metastasis potential of viral-related hepatocellular carcinoma. Clin. Biochem. 2012, 45, 1070–1074. [Google Scholar] [CrossRef]
- Martínez, A.K.; Maroni, L.; Marzioni, M.; Ahmed, S.T.; Milad, M.; Ray, D.; Alpini, G.; Glaser, S.S. Mouse Models of Liver Fibrosis Mimic Human Liver Fibrosis of Different Etiologies. Curr. Pathobiol. Rep. 2014, 2, 143–153. [Google Scholar] [CrossRef] [PubMed]
- Tsuchida, T.; Friedman, S.L. Mechanisms of hepatic stellate cell activation. Nat. Rev. Gastroenterol. Amp. Hepatol. 2017, 14, 397. [Google Scholar] [CrossRef] [PubMed]
- Baiocchini, A.; Montaldo, C.; Conigliaro, A.; Grimaldi, A.; Correani, V.; Mura, F.; Ciccosanti, F.; Rotiroti, N.; Brenna, A.; Montalbano, M.; et al. Extracellular Matrix Molecular Remodeling in Human Liver Fibrosis Evolution. PLoS ONE 2016, 11, e0151736. [Google Scholar] [CrossRef]
- Zhou, W.-C.; Zhang, Q.-B.; Qiao, L. Pathogenesis of liver cirrhosis. World J. Gastroenterol. 2014, 20, 7312–7324. [Google Scholar] [CrossRef] [PubMed]
- Higashi, T.; Friedman, S.L.; Hoshida, Y. Hepatic stellate cells as key target in liver fibrosis. Adv. Drug Deliv. Rev. 2017, 121, 27–42. [Google Scholar] [CrossRef] [PubMed]
- Biernacka, A.; Dobaczewski, M.; Frangogiannis, N.G. TGF-β signaling in fibrosis. Growth Factors 2011, 29, 196–202. [Google Scholar] [CrossRef] [Green Version]


© 2019 by the authors. Licensee MDPI, Basel, Switzerland. This article is an open access article distributed under the terms and conditions of the Creative Commons Attribution (CC BY) license (http://creativecommons.org/licenses/by/4.0/).
Share and Cite
Seo, H.-Y.; Lee, S.-H.; Lee, J.-H.; Kang, Y.N.; Choi, Y.-K.; Hwang, J.S.; Park, K.-G.; Jang, B.K.; Kim, M.K. Clusterin Attenuates Hepatic Fibrosis by Inhibiting Hepatic Stellate Cell Activation and Downregulating the Smad3 Signaling Pathway. Cells 2019, 8, 1442. https://0-doi-org.brum.beds.ac.uk/10.3390/cells8111442
Seo H-Y, Lee S-H, Lee J-H, Kang YN, Choi Y-K, Hwang JS, Park K-G, Jang BK, Kim MK. Clusterin Attenuates Hepatic Fibrosis by Inhibiting Hepatic Stellate Cell Activation and Downregulating the Smad3 Signaling Pathway. Cells. 2019; 8(11):1442. https://0-doi-org.brum.beds.ac.uk/10.3390/cells8111442
Chicago/Turabian StyleSeo, Hye-Young, So-Hee Lee, Ji-Ha Lee, Yu Na Kang, Young-Keun Choi, Jae Seok Hwang, Keun-Gyu Park, Byoung Kuk Jang, and Mi Kyung Kim. 2019. "Clusterin Attenuates Hepatic Fibrosis by Inhibiting Hepatic Stellate Cell Activation and Downregulating the Smad3 Signaling Pathway" Cells 8, no. 11: 1442. https://0-doi-org.brum.beds.ac.uk/10.3390/cells8111442