MicroRNA Signatures as Future Biomarkers for Diagnosis of Diabetes States
by
 , ,
, ,
Srividya Vasu
1 ,
,
Kenjiro Kumano
1,
Carly M. Darden
1,2,
Irum Rahman
1,
Michael C. Lawrence
1 and
Bashoo Naziruddin
3,* 1
Islet Cell Laboratory, Baylor Scott and White Research Institute, 3434 Live Oak Street, Dallas, TX 75204, USA
2
Department of Biomedical Studies, Baylor University, 1301 S. University Parks Dr., Waco, TX 75706, USA
3
Annette C. and Harold C. Simmons Transplant Institute, Baylor University Medical Center, 3410 Worth St., Suite 950, Dallas, TX 75246, USA
*
Author to whom correspondence should be addressed.
Cells 2019, 8(12), 1533; https://0-doi-org.brum.beds.ac.uk/10.3390/cells8121533
Submission received: 31 October 2019
/
Revised: 22 November 2019
/
Accepted: 24 November 2019
/
Published: 28 November 2019
(This article belongs to the Special Issue microRNA as Biomarker)
Abstract
:Diabetes results from the inability of pancreatic islets to maintain blood glucose concentrations within a normal physiological range. Clinical features are usually not observed until islets begin to fail and irreversible damage has occurred. Diabetes is generally diagnosed based on elevated glucose, which does not distinguish between type 1 and 2 diabetes. Thus, new diagnostic approaches are needed to detect different modes of diabetes before manifestation of disease. During prediabetes (pre-DM), islets undergo stress and release micro (mi) RNAs. Here, we review studies that have measured and tracked miRNAs in the blood for those with recent-onset or longstanding type 1 diabetes, obesity, pre-diabetes, type 2 diabetes, and gestational diabetes. We summarize the findings on miRNA signatures with the potential to stage progression of different modes of diabetes. Advances in identifying selective biomarker signatures may aid in early detection and classification of diabetic conditions and treatments to prevent and reverse diabetes.
1. Introduction
Pancreatic islets regulate glucose homeostasis through insulin and glucagon, which are central to key biological processes and energy homeostasis. Loss or impairment of islet function results in dysregulated blood glucose, which gives rise to multiple life-threatening complications including cardiovascular disease, neuropathy, nephropathy, blindness, and stroke. High blood glucose, the most common clinical sign of diabetes, is usually observed only when islet beta cells are already deficient or exhausted. In the case of type 1 diabetes (T1D), clinical symptoms manifest when >80% of islet beta cells are already lost to autoimmunity. During the progression of type 2 diabetes (T2D), islet compensation maintains normoglycemia for years without symptoms before progressing to a state of detectable impaired glucose tolerance (IGT) and impaired fasting glucose (IFG). In addition, during pregnancy, lack of islet compensation leads to gestational diabetes (GDM), which increases risk for T2D. Between 24% and 62% of people with diabetes are unaware of the disease, undiagnosed, and untreated [1], suggesting a large gap in current diagnostic practices. Early detection of islet cell stress preceding loss of islet function would allow for therapeutic interventions to delay or alleviate the onset of diabetes.
Emerging technologies to recover, amplify, and detect nucleic acids in the blood have allowed for sensitive methods to make correlations of gene expression profiling with specific states of disease. Several studies suggest that there is selective expression of circulating microRNAs (miRNA) that may correlate with diabetic conditions. In this review, we have surveyed and evaluated a compilation of studies regarding the use of miRNAs as potential biomarkers to improve current diagnostic practices performed in the clinic to detect and monitor diabetes. Due to complexity and variability of blood-borne miRNAs arising from multiple tissue sources during metabolic and inflammatory disease, we conclude that singular miRNAs may not be sufficient to precisely or accurately diagnose pre-diabetic (pre-DM) states or conditions. However, we propose that correlations of groupings of miRNAs that are selective for components related to inflammatory, immune, and metabolic stress would provide insight to progression of various modes of diabetes. These microRNAs could arise from brain, liver, muscle, adipose, myeloid, lymphoid, and islet cells among other tissue types contributing or responding to pre-DM conditions. Future studies focused on identifying and validating such groupings or “signatures” of miRNAs may prove useful in revealing the landscaping of disease progression for diagnosing or treating patients in the pre-DM state.
1.1. Current Diagnostic Practices
During routine annual health check-ups across various healthcare systems globally, fasting and postprandial glucose levels, glycated hemoglobin A1c (HbA1c), and symptoms reported by patients are assessed as first-step diagnostic measures of diabetes. Additionally, several questionnaires including Finnish Cardiovascular Risk Study (FINRISK), Australian type 2 diabetes risk assessment tool (AUSDRISK), and The Indian Diabetes Risk score (IDRS) have been developed to screen for risk of undiagnosed diabetes [2,3,4]. GDM is usually diagnosed during a routine glucose tolerance test between 24 and 28 weeks of pregnancy. Metabolic outcomes after islet transplantation are routinely monitored using fasting and stimulated C-peptide, glucose, and HbA1c levels. Even though these diagnostic findings help establish overt diabetes or assess islet graft function after transplantation, they do not indicate beta-cell stress or death during or before the pathological events. In addition, C-peptide, although used for assessing beta-cell function, is also released upon islet damage and thus cannot distinguish islet damage from intact function. Diagnosing beta-cell stress before irreversible loss of beta-cell mass is of prime importance for efficient therapeutic interventions.
1.2. Search for New Biomarkers
In T1D, autoantibodies to islet antigens–insulin (IAA), glutamic acid decarboxylase 65 (GAD), islet cell cytoplasmic antigens (ICA), zinc transporter 8 (ZnT8), and protein tyrosine phosphatase-like protein (IA-2/ICA512) [5] are validated biomarkers of autoimmunity. These biomarkers, along with C-peptide levels, can provide an indication of autoimmunity and beta-cell function, respectively, but cannot be used to measure the onset and rate of beta-cell death. In addition, these tests are performed in the clinic to distinguish T1D from T2D only after patients report diabetes symptoms and not for diagnostic purposes or for non-diabetic individuals [6].
Currently, no non-invasive biomarker is used clinically for early detection of islet stress and dysfunction before loss of beta-cell mass and the resulting changes in clinical parameters, including decreased C-peptide levels, increased HbA1c, and fasting and 2 h postprandial hyperglycemia. Testing biomarkers of islet cell stress and damage would be a simple and noninvasive technique for annual health check visits. Ideally, diagnostic biomarkers for diabetes should meet the following criteria to be: highly selective and specific, neutral to normal metabolic and physiological changes, easily detectable in circulation, highly reproducible, and non-invasive. Most importantly, a biomarker should be detectable in circulation before onset of irreversible loss of beta-cell mass.
In the search for biomarkers of islet stress, damage, and death, circulating cell-free DNA (cfDNA), advanced glycation end products, isoprostanes, advanced oxidation protein products, oxidative DNA damage markers, branched chain amino acids, and short-chain fatty acids have been investigated [7,8,9]. However, each of these measures have their challenges in meeting the aforementioned biomarker criteria. For example, insulin cfDNA reflects beta-cell death and is elevated in response to autoimmunity in NOD mice [10], recent-onset T1D [11,12], and islet transplant 24 h after islet infusion [13]. However, insulin cfDNA is not useful in predicting beta-cell death prior to the pathological events. Advanced glycation end-products, including HbA1c, on the other hand, reflect the effects of chronic hyperglycemia, which are useful in monitoring glucose control in diabetic patients. Other markers including oxidative DNA damage markers and advanced oxidation protein products are a result of chronic oxidative stress and implicated in diabetes pathogenesis. However, chronic oxidative stress is also implicated in other diseases, including cancer, Parkinson’s disease, and Alzheimer’s disease, and thus is non-specific. Branched chain amino acids and short-chain fatty acids are influenced by exercise and dietary changes (acute starvation or low-protein diets), maple syrup urine disease, and possibly hypermetabolic states such as sepsis, injury, or cancer [14].
1.3. miRNAs as Biomarkers
miRNAs are specialized short non-coding RNAs (20–22 nt) that inhibit target mRNA translation. Recent research on circulating miRNAs highlights their usefulness as biomarkers of diseases. Under various conditions, cells release miRNAs that are free or in microvesicles that can be taken up by other cell types. These extracellular miRNAs are important mediators of cell-to-cell communication and coordinate biological functions including angiogenesis, tumor cell invasion, and immune response. miRNAs are reliable biomarkers due to their resistance to degradation in circulation and their enrichment in particular tissues, which reveals the source of circulating miRNAs [15]. Modern technologies in nucleic acid amplification, sequencing, and analysis have allowed us to identify miRNAs produced and released by islets under stress conditions. For this review, we have compiled existing RNA sequencing, microarrays and quantitative polymerase chain reaction (qPCR) data from comprehensive studies in humans and present the potential use of miRNA signatures for future use in detecting pre-DM and/or staging progression and mode of diabetes.
2. Methods
To locate relevant articles, we searched PubMed, beginning with the following keywords: ((mir) or (miRNA) or (circulating mir) or (circulating miRNA)) and ((biomarker) or (biomarkers)) and ((diabetes) or (islet) or (beta)). The second search included the following search keywords: ((miRNA [Title/Abstract]) or (microRNA[Title/Abstract])) and ((diabetes[Title/Abstract]) or (obesity) or (prediabetes)) and (biomarker *). We filtered the results for clinical studies, trials, comparative studies, evaluation studies, journal articles, meta-analyses, multicenter studies, reviews, systematic reviews, and validation studies in the date range of 2009 to 2019, including only studies with human subjects. In addition, we excluded studies that used whole-blood miRNA analyses instead of plasma or serum analyses.
3. Results and Discussion
3.1. miRNAs as Biomarkers in Type 1 Diabetes (T1D)
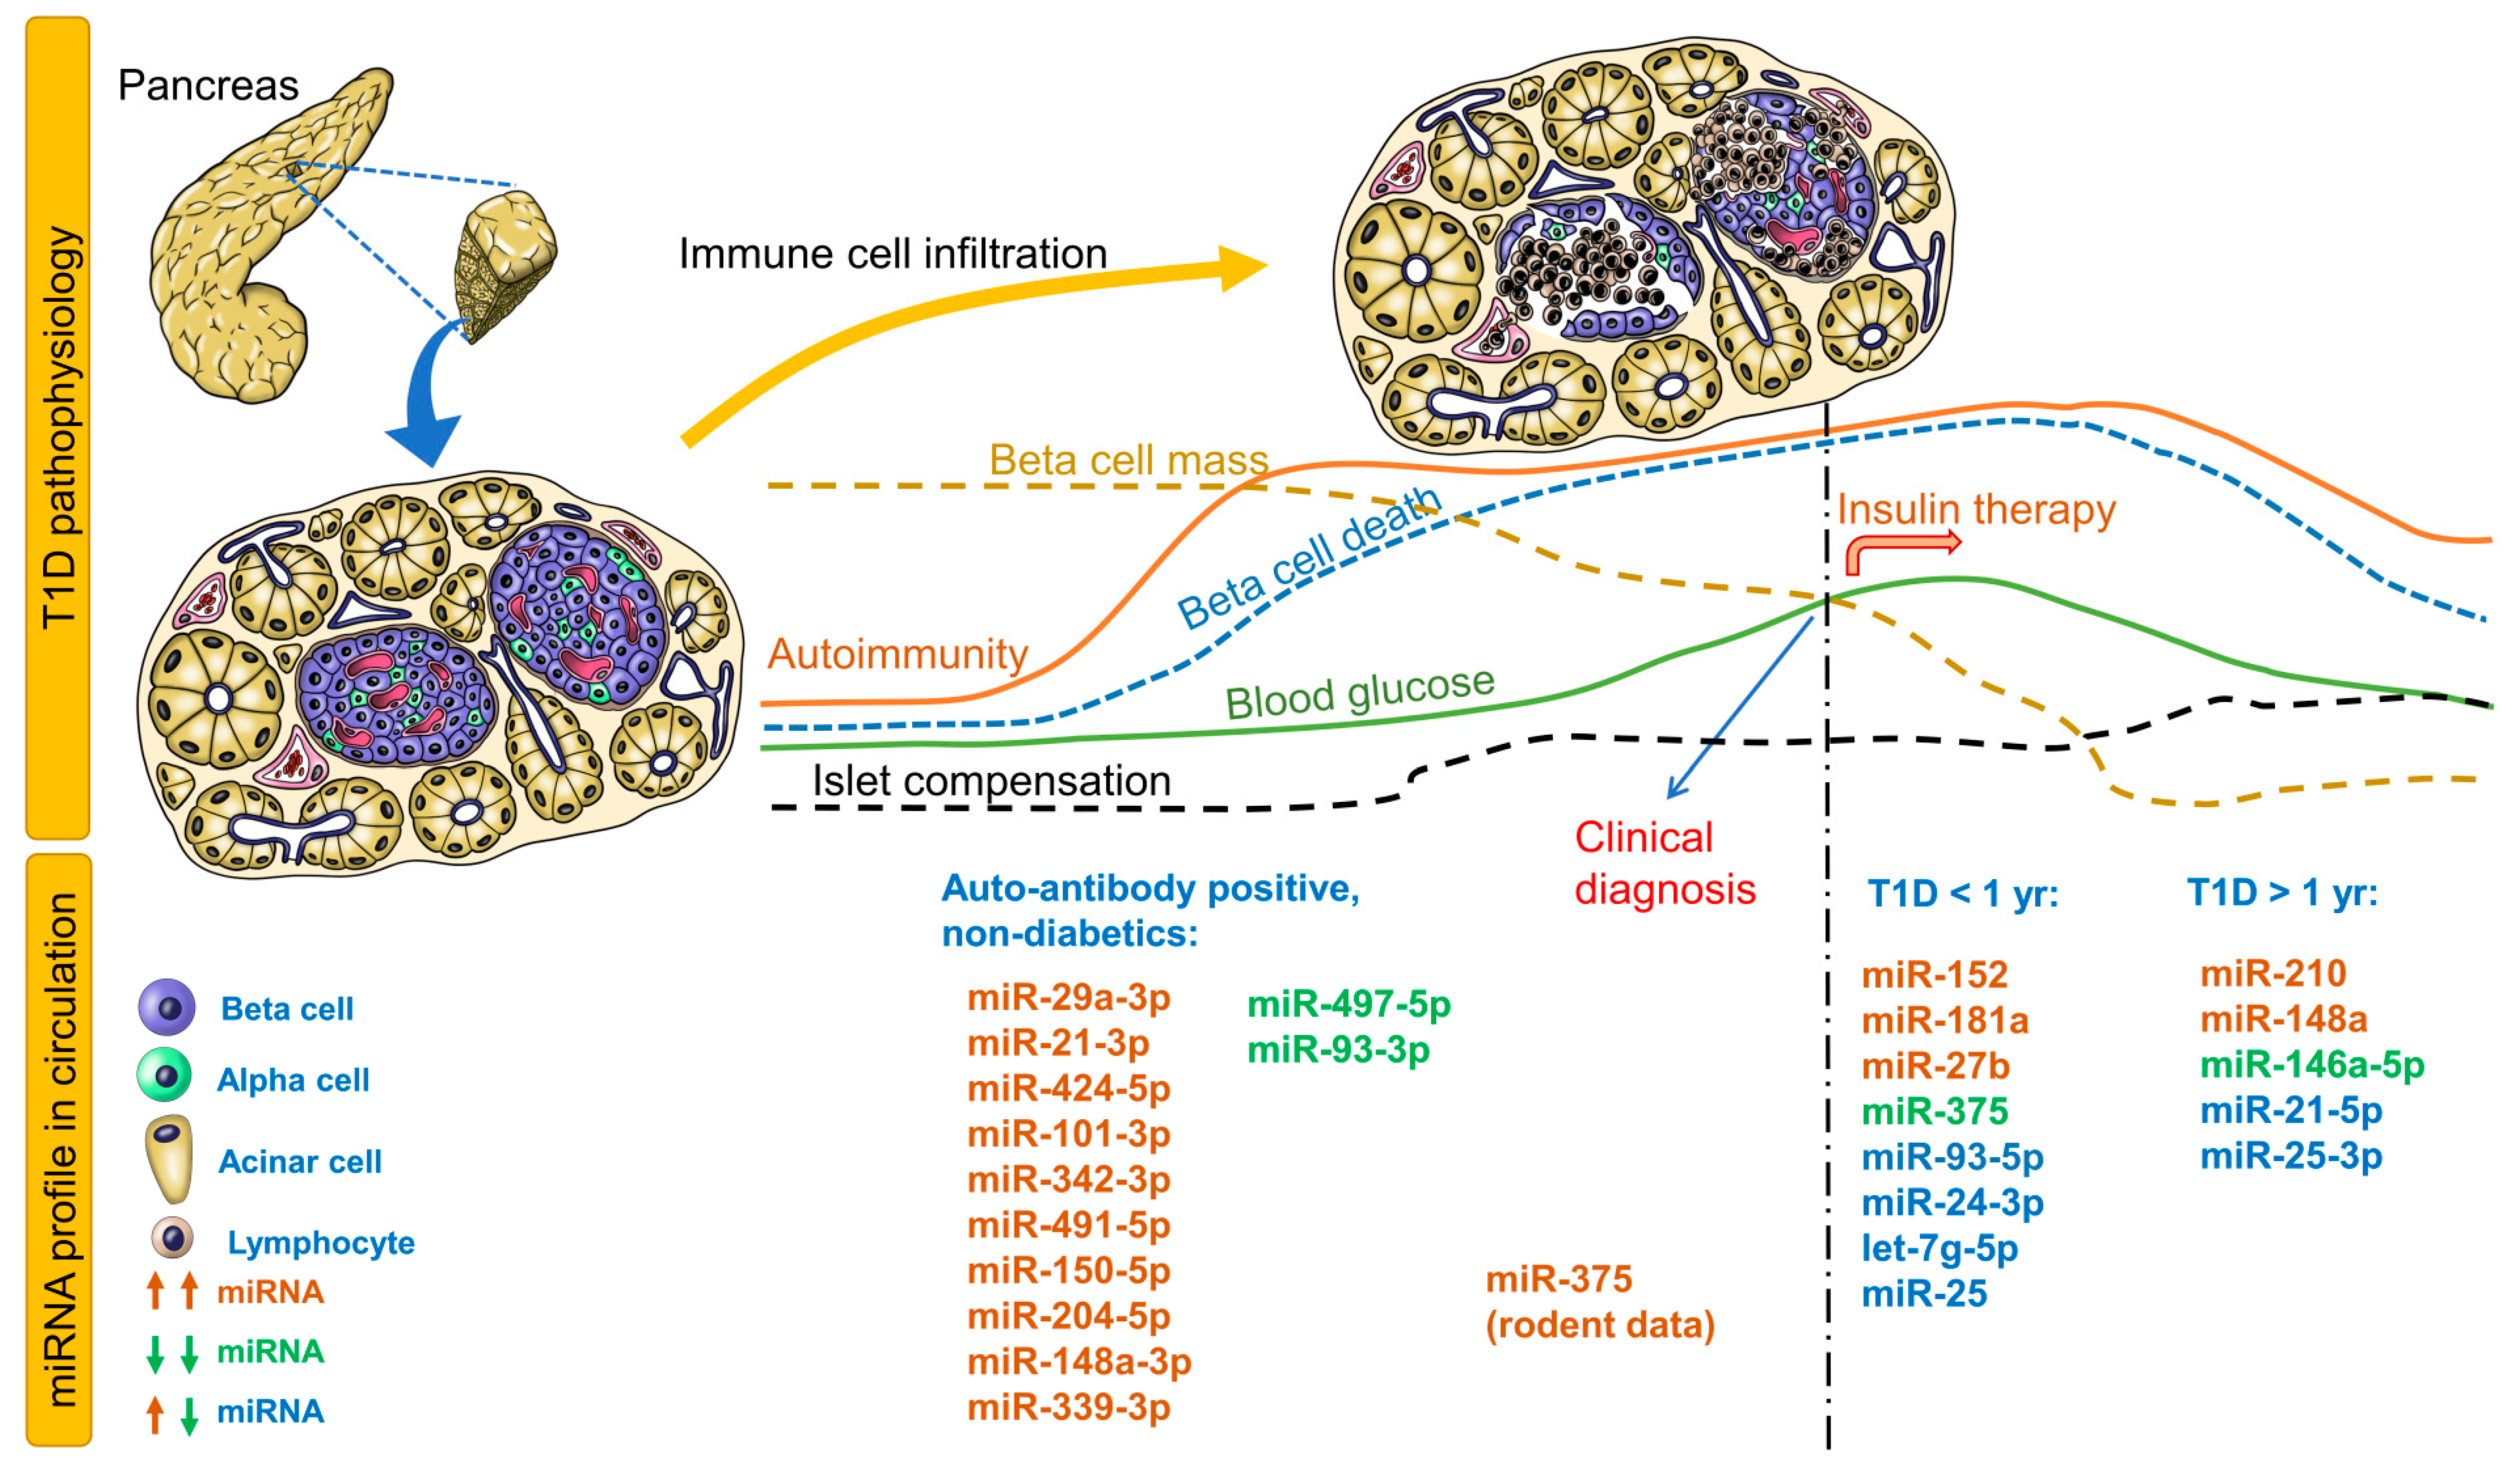
Table 1 provides circulating miRNA profiles for patients with recent-onset T1D, T1D > 1 year, maturity-onset diabetes of the young, latent autoimmune diabetes in adults, and individuals at risk for T1D (autoantibody positive). Immune cell infiltration is the first event that leads to significant reduction in beta-cell mass and eventual hyperglycemia, followed by changes in blood glucose, autoimmunity, beta-cell mass, beta-cell death, islet compensation, and corresponding circulating miRNA profiles (Figure 1). For the autoantibody-positive non-diabetic group, all miRNAs identified in 4 studies are provided in Figure 1. For recent-onset and longstanding T1D groups, only those miRNAs that were identified independently in at least 2 studies are provided in the figure. Any correlations of miRNAs to metabolic parameters are provided in Supplementary Table S1. It is evident that distinct groups of miRNAs can be identified for non-diabetic individuals vs. those with T1D.
In non-diabetic children (autoantibody positive) who participated in the T1D TrialNet Pathway to Prevention study, children with multiple autoantibodies and elevated miR-29a-3p, miR-21-3p, and miR-424-5p were more likely to progress to T1D within 2 years of follow-up [16]. In another cohort of non-diabetic children with islet autoantibodies, circulating miR-339-3p was elevated while miR-497-5p was decreased [17]. In the high-risk group, miR-148a-3p was significantly elevated while miR-93-3p was decreased in high-HLA-risk children. Interestingly, miR-342-3p correlated negatively while miR-144-5p correlated positively to insulinoma-2 antigen (IA2A) antibody titers. miR-378a-3p correlated negatively to IA2A and ZnT8A(Trp) but positively with GAD autoantibodies [17]. In a different autoantibody-positive cohort, miR-101-3p was elevated only in non-diabetic children with multiple autoantibodies and in children with recent-onset T1D and also correlated positively with GAD autoantibody levels [18]. In this cohort, miR-204-5p was elevated only in children with recent-onset T1D but not in non-diabetic autoantibody-positive children. In contrast, miR-204-5p was elevated in autoantibody-positive, non-diabetic children and recent-onset T1D. miR-204-5p levels also demonstrated good ability to distinguish autoantibody-positive non-diabetic children from recent-onset T1D children [19]. Of these miRNAs, miR-29a-3p, miR-342-3p, miR-148a-3p, and miR-93-3p were identified in studies involving recent-onset T1D children, whereas miR-424-5p, miR-101-3p, miR-148a-3p, and miR-93-3p were identified in studies involving children with longstanding T1D (>1 year). These studies in non-diabetic autoantibody-positive children should be validated independently across multiple institutions to evaluate the potential of these miRNAs as early predictive biomarkers of T1D.
In patients with recent-onset T1D, the most consistently upregulated miRNAs were miR-152, miR-181a, and miR-27b (Figure 1, Table 1), while miR-375 was consistently down regulated in independent cohorts (Figure 1, Table 1). miR-25, miR-24-3p, let-7g-5p, and miR-93-5p were either upregulated or downregulated in various recent-onset T1D cohorts. Apart from these miRNAs, a number of miRNAs displayed a positive or negative association with glycemic parameters (Table S1), some of which are described here. In a Danish Remission Phase cohort (European), miR-25 levels 1 month after diagnosis correlated negatively with HbA1c but positively with C-peptide levels at 3 months [20], suggesting an association with residual beta-cell function. However, any association was lost between miR-25 levels measured 12 months after disease onset and glycemic control parameters, possibly due to lack of residual beta-cell function and insulin therapy. In the same cohort after 5-year follow-up, miR-24-3p, miR-146a-5p, miR-194-5p, miR-197-3p, miR-301a-3p, and miR-375 but not miR-25 (although differentially expressed), measured 3 months after diagnosis, predicted stimulated C-peptide, HbA1c, or insulin dose-adjusted HbA1c (IDAA1c) 6 or 12 months after diagnosis [21]. Either upregulated or downregulated miR-25 levels have been reported in recent-onset T1D and longstanding T1D [17,22,23], possibly reflecting differences in residual beta-cell function in these cohorts.
miR-375, an established marker of beta-cell death, was downregulated in a cohort of recent-onset T1D patients [24], did not differ significantly compared to healthy controls in another cohort [25], but was upregulated in another cohort with at least 5 years of disease [26] (Table 1). In the Danish Remission Phase cohort that completed the 5-year follow-up, miR-375 correlated negatively with C-peptide levels 6 months after diagnosis [20]. T1D patients were best classified using miR-375 and miR-21 levels [26].
These conflicting observations are not surprising for at least three reasons: (1) the bulk of beta-cell death in T1D precedes clinical diagnosis, and hence any increase in circulating miR-375 is possibly missed at the time of sampling; (2) the degree, extent, and dynamics of beta-cell death differ between individuals; and (3) islet compensatory mechanisms and ongoing autoimmunity may influence circulating levels even after disease diagnosis. For instance, our observations in mice suggest that miR-375 levels are significantly elevated in circulation immediately (3–6 h) after streptozotocin administration, subsiding to undetectable levels within 24 h. In the context of islet transplantation, we observed that miR-375 levels increase markedly during islet autotransplantation in patients receiving total pancreatectomy with islet auto transplantation, but normalized to baseline levels 7 days after transplantation [35]. In mice, we also observed elevated miR-375 levels 24 h after human islet transplantation, indicating islet inflammation and damage in the peritransplant period [35]. Thus, miR-375 is a useful marker for islet cell damage during transplantation. In the context of diabetes prediction, miR-375 can be used alongside other biomarkers and not as a standalone biomarker.
In recent-onset T1D (<5 years), miR-200a-3p and miR-155-5p correlated negatively with HbA1c and IDAA1c levels [31]. This association was lost in patients with more than 5 years of T1D. Alterations in circulating miRNA profiles were also reported in another cohort, where miRNAs with elevated levels at baseline or 1 year after diagnosis were undetectable 4 to 8 years after diagnosis [27]. In fact, as depicted in Figure 1 and mentioned earlier, miRNAs in autoantibody-positive non-diabetic children were identified in independent studies involving recent-onset T1D or children with longstanding T1D (but not consistently in at least 2 studies, thus missing our threshold for inclusion in Figure 1). Nevertheless, these profiles of circulating miRNAs at different stages of T1D pathophysiology (Figure 1), especially those expressed during early stages of autoimmunity, are attractive candidates that should be validated further in international cohorts for diagnostic utility.
3.2. miRNAs as Biomarkers for Pre-Diabetes (Pre-DM) and T2D
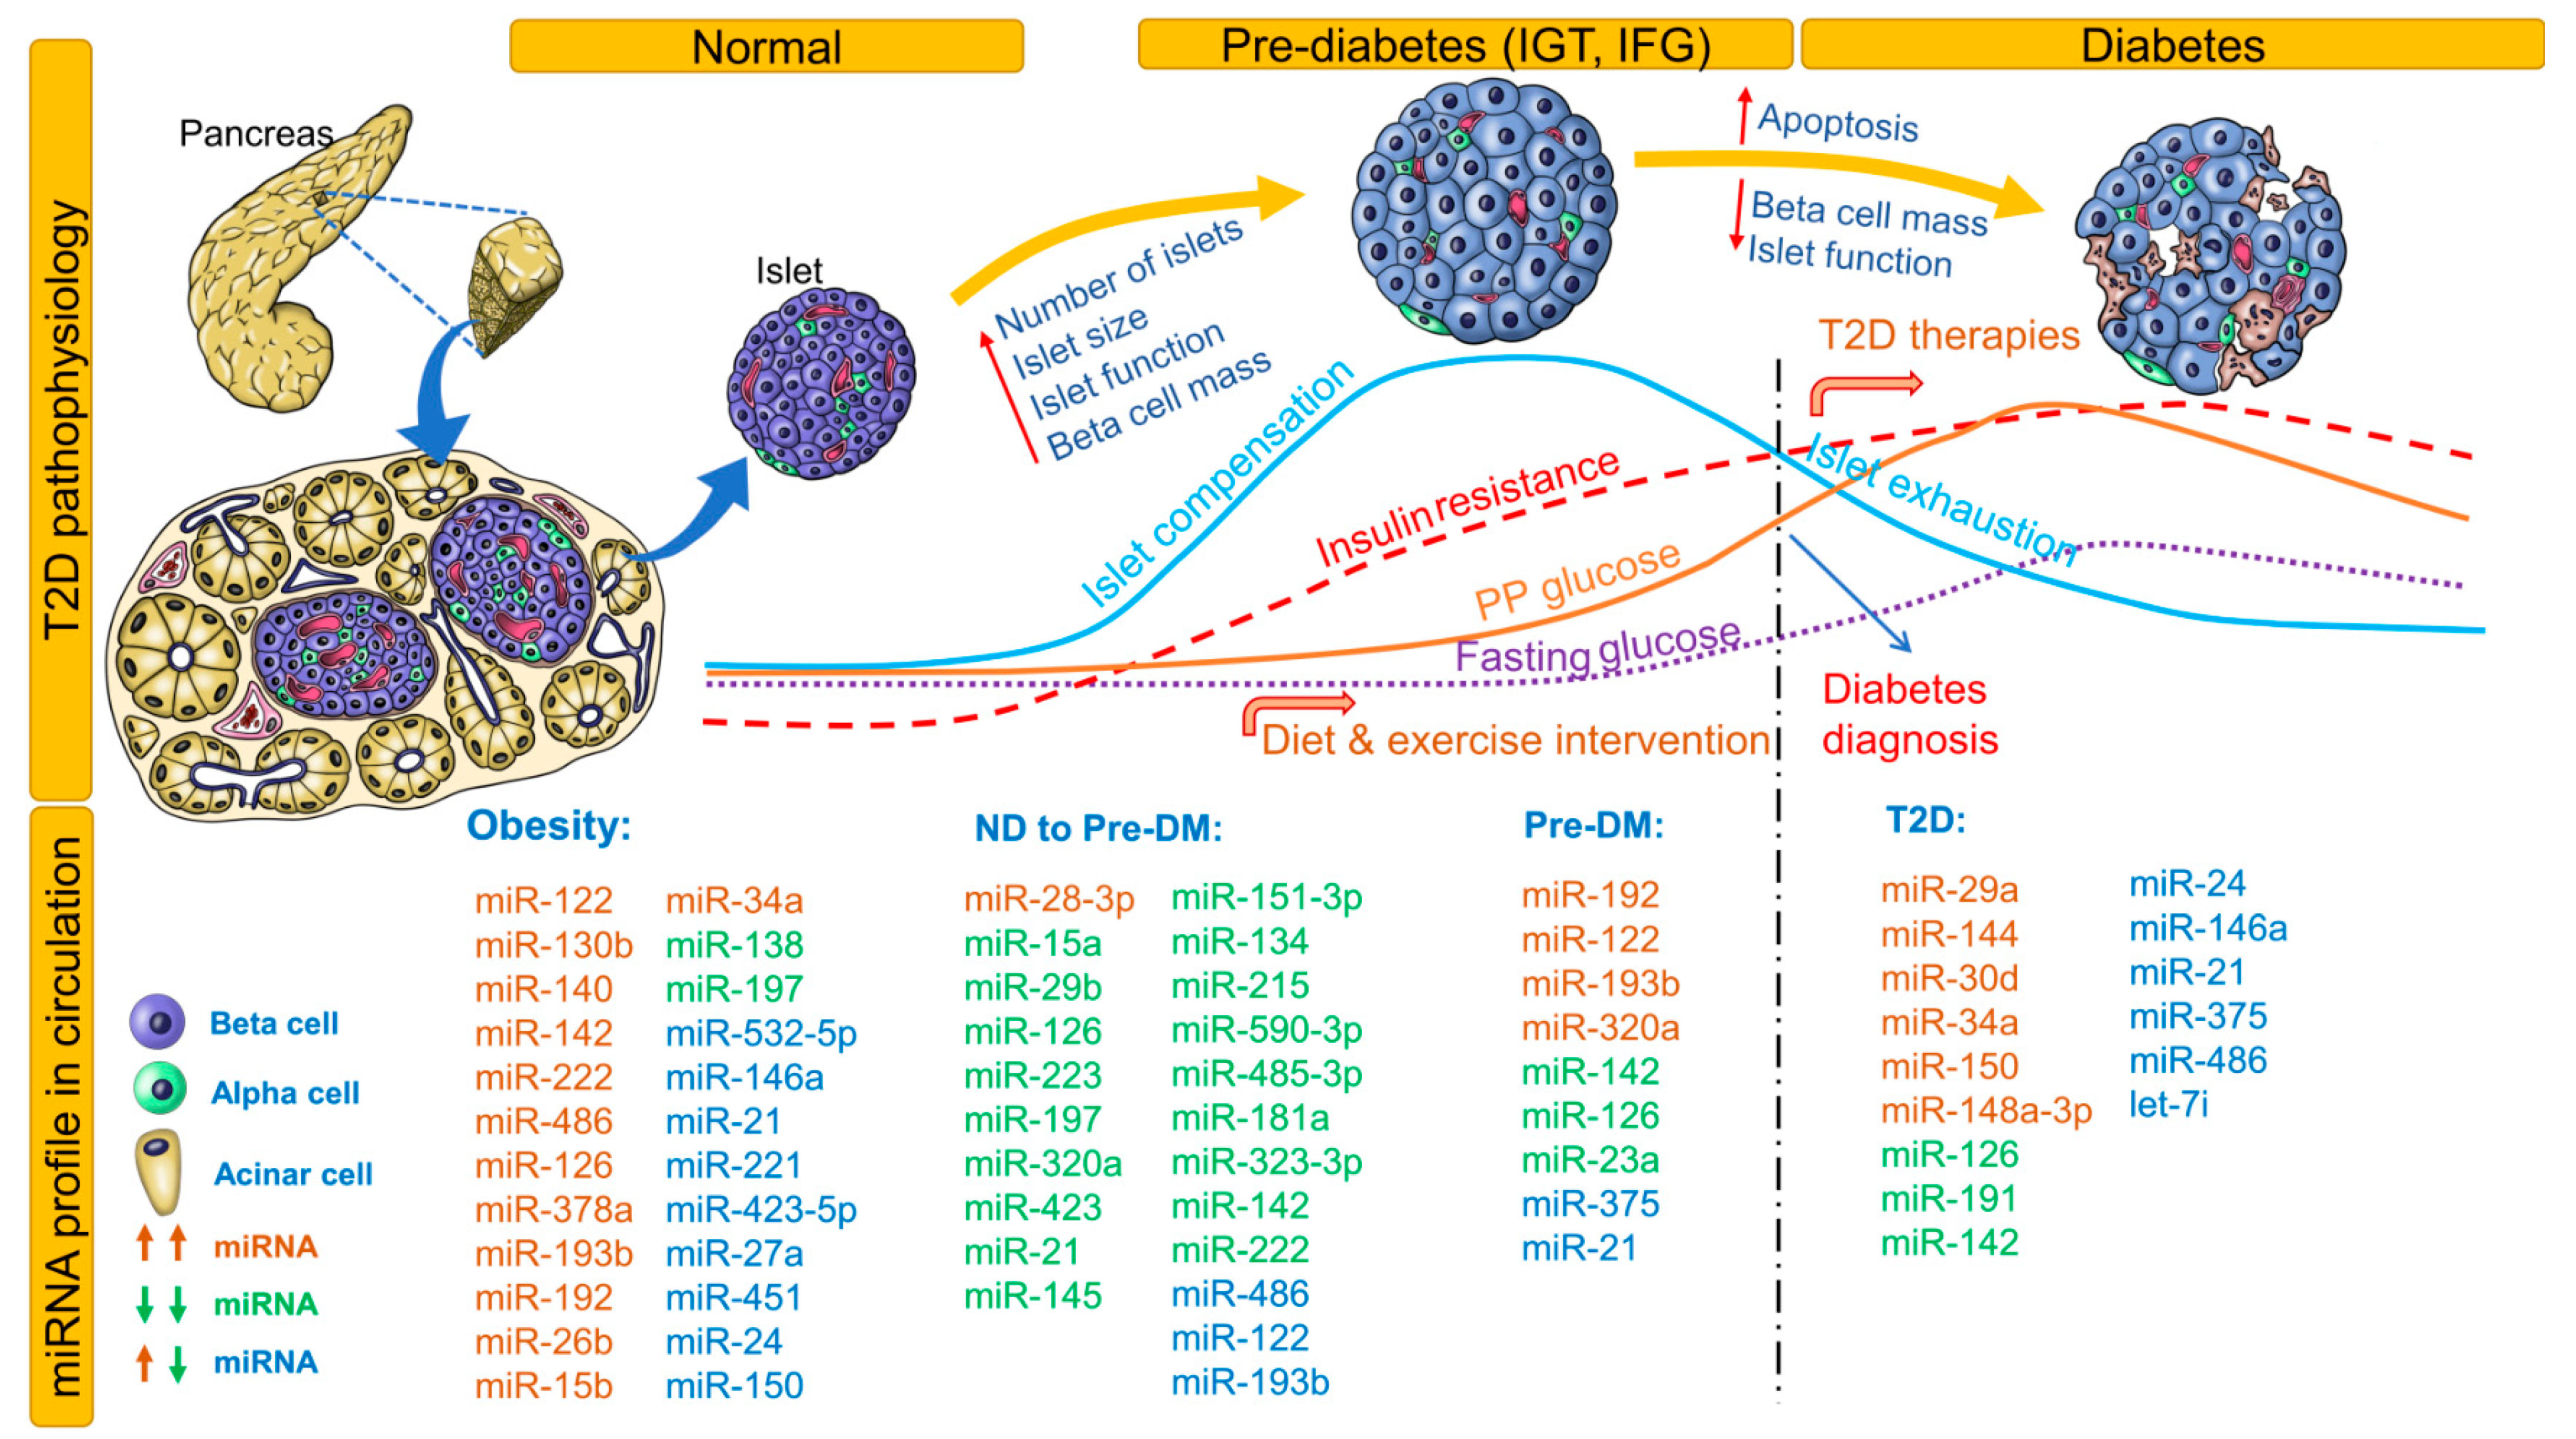
Changes in fasting and postprandial glucose, insulin resistance, islet compensation, and circulating miRNA profiles in the pathophysiology of T2D are shown in Figure 2. This figure also lists all miRNAs identified in non-diabetic healthy individuals who proceeded to develop pre-DM or T2D. Notably, miRNAs identified independently in at least 2 studies for obesity, pre-DM, and T2D are included. For an extensive list of all differentially expressed miRNAs, see Table 2 and Table 3. Association (positive or negative) of differentially expressed miRNAs with metabolic parameters are provided in Supplementary Table S1. Here, we provide a brief review of these correlation analyses conducted in different ethnic populations.
Case-control studies conducted in healthy populations with follow up for future development of pre-DM or T2D provide insights on circulating miRNA profiles before apparent changes in glucose homeostasis and onset of irreversible loss of beta-cell mass. For example, in healthy children aged 7 years, levels of miR-221, miR-28-3p, miR-142-3p, miR-486-3p, and miR-486-5p can be used for risk estimation and obesity classification [36]. In non-diabetic healthy adults, baseline miR-122, miR-15a, miR-197, miR-320a, miR-423, and miR-486 levels were inversely associated with progression to glycemic impairment at 2.5-year follow-up [37]. In another cohort of non-diabetic healthy adults, miR-320a and miR-486-5p increased the odds while miR-375 decreased the odds of insulin resistance [38]. In the Bruneck study cohort, normoglycemic individuals who developed T2D over 10 years were appropriately classified as diabetics based on baseline levels of miR-15a, miR-126, miR-320, miR-223, and miR-28-3p [39]. Thus, the assessment of miRNA signatures instead of a singular miRNA profile can help in not only accurately classifying DM but also distinguishing DM from other diseases.
In a Han Chinese non-diabetic cohort, low miR-126 levels predicted future development of T2D [40]. In another healthy cohort, miR-126, miR-148a, and miR-375 correlated negatively to glucose area under the concentration curve values, miR-29a and miR-21 correlated positively to homeostatic model assessment of insulin resistance (HOMA-IR) values, and miR-29a correlated positively to homeostasis model assessment of β-cell function (HOMA-B) values [26]. In a European relationship between insulin sensitivity and cardiovascular disease risk (RISC) study cohort of non-diabetic, normotensive individuals who proceeded to develop pre-DM at 3-year follow-up, miR-181a, miR-323-3p, miR-342-3p, miR-222, miR-483-5p, miR-151-5p, miR-532-3p, miR-142-5p, miR-625, miR-27b, and miR-590-3p were prognostic and diagnostic biomarkers of beta-cell dysfunction. In this group, a miRNA signature of reduced miR-21, miR-145, miR-151-3p, miR-134, miR-215, miR-590-3p, miR-485-3p, miR-181a, and miR-323-3p was diagnostic of beta-cell dysfunction [41]. In a general population study of 1000 individuals, elevated miR-122 levels correlated with liver enzymes, adiposity, inflammation, insulin resistance, and an adverse lipid profile. Treatment with atorvastatin reduced serum miR-122 levels significantly. Over a period of 15 years, individuals with a higher miR-122 level at baseline were at increased risk of developing metabolic syndrome or T2D [42]. Overall, from these studies, levels of miR-28-3p, miR-142, miR-486, miR-122, miR-15a, miR-320a, miR-126, and miR-375 appear to be consistently (in different cohorts) altered in circulation even before the onset of any clinical symptoms. Further studies are warranted in healthy populations to validate these findings and to discover consistent and unique circulating miRNA signatures to predict future development of T2D.
Obesity increases the risk for development of T2D/metabolic syndrome and is termed ‘diabesity’ (obesity-induced diabetes). Although not the focus of our review, we provide a brief overview of miRNAs associated with obesity traits (Figure 2) and related effects on glycemic status. In Caucasian obese children, increased miR-486-5p/miR-486-3p, miR-142-3p and HOMA-IR, together with decreased miR-28-3p, explained about 60% of variance in body mass index [36].
In obese Europeans, miR-144-5p, let-7d, miR-34a, and miR-532-5p strongly predicted insulin resistance [62]. For other associations, see Supplementary Table S1. Interestingly, in patients with metabolic syndrome enrolled in the Practicing Restorative Yoga vs. Stretching for the Metabolic Syndrome (PRYSMS) study, weight loss improved the circulating miRNA profile [59]. In another cohort with obesity, an acute aerobic intervention in a single session further increased circulating levels of miRNAs involved in inflammation [66]. In contrast, in a different cohort participating in the Centro Universitario Ricerca Interdipartimentale Attività Motoria (CURIAMO) trial, a 3-month exercise intervention markedly reduced the levels of miR-146a-5p, also correlating with decreases in total cholesterol and waist circumference [72]. In patients who underwent bariatric surgery, miR-125b, miR-378a, miR-192, miR-629, miR-22-5p, and miR-15a levels were reduced [65]. Similar reductions in circulating miRNAs (although different miRNAs) were observed in an independent cohort after bariatric surgery [74]. Thus, miRNA profiles are helpful in understanding and tracking the efficacy of intervention programs.
As depicted in Figure 2, progressive insulin resistance induces islet compensation that maintains glucose homeostasis. Progression of the disease results in an abnormal glycemic state, characterized by a reduction in beta-cell secretory capacity. This abnormal glycemic state is represented either by IFG or IGT. However, individuals may exhibit both states, thus reflecting a heterogeneous pathogenesis of T2D. Despite impairment in glycemic states, it takes years for patients to progress to overt T2D, and the disease is often undiagnosed due to infrequent/insufficient analysis of both of these parameters. Moreover, distinguishing pre-DM patients from healthy populations has proven difficult due to fluctuations in the tested ranges in clinical parameters and the influence of lifestyle factors. In this regard, even though the timeline of progression from pre-DM to T2D varies, distinct miRNA signatures can be used to predict future development of T2D. In the Bruneck study cohort, miR-126 remained a significant predictor of T2D, with a gradual decrease in levels from controls to those with IFG/IGT to those with T2D. T2D cases can be correctly classified using a panel of miRNAs including miR-15a, miR-126, miR-320, miR-223, and miR-28-3p [39]. In two other cohorts, miR-126 had an inverse association with fasting glucose, HbA1c, and 1 h postprandial glucose [46,56]. In newly diagnosed T2D and pre-DM patients, low levels of serum miR-126 increase the odds ratio for T2D and can distinguish T2D from controls [47]. Pre-DM patients were best distinguished from healthy populations by using a binary random forest classifier based on levels of miR-146a, miR-126, miR-30d, and miR-148a [26]. In T2D patients, miR-486, miR-146b, and miR-15b correlated positively with fasting plasma glucose, and these biomarkers could be used to discriminate T2D patients from healthy controls [67]. Pre-DM patients with higher levels of miR-150 and miR-30a-5p or lower levels of miR-375 and miR-15a were at a higher risk of developing T2D [69]. A miRNA panel consisting of miR-7641-3p, miR-136-5p, miR-490-3p, miR-501-5p, miR-127-5p, miR-4532-5p, miR-483-5p, and miR-210-3p distinguished obese nonprogressors from progressors who developed T2D at 5-year follow-up [77]. Thus, using a panel of miRNAs and other clinical parameters including HbA1c to classify the health status of patients may help in the discovery of the disease before onset.
Use of biomarkers may help not only in predicting future development of disease, but also in monitoring intervention efficiency. For example, in pre-DM patients enrolled in the CORDIOPREV study, elevated miR-150 and miR-130a-5p levels were associated with a decrease in the disposition index (insulin signaling and release); elevated miR-150 levels were associated with a decrease in the insulin sensitivity index and muscle insulin sensitivity index; and elevated miR-375 levels were associated with a decrease in the hepatic insulin resistance index after 4-year follow-up [69]. In another group of pre-DM patients, miR-192 and miR-193b correlated positively with serum triglycerides and fatty liver index. An exercise intervention program significantly reduced these levels over 6 weeks [51]. In patients with metabolic syndrome, after a 3-month weight loss intervention, circulating levels of miR-326, miR-24, miR-425, and miR-652 increased while circulating levels of miR-106b, miR-140, miR-20b, miR-363, miR-486, miR-532, miR-92a, miR-93, and miR-let7c decreased. Among these, changes in miR-146a, miR-151a, miR-23a, miR-181b, miR-181d, miR-21, miR-221, miR-222, miR-223, miR-23, miR-24, and miR-27b levels strongly correlated with weight change over 3 months. Baseline levels of miR-143, miR-145, miR-146, miR-191, miR-221, miR-23a, miR-29a, and miR-584 strongly correlated with weight change after 3 months [59]. A vitamin D–induced increase in miR-152 levels correlated negatively with HbA1c, while a decrease in miR-192 levels correlated positively with fasting glucose in individuals at risk for T2D [63]. In a Chinese cohort with IFG, upregulated levels of miR-144, miR-20a, and let-7b increased the risk for T2D and positively correlated with HOMA-IR, while decreased levels of miR-142 increased the risk for IFG and negatively correlated with HOMA-IR [70].
Irrespective of disease status (pre-DM, T2D, non-diabetic controls), in a cohort of 871 subjects, miR-144-5p correlated inversely with insulin levels, updated homeostasis model assessment (HOMA2) values, and triglyceride levels. miR-122-5p, miR-184, and miR-339-3p were associated with insulin and HOMA2. miR-144-5p, miR-146b-5p, miR-221-3p, miR-642a-5p, and miR-181a-2-3p correlated positively and miR-148a-3p, miR-15-3p, miR-93-5p, and miR-18-3p correlated inversely with HbA1c. In individuals with IFG, in addition to the trend in the whole population, miR-122-5p was independently associated with insulin and HOMA2 index while miR-146b-5p was associated with HbA1c. In addition, miR-885-5p and miR-106b-5p correlated positively with serum glucose levels [95]. These general population studies are important for understanding the associations of miRNAs to metabolic parameters regardless of disease status.
The ability of miRNA signatures to predict pre-DM or T2D should be tested in various ethnic populations. It is possible that specific miRNA signatures may be driven by ethnicity-related factors (genetic or environmental). For example, in a Swedish cohort, miR-15a, miR-29b, miR-24, miR-126, miR-144, miR-223, miR-191, and miR-486-5p correlated inversely with insulin sensitivity index. In an Iraqi cohort, miR-197 (but not the miRNAs noted in the Swedish cohort) correlated positively with insulin sensitivity index, thus suggesting ethnicity-specific associations [86]. Overall, specific miRNA signatures have the capability to predict future development of T2D. Ethnicity-specific miRNA signatures should be established to improve the predictive potential of these signatures.
3.3. miRNA Biomarkers in Gestational Diabetes
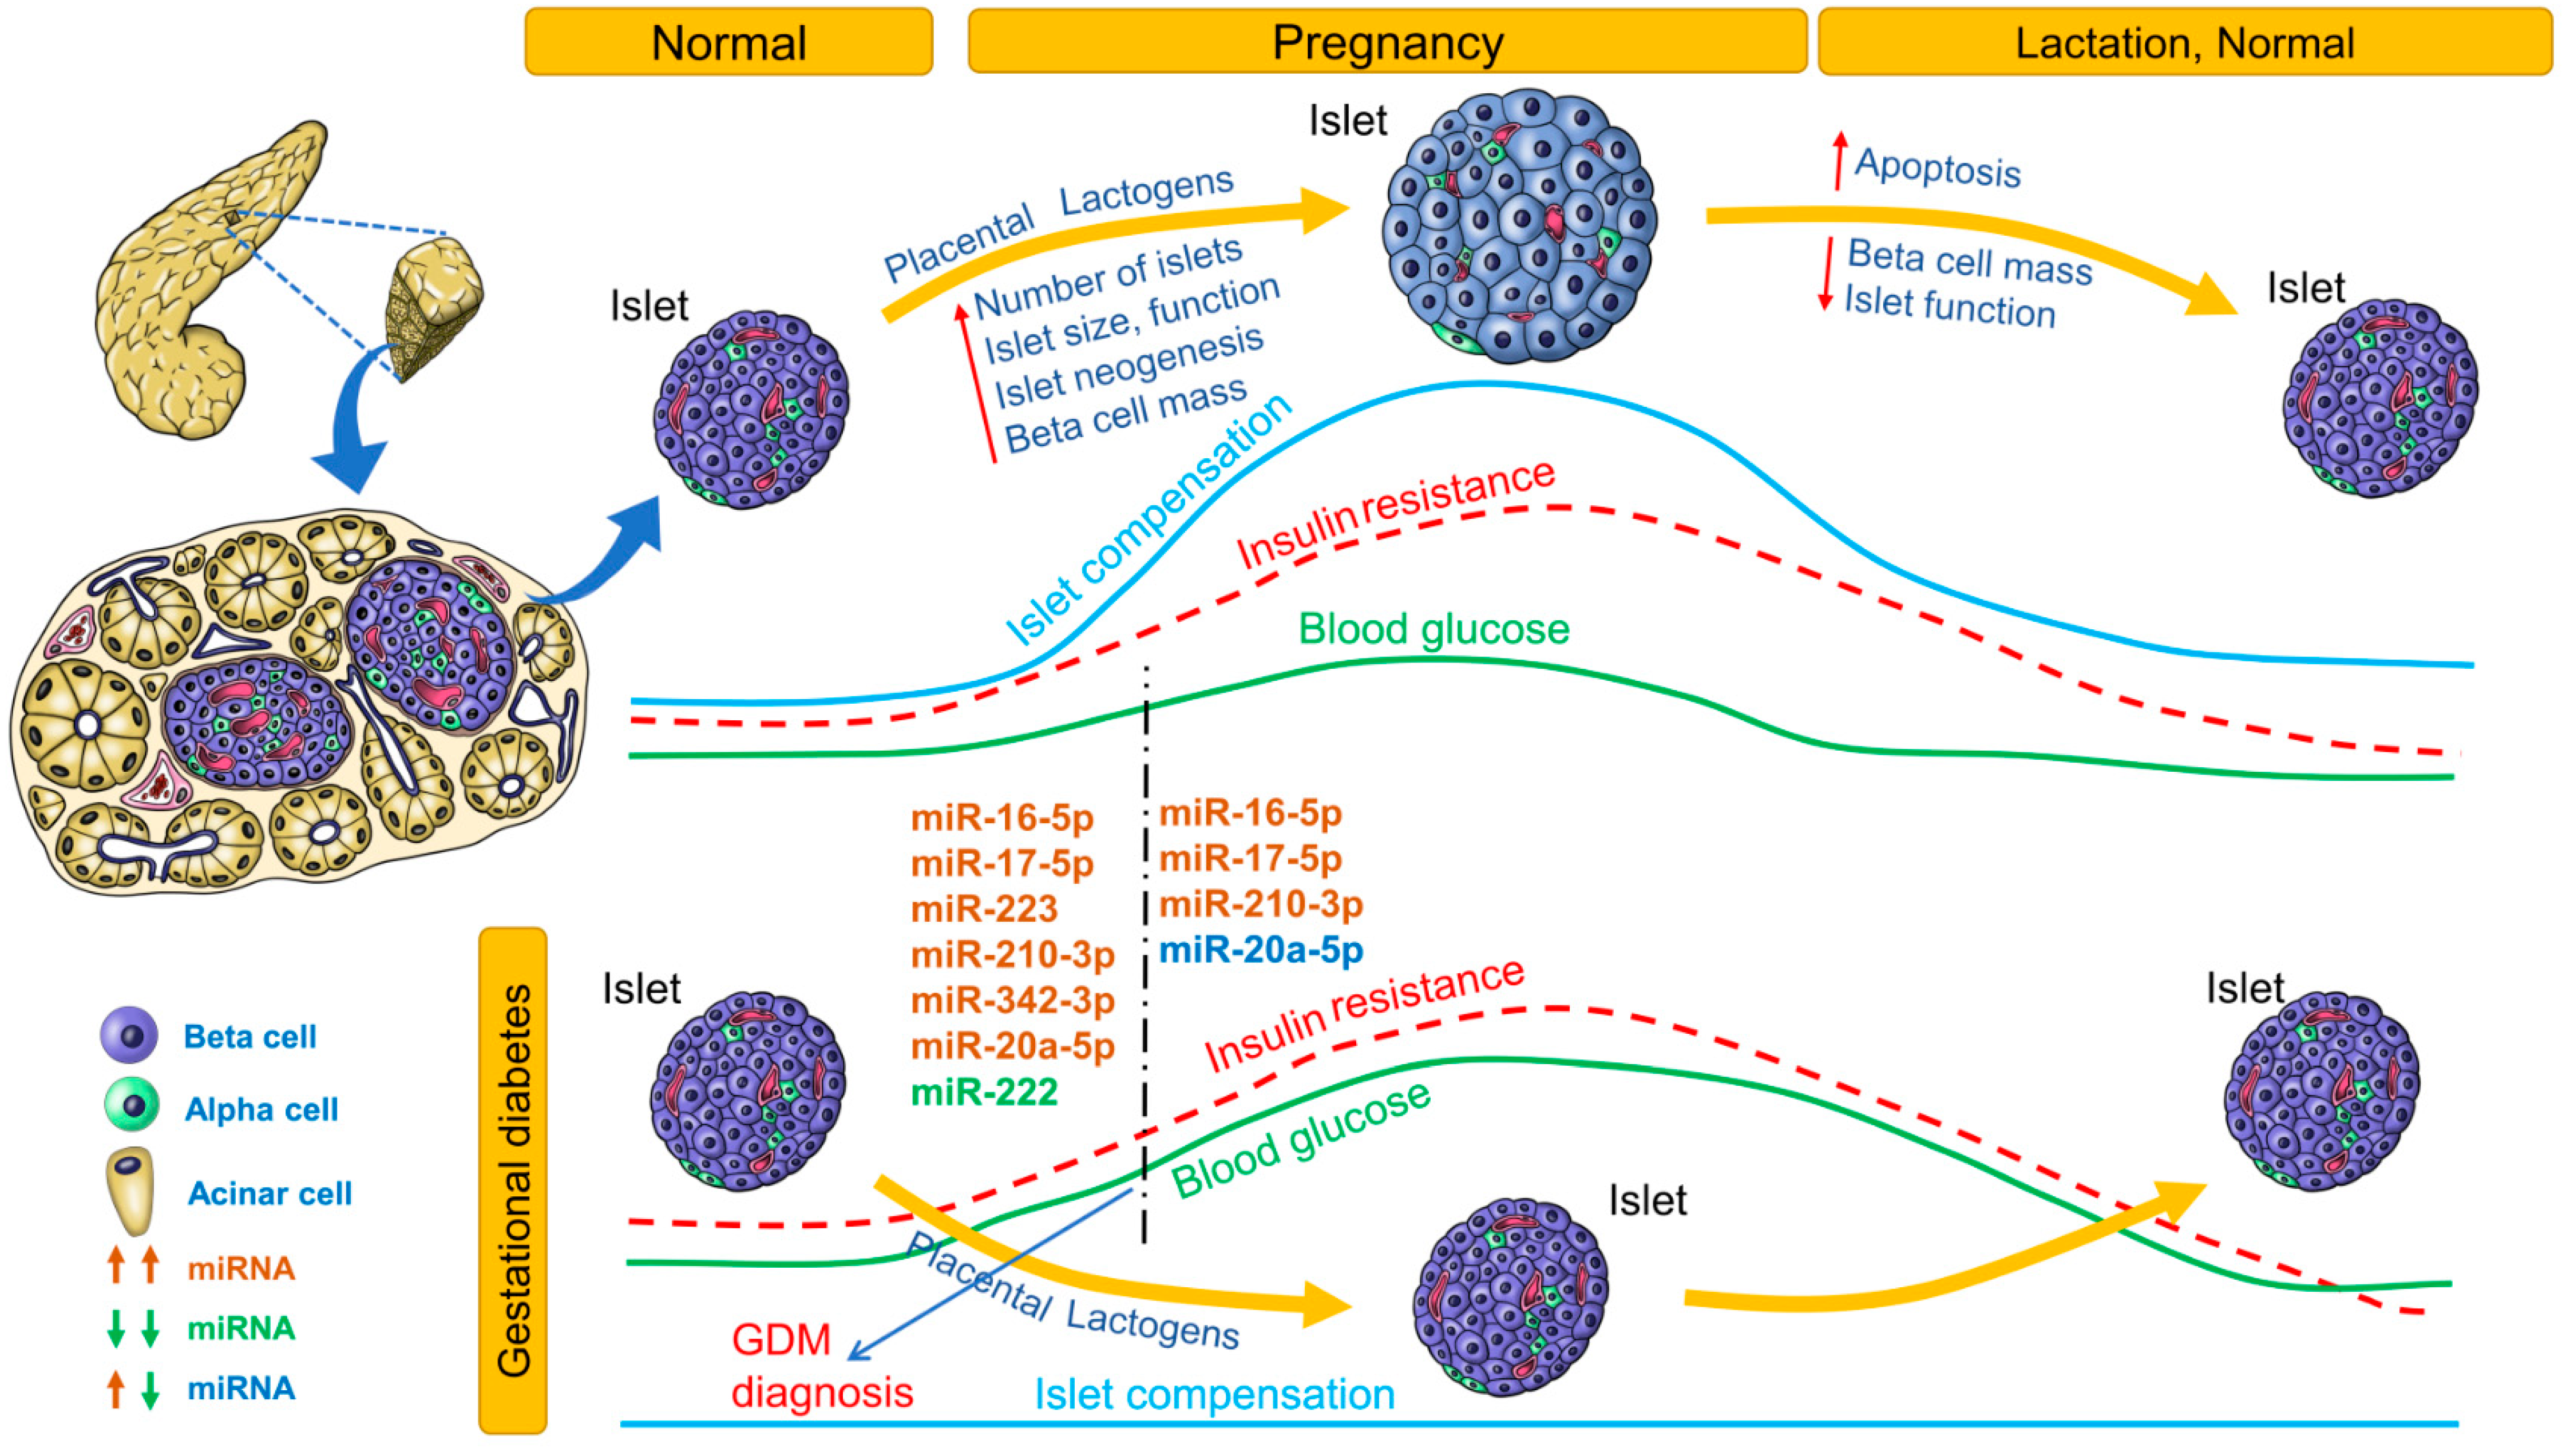
Changes in blood glucose, insulin resistance, islet compensation and circulating miRNA profiles in GDM are summarized in Figure 3. Only miRNAs that were identified independently in at least 2 studies are listed. For an extensive list of all differentially expressed miRNAs, see Table 4. The association (positive or negative) of differentially expressed miRNAs with metabolic parameters is provided in Supplementary Table S1.
During pregnancy, insulin resistance imposes increased metabolic demand on islets. Islet adaptation to pregnancy is crucial not only for maintaining glucose homeostasis but also for preventing excessive nutrient flow from mother to fetus across the placenta. Placental lactogens induce beta-cell mass expansion, and islet neogenesis (in humans) has been demonstrated [96]. Lack of islet adaptation to pregnancy results in GDM, the incidence of which is steadily increasing. GDM also increases the risk of future development of T2D in both mother and child. Glucose tolerance is usually tested between 24 and 28 weeks of pregnancy. By this time, blood glucose levels are already significantly elevated and may affect the developing fetus. There is a need for predicting development of GDM earlier in pregnancy, so that intervention strategies can be applied before blood glucose levels increase.
Table 4 lists the miRNA profiles identified in various studies at different stages of gestation. Of these miRNA profiles, the most consistently upregulated miRNAs before 20 weeks of pregnancy were miR-16-5p, miR-17-5p, miR-223, miR-210-3p, miR-342-3p, and miR-20a-5p, whereas miR-222 was the most consistently downregulated miRNA (Figure 3). In women 16.1 weeks’ pregnant, higher levels of miR-155-5p and miR-21-3p were associated with higher odds for GDM. In women with male offspring (but not female offspring), miR-155-5p, miR-21-3p, miR-146b-5p, miR-223-3p, miR-517-5p, and miR-29a-3p were associated with GDM risk [101]. In pregnant women, miR-30a-5p, miR-130a, and miR-150 were associated with higher pregnancy weight gain, whereas miR-99b, miR-103, mIR-128a, miR-221, miR-324-3p, and miR-652 were associated with lower pregnancy weight gain. In pregnant women who were followed up to the 28th week, levels of miR-16-5p, miR-17-5p, and miR-20a-5p were positively correlated with insulin resistance (HOMA-IR) [100]. In pregnant women with GDM, high levels of miR-330-3p were inversely associated with insulinemia. In contrast, in GDM patients with lower miR-330-3p levels but levels higher than those of control women, insulinemia was higher than in the group with high miR-330-3p levels. Moreover, women with high miR-330-3p levels had an aggressive diabetic phenotype among GDM patients [102]. In pregnant South African women, miR-20a-5p and one or more risk factors were significant predictors of GDM [105]. The predictive potential for these miRNAs should be validated in further studies.
3.4. Common miRNA Signatures for Diabetes
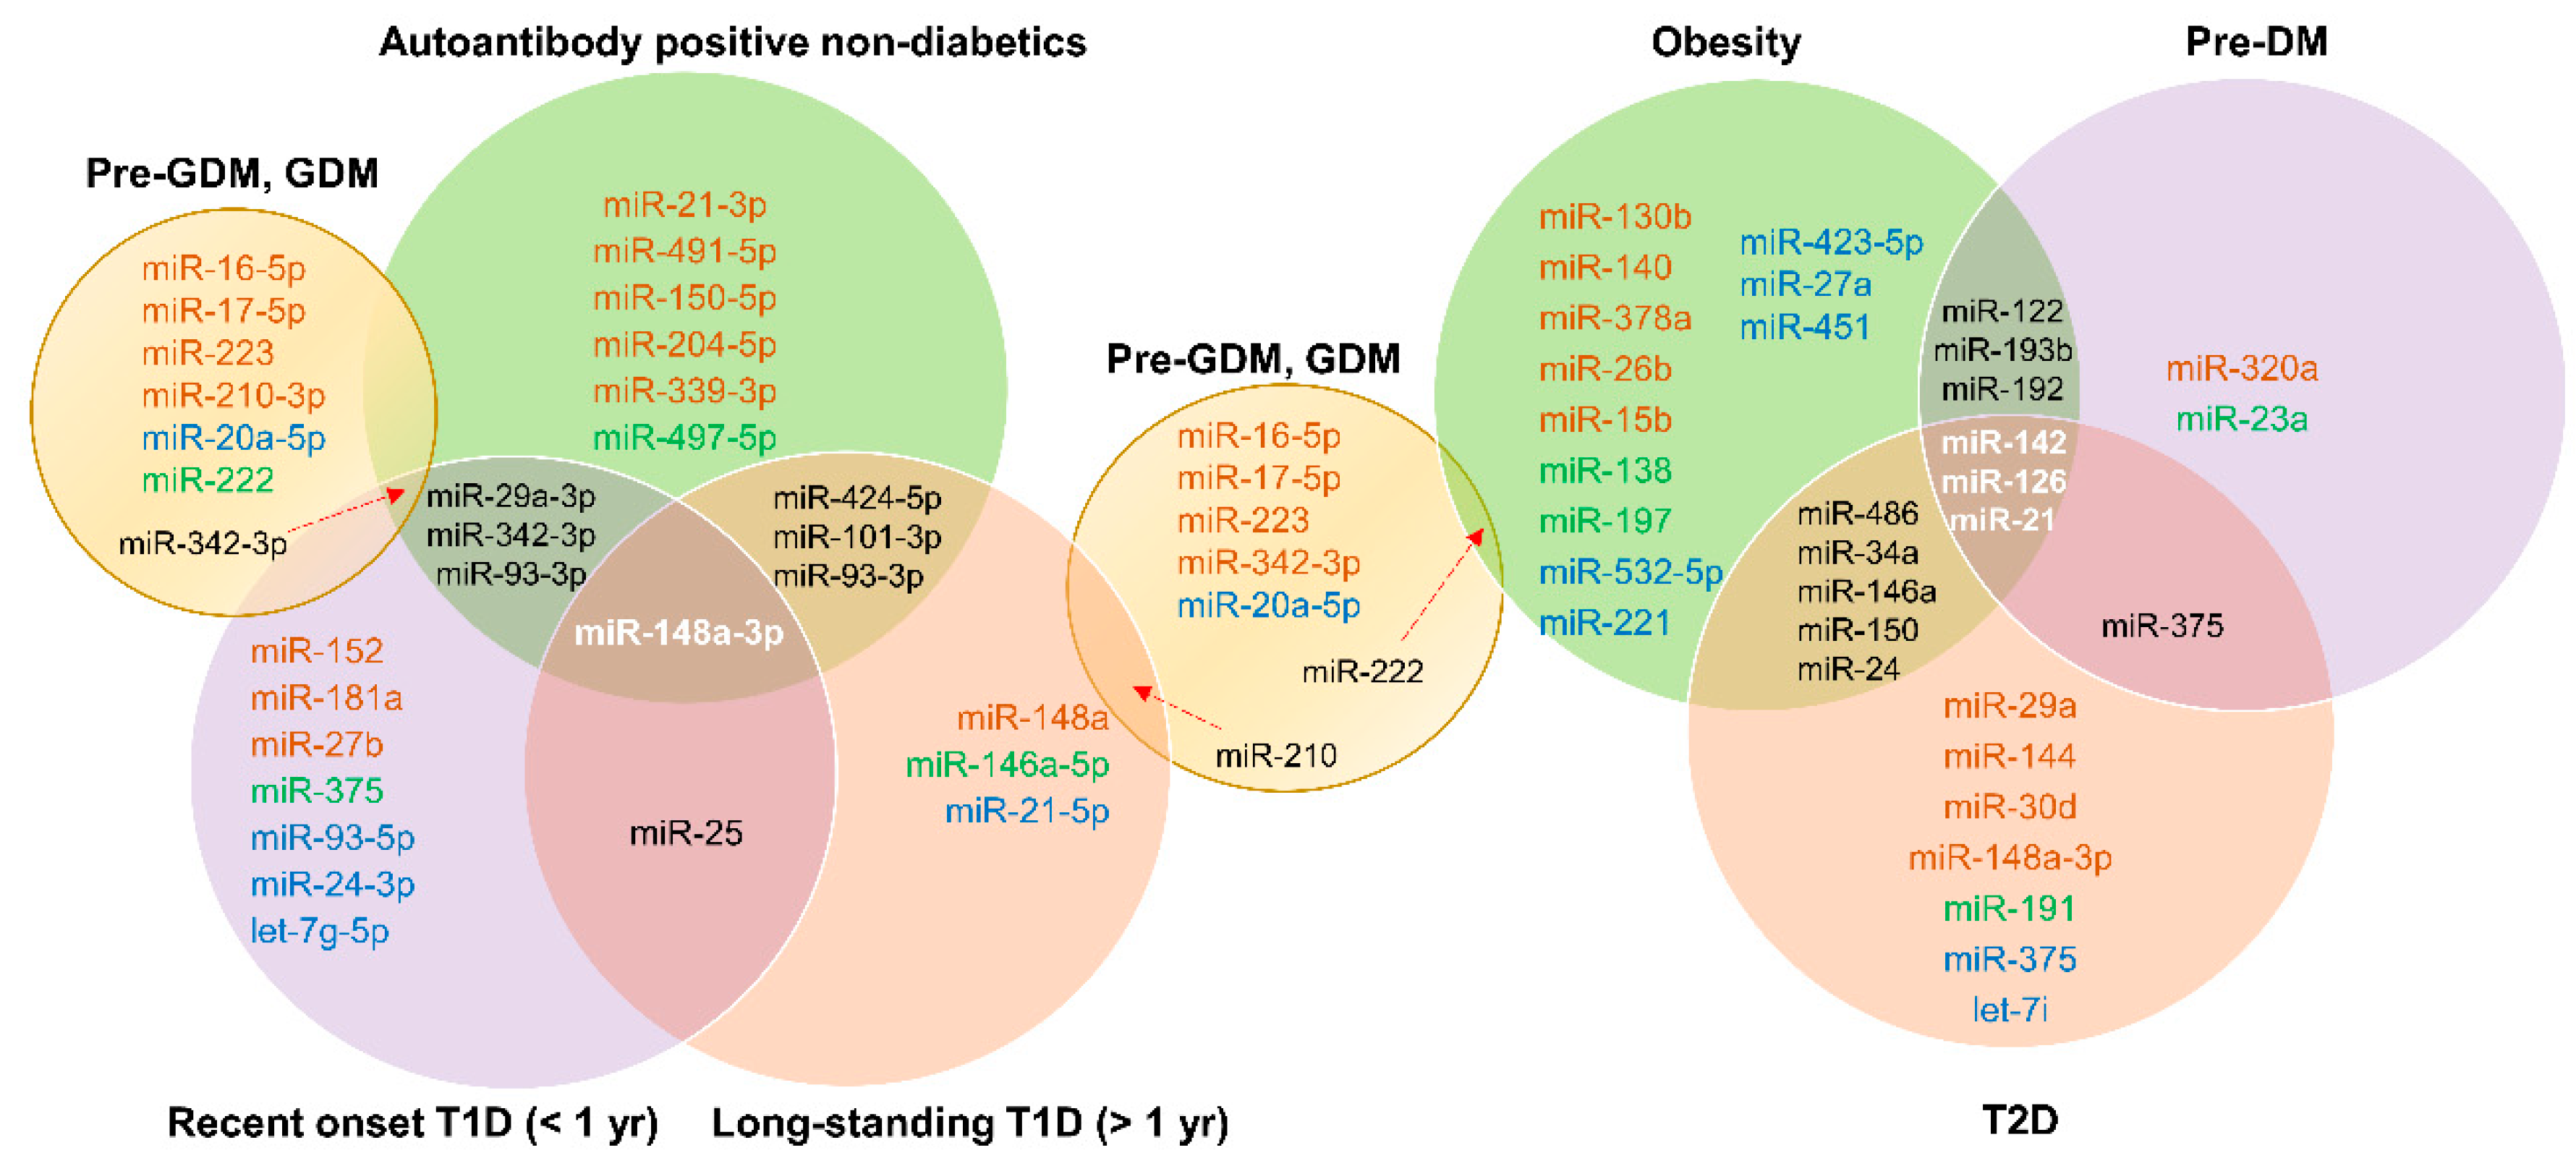
Figure 4 depicts common miRNA signatures for those at risk for T1D, with recent-onset T1D, longstanding T1D, obesity, pre-DM, T2D, and GDM. For specific upregulation or downregulation of these common miRNAs in specific stages, see Table 1, Table 2, Table 3 and Table 4. miR-148a-3p was common in all stages of T1D, suggesting its potential as an early biomarker specific to T1D pathogenesis. Among those at risk for T1D and with recent-onset T1D, miR-29a-3p, miR-342-3p, and miR-93-3p were common. miR-25 was common in individuals with recent-onset or longstanding T1D. miRNAs common to obesity, pre-DM, and T2D were miR-142, miR-126, and miR-21. miR-375 was common to both pre-DM and T2D patients, suggesting early involvement of this miRNA in the pathogenesis of T2D. miR-342-3p was common to those with GDM, those at risk for T1D, and patients with T1D, whereas miR-210 was shared by individuals with GDM and longstanding T1D. Thus, there appear to be some common signatures, but more studies are needed to make solid connections between various types of diabetes.
3.5. Tissue of Origin and Functional Significance
The tissue of origin of circulating miRNAs is important to establish islet stress-specific signatures. However, such determinations are difficult to implement as miRNAs have diverse roles in different tissues in a context-dependent manner and thus are expressed in multiple tissues with differing expression patterns. For example, miR-375 is abundantly expressed in islets but is predominantly expressed in the pituitary gland. Although islets are important for glucose and energy homeostasis, coordinated actions of other organs including the brain, liver, adipose tissue, and muscle are central to regulation of whole-body metabolism. From our list of consistently up- or down-regulated miRNAs, we observed that miR-150-5p, identified in the circulation in non-diabetic individuals with autoantibodies, obesity, or T2D, was the only miRNA with predominant expression in the pancreas [109]. Nevertheless, irrespective of tissue source, miRNA signatures specific to early stages of diabetes are important for distinguishing diabetes-prone individuals from the healthy population. The functional significance of circulating miRNAs is unclear, with many reports suggesting roles in communication between different tissues. However, circulating miRNAs may also be a result of a specific pathological event in the course of disease. For example, reduced miR-126 in circulation in pre-DM and T2D signifies endothelial dysfunction (caused by hyperglycemia exposure) and correlates with subclinical and manifest peripheral artery disease [39]. Further investigations are needed to delineate functional roles of circulating miRNA signatures in diabetes.
3.6. Challenges in Establishing miRNA Biomarkers
Despite careful analysis of a number of studies, our literature review showed only a handful of consistent miRNA signatures. It is possible to miss important miRNA signatures because of technical differences in sample handling, miRNA measurement, and data analysis. As for differences in serum and plasma, the contribution of platelets to miRNA content should be addressed. Circulating miRNAs should ideally be cell free and reflect a true pathological state. Some of the studies reported here used sample pools for analyses which is not ideal for any analyses. Sample pools do not provide information on variability, with assumptions that all individuals in a cohort are identical in their disease state. Sample size is an important factor in determining true miRNA signatures for a particular disease state. We included studies with both small and large sample sizes in our analyses because it is important to establish consistency in miRNA signatures across independent centers. For example, miR-148a was elevated in a cohort of 16 newly diagnosed T1D patients (Seyhan et al., 2016) but this observation was also seen in large cohorts of 275 recent onset T1D patients (Nielsen et al., 2012). Thus including all studies in our analyses give us the opportunity to optimize and tailor future investigations to gaps in literature. In addition, in the studies we analyzed, normalization strategies varied from using endogenous miRNA controls to exogenous spike-in controls. While endogenous housekeeping controls are standard for gene expression analysis using qPCR, one needs to be careful before applying the same controls in measuring circulating miRNAs. For example, one of the studies used miR-191 as an endogenous control for normalization [43], but later studies confirmed that pre-DM and obesity may alter the circulating levels of miR-191 [37,64,78]. On the other hand, exogenous spike-in controls are used for handling technical differences in miRNA extraction and cDNA conversion. In addition, currently existing commercial kits recommend normalizing data to sample input (plasma or serum volume) rather than RNA concentration for cDNA input (as is the norm for qPCR). This is mainly because of difficulties in determining miRNA concentrations. Even though small RNA concentrations can be determined, miRNA fraction of the small RNAs may vary between samples. Such differences in small RNA input for cDNA conversion may introduce bias in the analysis. In our experience, we observed that in normal healthy conditions, the miRNA fraction of circulating small RNAs is lower and hence normalizing input for cDNA to sample volume may introduce bias in data analysis. Small RNA sequencing avoids this bias by normalizing the expression to number of reads instead of the sample input. However, this approach is not practical, as small RNA sequencing is too expensive to perform on a routine basis. Absolute quantification of miRNA concentrations using synthetic miRNA mimics can help overcome these problems. Absolute quantification will also help in comparing different data sets and in correlation analysis. To conclude, miRNA expression methodology should be standardized for possible clinical applications.
3.7. Future Directions and Conclusions
We have provided comprehensive information on the potential use of miRNA signatures selective for T1D, pre-DM, T2D, and GDM. Although islet-specific miRNAs are of special interest for identifying islet stress or damage, miRNA signatures not specific to islets may also be important in understanding the metabolic disarray involving multiple tissues in diabetes. Consistent miRNA signatures specific to different stages, identified especially in those studies involving non-diabetic individuals who developed pre-DM or T1D at follow-up, should be validated independently. In future studies, influences on circulating miRNA signatures by gender, age and other factors (other diseases, medications, lifestyle factors) should be investigated. These studies will help establish miRNA signatures that can be used clinically to predict diabetes in the general population. Further, amassing data samples, standardizing miRNA detection technologies, and tracking and validating correlations with disease states will improve their predictive and diagnostic efficacy for developing strategies of therapeutic intervention.
Supplementary Materials
The following are available online at https://0-www-mdpi-com.brum.beds.ac.uk/2073-4409/8/12/1533/s1. Table S1: miRNA associations with metabolic parameters in different diabetes types.
Author Contributions
S.V. and I.R. conducted the literature search and collected all pertinent research articles. S.V., K.K., and C.M.D. reviewed the literature and designed and formatted the tables and figures for clarity and intellectual content. S.V. wrote the manuscript and K.K., C.M.D., M.C.L., and B.N. contributed to writing, reviewing, and editing the manuscript.
Funding
We did not receive any funding for this review article.
Conflicts of Interest
The authors declare no conflict of interest.
References
- World Health Organization. Global Report on Diabetes; World Health Organization: Geneva, Switzerland, 2016; pp. 1–88. [Google Scholar]
- Chen, L.; Magliano, D.J.; Balkau, B.; Colagiuri, S.; Zimmet, P.Z.; Tonkin, A.M.; Mitchell, P.; Phillips, P.J.; Shaw, J.E. AUSDRISK: An Australian type 2 diabetes risk assessment tool based on demographic, lifestyle and simple anthropometric measures. Med. J. Aust. 2010, 192, 197–202. [Google Scholar] [CrossRef]
- Lindström, J.; Tuomilehto, J. The diabetes risk score: A practical tool to predict type 2 diabetes risk. Diabetes Care 2003, 26, 725–731. [Google Scholar] [CrossRef] [PubMed]
- Mohan, V.; Sandeep, S.; Deepa, M.; Gokulakrishnan, K.; Datta, M.; Deepa, R. A diabetes risk score helps identify metabolic syndrome and cardiovascular risk in Indians—The Chennai Urban Rural Epidemiology Study (CURES-38). Diabetes Obes. Metab. 2007, 9, 337–343. [Google Scholar] [CrossRef] [PubMed]
- Taplin, C.E.; Barker, J.M. Autoantibodies in type 1 diabetes. Autoimmunity 2008, 41, 11–18. [Google Scholar] [CrossRef] [PubMed]
- Winter, W.E.; Schatz, D.A. Autoimmune markers in diabetes. Clin. Chem. 2011, 57, 168–175. [Google Scholar] [CrossRef] [PubMed]
- Bigagli, E.; Lodovici, M. Circulating oxidative stress biomarkers in clinical studies on type 2 diabetes and its complications. Oxid. Med. Cell. Longev. 2019, 2019, 5953685. [Google Scholar] [CrossRef]
- Mazidi, M.; Kengne, A.P.; George, E.S.; Siervo, M. The association of red meat intake with inflammation and circulating intermediate biomarkers of type 2 diabetes is mediated by central adiposity. Br. J. Nutr. 2019, 22, 1–20. [Google Scholar] [CrossRef]
- Zhao, L.; Wang, M.; Li, J.; Bi, Y.; Li, M.; Yang, J. Association of circulating branched-chain amino acids with gestational diabetes mellitus: A meta-analysis. Int. J. Endocrinol. Metab. 2019, 17, e85413. [Google Scholar] [CrossRef]
- Rui, J.; Deng, S.; Lebastchi, J.; Clark, P.L.; Usmani-Brown, S.; Herold, K.C. Methylation of insulin DNA in response to proinflammatory cytokines during the progression of autoimmune diabetes in NOD mice. Diabetologia 2016, 59, 1021–1029. [Google Scholar] [CrossRef]
- Fisher, M.M.; Watkins, R.A.; Blum, J.; Evans-Molina, C.; Chalasani, N.; DiMeglio, L.A.; Mather, K.J.; Tersey, S.A.; Mirmira, R.G. Elevations in circulating methylated and unmethylated preproinsulin DNA in new-onset type 1 diabetes. Diabetes 2015, 64, 3867–3872. [Google Scholar] [CrossRef]
- Lebastchi, J.; Deng, S.; Lebastchi, A.H.; Beshar, I.; Gitelman, S.; Willi, S.; Gottlieb, P.; Akirav, E.M.; Bluestone, J.A.; Herold, K.C. Immune therapy and β-cell death in type 1 diabetes. Diabetes 2013, 62, 1676–1680. [Google Scholar] [CrossRef] [PubMed]
- Gala-Lopez, B.L.; Neiman, D.; Kin, T.; O’Gorman, D.; Pepper, A.R.; Malcolm, A.J.; Pianzin, S.; Senior, P.A.; Campbell, P.; Glaser, B.; et al. Beta cell death by cell-free DNA and outcome after clinical islet transplantation. Transplantation 2018, 102, 978–985. [Google Scholar] [CrossRef] [PubMed]
- Holeček, M. Branched-chain amino acids in health and disease: Metabolism, alterations in blood plasma, and as supplements. Nutr. Metab. (Lond.) 2018, 15, 33. [Google Scholar] [CrossRef] [PubMed]
- Beltrami, C.; Angelini, T.G.; Emanueli, C. Noncoding RNAs in diabetes vascular complications. J. Mol. Cell Cardiol. 2015, 89, 42–50. [Google Scholar] [CrossRef] [PubMed]
- Snowhite, I.V.; Allende, G.; Sosenko, J.; Pastori, R.L.; Messinger Cayetano, S.; Pugliese, A. Association of serum microRNAs with islet autoimmunity, disease progression and metabolic impairment in relatives at risk of type 1 diabetes. Diabetologia 2017, 60, 1409–1422. [Google Scholar] [CrossRef]
- Åkerman, L.; Casas, R.; Ludvigsson, J.; Tavira, B.; Skoglund, C. Serum miRNA levels are related to glucose homeostasis and islet autoantibodies in children with high risk for type 1 diabetes. PLoS ONE 2018, 13, e0191067. [Google Scholar] [CrossRef]
- Santos, A.S.; Cunha Neto, E.; Fukui, R.T.; Ferreira, L.R.P.; Silva, M.E.R. Increased expression of circulating microRNA 101-3p in type 1 diabetes patients: New insights into miRNA-regulated pathophysiological pathways for type 1 diabetes. Front. Immunol. 2019, 10, 1637. [Google Scholar] [CrossRef]
- Xu, G.; Thielen, L.A.; Chen, J.; Grayson, T.B.; Grimes, T.; Bridges, S.L., Jr.; Tse, H.M.; Smith, B.; Patel, R.; Li, P.; et al. Serum miR-204 is an early biomarker of type 1 diabetes-associated pancreatic beta-cell loss. Am. J. Physiol. Endocrinol. Metab. 2019, 317, E723–E730. [Google Scholar] [CrossRef]
- Nielsen, L.B.; Wang, C.; Sørensen, K.; Bang-Berthelsen, C.H.; Hansen, L.; Andersen, M.L.; Hougaard, P.; Juul, A.; Zhang, C.Y.; Pociot, F.; et al. Circulating levels of microRNA from children with newly diagnosed type 1 diabetes and healthy controls: Evidence that miR-25 associates to residual beta-cell function and glycaemic control during disease progression. Exp. Diabetes Res. 2012, 2012, 896362. [Google Scholar]
- Samandari, N.; Mirza, A.H.; Nielsen, L.B.; Kaur, S.; Hougaard, P.; Fredheim, S.; Mortensen, H.B.; Pociot, F. Circulating microRNA levels predict residual beta cell function and glycaemic control in children with type 1 diabetes mellitus. Diabetologia 2017, 60, 354–363. [Google Scholar] [CrossRef]
- Garcia-Contreras, M.; Shah, S.H.; Tamayo, A.; Robbins, P.D.; Golberg, R.B.; Mendez, A.J.; Ricordi, C. Plasma-derived exosome characterization reveals a distinct microRNA signature in long duration Type 1 diabetes. Sci. Rep. 2017, 7, 5998. [Google Scholar] [CrossRef] [PubMed]
- Liu, Y.; Ma, M.; Yu, J.; Ping, F.; Zhang, H.; Li, W.; Xu, L.; Li, Y. Decreased serum microRNA-21, microRNA-25, microRNA-146a, and microRNA-181a in autoimmune diabetes: Potential biomarkers for diagnosis and possible involvement in pathogenesis. Int. J. Endocrinol. 2019, 2019, 8406438. [Google Scholar] [CrossRef] [PubMed]
- Marchand, L.; Jalabert, A.; Meugnier, E.; Van den Hende, K.; Fabien, N.; Nicolino, M.; Madec, A.M.; Thivolet, C.; Rome, S. miRNA-375 a sensor of glucotoxicity is altered in the serum of children with newly diagnosed type 1 diabetes. J. Diabetes Res. 2016, 2016, 1869082. [Google Scholar] [CrossRef] [PubMed]
- Erener, S.; Marwaha, A.; Tan, R.; Panagiotopoulos, C.; Kieffer, T.J. Profiling of circulating microRNAs in children with recent onset of type 1 diabetes. JCI Insight 2017, 2, e89656. [Google Scholar] [CrossRef]
- Seyhan, A.A.; Nunez Lopez, Y.O.; Xie, H.; Yi, F.; Mathews, C.; Pasarica, M.; Pratley, R.E. Pancreas-enriched miRNAs are altered in the circulation of subjects with diabetes: A pilot cross-sectional study. Sci. Rep. 2016, 6, 31479. [Google Scholar] [CrossRef]
- Małachowska, B.; Wyka, K.; Nowicka, Z.; Bartłomiejczyk, M.A.; Młynarski, W.; Fendler, W. Temporal dynamics of serum let-7g expression mirror the decline of residual beta-cell function in longitudinal observation of children with type 1 diabetes. Pediatr. Diabetes 2018, 19, 1407–1415. [Google Scholar] [CrossRef]
- Liu, L.; Yan, J.; Xu, H.; Zhu, Y.; Liang, H.; Pan, W.; Yao, B.; Han, X.; Ye, J.; Weng, J. Two novel microRNA biomarkers related to β-cell damage and their potential values for early diagnosis of type 1 diabetes. J. Clin. Endocrinol. Metab. 2018, 103, 1320–1329. [Google Scholar] [CrossRef]
- Osipova, J.; Fischer, D.C.; Dangwal, S.; Volkmann, I.; Widera, C.; Schwarz, K.; Lorenzen, J.M.; Schreiver, C.; Jacoby, U.; Heimhalt, M.; et al. Diabetes-associated microRNAs in pediatric patients with type 1 diabetes mellitus: A cross-sectional cohort study. J. Clin. Endocrinol. Metab. 2014, 99, E1661–E1665. [Google Scholar] [CrossRef]
- Bacon, S.; Engelbrecht, B.; Schmid, J.; Pfeiffer, S.; Gallagher, R.; McCarthy, A.; Burke, M.; Concannon, C.; Prehn, J.H.; Byrne, M.M. MicroRNA-224 is readily detectable in urine of individuals with diabetes mellitus and is a potential indicator of beta-cell demise. Genes (Basel) 2015, 6, 399–416. [Google Scholar] [CrossRef]
- Assmann, T.S.; Recamonde-Mendoza, M.; Puñales, M.; Tschiedel, B.; Canani, L.H.; Crispim, D. MicroRNA expression profile in plasma from type 1 diabetic patients: Case-control study and bioinformatic analysis. Diabetes Res. Clin. Pract. 2018, 141, 35–46. [Google Scholar] [CrossRef]
- Grieco, G.E.; Cataldo, D.; Ceccarelli, E.; Nigi, L.; Catalano, G.; Brusco, N.; Mancarella, F.; Ventriglia, G.; Fondelli, C.; Guarino, E.; et al. Serum levels of miR-148a and miR-21-5p are increased in type 1 diabetic patients and correlated with markers of bone strength and metabolism. Noncoding RNA 2018, 4, E37. [Google Scholar] [CrossRef] [PubMed]
- Kong, Q.; Guo, X.; Guo, Z.; Su, T. Urinary exosome miR-424 and miR-218 as biomarkers for type 1 diabetes in children. Clin. Lab. 2019, 65. [Google Scholar] [CrossRef] [PubMed]
- Yu, K.; Huang, Z.; Zhou, J.; Lang, J.; Wang, Y.; Yin, X.; Zhou, Y.; Zhao, D. Transcriptome profiling of microRNAs associated with latent autoimmune diabetes in adults (LADA). Sci. Rep. 2019, 9, 11347. [Google Scholar] [CrossRef] [PubMed] [Green Version]
- Saravanan, P.B.; Vasu, S.; Yoshimatsu, G.; Darden, C.M.; Wang, X.; Gu, J.; Lawrence, M.C.; Naziruddin, B. Differential expression and release of exosomal miRNAs by human islets under inflammatory and hypoxic stress. Diabetologia 2019, 62, 1901–1914. [Google Scholar] [CrossRef] [PubMed]
- Prats-Puig, A.; Ortega, F.J.; Mercader, J.M.; Moreno-Navarrete, J.M.; Moreno, M.; Bonet, N.; Ricart, W.; López-Bermejo, A.; Fernández-Real, J.M. Changes in circulating microRNAs are associated with childhood obesity. J. Clin. Endocrinol. Metab. 2013, 98, E1655–E1660. [Google Scholar] [CrossRef]
- Flowers, E.; Gadgil, M.; Aouizerat, B.E.; Kanaya, A.M. Circulating microRNAs associated with glycemic impairment and progression in Asian Indians. Biomark. Res. 2015, 3, 22. [Google Scholar] [CrossRef] [Green Version]
- Flowers, E.; Aouizerat, B.E.; Abbasi, F.; Lamendola, C.; Grove, K.M.; Fukuoka, Y.; Reaven, G.M. Circulating microRNA-320a and microRNA-486 predict thiazolidinedione response: Moving towards precision health for diabetes prevention. Metabolism 2015, 64, 1051–1059. [Google Scholar] [CrossRef] [Green Version]
- Zampetaki, A.; Kiechl, S.; Drozdov, I.; Willeit, P.; Mayr, U.; Prokopi, M.; Mayr, A.; Weger, S.; Oberhollenzer, F.; Bonora, E.; et al. Plasma microRNA profiling reveals loss of endothelial miR-126 and other microRNAs in type 2 diabetes. Circ. Res. 2010, 107, 810–817. [Google Scholar] [CrossRef]
- Zhang, T.; Li, L.; Shang, Q.; Lv, C.; Wang, C.; Su, B. Circulating miR-126 is a potential biomarker to predict the onset of type 2 diabetes mellitus in susceptible individuals. Biochem. Biophys. Res. Commun. 2015, 463, 60–63. [Google Scholar] [CrossRef]
- Belongie, K.J.; Ferrannini, E.; Johnson, K.; Andrade-Gordon, P.; Hansen, M.K.; Petrie, J.R. Identification of novel biomarkers to monitor β-cell function and enable early detection of type 2 diabetes risk. PLoS ONE 2017, 12, e0182932. [Google Scholar] [CrossRef]
- Willeit, P.; Skroblin, P.; Moschen, A.R.; Yin, X.; Kaudewitz, D.; Zampetaki, A.; Barwari, T.; Whitehead, M.; Ramírez, C.M.; Goedeke, L.; et al. Circulating microRNA-122 is associated with the risk of new-onset metabolic syndrome and type 2 diabetes. Diabetes 2017, 66, 347–357. [Google Scholar] [CrossRef] [PubMed] [Green Version]
- Pescador, N.; Pérez-Barba, M.; Ibarra, J.M.; Corbatón, A.; Martínez-Larrad, M.T.; Serrano-Ríos, M. Serum circulating microRNA profiling for identification of potential type 2 diabetes and obesity biomarkers. PLoS ONE 2013, 8, e77251. [Google Scholar] [CrossRef] [PubMed] [Green Version]
- Wang, Y.C.; Li, Y.; Wang, X.Y.; Zhang, D.; Zhang, H.; Wu, Q.; He, Y.Q.; Wang, J.Y.; Zhang, L.; Xia, H.; et al. Circulating miR-130b mediates metabolic crosstalk between fat and muscle in overweight/obesity. Diabetologia 2013, 56, 2275–2285. [Google Scholar] [CrossRef] [PubMed]
- Wang, Y.T.; Tsai, P.C.; Liao, Y.C.; Hsu, C.Y.; Juo, S.H. Circulating microRNAs have a sex-specific association with metabolic syndrome. J. Biomed. Sci. 2013, 20, 72. [Google Scholar] [CrossRef] [PubMed] [Green Version]
- Zhang, T.; Lv, C.; Li, L.; Chen, S.; Liu, S.; Wang, C.; Su, B. Plasma miR-126 is a potential biomarker for early prediction of type 2 diabetes mellitus in susceptible individuals. BioMed Res. Int. 2013, 2013, 761617. [Google Scholar] [CrossRef] [PubMed]
- Liu, Y.; Gao, G.; Yang, C.; Zhou, K.; Shen, B.; Liang, H.; Jiang, X. The role of circulating microRNA-126 (miR-126): A novel biomarker for screening prediabetes and newly diagnosed type 2 diabetes mellitus. Int. J. Mol. Sci. 2014, 15, 10567–10577. [Google Scholar] [CrossRef] [PubMed] [Green Version]
- Yang, Z.; Chen, H.; Si, H.; Li, X.; Ding, X.; Sheng, Q.; Chen, P.; Zhang, H. Serum miR-23a, a potential biomarker for diagnosis of pre-diabetes and type 2 diabetes. Acta Diabetol. 2014, 51, 823–831. [Google Scholar] [CrossRef]
- Can, U.; Buyukinan, M.; Yerlikaya, F.H. The investigation of circulating microRNAs associated with lipid metabolism in childhood obesity. Pediatr. Obes. 2016, 11, 228–234. [Google Scholar] [CrossRef]
- Prabu, P.; Rome, S.; Sathishkumar, C.; Aravind, S.; Mahalingam, B.; Shanthirani, C.S.; Gastebois, C.; Villard, A.; Mohan, V.; Balasubramanyam, M. Circulating miRNAs of ‘Asian Indian phenotype’ identified in subjects with impaired glucose tolerance and patients with type 2 diabetes. PLoS ONE 2015, 10, e0128372. [Google Scholar] [CrossRef] [Green Version]
- Párrizas, M.; Brugnara, L.; Esteban, Y.; González-Franquesa, A.; Canivell, S.; Murillo, S.; Gordillo-Bastidas, E.; Cussó, R.; Cadefau, J.A.; García-Roves, P.M.; et al. Circulating miR-192 and miR-193b are markers of prediabetes and are modulated by an exercise intervention. J. Clin. Endocrinol. Metab. 2015, 100, E407–E415. [Google Scholar] [CrossRef] [Green Version]
- Wu, L.; Dai, X.; Zhan, J.; Zhang, Y.; Zhang, H.; Zhang, H.; Zeng, S.; Xi, W. Profiling peripheral microRNAs in obesity and type 2 diabetes mellitus. APMIS 2015, 123, 580–585. [Google Scholar] [CrossRef] [PubMed]
- Iacomino, G.; Russo, P.; Stillitano, I.; Lauria, F.; Marena, P.; Ahrens, W.; De Luca, P.; Siani, A. Circulating microRNAs are deregulated in overweight/obese children: Preliminary results of the I.Family study. Genes Nutr. 2016, 11, 7. [Google Scholar] [CrossRef] [PubMed] [Green Version]
- Nunez Lopez, Y.O.; Garufi, G.; Seyhan, A.A. Altered levels of circulating cytokines and microRNAs in lean and obese individuals with prediabetes and type 2 diabetes. Mol. Biosyst. 2016, 13, 106–121. [Google Scholar] [CrossRef] [PubMed]
- Parr, E.B.; Camera, D.M.; Burke, L.M.; Phillips, S.M.; Coffey, V.G.; Hawley, J.A. Circulating microRNA responses between ‘high’ and ‘low’ responders to a 16-wk diet and exercise weight loss intervention. PLoS ONE 2016, 11, e0152545. [Google Scholar] [CrossRef] [PubMed]
- Rezk, N.A.; Sabbah, N.A.; Saad, M.S. Role of microRNA 126 in screening, diagnosis, and prognosis of diabetic patients in Egypt. IUBMB Life 2016, 68, 452–458. [Google Scholar] [CrossRef] [Green Version]
- Yan, S.; Wang, T.; Huang, S.; Di, Y.; Huang, Y.; Liu, X.; Luo, Z.; Han, W.; An, B. Differential expression of microRNAs in plasma of patients with prediabetes and newly diagnosed type 2 diabetes. Acta Diabetol. 2016, 53, 693–702. [Google Scholar] [CrossRef]
- de Candia, P.; Spinetti, G.; Specchia, C.; Sangalli, E.; La Sala, L.; Uccellatore, A.; Lupini, S.; Genovese, S.; Matarese, G.; Ceriello, A. A unique plasma microRNA profile defines type 2 diabetes progression. PLoS ONE 2017, 12, e0188980. [Google Scholar] [CrossRef] [Green Version]
- Flowers, E.; Kanaya, A.M.; Fukuoka, Y.; Allen, I.E.; Cooper, B.; Aouizerat, B.E. Preliminary evidence supports circulating microRNAs as prognostic biomarkers for type 2 diabetes. Obes. Sci. Pract. 2017, 3, 446–452. [Google Scholar] [CrossRef] [Green Version]
- Giannella, A.; Radu, C.M.; Franco, L.; Campello, E.; Simioni, P.; Avogaro, A.; de Kreutzenberg, S.V.; Ceolotto, G. Circulating levels and characterization of microparticles in patients with different degrees of glucose tolerance. Cardiovasc. Diabetol. 2017, 16, 118. [Google Scholar] [CrossRef]
- Goguet-Rubio, P.; Klug, R.L.; Sharma, D.L.; Srikanthan, K.; Puri, N.; Lakhani, V.H.; Nichols, A.; O’Hanlon, K.M.; Abraham, N.G.; Shapiro, J.I.; et al. Existence of a strong correlation of biomarkers and miRNA in females with metabolic syndrome and obesity in a population of West Virginia. Int. J. Med. Sci. 2017, 14, 543–553. [Google Scholar] [CrossRef] [Green Version]
- Jones, A.; Danielson, K.M.; Benton, M.C.; Ziegler, O.; Shah, R.; Stubbs, R.S.; Das, S.; Macartney-Coxson, D. miRNA signatures of insulin resistance in obesity. Obesity (Silver Spring) 2017, 25, 1734–1744. [Google Scholar] [CrossRef] [PubMed] [Green Version]
- Nunez Lopez, Y.O.; Pittas, A.G.; Pratley, R.E.; Seyhan, A.A. Circulating levels of miR-7, miR-152 and miR-192 respond to vitamin D supplementation in adults with prediabetes and correlate with improvements in glycemic control. J. Nutr. Biochem. 2017, 49, 117–122. [Google Scholar] [CrossRef] [PubMed]
- Thompson, M.D.; Cismowski, M.J.; Serpico, M.; Pusateri, A.; Brigstock, D.R. Elevation of circulating microRNA levels in obese children compared to healthy controls. Clin. Obes. 2017, 7, 216–221. [Google Scholar] [CrossRef] [PubMed]
- Alkandari, A.; Ashrafian, H.; Sathyapalan, T.; Sedman, P.; Darzi, A.; Holmes, E.; Athanasiou, T.; Atkin, S.L.; Gooderham, N.J. Improved physiology and metabolic flux after Roux-en-Y gastric bypass is associated with temporal changes in the circulating microRNAome: A longitudinal study in humans. BMC Obes. 2018, 5, 20. [Google Scholar] [CrossRef] [Green Version]
- Bao, F.; Slusher, A.L.; Whitehurst, M.; Huang, C.J. Circulating microRNAs are upregulated following acute aerobic exercise in obese individuals. Physiol. Behav. 2018, 197, 15–21. [Google Scholar] [CrossRef]
- Cui, X.; You, L.; Zhu, L.; Wang, X.; Zhou, Y.; Li, Y.; Wen, J.; Xia, Y.; Wang, X.; Ji, C.; et al. Change in circulating microRNA profile of obese children indicates future risk of adult diabetes. Metabolism 2018, 78, 95–105. [Google Scholar] [CrossRef] [Green Version]
- Ghorbani, S.; Mahdavi, R.; Alipoor, B.; Panahi, G.; Nasli Esfahani, E.; Razi, F.; Taghikhani, M.; Meshkani, R. Decreased serum microRNA-21 level is associated with obesity in healthy and type 2 diabetic subjects. Arch. Physiol. Biochem. 2018, 124, 300–305. [Google Scholar] [CrossRef]
- Jiménez-Lucena, R.; Camargo, A.; Alcalá-Diaz, J.F.; Romero-Baldonado, C.; Luque, R.M.; van Ommen, B.; Delgado-Lista, J.; Ordovás, J.M.; Pérez-Martínez, P.; Rangel-Zúñiga, O.A.; et al. A plasma circulating miRNAs profile predicts type 2 diabetes mellitus and prediabetes: From the CORDIOPREV study. Exp. Mol. Med. 2018, 50, 168. [Google Scholar] [CrossRef] [Green Version]
- Liang, Y.Z.; Dong, J.; Zhang, J.; Wang, S.; He, Y.; Yan, Y.X. Identification of neuroendocrine stress response-related circulating microRNAs as biomarkers for type 2 diabetes mellitus and insulin resistance. Front. Endocrinol. (Lausanne) 2018, 9, 132. [Google Scholar] [CrossRef]
- O’Neill, S.; Larsen, M.B.; Gregersen, S.; Hermansen, K.; O’Driscoll, L. miR-758-3p: A blood-based biomarker that’s influence on the expression of CERP/ABCA1 may contribute to the progression of obesity to metabolic syndrome. Oncotarget 2018, 9, 9379–9390. [Google Scholar] [CrossRef] [Green Version]
- Russo, A.; Bartolini, D.; Mensà, E.; Torquato, P.; Albertini, M.C.; Olivieri, F.; Testa, R.; Rossi, S.; Piroddi, M.; Cruciani, G.; et al. Physical activity modulates the overexpression of the inflammatory miR-146a-5p in obese patients. IUBMB Life 2018, 70, 1012–1022. [Google Scholar] [CrossRef] [PubMed] [Green Version]
- Al-Rawaf, H.A. Circulating microRNAs and adipokines as markers of metabolic syndrome in adolescents with obesity. Clin. Nutr. 2019, 38, 2231–2238. [Google Scholar] [CrossRef] [PubMed]
- Bae, Y.U.; Kim, Y.; Lee, H.; Kim, H.; Jeon, J.S.; Noh, H.; Han, D.C.; Ryu, S.; Kwon, S.H. Bariatric surgery alters microRNA content of circulating exosomes in patients with obesity. Obesity (Silver Spring) 2019, 27, 264–271. [Google Scholar] [CrossRef] [PubMed] [Green Version]
- Cereijo, R.; Taxerås, S.D.; Piquer-Garcia, I.; Pellitero, S.; Martínez, E.; Tarascó, J.; Moreno, P.; Balibrea, J.; Puig-Domingo, M.; Jiménez-Pavón, D.; et al. Elevated levels of circulating miR-92a are associated with impaired glucose homeostasis in patients with obesity and correlate with metabolic status after bariatric surgery. Obes. Surg. 2019. [Google Scholar] [CrossRef] [PubMed]
- Choi, H.; Koh, H.W.L.; Zhou, L.; Cheng, H.; Loh, T.P.; Parvaresh Rizi, E.; Toh, S.A.; Ronnett, G.V.; Huang, B.E.; Khoo, C.M. Plasma protein and microRNA biomarkers of insulin resistance: A network-based integrative -omics analysis. Front. Physiol. 2019, 10, 379. [Google Scholar] [CrossRef] [Green Version]
- Ghai, V.; Baxter, D.; Wu, X.; Kim, T.K.; Kuusisto, J.; Laakso, M.; Connolly, T.; Li, Y.; Andrade-Gordon, P.; Wang, K. Circulating RNAs as predictive markers for the progression of type 2 diabetes. J. Cell. Mol. Med. 2019, 23, 2753–2768. [Google Scholar] [CrossRef] [Green Version]
- Iacomino, G.; Russo, P.; Marena, P.; Lauria, F.; Venezia, A.; Ahrens, W.; De Henauw, S.; De Luca, P.; Foraita, R.; Günther, K.; et al. Circulating microRNAs are associated with early childhood obesity: Results of the I.Family Study. Genes Nutr. 2019, 14, 2. [Google Scholar] [CrossRef] [Green Version]
- La Sala, L.; Mrakic-Sposta, S.; Tagliabue, E.; Prattichizzo, F.; Micheloni, S.; Sangalli, E.; Specchia, C.; Uccellatore, A.C.; Lupini, S.; Spinetti, G.; et al. Circulating microRNA-21 is an early predictor of ROS-mediated damage in subjects with high risk of developing diabetes and in drug-naïve T2D. Cardiovasc. Diabetol. 2019, 18, 18. [Google Scholar] [CrossRef] [Green Version]
- Luo, M.; Xu, C.; Luo, Y.; Wang, G.; Wu, J.; Wan, Q. Circulating miR-103 family as potential biomarkers for type 2 diabetes through targeting CAV-1 and SFRP4. Acta Diabetol. 2019. [Google Scholar] [CrossRef]
- Caporali, A.; Meloni, M.; Völlenkle, C.; Bonci, D.; Sala-Newby, G.B.; Addis, R.; Spinetti, G.; Losa, S.; Masson, R.; Baker, A.H.; et al. Deregulation of microRNA-503 contributes to diabetes mellitus-induced impairment of endothelial function and reparative angiogenesis after limb ischemia. Circulation 2011, 123, 282–291. [Google Scholar] [CrossRef] [Green Version]
- Kong, L.; Zhu, J.; Han, W.; Jiang, X.; Xu, M.; Zhao, Y.; Dong, Q.; Pang, Z.; Guan, Q.; Gao, L.; et al. Significance of serum microRNAs in pre-diabetes and newly diagnosed type 2 diabetes: A clinical study. Acta Diabetol. 2011, 48, 61–69. [Google Scholar] [CrossRef] [PubMed]
- Sun, K.; Chang, X.; Yin, L.; Li, J.; Zhou, T.; Zhang, C.; Chen, X. Expression and DNA methylation status of microRNA-375 in patients with type 2 diabetes mellitus. Mol. Med. Rep. 2014, 9, 967–972. [Google Scholar] [CrossRef] [PubMed] [Green Version]
- Baldeón, R.L.; Weigelt, K.; de Wit, H.; Ozcan, B.; van Oudenaren, A.; Sempértegui, F.; Sijbrands, E.; Grosse, L.; Freire, W.; Drexhage, H.A.; et al. Decreased serum level of miR-146a as sign of chronic inflammation in type 2 diabetic patients. PLoS ONE 2014, 9, e115209. [Google Scholar] [CrossRef] [PubMed] [Green Version]
- Yan, S.T.; Li, C.L.; Tian, H.; Li, J.; Pei, Y.; Liu, Y.; Gong, Y.P.; Fang, F.S.; Sun, B.R. MiR-199a is overexpressed in plasma of type 2 diabetes patients which contributes to type 2 diabetes by targeting GLUT4. Mol. Cell. Biochem. 2014, 397, 45–51. [Google Scholar] [CrossRef] [PubMed]
- Wang, X.; Sundquist, J.; Zöller, B.; Memon, A.A.; Palmér, K.; Sundquist, K.; Bennet, L. Determination of 14 circulating microRNAs in Swedes and Iraqis with and without diabetes mellitus type 2. PLoS ONE 2014, 9, e86792. [Google Scholar] [CrossRef] [PubMed]
- Wang, X.; Chang, X.; Li, J.; Yin, L.; Sun, K. DNA methylation of microRNA-375 in impaired glucose tolerance. Exp. Ther. Med. 2014, 8, 775–780. [Google Scholar] [CrossRef] [Green Version]
- Higuchi, C.; Nakatsuka, A.; Eguchi, J.; Teshigawara, S.; Kanzaki, M.; Katayama, A.; Yamaguchi, S.; Takahashi, N.; Murakami, K.; Ogawa, D.; et al. Identification of circulating miR-101, miR-375 and miR-802 as biomarkers for type 2 diabetes. Metabolism 2015, 64, 489–497. [Google Scholar] [CrossRef] [Green Version]
- Yang, Z.M.; Chen, L.H.; Hong, M.; Chen, Y.Y.; Yang, X.R.; Tang, S.M.; Yuan, Q.F.; Chen, W.W. Serum microRNA profiling and bioinformatics analysis of patients with type 2 diabetes mellitus in a Chinese population. Mol. Med. Rep. 2017, 15, 2143–2153. [Google Scholar] [CrossRef] [Green Version]
- Wan, S.; Wang, J.; Wang, J.; Wu, J.; Song, J.; Zhang, C.Y.; Zhang, C.; Wang, C.; Wang, J.J. Increased serum miR-7 is a promising biomarker for type 2 diabetes mellitus and its microvascular complications. Diabetes Res. Clin. Pract. 2017, 130, 171–179. [Google Scholar] [CrossRef]
- Sucharita, S.; Ashwini, V.; Prabhu, J.S.; Avadhany, S.T.; Ayyar, V.; Bantwal, G. The role of circulating microRNA in the regulation of beta cell function and insulin resistance among Indians with type 2 diabetes. Indian J. Endocrinol. Metab. 2018, 22, 770–773. [Google Scholar] [CrossRef]
- Yu, X.; Zhong, L. Pioglitazone/microRNA‑141/FOXA2: A novel axis in pancreatic β‑cells proliferation and insulin secretion. Mol. Med. Rep. 2018, 17, 7931–7938. [Google Scholar] [CrossRef] [PubMed] [Green Version]
- Atkin, S.L.; Ramachandran, V.; Yousri, N.A.; Benurwar, M.; Simper, S.C.; McKinlay, R.; Adams, T.D.; Najafi-Shoushtari, S.H.; Hunt, S.C. Changes in blood microRNA expression and early metabolic responsiveness 21 days following bariatric surgery. Front. Endocrinol. (Lausanne) 2019, 9, 773. [Google Scholar] [CrossRef] [PubMed]
- Meerson, A.; Eliraz, Y.; Yehuda, H.; Knight, B.; Crundwell, M.; Ferguson, D.; Lee, B.P.; Harries, L.W. Obesity impacts the regulation of miR-10b and its targets in primary breast tumors. BMC Cancer 2019, 19, 86. [Google Scholar] [CrossRef] [PubMed]
- Mononen, N.; Lyytikäinen, L.P.; Seppälä, I.; Mishra, P.P.; Juonala, M.; Waldenberger, M.; Klopp, N.; Illig, T.; Leiviskä, J.; Loo, B.M.; et al. Whole blood microRNA levels associate with glycemic status and correlate with target mRNAs in pathways important to type 2 diabetes. Sci. Rep. 2019, 9, 8887. [Google Scholar] [CrossRef]
- Butler, A.E.; Cao-Minh, L.; Galasso, R.; Rizza, R.A.; Corradin, A.; Cobelli, C.; Butler, P.C. Adaptive changes in pancreatic beta cell fractional area and beta cell turnover in human pregnancy. Diabetologia 2010, 53, 2167–2176. [Google Scholar] [CrossRef] [Green Version]
- Zhao, C.; Dong, J.; Jiang, T.; Shi, Z.; Yu, B.; Zhu, Y.; Chen, D.; Xu, J.; Huo, R.; Dai, J.; et al. Early second-trimester serum miRNA profiling predicts gestational diabetes mellitus. PLoS ONE 2011, 6, e23925. [Google Scholar] [CrossRef]
- Carreras-Badosa, G.; Bonmatí, A.; Ortega, F.J.; Mercader, J.M.; Guindo-Martínez, M.; Torrents, D.; Prats-Puig, A.; Martinez-Calcerrada, J.M.; Platero-Gutierrez, E.; De Zegher, F.; et al. Altered circulating miRNA expression profile in pregestational and gestational obesity. J. Clin. Endocrinol. Metab. 2015, 100, E1446–E1456. [Google Scholar] [CrossRef] [Green Version]
- Zhu, Y.; Tian, F.; Li, H.; Zhou, Y.; Lu, J.; Ge, Q. Profiling maternal plasma microRNA expression in early pregnancy to predict gestational diabetes mellitus. Int. J. Gynaecol. Obstet. 2015, 130, 49–53. [Google Scholar] [CrossRef]
- Cao, Y.L.; Jia, Y.J.; Xing, B.H.; Shi, D.D.; Dong, X.J. Plasma microRNA-16-5p, -17-5p and -20a-5p: Novel diagnostic biomarkers for gestational diabetes mellitus. J. Obstet. Gynaecol. Res. 2017, 43, 974–981. [Google Scholar] [CrossRef]
- Wander, P.L.; Boyko, E.J.; Hevner, K.; Parikh, V.J.; Tadesse, M.G.; Sorensen, T.K.; Williams, M.A.; Enquobahrie, D.A. Circulating early- and mid-pregnancy microRNAs and risk of gestational diabetes. Diabetes Res. Clin. Pract. 2017, 132, 1–9. [Google Scholar] [CrossRef]
- Sebastiani, G.; Guarino, E.; Grieco, G.E.; Formichi, C.; Delli Poggi, C.; Ceccarelli, E.; Dotta, F. Circulating microRNA (miRNA) expression profiling in plasma of patients with gestational diabetes mellitus reveals upregulation of miRNA miR-330-3p. Front. Endocrinol. (Lausanne) 2017, 8, 345. [Google Scholar] [CrossRef] [PubMed] [Green Version]
- Lamadrid-Romero, M.; Solís, K.H.; Cruz-Reséndiz, M.S.; Pérez, J.E.; Díaz, N.F.; Flores-Herrera, H.; García-López, G.; Perichart, O.; Reyes-Muñoz, E.; Arenas-Huertero, F.; et al. Central nervous system development-related microRNAs levels increase in the serum of gestational diabetic women during the first trimester of pregnancy. Neurosci. Res. 2018, 130, 8–22. [Google Scholar] [CrossRef] [PubMed]
- Nair, S.; Jayabalan, N.; Guanzon, D.; Palma, C.; Scholz-Romero, K.; Elfeky, O.; Zuñiga, F.; Ormazabal, V.; Diaz, E.; Rice, G.E.; et al. Human placental exosomes in gestational diabetes mellitus carry a specific set of miRNAs associated with skeletal muscle insulin sensitivity. Clin. Sci. (Lond.) 2018, 132, 2451–2467. [Google Scholar] [CrossRef] [PubMed]
- Pheiffer, C.; Dias, S.; Rheeder, P.; Adam, S. Decreased expression of circulating miR-20a-5p in South African women with gestational diabetes mellitus. Mol. Diagn. Ther. 2018, 22, 345–352. [Google Scholar] [CrossRef] [PubMed]
- Tagoma, A.; Alnek, K.; Kirss, A.; Uibo, R.; Haller-Kikkatalo, K. MicroRNA profiling of second trimester maternal plasma shows upregulation of miR-195-5p in patients with gestational diabetes. Gene 2018, 672, 137–142. [Google Scholar] [CrossRef]
- Gillet, V.; Ouellet, A.; Stepanov, Y.; Rodosthenous, R.S.; Croft, E.K.; Brennan, K.; Abdelouahab, N.; Baccarelli, A.; Takser, L. miRNA Profiles in extracellular vesicles from serum early in pregnancies complicated by gestational diabetes mellitus. J. Clin. Endocrinol. Metab. 2019, 104, 5157–5169. [Google Scholar] [CrossRef]
- Yoffe, L.; Polsky, A.; Gilam, A.; Raff, C.; Mecacci, F.; Ognibene, A.; Crispi, F.; Gratacós, E.; Kanety, H.; Mazaki-Tovi, S.; et al. Early diagnosis of gestational diabetes mellitus using circulating microRNAs. Eur. J. Endocrinol. 2019, 181, 565–577. [Google Scholar] [CrossRef]
- Ludwig, N.; Leidinger, P.; Becker, K.; Backes, C.; Fehlmann, T.; Pallasch, C.; Rheinheimer, S.; Meder, B.; Stähler, C.; Meese, E.; et al. Distribution of miRNA expression across human tissues. Nucleic Acids Res. 2016, 44, 3865–3877. [Google Scholar] [CrossRef]
Figure 1.
Circulating miRNA profiles at different stages of type 1 diabetes (T1D) pathophysiology. Changes in autoimmunity, beta-cell mass/death, blood glucose, and islet compensation over the course of T1D pathophysiology are provided as line profiles. Circulating miRNA profiles consistent in at least two studies are provided for T1D (<1 and >1 year). All miRNAs identified in autoantibody-positive non-diabetic children before onset of T1D are provided. Upregulated miRNAs are shown as brown; downregulated miRNAs, green; and upregulated or downregulated, blue.

Figure 2.
Circulating miRNA profile at different stages of type 2 diabetes (T2D) pathophysiology. Changes in autoimmunity, beta-cell mass, blood glucose, and islet compensation over the course of T2D pathophysiology are provided as line profiles. Circulating miRNA profiles identified and consistent in at least 2 clinical studies are provided. All identified miRNAs are provided for non-diabetic (ND) to pre-DM stage. Upregulated miRNAs are shown in red; downregulated miRNAs, green; and upregulated or downregulated in at least 2 studies, blue. DM indicates diabetes mellitus; IFG, impaired fasting glucose; IGT, impaired glucose tolerance; ND, non-diabetic; PP, postprandial; T2D, type 2 diabetes.

Figure 3.
Circulating miRNA profile at different stages of gestational diabetes. Changes in blood glucose, insulin resistance, and islet compensation over the course of normal pregnancy/lactation and gestational diabetes mellitus (GDM) pathophysiology are provided as line profiles. Circulating miRNA profiles identified and consistent in at least 2 clinical studies are provided. Upregulated miRNAs are shown in red; downregulated miRNAs, in green; upregulated or downregulated in at least 2 studies, in blue.

Figure 4.
Common miRNA signatures. Venn diagrams indicate common miRNA signatures between different stages/types of diabetes. For expression of these miRNAs in specific disease states, refer to Figure 1, Figure 2 and Figure 3 and Table 1, Table 2, Table 3 and Table 4.


Table 1.
miRNAs differentially expressed in patients with or at risk of type 1 diabetes (T1D).
| miRNAs | +/− | Sample | Patient Classifications | Ethnicity | Method | Cohort Size * | Refs |
|---|---|---|---|---|---|---|---|
| Type 1 diabetes (recent onset) | |||||||
| miR-152, miR-30a-5p, miR-181a, miR-24, miR-148a, miR-210, miR-27a, miR-29a, miR-26a, miR-27b, miR-25, miR-200a | +++ | Serum | Recent-onset T1D | Hvidoere cohort | Small RNA seq, qPCR | P-275 C-151 | [20] |
| miR-30a-5p, miR-181a, miR-26a, miR-25 | +++ | Serum | Recent-onset T1D | Danish remission cohort | Small RNA seq, qPCR | P-129 C-151 | [20] |
| miR-375 | −−− | Serum | Newly diagnosed T1D | Not available | qPCR | P-22 C-10 | [24] |
| miR-454-3p, miR-222-3p, miR-144-5p, miR-345-5p, miR-125a-3p, miR-24-3p, miR-502-3p, miR-25-3p, miR-500a-5p, miR-324-5p, miR-140-5p, miR-192-5p, miR-331-3p, miR-377-3p, miR-221-3p, miR-182-5p, miR-103a-2-5p, miR-183-5p, let-7e-5p, miR-30e-5p, let-7g-5p, miR-18a-5p, miR-324-3p, miR-1468, miR-214-5p, miR-23b-3p, miR-93-5p | +++ | Serum | Recent-onset T1D (<42 d) | Not available | qPCR | P-29 C-32 | [25] |
| miR-375 | NC | Serum | Recent-onset T1D (<42 d) | Not available | qPCR | P-29 C-32 | [25] |
| miR-720, miR-636, miR-630, miR-490-5p, miR-154-3p, miR-675-3p, miR-100-5p, miR-639 | −−− | Serum | Recent-onset T1D (<42 d) | Not available | qPCR | P-29 C-32 | [25] |
| hsa-miR-24-3p, hsa-miR-146a-5p, hsa-miR-194-5p, hsa-miR-197-3p, hsa-miR-301a-3p, hsa-miR-375 | NA | Plasma | Newly diagnosed T1D; measured at diagnosis predicts C-peptide 6-12 mo after diagnosis | Danish remission phase cohort | qPCR | P-123 No controls; follow-up study | [21] |
| miR-197-3p | NA | Plasma | Newly diagnosed T1D; measured 3 months after diagnosis predicted C-peptide at 12 mo | Danish remission phase cohort | qPCR | P-123 No controls; follow-up study | [21] |
| miR-122-5p, miR-125b-5p, miR-136-5p, miR-34a-5p, miR-342-3p, miR-152, miR-320b, miR-28-5p, miR-151a-3p, miR-181a-5p, miR-151a-5p, miR-423-5p, miR-199a-3p, miR-126-3p, miR-652-3p, miR-148b-3p, miR-27b-3p | +++ | Serum | Recent-onset T1D | Not available | qPCR | P-8 C-17 | [17] |
| miR-107, miR-22-3p, miR-590-5p, let-7g-5p, miR-24-3p, miR-32-5p, miR-22-5p, miR-16-2-3p, miR-93-5p, miR-25-3p, miR-140-3p, miR-19a-3p, miR-19b-3p, miR-16-5p, miR-30e-5p, miR-363-3p, miR-222-3p, miR-144-3p, miR-140-5p, miR-144-5p | −−− | Serum | Recent-onset T1D | Not available | qPCR | P-8 C-17 | [17] |
| let-7g-5p, miR-24-3p | −−− | Serum | T1D | Not available | qPCR | P-10 C-10 | [27] |
| miR-1225-5p, miR-320c | +++ | Serum | Recent-onset T1D; duration <1 y | Not available | Microarray, qPCR | P-73 C-85 | [28] |
| Type 1 diabetes (>1 y), LADA, MODY | |||||||
| miR-21, miR-210 | +++ | Plasma, urine | Pediatric T1D; duration >1 y | Not available | qPCR | P-68 C-79 | [29] |
| miR-126 | +++ | Urine | Pediatric T1D; duration >1 y | Not available | qPCR | P-68 C-79 | [29] |
| miR-224 | +++ | Urine | HNF1A carriers (MODY), T1D | Not available | qPCR | P-38, 44 C-26 | [30] |
| miR-148a, miR-21, miR-375 | +++ | Plasma | T1D, diagnosed before age 30 y | Not available | qPCR | P-16 C-27 | [26] |
| miR-16, miR-302d-3p, miR-378e, miR-570–3p, miR-574-5p, miR-579 | −−− | Plasma exosomes | T1D; duration of disease-25 y | Not available | Microarray | P-36 C-36 | [22] |
| miR-25-3p | +++ | Plasma exosomes | T1D; duration of disease-25 y | Not available | Microarray | P-36 C-36 | [22] |
| miR-21-5p, miR-101-3p, miR-103a-3p, miR-148b-3p, miR-155-5p, miR-200a-3p, miR-210-3p, miR-1275 | +++ | Plasma | Recent-onset T1D; duration of first group < 5 y and second group > 5 y; levels in second group normalized to control levels | Not available | qPCR | Group 1 P-29 Group 2 P-31, C-40 | [31] |
| miR-146a-5p | −−− | Plasma | Recent-onset T1D; duration of first group < 5 y and second group > 5 y; levels in second group normalized to control levels | Not available | qPCR | Group 1 P-29 Group 2 P-31, C-40 | [31] |
| miR-21-5p, miR-148a | +++ | Serum | T1D, duration of disease 15.7 ± 11.3 y | Not available | qPCR | P-15 C-14 | [32] |
| let-7g-5p, miR-24-3p | −−− | Serum | C-peptide negative GCK-MODY | Not available | qPCR | P-13 C-10 | [27] |
| miR-424, miR-218 | +++ | Urine exosomes | T1D | Not available | No access; Abstract only | No access; abstract only | [33] |
| miR-21, miR-25, miR-146a, miR-181a | −−− | Serum | LADA and T1D; > 1 y after diagnosis | Not available | qPCR | T1D P-29 LADA P-16 C-19 | [23] |
| miR-555, miR-93-5p | +++ | Plasma | LADA | Not available | Microarray, qPCR | P-12 C-6 | [34] |
| miR-507, miR-517a-3p, miR-517b-3p, miR-4691-3p, miR-448, miR-370-5p, miR-1236-3p, miR-1267 | −−− | Plasma | LADA | Not available | Microarray, qPCR | P-12 C-6 | [34] |
| Non-diabetic autoantibody-positive children compared with T1D children | |||||||
| miR-21-3p, miR-424-5p, miR-29a-3p, miR-150-5p, miR-342-3p, miR-491-5p | +++ | Serum | In relatives of T1D individuals who were autoantibody positive and progressed to develop T1D in 1.8 ± 1.9 y at follow up; controls were nonprogressors but autoantibody positive | T1D TrialNet Pathway to Prevention study cohort | qPCR | 300 children | [16] |
| miR-339-3p, miR-148a-3p | +++ | Serum | Autoantibody-positive children, high risk for T1D. miR-148a-3p levels in comparison to low HLA-risk children among the high-risk group. | All Babies in Southeast Sweden cohort | qPCR | P-21 C-17 | [17] |
| miR-497-5p, miR-93-3p | −−− | Serum | Autoantibody-positive children, high risk for T1D. miR-93-3p levels in comparison to low HLA-risk children among the high-risk group. | All Babies in Southeast Sweden cohort | qPCR | P-21 from 17,055 participants C-17 | [17] |
| miR-101-3p | +++ | Serum | In non-diabetic individuals with single or multiple autoantibody and T1D | Not available | qPCR | P-26, 12 C-43 | [18] |
| miR-204-5p | +++ | Serum | Elevated immediately after islet autotransplantation; pediatric recent-onset T1D; adult at-risk subjects with positive autoantibody and recent-onset T1D. | TrialNet Pathway to Prevention cohort and center recruits | qPCR | P-14 C-10 | [19] |
* P and C indicate patient and control sample size, respectively. LADA, latent autoimmune diabetes in adults; MODY, maturity-onset diabetes of the young; NC, no change; qPCR, quantitative polymerase chain reaction; seq, sequencing; T1D, type 1 diabetes.
Table 2.
miRNAs differentially expressed in pre-DM, obese, and non-diabetic individuals at follow-up.
Table 2.
miRNAs differentially expressed in pre-DM, obese, and non-diabetic individuals at follow-up.
| miRNAs | +/− | Sample | Patient Classifications | Ethnicity | Method | Cohort Size * | Ref |
|---|---|---|---|---|---|---|---|
| miR-15a, miR-29b, miR-126, miR-223 | −−− | Plasma | Non-diabetic individuals who developed T2D in 10 y | Bruneck study, Italy | miRNA qPCR arrays | P –19 C-822 | [39] |
| miR-28-3p | +++ | Plasma | Non-diabetic individuals who developed T2D in 10 y | Bruneck study, Italy | miRNA qPCR arrays | P-19 C-822 | [39] |
| miR-15b | +++ | Serum | Obesity | Not available | qPCR | P-20 C-20 | [43] |
| miR-138, miR-376a | −−− | Serum | Obesity | Not available | qPCR | P-20 C-20 | [43] |
| miR-30c, miR-103, miR-191, miR-423-3p | NC | Serum | Obesity (used as internal controls) | Not available | qPCR | P-20 C-20 | [43] |
| miR-16-1, miR-122, miR-130b, miR-140-5p, miR-142-3p, miR-222, miR-363, miR-423-5p, miR-486-3p, miR-486-5p, miR-532-5p | +++ | Plasma | Childhood obesity | Caucasian | qPCR | P-40 C-85 | [36] |
| miR-28-3p, miR-125b, miR-221, miR-328 | −−− | Plasma | Childhood obesity | Caucasian | qPCR | P-40 C-85 | [36] |
| miR-130b | +++ | Serum | Obesity | Chinese | qPCR | P-44 | [44] |
| let-7g, miR-221 | +++ | Serum | MetS | Chinese women | qPCR | P-31 C-71 | [45] |
| miR-126 | −−− | Plasma | T2D-susceptible individuals | Han Chinese | qPCR | P-30, 30 C-30 | [46] |
| miR-126 | −−− | Serum | IGT/IFG | Not available | qPCR | P-82 IGT, 75 IFG C-138 | [47] |
| miR-23a | −−− | Serum | Pre-DM (IFG and IGT) | Han Chinese | Solexa seq, qPCR | P-20 C-20 | [48] |
| miR-370, miR-378a-5p, miR-27a-5p | +++ | Serum | Obese children and adolescents | Turkish | qPCR | P-45, 45 C-41, 41 | [49] |
| miR-335-5p, miR-143-5p, miR-758-3p | −−− | Serum | Obese children and adolescents | Turkish | qPCR | P-45, 45 C-41, 41 | [49] |
| miR-191-5p | +++ | Plasma | Prevalent glycemic impairment (IGT, IFG, or T2D) but not on medications | Asian Indians | Firefly circulating miRNA assay | P-149 | [37] |
| miR-122, miR-15a, miR-197, miR-320a, miR-423, miR-486 | −−− | Plasma | Progressive glycemic impairment at 2.5-y follow-up (IGT, IFG, or T2D) but not on medications | Asian Indians | Firefly circulating miRNA assay | P-149 | [37] |
| miR-138, miR-192, miR-193b, miR-214, miR-370, miR-375 | ND | Plasma | Prevalent or progressive glycemic impairment at 2.5-y follow-up (IGT, IFG, or T2D) but not on medications | Asian Indians | Firefly circulating miRNA assay | P-149 | [37] |
| miR-193b-3p, miR-22-3p, miR-320a, miR-486-5p | +++ | Plasma | Non-diabetic healthy individuals with or without insulin resistance; levels higher in insulin-resistant group | 50% Caucasian, 13% Asian, 8% African American, 5% Latino | Firefly circulating miRNA assay | 93 | [38] |
| miR-375 | −−− | Plasma | Non-diabetic healthy individuals with or without insulin resistance; levels lower in insulin-resistant group | 50% Caucasian, 13% Asian, 8% African American, 5% Latino | Firefly circulating miRNA assay | 93 | [38] |
| miR-20b-5p, miR-214-3p, miR-22-3p, miR-486-5p | +++ | Plasma | TZD intervention study: Non-diabetic healthy individuals with insulin resistance; TZD intervention responder levels | 50% Caucasian, 13% Asian, 8% African American, 5% Latino | Firefly circulating miRNA assay | 93 | [38] |
| miR-21-5p, miR-320a | −−− | Plasma | TZD intervention study: Non-diabetic healthy individuals with insulin resistance; TZD intervention responder levels | 50% Caucasian, 13% Asian, 8% African American, 5% Latino | Firefly circulating miRNA assay | 93 | [38] |
| miR-128, miR-99b-5p | +++ | Serum | IGT patients | Asian Indian | miRNA human panel I qPCR | P-47 C-49 | [50] |
| miR-423-5p | −−− | Serum | IGT patients | Asian Indian | miRNA human panel I qPCR | P-47 C-49 | [50] |
| miR-192, miR-193b | +++ | Serum | Pre-diabetic (Pre-DM) patients (IFG, IGT); normalized by exercise intervention | Not available | qPCR | P-22, 21 C-29 | [51] |
| miR-152, miR-17, miR-593 | +++ | Plasma | Obesity | Not available | qPCR | 25/group | [52] |
| miR-138 | −−− | Plasma | Obesit | Not available | qPCR | 25/group | [52] |
| miR-126 | −−− | Plasma | Normoglycemic individuals who developed T2D at 2-y follow-up | Han Chinese | qPCR | 20/group | [40] |
| miR-31-5p, miR-2355-5p, miR-26b-5p | −−− | Plasma | Overweight/obese children and adolescents | I.Family study; Italian cohort | qPCR arrays | P-10 C-10 | [53] |
| miR-320a, miR-1231, miR-361-3p, miR-136-5p, miR-206 | +++ | Plasma | Overweight/obese children and adolescents | I.Family study; Italian cohort | qPCR arrays | P-10 C-10 | [53] |
| miR-29b, miR-126, miR-155 | −−− | Serum | Pre-DM | ORIGINS trial | qPCR | P-21 C-20 | [54] |
| miR-21, miR-24, miR-27a, miR-34a, miR-126, miR-146a | +++ | Serum | Obesity | ORIGINS trial | qPCR | P-21 C-20 | [54] |
| miR-25, miR-93 | −−− | Serum | Obesity | ORIGINS trial | qPCR | P-21 C-20 | [54] |
| miR-935 | +++ | Plasma | Non-diabetic obese adults; 16-wk weight loss intervention (diet and exercise) study; low responder group high levels | Not available | qPCR | 111 | [55] |
| miR-126 | −−− | Serum | IGT | Egyptian | qPCR | P-86 C-100 | [56] |
| miR-126, miR-146a | −−− | Plasma | Pre-DM patients | Not available | qPCR | P-12 C-27 | [26] |
| miR-1249, miR-320b | −−− | Plasma | IGT/IFG | Han Chinese | Solexa seq, qPCR | 3/group-seq 50/group-qPCR | [57] |
| miR-6069, miR-572 | +++ | Plasma | IGT/IFG and T2D; miR-6069 only in IFG/IGT | Han Chinese | Solexa seq, qPCR | 3/group-seq 50/group-qPCR | [57] |
| miR-181a, miR-323-3p, miR-342-3p, miR-222, miR-483-5p, miR-151-5p, miR-532-3p, miR-142-5p, miR-625, miR-27b, miR-590-3p | −−− | Plasma | Non-diabetic, normotensive; prognostic and diagnostic biomarkers of beta-cell dysfunction in individuals who proceeded to develop pre-DM at 3-y follow-up | European RISC cohort | qPCR-based miRNA card | Total-1384 P-90 IGT at 3-y follow-up | [41] |
| miR-21, miR-145, miR-151-3p, miR-134, miR-215, miR-590-3p, miR-485-3p, miR-181a, miR-323-3p | −−− | Plasma | Non-diabetic, normotensive; diagnostic biomarkers of beta-cell dysfunction in individuals who developed pre-DM at 3-y follow-up | European RISC cohort | qPCR-based miRNA card | Total-1384 P-90 IGT at 3-y follow-up | [41] |
| miR-122-5p, miR-99a-5p | +++ | Plasma | IGT | DIAPASON study cohort | qPCR miRNA panels | P-9 C-9 | [58] |
| miR-18a-5p, miR-18b-5p, miR-30d-5p, miR-23a-3p, miR-24-3p, miR-27a-3p, miR-28-3p | −−− | Plasma | IGT | DIAPASON study cohort | qPCR miRNA panels | P-9 C-9 | [58] |
| miR-326, miR-24, miR-425, miR-652 | +++ | Plasma | After weight loss intervention in MetS patients | PRYSMS study | Firefly circulating miRNA assay | 171 | [59] |
| miR-106b, miR-140, miR-20b, miR-363, miR486, miR-532, miR-92a, miR-93, miR-let7c | −−− | Plasma | After weight loss intervention in MetS patients | PRYSMS study | Firefly circulating miRNA assay | 171 | [59] |
| miR-126-3p | −−− | Microparticles | Pre-DM | Not available | qPCR | P-39 C-53 | [60] |
| miR-320a, miR-197-3p, miR-23-3p, miR-221-3p, miR-27a-3p, miR-130a-3p | −−− | Serum | Obese individuals with or without MetS; these levels were further reduced to negligible in MetS patients | Not available | qPCR | Obese-17 MetS-16 C-24 | [61] |
| miR-144, miR-365, miR-32, miR-451, miR-150 | +++ | Plasma | Obese, insulin sensitive | European | qPCR miRNA panels | P-11, 19 C-12 | [62] |
| Let-7f, let-7e, miR-409-3p, miR-151-5p, miR-374b | −−− | Plasma | Obese, insulin sensitive | European | qPCR miRNA panels | P-11, 19 C-12 | [62] |
| miR-144, miR-193b, miR-365, miR-451, miR-122 | +++ | Plasma | Obese, insulin resistant | European | qPCR miRNA panels | P-11, 19 C-12 | [62] |
| miR-409-3p, let-7f, let-7e, miR-1974, miR-382 | −−− | Plasma | Obese, insulin resistant | European | qPCR miRNA panels | P-11, 19 C-12 | [62] |
| miR-7, miR-192 | +++ | Plasma | Pre-DM; vitamin D supplementation reduced levels after 6 mo | CaDDM study | miRNA qPCR arrays | 21/group | [63] |
| miR-152 | −−− | Plasma | Pre-DM; vitamin D supplementation increased levels after 6 mo | CaDDM study | miRNA qPCR arrays | 21/group | [63] |
| miR-199a-5p, miR-122-5p, miR-191-5p, miR-27b-3p, miR-15b-5p, miR-222-3p, miR-223-3p, miR-181b-5p, miR-23a-3p, miR-21-5p, miR-34a-5p, miR-192-5p, miR-29a-3p, miR-214-5p, miR-155-5p, miR-103a-5p | +++ | Plasma | Obese children with NAFLD | Not available | qPCR | P-20 C-10 | [64] |
| MiR-451, miR-16, miR-150, miR-375 | NC | Plasma | Obese children with NAFLD | Not available | qPCR | P-20 C-10 | [64] |
| miR-122 | +++ | Serum, plasma | General public, followed up for 15 y, MetS | Bruneck study | qPCR | 1000 | [42] |
| miR-125b, miR-378a, miR-192, miR-629, miR-22-5p, miR-15a | −−− | Plasma | miRNA levels after bariatric surgery | Not available | miRNA qPCR panels | 9 | [65] |
| miR-126, miR-130b, miR-221, miR-222 | +++ | Plasma | Obese, non-diabetic | Not available | qPCR | P-12 C-12 | [66] |
| miR-21, miR-126, miR-130b, miR-221, miR-222 | +++ | Plasma | Exercise intervention further increased these levels | Not available | qPCR | P-12 C-12 | [66] |
| miR-222, miR-486, miR-146b, miR-15b, miR-146a, miR-20a, miR-26b | +++ | Serum | Obesity | Not available | Small RNA seq, qPCR | P-206, 101 C-146, 82 | [67] |
| miR-197 | −−− | Serum | Obesity | Not available | Small RNA seq, qPCR | P-206, 101 C-146, 82 | [67] |
| miR-21 | −−− | Serum | Obese non-diabetic | Not available | qPCR | P-45 C-42 | [68] |
| miR-150 | +++ | Plasma | Pre-DM or progressed to pre-DM, 5-y follow-up study; baseline levels | CORDIOPREV study | qPCR | 462 | [69] |
| let-7b, miR-144, miR-29a | +++ | Plasma | IFG | Han Chinese | Microarray, qPCR | P-72 C-94 | [70] |
| miR-142 | −−− | Plasma | IFG | Han Chinese | Microarray, qPCR | P-72 C-94 | [70] |
| miR-758-3p, miR-29b-3p | +++ | Plasma | Detected in obesity but undetected in MetS | DairyHealth study, Denmark | MicroRNA qPCR panel, qPCR | 26/group | [71] |
| miR-146a-5p, miR-126 | +++ | Plasma | Obese non-diabetic; exercise intervention reduced levels of miR-146a | CURIAMO trial cohort | qPCR | P-31 C-31 | [72] |
| miR-142-3p, miR-140-5p, miR-222, miR-143, miR-130 | +++ | Plasma | Overweight and obese non-diabetic children (12-18 y) | Not available | qPCR | P-100, 100 C-50 | [73] |
| miR-532-5p, miR-423-5p, miR-520c-3p, miR-146a, miR-15a | −−− | Plasma | Overweight and obese non-diabetic children (12-18 y) | Not available | qPCR | P-100, 100 C-50 | [73] |
| miR-122-5p, miR-193b-5p, miR-26b-3p, miR-4449, let-7a-3p, miR-1290, let-7f-1-3p, miR-193a-5p, miR-183-5p, miR-126-5p | +++ | Serum exosomes | Obesity | Not available | Small RNA seq | P-16 C-18 | [74] |
| miR-4461, miR-1273a, miR-6739-5p, miR-1273g-3p, miR-4284, miR-6751-3p, miR-4485-5p, miR-8485, miR-1285-3p, miR-20a-5p | −−− | Serum exosomes | Obesity | Not available | Small RNA seq | P-16 C-18 | [74] |
| miR-1246, miR-1290, miR-193b-5p, miR-378c, miR-378d, miR-378g, miR-424-5p, miR-4449, miR-6126 | −−− | Serum exosomes | Reduction in levels after bariatric surgery in obese patients | Not available | Small RNA seq | P-16 C-18 | [74] |
| miR-92a | Serum | Obesity | Not available | qPCR | P-26 C-7 | [75] | |
| 65 miRNAs | +++ | Plasma | Obese insulin-resistant individuals | Chinese | MiRXES | P-9 C-9 | [76] |
| 73 miRNAs | −−− | Plasma | Obese insulin-resistant individuals | Chinese | MiRXES | P-9 C-9 | [76] |
| miR-122-5p, miR-210-3p, miR-3200-3p, miR-376b-3p, miR-378a-3p, miR-4532-5p, miR-660-3p, miR-375, miR-192-5p, miR-127-5p | +++ | Plasma | Pre-DM who progressed to T2D at 5-y follow-up | METSIM study | Small RNA seq, qPCR | P-290 (145 each) | [77] |
| miR-10b-5p, miR-191-3p, miR-215-5p, miR-501-5p, miR-551a, miR-874-3p | +++/−−− | Plasma | Overweight/obese children and adolescents | I.Family study; 8 European countries | qPCR arrays | P-95 C-95 | [78] |
| miR-21 | +++ | Plasma | IGT | DIAPASON study cohort | qPCR | P-43 C-39 | [79] |
| miR-103a | +++ | Plasma | Pre-DM | Han Chinese | qPCR | P-47 C-50 | [80] |
| miR-103b | −−− | Plasma | Pre-DM | Han Chinese | qPCR | P-47 C-50 | [80] |
* P and C indicate patient and control sample size, respectively. DM, diabetes mellitus; IFG, impaired fasting glucose; IGT, impaired glucose tolerance; MetS, metabolic syndrome; NAFLD, non-alcoholic fatty liver disease; NC, no change qPCR, quantitative polymerase chain reaction; seq, sequencing; TZD, thiazolidinedione. ORIGINS, birth cohort; DIAPASON, diabetes prediction and screening observational; PRYSMS, Practicing Restorative Yoga vs. Stretching for the Metabolic Syndrome; CaDDM, Calcium and Vitamin D for Diabetes Mellitus; CARDIOPREV, cardiovascular disease prevention; CURIAMO, Centro Universitario Ricerca Interdipartimentale Attività Motoria; METSIM, Metabolic Syndrome In Men.
Table 3.
miRNAs differentially expressed in patients with type 2 diabetes.
| miRNAs | +/− | Sample | Patient Classifications | Ethnicity | Method | Cohort Size * | Ref |
|---|---|---|---|---|---|---|---|
| miR-20b, miR-21, miR-24, miR-15a, miR-126, miR-191, miR-197, miR-223, miR-320, miR-486 | −−− | Plasma | T2D | Bruneck study, Italy | miRNA qPCR arrays | 822 | [39] |
| miR-28-3p | +++ | Plasma | T2D | Bruneck study, Italy | miRNA qPCR arrays | 822 | [39] |
| miR-503 | +++ | Plasma | T2D | Not available | qPCR | 11/group | [81] |
| miR-9, miR-29a, miR-30d, miR-34a, miR-124a, miR-146a, miR-375 | +++ | Serum | T2D | Han Chinese | qPCR | P-9 C-12 | [82] |
| miR-503 | −−− | Serum | T2D | Not available | miRNA qPCR panels | P-13 C-20 | [43] |
| miR-375 | +++ | Plasma | T2D | Chinese Kazak | qPCR | P-100 C-100 | [83] |
| miR-126 | −−− | Plasma | T2D-susceptible individuals, T2D | Han Chinese | qPCR | 30/group | [46] |
| miR-146a | −−− | Serum | T2D | Not available | qPCR | P-56 C-40 | [84] |
| miR-126 | −−− | Serum | New T2D | Not available | qPCR | P-160 C-138 | [47] |
| miR-199a | +++ | Plasma | T2D | Chinese | qPCR | 64/group | [85] |
| miR-23a, let-7i, miR-486, miR-96, miR-186, miR-191, miR-192, miR-146a | −−− | Serum | T2D | Han Chinese | Solexa seq, qPCR | P-20 C-20 | [48] |
| miR-144, miR-486-5p | +++ | Plasma | T2D | Swedes | qPCR | P-14 C-54 | [86] |
| miR-150 | +++ | Plasma | T2D | Iraqi | qPCR | P-19 C-65 | [86] |
| miR-375 | +++ | Plasma | Increased in T2D | Not available | qPCR | P-54 C-53 | [87] |
| miR-103 | +++ | Urine | T2D | Not available | qPCR | P-36 C-26 | [30] |
| miR-101, miR-375, miR-802 | +++ | Serum | T2D | Japanese | qPCR | P-155 C-49 | [88] |
| Let-7d-3p, miR-128, miR-130b-3p | +++ | Serum | T2D | Asian Indian | qPCR | P-49 C-49 | [50] |
| miR-142-3p | −−− | Serum | T2D | Asian Indian | qPCR | P-49 C-49 | [50] |
| miR-593 | −−− | Plasma | T2D | Not available | qPCR | 25/group | [52] |
| miR-21, miR-24, miR-34a, miR-148a, miR-27a, miR-146a, miR-223, miR-326 | +++ | Serum | T2D; miRNAs in italics were elevated in comparison to pre-T2D | ORIGINS trial | qPCR | P-17 C-20 | [54] |
| miR-126 | −−− | Serum | T2D | Egyptian | qPCR | P-100 C-100 | [56] |
| miR-148a, miR-21, miR-30d, miR-34a | +++ | Plasma | T2D | Not available | qPCR | P-31 C-27 | [26] |
| miR-1249, miR-320b | −−− | Plasma | T2D | Han Chinese | Solexa seq, qPCR | 3/group-seq 50/group-qPCR | [57] |
| miR-572 | +++ | Plasma | T2D | Han Chinese | Solexa seq, qPCR | 3/group-seq 50/group-qPCR | [57] |
| miR-148a-3p | +++ | Plasma | T2D | DIAPASON study cohort | qPCR miRNA panels | P-9 C-9 | [58] |
| miR-222-3p, miR-342-3p | −−− | Plasma | T2D | DIAPASON study cohort | qPCR miRNA panels | P-9 C-9 | [58] |
| miR-126-3p | −−− | Microparticles | T2D | Not available | qPCR | P-68 C-53 | [60] |
| miR-144, miR-193b, miR-136, miR-34a, miR-32 | +++ | Plasma | Obese T2D | European | qPCR miRNA panels | P-11, 15 C-12 | [62] |
| Let-7d, let-7c, let-7e, let-7f, miR-485-3p | −−− | Plasma | Obese T2D | European | qPCR miRNA panels | P-11, 15 C-12 | [62] |
| miR-409-3p, miR-665, miR-766-3p | −−− | Serum | T2D | Chinese | miRNA qPCR array | P-10 C-5 | [89] |
| miR-455-5p, miR-454-3p, miR-144-3p, miR-96-5p | +++ | Serum | T2D | Chinese | miRNA qPCR array | P-10 C-5 | [89] |
| miR-7 | +++ | Serum | T2D | Not available | qPCR | P-152 C-74 | [90] |
| miR-122 | +++ | Serum and plasma | T2D | Bruneck study | qPCR | 1000 | [42] |
| miR-486, miR-146b, miR-15b | +++ | Serum | T2D | Not available | Small RNA seq, qPCR | P-206, 101 C-146, 82 | [67] |
| miR-21 | −−− | Serum | Obese, T2D | Not available | qPCR | P-45 C-42 | [68] |
| miR-150, miR-30a-5p | +++ | Plasma | T2D | CORDIOPREV study | qPCR | 462 | [69] |
| miR-375 | −−− | Plasma | T2D | CORDIOPREV study | qPCR | 462 | [69] |
| miR-144-3p, miR-155-5p, miR-29a-5p, let-7b-5p, let-7i-5p | +++ | Plasma | Newly diagnosed T2D | Han Chinese | Microarray, qPCR | P-112 C-94 | [70] |
| miR-142 | −−− | Plasma | Newly diagnosed T2D | Han Chinese | Microarray, qPCR | P-112 C-94 | [70] |
| miR-30d | +++ | Plasma | T2D | Indian | qPCR | P-30 C-30 | [91] |
| miR-141 | +++ | Serum | Elderly T2D (60–65 y) | Not available | qPCR | P-50 | [92] |
| miR-7-5p, let-7f-5p, miR-15b-5p, miR-320c, miR-205-5p, miR-335-5p | +++ | Plasma | Obese diabetes and levels after bariatric surgery | Not available | qPCR | 29 | [93] |
| let-7i-5p | −−− | Plasma | Obese diabetes and levels after bariatric surgery | Not available | qPCR | 29 | [93] |
| miR-21 | +++ | Plasma | T2D | DIAPASON study cohort | qPCR | P-27 C-39 | [79] |
| miR-103a | +++ | Plasma | T2D | Han Chinese | qPCR | P-48 C-50 | [80] |
| miR-103b | −−− | Plasma | T2D | Han Chinese | qPCR | P-48 C-50 | [80] |
| miR-183-5p, miR-486-3p | +++ | Plasma | Recent-onset T2D; miR-486-3p only in men not women | Arab/Jewish Israeli population | qPCR | 88 | [94] |
| miR-423 | −−− | Plasma | Recent-onset T2D | Arab/Jewish Israeli population | qPCR | 88 | [94] |
* P and C indicate patient and control sample size, respectively. T2D indicates type 2 diabetes; qPCR, quantitative polymerase chain reaction.
Table 4.
miRNAs differentially expressed in patients at risk for or with gestational diabetes mellitus.
Table 4.
miRNAs differentially expressed in patients at risk for or with gestational diabetes mellitus.
| miRNAs | +/− | Sample | Patient Classifications | Ethnicity | Method | Cohort Size * | Ref |
|---|---|---|---|---|---|---|---|
| miR-132, miR-29a, miR-222 | −−− | Serum | 16–19 weeks of gestation, before onset of GDM | Not available | miRNA qPCR panel, qPCR | 24, 36, 16/group | [97] |
| miR-29c, miR-99b, miR-103, miR-221, miR-340, miR-122, miR-324-3p, miR-375, miR-652 | −−− | Plasma | Gestational obesity patients | Caucasian | qPCR array, qPCR | P-25 C-25 | [98] |
| miR-30a-5p, miR-130a, miR-150, miR-625 | +++ | Plasma | Gestational obesity patients | Caucasian | qPCR array, qPCR | P-25 C-25 | [98] |
| miR-122, miR-324-3p, miR-375, miR-652 | −−− | Plasma | Gestational obesity and pre-gestational obesity patients | Caucasian | qPCR array, qPCR | P-20, 25 C-25 | [98] |
| miR-16-5p, miR-17-5p, miR-19a-3p, miR-19b-3p, miR-20a-5p | +++ | Plasma | Every 4 weeks of gestation, before onset of GDM | Not available | Small RNA seq, qPCR | P-10 C-10 | [99] |
| miR-16-5p, miR-17-5p, miR-20a-5p | +++ | Plasma | 16–20 weeks, before onset of GDM, 20–24 and 24–28 weeks | Not available | qPCR | P-85 C-72 | [100] |
| miR-155-5p, miR-21-3p, miR-146b-5p, miR-210-3p, miR-223-3p, miR-517-5p | +++ | Plasma | At 16.1 weeks of gestation followed up to 28 weeks, GDM | Hispanic, non-Hispanic, Asian, White, other | qPCR | P-36 C-80 | [101] |
| miR-330-3p, miR-483-5p | +++ | Plasma | 24–33 weeks of gestation, GDM | Not available | miRNA array, qPCR | P-21 C-10 | [102] |
| miR-183-3p, miR-200b-3p, miR-17-5p (trend), miR-125b-5p, miR-191-5p (trend), miR-1290 | +++ | Serum | First trimester of pregnancy in GDM | Not available | qPCR | P-67 C-74 | [103] |
| miR-183-5p, miR-200b-3p | +++ | Serum | Second trimester of pregnancy in GDM | Not available | qPCR | P-67 C-74 | [103] |
| miR-128-5p | −−− | Serum | Second trimester of pregnancy in GDM | Not available | qPCR | P-67 C-74 | [103] |
| miR-183-5p, miR-200b-3p | −−− | Serum | Third trimester of pregnancy in GDM | Not available | qPCR | P-67 C-74 | [103] |
| miR-125a-3p, miR-99b-5p, miR-197-3p, miR-22-3p, miR-27b-3p, miR-200a-3p, miR-141-3p | +++ | Plasma exosomes | End of pregnancy, GDM | Caucasian, Australian, Asian, Middle Eastern | qPCR | P-12 C-12 | [104] |
| miR-20a-5p, miR-222-3p | −−− | Serum | 13–31 weeks, GDM | South African | miRNA qPCR arrays | 81 | [105] |
| Let-7e-5p, let-7g-5p, miR-100-5p, miR-101-3p, miR-146a-5p, miR-18a-5p, miR-195-5p, miR-222-3p, miR-23b-3p, miR-30b-5p, miR-30c-5p, miR-30d-5p, miR-342-3p, miR-423-5p, miR-92a-3p | +++ | Plasma | 23–31 weeks of gestation, GDM | Not available | miRNA qPCR arrays, qPCR | P-13 C-9 | [106] |
| miR-122-5p; miR-132-3p; miR-1323; miR-136-5p; miR-182-3p; miR-210-3p; miR-29a-3p; miR-29b-3p; miR-342-3p, miR-520h | +++ | Serum exosomes | 6–15 weeks of gestation, before onset of GDM | White | qPCR | P-23 C-46 | [107] |
| miR-223, miR-23a | +++ | Plasma | First trimester in GDM women | Not available | qPCR | Not available | [108] |
* P and C indicate patient and control sample size, respectively. GDM indicates gestational diabetes mellitus; qPCR, quantitative polymerase chain reaction; seq, sequencing.
© 2019 by the authors. Licensee MDPI, Basel, Switzerland. This article is an open access article distributed under the terms and conditions of the Creative Commons Attribution (CC BY) license (http://creativecommons.org/licenses/by/4.0/).
Share and Cite
MDPI and ACS Style
Vasu, S.; Kumano, K.; Darden, C.M.; Rahman, I.; Lawrence, M.C.; Naziruddin, B. MicroRNA Signatures as Future Biomarkers for Diagnosis of Diabetes States. Cells 2019, 8, 1533. https://0-doi-org.brum.beds.ac.uk/10.3390/cells8121533
AMA Style
Vasu S, Kumano K, Darden CM, Rahman I, Lawrence MC, Naziruddin B. MicroRNA Signatures as Future Biomarkers for Diagnosis of Diabetes States. Cells. 2019; 8(12):1533. https://0-doi-org.brum.beds.ac.uk/10.3390/cells8121533
Chicago/Turabian StyleVasu, Srividya, Kenjiro Kumano, Carly M. Darden, Irum Rahman, Michael C. Lawrence, and Bashoo Naziruddin. 2019. "MicroRNA Signatures as Future Biomarkers for Diagnosis of Diabetes States" Cells 8, no. 12: 1533. https://0-doi-org.brum.beds.ac.uk/10.3390/cells8121533
Note that from the first issue of 2016, this journal uses article numbers instead of page numbers. See further details here.