Autophagy Controls Sulphur Metabolism in the Rosette Leaves of Arabidopsis and Facilitates S Remobilization to the Seeds

 , , and
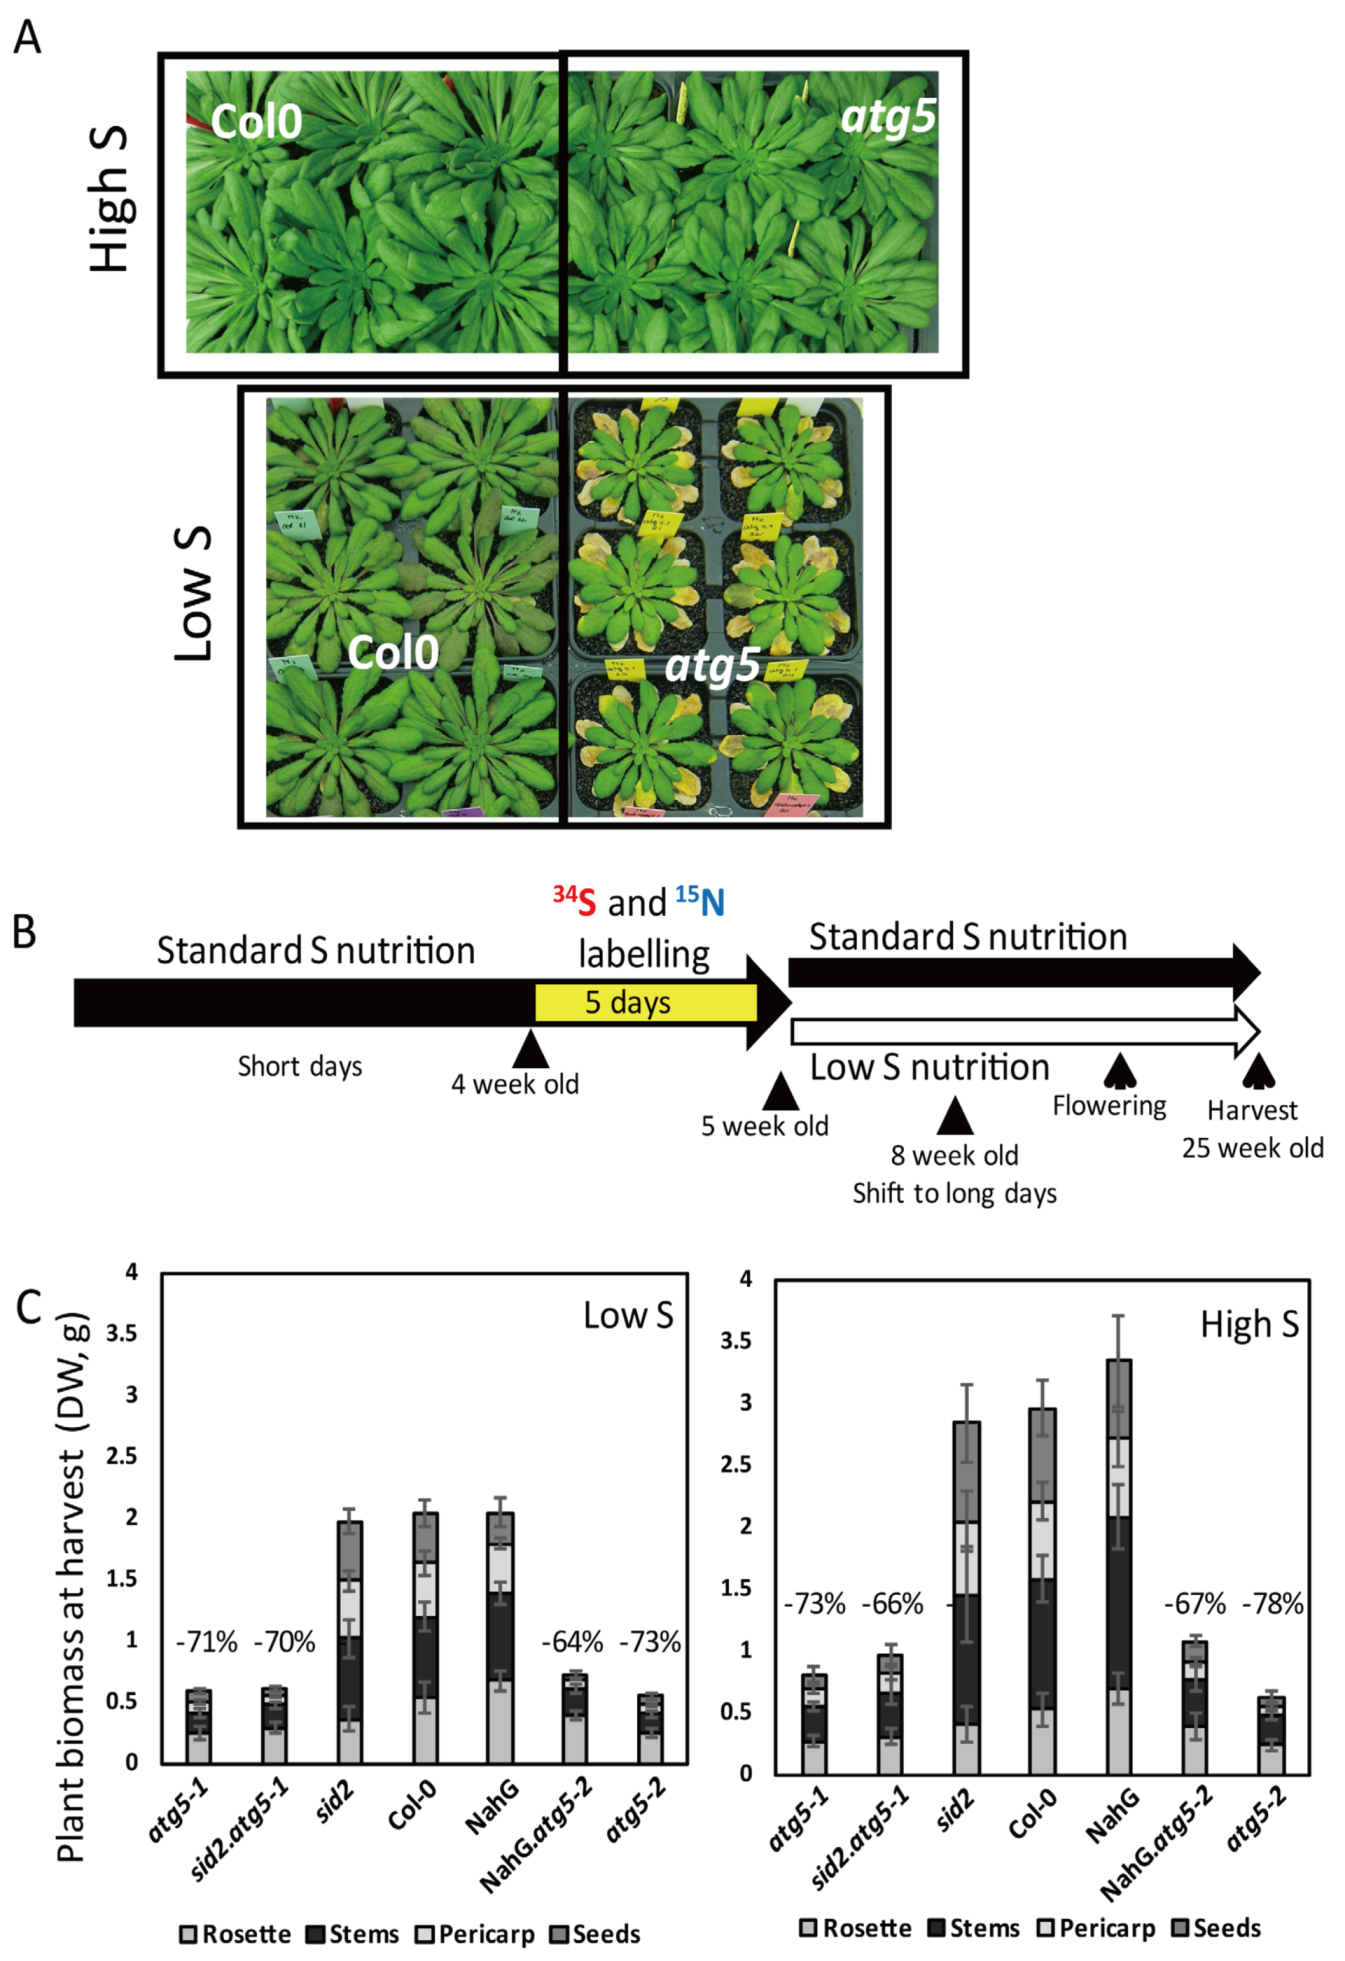
Abstract
:1. Introduction
2. Materials and Methods
2.1. Plant Material and Growth Conditions
2.2. 15N Labelling and Tracing
2.3. Metabolite Profiling and Sulphate Measurements
2.4. Statistical Analysis
3. Results
3.1. Hypersensitivity of Autophagy Mutants to Sulphur Limitation
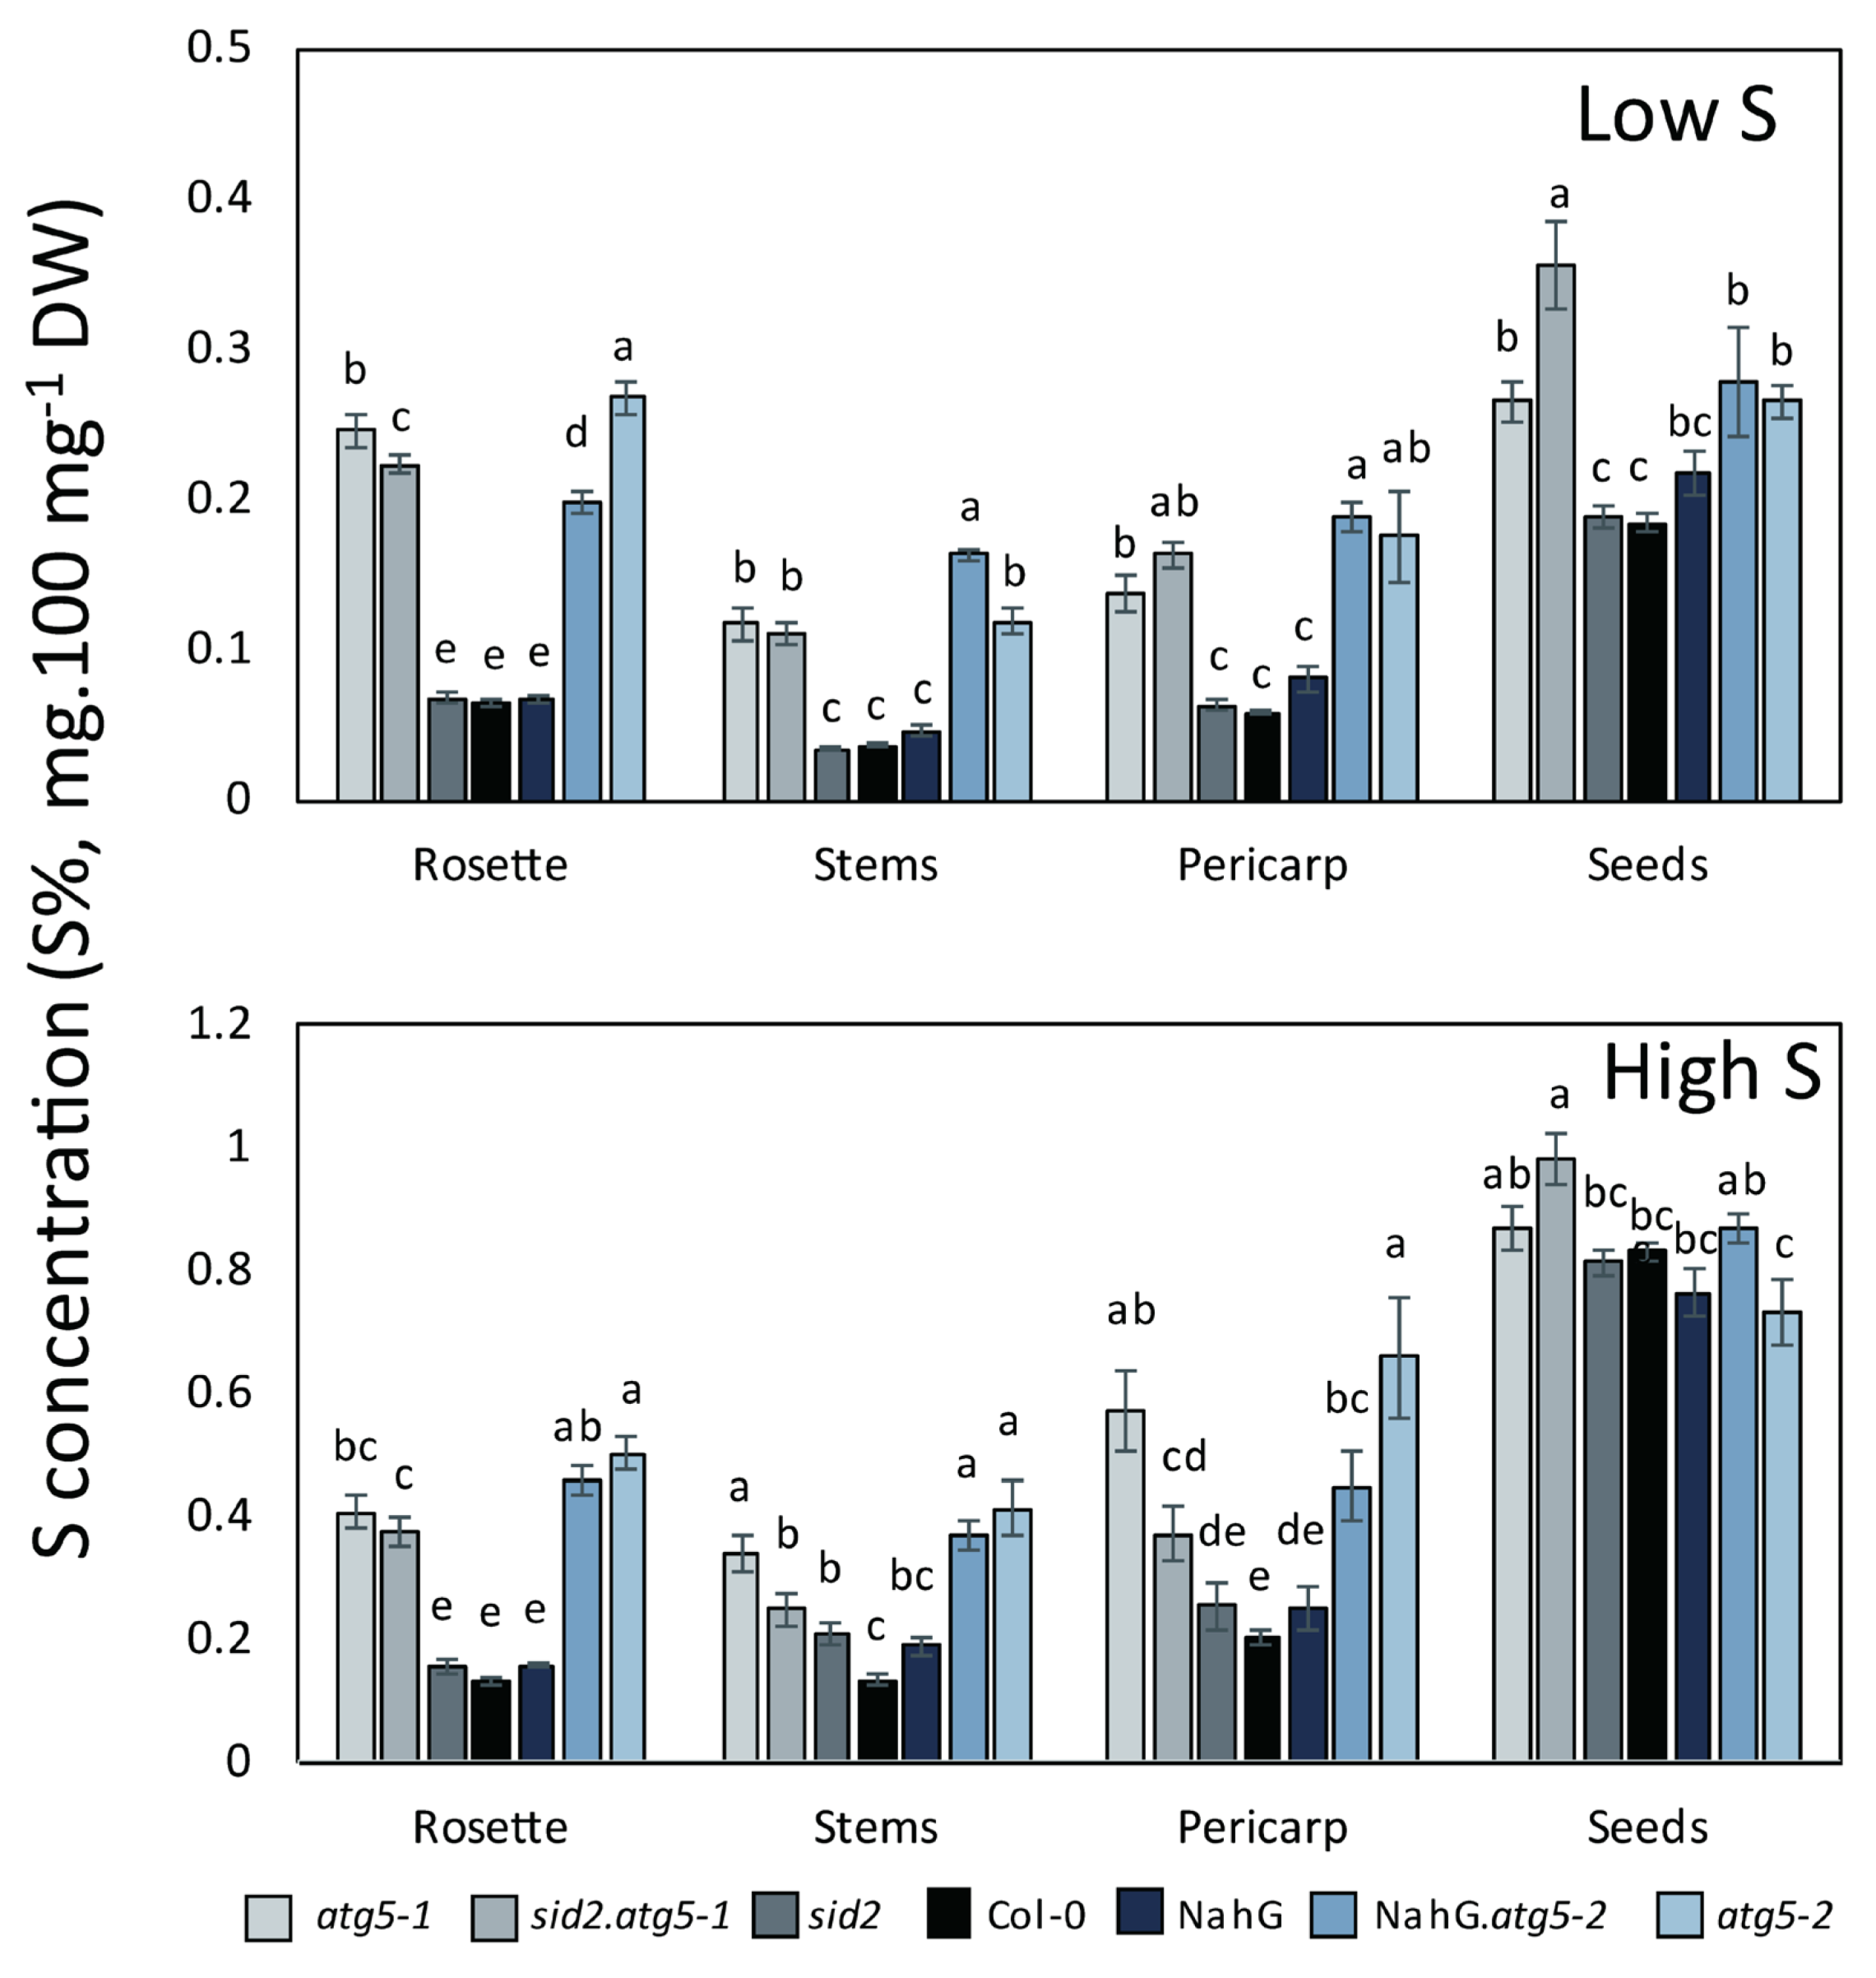
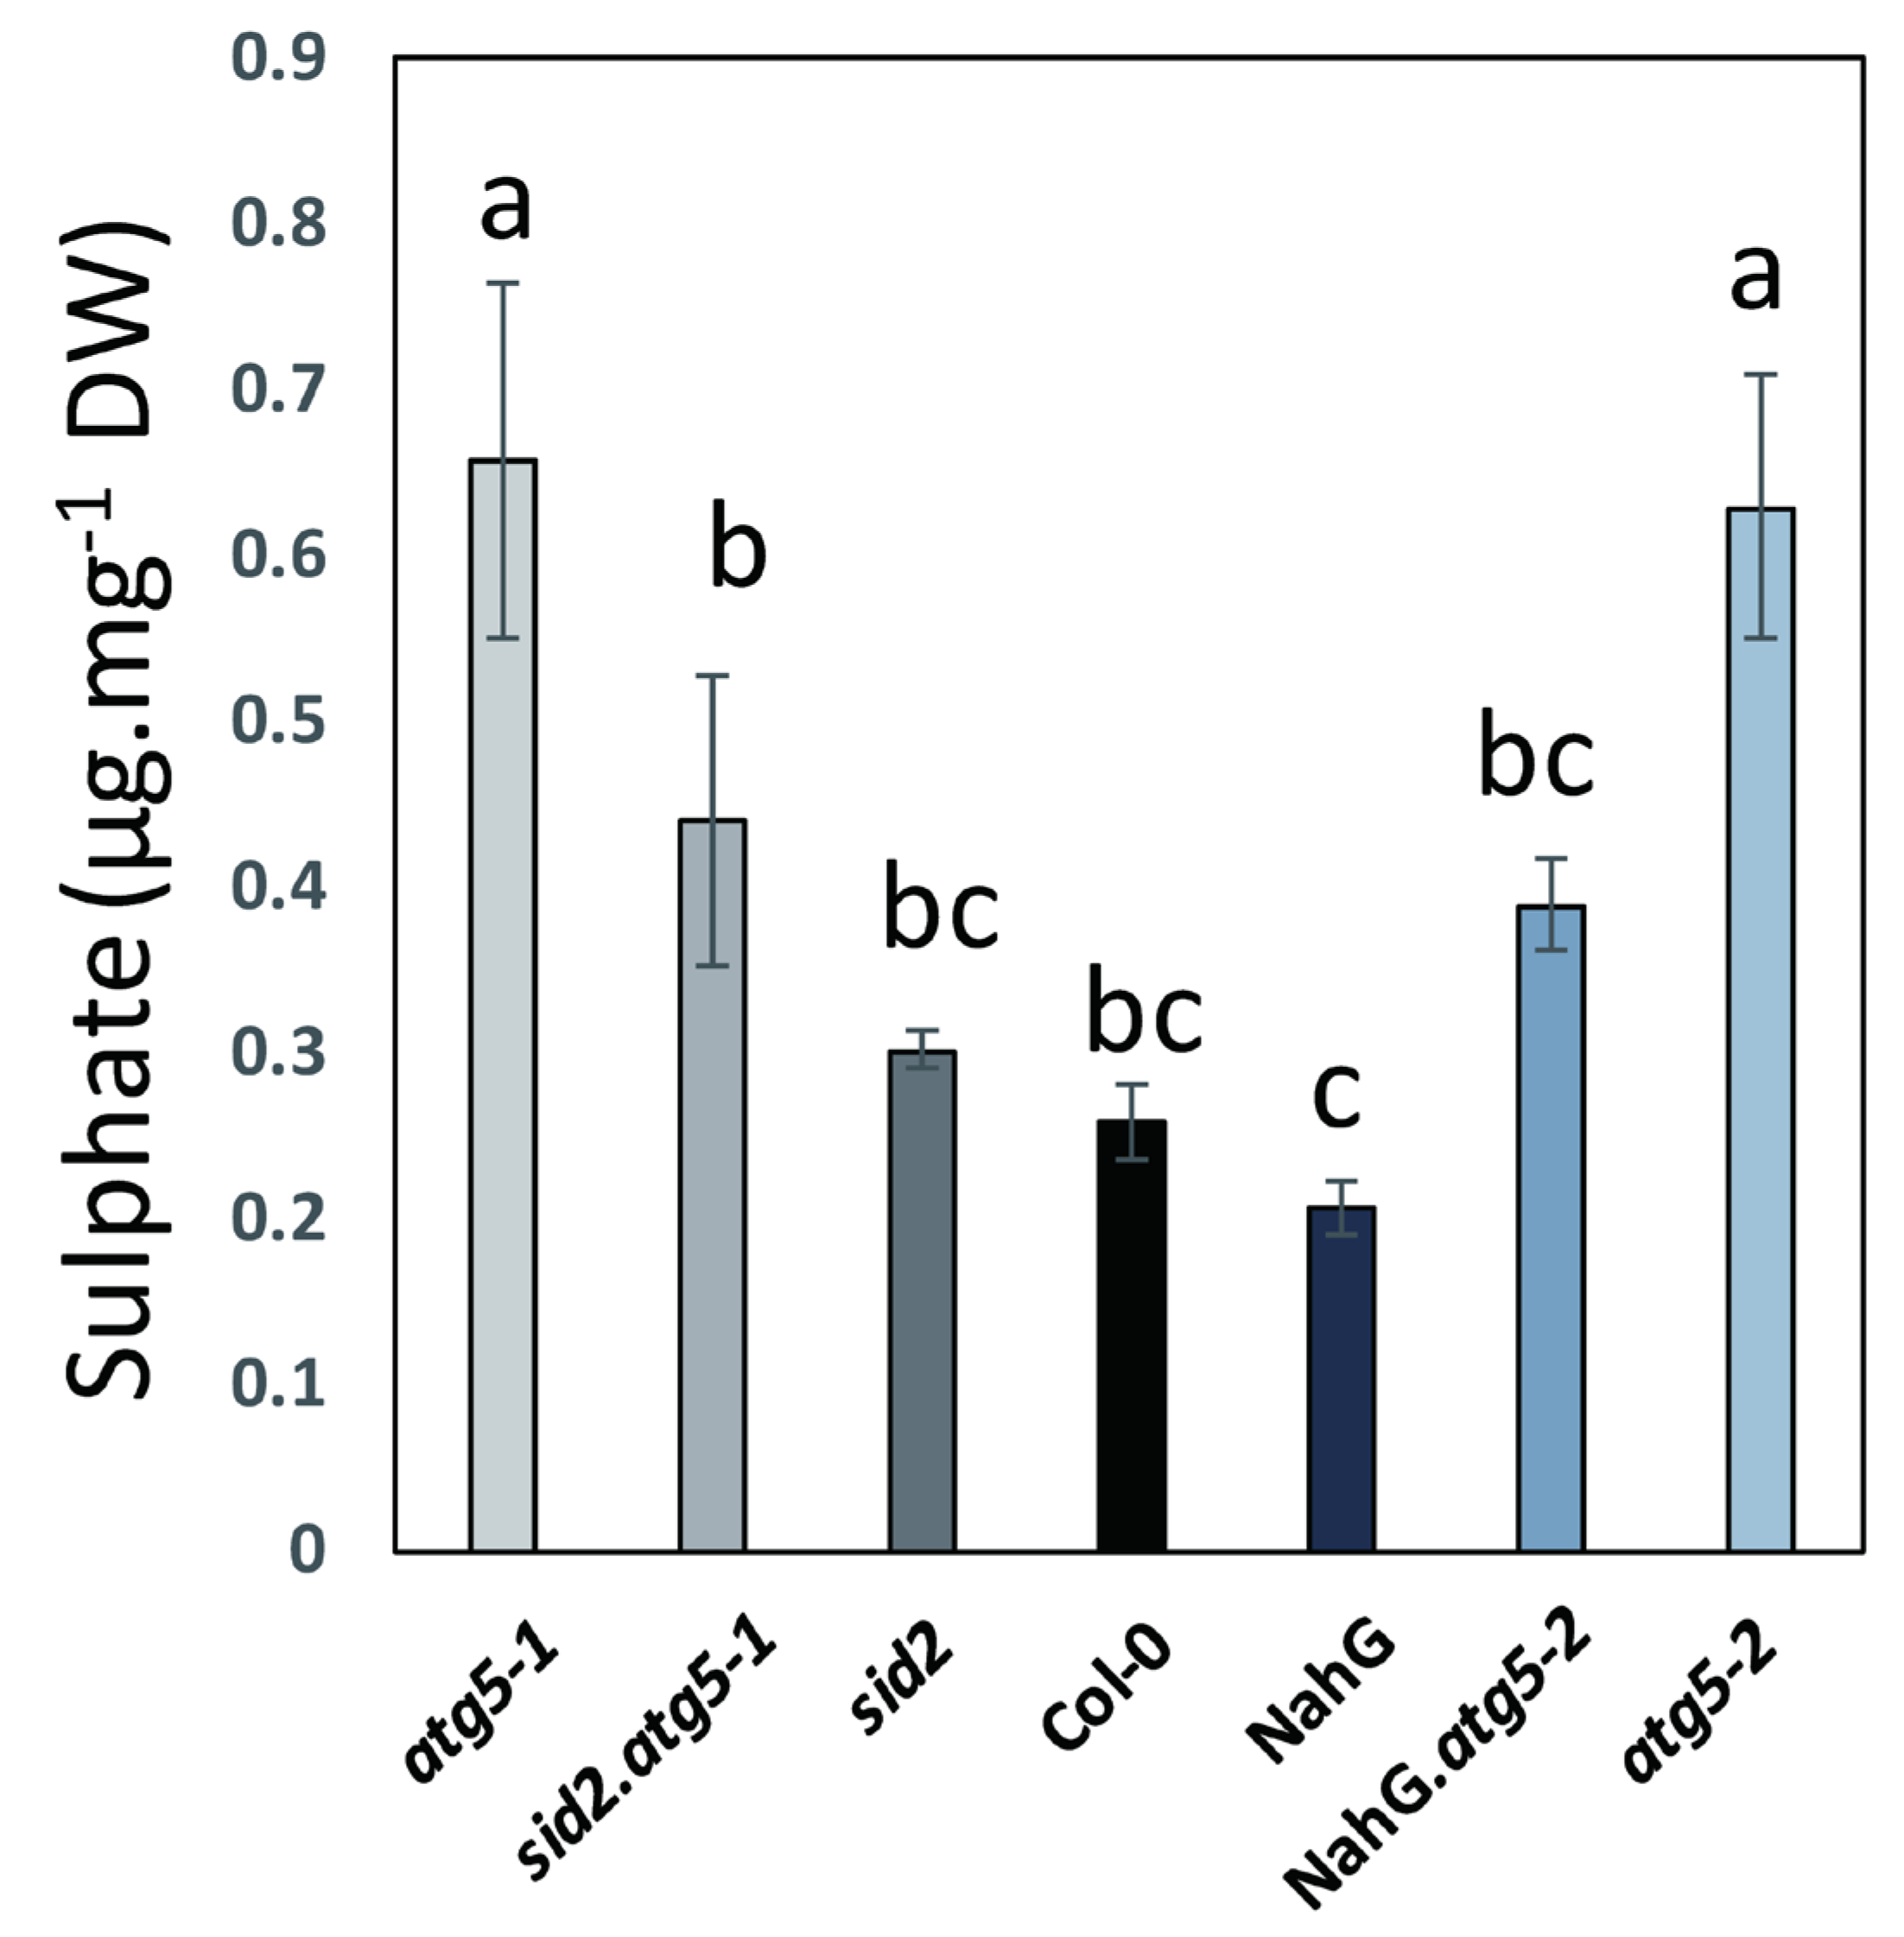
3.2. Autophagy Mutants Hyper-Accumulate Sulphur
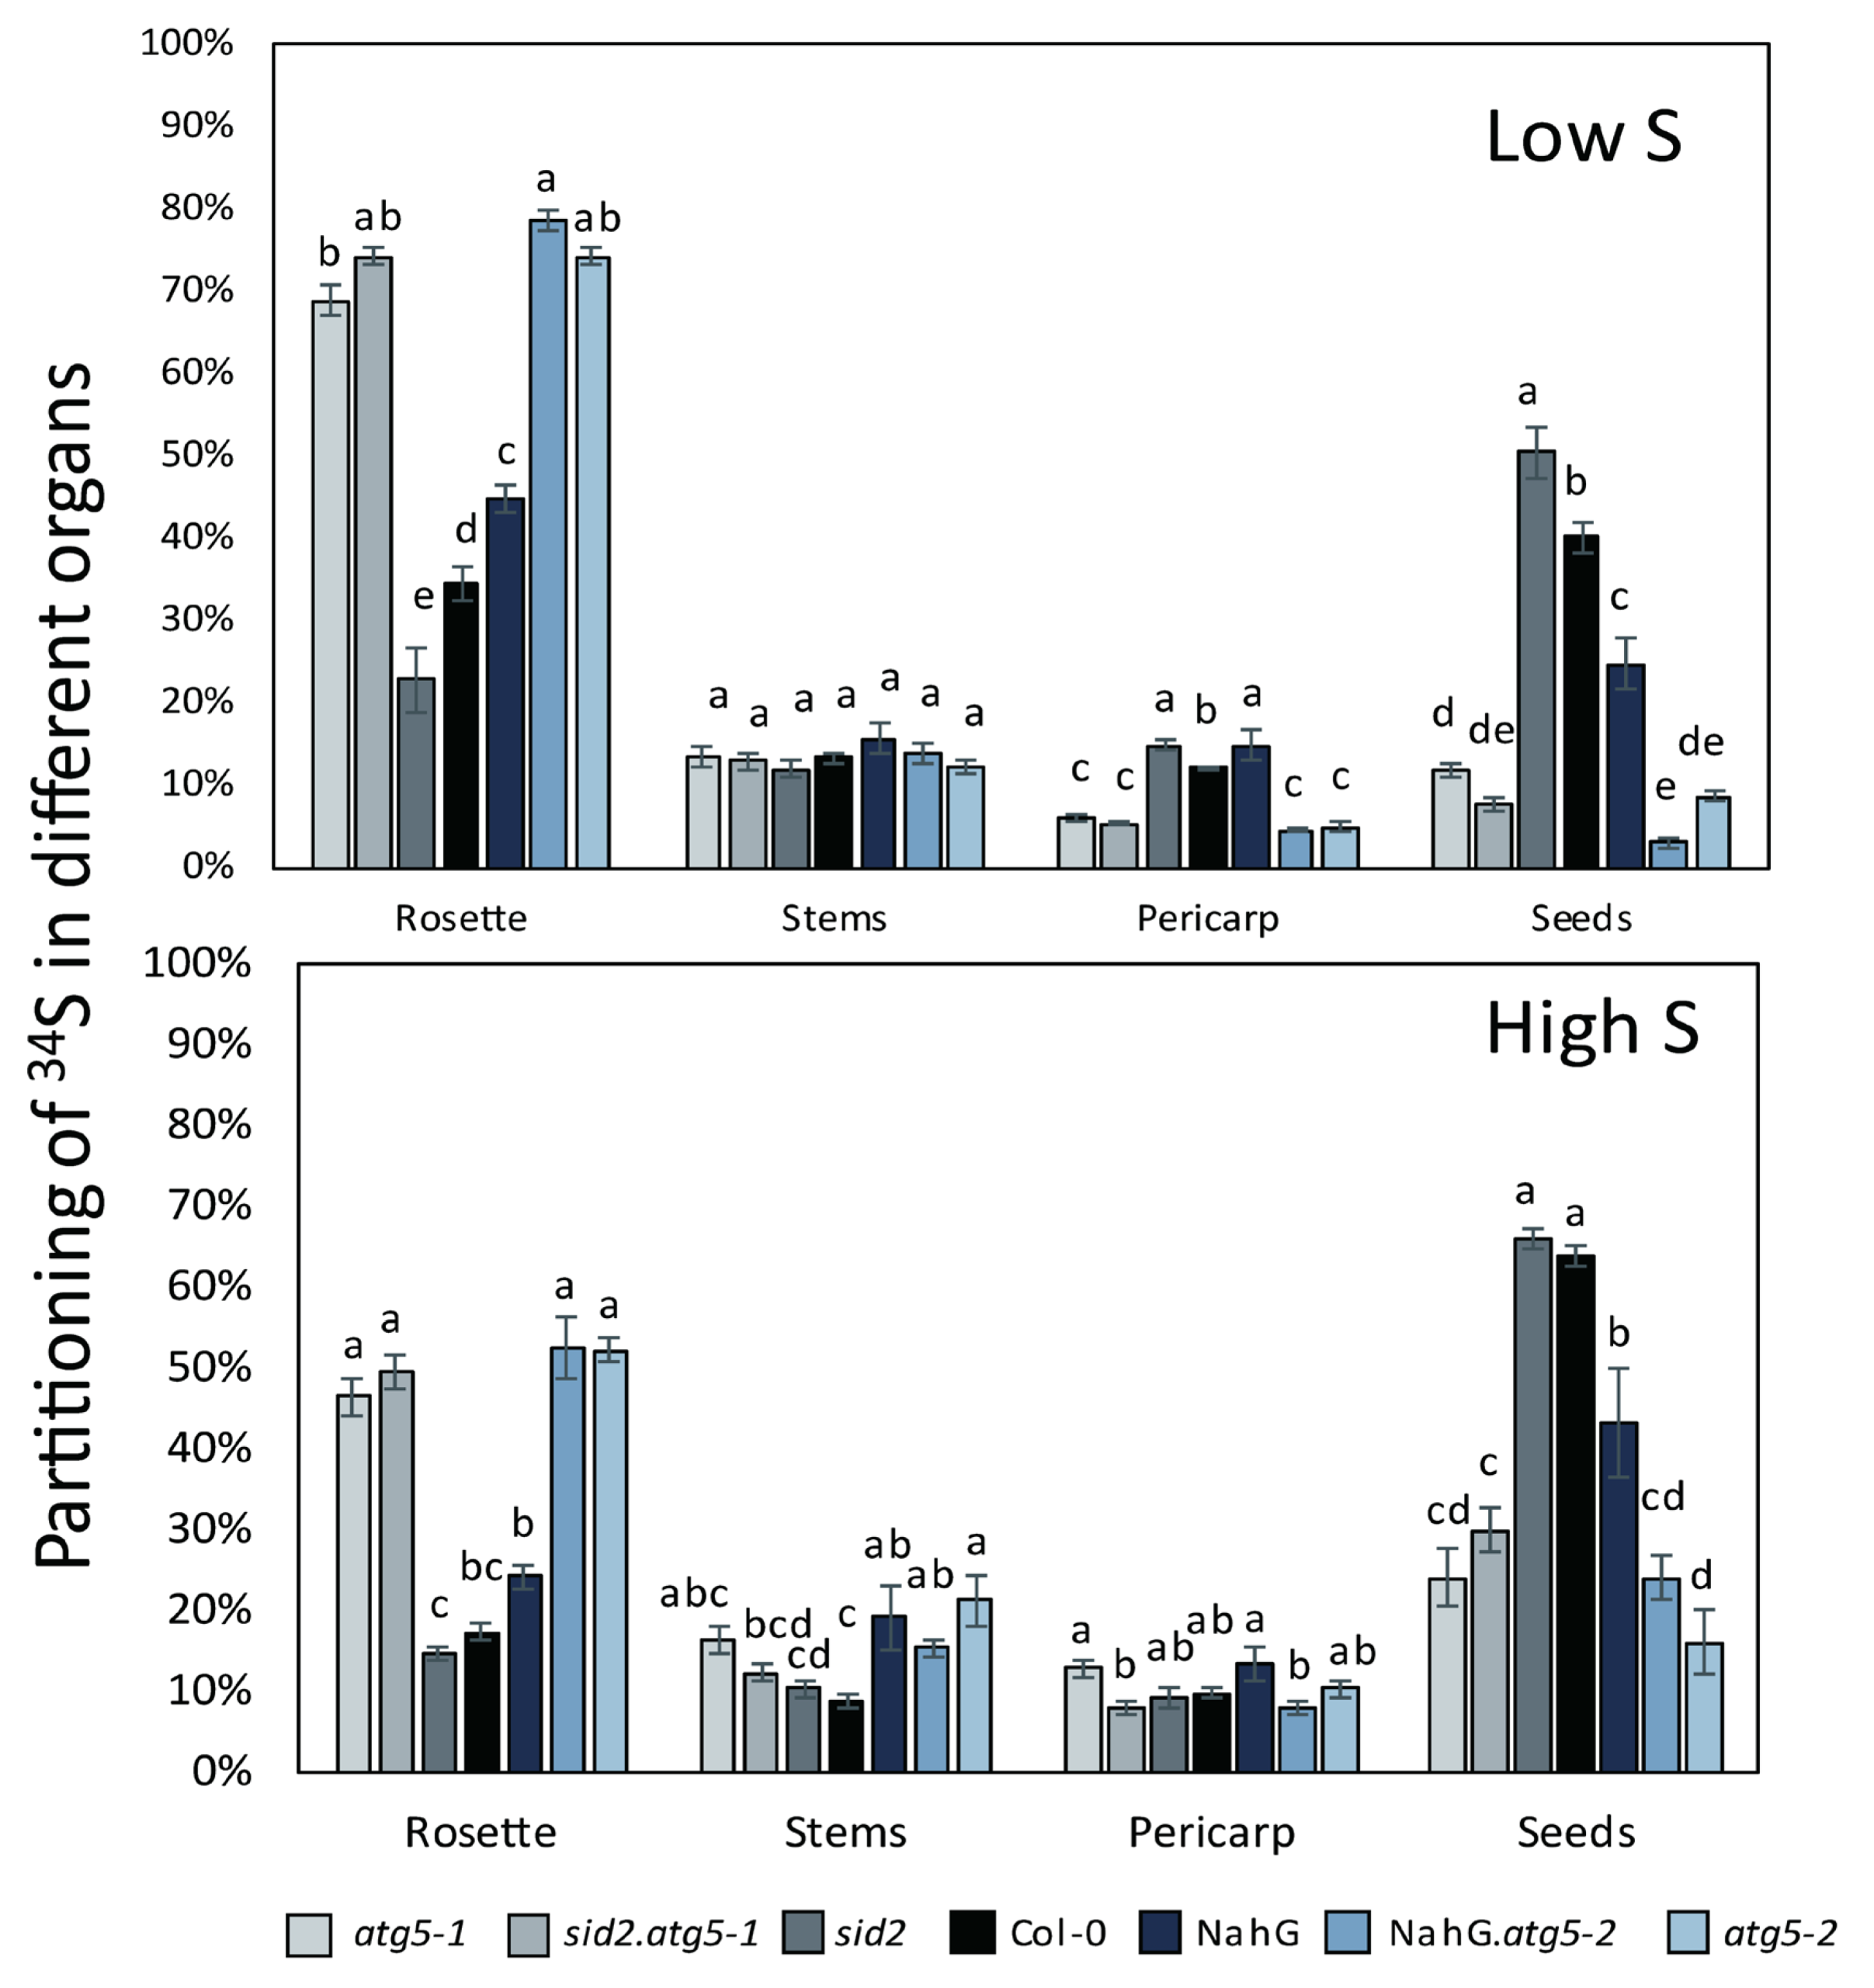
3.3. Sulphur Remobilization from the Rosette to the Seeds and Pericarp Is Less Efficient in atg5 Mutants
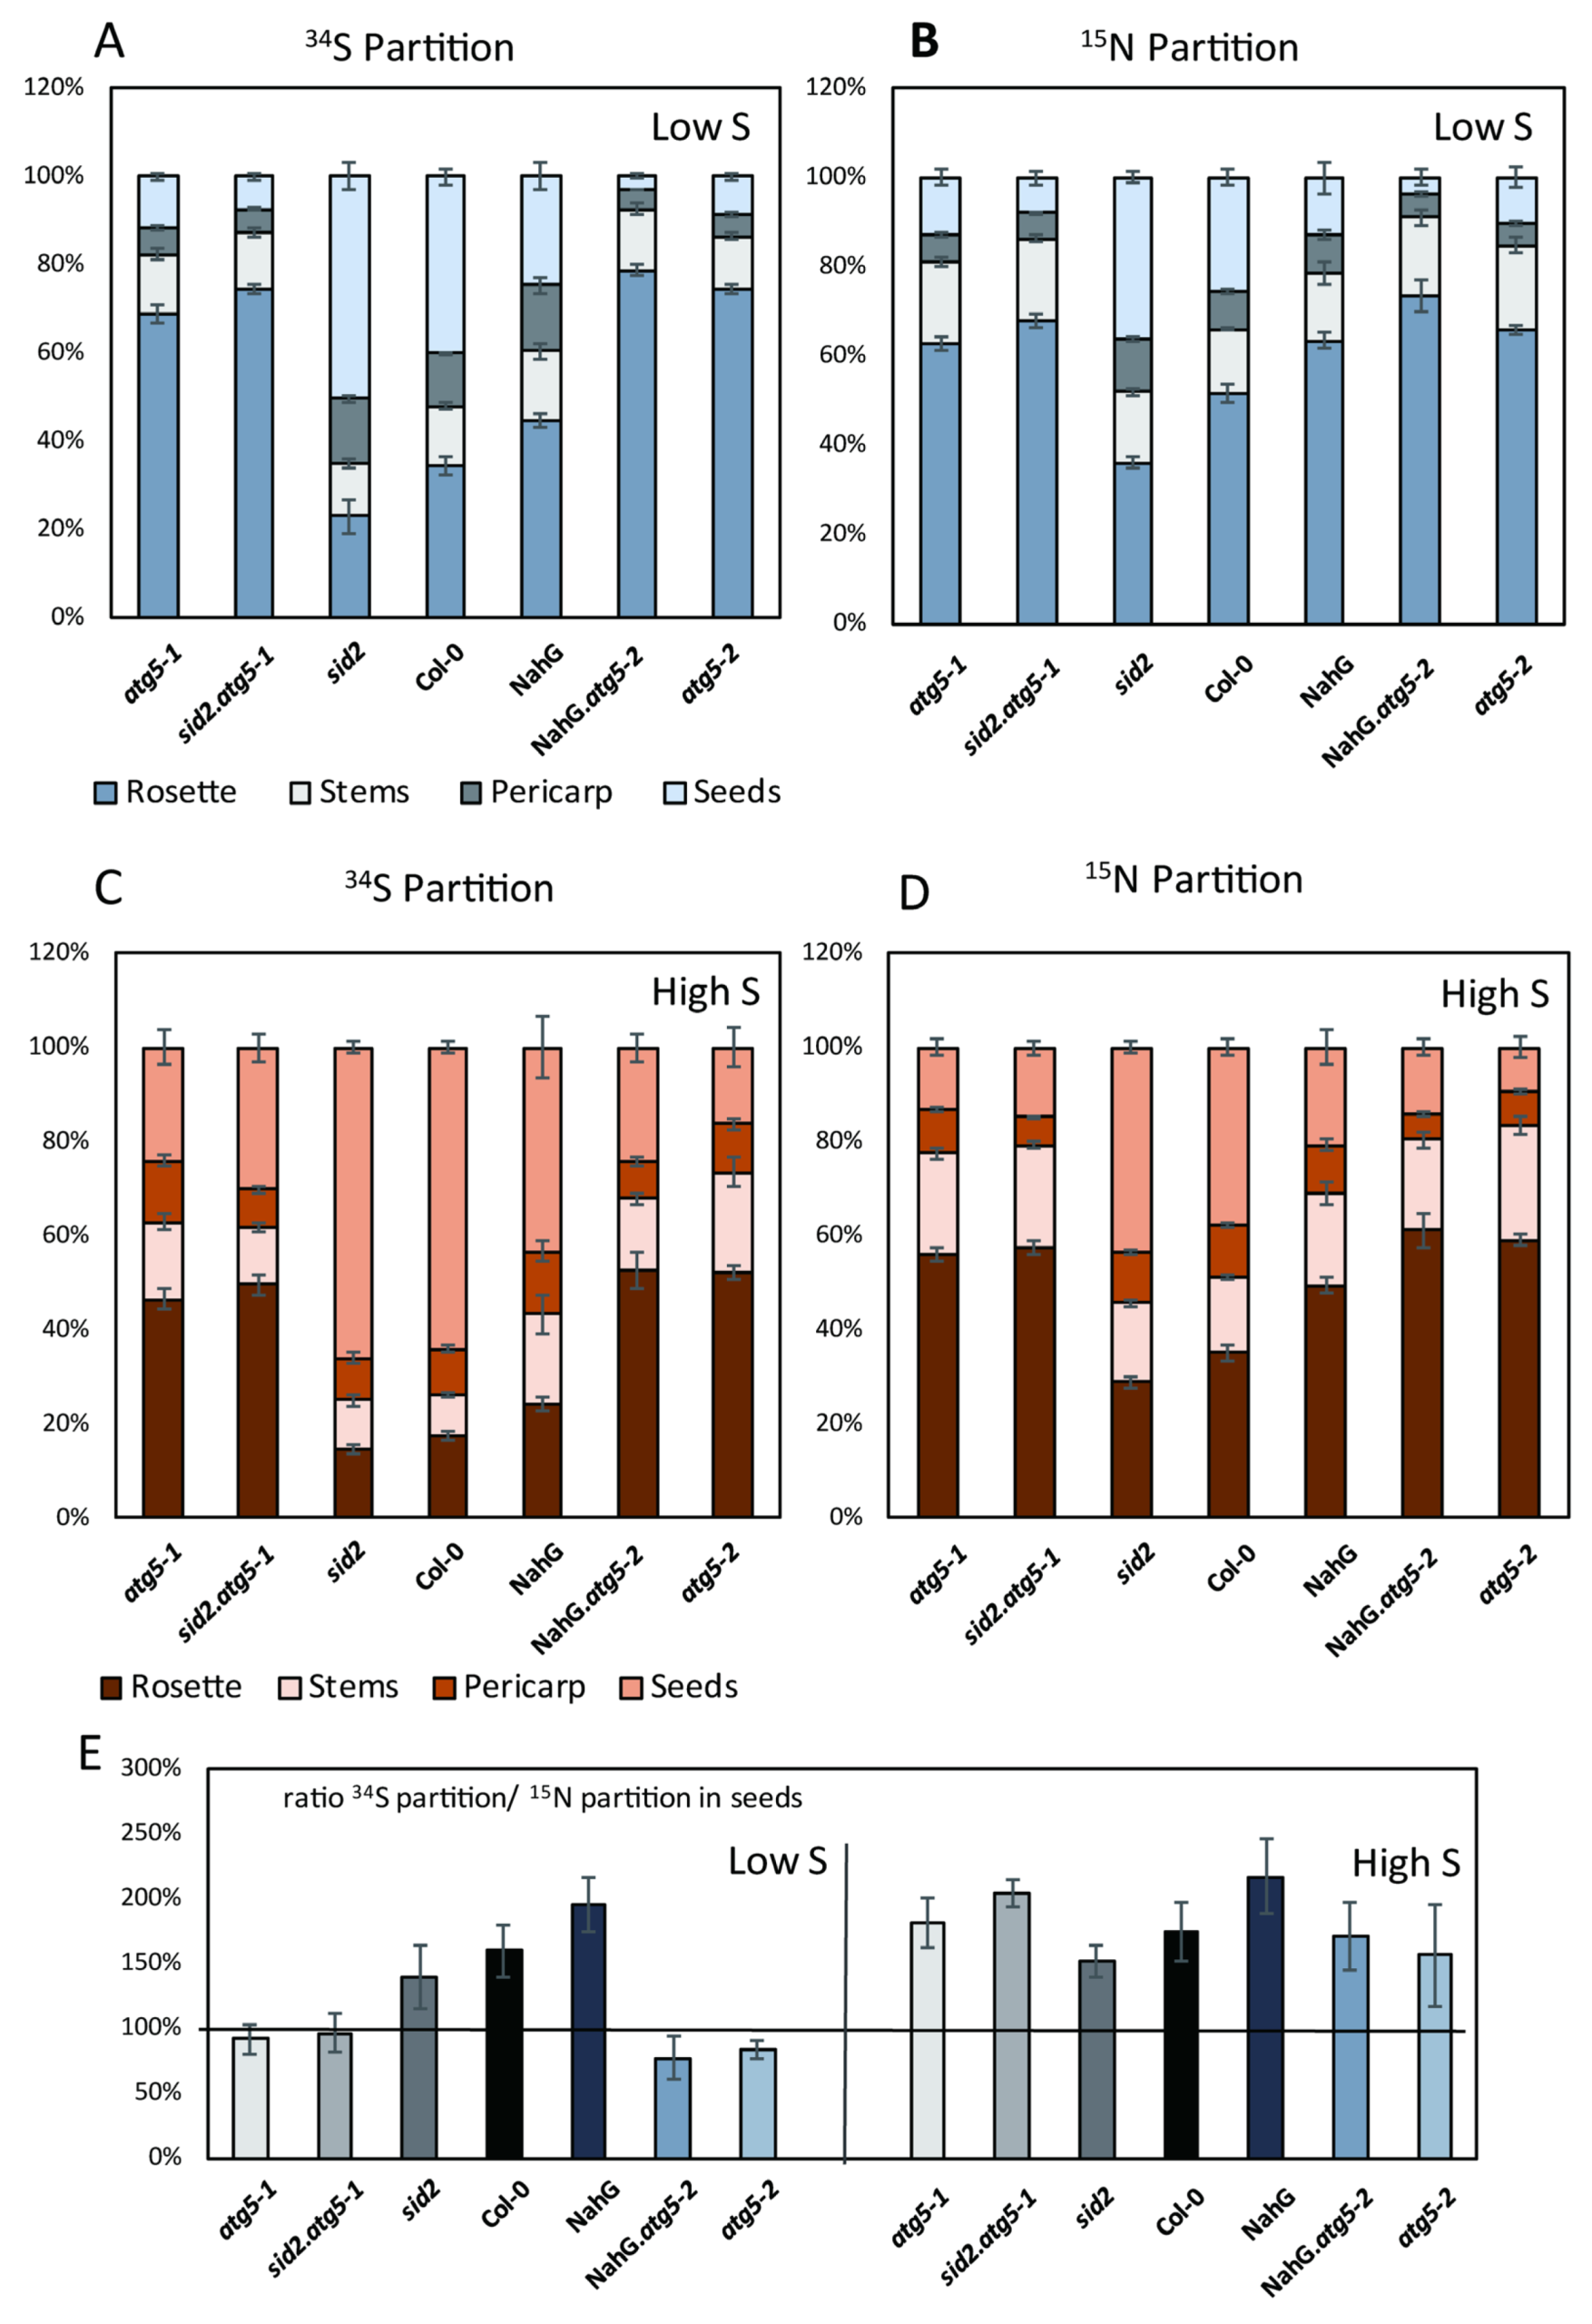
3.4. Relative Rates of 34S and 15N Remobilizations Are Different in Control Lines and atg5 Mutants Under Low S Conditions
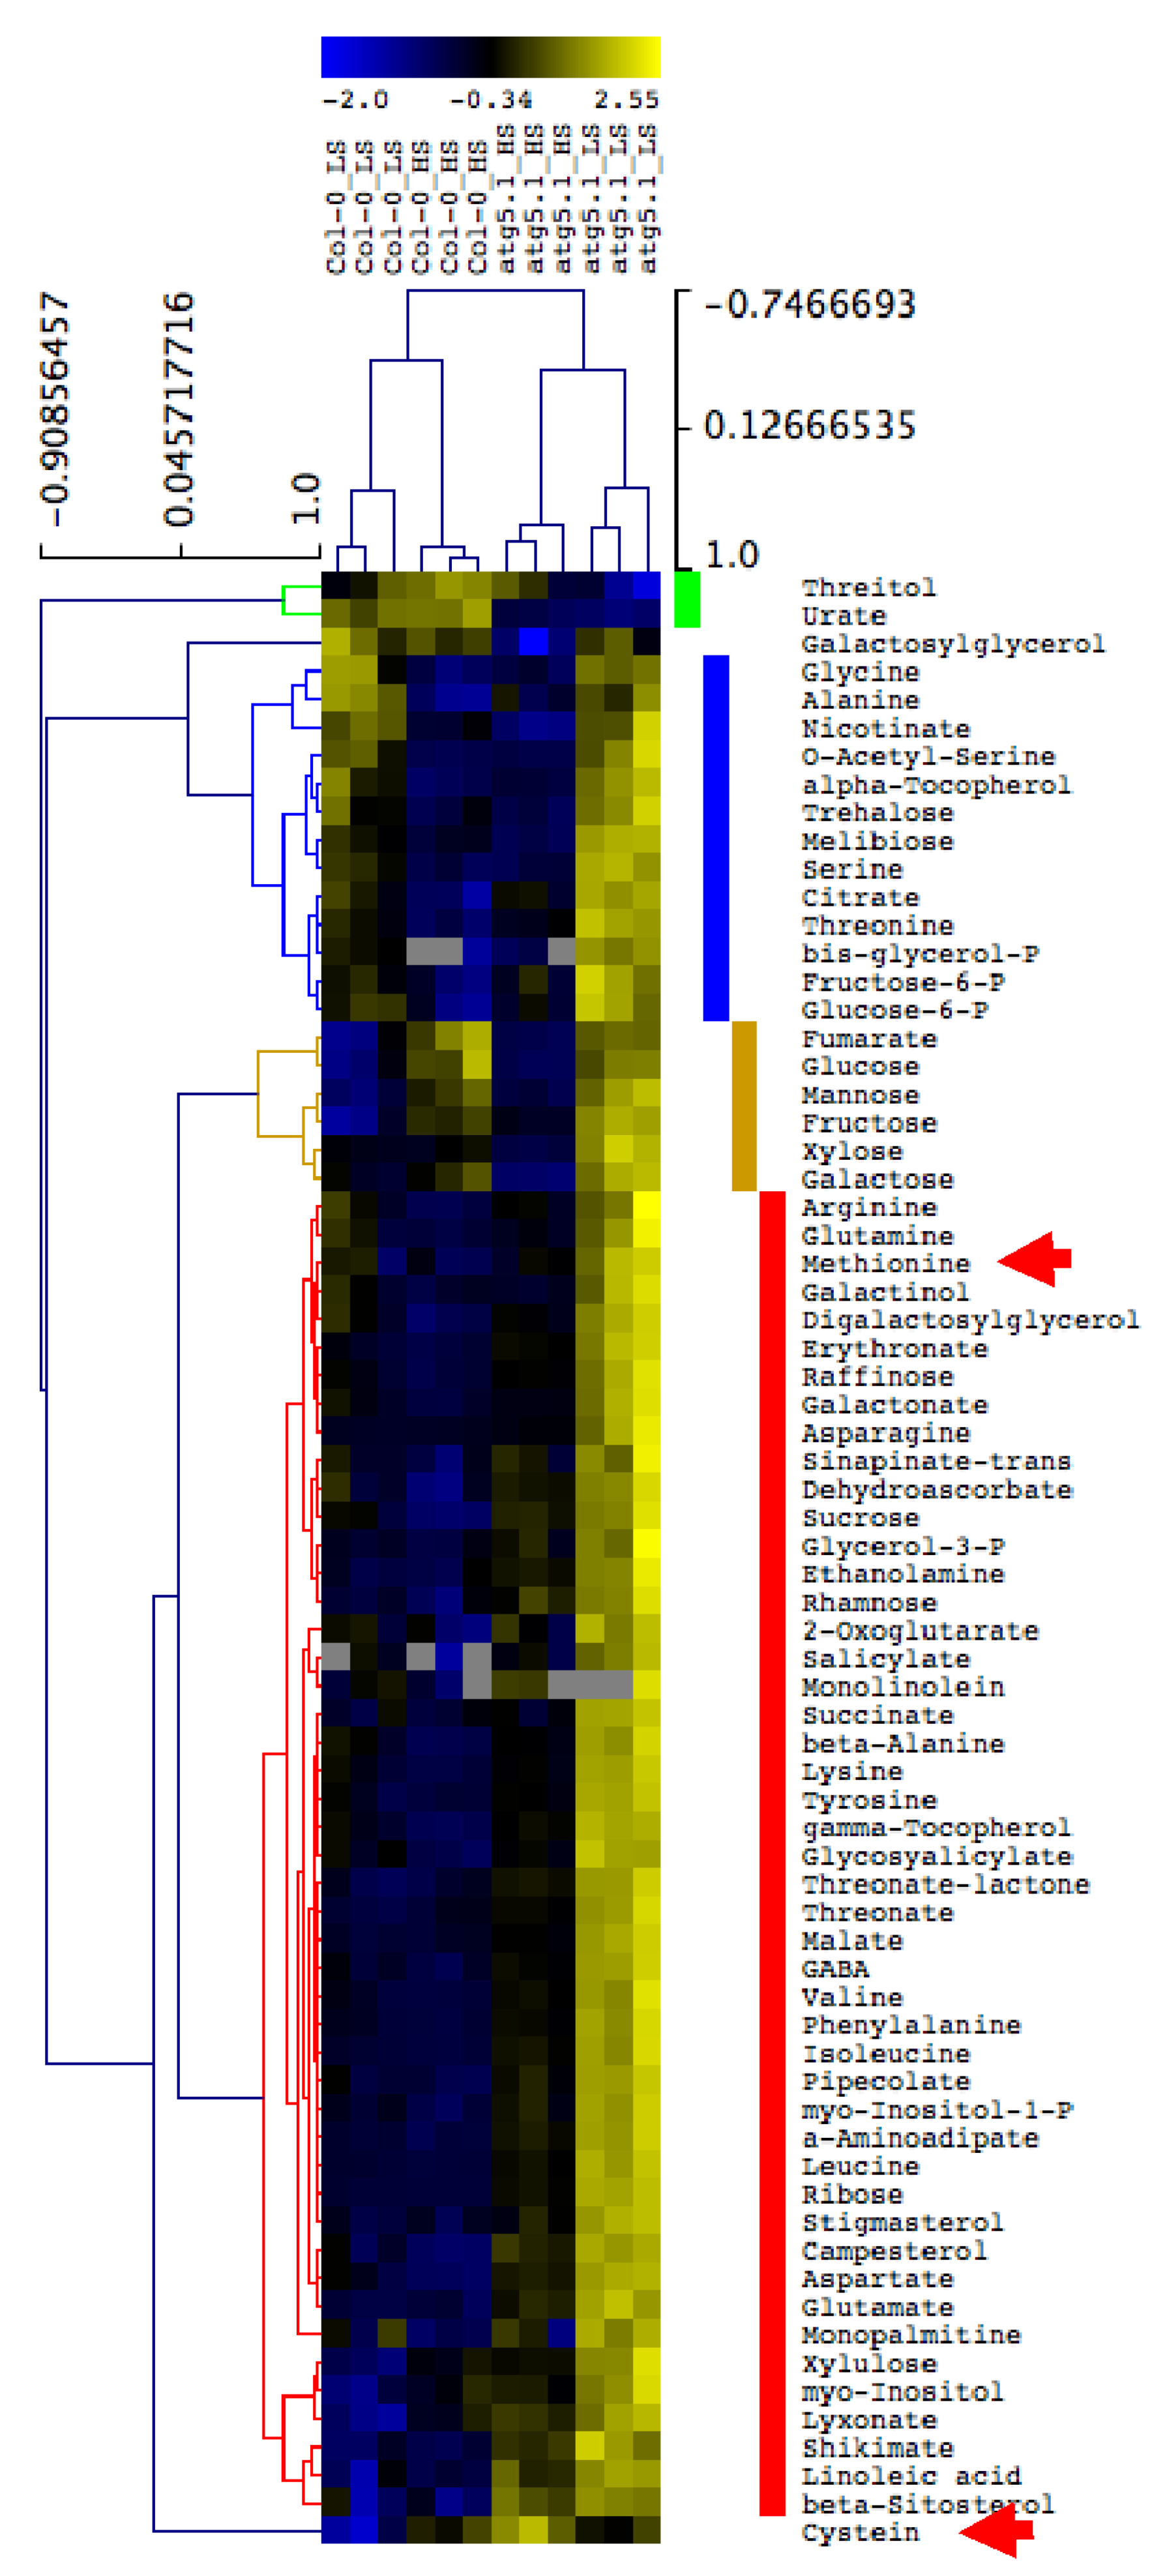
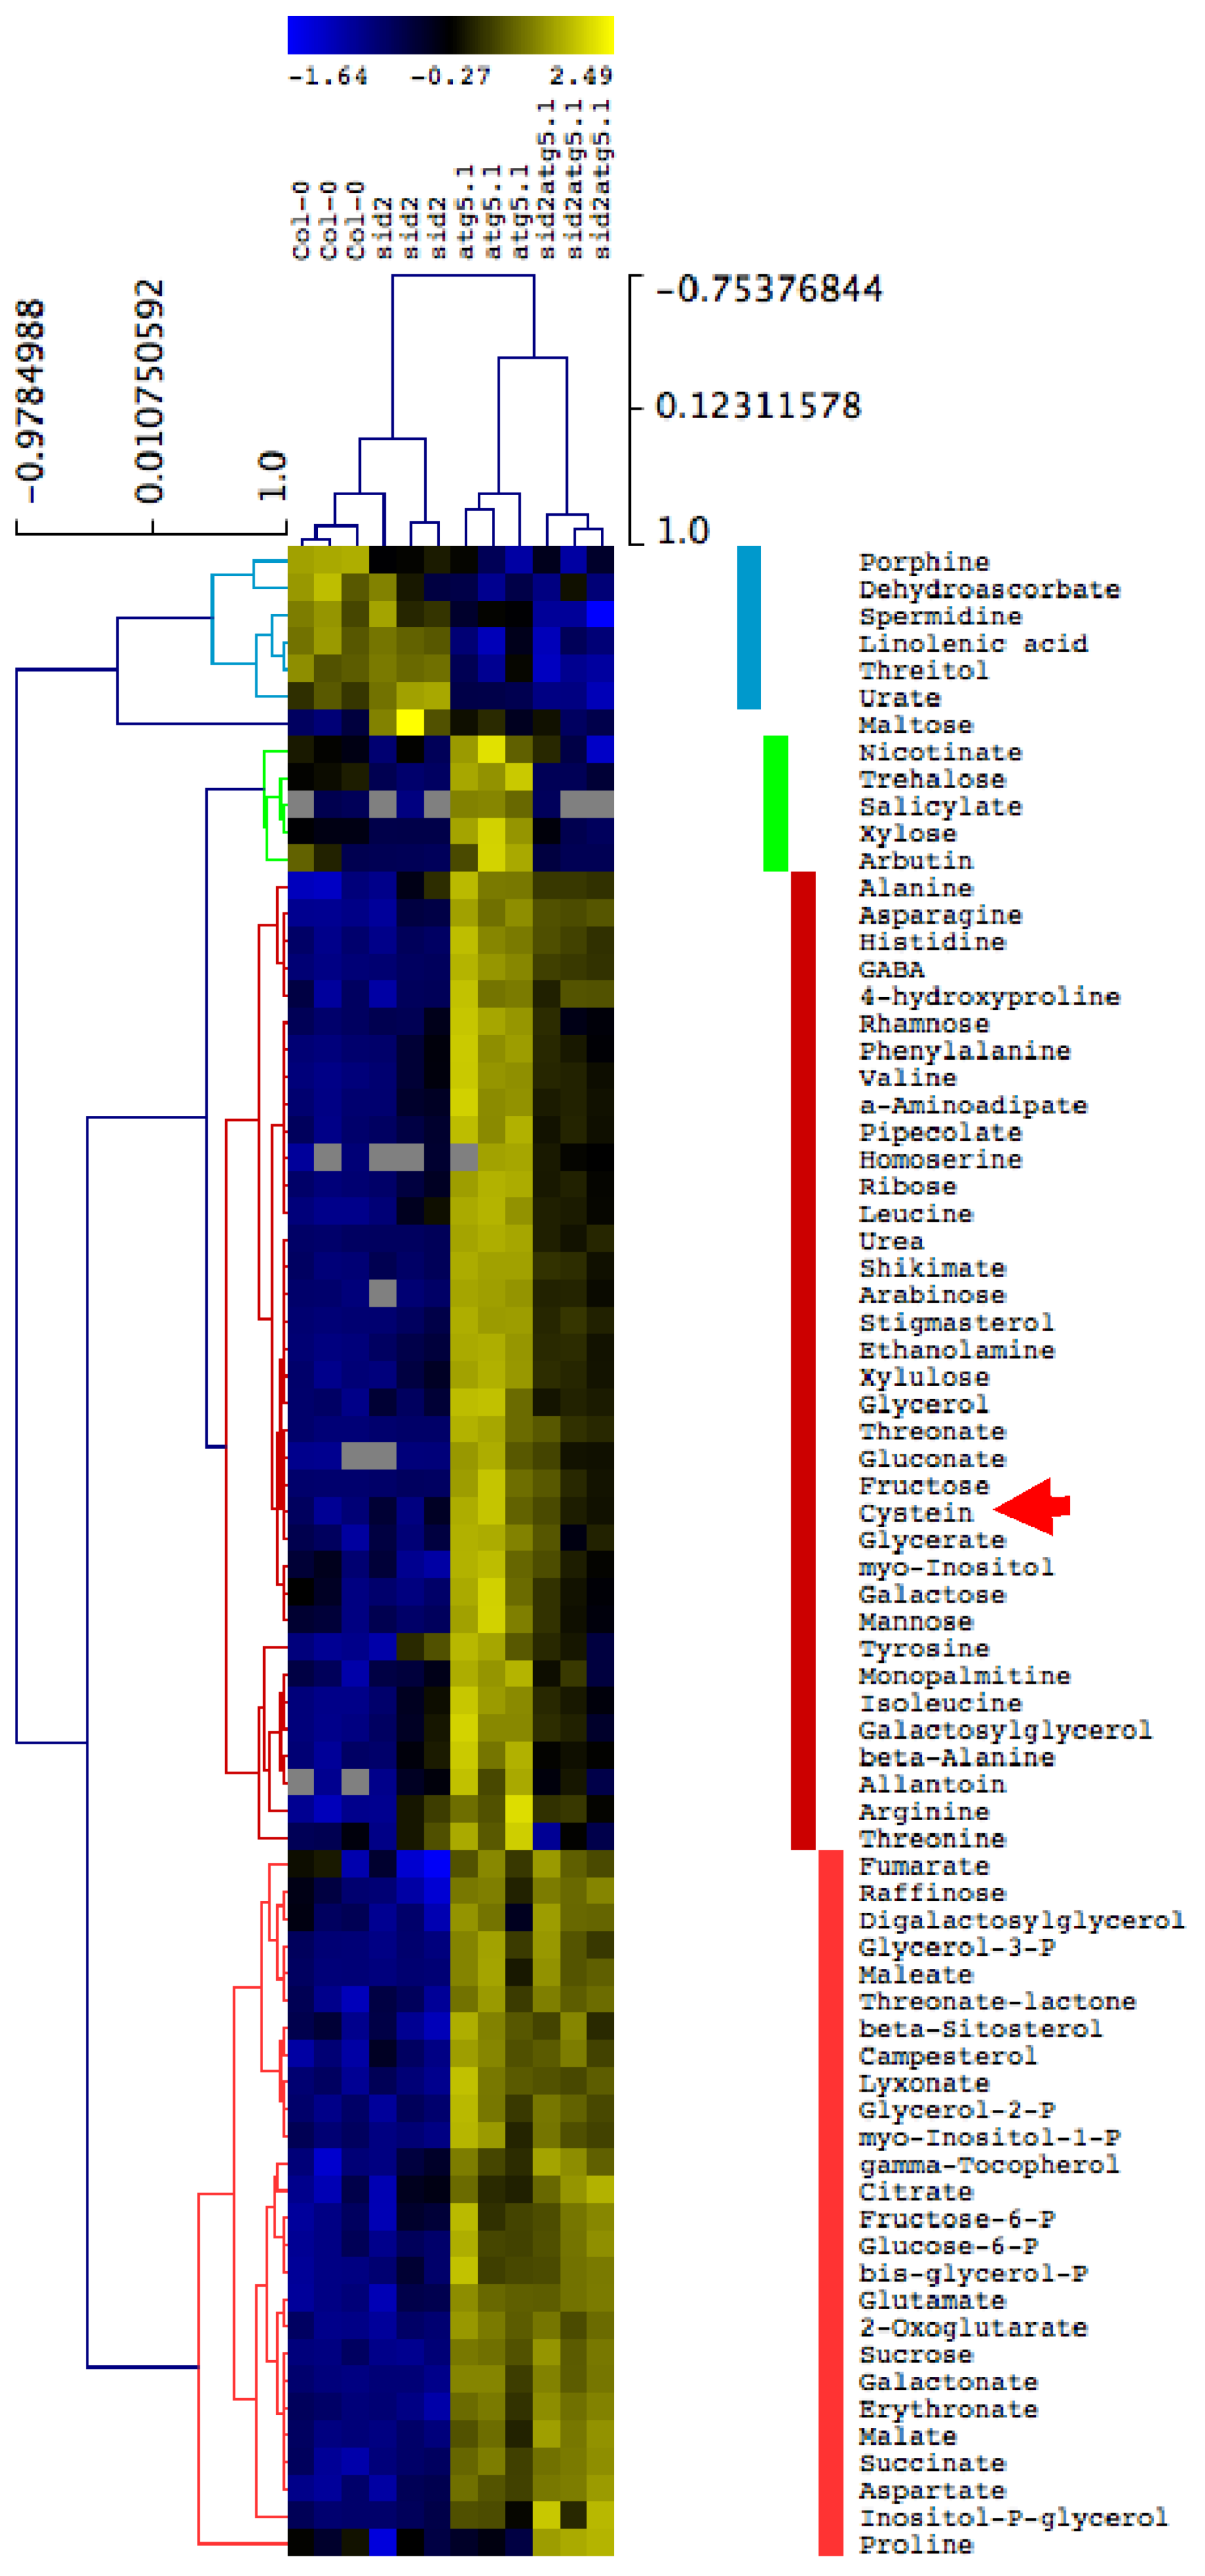
3.5. Metabolite Accumulation in the Rosette Leaves of atg5 Mutants Is Exacerbated under Low S Irrespective of Salicylic Acid Production
4. Discussion
Supplementary Materials
Author Contributions
Funding
Acknowledgments
Conflicts of Interest
References
- Liu, Y.; Bassham, D.C. Autophagy: Pathways for self-eating in plant cells. Annu. Rev. Plant Biol. 2012, 63, 215–237. [Google Scholar] [CrossRef] [PubMed] [Green Version]
- Avila-Ospina, L.; Moison, M.; Yoshimoto, K.; Masclaux-Daubresse, C. Autophagy, plant senescence, and nutrient recycling. J. Exp. Bot. 2014, 65, 3799–3811. [Google Scholar] [CrossRef] [PubMed] [Green Version]
- Chen, Q.; Shinozaki, D.; Luo, J.; Pottier, M.; Havé, M.; Marmagne, A.; Reisdorf-Cren, M.; Chardon, F.; Thomine, S.; Yoshimoto, K.; et al. Autophagy and nutrients management in plants. Cells 2019, 8, 1426. [Google Scholar] [CrossRef] [PubMed] [Green Version]
- Li, F.; Chung, T.; Pennington, J.G.; Federico, M.L.; Kaeppler, H.F.; Kaeppler, S.M.; Otegui, M.S.; Vierstra, R.D. Autophagic recycling plays a central role in maize nitrogen remobilization. Plant Cell 2015, 27, 1389–1408. [Google Scholar] [CrossRef] [Green Version]
- Guiboileau, A.; Yoshimoto, K.; Soulay, F.; Bataillé, M.; Avice, J.; Masclaux-Daubresse, C. Autophagy machinery controls nitrogen remobilization at the whole-plant level under both limiting and ample nitrate conditions in Arabidopsis. New Phytol. 2012, 194, 732–740. [Google Scholar] [CrossRef]
- Chen, Q.; Soulay, F.; Saudemont, J.; Elmayan, T.; Marmagne, A.; Masclaux-Daubresse, C. Overexpression of ATG8 in Arabidopsis stimulates autophagic activity and increases nitrogen remobilization efficiency and grain filling. Plant Cell Physiol. 2019, 60, 343–352. [Google Scholar] [CrossRef]
- Yang, X.; Bassham, D.C. New insight into the mechanism and function of autophagy in plant cells. In International Review of Cell and Molecular Biology; Jeon, K.W., Ed.; Academic Press Elsevier Inc.: Cambridge, MA, USA, 2015; Volume 320, pp. 1–40. [Google Scholar]
- Guiboileau, A.; Avila-Ospina, L.; Yoshimoto, K.; Soulay, F.; Azzopardi, M.; Marmagne, A.; Lothier, J.; Masclaux-Daubresse, C. Physiological and metabolic consequences of autophagy defisciency for the management of nitrogen and protein resources in Arabidopsis leaves depending on nitrate availability. New Phytol. 2013, 199, 683–694. [Google Scholar] [CrossRef]
- Minina, E.A.; Moschou, P.N.; Vetukuri, R.R.; Sanchez-Vera, V.; Cardoso, C.; Liu, Q.S.; Elander, P.H.; Dalman, K.; Beganovic, M.; Yilmaz, J.L.; et al. Transcriptional stimulation of rate-limiting components of the autophagic pathway improves plant fitness. J. Exp. Bot. 2018, 69, 1415–1432. [Google Scholar] [CrossRef]
- Pottier, M.; Dumont, J.; Masclaux-Daubresse, C.; Thomine, S. Autophagy is essential for optimal translocation of iron to seeds in Arabidopsis. J. Exp. Bot. 2019, 70, 859–869. [Google Scholar] [CrossRef] [Green Version]
- Shinozaki, D.; Merkulova, E.A.; Naya, L.; Horie, T.; Ohsumi, Y.; Masclaux-Daubresse, C.; Yoshimoto, K. Autophagy maintains Zn pools to avoid Unfavorable ROS production via a photosynthesis-dependent reaction under Zn deficiency in Arabidopsis. Plant Physiol. 2020, in press. [Google Scholar]
- Leustek, T.; Saito, K. Sulfate transport and assimilation in plants. Plant Physiol. 1999, 120, 637–643. [Google Scholar] [CrossRef] [PubMed] [Green Version]
- McNeill, A.M.; Eriksen, J.; Bergstrom, L.; Smith, K.A.; Marstorp, H.; Kirchmann, H.; Nilsson, I. Nitrogen and sulphur management: Challenges for organic sources in temperate agricultural systems. SOIL USE MANAGE. 2005, 21, 82–93. [Google Scholar] [CrossRef]
- McGrath, S.P.; Zhao, F.J. Sulphur uptake, yield responses and the interactions between nitrogen and sulphur in winter oilseed rape (Brassica napus). J. Agric. Sci. 1996, 126, 53–62. [Google Scholar] [CrossRef]
- Gironde, A.; Etienne, P.; Trouverie, J.; Bouchereau, A.; Le Caherec, F.; Leport, L.; Orsel, M.; Niogret, M.F.; Nesi, N.; Carole, D.; et al. The contrasting N management of two oilseed rape genotypes reveals the mechanisms of proteolysis associated with leaf N remobilization and the respective contributions of leaves and stems to N storage and remobilization during seed filling. BMC Plant Biol. 2015, 15. [Google Scholar] [CrossRef] [PubMed] [Green Version]
- Diaz, C.; Lemaitre, T.; Christ, A.; Azzopardi, M.; Kato, Y.; Sato, F.; Morot-Gaudry, J.-F.; Le Dily, F.; Masclaux-Daubresse, C. Nitrogen recycling and remobilization are differentially controlled by leaf senescence and development stage in Arabidopsis under low nitrogen nutrition. Plant Physiol. 2008, 147, 1437–1449. [Google Scholar] [CrossRef] [PubMed] [Green Version]
- Masclaux-Daubresse, C.; Clément, G.; Anne, P.; Routaboul, J.; Guiboileau, A.; Soulay, F.; Shirasu, K.; Yoshimoto, K. Stitching together the multiple dimensions of autophagy using metabolomic and transcriptomic analyses reveals new impacts of autophagy defects on metabolism, development and plant response to environment. Plant Cell 2014, 26, 1857–1877. [Google Scholar] [CrossRef] [Green Version]
- Akmouche, Y.; Cheneby, J.; Lamboeuf, M.; Elie, N.; Laperche, A.; Bertheloot, J.; D’Hooghe, P.; Trouverie, J.; Avice, J.C.; Etienne, P.; et al. Do nitrogen- and sulphur-remobilization-related parameters measured at the onset of the reproductive stage provide early indicators to adjust N and S fertilization in oilseed rape (Brassica napus L.) grown under N- and/or S-limiting supplies? Planta 2019, 250, 2047–2062. [Google Scholar] [CrossRef]
- Di Berardino, J.; Marmagne, A.; Berger, A.; Yoshimoto, K.; Cueff, G.; Chardon, F.; Masclaux-Daubresse, C.; Reisdorf-Cren, M. Autophagy Controls Resource Allocations and Protein Storage Accumulation in Arabidopsis Seeds. J. Exp. Bot. 2018, 69, 1403–1414. [Google Scholar] [CrossRef] [Green Version]
- Gaudin, Z.; Cerveau, D.; Marnet, N.; Bouchereau, A.; Delavault, P.; Simier, P.; Pouyreau, J.-B. Robust method for investigating nitrogen metabolism of N-15 labeled amino acids using accq center dot tag ultra performance liquid chromatography-photodiode array-electrospray ionization-mass spectrometry: Application to a parasitic plant-plant interaction. Anal. Chem. 2014, 86, 1138–1145. [Google Scholar] [CrossRef]
- Havé, M.; Luo, J.; Tellier, F.; Balliau, T.; Cueff, G.; Chardon, F.; Zivy, M.; Rajjou, L.; Cacas, J.-L.; Masclaux-Daubresse, C. Proteomic and lipidomic analyses of the Arabidopsis atg5 autophagy mutant reveal major changes in ER and peroxisome metabolisms and in lipid composition. New Phytol. 2019, 223, 1461–1477. [Google Scholar] [CrossRef]
- Fan, J.; Yu, L.; Xu, C.G. Dual role of autophagy in lipid metabolism in Arabidopsis. Plant Cell 2019, 31, 1598–1613. [Google Scholar] [CrossRef] [PubMed] [Green Version]


© 2020 by the authors. Licensee MDPI, Basel, Switzerland. This article is an open access article distributed under the terms and conditions of the Creative Commons Attribution (CC BY) license (http://creativecommons.org/licenses/by/4.0/).
Share and Cite
Lornac, A.; Havé, M.; Chardon, F.; Soulay, F.; Clément, G.; Avice, J.-C.; Masclaux-Daubresse, C. Autophagy Controls Sulphur Metabolism in the Rosette Leaves of Arabidopsis and Facilitates S Remobilization to the Seeds. Cells 2020, 9, 332. https://0-doi-org.brum.beds.ac.uk/10.3390/cells9020332
Lornac A, Havé M, Chardon F, Soulay F, Clément G, Avice J-C, Masclaux-Daubresse C. Autophagy Controls Sulphur Metabolism in the Rosette Leaves of Arabidopsis and Facilitates S Remobilization to the Seeds. Cells. 2020; 9(2):332. https://0-doi-org.brum.beds.ac.uk/10.3390/cells9020332
Chicago/Turabian StyleLornac, Aurélia, Marien Havé, Fabien Chardon, Fabienne Soulay, Gilles Clément, Jean-Christophe Avice, and Céline Masclaux-Daubresse. 2020. "Autophagy Controls Sulphur Metabolism in the Rosette Leaves of Arabidopsis and Facilitates S Remobilization to the Seeds" Cells 9, no. 2: 332. https://0-doi-org.brum.beds.ac.uk/10.3390/cells9020332