Article

Stress Reshapes the Physiological Response of Halophile Fungi to Salinity

by
Yordanis Pérez-Llano
1,
Eya Caridad Rodríguez-Pupo
1,
Irina S. Druzhinina
2,3,
Komal Chenthamara
2,
Feng Cai
2,3,
Nina Gunde-Cimerman
4,
Polona Zalar
4,
Cene Gostinčar
4,
Rok Kostanjšek
4,
Jorge Luis Folch-Mallol
5,
Ramón Alberto Batista-García
1,* and
María del Rayo Sánchez-Carbente
5,*
1
Center of Research on Cell Dynamics, Autonomous University of the State of Morelos, Morelos 62210, Mexico
2
Institute of Chemical, Environmental and Bioscience Engineering (ICEBE), TU Wien, 1060 Vienna, Austria
3
Fungal Genomics Group, Nanjing Agricultural University, Nanjing 210095, China
4
Department of Biology, Biotechnical Faculty, University of Ljubljana, SI-1000 Ljubljana, Slovenia
5
Laboratory of Molecular Biology of Fungi, Center for Research on Biotechnology, Autonomous University of the State of Morelos, Morelos 62210, Mexico
*
Authors to whom correspondence should be addressed.
Submission received: 14 January 2020 / Revised: 12 February 2020 / Accepted: 19 February 2020 / Published: 25 February 2020
(This article belongs to the Section Plant, Algae and Fungi Cell Biology)

Abstract

:
(1) Background: Mechanisms of cellular and molecular adaptation of fungi to salinity have been commonly drawn from halotolerant strains and few studies in basidiomycete fungi. These studies have been conducted in settings where cells are subjected to stress, either hypo- or hyperosmotic, which can be a confounding factor in describing physiological mechanisms related to salinity. (2) Methods: We have studied transcriptomic changes in Aspergillus sydowii, a halophilic species, when growing in three different salinity conditions (No NaCl, 0.5 M, and 2.0 M NaCl). (3) Results: In this fungus, major physiological modifications occur under high salinity (2.0 M NaCl) and not when cultured under optimal conditions (0.5 M NaCl), suggesting that most of the mechanisms described for halophilic growth are a consequence of saline stress response and not an adaptation to saline conditions. Cell wall modifications occur exclusively at extreme salinity, with an increase in cell wall thickness and lamellar structure, which seem to involve a decrease in chitin content and an augmented content of alfa and beta-glucans. Additionally, three hydrophobin genes were differentially expressed under hypo- or hyperosmotic stress but not when the fungus grows optimally. Regarding compatible solutes, glycerol is the main compound accumulated in salt stress conditions, whereas trehalose is accumulated in the absence of salt. (4) Conclusions: Physiological responses to salinity vary greatly between optimal and high salt concentrations and are not a simple graded effect as the salt concentration increases. Our results highlight the influence of stress in reshaping the response of extremophiles to environmental challenges.

Graphical Abstract

1. Introduction

Ubiquitous filamentous fungus Aspergillus sydowii is mainly known as a pathogen of corals, which causes tissue lesions and darkening by melanization [1,2,3]. Additionally, this species can be found in hypersaline habitats, such as waters of the salterns [4,5] and dried foods [6]. However, it has been also isolated from various terrestrial niches, such as soil from near-Arctic to tropical regions [2,7,8] and decaying plant matter [9]. Interestingly, terrestrial isolates were consistently not pathogenic for corals, indicating a distinct ecotype, although genetic and metabolic signatures used so far did not confirm this distinction [2,10].
A. sydowii strains have been studied for their biotechnological potential as producers of secondary metabolites [11] and plant biomass-degrading enzymes [8,12,13]. A recent transcriptomic analysis of an A. sydowii isolate from Antarctic microalgae showed its ability to produce lignin-degrading enzymes and to grow on lignin as the sole carbon source [7].
We isolated a halophilic strain of A. sydowii in the search for a fungal model with two distinctive characteristics: the ability to grow in high salinity (up to 2.0 M NaCl) and the capacity to degrade plant biomass under these conditions. Due to its extremotolerant ecology and biotechnological potential, A. sydowii emerged as a prospective fungal model for the analysis of molecular adaptations to saline conditions. In fungi, these adaptations differ in many ways from adaptations of bacteria and archaea and have been described more extensively in Basidiomycota yeast and filamentous fungi [14], although some studies have also been conducted in filamentous Ascomycota, such as other Aspergilli [15,16,17,18]. The study aimed to identify, using transcriptomics, the mechanisms that mediate the halotolerance of A. sydowii at both optimal and extreme salinity. To date, this important distinction has not received sufficient attention, either in fungi or in prokaryotes [19]. Using the genome-wide transcriptomic approach, we have been able to delineate the osmoprotective strategies of a halophile in optimal growth conditions from responses triggered by osmotic stress.

2. Materials and Methods

2.1. Strain and Culture Conditions

The strain Aspergillus sydowii BMH-0004 was isolated at the Laboratory of Molecular Biology of Fungi at the Center for Research on Biotechnology (CEIB), Autonomous University of the State of Morelos (UAEM), Cuernavaca, Mor, Mexico. It was isolated from sugarcane bagasse and initially described by Batista-García et al., (2014) [20] as A. caesiellus H1. This strain was deposited in the Fungal Culture Collection of the CEIB (UAEM, Cuernavaca, Mexico) with reference number BMH-0004; in the Technological University Collection of Industrially relevant Microorganisms (TUCIM) (Vienna, Austria) with reference number 6524; and the Ex Culture Collection of the Infrastructural Centre Mycosmo (MRIC UL) (Ljubljana, Slovenia) with number EXF-12860.
To describe the morphology of the strain, the fungus was grown at 25 °C on malt extract agar (MEA), Czapek yeast extract agar (CYA), and creatine-sucrose agar (CREA) for 7 days. Additionally, the strain was grown at 30 and 37 °C on CYA and 25 °C on saline CYA (CYAS) with 5% NaCl. Colony diameter, color, texture, production of soluble pigments, and exudates were evaluated in all culture conditions. Conidia and conidiophores were visualized for colonies grown at 25 °C on MEA.
For RNA extraction, the strain was cultivated on a semi-solid fermentation of autoclaved (121 °C for 15 min) wheat straw. Three plugs of fresh mycelium grown on PDA without NaCl were inoculated onto 3.0 g of wheat straw soaked with thirty milliliters of Voegel’s medium (without NaCl (No NaCl) and with 0.5 M NaCl or 2.0 M NaCl) in 25.0-cm petri dishes and cultured for 7 days at 28 °C without agitation. For the relative quantification of selected genes by qPCR, an additional group cultured with 1.0 M NaCl in the medium was also considered. The mycelium was collected by adding 15 mL of diethyl-pyrocarbonate (DEPC)-treated water to recover the biomass from the petri dishes and vortexed in sterile conical tubes. This procedure was repeated three times, and the resulting washing liquid was centrifuged to obtain a pellet of cells. Triplicate cultures were obtained for RNA extraction and transcriptome profiling.

2.2. DNA Extraction, PCR Amplification, and Sequencing

Genomic DNA was extracted from PDA-grown mycelium using standard phenol:chloroform procedure. Primers for internal transcribed spacer (ITS) rDNA, RNA polymerase II second-largest subunit gene (rpb2), β-tubulin gene (benA), and calmodulin gene (cam) were used as recommended for classification of Aspergillus species [21], and PCR products were purified from 1% agarose gel using the GeneJET Gel Extraction kit (ThermoFisher Scientific, Waltham, MA, USA). Sanger sequencing of the amplicons was performed with the forward primers used for amplification, and the sequencing service was provided by Microsynth (Vienna, Austria).

2.3. Molecular Phylogeny

First, the sequences of ITS, rpb2, benA, and cam were submitted to a sequence similarity search by BLASTn against the NCBI nucleotide database. Most similar sequences and the corresponding published voucher DNA barcodes for the reference species [21] were retrieved. Sequences of A. multicolor NRRL 4775, A. nidulans NRRL 187, and A. caesiellus NRRL 5061 were chosen as outgroups (Supplementary Table S1). Multiple sequence alignments were created using the MUSCLE v3.8.425 [22] tool integrated into AliView [23]. Consecutively, a concatenated set of alignment was assembled using SEAVIEW [24] and realigned using MUSCLE in AliView. Where necessary, GBlocks [25] with less stringent conditions allowing smaller final blocks, gap position within the final blocks, and less strict flanking positions were used to remove ambiguous fragments (Supplementary Table S2). Maximum likelihood trees based on their specific best substitution model, as obtained using SMS, were created using PhyML tool (http://www.atgc-montpellier.fr/phyml-sms/) (Supplementary Figure S1). One thousand replicates were run to calculate bootstrap supports. Alternatively, the concatenated alignment with 88,625 nucleotides was subjected to Bayesian analysis using program MrBayes v3.2.5 [26] with an unconstrained GTR + I + G nucleotide substitution model applied to all loci. The chain was run for 3 million generations by applying two simultaneous, completely independent analyses starting from different random trees using three heated chains and one “cold” chain. Once the analyses were finished, 22,500 trees were summarized after discarding the first 25% of 30,000 trees generated, and a consensus tree was obtained. The trees were visualized and mid-point rooted using FigTree v1.4.22 (http://tree.bio.ed.ac.uk/software/figtree/). Further image improvement was performed in CorelDraw Graphics Suite X8 (Corel corporation, ON, Canada).

2.4. RNA Extraction, Library Construction, and Sequencing

Samples were ground with liquid nitrogen, and RNA purification was performed by the Tri-Reagent method (Sigma-Aldrich, San Louis, MO, USA). Libraries were constructed with the TruSeq Stranded mRNA HT kit (Illumina, San Diego, CA, USA), and sequencing was performed by the Mass Sequencing Unit of the Biotechnology Institute (UNAM, Cuernavaca, Mor, México) with a NextSeq 500 Sequencer (Illumina, San Diego, CA, USA) using 150 cycles of pair-end readings.

2.5. Transcriptome Assembly and Transcript Quantification

Sequence reads were filtered/trimmed by quality using FASTQC/Trimmomatic (cutoff: Q20), and de novo assembly was performed with Trinity [27]. The assembled transcriptome was mapped back to the A. sydowii genome for quality control purposes, which rendered a 90.4% overall similarity and approximately 73% coverage. Functional annotation of transcript sequences was achieved by BLAST against nr NCBI RefSeq and UniProt databases using Trinotate software [28]. Pfam, GO, and KOG term annotation, the prediction of signal peptide and transmembrane region (SignalP v4.1 [29]), were also performed. When considering membrane transporters, deducing the function of the protein from its sequence is often difficult. This is especially true for metal cation transporters, where substrate specificity and selectivity cannot be unambiguously predicted. To partially alleviate this problem, the Transporter Classification Database (TCDB: http://www.tcdb.org) was used to refine the annotations of transcripts belonging to transporter encoding genes of A. sydowii, and substrate specificity of DE transcripts was predicted using the TrSSP tool (http://bioinfo.noble.org/TrSSP/).
The mapping of reads to the assembled transcriptome was done by SMALT (http://www.sanger.ac.uk/science/tools/smalt-0). With this alignment, expression levels were quantified using Samtools [30]. Expression levels were reported in transcripts per million (TPM) [31,32], obtained by the RSEM program [33] using mappings obtained by Bowtie2 software [34]. Cumulative transcript expression values were obtained by adding the TPM values of transcripts mapped to functionally identified orthologous genes, and differences in cumulative expression between groups were assessed by two-way ANOVA with posterior Tukey’s multiple comparison test (α = 0.05).

2.6. Differential Transcript Expression Analysis

In order to perform the differential expression analysis, transcripts with a low number of read counts (CPM < 2) were filtered, aiming to increase the statistical strength of the prediction of differentially expressed transcripts [31]. As shown in Supplementary Figure S2a, the deletion of these transcripts allows the clustering (nonsupervised hierarchical clustering method) of sample profiles according to the treatment groups, indicating that it reduces the noise (i.e., variability that is not associated with biological conditions). Removal of these transcripts does not affect the genes identified, as differentially expressed (DE) (Supplementary Figure S2b). Based on this nonsupervised hierarchical clustering analysis, we removed a sample replicate belonging to the group 0.5 M NaCl from subsequent steps, as it is an outlier.
Expression data were normalized using the RUVseq algorithm [35] for the removal of variation between samples, and differential transcript expression analysis was performed using DESeq2 [36]. Transcripts with logFC > 2.0 and FDR < 0.05 were considered as differentially expressed (DE).
Gene ontology enrichment was determined by the over-representation analysis (ORA) method with a Fisher’s statistical test using the topGO package (https://bioconductor.org/). Pathway enrichment analysis was done using the BlastKOALA tool from KEGG database.

2.7. qPCR and Transcriptome Validation

For validation of RNA sequencing results, 1 µg of total RNA isolated as previously described from semi-solid wheat straw fermentation was treated with DNase I (Thermo Fisher Scientific, Waltham, MA, USA) and used for cDNA synthesis with the RevertAid First-Strand Synthesis kit (Thermo Fisher Scientific, Waltham, MA, USA) using oligo (dT) nucleotides. Two-step quantitative PCR (qPCR) reactions were carried out in a rotor-gene apparatus (Qiagen, Hilden, Germany). Each reaction contained 5 µL of QuantiNova SYBR Green PCR MasterMix and 1 µL of 1:8 dilution of cDNA as the template (total volume: 10 µL). The primers used for qPCR, their final concentration on the assay, and the annealing/extension temperature for each primer pair are listed in Supplementary Table S3. Internal standard genes for relative quantification (sarA and cox5) were selected according to a previous standardization for Aspergillus niger [37]. Relative expression of sih1, sih2, sih4, and AsHog1 genes was calculated as described by Pfaffl [38] using the REST software (2009, Qiagen, Hilden, Germany).

2.8. Electron Microscopy and TEM Image Analysis

Fungal tissues were embedded in agarose gel to facilitate fixation procedures, as described elsewhere [39]. Briefly, the samples were fixed for 24 h in 2.5% glutaraldehyde in 0.1 M phosphate buffer (pH = 7.4). NaCl was added to the fixative to maintain osmolarity. Samples were washed three times with 0.1 M phosphate buffer and decreasing NaCl concentrations to avoid the collapse of cell structure due to osmotic shock. After washing, samples were post-fixed in 1% aqueous solution of osmium tetroxide for 1 h at 4 °C and embedded in Agar 100 resin (Structure Probe, Inc Supplies, West Chester, PA, USA). Ultrathin sections were contrasted with 1% aqueous solution of uranyl acetate and saturated solution of lead citrate in 0.1 M NaOH prior to observation with a CM 100 transmission electron microscope (Philips, Eindhoven, The Netherlands). To assess the ultrastructural differences in the cell wall composition between cells grown in different conditions of salinity, 50 cell wall measurements were performed per group. All measurements were performed on perpendicular cross-sections of comparable-sized hyphae by using Digital Micrograph software v2.11 (Gatan Inc. Pleasanton, CA, USA) and statistically evaluated by Student’s t-test.

2.9. Quantification of Compatible Solutes

For the determination of glycerol and trehalose in salt-adapted cultures of A. sydowii, the fungus was cultured for 7 days at 150 rpm and 28 °C in 250 mL flasks containing 100 mL of Vogel’s medium (without NaCl (No NaCl) and with 0.5 M NaCl or 2.0 M NaCl) supplemented with 2% glucose as the carbon source. The mycelium was collected by filtration through a 40 μm cell strainer and dried in an oven at 60 °C. Compatible solute extraction for HPLC analysis (Waters 600, Milford, MA, USA) was performed as previously described with minor modifications [40]. Briefly, 100 mg of dried mycelium was suspended in 3680 μL of chloroform:methanol:water solution (10:5:3.4) and stirred vigorously for 30 min. After that, 433 μL of chloroform and 433 μL of demineralized water were added, and the suspension was incubated for 30 min with stirring. The samples were centrifuged at 5500× g for 10 min for phase separation. The upper methanol:water phase was transferred to a 15 mL falcon tube and stored at −20 °C. The HPLC analysis was performed in an isocratic system with an AMINEX-HPX87H column (Bio-Rad, Munich, Germany, 300 mm × 7.8 mm) at 50 °C. Fifty microliters of each sample were injected, and 5mM sulfuric acid was used as the mobile phase at a flow rate of 0.8 mL/min. Glycerol and trehalose standards with an initial concentration of 5 mg/mL were used to construct calibration curves. Chromatogram analysis was performed using ChromQuest software version 2.51 (Thermo de Quest, Thermo Fisher Scientific, Waltham, MA, USA).

2.10. Data Availability

Sequencing short read data and processed data were deposited to SRA database under accession number GSE139804, BioProject PRJNA587059. All scripts used for the analysis of high-throughput sequencing data are available from the authors upon request.

3. Results and Discussion

3.1. Identification of a Terrestrial Isolate of Aspergillus sydowii

The strain BMH-0004 was isolated from a sugarcane bagasse fermentation with 2.0 M NaCl and a posterior screening on a solid medium with carboxymethylcellulose at 0.5 M NaCl [20]. This strain was initially classified as Aspergillus caesiellus by a polyphasic identification based on: (i) molecular markers (ITS, SSU, and LSU); (ii) micromorphological traits of the colonies, such as shape, size, and grouping of conidiophores and hyphae; and (iii) macromorphological aspects, such as exudates and pigmentation. Although none of the listed molecular markers rendered a resolved phylogram, the authors identified the strain as A. caesiellus, primarily based on micromorphology.
Since the sequences of different parts of rRNA genes did not provide a clear classification of this fungus, additional DNA barcoding markers were used. Although ITS, SSU, and LSU are commonly utilized as primary fungal markers, within the Aspergillus genus, secondary markers are necessary to ascertain species level with higher confidence [21,41]. Therefore, benA, cam, and rpb2 phylogenetic markers were also amplified to aid with identification. The reconstructed phylogeny with these markers showed that strain BMH-0004 is closely related to A. sydowii, Aspergillus section Versicolores [42], and is relatively distant from A. caesiellus (Figure 1 and Supplementary Figure S1), which is a member of Aspergillus section Restricti [43]. In comparison to the A. sydowii type strain CBS 593.65, all obtained nucleotide sequences of the strain BMH-0004 were highly similar: 100% identity in benA and 99 % in cam and rpb2.
The morphology of this strain confirmed the characteristics of A. sydowii (Bain. and Sart.) Thom and Church [10]. It is mostly bluish-green and produces brown soluble exudates and brown soluble pigments when growing on CYA (Figure 2). Growth on other culture media used for Aspergillus identification is in accordance with A. sydowii. Additionally, microscopic parameters, like biseriate aspergilli, spathulate to subclavate vesicles measuring 10–20 μm, and cylindrical short neck phialides, 5–7 × 3 μm, as well as conspicuously spinose conidia of diameter 3–4 μm, are corresponding. The strain BMH-0004 could grow on solid and in liquid media without NaCl, but its optimal growth was detected when salinity ranged between 0.5 M and 1.0 M NaCl. The maximum tolerated salinity was 2.0 M NaCl when grown on glucose (unpublished data) and complex substrates (carboxymethylcellulose or wheat straw) [20].

3.2. Thriving and Enduring Require a Different Set of Adaptations

Most studies on halophile physiology have been conducted in settings where the cells are exposed to hyperosmotic stress [14]. Under such circumstances, the physiological responses can be largely influenced by cellular stress-protective mechanisms. Actually, the clustering of expression level profiles of the transcriptomic data (Supplementary Figure S2) showed that the A. sydowii transcriptomes of the fungus growing without NaCl or at 2.0 M NaCl (nonoptimal conditions) were more similar to each other than to the transcriptome at the optimum salinity (0.5 M NaCl). This suggests that the expression profile under nonoptimal conditions is driven by stress-related responses, which include a global upregulation of central catabolic and secondary metabolism transcripts and substrate-degrading enzymes (Figure 3). Salinity-related responses differed between both salinity conditions. Under optimal salinity (i.e., 0.5 M NaCl), the fungus increased the expression of cation transport systems, presumably to maintain cellular ionic balance, but no other salinity related GO was enriched in this condition. Additionally, the energy strategy of the cells shifted towards an increase of the transcripts coding for solute transporters and a reduction of the transcripts for substrate degradation enzymes (Figure 3). In the case of hyperosmotic stress, cation transport systems are not pivotal (and indeed, the number of differentially expressed genes decreased when compared to 0.5 M NaCl), as the main challenge was osmotic, and therefore, the fungus overexpressed several transcripts associated to the remodeling of the fungal cell wall. The seemingly different strategies to cope with salinity lead to the question of whether some of the mechanisms described for halophiles are a consequence of saline stress and may not occur under optimal saline conditions. The main salt-response mechanisms described in other microorganisms are present in A. sydowii, although some differences were observed as well, and are discussed below.

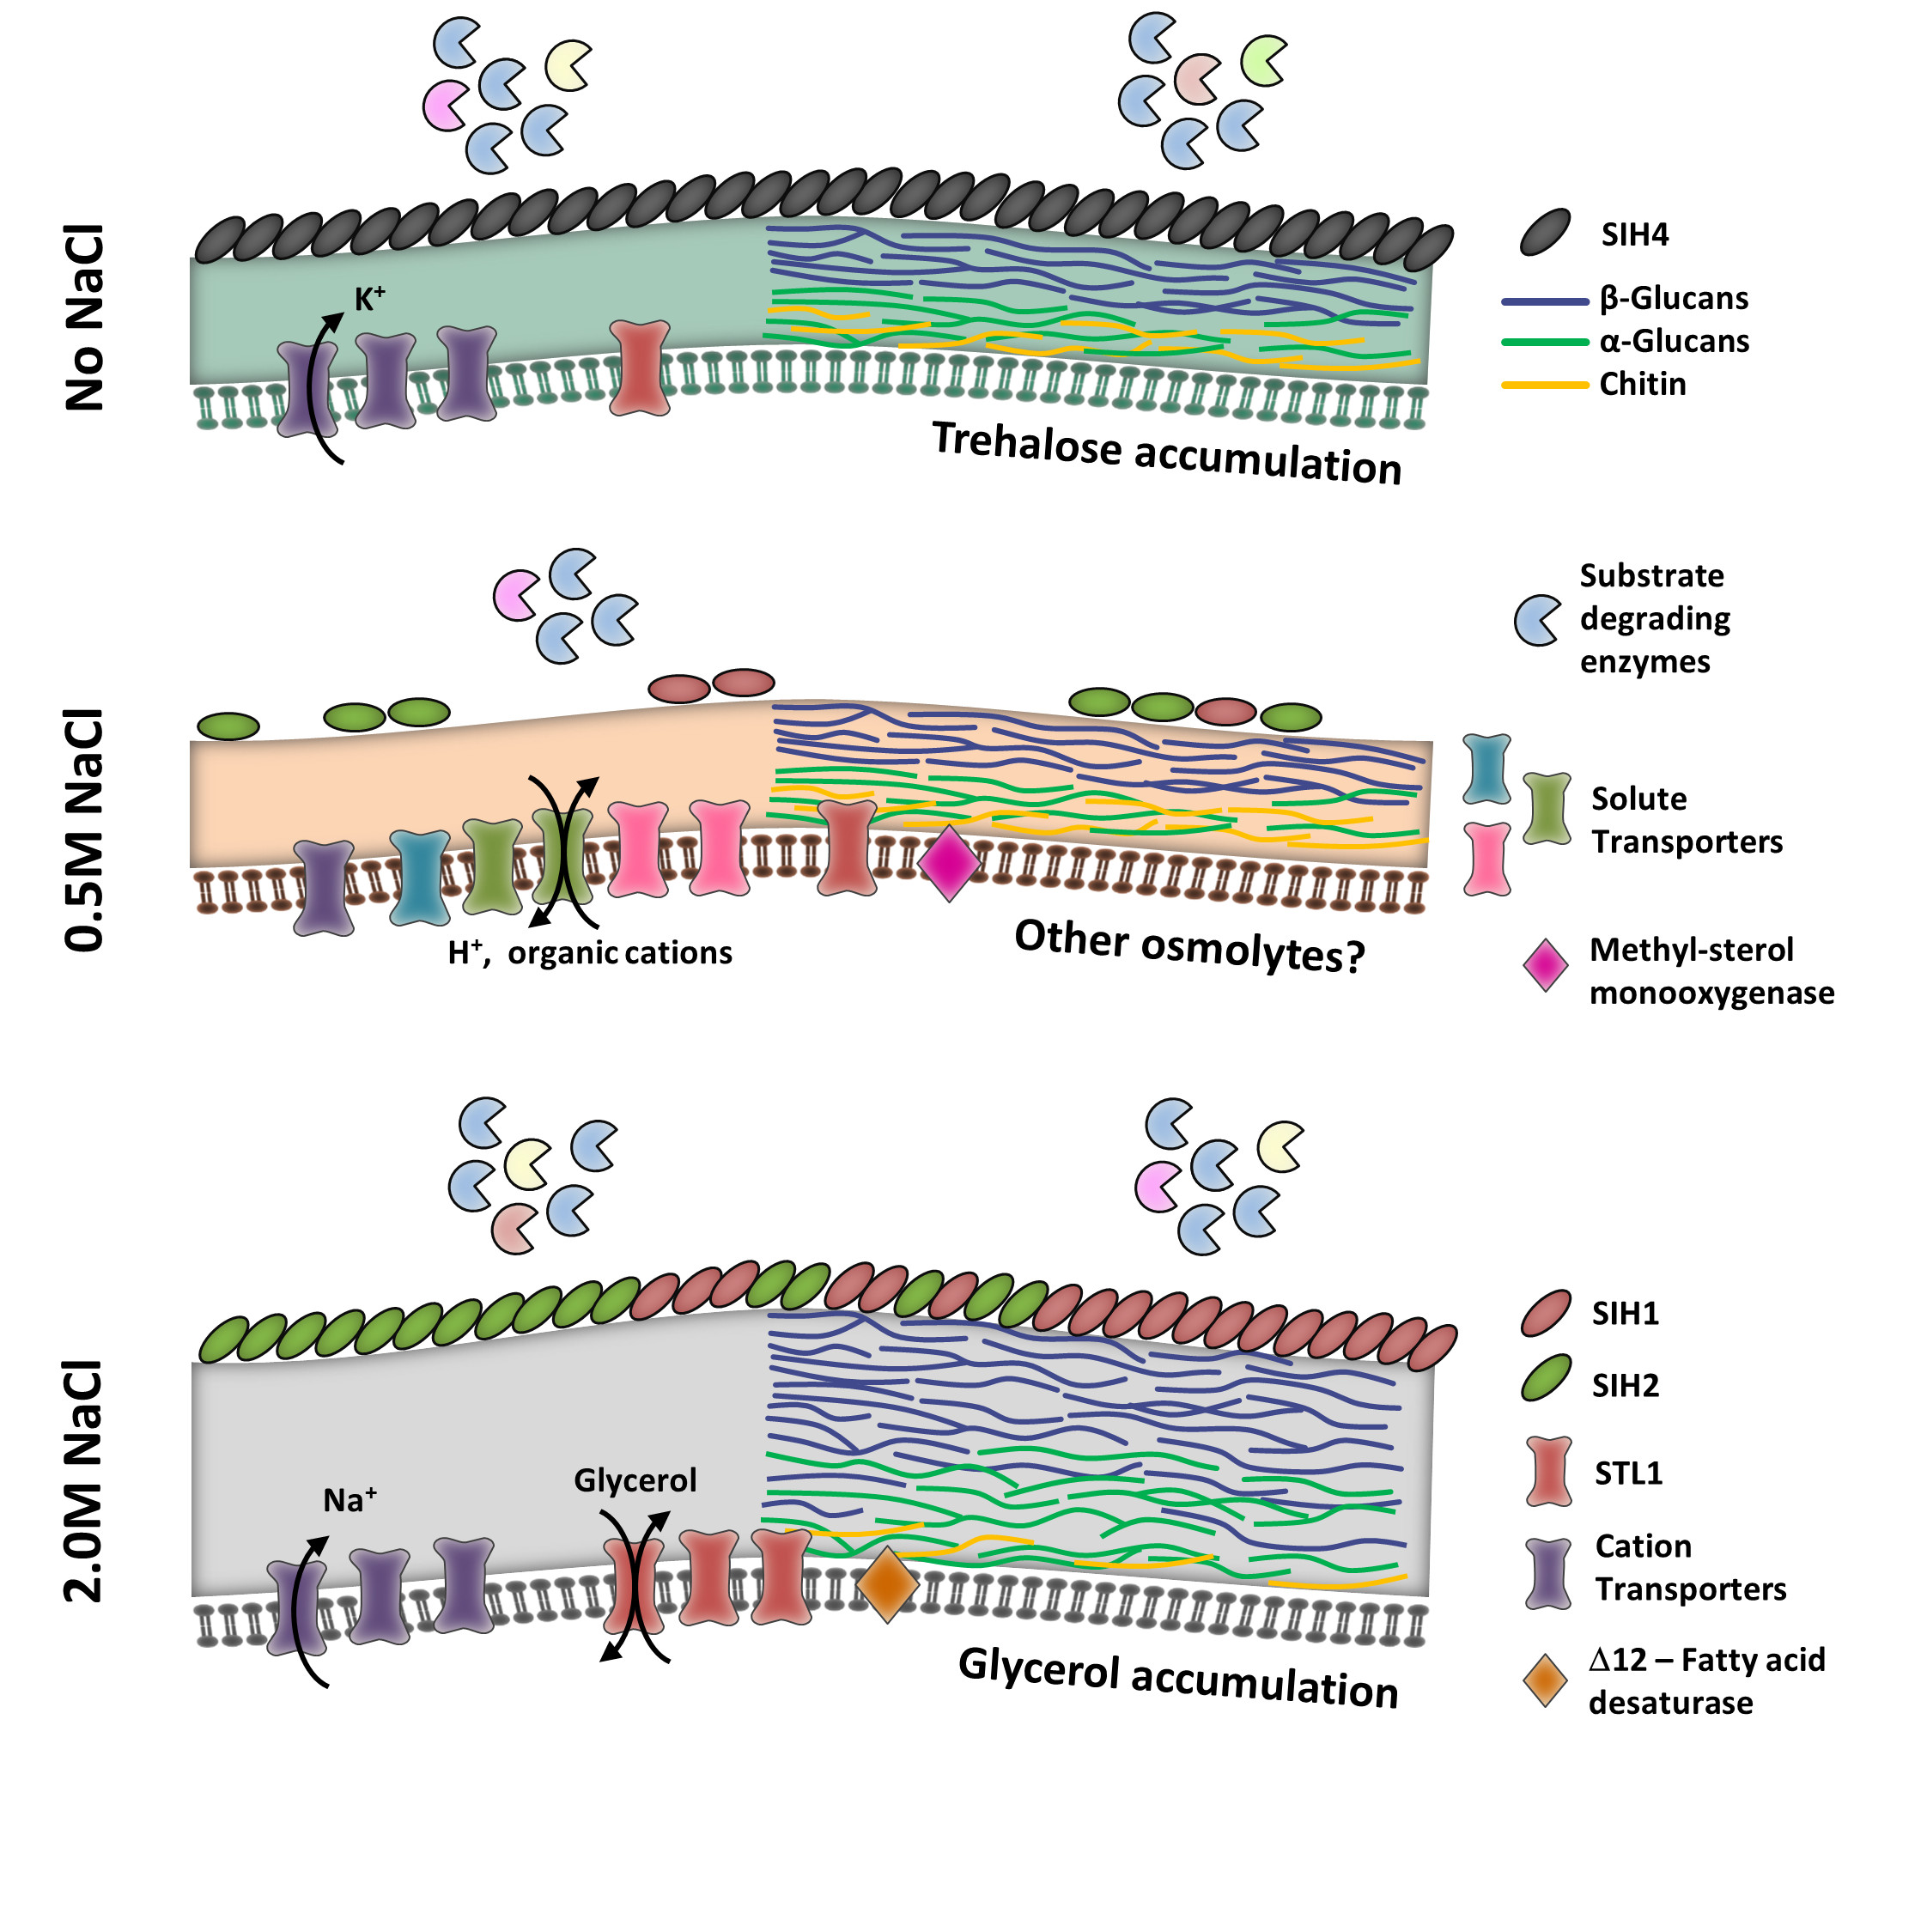
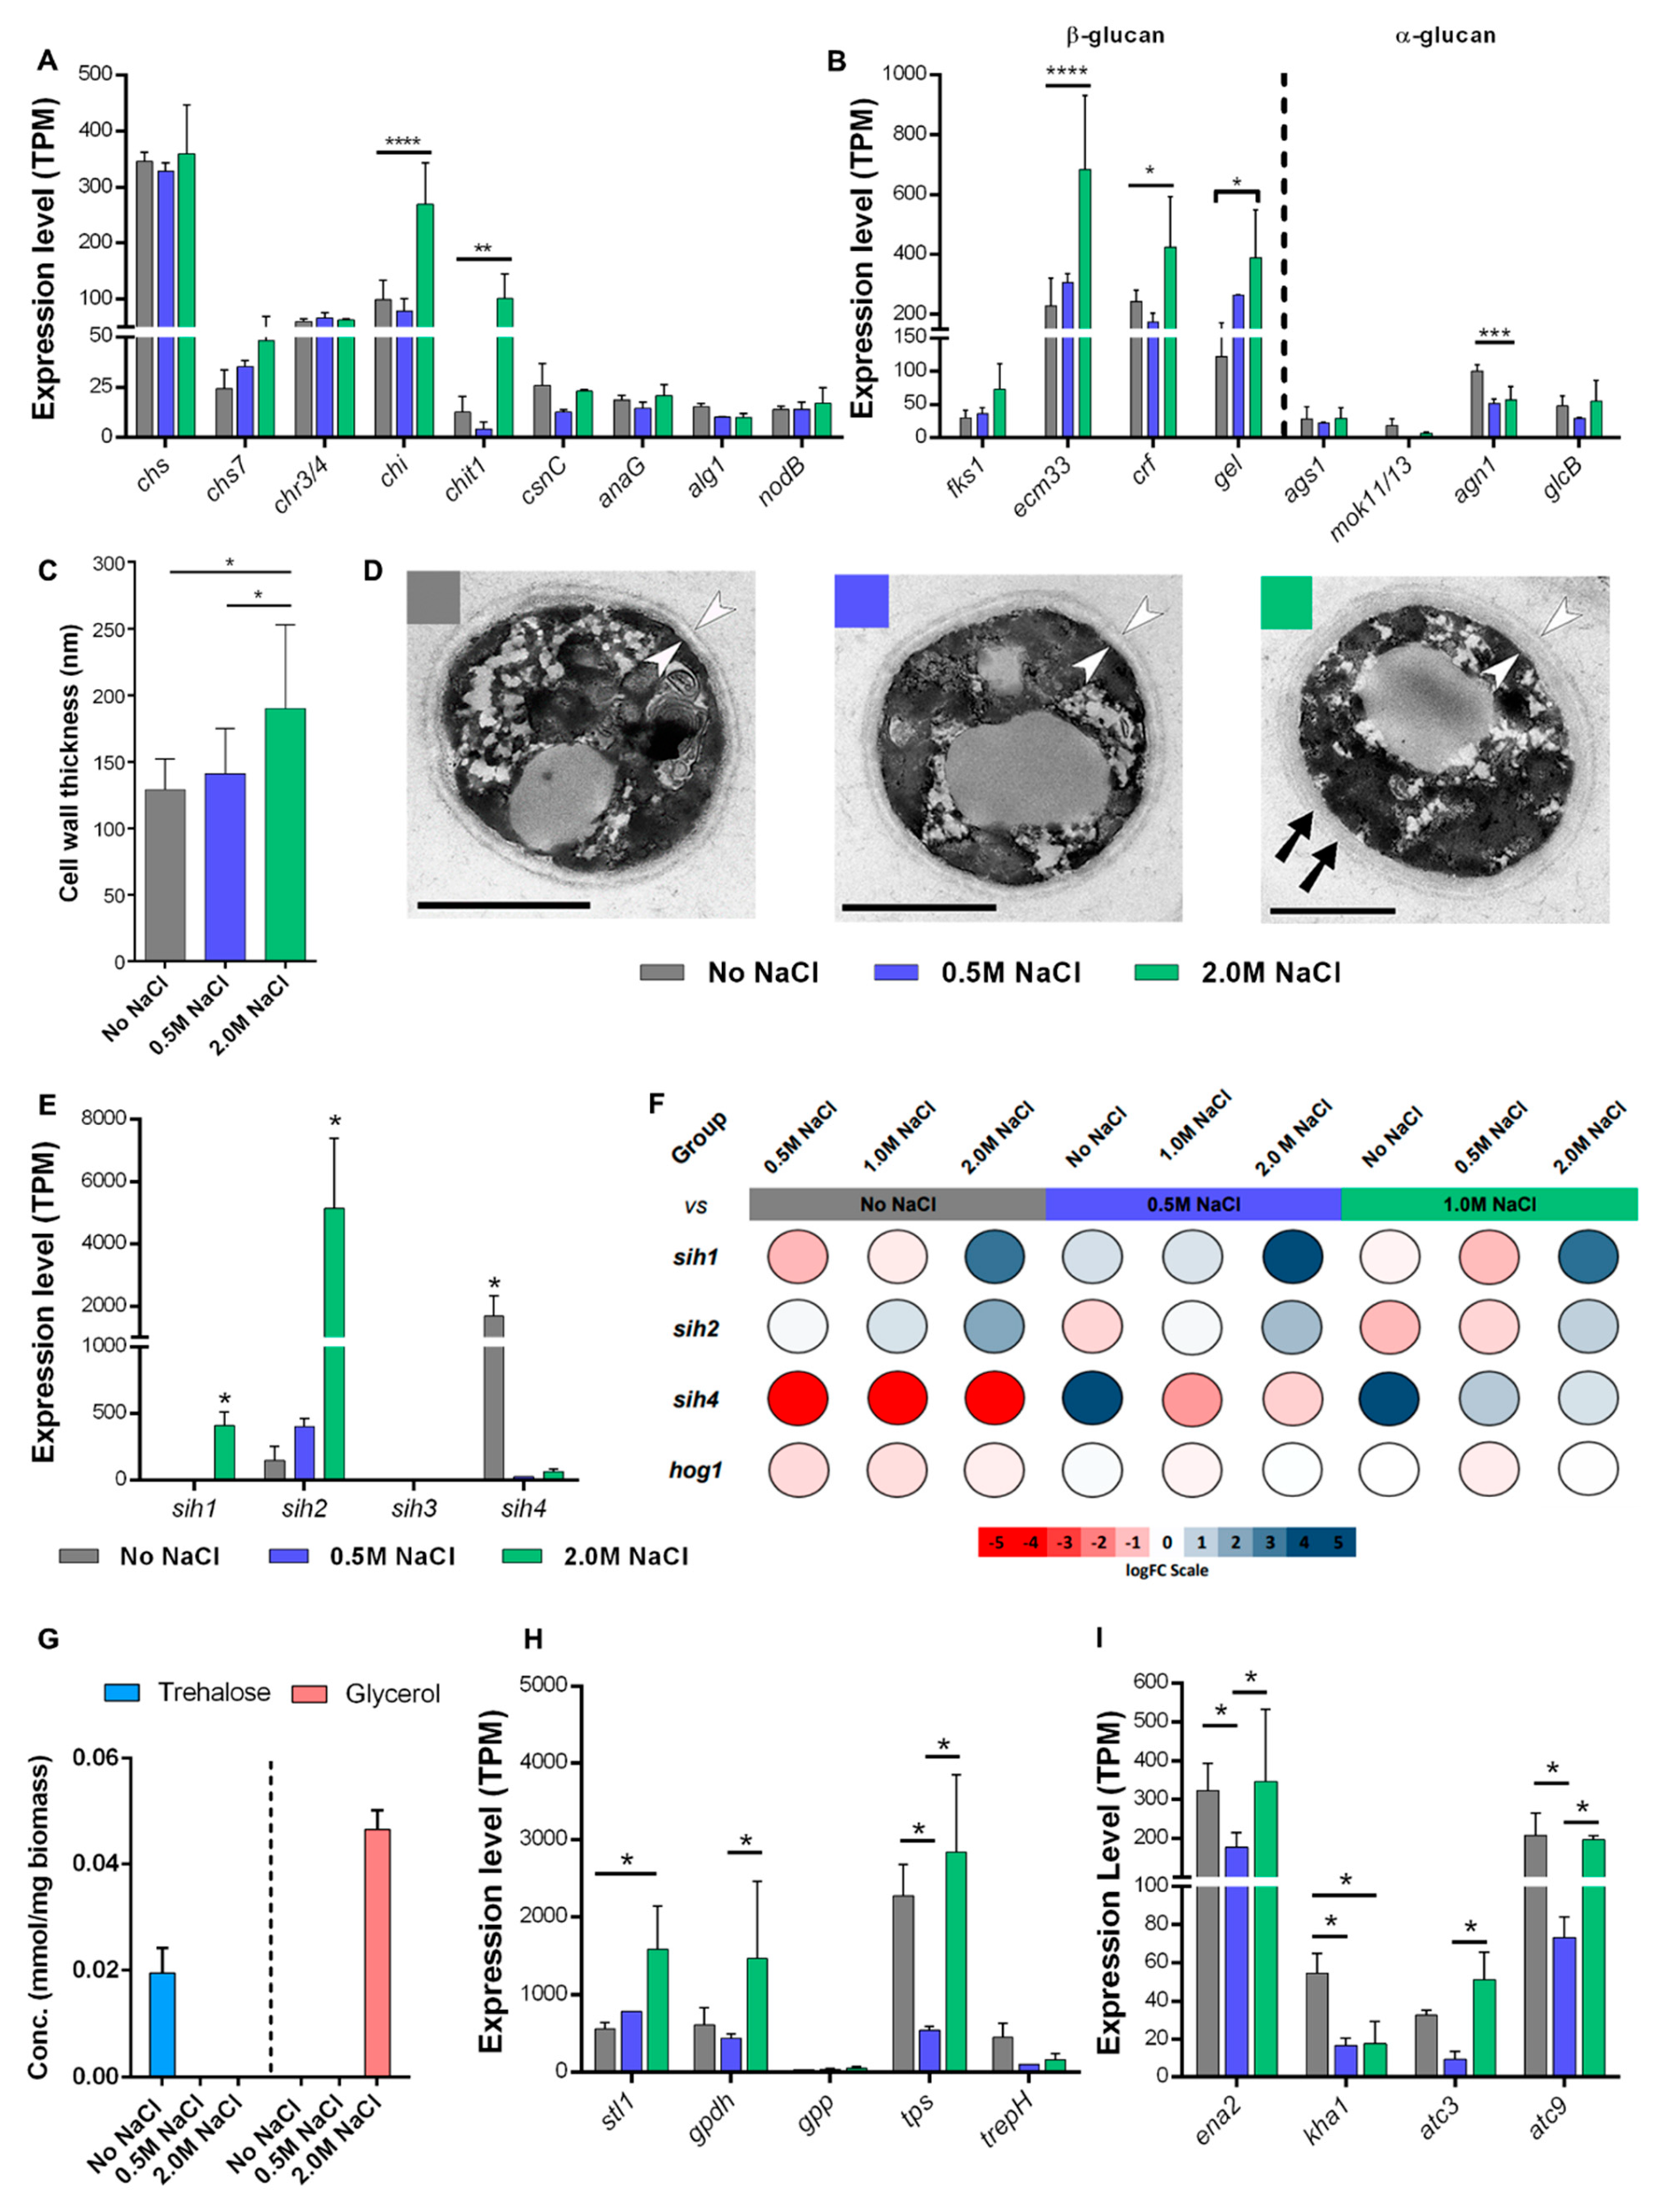
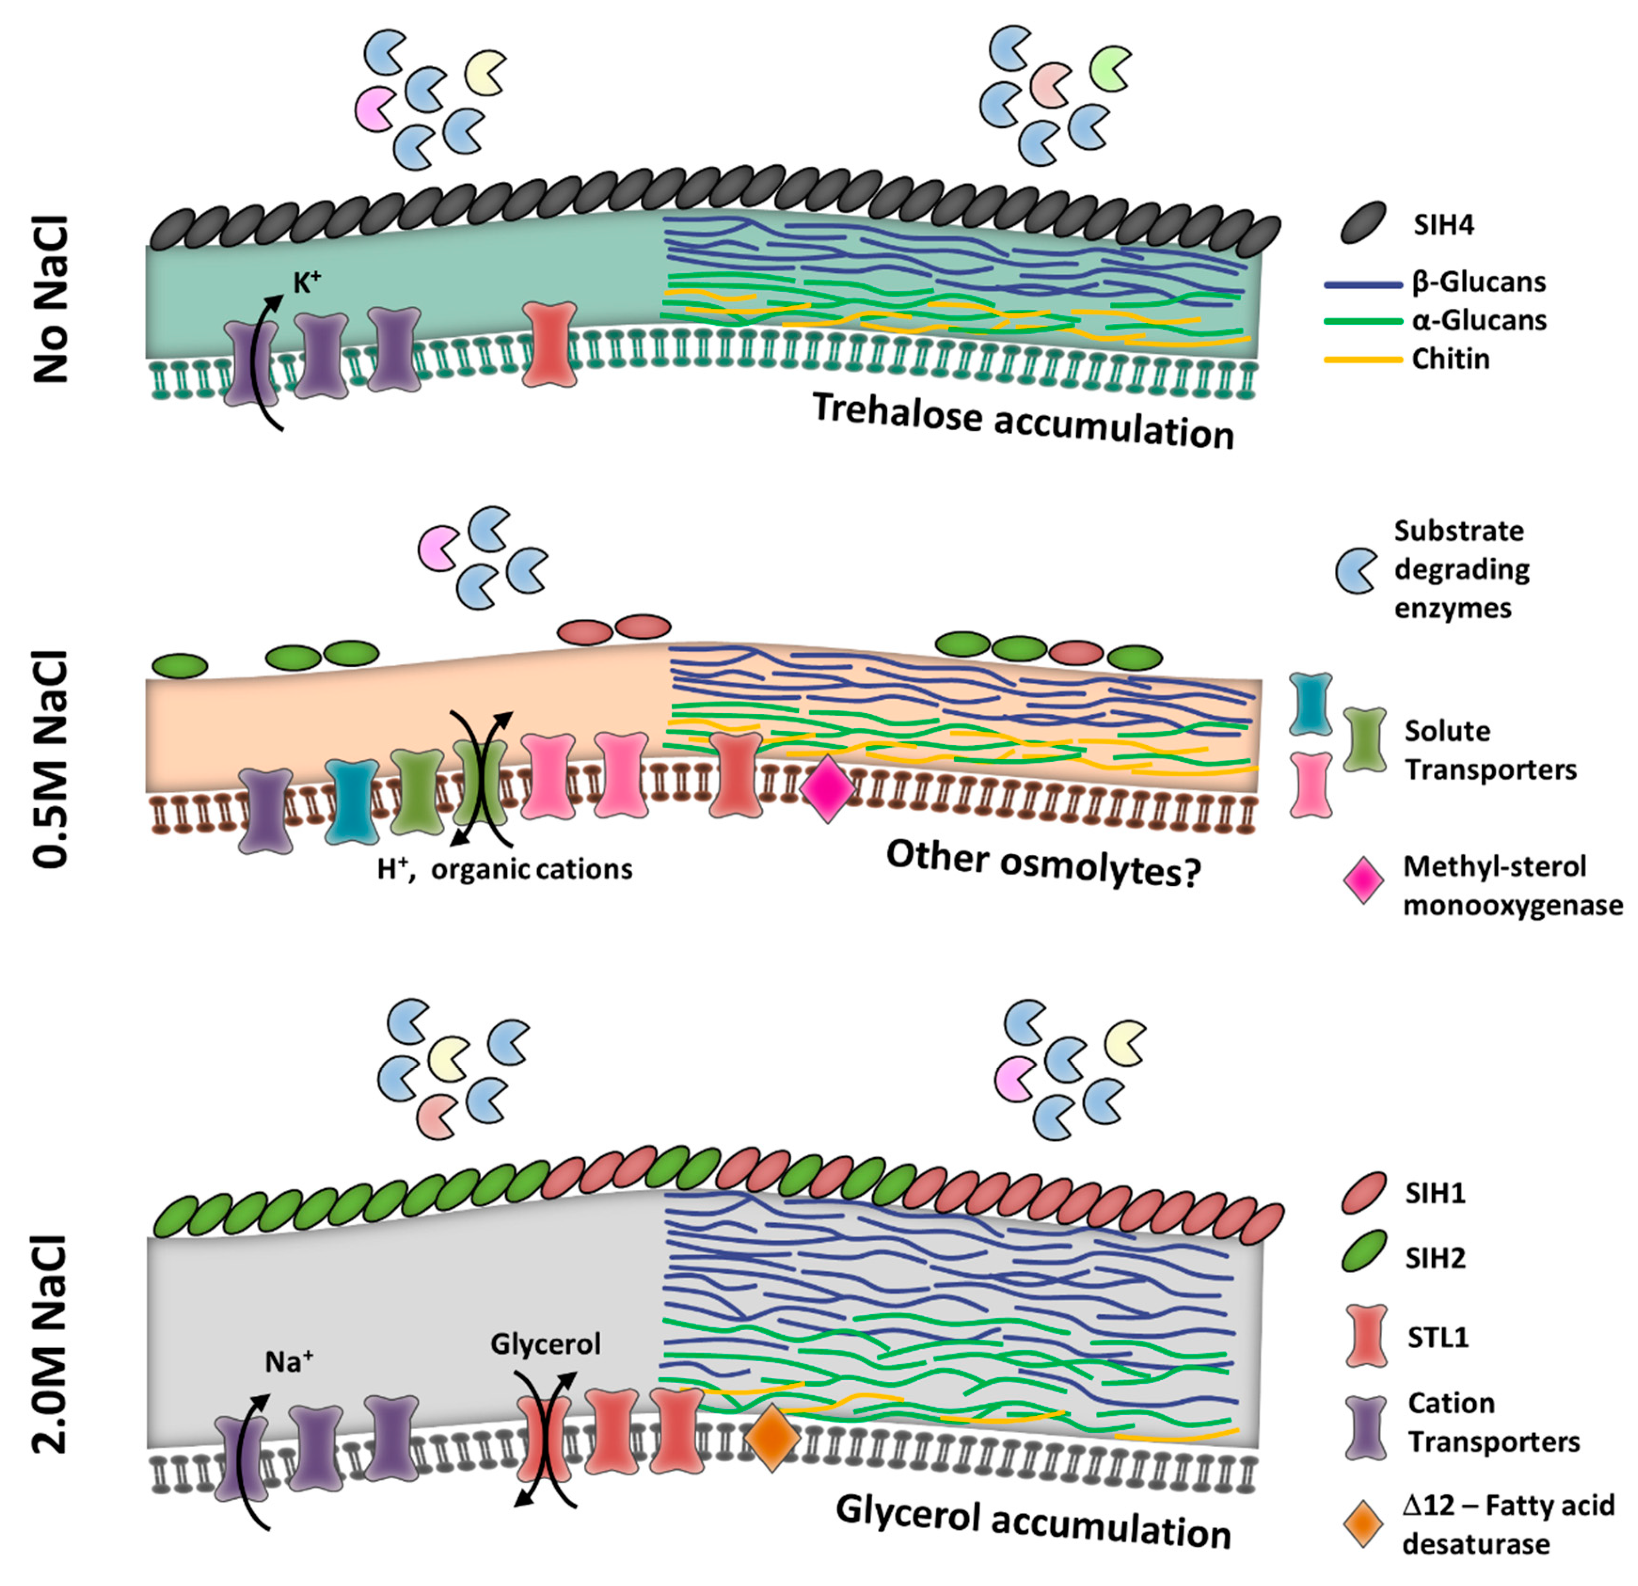
3.3. Membrane and Cell Wall Are the Main Defenses under Saline Stress

In A. sydowii, there were no major changes in the transcription of genes involved in modifying the plasma membrane composition, a mechanism described as a response to salt in halotolerant fungi [45,46]. While the number of differentially expressed genes in the corresponding GO category was not significant, overexpression of two genes was observed: a Δ12-fatty acid desaturase at 2.0 M NaCl (logFC 2.0 M NaCl vs No NaCl = 2.12) and a methyl-sterol monooxygenase at 0.5 M NaCl (logFC 0.5 M NaCl vs No NaCl = 2.29). The overexpression of the former would imply an increase in unsaturated lipids, while the latter is involved in the ergosterol synthesis pathway. The action of these enzymes possibly increases membrane fluidity, which was observed previously in the extremely halotolerant black yeast Hortaea werneckii and the halotolerant black yeast Aureobasidium pullulans [45].
Transcriptional changes of genes associated with construction, deconstruction, and remodeling of the fungal cell wall suggest that, in A. sydowii, this structure is extensively modified in salinity conditions (Figure 3). The current model of the cell wall in Aspergillus describes that chitin, a linear polymer of β-1,4-N-acetyl-glucosamine, is located nearest to the cell membrane and cross-linked to α(1-3)-glucans forming a rigid hydrophobic core surrounded by cross-linked β(1-3)-glucans [47,48,49]. Covering this stiff region, a second layer of more hydrated β-glucans can be found. Finally, the outermost region of the cell wall is composed of mannan, arabinan, α(1-3)-glucans, and proteins [49].
The amount of chitin in cell walls is a function of its synthesis and degradation. Chitin synthases (CHS) are membrane proteins that polymerize intracellular UDP-N-acetyl-glucosamine and extrude the chitin polymer to the cell wall space. In A. fumigatus, eight CHS (chsAG) genes have been identified, but their specific biological roles are still unclear, as deletion of many of these genes had no observable effect on growth or chitin content in the cell wall [50]. In A.sydowii, at least 11 different transcripts encoding eight chitin synthases genes (chs) were identified, but only one of these was strongly downregulated (logFC 2.0 M NaCl vs No NaCl = −3.18) when growing in the presence of salt. Nonetheless, the cumulative transcription level of all chs genes did not change significantly, suggesting that chitin synthesis is not affected (Figure 4A). Additionally, transcripts involved in the remodeling or modification of chitin/chitosan fibers, such as the alg1 and nodB genes participating in mannosylation and deacetylation, were not differentially expressed. Instead, the endochitinase (chi) and chitotriosidase (chit) transcripts levels were upregulated when the fungus grew in 2.0 M NaCl, which may result in an overall decrease of the chitin and chitosan content in the cell wall.
As shown in A. fumigatus, chsE and chsG deletion mutants displayed substantial changes in growth, hyphal morphology, conidiation, and chitin content, with a decrease in chitin being counterbalanced by an increase in α(1,3)-glucan [51]. Interestingly, the upregulation of transcripts involved in the synthesis and modification of β-glucans in A. sydowii suggested that, in response to salinity, the increase in β-glucans was more pronounced than that of α-glucans (Figure 4B).
The cell wall of A. fumigatus is mainly composed of β(1,3)-glucans and α(1,3)(1,4)-glucans. The β (1,3)-glucan is synthesized as a linear polymer by the FKS1 synthase complex, while the extruded chains can be transferred to extend existent β(1,3)-glucan or to GPI-anchored proteins that link cell wall polysaccharides to the cell membrane. Four families of GPI-anchored proteins (ECM33, GEL1-7, CRH1-5, and DFG1-7) were found to be common to all fungi [52,53]. Genes from three of these families were upregulated at the highest salinity in the A. sydowii transcriptome, indicating the importance of cross-linkage modifications for maintaining cell wall integrity during osmotic stress, as discussed below.
ECM33 proteins are involved in the correct assembly of the cell wall β(1,3)-glucan and the mannoprotein layer [54]. Several mutants of the ecm33 gene display increased sensitivity to a variety of stress conditions, such as oxidative agents, fungicides, cell wall perturbing agents, and osmotic and ionic imbalances [55,56]. ECM33 are assumed to participate in the crosslinking of β(1,3)-glucans to other cell wall components, although their precise biochemical function and their role in cell wall dynamics are not fully understood. The cumulative expression level of ecm33 genes in A. sydowii was almost two times greater at 2.0 M NaCl than at the other two tested conditions, which indicates they favor the fungus’ stress tolerance.
The CRH glycosidases are responsible for transglycosylation, forming chitin-glucan linkages [57]. In Δcrh mutants of Saccharomyces cerevisiae, the chitin fraction is completely devoid of linkages to β-glucans [57]. Deletion of crh genes in Candida albicans increases the elasticity of the cell wall, reducing survival during osmotic shock, while overexpression of one crh gene has an osmoprotective effect [58]. Such protection might also happen in A. sydowii, where a CRH homologue gene (crf) was overexpressed at 2.0 M NaCl (logFC 2.0 M NaCl vs No NaCl = 1.23) (Figure 4B).
Finally, the GEL family of glucanosyltransferases is the most studied among cell wall-associated proteins, and its members are present in a relatively high amounts in fungal cell walls. Their function is to cleave the newly synthesized linear β(1,3)-glucan and transfer it to another β(1,3)-glucan molecule, resulting in elongation or shortening of the glucan fibers. GEL proteins also regulate the cross-linking of proteins into the cell wall, therefore allowing the correct assembly of cell wall structures [59]. In A. fumigatus, seven gel genes have been identified, of which only three (gel1, gel2, and gel4) are expressed during mycelial growth [50,60]. In this fungus, gel4 is an essential gene [60], whereas Δgel2 mutants have reduced growth, and gel1 deletion has no evident effect on morphology [61]. In Neurospora crassa, individual deletions of gel genes do not influence stress sensitivity [59], indicating that there is higher redundancy in their function than in A. fumigatus. Noticeably, if the function of GEL proteins is abolished—with a triple mutation in N. crassa [59] or a single mutation of the GEL homolog gene gas1 in S. cerevisiae [62]—the chitin content in the cell wall is increased. This could be a compensatory mechanism to restore the rigidity of the cell wall, indicating a balancing effect between β(1,3)-glucan crosslinking and chitin production. In A. sydowii, the same balancing effect can be observed. At 2.0 M NaCl, chitin content should be lower due to increased chitin degradation, which is compensated by β(1,3)-glucan cross-linking as a result of higher GEL expression.
Our results indicate that, under hyperosmotic stress, the chitin content is reduced, while the content of β-glucans either increases or they are rearranged in the cell wall mesh. As evidenced in other organisms, these modifications (including the increased cross-linkage) generate a reduction in cell wall elasticity that allows resistance to external insults. Ultrastructural analysis of A. sydowii supported this notion, showing that the cells grown in 2.0 M NaCl exhibit significantly thicker cell walls compared to the other two investigated conditions (Figure 4C). Furthermore, the cell walls of the hyphae under hyperosmotic stress showed a distinctive lamellar structure when compared to the more uniform cell wall structure in the cells growing in 0.5 M NaCl or without salt (Figure 4D).

3.4. Coating for the Occasion

One of the novel halophilic strategies described in fungi is the production of hydrophobins (HFBs), which have been observed in both basidiomycete and ascomycete model fungi when growing in high salinity. HFBs are small extracellular proteins produced exclusively by filamentous fungi, which means that even yeasts do not contain genes for these proteins. HFBs self-assemble at hydrophobic-hydrophilic interfaces and have been associated with the morphogenesis of aerial hyphae and the adhesion of hyphae to hydrophobic surfaces [63]. The abundance of HFB-encoding genes in some fungal genera and the few studies on their physiological role suggests that HFB could fulfill additional functions besides those currently known.
Individual species of filamentous fungi usually contain between two and seven HFB genes [64]. In the genome of the obligate halophilic Wallemia ichthyophaga, there are 26 HFB genes, more than twice the number found in related species of the genus. At the low-salinity growth limit of this species (10% NaCl), eight HFB genes are overexpressed, while four are overexpressed at high salt concentrations (30% NaCl) [65]. Another interesting feature of HFB from halophilic fungi is that they have a higher percentage of acidic residues than their homologs in nonhalophilic fungi, which is a characteristic found also in other proteins from extremophilic archaea [65]. This suggests that HFB could have a relevant role in the mycelial growth under halophilic conditions, which is why the term “halophilic hydrophobins” was coined [66], but this is still to be proven.
Particularly in the genus Aspergillus, the estimated number of HFB per species is between six and 10, with an average of nine [67]. In the A. sydowii transcriptome, we identified four HFBs (sih1-4), fewer than in some other members of the genus. Of these, only three (sih1, sih2, and sih3) were completely represented in the sequenced genome of A. sydowii. In the genomic locus corresponding to the sih4 transcript, there is a truncated version of the gene that codes for a protein product with only four cysteine residues. As this transcript was highly expressed when the fungus was grown without NaCl, we cloned the sih4 coding sequence from cDNA and confirmed that the transcript corresponds to a complete HFB gene (data not shown). This gene might have been lost (or repurposed) during the migration of A. sydowii from the terrestrial to the marine habitat, which has been previously proposed as a mechanism of evolution of HFB genes in the ascomycete family of Hypocreales [68]. It also agrees with the findings that gene loss is more abundant in highly polymorphic gene families, because these do not fulfill essential functions for cell viability [69].
The main conserved characteristic of hydrophobins is the presence of eight cysteines with a relatively conserved spacing between them. This pattern was also present in the HFB sequences identified in the transcriptome (Table 1). According to the proposed classification based on cysteine spacing, only SIH2 could be classified in Class I. However, the Kyte-Doolittle hydropathy profile indicates that all sequences belonged to Class I (data not shown). A. sydowii hydrophobins do not have a high proportion of acidic residues, as observed for their orthologues in the halophilic W. ichthyophaga, and their pI values do not distinguish them from their counterparts in nonhalophilic fungi (Table 1).
Relative expression values (TPM) indicated that only sih1, sih2, and sih4 were expressed under the culture conditions in which this fungus grew, whereas the levels of sih3 were close to zero (Figure 4E). Relative quantification by qPCR confirms that sih4 was expressed in the absence of NaCl, and its expression was almost abolished under salinity conditions (Figure 4F). On the other hand, sih1 and sih2 were expressed in the presence of 2.0 M NaCl, but their transcription levels in 0.5 M NaCl were very low. The differential expression of the HFB-encoding genes of A. sydowii suggests that these proteins might function as effectors under stress or nonoptimal growth conditions. Such a hypothesis is not unprecedented, as evidence of this particular function of HFBs has come to light in recent years [70], but their role during stress remains poorly understood. HFBs could facilitate a more dense packing of the mycelium due to increased hydrophobicity [71], thus protecting cells inside the pellet from the external insults. Additionally, more hydrophobic hyphae or spores would spread more efficiently in aqueous media, which could constitute an ecological strategy to increase the chances of escape from stressful conditions. These two scenarios do not account for the fact that the fungus expressed different HFBs under different stress conditions, leaving questions about the function of HFBs in hyphae development and stress response for future studies.

3.5. Compatible Solutes

Among the most crucial adaptations to salinity in fungi is an increased concentration of intracellular compatible solutes. For example, in H. werneckii and W. ichthyophaga, glycerol is the most abundant osmolyte, but also, erythritol, arabitol, and mannitol can be found in lesser amounts [40,72]. Similarly, in A. niger, glycerol and erythritol accumulate in young mycelium, whereas mannitol and erythritol are the signature compatible solutes in old mycelium [73,74]. In conidia of A. niger and A. nidulans, trehalose and mannitol have been found [75,76].
As mentioned earlier, in A. sydowii BMH-0004 strain, some transcripts associated with the metabolism of osmolytes were differentially regulated in response to osmotic stress. Noteworthy was the expression of genes involved in trehalose synthesis, where α-trehalose phosphate synthase (TpsA) was expressed under both hypo- and hyperosmotic stress (Figure 4H) and trehalose phosphorylase (TrePH) only under hypo-osmotic stress (i.e., without NaCl). Quantification of trehalose in A. sydowii shows that this metabolite was produced exclusively when the fungus was grown without NaCl (Figure 4G), indicating that TpsA expression alone cannot ensure trehalose accumulation. While, in A. nidulans, trehalose accumulates in response to oxidative and heat stress and during conidiation, the same is not the case for osmotic stress [77].
Conversely, there was an upregulation of genes related to the synthesis and transport of glycerol from the extracellular medium under hyperosmotic stress. This salinity caused an apparent upregulation (statistically significant only at cumulative expression, not at transcript level) of the glycerol-3-phosphate dehydrogenase gene (gpd), encoding the rate-limiting enzyme in the pathway of glycerol synthesis. At the same time, the transcription of the genes encoding the STL1 glycerol:H+ transporters, which facilitate the import of glycerol into the cells, also increased at 2.0 M NaCl. Glycerol was accumulated only at 2.0 M NaCl and not at the optimal salinity for growth (Figure 4G), indicating that, in A. sydowii, it is a signature osmolyte of stress. In many other halotolerant and halophilic fungi, accumulation of glycerol is thought to be mediated by an increase of the gpd transcript levels [78], although most studies have been performed exposing the organisms to short-term osmotic shocks. Meanwhile, in the long-term exposure to high salinity, the expression of gpd can be similar to nonsaline conditions, leaving the regulation of glycerol concentration to Stl1 transporters [79].
Osmotic stress activates a MAPK signaling pathway known by the name of its principal kinase: HOG (High Osmolarity of Glycerol). The activation of the HOG pathway induces the accumulation of glycerol, arrest of the cell cycle, and reorganization in the actin cytoskeleton, as well as changes in cell wall dynamics [80,81]. In this strain, we found two variants of the MAP kinase hogA that could regulate the pathways of adaptation to salinity conditions, but none was differentially expressed in response to salinity. Relative quantification of the main hogA gene variant by qPCR confirmed that this kinase is not changing its expression even under hyperosmotic shock (Figure 4F).

3.6. Membrane Transporter Expression Is Not Pivotal for Eluding Ion Toxicity

Although not universally, some fungal halophilic strains have a higher number of transport systems—when compared with mesophilic relatives – to regulate the homeostasis of alkali cation levels, as well as the fluxes across the plasma membrane, to eliminate toxic ions such as sodium (Na+) [65,82,83]. For this reason, we compared the total number of transporter genes in the genomes of five Aspergilli: the halophiles A. sydowii and A. versicolor, and the halotolerant relatives A. nidulans, A. niger, and A. fumigatus (Table 2). The halophiles W. ichthyophaga and H. werneckii were included as a reference. In the analyzed genomes, the total number of genes encoding AA uptake transporters (Pfam 01490 and 00324); MFS members (Pfam 07690 and 00083); and cation/transporter ATPase exchangers (Pfam 00689, 00690, and 01061) showed striking differences (Table 2). The genomes of A. sydowii and A. versicolor (halophiles) revealed a higher number of genes encoding APC members, which could have a role in ensuring a rapid uptake of certain amino acids under hypersaline conditions. Osmoregulation at increased salinity in prokaryotes often involves accumulation of amino acids, such as proline and betaines, which could be also the case in halophile fungi growing in rich substrates. The contribution of the APC transporters to halotolerance remains underexplored in filamentous fungi.
Gene expression analysis showed an enrichment of transport-related genes when A. sydowii was grown at 0.5 M NaCl but not at 2.0 M NaCl (Figure 3). In total, 137 and 94 transcripts predicted to transport cations according to TCDB/TrSSP analysis were upregulated at 0.5 M NaCl and 2.0 M NaCl against the condition without NaCl, respectively. However, most differentially expressed transcripts are not involved in maintaining the metal cation balance of the cell but are participating in the internalization of sugars, aminoacids, and other solutes resulting from the degradation of the wheat straw. These results, although counterintuitive, are similar to the findings in the halophilic basidiomycete W. ichthyophaga, where only three transcripts related to alkali metal cation transporters were overexpressed at different salinities [65]. One possibility is that nonmetal cation transporters, seemingly not related to salinity, are involved in osmotic balance when the fungus is growing optimally. Additionally, the expression level of cation transporting genes was low, which makes it difficult to assure the biological relevance of the estimated differential expression. For example, transcripts from a Na+/H+ antiporter nah2 gene had a high logFC 0.5 M NaCl vs No NaCl (3.21), but their expression level mean across all conditions was 1.36 tpm.
The ena2 gene (ATN2), a sodium P-type ATPase commonly associated with salinity adaptations in the yeast Saccharomyces cerevisiae and other fungi, was downregulated at 0.5 M NaCl when compared to the conditions without salt or 2.0 M NaCl. This gene was found differentially expressed in W. ichthyophaga and H. werneckii under high salinity conditions [65]. Our results indicate that, in A. sydowii, the expression of ena2 is regulated by stress signals rather than high concentrations of salt. ENA P-type ATPase family in fungi are functionally different from animal Na+, K+- ATPases, as they have lower selectivity to cations (i.e., they pump out both alkali cations) [84]. In conditions with low Na+ concentrations, the ENA P-type ATPase pumps out K+ to maintain the Na+/K+ ratio, whereas the opposite occurs in hypersalinity conditions. Supporting this notion, the K+/H+ antiporter kha1 gene, which presumably extrudes K+ from the cell or into intracellular vesicles [85,86], was overexpressed in the condition without salt. Finally, atc3 and atc9 genes are other putative P-type ATPases with the same expression profile as the ena2 gene in A. sydowii, suggesting that the fungus actively transport cations under nonoptimal conditions to maintain the Na+/K+ ratio.

4. Conclusions

By comparing the transcriptomic profiles of A. sydowii in three different osmotic conditions, we learned that physiological responses to salinity vary greatly and are not a simple graded effect as the salt concentration of the medium is increased. In fact, in each condition assayed, the responses could be assumed as a distinct physiological state (Figure 5). When growing without NaCl, the cells of A. sydowii seem to be exposed to hypoosmotic stress, which elicits the production of trehalose and the overexpression of a hydrophobin gene (sih4) (Figure 4). Stress also triggers an increase in the transcription of genes for substrate degradation and carbohydrate catabolic processes, very similar to the effect in hyperosmotic conditions (i.e., 2.0 M NaCl). Oppositely, at optimal growth circumstances, the biosynthetic metabolic processes are favored, and the strategy of the cell is to increase transport systems for the efficient uptake of nutrients instead of the energy-demanding synthesis of extracellular enzymes. Osmotic balance in this condition is likely achieved by accumulating high energy-containing metabolites, such as mannitol, sorbitol, or arabitol. Only when the osmotic pressure increases up to nonoptimal conditions, the fungus starts to produce glycerol, reshape the cell walls and increase its thickness, possibly changes membrane composition, and produces a different set of hydrophobins (sih1 and sih2).
While most of the mechanisms of adaptation to salinity described to date in eukaryotes are also occurring in A. sydowii, these are not taking place concurrently. The adaptations to ensure osmotic balance and avoid ion toxicity when the fungus grows under optimal salinity conditions are not completely understood, as they do not coincide with the halophile adaptations described in the literature. Further experiments should be conducted to identify and understand these adaptations and the effects of different stress signals on modulating the response. Our results indicate that the interpretation of physiological reactions in extremophiles or extremotolerant microorganisms should be addressed differently, as stress can reshape the physiological outcome. In this sense, the strain A. sydowii BMH-0004 was a useful model to observe these transitions.

Supplementary Materials

The following are available online at https://0-www-mdpi-com.brum.beds.ac.uk/2073-4409/9/3/525/s1: Table S1: NCBI accession numbers of the genes used in the phylogenetic analyses. Table S2: Parameters for maximum likelihood trees using PhyML-SMS. Table S3: Primer and PCR conditions used in this study. Figure S1: Maximum likelihood phylograms based on their specific best substitution models. All the nodes with bootstrap support >50% are indicated at nodes with a circle. * Aspergillus sydowii reference strain [21]. Figure S2: Effect of filtering out the transcripts with low read counts on gene expression profiles and discrimination between experimental groups by unsupervised clustering (a and b) and the identification of DE transcripts (c).

Author Contributions

Conceptualization, Y.P.-L., R.A.B.-G., J.L.F.-M., and M.d.R.S.-C.; methodology, Y.P.-L., I.S.D., N.G.-C., and M.R.S.-C.; software, Y.P.-L., K.C., C.G., and F.C.; validation, Y.P.-L. and E.C.R.-P.; formal analysis, Y.P.-L., R.A.B.-G., and M.R.S.-C.; investigation, Y.P.-L., E.C.R.-P., K.C., F.C., P.Z., and R.K.; data curation, Y.P.-L.; writing—original draft preparation, Y.P.L., R.A.B.G., and M.d.R.S.-C.; writing—review and editing, Y.P.-L., R.A.B.-G., J.L.F.-M., I.S.D., N.G.-C., C.G., P.Z., and M.d.R.S.-C.; visualization, Y.P.-L., K.C., P.Z., and M.d.R.S.-C.; supervision, M.d.R.S.-C.; project administration, J.L.F.-M., R.A.B.-G. and M.d.R.S.-C.; funding acquisition, I.S.D., N.G.-C., R.A.B.-G., J.L.F.-M., and M.d.R.S.-C. All authors have read and agreed to the published version of the manuscript.

Funding

This project was partially financed by the Consejo Nacional de Ciencia y Tecnología (CONACyT) grant CB 250831 to J.L.F.-M., and grant CB 285816 to R.A.B.-G., and by the PRODEP grant UAEMOR-PTC-333 to M.R.S.-C., Y.P.-L., and E.C.R.-P., received scholarship support from CONACyT. The work in Vienna (Austria) was supported by the Austrian Science Fund (FWF) P25613-B20 and P25745-B20 to I.S.D., and the Vienna Science and Technology Fund (WWTF) LS13-048 to I.S.D. This study was also supported by the Slovenian Research Agency to the Infrastructural Centre Mycosmo (MRIC UL) to N.G.-C., P.Z., and C.G., and by the programs P1-0170 to N.G.-C., and P1-0198 to P.Z., and C.G.

Acknowledgments

We are grateful to María del Rocío Hernández-Rodríguez for technical assistance.

Conflicts of Interest

The authors declare no conflicts of interest. The funders had no role in the design of the study; in the collection, analyses, or interpretation of data; in the writing of the manuscript; or in the decision to publish the results.

References

  1. Smith, G.W.; Ives, L.D.; Nagelkerken, I.A.; Ritchie, K.B. Caribbean sea-fan mortalities. Nature 1996, 383, 487. [Google Scholar] [CrossRef]
  2. Geiser, D.M.; Taylor, J.W.; Ritchie, K.B.; Smith, G.W. Cause of sea fan death in the West Indies. Nature 1998, 394, 137–138. [Google Scholar] [CrossRef]
  3. Soler-Hurtado, M.M.; Sandoval-Sierra, V.; Machordom, A.; Dieguez-Uribeondo, J. Aspergillus sydowii and Other Potential Fungal Pathogens in Gorgonian Octocorals of the Ecuadorian Pacific. PLoS ONE 2016, 11, 1–12. [Google Scholar] [CrossRef] [PubMed] [Green Version]
  4. Butinar, L.; Frisvad, J.C.; Gunde-cimerman, N. Hypersaline waters—A potential source of foodborne toxigenic aspergilli and penicillia. FEMS Microbiol. Lett. 2011, 77, 186–199. [Google Scholar] [CrossRef]
  5. Zajc, J.; Zalar, P.; Plemenitas, A.; Gunde-Cimerman, N. The mycobiota of the Salterns. In Biology of Marine Fungi; Raghukumar, C., Ed.; Springer: Berlin/Heidelberg, Germany, 2012; Volume 53, pp. 133–158. ISBN 978-3-642-23341-8. [Google Scholar]
  6. Pitt, J.I.; Hocking, A.D. Spoilage of Stored, Processed and Preserved Foods. In Fungi and Food Spoilage; Pitt, J.I., Hocking, A.D., Eds.; Springer: Boston, MA, USA, 2009; pp. 402–421. ISBN 9780387922065. [Google Scholar]
  7. Cong, B.; Wang, N.; Liu, S.; Liu, F.; Yin, X.; Shen, J. Isolation, characterization and transcriptome analysis of a novel Antarctic Aspergillus sydowii strain MS-19 as a potential lignocellulosic enzyme source. BMC Microbiol. 2017, 17, 1–14. [Google Scholar] [CrossRef]
  8. Schmitt, E.K.; Eilinghoff, B.; Olliger, R.; Decker, H.; Kück, U. Development of molecular tools for the mulundocandin producer Aspergillus sydowii: DNA-mediated transformation and reporter gene expression. Appl. Microbiol. Biotechnol. 2002, 58, 625–631. [Google Scholar] [CrossRef]
  9. Matkar, K.; Chapla, D.; Divecha, J.; Nighojkar, A.; Madamwar, D. Production of cellulase by a newly isolated strain of Aspergillus sydowii and its optimization under submerged fermentation. Int. Biodeterior. Biodegradation 2013, 78, 24–33. [Google Scholar] [CrossRef]
  10. Alker, A.P.; Smith, G.W.; Kim, K. Characterization of Aspergillus sydowii (Thom et Church), a fungal pathogen of Caribbean sea fan corals. Hydrobiologia 2001, 460, 105–111. [Google Scholar] [CrossRef]
  11. Wang, J.; Lin, X.; Qin, C.; Liao, S.; Wan, J.; Zhang, T.; Liu, J.; Fredimoses, M.; Chen, H.; Yang, B.; et al. Antimicrobial and antiviral sesquiterpenoids from sponge-associated fungus, Aspergillus sydowii ZSDS1-F6. J. Antibiot. 2014, 67, 581–583. [Google Scholar] [CrossRef] [PubMed]
  12. Nair, S.G.; Shankar, R.S. Enzymatic bleaching of kraft pulp by xylanase from Aspergillus sydowii SBS 45. Indian J. Microbiol. 2010, 50, 332–338. [Google Scholar] [CrossRef] [PubMed] [Green Version]
  13. Madhu, K.M.; Beena, P.S.; Chandrasekaran, M. Extracellular β -glucosidase Production by a Marine Aspergillus sydowii BTMFS 55 under Solid State Fermentation Using Statistical Experimental Design. Biotechnol. Bioprocess Eng. 2009, 14, 457–466. [Google Scholar] [CrossRef]
  14. Gunde-Cimerman, N.; Plemenitas, A.; Oren, A. Strategies of adaptation of microorganisms of the three domains of life to high salt concentrations. FEMS Microbiol. Rev. 2018, 42, 353–375. [Google Scholar] [CrossRef] [PubMed]
  15. Ge, Y.; Yu, F.; Tan, Y.; Zhang, X.; Liu, Z. Comparative Transcriptome Sequence Analysis of Sporulation-Related Genes of Aspergillus cristatus in Response to Low and High Osmolarity. Curr. Microbiol. 2017, 74, 806–814. [Google Scholar] [CrossRef] [PubMed]
  16. Liu, K.H.; Ding, X.W.; Narsing Rao, M.P.; Zhang, B.; Zhang, Y.G.; Liu, F.H.; Liu, B.B.; Xiao, M.; Li, W.J. Morphological and transcriptomic analysis reveals the osmoadaptive response of endophytic fungus Aspergillus montevidensis ZYD4 to high salt stress. Front. Microbiol. 2017, 8, 1–12. [Google Scholar] [CrossRef] [PubMed]
  17. Liu, S.; Li, J.; Wu, Y.; Ren, Y.; Liu, Q.; Wang, Q.; Zhou, X.; Cai, M.; Zhang, Y. De novo transcriptome sequencing of marine-derived Aspergillus glaucus and comparative analysis of metabolic and developmental variations in response to salt stress. Genes Genom. 2017, 39, 317–329. [Google Scholar] [CrossRef]
  18. Salamov, A.; Sun, H.; Lipzen, A.; Kis-papo, T.; Weig, A.R.; Riley, R.; Pers, D.; Wasser, S.P.; Rambold, G.; Grigoriev, I.V.; et al. Genomic adaptations of the halophilic Dead Sea filamentous fungus Eurotium rubrum. Nat. Commun. 2014, 5, 1–8. [Google Scholar]
  19. Saum, S.H.; Müller, V. Regulation of osmoadaptation in the moderate halophile Halobacillus halophilus: Chloride, glutamate and switching osmolyte strategies. Saline Syst. 2008, 4, 1–15. [Google Scholar] [CrossRef] [Green Version]
  20. Batista-García, R.A.; Balcázar-López, E.; Miranda-Miranda, E.; Sánchez-Reyes, A.; Cuervo-Soto, L.; Aceves-Zamudio, D.; Atriztán-Hernández, K.; Morales-Herrera, C.; Rodríguez-Hernández, R.; Folch-Mallol, J. Characterization of lignocellulolytic activities from a moderate halophile strain of Aspergillus caesiellus isolated from a sugarcane bagasse fermentation. PLoS ONE 2014, 9, 1–12. [Google Scholar]
  21. Samson, R.A.; Visagie, C.M.; Houbraken, J.; Hong, S.-B.; Hubka, V.; Klaassen, C.H.W.; Perrone, G.; Seifert, K.A.; Susca, A.; Szigeti, G.; et al. Phylogeny, identification and nomenclature of the genus Aspergillus. Stud. Mycol. 2014, 141–173. [Google Scholar] [CrossRef] [Green Version]
  22. Edgar, R.C. MUSCLE: Multiple sequence alignment with high accuracy and high throughput. Nucleic Acids Res. 2004, 32, 1792–1797. [Google Scholar] [CrossRef] [Green Version]
  23. Larsson, A. AliView: A fast and lightweight alignment viewer and editor for large datasets. Bioinformatics 2014, 30, 3276–3278. [Google Scholar] [CrossRef] [PubMed]
  24. Gouy, M.; Guindon, S.; Gascuel, O. Sea view version 4: A multiplatform graphical user interface for sequence alignment and phylogenetic tree building. Mol. Biol. Evol. 2010, 27, 221–224. [Google Scholar] [CrossRef] [Green Version]
  25. Castresana, J. Selection of conserved blocks from multiple alignments for their use in phylogenetic analysis. Mol. Biol. Evol. 2000, 17, 540–552. [Google Scholar] [CrossRef] [PubMed] [Green Version]
  26. Ronquist, F.; Teslenko, M.; Van Der Mark, P.; Ayres, D.L.; Darling, A.; Höhna, S.; Larget, B.; Liu, L.; Suchard, M.A.; Huelsenbeck, J.P. Mrbayes 3.2: Efficient bayesian phylogenetic inference and model choice across a large model space. Syst. Biol. 2012, 61, 539–542. [Google Scholar] [CrossRef] [PubMed] [Green Version]
  27. Haas, B.J.; Papanicolaou, A.; Yassour, M.; Grabherr, M.; Blood, P.D.; Bowden, J.; Couger, M.B.; Eccles, D.; Li, B.; Macmanes, M.D.; et al. De novo transcript sequence reconstruction from RNA-Seq: Reference generation and analysis with Trinity. Nat Protoc. 2013, 8, 1494–1512. [Google Scholar] [CrossRef]
  28. Grabherr, M.G.; Haas, B.J.; Yassour, M.; Levin, J.Z.; Thompson, D.A.; Amit, I.; Adiconis, X.; Fan, L.; Raychowdhury, R.; Zeng, Q.; et al. Full-length transcriptome assembly from RNA-Seq data without a reference genome. Nat. Biotechnol. 2011, 29, 644–652. [Google Scholar] [CrossRef] [PubMed] [Green Version]
  29. Petersen, T.N.; Brunak, S.; von Heijne, G.; Nielsen, H. SignalP 4.0: Discriminating signal peptides from transmembrane regions. Nat. Methods 2011, 8, 785. [Google Scholar] [CrossRef]
  30. Li, H.; Handsaker, B.; Wysoker, A.; Fennell, T.; Ruan, J.; Homer, N.; Marth, G.; Abecasis, G.; Durbin, R. The Sequence Alignment/Map format and SAMtools. Bioinformatics 2009, 25, 2078–2079. [Google Scholar] [CrossRef] [Green Version]
  31. Conesa, A.; Madrigal, P.; Tarazona, S.; Gomez-Cabrero, D.; Cervera, A.; McPherson, A.; Szczesniak, M.W.; Gaffney, D.J.; Elo, L.L.; Zhang, X.; et al. A survey of best practices for RNA-seq data analysis. Genome Biol. 2016, 17, 19. [Google Scholar] [CrossRef] [Green Version]
  32. Wagner, G.P.; Kin, K.; Lynch, V.J. Measurement of mRNA abundance using RNA-seq data: RPKM measure is inconsistent among samples. Theory Biosci. 2012, 131, 281–285. [Google Scholar] [CrossRef]
  33. Li, B.; Dewey, C.N. RSEM: Accurate transcript quantification from RNA-seq data with or without a reference genome. BMC Bioinformatics 2011, 12, 41–74. [Google Scholar] [CrossRef] [Green Version]
  34. Langmead, B.; Salzberg, S.L. Fast gapped-read alignment with Bowtie 2. Nat. Methods 2013, 9, 357–359. [Google Scholar] [CrossRef] [PubMed] [Green Version]
  35. Risso, D.; Ngai, J.; Speed, T.P.; Dudoit, S. Normalization of RNA-seq data using factor analysis of control genes or samples. Nat. Biotechnol. 2014, 32, 896–902. [Google Scholar] [CrossRef] [PubMed] [Green Version]
  36. Love, M.I.; Huber, W.; Anders, S. Moderated estimation of fold change and dispersion for RNA-seq data with DESeq2. Genome Biol. 2014, 15, 550. [Google Scholar] [CrossRef] [Green Version]
  37. Bohle, K.; Jungebloud, A.; Dalpiaz, A. Selection of reference genes for normalisation of specific gene quantification data of Aspergillus niger. J. Biotechnol. 2007, 132, 353–358. [Google Scholar] [CrossRef] [PubMed]
  38. Pfaffl, M.W.; Horgan, G.W.; Dempfle, L. Relative expression software tool (REST©) for group-wise comparison and statistical analysis of relative expression results in real-time PCR. Nucleic Acids Res. 2002, 30, e36–e46. [Google Scholar] [CrossRef]
  39. Kuncic, M.K.; Kogej, T.; Drobne, D.; Gunde-Cimerman, N. Morphological Response of the Halophilic Fungal Genus Wallemia to High Salinity. Appl. Environ. Microbiol. 2010, 76, 329–337. [Google Scholar] [CrossRef] [Green Version]
  40. Kogej, T.; Stein, M.; Volkmann, M.; Gorbushina, A.A.; Galinski, E.A.; Gunde-Cimerman, N. Osmotic adaptation of the halophilic fungus Hortaea werneckii: Role of osmolytes and melanization. Microbiology 2007, 153, 4261–4273. [Google Scholar] [CrossRef] [Green Version]
  41. Stielow, J.B.; Lévesque, C.A.; Seifert, K.A.; Meyer, W.; Irinyi, L.; Smits, D.; Renfurm, R.; Verkley, G.J.M.; Groenewald, M.; Chaduli, D.; et al. One fungus, which genes? Development and assessment of universal primers for potential secondary fungal DNA barcodes. Persoonia 2015, 35, 242–263. [Google Scholar] [CrossRef] [Green Version]
  42. Jurjevic, Z.; Peterson, S.W.; Horn, B.W. Aspergillus section Versicolores: Nine new species and multilocus DNA sequence based phylogeny. IMA Fungus 2012, 3, 59–79. [Google Scholar] [CrossRef]
  43. Sklenář, F.; Jurjević, Z.; Zalar, P.; Frisvad, J.C.; Visagie, C.M.; Kolařík, M.; Houbraken, J.; Chen, A.J.; Yilmaz, N.; Seifert, K.A.; et al. Phylogeny of xerophilic aspergilli (subgenus Aspergillus) and taxonomic revision of section Restricti. Stud. Mycol. 2017, 88, 161–236. [Google Scholar] [CrossRef] [Green Version]
  44. Siqueira, J.P.Z.; Sutton, D.A.; García, D.; Gené, J.; Thomson, P.; Wiederhold, N.; Guarro, J. Species diversity of Aspergillus section Versicolores in clinical samples and antifungal susceptibility. Fungal Biol. 2016, 120, 1458–1467. [Google Scholar] [CrossRef] [PubMed]
  45. Gunde-Cimerman, N.; Turk, M.; Abramovi, Z.; Plemenitas, A. Salt stress and plasma-membrane fluidity in selected extremophilic yeasts and yeast-like fungi. FEMS Yeast Res. 2007, 7, 550–557. [Google Scholar]
  46. Turk, M.; Mejanelle, L.; Sentjur, M.; Gunde-Cimerman, N.; Grimalt, J.; Plemenitas, A. Salt-induced changes in lipid composition and membrane fluidity of halophilic yeast-like melanized fungi. Extremophiles 2004, 8, 53–61. [Google Scholar] [CrossRef] [PubMed]
  47. Gow, N.A.R.; Latge, J.; Munro, C.A. The Fungal Cell Wall: Structure, Biosynthesis, and Function. Microbiol Spectr. 2017, 5, 1–25. [Google Scholar]
  48. Arroyo, J.; Farka, V.; Sanz, A.B.; Cabib, E. Strengthening the fungal cell wall through chitin – glucan cross-links: Effects on morphogenesis and cell integrity. Cell. Microbiol. 2016, 18, 1239–1250. [Google Scholar] [CrossRef]
  49. Kang, X.; Kirui, A.; Muszyński, A.; Widanage, M.C.D.; Chen, A.; Azadi, P.; Wang, P.; Mentink-Vigier, F.; Wang, T. Molecular architecture of fungal cell walls revealed by solid-state NMR. Nat. Commun. 2018, 9, 1–12. [Google Scholar] [CrossRef] [Green Version]
  50. Gastebois, A.; Clavaud, C.; Aimanianda, V.; Latgé, J.-P. Aspergillus fumigatus: Cell wall polysaccharides, their biosynthesis and organization. Future Microbiol. 2009, 4, 583–595. [Google Scholar] [CrossRef] [Green Version]
  51. Mellado, E.; Dubreucq, G.; Mol, P.; Sarfati, J.; Paris, S.; Diaquin, M.; Holden, D.W.; Latg, J.P. Cell wall biogenesis in a double chitin synthase mutant (chsG-/chsE-) of Aspergillus fumigatus. Fungal Genet. Biol. 2003, 38, 98–109. [Google Scholar] [CrossRef]
  52. Mouyna, I.; Hartl, L.; Latgé, J. β -1, 3-glucan modifying enzymes in Aspergillus fumigatus. Front. Microbiol. 2013, 4, 1–9. [Google Scholar] [CrossRef] [Green Version]
  53. Beauvais, A.; Latge, J. Functional duality of the cell wall. Curr. Opin. Microbiol. 2014, 11, 11–117. [Google Scholar]
  54. Chabane, S.; Sarfati, J.; Ibrahim-granet, O.; Du, C.; Schmidt, C.; Mouyna, I.; Prevost, M.; Calderone, R.; Latge, J. Glycosylphosphatidylinositol-Anchored Ecm33p Influences Conidial Cell Wall Biosynthesis in Aspergillus fumigatus. Appl. Environ. Microbiol. 2006, 72, 3259–3267. [Google Scholar] [CrossRef] [PubMed] [Green Version]
  55. Gil-Bona, A.; Reales-Calderon, J.A.; Parra-Giraldo, C.M.; Martinez-Lopez, R.; Monteoliva, L.; Gil, C. The Cell Wall Protein Ecm33 of Candida albicans is Involved in Chronological Life Span, Morphogenesis, Cell Wall Regeneration, Stress Tolerance, and Host – Cell Interaction. Front. Microbiol. 2016, 7, 1–14. [Google Scholar] [CrossRef] [PubMed]
  56. Chen, Y.; Zhu, J.; Ying, S.-H.; Feng, M.-G. The GPI-anchored protein Ecm33 is vital for conidiation, cell wall integrity, and multi-stress tolerance of two filamentous entomopathogens but not for virulence. Appl. Microbiol. Biotechnol. 2014, 98, 5517–5529. [Google Scholar] [CrossRef] [PubMed]
  57. Cabib, E. Two Novel Techniques for Determination of Polysaccharide Cross-Links Show that Crh1p and Crh2p Attach Chitin to both b(1-6)- and b(1-3)Glucan in the Saccharomyces cerevisiae Cell Wall. Eukaryot. Cell 2009, 8, 1626–1636. [Google Scholar] [CrossRef] [PubMed] [Green Version]
  58. Ene, I.V.; Walker, L.A.; Schiavone, M.; Lee, K.K.; Martin-yken, H.; Dague, E. Cell Wall Remodeling Enzymes Modulate Fungal Cell Wall Elasticity and Osmotic Stress Resistance. MBio 2015, 6, 1–15. [Google Scholar] [CrossRef] [Green Version]
  59. Ao, J.; Free, S.J. Genetic and biochemical characterization of the GH72 family of cell wall transglycosylases in Neurospora crassa. Fungal Genet. Biol. 2017, 101, 46–54. [Google Scholar] [CrossRef] [Green Version]
  60. Gastebois, A.; Fontaine, T.; Latgé, J.P.; Mouyna, I. b(1-3) glucanosyltransferase Gel4p is essential for Aspergillus fumigatus. Eukaryot. Cell 2010, 9, 1294–1298. [Google Scholar] [CrossRef] [Green Version]
  61. Mouyna, I.; Morelle, W.; Vai, M.; Monod, M.; Léchenne, B.; Fontaine, T.; Beauvais, A.; Sarfati, J.; Prévost, M.C.; Henry, C.; et al. Deletion of GEL2 encoding for a β(1-3)glucanosyltransferase affects morphogenesis and virulence in Aspergillus fumigatus. Mol. Microbiol. 2005, 56, 1675–1688. [Google Scholar] [CrossRef]
  62. Valdivieso, M.-H.; Ferrario, L.; Vai, M.; Duran, A.; Popolo, L. Chitin Synthesis in a gas1 Mutant of Saccharomyces cerevisiae. J. Bacteriol. 2000, 182, 4752–4757. [Google Scholar] [CrossRef] [Green Version]
  63. Wösten, H.A.B. Hydrophobins: Multipurpose Proteins. Annu. Rev. Microbiol. 2001, 55, 625–646. [Google Scholar] [CrossRef] [Green Version]
  64. Sunde, M.; Kwan, A.H.Y.; Templeton, M.D.; Beever, R.E.; Mackay, J.P. Structural analysis of hydrophobins. Micron 2008, 39, 773–784. [Google Scholar] [CrossRef] [PubMed]
  65. Zajc, J.; Liu, Y.; Dai, W.; Yang, Z.; Hu, J.; Gostinčar, C.; Gunde-Cimerman, N. Genome and transcriptome sequencing of the halophilic fungus Wallemia ichthyophaga: Haloadaptations present and absent. BMC Genomics 2013, 14, 1–20. [Google Scholar] [CrossRef] [PubMed] [Green Version]
  66. Plemenitaš, A.; Lenassi, M.; Konte, T.; Kejžar, A.; Zajc, J.; Gostinčar, C.; Gunde-Cimerman, N. Adaptation to high salt concentrations in halotolerant/halophilic fungi: A molecular perspective. Front. Microbiol. 2014, 5, 1–13. [Google Scholar] [CrossRef] [PubMed] [Green Version]
  67. Littlejohn, K.A.; Hooley, P.; Cox, P.W. Bioinformatics predicts diverse Aspergillus hydrophobins with novel properties. Food Hydrocoll. 2012, 27, 503–516. [Google Scholar] [CrossRef]
  68. Kubicek, C.P.; Baker, S.; Gamauf, C.; Kenerley, C.M.; Druzhinina, I.S. Purifying selection and birth-and-death evolution in the class II hydrophobin gene families of the ascomycete Trichoderma/Hypocrea. BMC Evol. Biol. 2008, 8, 1–16. [Google Scholar] [CrossRef] [Green Version]
  69. Krylov, D.M.; Wolf, Y.I.; Rogozin, I.B.; Koonin, E. V Gene Loss, Protein Sequence Divergence, Gene Dispensability, Expression Level, and Interactivity Are Correlated in Eukaryotic Evolution. Genome Res. 2003, 13, 2229–2235. [Google Scholar] [CrossRef] [Green Version]
  70. Przylucka, A.; Akcapinar, G.B.; Chenthamara, K.; Cai, F.; Grujic, M.; Karpenko, J.; Livoi, M.; Shen, Q.; Kubicek, C.P.; Druzhinina, I.S. HFB7—A novel orphan hydrophobin of the Harzianum and Virens clades of Trichoderma, is involved in response to biotic and abiotic stresses. Fungal Genet. Biol. 2017, 102, 63–76. [Google Scholar] [CrossRef]
  71. Appels, F.V.W.; Dijksterhuis, J.; Lukasiewicz, C.E.; Jansen, K.M.B.; Wösten, H.A.B.; Krijgsheld, P. Hydrophobin gene deletion and environmental growth conditions impact mechanical properties of mycelium by affecting the density of the material. Sci. Rep. 2018, 8, 1–7. [Google Scholar] [CrossRef]
  72. Zajc, J.; Kogej, T.; Galinski, E.A.; Gunde-Cimerman, N. Osmoadaptation Strategy of the Most Halophilic Fungus, Wallemia ichthyophaga, Growing Optimally at Salinities above 15% NaCl. Appl. Environ. Microbiol. 2014, 80, 247–256. [Google Scholar] [CrossRef] [Green Version]
  73. Witteveen, C.F.B.; Visser, J. Polyol pools in Aspergillus niger. FEMS Microbiol. Lett. 1995, 134, 57–62. [Google Scholar] [CrossRef]
  74. Krijgsheld, P.; Bleichrodt, R.; Van Veluw, G.J.; Wang, F.; Müller, W.H.; Dijksterhuis, J.; Wösten, H.A.B. Development in Aspergillus. Stud. Mycol. 2011, 74, 1–29. [Google Scholar] [CrossRef] [PubMed]
  75. Ruijter, G.J.G.; Visser, J.; Rinzema, A. Polyol accumulation by Aspergillus oryzae at low water activity in solid-state fermentation. Microbiology 2004, 150, 1095–1101. [Google Scholar] [CrossRef] [PubMed] [Green Version]
  76. Van Leeuwen, M.R.; Krijgsheld, P.; Bleichrodt, R.; Menke, H.; Stam, H.; Stark, J.; Wösten, H.A.B.; Dijksterhuis, J. Germination of conidia of Aspergillus niger is accompanied by major changes in RNA profiles. Stud. Mycol. 2011, 74, 59–70. [Google Scholar] [CrossRef] [PubMed]
  77. Fillinger, S.; Chaveroche, M.K.; van Dijck, P.; de Vries, R.; Ruijter, G.; Thevelein, J.; d’Enfert, C. Trehalose is required for the acquisition of tolerance to a variety of stresses in the filamentous fungus Aspergillus nidulans. Microbiology 2001, 147, 1851–1862. [Google Scholar] [CrossRef] [Green Version]
  78. Gorjan, A.; Gunde-Cimerman, N.; Plemenitas, A.; Gadd, G.M. Adaptation of the glycerol-3-phosphate dehydrogenase Gpd1 to high salinities in the extremely halotolerant Hortaea werneckii and halophilic Wallemia ichthyophaga. Fungal Biol. 2011, 115, 959–970. [Google Scholar]
  79. Turk, M.; Gostinčar, C. Glycerol metabolism genes in Aureobasidium pullulans and Aureobasidium subglaciale. Fungal Biol. 2018, 122, 63–73. [Google Scholar] [CrossRef]
  80. Clotet, J.; Posas, F. Control of Cell Cycle in Response to Osmostress: Lessons from Yeast. In Methods in Enzymology; Elsevier Inc.: Amsterdam NX, The Netherlands, 2017; Volume 428, pp. 63–76. [Google Scholar]
  81. Nadal, E.; Posas, F. EMBO Member ’ s Review Multilayered control of gene expression by stress-activated protein kinases. EMBO J. 2010, 29, 4–13. [Google Scholar] [CrossRef] [Green Version]
  82. Ramos, J.; Sychrová, H.; Kschischo, M. Yeast Membrane Transport; Ramos, J., Sychrová, H., Kschischo, M., Eds.; Springer International Publishing: AG, Switzerland, 2016; Volume 892, ISBN 9783319253022. [Google Scholar]
  83. Ramos, J.; Ariño, J.; Sychrova, H. Alkali-metal-cation influx and efflux systems in nonconventional yeast species. FEMS Microbiol. Lett. 2011, 317, 1–8. [Google Scholar] [CrossRef] [Green Version]
  84. Benito, B.; Garciadeblas, B.; Perez-Martin, J.; Rodriguez-Navarro, A. Growth at High pH and Sodium and Potassium Tolerance in Media above the Cytoplasmic pH Depend on ENA ATPases in Ustilago maydis. Eukaryot. Cell 2009, 8, 821–829. [Google Scholar] [CrossRef] [Green Version]
  85. Ramírez, J.; Ramírez, O.; Saldaña, C.; Coria, R.; Peña, A. A Saccharomyces cerevisiae Mutant Lacking a K+/H+ Exchanger. J. Bacteriol. 1998, 180, 5860–5865. [Google Scholar] [CrossRef] [Green Version]
  86. Maresova, L.; Sychrova, H. Physiological characterization of Saccharomyces cerevisiae kha1 deletion mutants. Mol. Microbiol. 2005, 55, 588–600. [Google Scholar] [CrossRef] [PubMed]
Figure 1. Bayesian phylogram obtained based on the concatenated alignment using an internal transcribed spacer (ITS), benA, cam, and rpb2 from strains belonging to Aspergillus section Versicolores [44]. The color of the branch corresponds to the posterior probabilities (Pp) percentage. The accession number of the genes used for the phylogram is given in Supplementary Table S1. * Aspergillus sydowii reference strain [21].
Cells 09 00525 g001
Figure 2. Macro and micromorphology of A. sydowii strain BMH-0004. (A) malt extract agar (MEA) 25 °C, (B) Czapek yeast extract agar (CYA) 25 °C, (C) CYA 30 °C, (D) CYA with saline (CYAS) 25 °C, and (E) creatine-sucrose agar (CREA). (FJ) Reverses in the same order as (AE,KQ) Conidiophores and conidia on MEA.
Cells 09 00525 g002
Figure 3. GO enrichment in the sets of differentially expressed (DE) transcripts for each evaluated comparison. False discovery rate (FDR) for the enrichment of each GO term was obtained by over-representation analysis.
Cells 09 00525 g003
Figure 4. Mechanisms of tolerance to salinity and hyperosmotic stress identified in A. sydowii. (A) Cumulative expression level of transcripts associated to chitin/chitosan synthesis and degradation. (B) Cumulative expression level of transcripts associated to synthesis and degradation of glucans of the cell wall. (C) Cell wall thickness of comparable-sized hyphae. Results depicted as the averages and standard deviation of 50 measurements in each condition. Statistically significant differences (* p < 0.05) were identified by Student’s t-test. (D) Ultrastructural analysis of cross-sections of A. sydowii hyphae, showing lamellar structure (black arrows) and considerably thicker cell walls (arrowheads) in the samples grown in 2.0 M NaCl. Scale bars = 1 µm. (E) Expression levels (TPM) of hydrophobins identified in A. sydowii transcriptome. TPM: transcripts per million. (F) Relative quantification of sih1, sih2, sih4, and hog1 gene expression levels by qPCR in cells grown without NaCl (No NaCl) or with 0.5 M, 1.0 M, and 2.0 M NaCl. Biological samples (n = 3) were assayed with two technical replicates. Color scale represents the logarithm of the expression fold change. (G) Glycerol and trehalose accumulation in the mycelium of A. sydowii when growing at different salinities. (H) Cumulative expression level of selected transcripts associated to the synthesis and degradation of compatible solutes. See main text for details. (I) Cumulative expression level of selected transcripts associated to metal cation transport. See main text for details. Statistically significant differences in (A,B,E,H and I) (**** p < 0.0001, *** p < 0.001, ** p < 0.01, and * p < 0.05) were identified by multiple Tukey’s tests.
Cells 09 00525 g004
Figure 5. Proposed mechanisms of tolerance to salinity and hyperosmotic stress in Aspergillus sydowii. The location of SIH hydrophobins at the cell wall is putative. Cell wall composition was inferred from the expression of genes involved in the synthesis of polymers.
Cells 09 00525 g005
Table 1. Sequence properties of hydrophobins from Aspergillus sydowii BMH-0004.
GeneSequence Properties aClassCysteine Spacing
LengthpI%Basic%AcidicC1-C2C3-C4C4-C5C5-C6C7-C8
sih11293.985.410.9Unclassified63519519
sih21374.053.77.3Class I73918517
sih31104.026.412.7Unclassified5326513
sih41173.997.717.1Unclassified6302584
a—of mature protein without signal peptide.
Table 2. Genomic distribution of transporter families within Aspergilli species *.
Transporter FamilyPfam NumberA. sydowiiA. versicolorA. nidulansA. nigerA. fumigatusW. ichthyophagaH. werneckii
Alkali metal cation/H+ antiporterPF086191111102
Sodium: solute symporterPF004745744326
MFSPF07690
PF00083
447
171
452
164
271
106
335
96
220
83
52
17
342
178
Cation transporter/ATPase PF00690
PF00689
21
16
16
12
13
11
13
7
12
11
7
4
14
9
ABC TransportersPF01061
PF00664
PF00005
PF06422
21
22
52
16
22
31
75
20
18
24
49
14
21
32
62
16
15
23
52
12
3
10
20
2
14
32
8
10
AA uptakePF13520
PF01490
PF00324
0
32
86
0
31
87
0
13
52
0
22
61
0
16
46
0
9
5
46
33
27
V-Type ATPase-IPF014961121112
Na+/H+ exchanger familyPF00999810877614
Na+/Ca2+ exchanger familyPF0169987697312
Cation transporter familyPF023866334318
* The highest number of genes in each family is represented in bold.

