Aquaporin-11 Contributes to TGF-β1-induced Endoplasmic Reticulum Stress in Human Visceral Adipocytes: Role in Obesity-Associated Inflammation

 , , ,
, , ,  ,
,
Abstract
: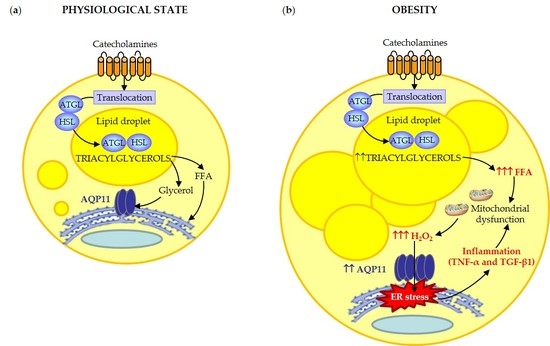
1. Introduction
2. Materials and Methods
2.1. Patient Selection
2.2. Adipose Tissue Handling
2.3. Adipocyte Cultures
2.4. Subcellular Fractionation Studies
2.5. AQP11 Knockdown by siRNA Transfection
2.6. Real-Time PCR
2.7. Western-Blot
2.8. Immunohistochemistry of AQP11
2.9. Confocal Immunofluorescence Microscopy of AQP11
2.10. Statistical Analysis
3. Results
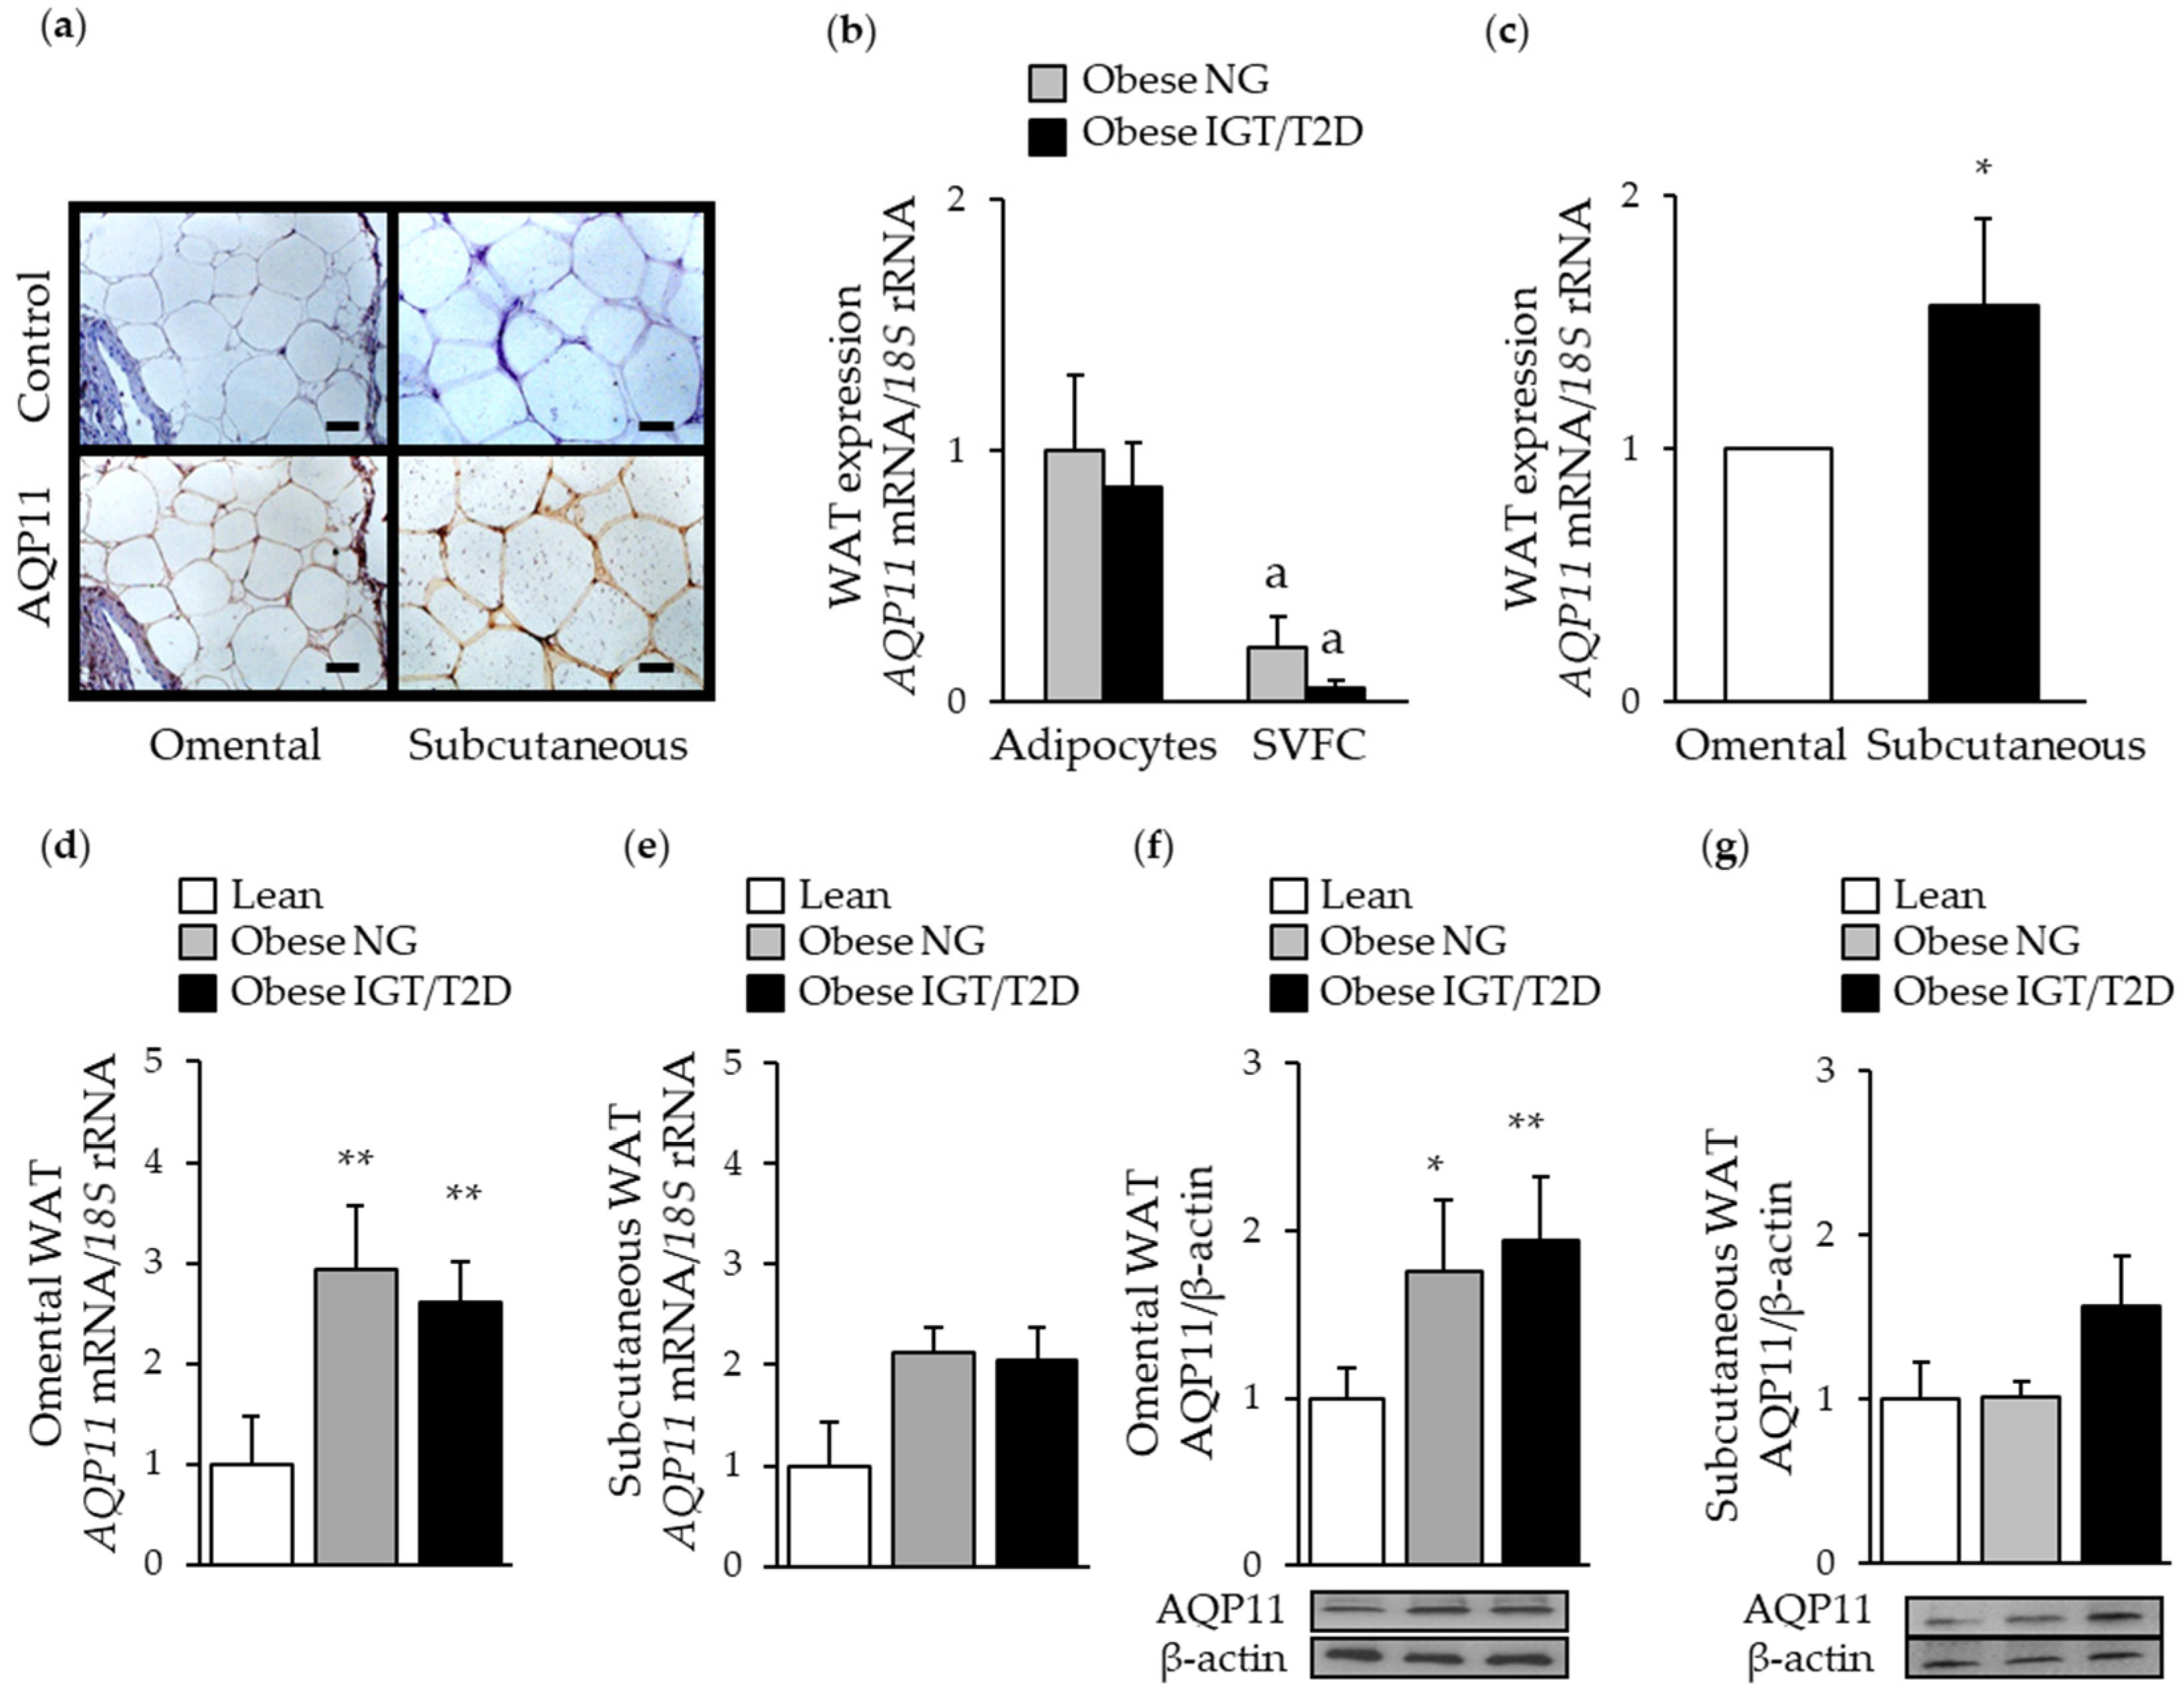
3.1. Obesity and Obesity-Associated Type 2 Diabetes Upregulated AQP11 Expression in Human Visceral Fat
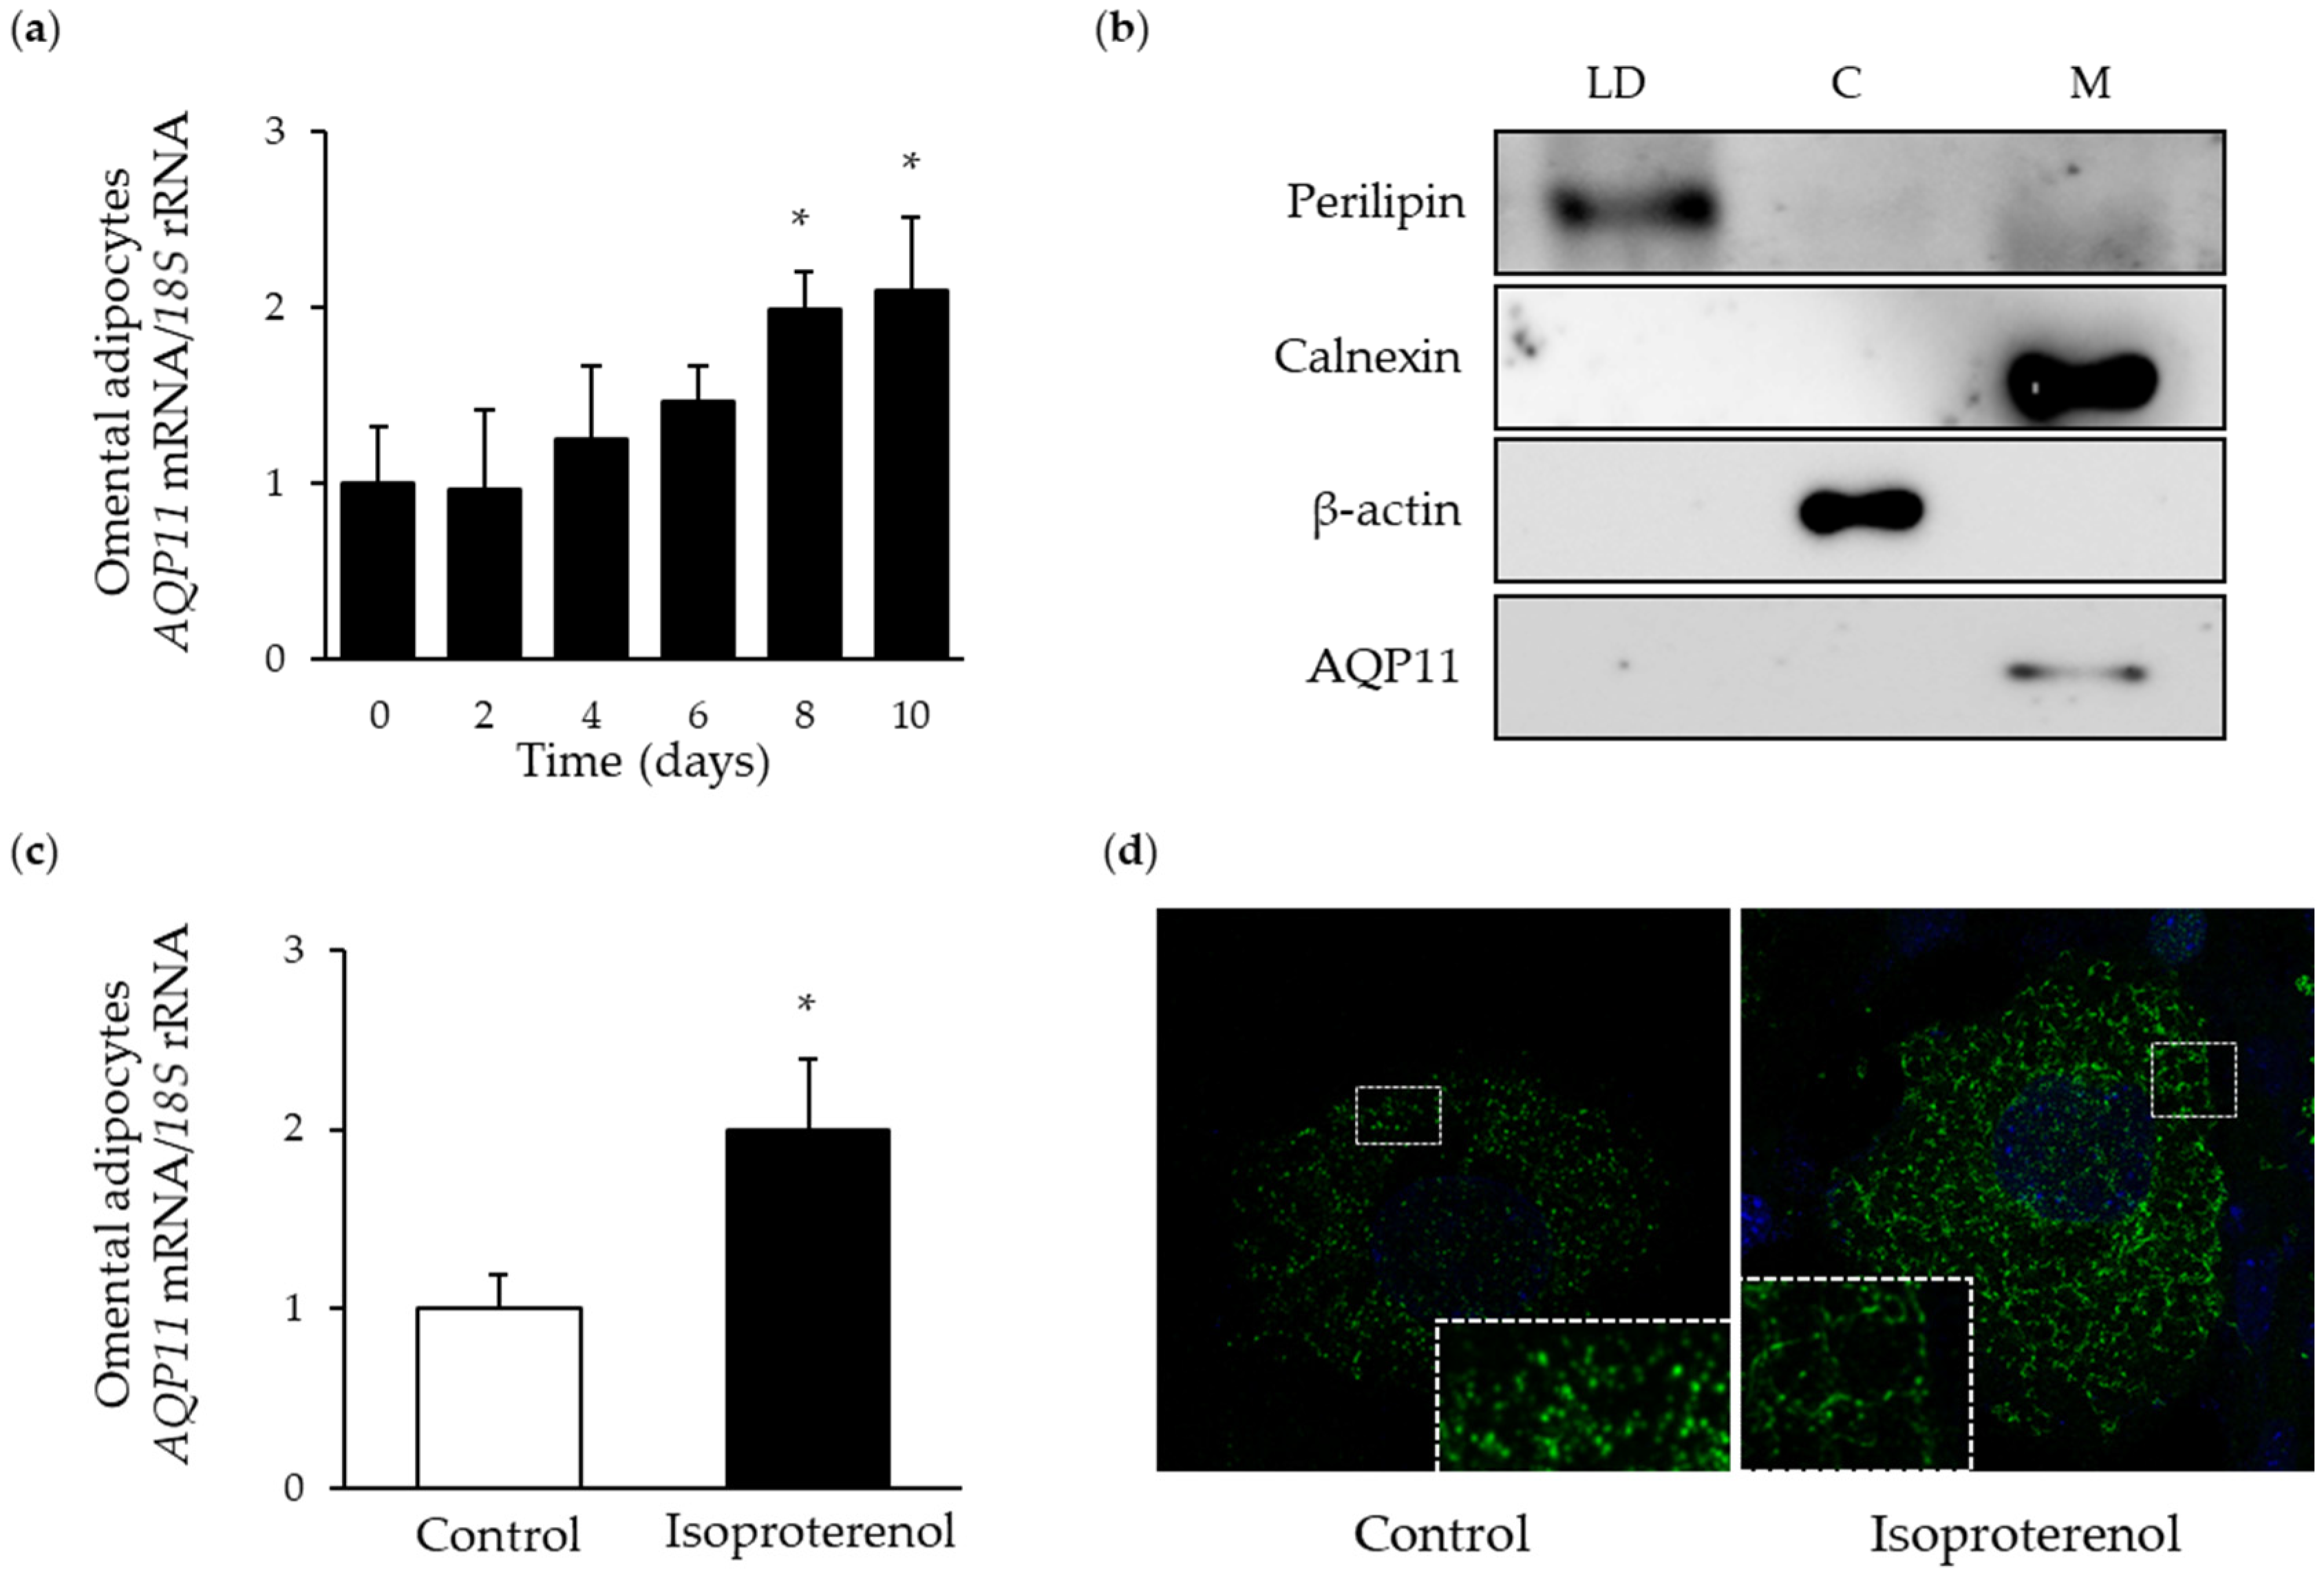
3.2. AQP11 is Increased during Adipocyte Differentiation and Lipolysis
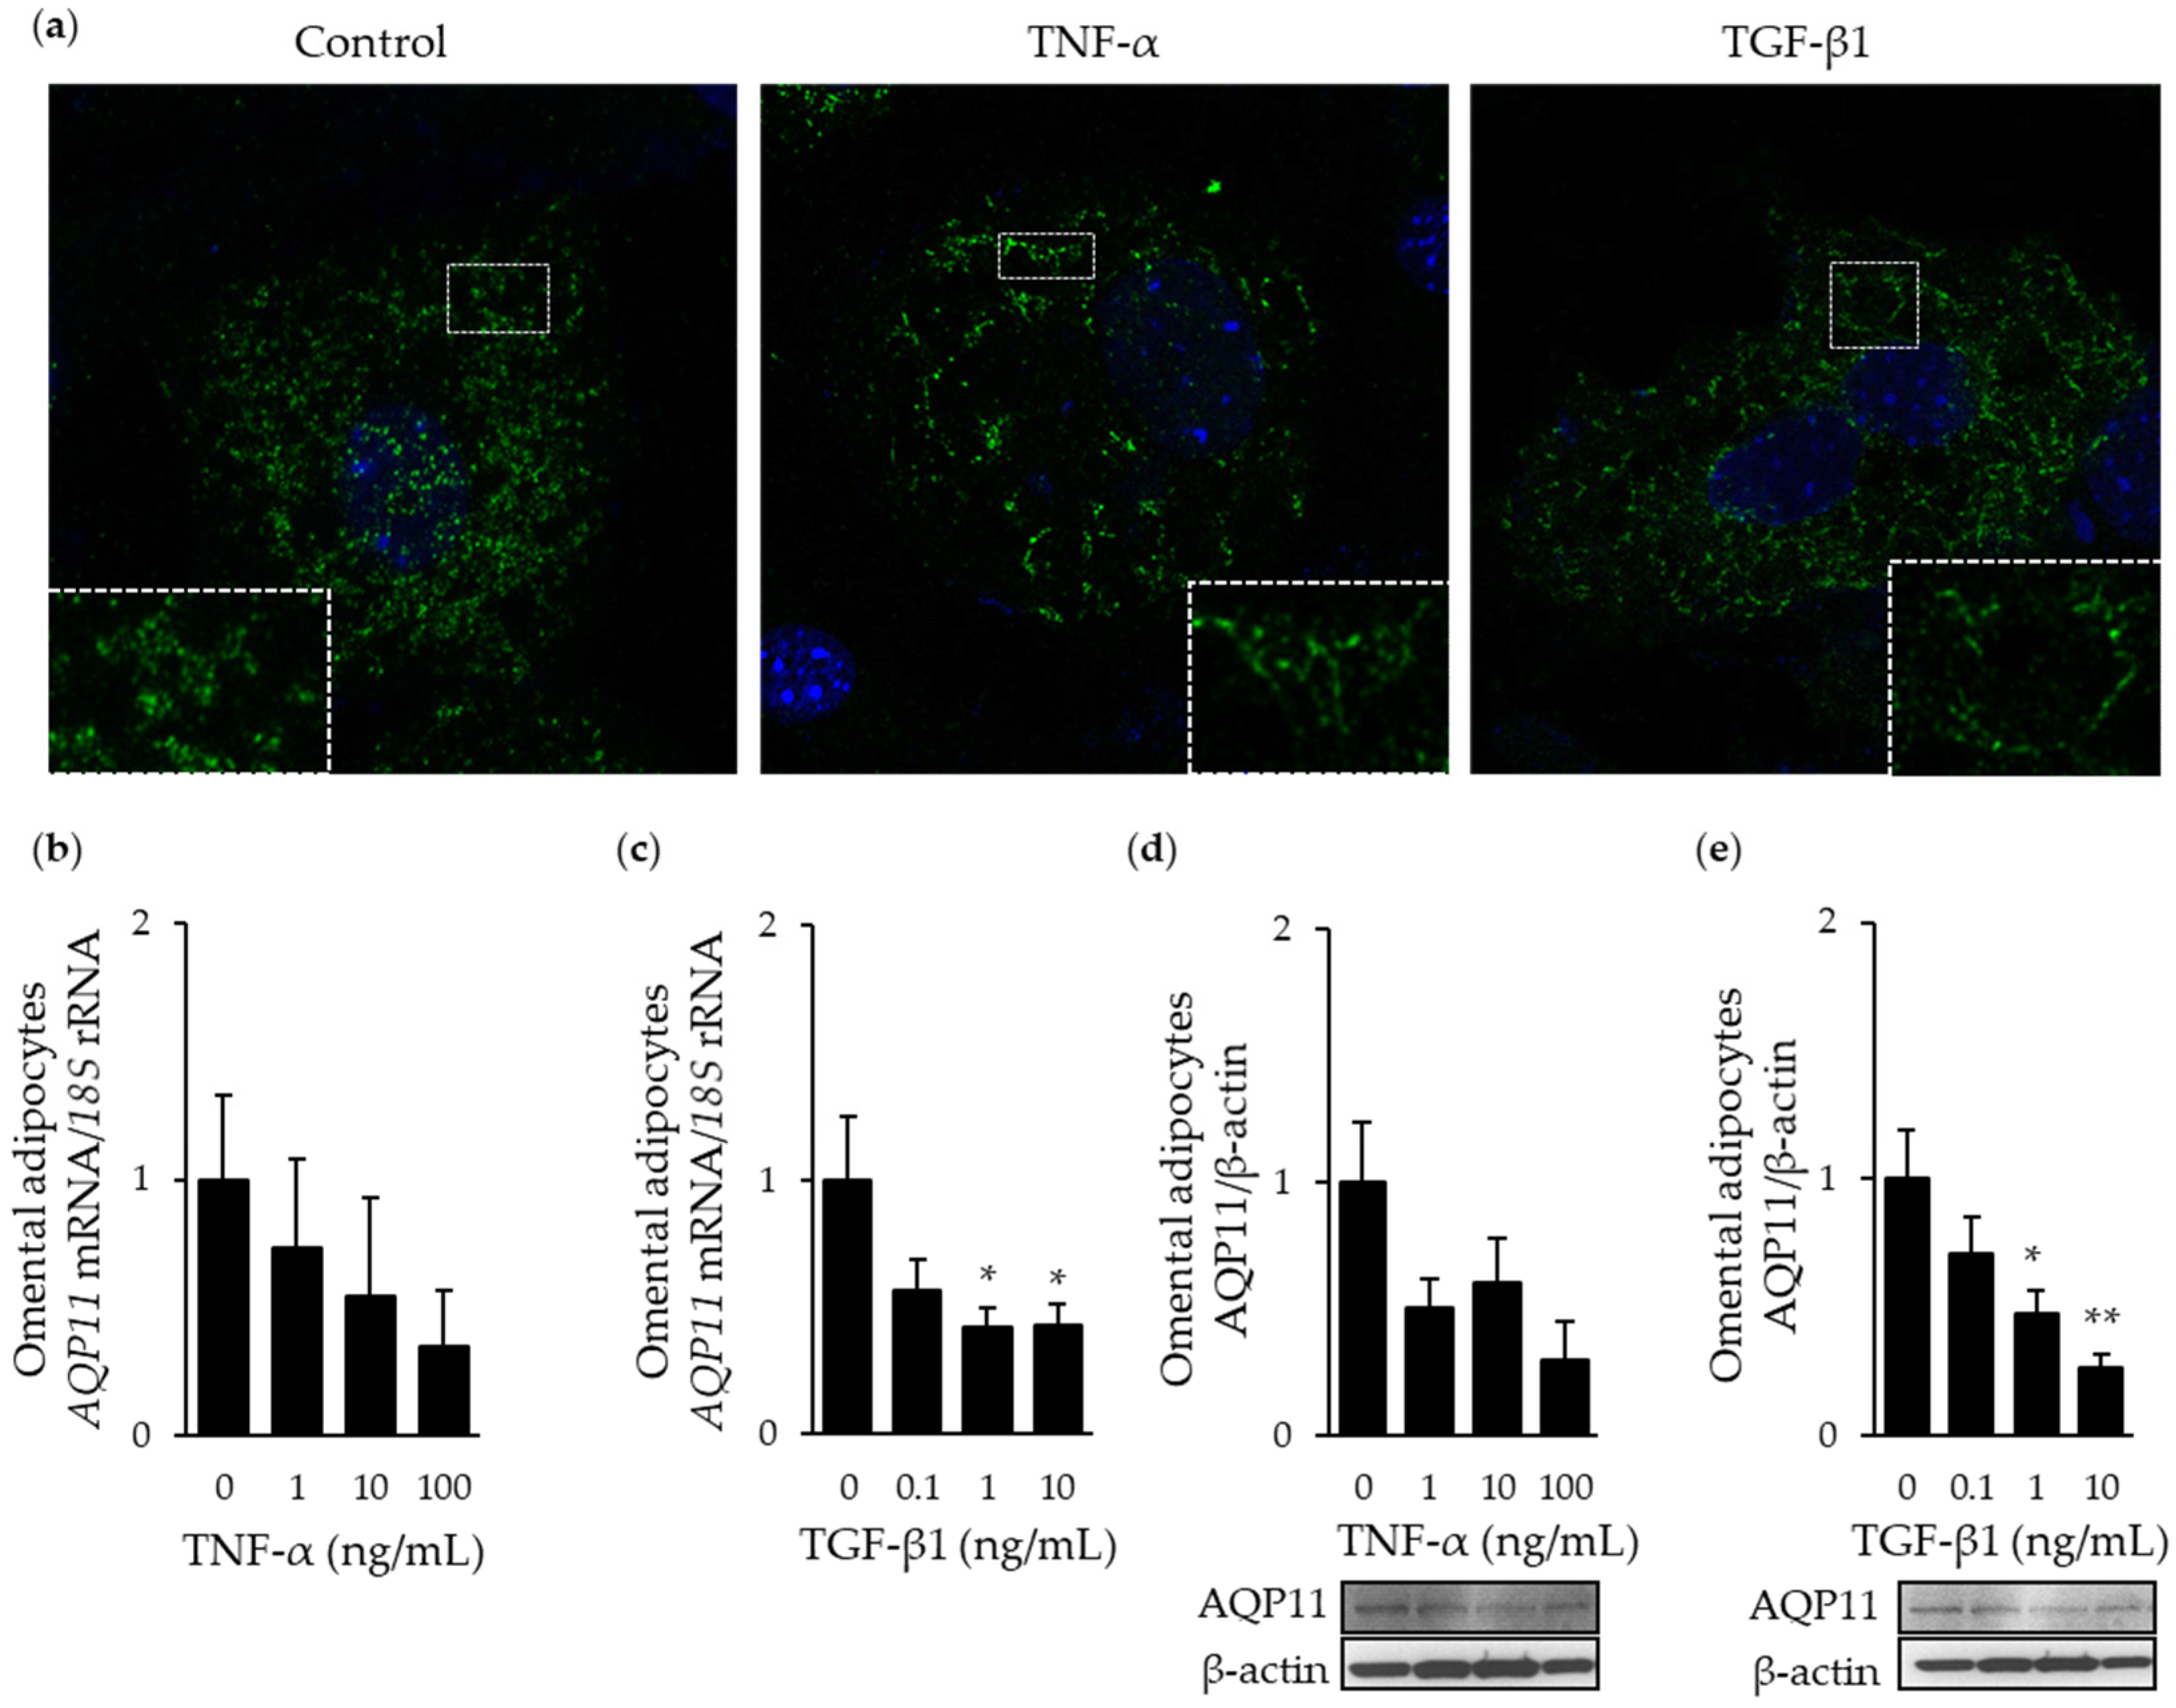
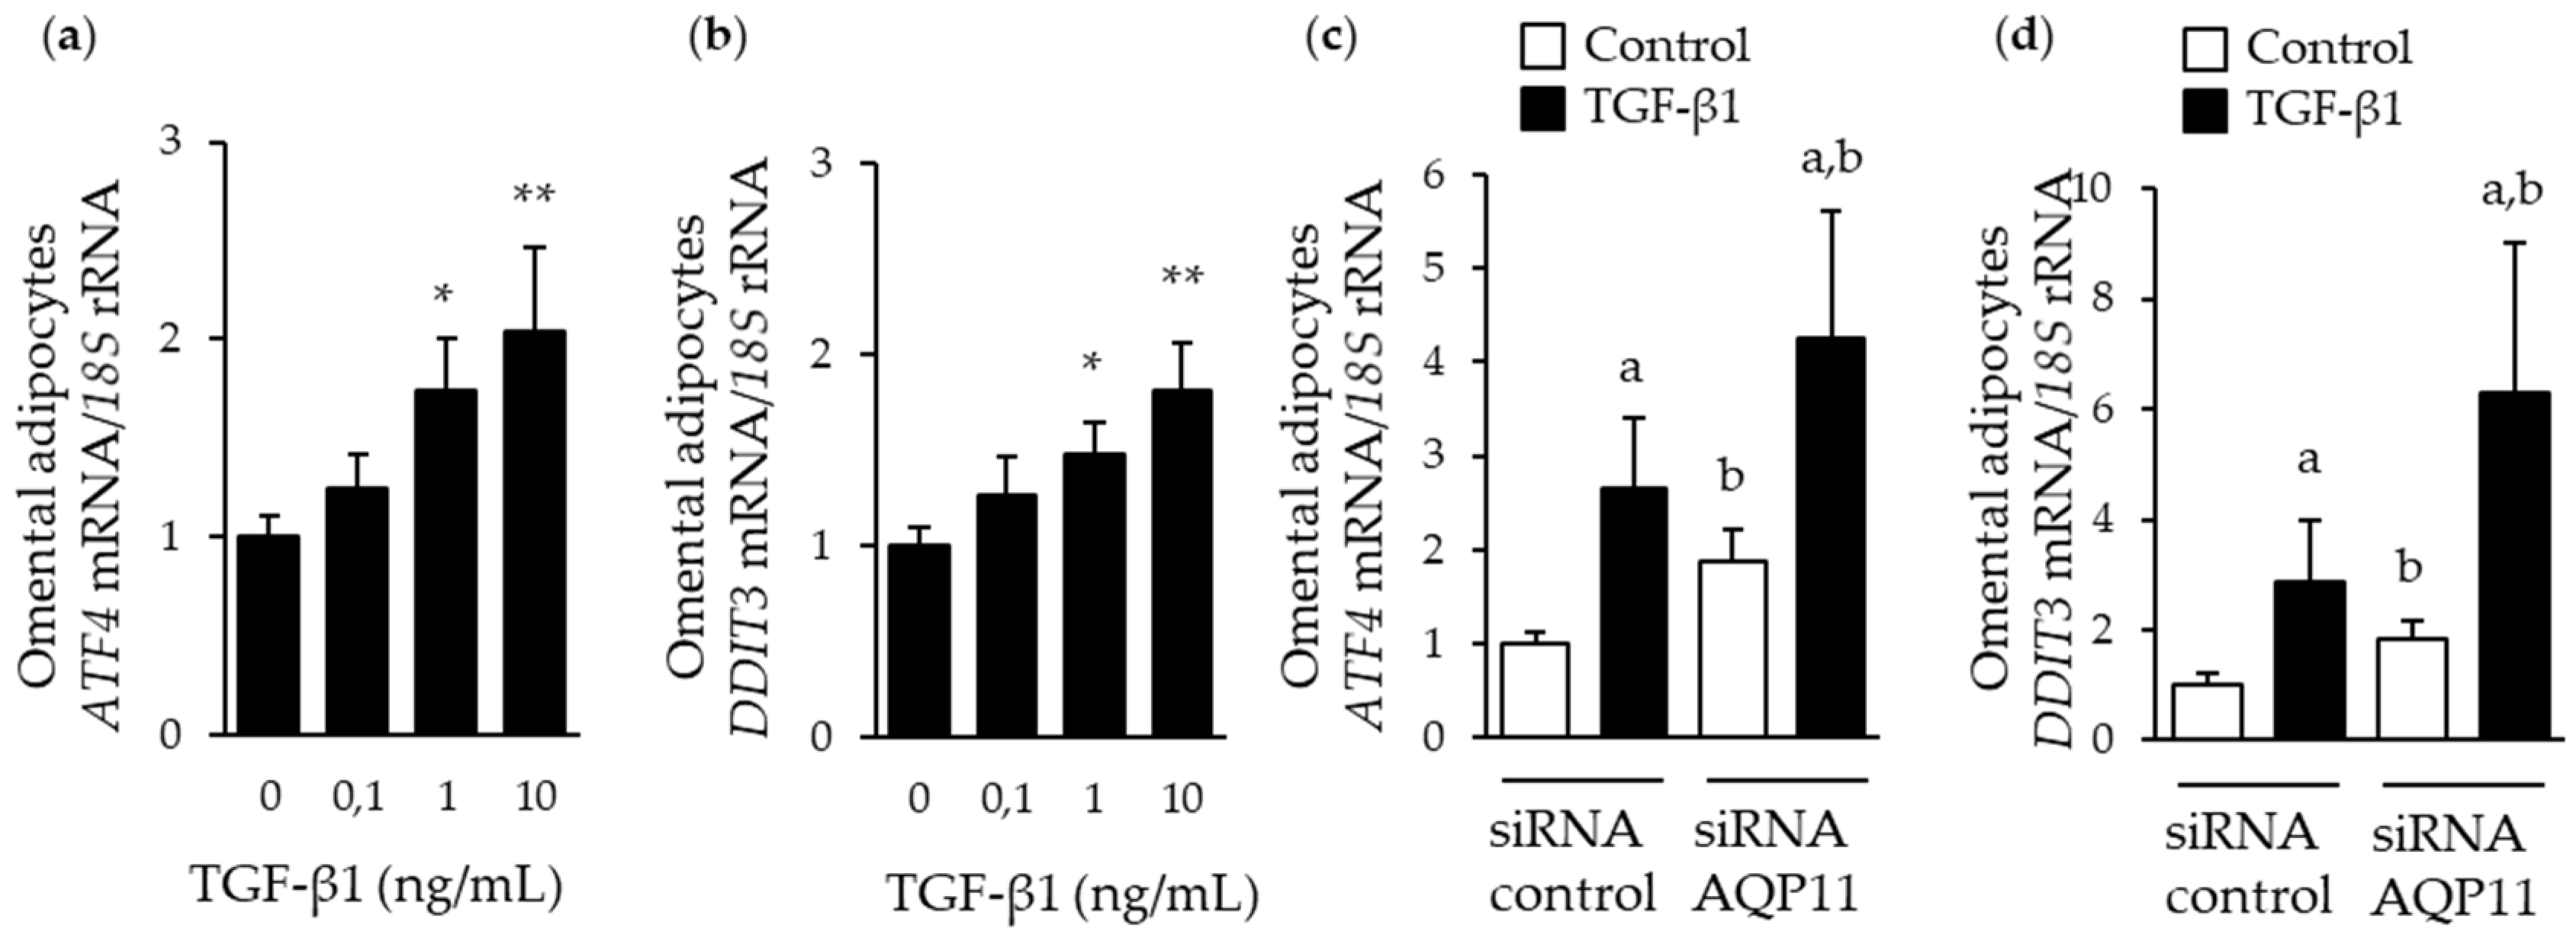
3.3. AQP11 Participates in TGF-β1-Induced Endoplasmic Reticulum Stress
4. Discussion
5. Conclusions
Supplementary Materials
Author Contributions
Funding
Acknowledgments
Conflicts of Interest
References
- Agre, P. The 2009 lindau nobel laureate meeting: Peter agre, chemistry 2003. J. Vis. Exp. JoVE 2009, e1565. [Google Scholar] [CrossRef]
- Li, S.; Li, C.; Wang, W. Molecular aspects of aquaporins. Vitam. Horm. 2020, 113, 129–181. [Google Scholar] [CrossRef]
- Tesse, A.; Grossini, E.; Tamma, G.; Brenner, C.; Portincasa, P.; Marinelli, R.A.; Calamita, G. Aquaporins as targets of dietary bioactive phytocompounds. Front. Mol. Biosci. 2018, 5, 30. [Google Scholar] [CrossRef] [PubMed] [Green Version]
- Frühbeck, G. Obesity: Aquaporin enters the picture. Nature 2005, 438, 436–437. [Google Scholar] [CrossRef] [PubMed]
- Méndez-Giménez, L.; Rodríguez, A.; Balaguer, I.; Frühbeck, G. Role of aquaglyceroporins and caveolins in energy and metabolic homeostasis. Mol. Cell. Endocrinol. 2014, 397, 78–92. [Google Scholar] [CrossRef] [PubMed]
- Calvanese, L.; Pellegrini-Calace, M.; Oliva, R. In silico study of human aquaporin AQP11 and AQP12 channels. Protein Sci. 2013, 22, 455–466. [Google Scholar] [CrossRef] [Green Version]
- Ishibashi, K.; Koike, S.; Kondo, S.; Hara, S.; Tanaka, Y. The role of a group III AQP, AQP11 in intracellular organelle homeostasis. J. Med. Investig. 2009, 56, 312–317. [Google Scholar] [CrossRef] [Green Version]
- Yakata, K.; Hiroaki, Y.; Ishibashi, K.; Sohara, E.; Sasaki, S.; Mitsuoka, K.; Fujiyoshi, Y. Aquaporin-11 containing a divergent NPA motif has normal water channel activity. Biochim. Biophys. Acta 2007, 1768, 688–693. [Google Scholar] [CrossRef] [Green Version]
- Madeira, A.; Fernandez-Veledo, S.; Camps, M.; Zorzano, A.; Moura, T.F.; Ceperuelo-Mallafre, V.; Vendrell, J.; Soveral, G. Human aquaporin-11 is a water and glycerol channel and localizes in the vicinity of lipid droplets in human adipocytes. Obesity 2014, 22, 2010–2017. [Google Scholar] [CrossRef]
- Bestetti, S.; Galli, M.; Sorrentino, I.; Pinton, P.; Rimessi, A.; Sitia, R.; Medrano-Fernandez, I. Human aquaporin-11 guarantees efficient transport of H2O2 across the endoplasmic reticulum membrane. Redox Biol. 2020, 28, 101326. [Google Scholar] [CrossRef]
- Rodrigues, C.; Pimpao, C.; Mosca, A.F.; Coxixo, A.S.; Lopes, D.; da Silva, I.V.; Pedersen, P.A.; Antunes, F.; Soveral, G. Human aquaporin-5 facilitates hydrogen peroxide permeation affecting adaption to oxidative stress and cancer cell migration. Cancers 2019, 11, 932. [Google Scholar] [CrossRef] [PubMed] [Green Version]
- Marchissio, M.J.; Frances, D.E.; Carnovale, C.E.; Marinelli, R.A. Mitochondrial aquaporin-8 knockdown in human hepatoma HepG2 cells causes ROS-induced mitochondrial depolarization and loss of viability. Toxicol. Appl. Pharmacol. 2012, 264, 246–254. [Google Scholar] [CrossRef] [PubMed]
- Miller, E.W.; Dickinson, B.C.; Chang, C.J. Aquaporin-3 mediates hydrogen peroxide uptake to regulate downstream intracellular signaling. Proc. Natl. Acad. Sci. USA 2010, 107, 15681–15686. [Google Scholar] [CrossRef] [PubMed] [Green Version]
- Watanabe, S.; Moniaga, C.S.; Nielsen, S.; Hara-Chikuma, M. Aquaporin-9 facilitates membrane transport of hydrogen peroxide in mammalian cells. Biochem. Biophys. Res. Commun. 2016, 471, 191–197. [Google Scholar] [CrossRef]
- Gorelick, D.A.; Praetorius, J.; Tsunenari, T.; Nielsen, S.; Agre, P. Aquaporin-11: A channel protein lacking apparent transport function expressed in brain. BMC Biochem. 2006, 7, 14. [Google Scholar] [CrossRef] [Green Version]
- Morishita, Y.; Matsuzaki, T.; Hara-chikuma, M.; Andoo, A.; Shimono, M.; Matsuki, A.; Kobayashi, K.; Ikeda, M.; Yamamoto, T.; Verkman, A.; et al. Disruption of aquaporin-11 produces polycystic kidneys following vacuolization of the proximal tubule. Mol. Cell. Biol. 2005, 25, 7770–7779. [Google Scholar] [CrossRef] [Green Version]
- Rützler, M.; Rojek, A.; Damgaard, M.V.; Andreasen, A.; Fenton, R.A.; Nielsen, S. Temporal deletion of Aqp11 in mice is linked to the severity of cyst-like disease. Am. J. Physiol. Renal. Physiol. 2017, 312, F343–F351. [Google Scholar] [CrossRef] [Green Version]
- Hoshino, Y.; Sonoda, H.; Nishimura, R.; Mori, K.; Ishibashi, K.; Ikeda, M. Involvement of the NADPH oxidase 2 pathway in renal oxidative stress in Aqp11 (-/-) mice. Biochem. Biophys. Rep. 2019, 17, 169–176. [Google Scholar] [CrossRef]
- Rojek, A.; Fuchtbauer, E.M.; Fuchtbauer, A.; Jelen, S.; Malmendal, A.; Fenton, R.A.; Nielsen, S. Liver-specific aquaporin 11 knockout mice show rapid vacuolization of the rough endoplasmic reticulum in periportal hepatocytes after feeding amino acids. Am. J. Physiol. Gastrointest. Liver Physiol. 2013, 304, G501–G515. [Google Scholar] [CrossRef]
- Ezquerro, S.; Becerril, S.; Tuero, C.; Méndez-Giménez, L.; Mocha, F.; Moncada, R.; Valentí, V.; Cienfuegos, J.A.; Catalán, V.; Gómez-Ambrosi, J.; et al. Role of ghrelin isoforms in the mitigation of hepatic inflammation, mitochondrial dysfunction, and endoplasmic reticulum stress after bariatric surgery in rats. Int. J. Obes. 2020, 44, 475–487. [Google Scholar] [CrossRef]
- Kawasaki, N.; Asada, R.; Saito, A.; Kanemoto, S.; Imaizumi, K. Obesity-induced endoplasmic reticulum stress causes chronic inflammation in adipose tissue. Sci. Rep. 2012, 2, 799. [Google Scholar] [CrossRef] [PubMed] [Green Version]
- Ozcan, U.; Cao, Q.; Yilmaz, E.; Lee, A.H.; Iwakoshi, N.N.; Ozdelen, E.; Tuncman, G.; Gorgun, C.; Glimcher, L.H.; Hotamisligil, G.S. Endoplasmic reticulum stress links obesity, insulin action, and type 2 diabetes. Science 2004, 306, 457–461. [Google Scholar] [CrossRef] [PubMed] [Green Version]
- American Diabetes Association. 2. Classification and diagnosis of diabetes: Standards of medical care in diabetes-2019. Diabetes Care 2019, 42, S13–S28. [Google Scholar] [CrossRef] [PubMed] [Green Version]
- Rodríguez, A.; Catalán, V.; Gómez-Ambrosi, J.; García-Navarro, S.; Rotellar, F.; Valentí, V.; Silva, C.; Gil, M.J.; Salvador, J.; Burrell, M.A.; et al. Insulin- and leptin-mediated control of aquaglyceroporins in human adipocytes and hepatocytes is mediated via the PI3K/Akt/mTOR signaling cascade. J. Clin. Endocrinol. Metab. 2011, 96, E586–E597. [Google Scholar] [CrossRef] [Green Version]
- Guzmán-Ruiz, R.; Tercero-Alcázar, C.; Rabanal-Ruiz, Y.; Díaz-Ruiz, A.; El Bekay, R.; Rangel-Zuñiga, O.A.; Navarro-Ruiz, M.C.; Molero, L.; Membrives, A.; Ruiz-Rabelo, J.F.; et al. Adipose tissue depot-specific intracellular and extracellular cues contributing to insulin resistance in obese individuals. FASEB J. 2020. [Google Scholar] [CrossRef] [Green Version]
- Pulido, M.R.; Díaz-Ruiz, A.; Jiménez-Gómez, Y.; García-Navarro, S.; Gracia-Navarro, F.; Tinahones, F.; López-Miranda, J.; Frühbeck, G.; Vázquez-Martínez, R.; Malagón, M.M. Rab18 dynamics in adipocytes in relation to lipogenesis, lipolysis and obesity. PLoS ONE 2011, 6, e22931. [Google Scholar] [CrossRef] [Green Version]
- Catalán, V.; Gómez-Ambrosi, J.; Pastor, C.; Rotellar, F.; Silva, C.; Rodríguez, A.; Gil, M.J.; Cienfuegos, J.A.; Salvador, J.; Vendrell, J.; et al. Influence of morbid obesity and insulin resistance on gene expression levels of AQP7 in visceral adipose tissue and AQP9 in liver. Obes. Surg. 2008, 18, 695–701. [Google Scholar] [CrossRef]
- Díaz-Ruiz, A.; Guzmán-Ruiz, R.; Moreno, N.R.; García-Ríos, A.; Delgado-Casado, N.; Membrives, A.; Tunez, I.; El Bekay, R.; Fernández-Real, J.M.; Tovar, S.; et al. Proteasome dysfunction associated to oxidative stress and proteotoxicity in adipocytes compromises insulin sensitivity in human obesity. Antioxid. Redox Signal. 2015, 23, 597–612. [Google Scholar] [CrossRef] [Green Version]
- Heid, H.; Rickelt, S.; Zimbelmann, R.; Winter, S.; Schumacher, H.; Dorflinger, Y.; Kuhn, C.; Franke, W.W. On the formation of lipid droplets in human adipocytes: The organization of the perilipin-vimentin cortex. PLoS ONE 2014, 9, e90386. [Google Scholar] [CrossRef] [Green Version]
- Skinner, J.R.; Harris, L.A.; Shew, T.M.; Abumrad, N.A.; Wolins, N.E. Perilipin 1 moves between the fat droplet and the endoplasmic reticulum. Adipocyte 2013, 2, 80–86. [Google Scholar] [CrossRef] [Green Version]
- Sztalryd, C.; Brasaemle, D.L. The perilipin family of lipid droplet proteins: Gatekeepers of intracellular lipolysis. Biochim. Biophys. Acta Mol. Cell Biol. Lipids 2017, 1862, 1221–1232. [Google Scholar] [CrossRef]
- Frühbeck, G.; Méndez-Giménez, L.; Fernández-Formoso, J.A.; Fernández, S.; Rodríguez, A. Regulation of adipocyte lipolysis. Nutr. Res. Rev. 2014, 27, 63–93. [Google Scholar] [CrossRef] [PubMed] [Green Version]
- Hansen, J.S.; Krintel, C.; Hernebring, M.; Haataja, T.J.; de Marè, S.; Wasserstrom, S.; Kosinska-Eriksson, U.; Palmgren, M.; Holm, C.; Stenkula, K.G.; et al. Perilipin 1 binds to aquaporin 7 in human adipocytes and controls its mobility via protein kinase A mediated phosphorylation. Metabolism 2016, 65, 1731–1742. [Google Scholar] [CrossRef] [PubMed] [Green Version]
- Kishida, K.; Kuriyama, H.; Funahashi, T.; Shimomura, I.; Kihara, S.; Ouchi, N.; Nishida, M.; Nishizawa, H.; Matsuda, M.; Takahashi, M.; et al. Aquaporin adipose, a putative glycerol channel in adipocytes. J. Biol. Chem. 2000, 275, 20896–20902. [Google Scholar] [CrossRef] [Green Version]
- Laforenza, U.; Scaffino, M.F.; Gastaldi, G. Aquaporin-10 represents an alternative pathway for glycerol efflux from human adipocytes. PLoS ONE 2013, 8, e54474. [Google Scholar] [CrossRef]
- Paar, M.; Jungst, C.; Steiner, N.A.; Magnes, C.; Sinner, F.; Kolb, D.; Lass, A.; Zimmermann, R.; Zumbusch, A.; Kohlwein, S.D.; et al. Remodeling of lipid droplets during lipolysis and growth in adipocytes. J. Biol. Chem. 2012, 287, 11164–11173. [Google Scholar] [CrossRef] [Green Version]
- Rodríguez, A.; Becerril, S.; Hernández-Pardos, A.W.; Frühbeck, G. Adipose tissue depot differences in adipokines and effects on skeletal and cardiac muscle. Curr. Opin. Pharmacol. 2020, 52, 1–8. [Google Scholar] [CrossRef] [PubMed]
- Hotamisligil, G.S. Endoplasmic reticulum stress and the inflammatory basis of metabolic disease. Cell 2010, 140, 900–917. [Google Scholar] [CrossRef] [Green Version]
- Heinonen, S.; Muniandy, M.; Buzkova, J.; Mardinoglu, A.; Rodríguez, A.; Frühbeck, G.; Hakkarainen, A.; Lundbom, J.; Lundbom, N.; Kaprio, J.; et al. Mitochondria-related transcriptional signature is downregulated in adipocytes in obesity: A study of young healthy MZ twins. Diabetologia 2017, 60, 169–181. [Google Scholar] [CrossRef] [Green Version]
- Baldini, F.; Portincasa, P.; Grasselli, E.; Damonte, G.; Salis, A.; Bonomo, M.; Florio, M.; Serale, N.; Voci, A.; Gena, P.; et al. Aquaporin-9 is involved in the lipid-lowering activity of the nutraceutical silybin on hepatocytes through modulation of autophagy and lipid droplets composition. Biochim. Biophys. Acta Mol. Cell Biol. Lipids 2020, 1865, 158586. [Google Scholar] [CrossRef]
- Chen, Y.; Wu, Z.; Zhao, S.; Xiang, R. Chemical chaperones reduce ER stress and adipose tissue inflammation in high fat diet-induced mouse model of obesity. Sci. Rep. 2016, 6, 27486. [Google Scholar] [CrossRef] [PubMed] [Green Version]
- Chiadak, J.D.; Arsenijevic, T.; Gregoire, F.; Bolaky, N.; Delforge, V.; Perret, J.; Delporte, C. Involvement of JNK/NFkB signaling pathways in the lipopolysaccharide-induced modulation of aquaglyceroporin expression in 3T3-L1 Cells differentiated into adipocytes. Int. J. Mol. Sci. 2016, 17, 1742. [Google Scholar] [CrossRef] [PubMed] [Green Version]


| Lean | Obese NG | Obese IGT/T2D | p | |
|---|---|---|---|---|
| n | 14 | 24 | 29 | - |
| Sex (male/female) | 6/8 | 10/14 | 13/16 | 0.973 |
| Age (years) | 48 ± 3 | 41 ± 3 | 45 ± 2 | 0.140 |
| BMI (kg/m2) | 23.1 ± 0.8 | 47.2 ± 1.5 a | 48.6 ± 1.6 a | <0.0001 |
| Body fat (%) | 24.8 ± 2.8 | 51.7 ± 1.4 a | 52.1 ± 1.3 a | <0.0001 |
| Glucose (mg/dL) | 85 ± 3 | 91 ± 2 | 120 ± 7 a,b | 0.001 |
| Glucose 2-h OGTT (mg/dL) | - | 119 ± 6 | 194 ± 14 b | <0.0001 |
| Insulin (µU/mL) | 7.8 ± 1.4 | 21.1 ± 2.8 a | 23.9 ± 4.9 a | 0.004 |
| Insulin 2-h OGTT (µU/mL) | - | 93.2 ± 13.6 | 90.6 ± 7.3 | 0.862 |
| HOMA | 1.7 ± 0.3 | 4.8 ± 0.7 a | 7.8 ± 2.0 a | 0.007 |
| QUICKI | 0.36 ± 0.01 | 0.31 ± 0.01 a | 0.31 ± 0.01 a | 0.014 |
| FFA (mmol/L) | 13.3 ± 1.6 | 17.0 ± 1.3 | 18.6 ± 1.9 a | 0.040 |
| Glycerol (mg/dL) | 22.5 ± 3.5 | 34.1 ± 3.4 | 44.4 ± 5.0 a | 0.008 |
| Adipo-IR index | 21.1 ± 3.1 | 83.6 ± 11.6 | 108.6 ± 19.8 a | 0.003 |
| Triacylglycerol (mg/dL) | 68 ± 9 | 135 ± 19 a | 165 ± 33 a | 0.011 |
| Total cholesterol (mg/dL) | 191 ± 8 | 196 ± 8 | 200 ± 6 | 0.800 |
| LDL-cholesterol (mg/dL) | 117 ± 8 | 119 ± 8 | 130 ± 6 | 0.448 |
| HDL-cholesterol (mg/dL) | 59 ± 2 | 49 ± 5 a | 44 ± 2 a | 0.013 |
| CRP (mg/L) | 2.3 ± 0.6 | 8.8 ± 1.4 a | 11.5 ± 2.8 a | 0.001 |
| Uric acid (mg/dL) | 4.2 ± 0.4 | 9.2 ± 2.8 a | 6.5 ± 0.2 a | 0.007 |
| Leptin (ng/mL) | 7.2 ± 1.4 | 46.9 ± 5.8 a | 53.5 ± 6.5 a | 0.004 |
| TNF-α (ng/mL) | 0.87 ± 0.15 | 1.89 ± 0.12 a | 2.02 ± 0.41 a | 0.003 |
| Fibrinogen (mg/dL) | 251 ± 42 | 358 ± 16 a | 372 ± 15 a | 0.003 |
| von Willebrand factor (%) | 87 ± 11 | 126 ± 9 a | 154 ± 14 a | 0.025 |
| Antihypertensive therapy, n (%) | 0 (0%) | 7 (29%) | 8 (28%) | 0.092 |
| Antidiabetic therapy, n (%) | 0 (0%) | 0 (0%) | 4 (14%) | 0.041 |
| Lipid-lowering therapy, n (%) | 0 (0%) | 4 (17%) | 2 (22%) | 0.384 |
© 2020 by the authors. Licensee MDPI, Basel, Switzerland. This article is an open access article distributed under the terms and conditions of the Creative Commons Attribution (CC BY) license (http://creativecommons.org/licenses/by/4.0/).
Share and Cite
Frühbeck, G.; Balaguer, I.; Méndez-Giménez, L.; Valentí, V.; Becerril, S.; Catalán, V.; Gómez-Ambrosi, J.; Silva, C.; Salvador, J.; Calamita, G.; et al. Aquaporin-11 Contributes to TGF-β1-induced Endoplasmic Reticulum Stress in Human Visceral Adipocytes: Role in Obesity-Associated Inflammation. Cells 2020, 9, 1403. https://0-doi-org.brum.beds.ac.uk/10.3390/cells9061403
Frühbeck G, Balaguer I, Méndez-Giménez L, Valentí V, Becerril S, Catalán V, Gómez-Ambrosi J, Silva C, Salvador J, Calamita G, et al. Aquaporin-11 Contributes to TGF-β1-induced Endoplasmic Reticulum Stress in Human Visceral Adipocytes: Role in Obesity-Associated Inflammation. Cells. 2020; 9(6):1403. https://0-doi-org.brum.beds.ac.uk/10.3390/cells9061403
Chicago/Turabian StyleFrühbeck, Gema, Inmaculada Balaguer, Leire Méndez-Giménez, Víctor Valentí, Sara Becerril, Victoria Catalán, Javier Gómez-Ambrosi, Camilo Silva, Javier Salvador, Giuseppe Calamita, and et al. 2020. "Aquaporin-11 Contributes to TGF-β1-induced Endoplasmic Reticulum Stress in Human Visceral Adipocytes: Role in Obesity-Associated Inflammation" Cells 9, no. 6: 1403. https://0-doi-org.brum.beds.ac.uk/10.3390/cells9061403