Silence of Hippo Pathway Associates with Pro-Tumoral Immunosuppression: Potential Therapeutic Target of Glioblastomas

 ,
,  , , and
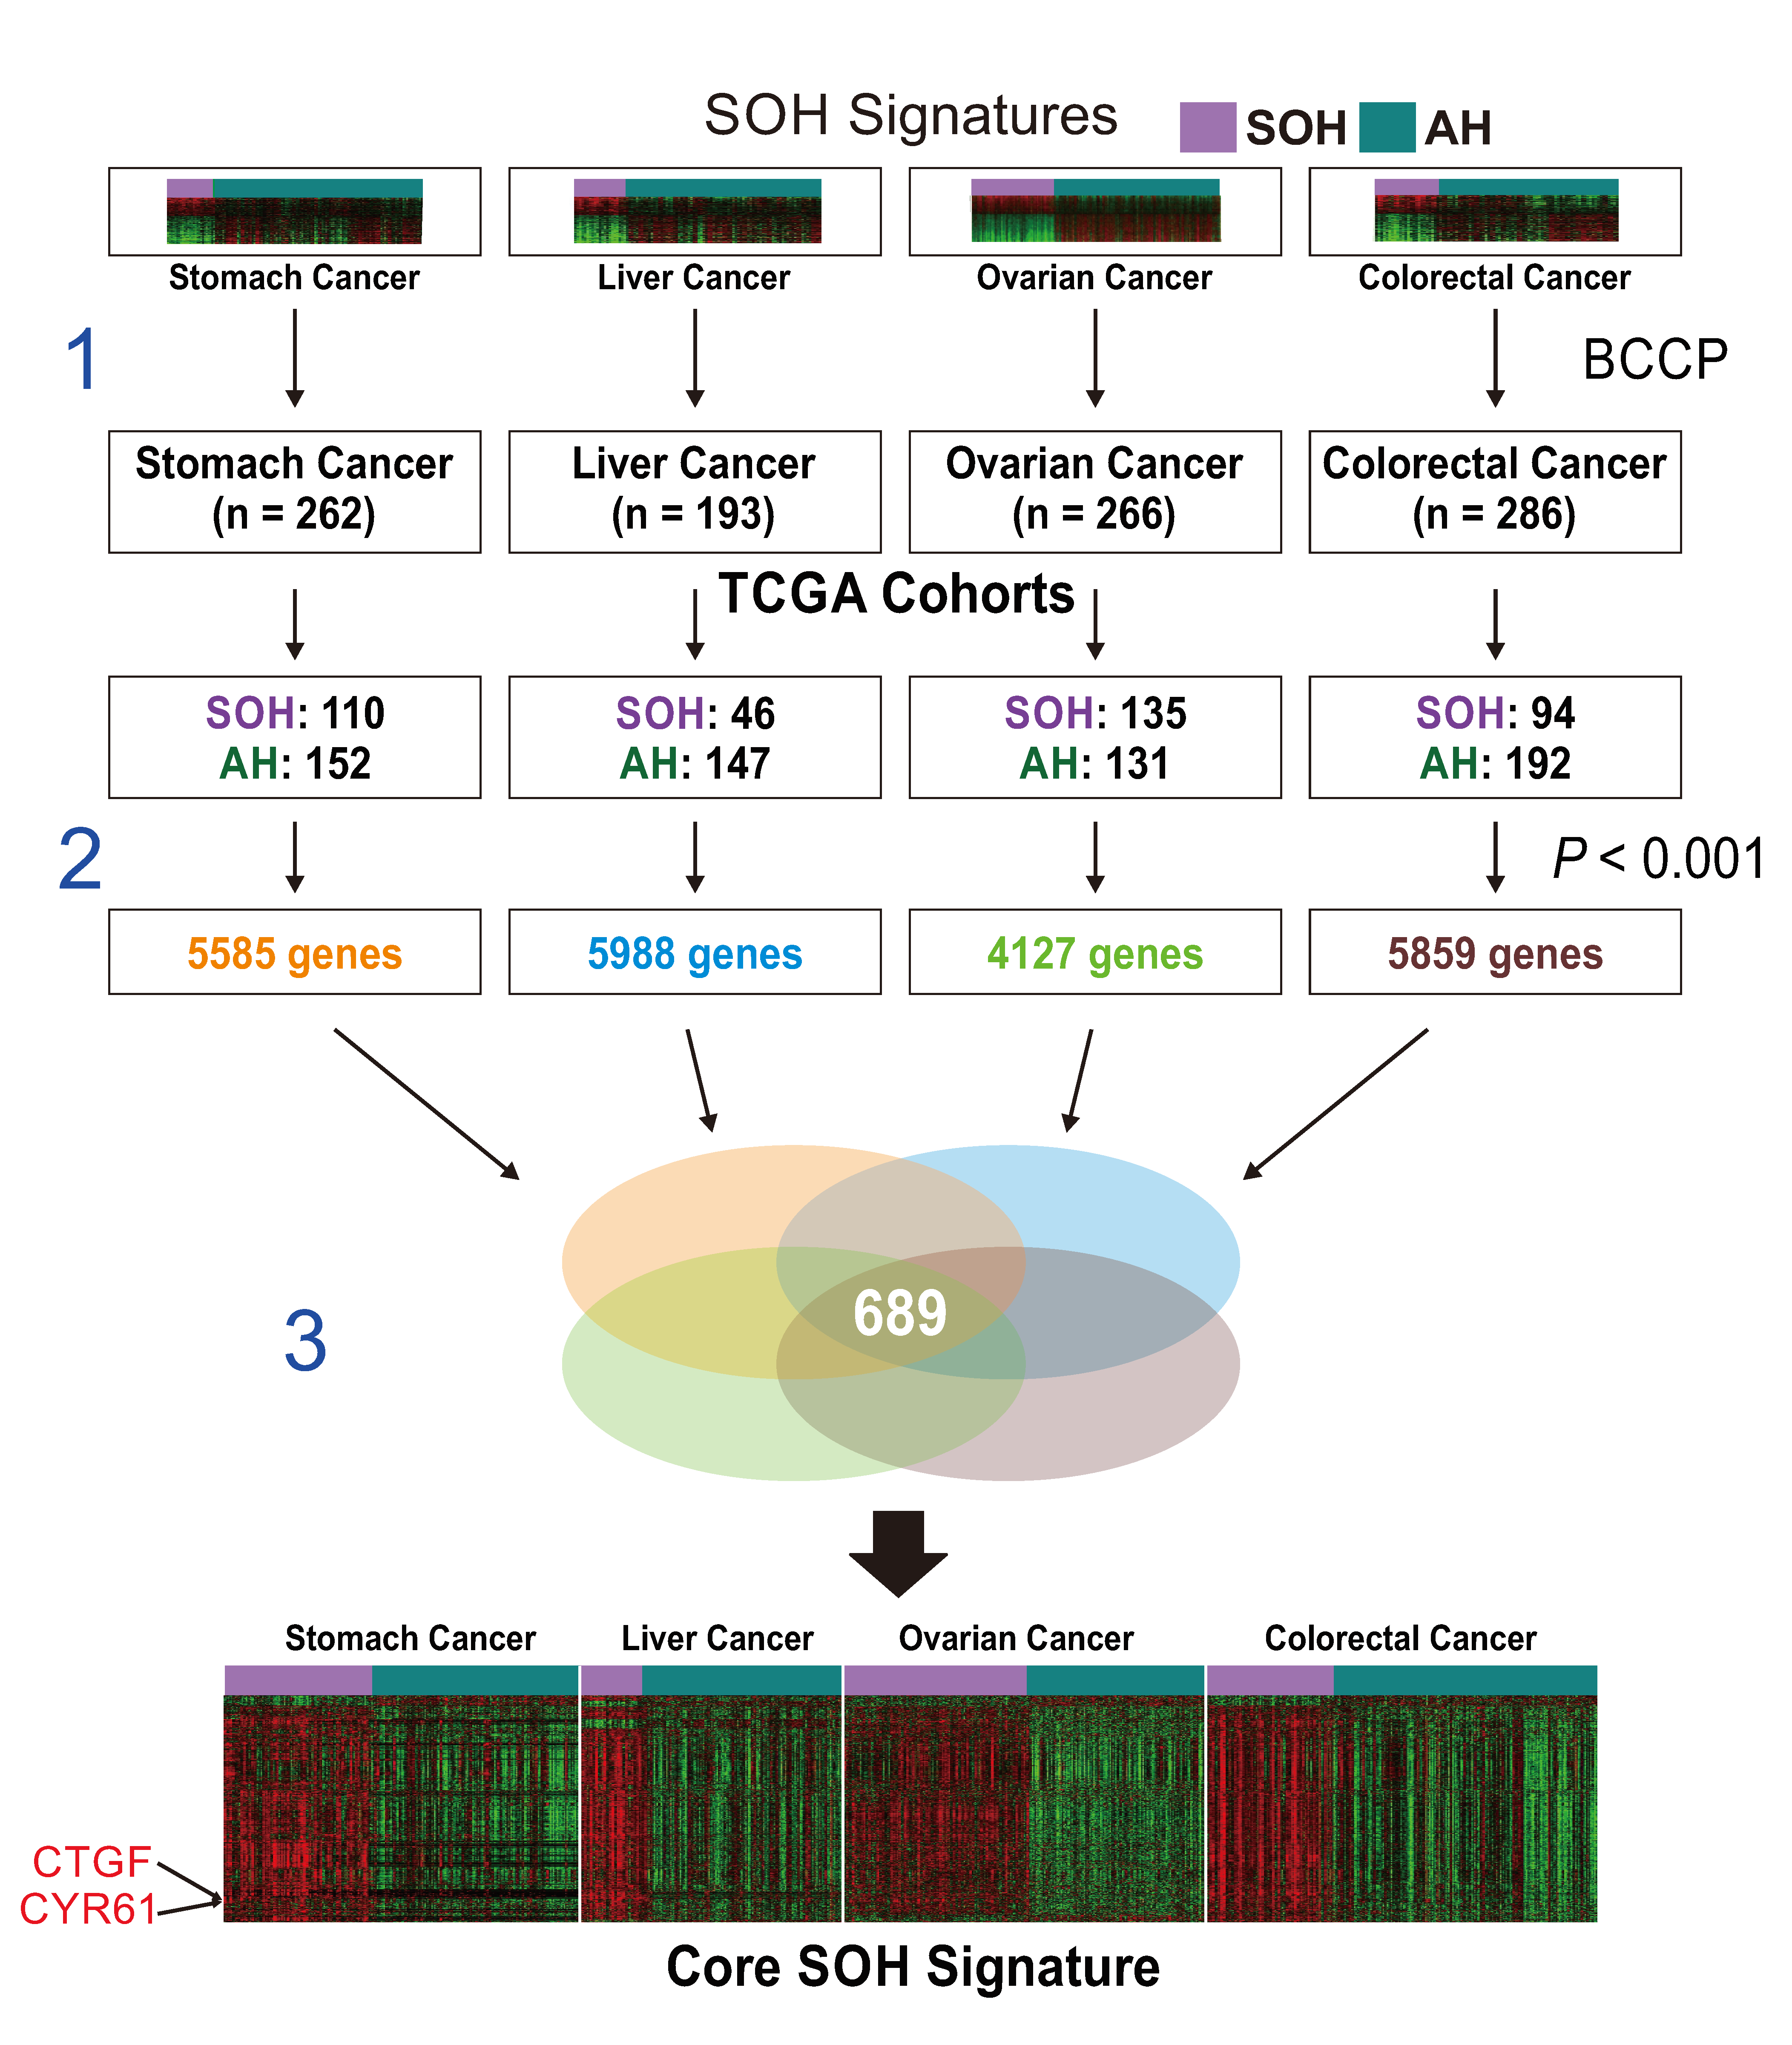
Abstract
:1. Introduction
2. Materials and Methods
2.1. General Analytic Methods
2.2. Generation of a Core SOH Signature and Validation in GBM Datasets
2.3. Genomic Analysis of TCGA Cohort Data
2.4. Proteomics of TCGA Cohort Data
2.5. Comparison of mRNA Expression Levels and Pathway Analysis
2.6. Immunohistochemistry on GBM Tissue
2.7. Immune Signature Score (ISS) and Leukocyte Subset Analysis
2.8. Transforming Growth Factor Beta (TGF-β) Signature
2.9. Epithelial–Mesenchymal Transition Signature
3. Results
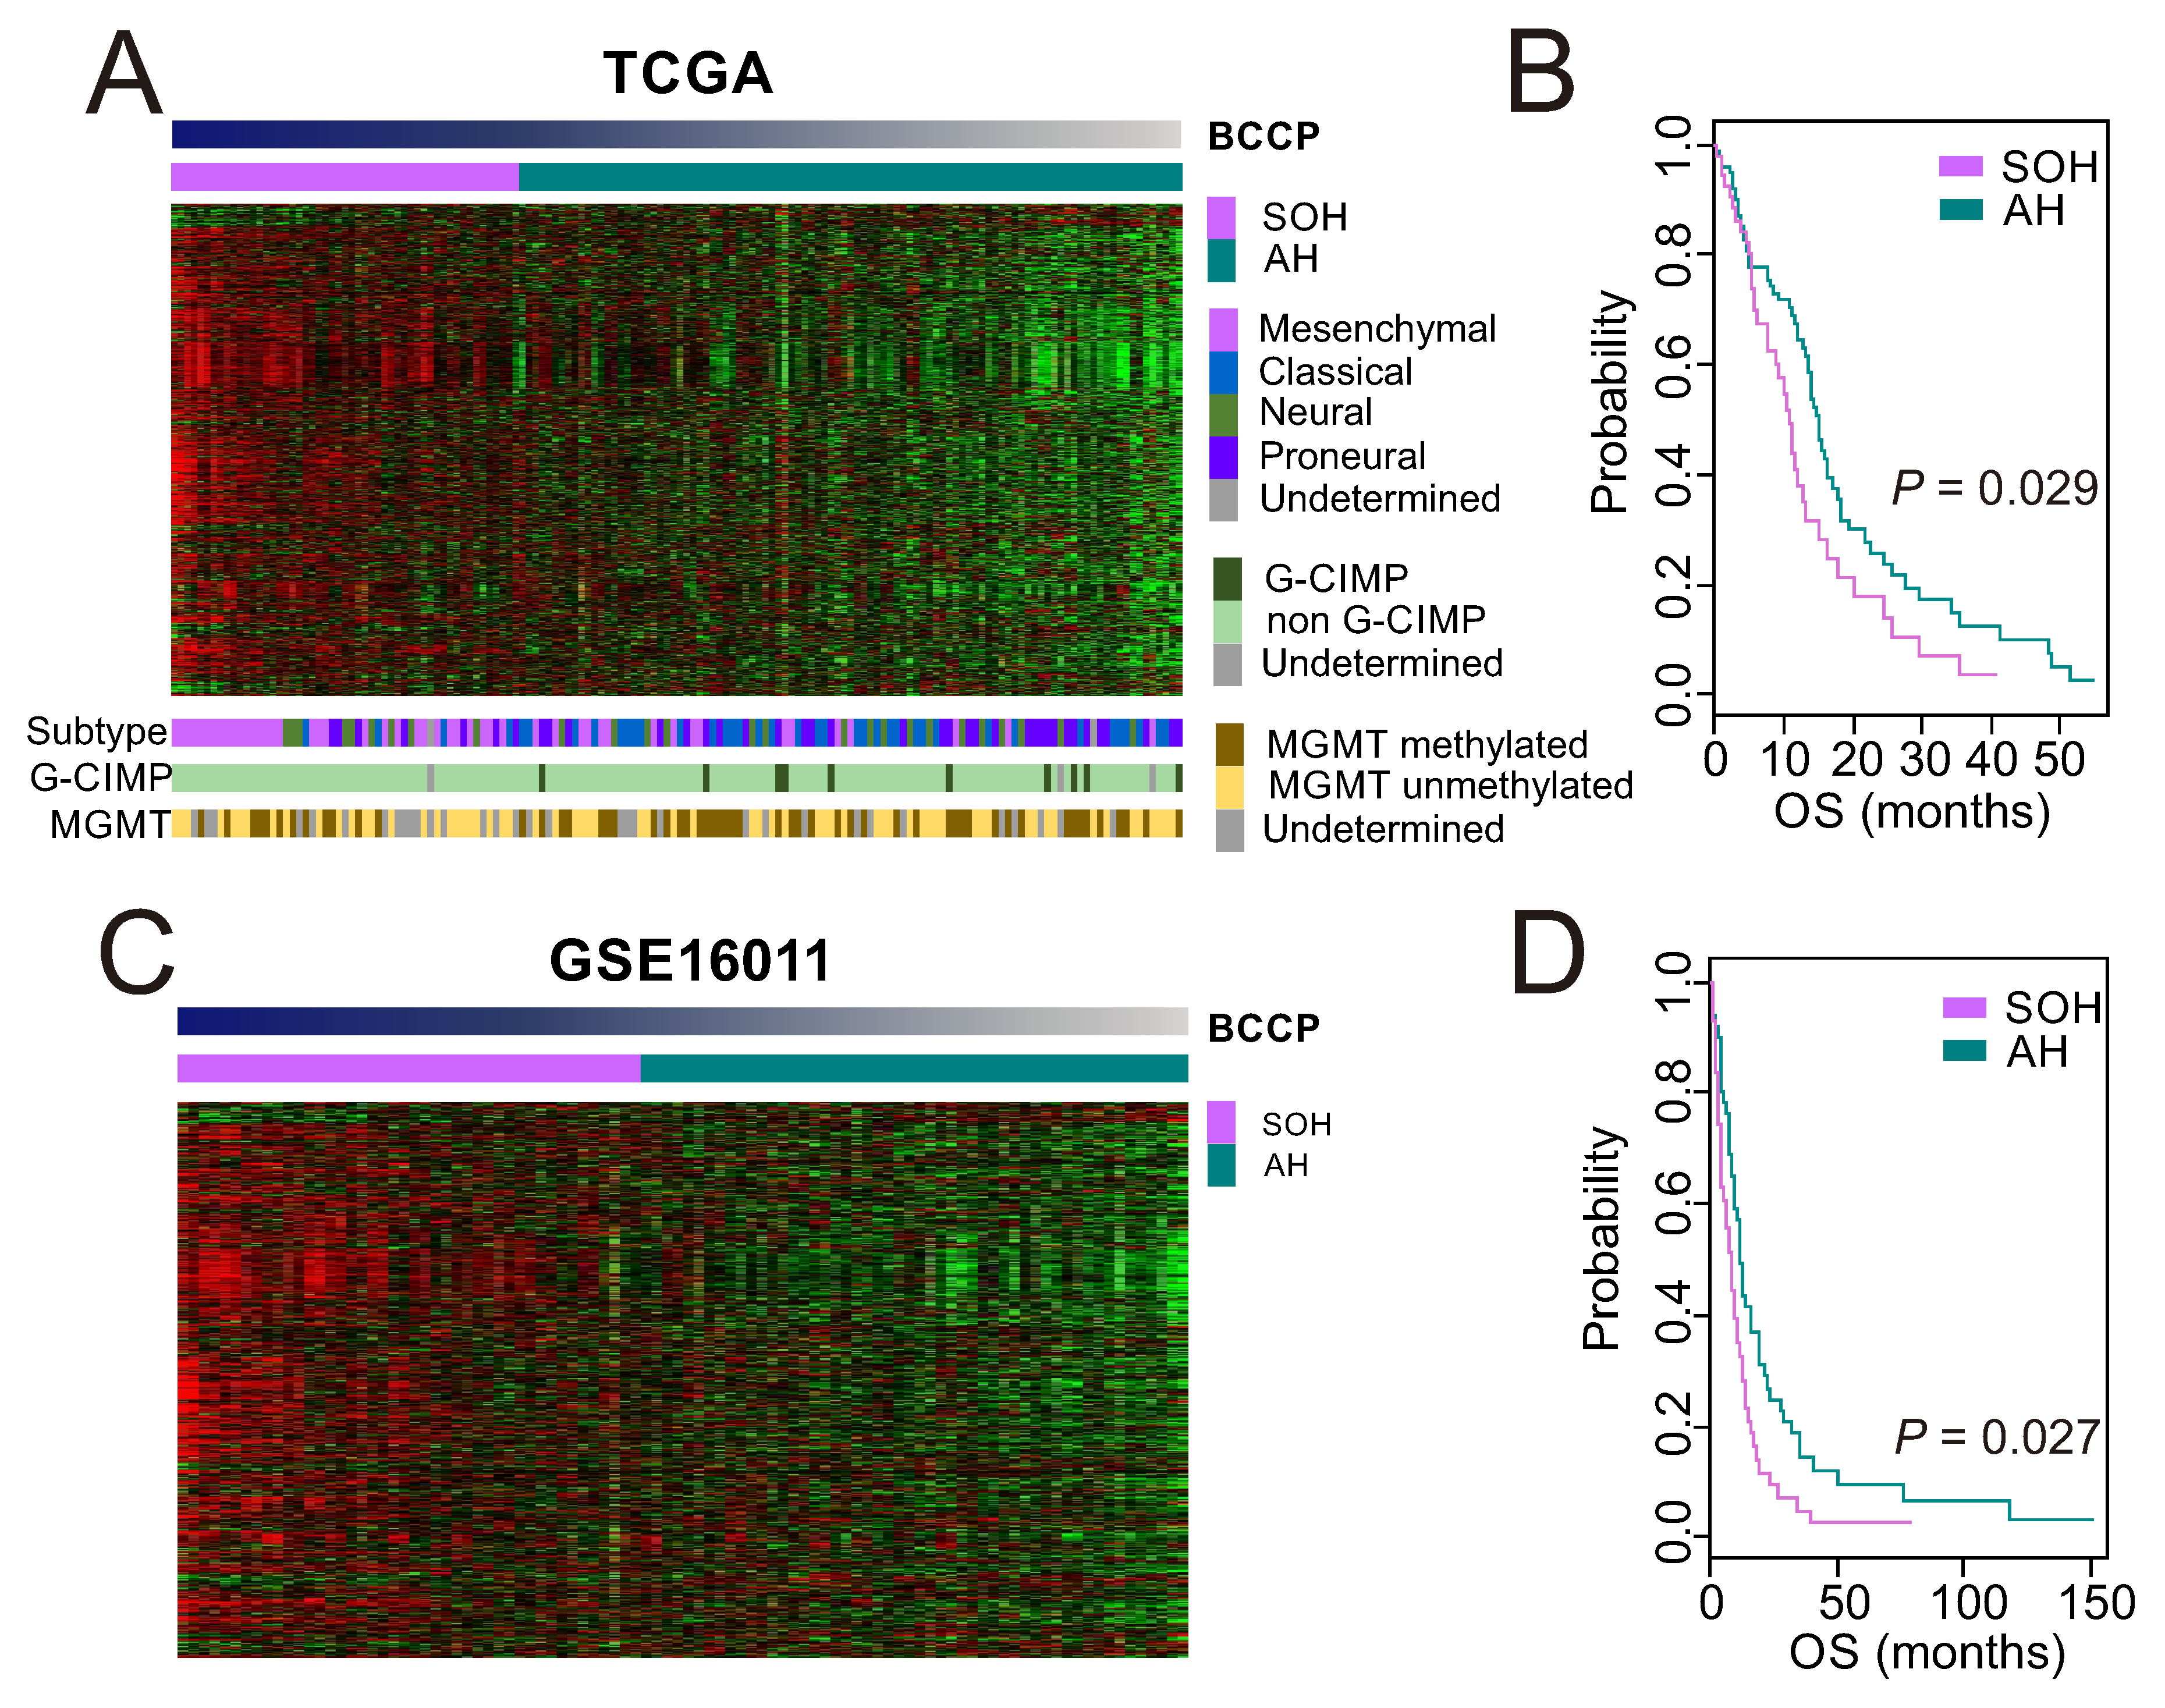
3.1. Clinical Significance of Inactivation of the Hippo Pathway in GBM
3.2. Genomic and Proteomic Characteristics Associated with the SOH Signature
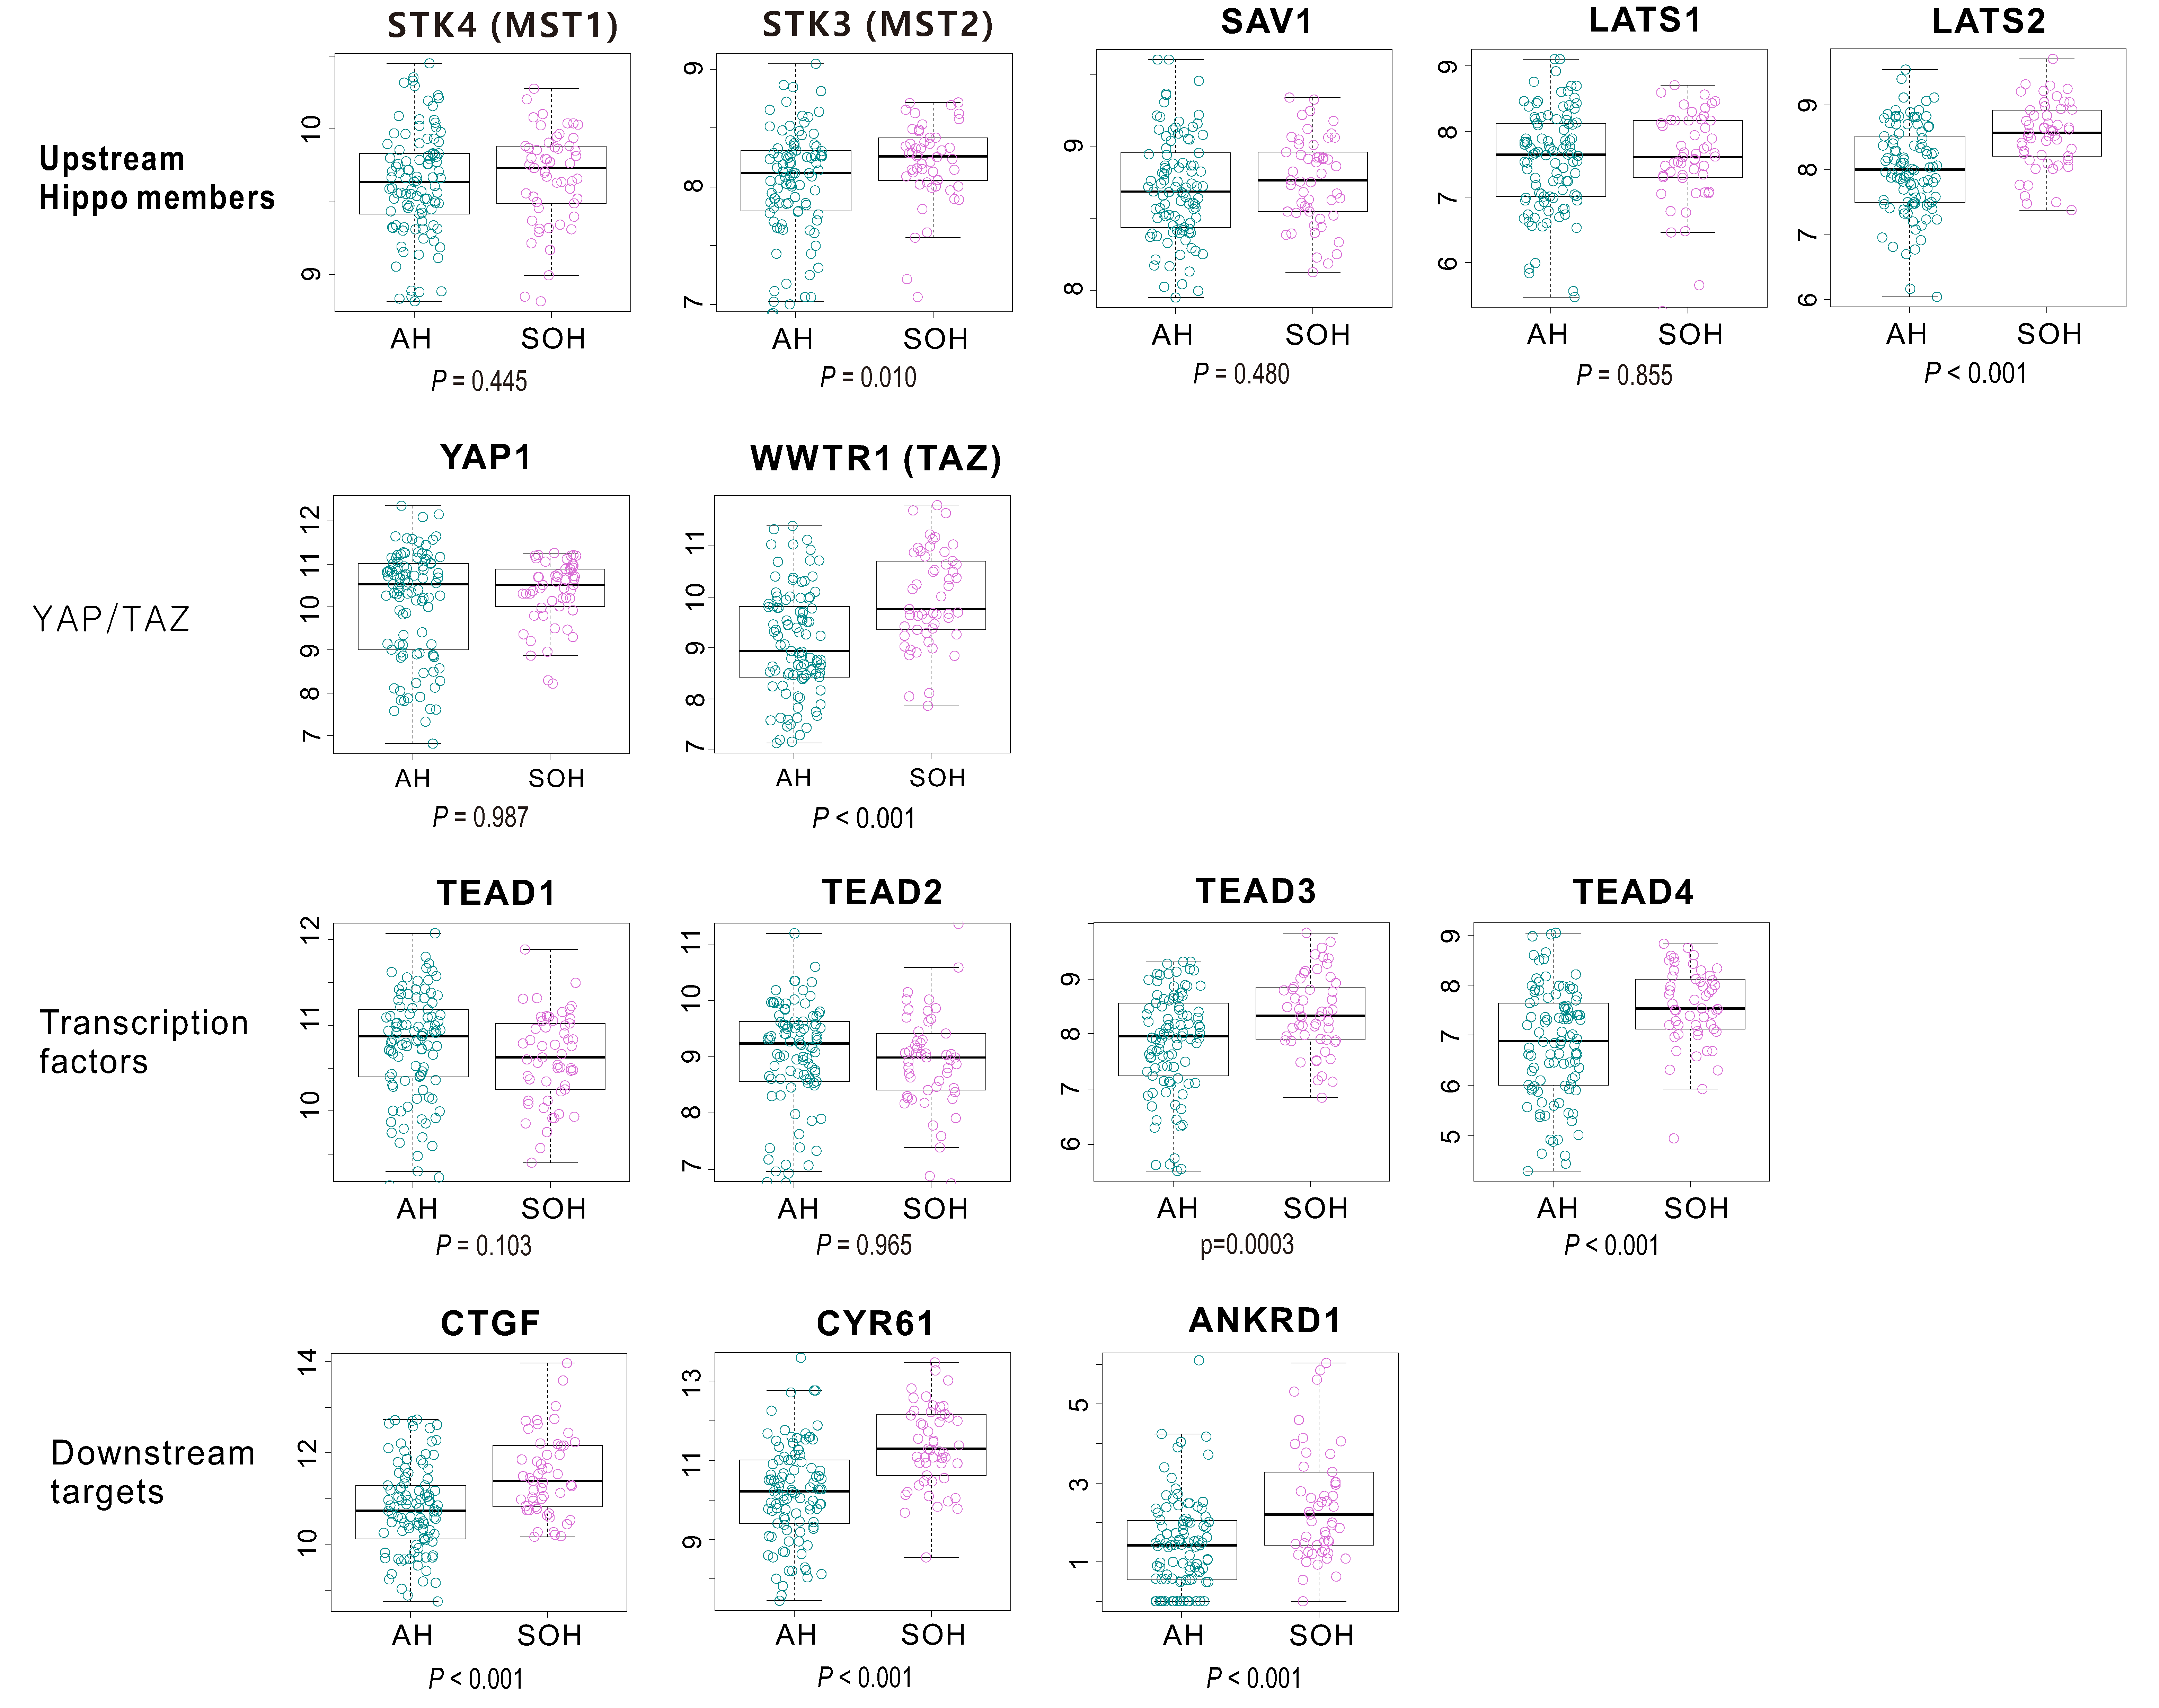
3.3. Molecular Characteristics Associated with the SOH Signature
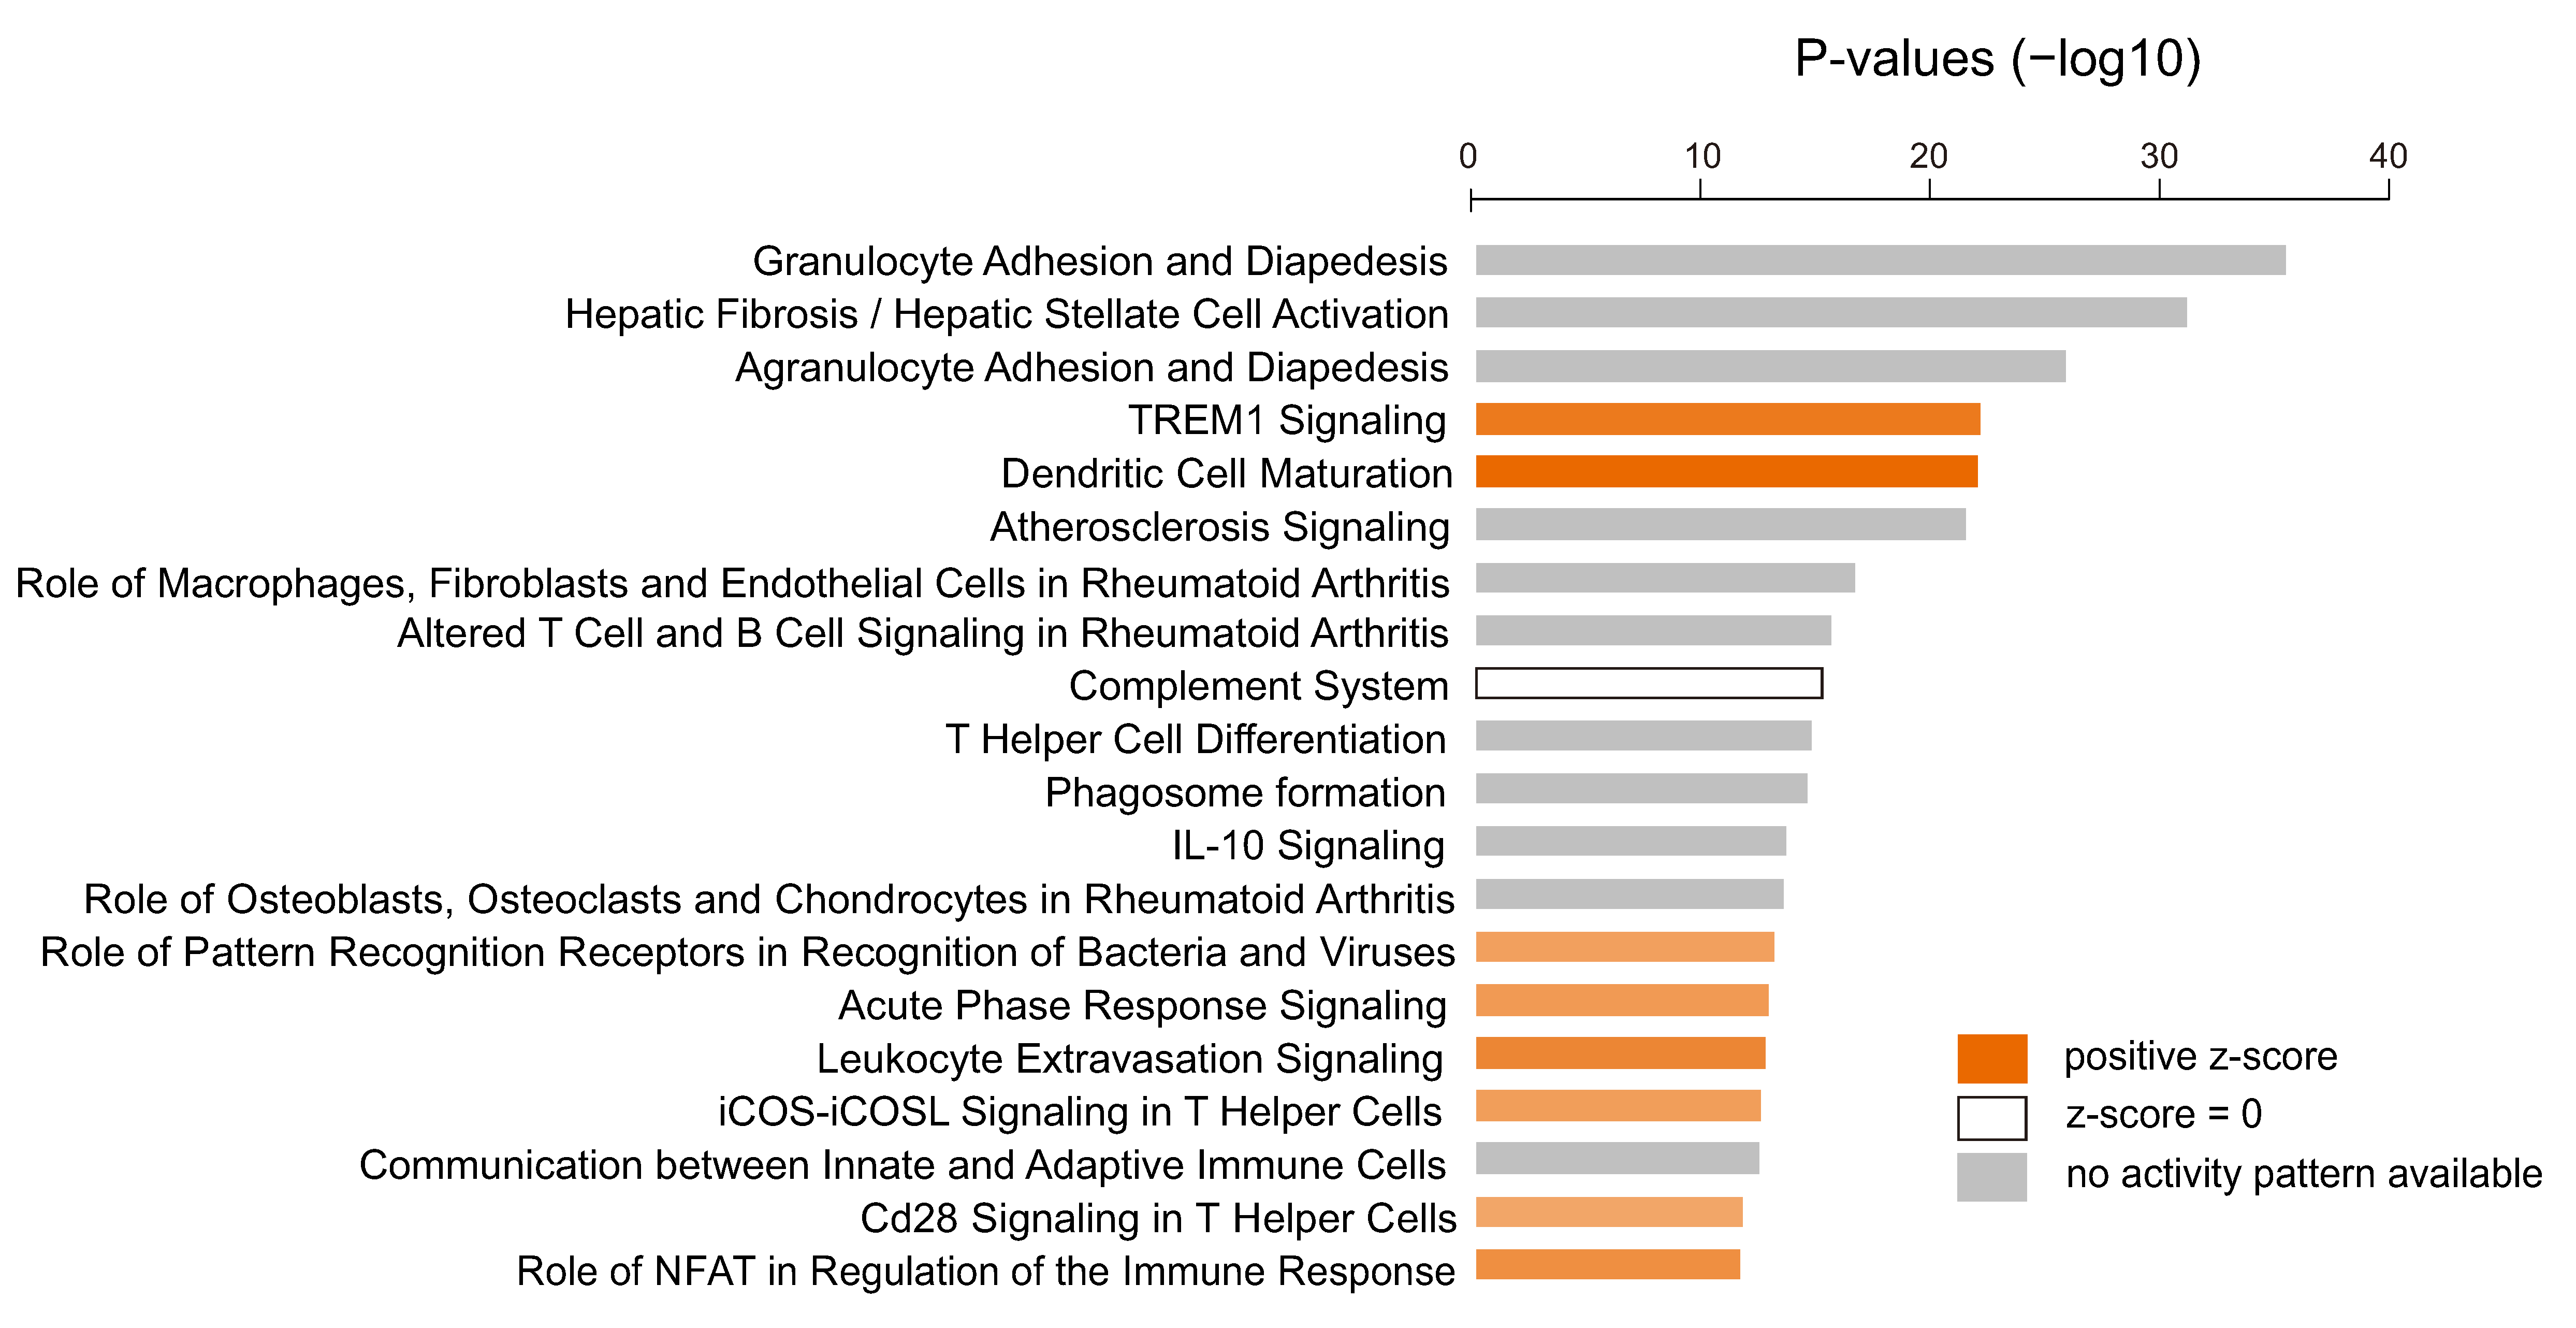
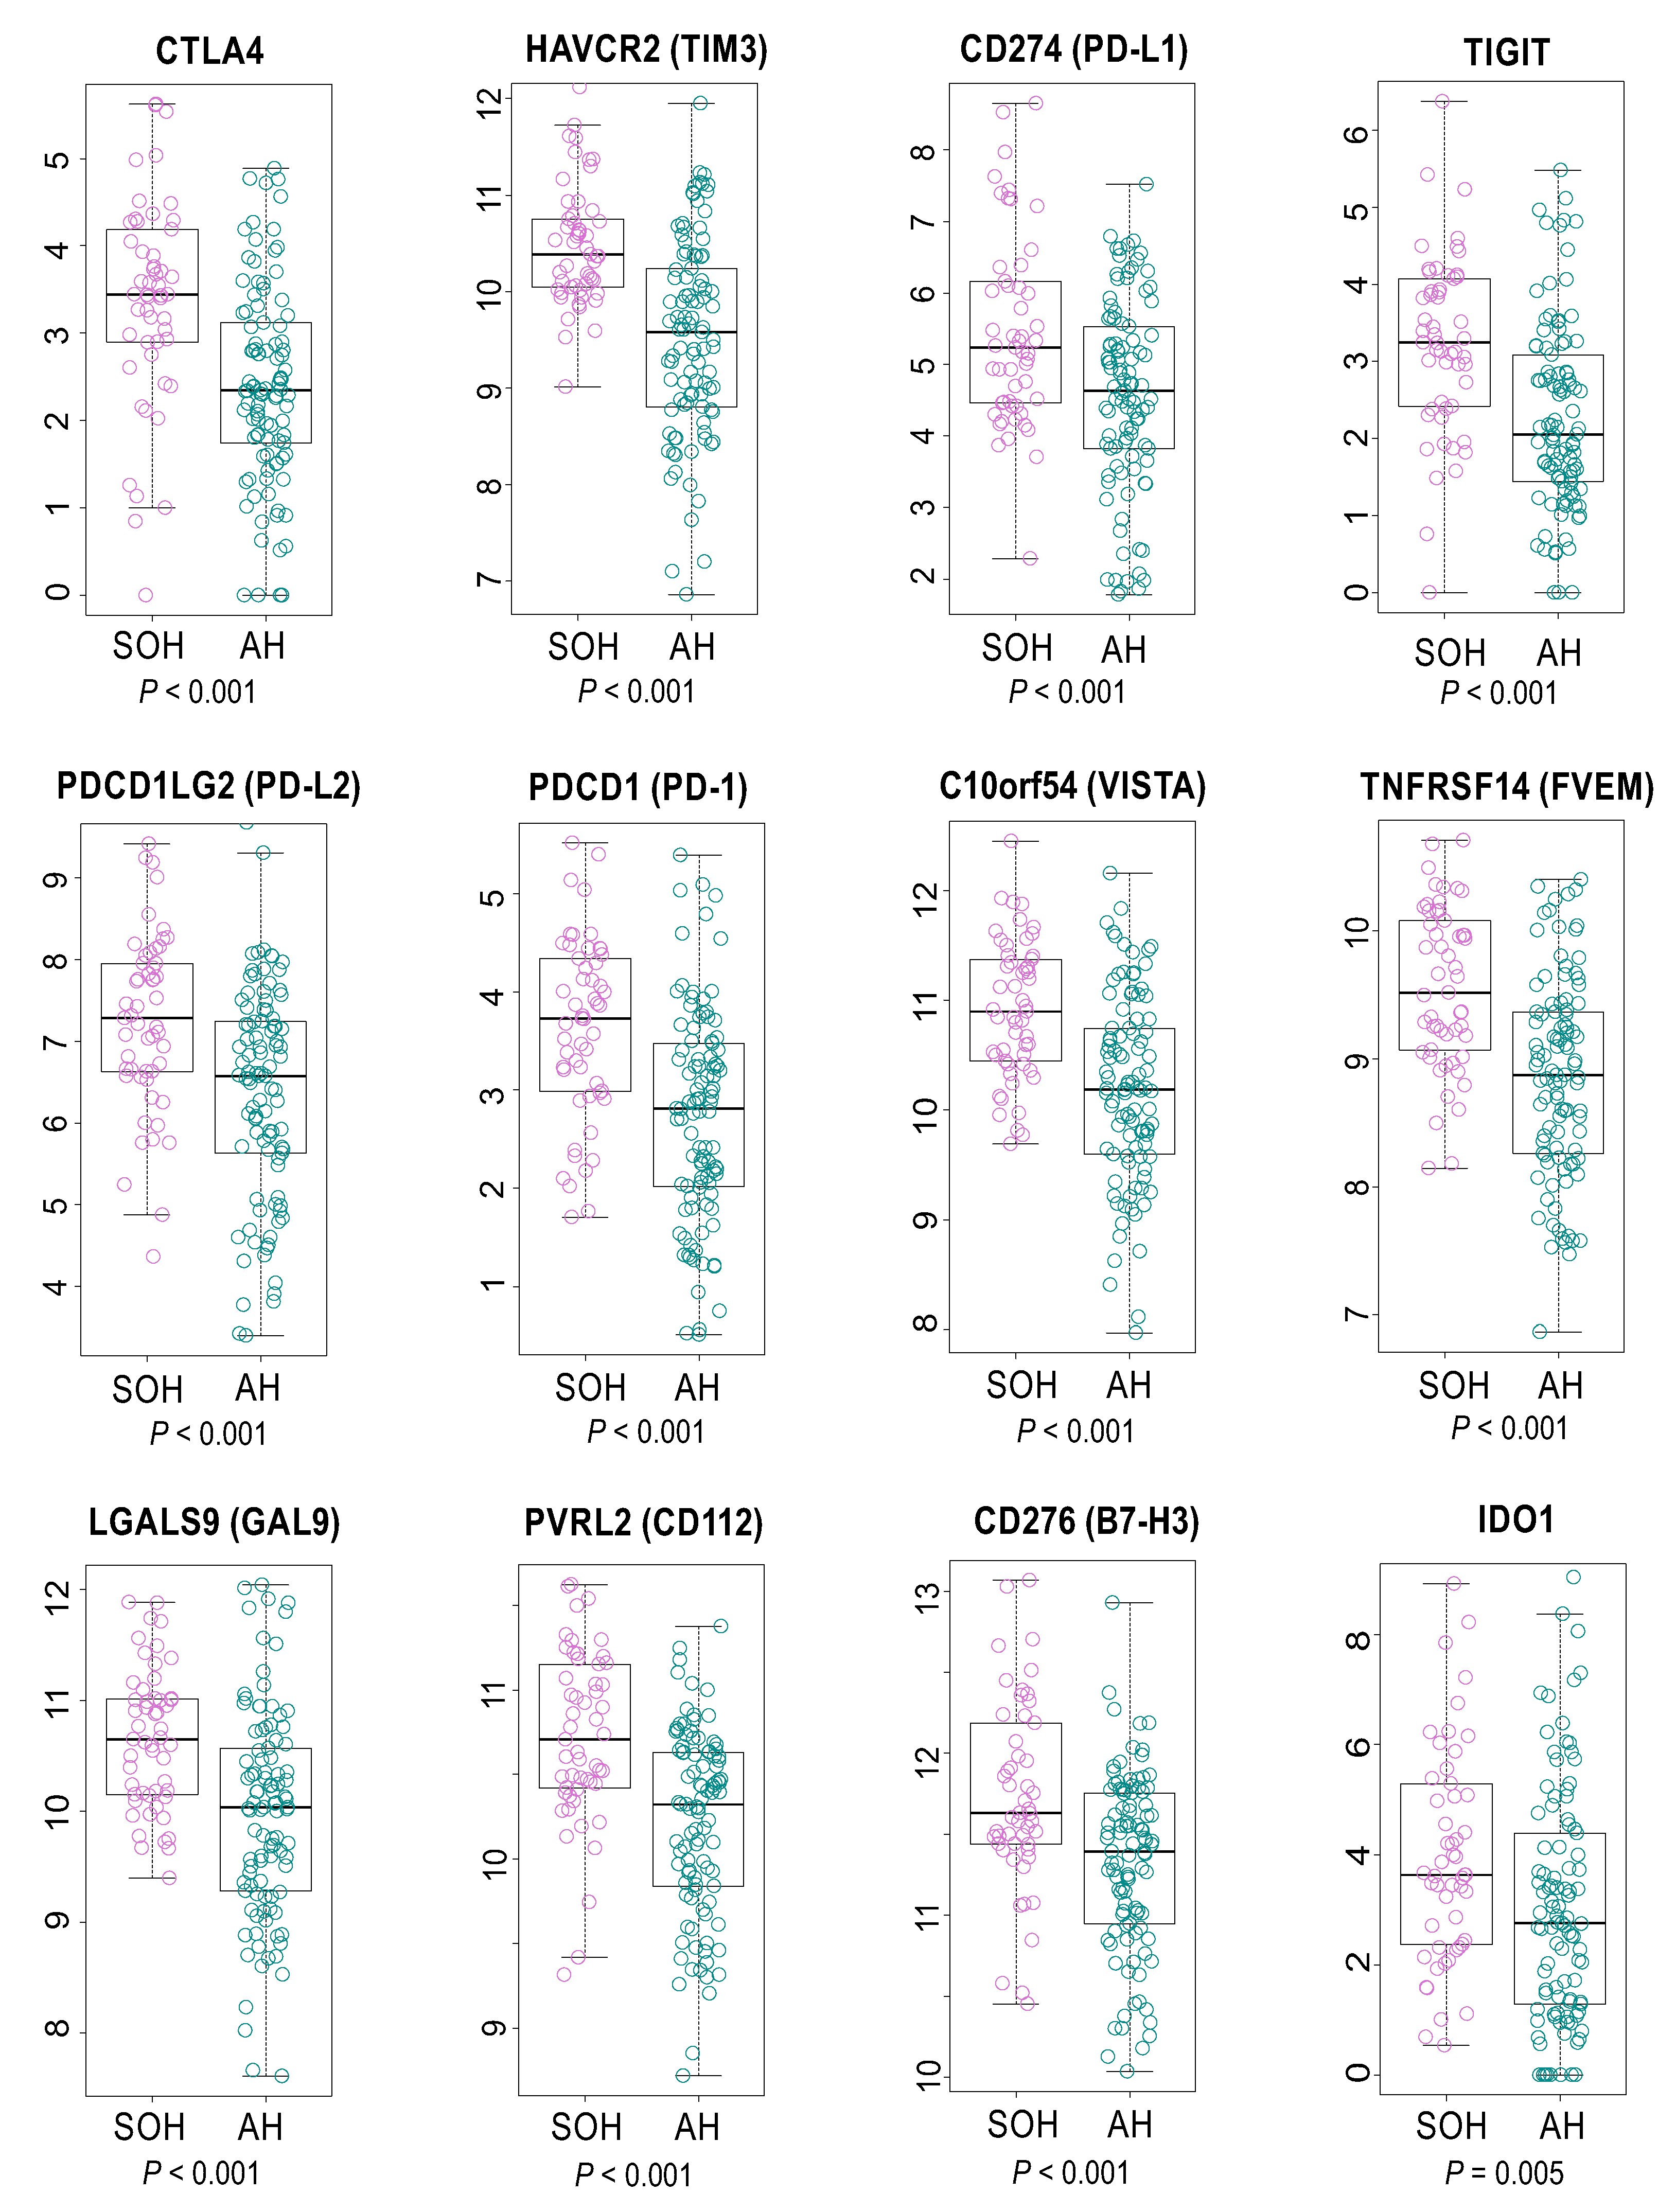
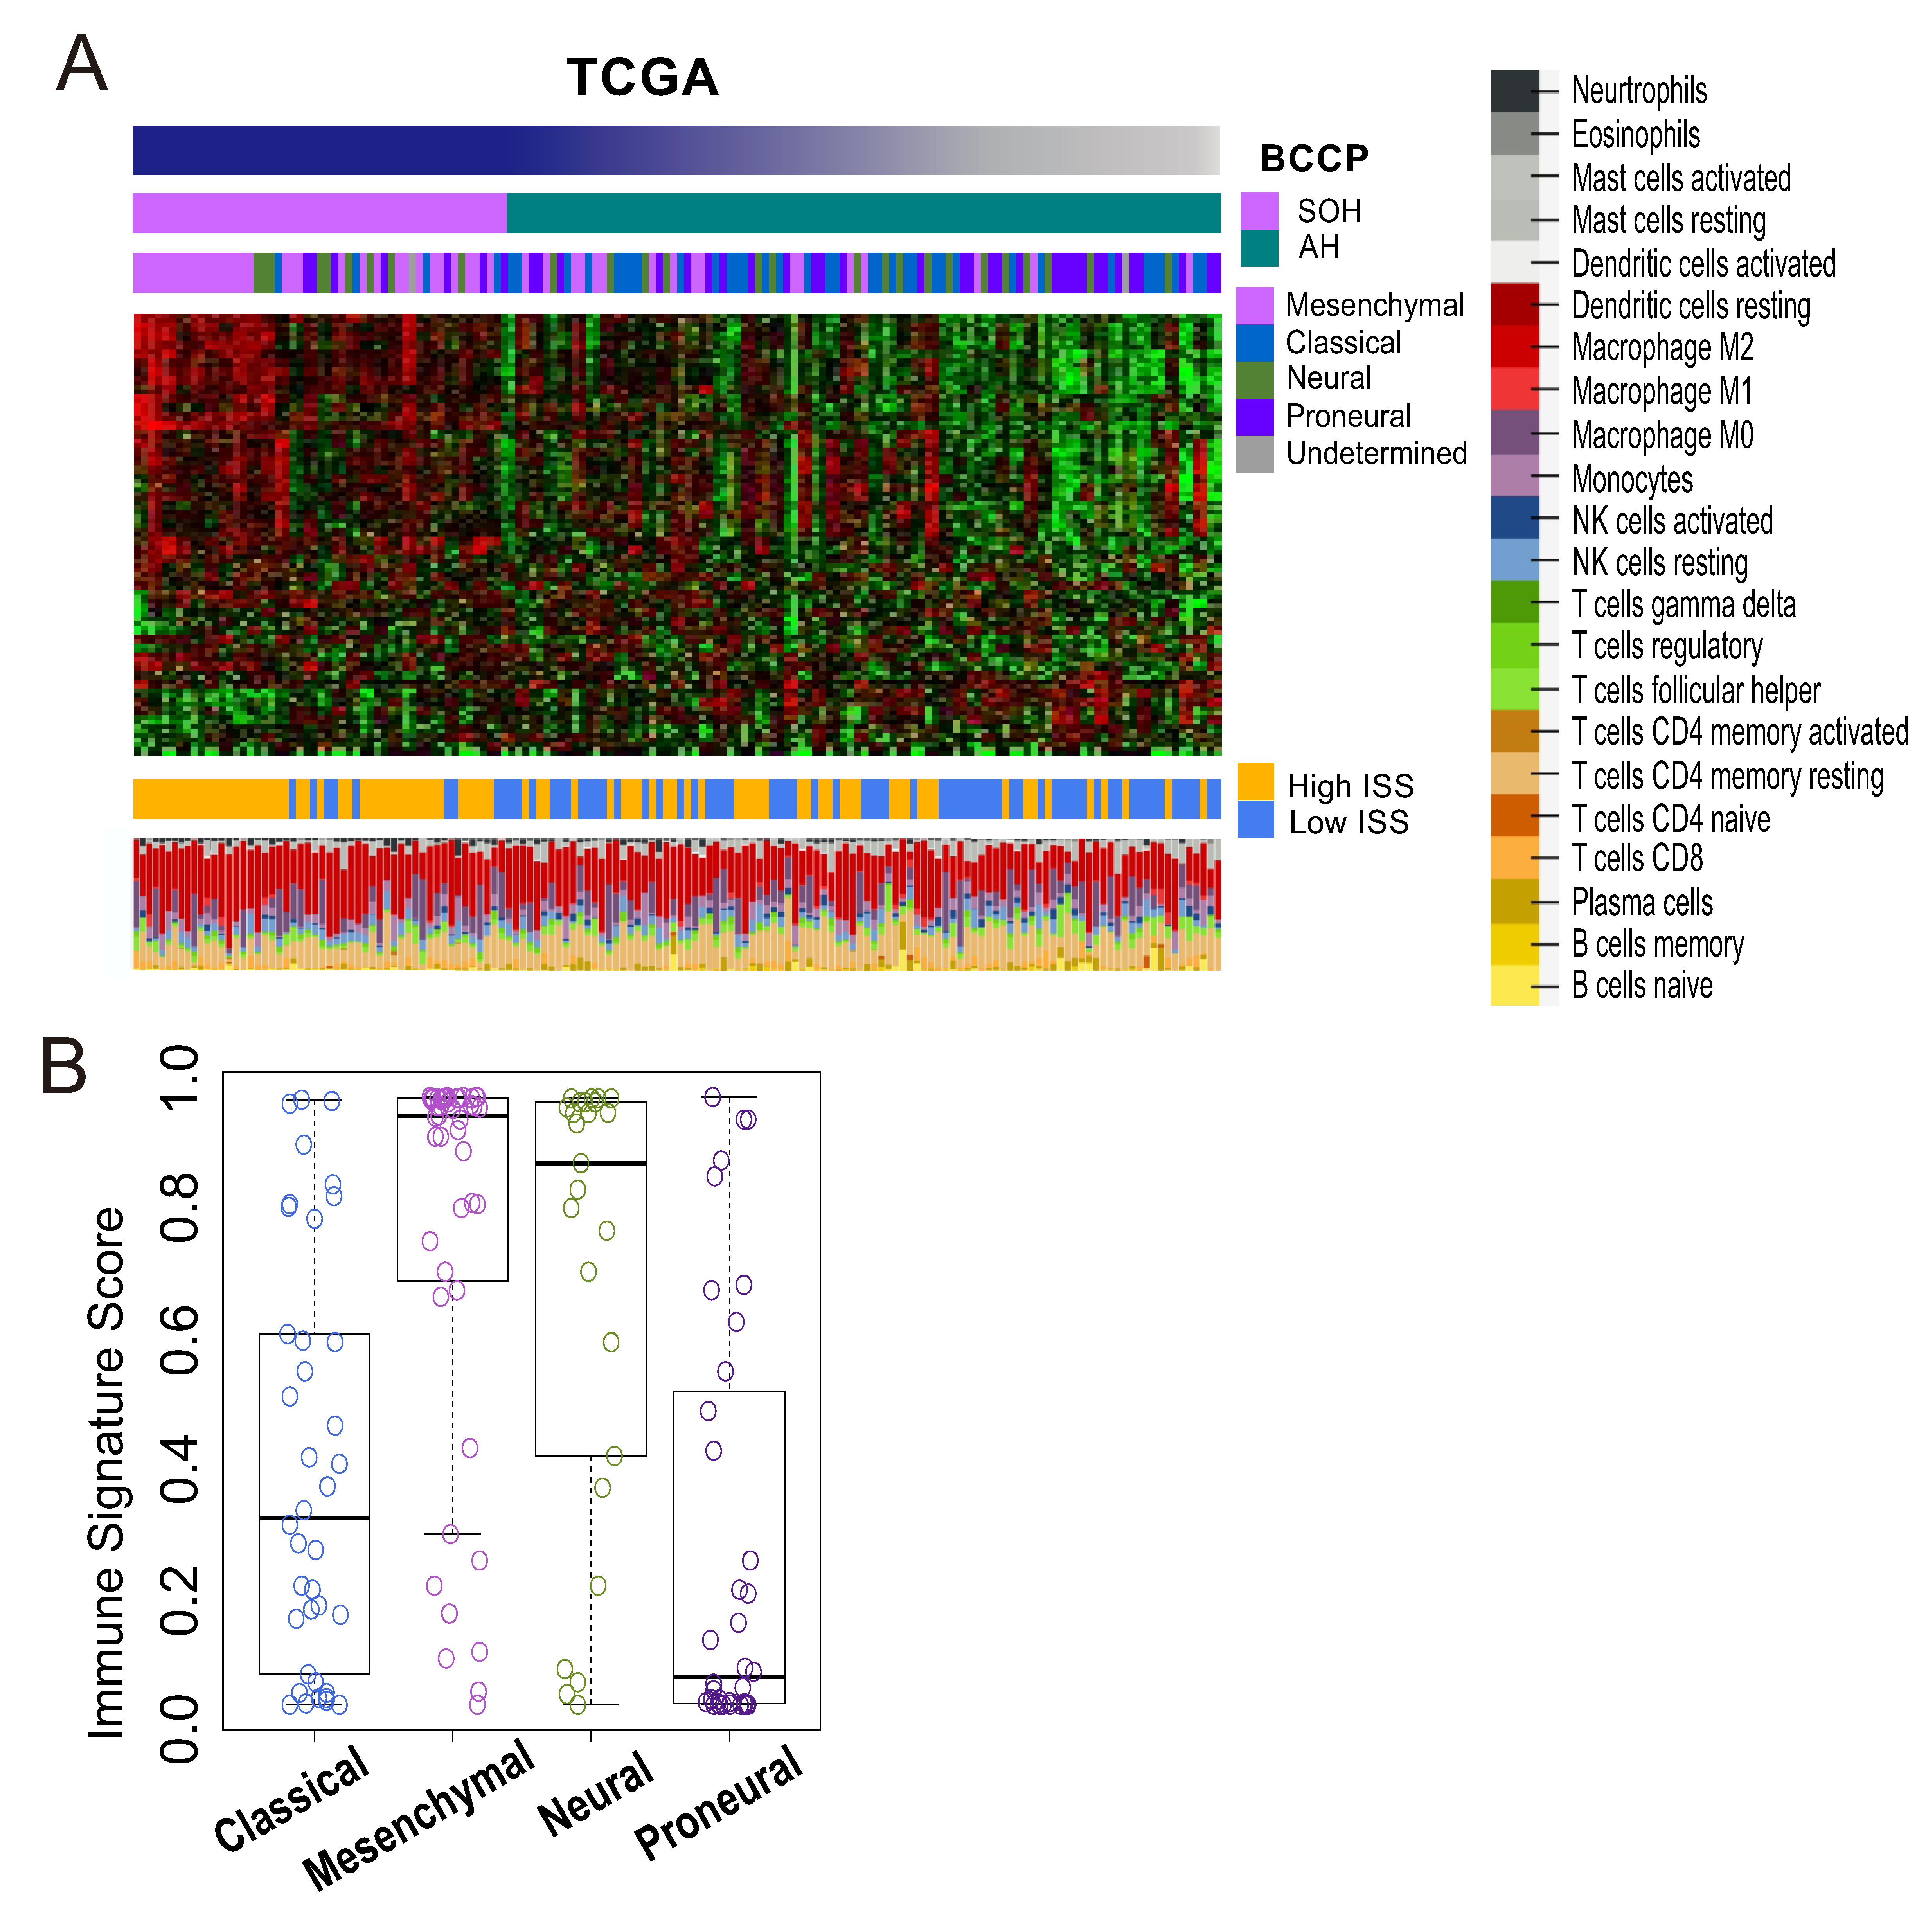
3.4. Immunologic Features Associated with Activation of YAP1/TAZ in GBM
3.5. TGF-β Signature and Inactivation of the Hippo Pathway
3.6. Epithelial–Mesenchymal Transition and Inactivation of the Hippo Pathway
4. Discussion
Supplementary Materials
Author Contributions
Funding
Conflicts of Interest
References
- Stupp, R.; Hegi, M.E.; Mason, W.P.; van den Bent, M.J.; Taphoorn, M.J.; Janzer, R.C.; Ludwin, S.K.; Allgeier, A.; Fisher, B.; Belanger, K.; et al. Effects of radiotherapy with concomitant and adjuvant temozolomide versus radiotherapy alone on survival in glioblastoma in a randomised phase III study: 5-year analysis of the EORTC-NCIC trial. Lancet Oncol. 2009, 10, 459–466. [Google Scholar] [CrossRef]
- Jue, T.R.; McDonald, K.L. The challenges associated with molecular targeted therapies for glioblastoma. J. Neuro-Oncol. 2016, 127, 427–434. [Google Scholar] [CrossRef] [PubMed]
- Piccolo, S.; Dupont, S.; Cordenonsi, M. The biology of YAP/TAZ: Hippo signaling and beyond. Physiol. Rev. 2014, 94, 1287–1312. [Google Scholar] [CrossRef] [PubMed]
- Sudol, M. Yes-associated protein (YAP65) is a proline-rich phosphoprotein that binds to the SH3 domain of the Yes proto-oncogene product. Oncogene 1994, 9, 2145–2152. [Google Scholar] [PubMed]
- Yu, F.X.; Zhao, B.; Guan, K.L. Hippo Pathway in Organ Size Control, Tissue Homeostasis, and Cancer. Cell 2015, 163, 811–828. [Google Scholar] [CrossRef] [PubMed] [Green Version]
- Zhao, B.; Ye, X.; Yu, J.; Li, L.; Li, W.; Li, S.; Yu, J.; Lin, J.D.; Wang, C.Y.; Chinnaiyan, A.M.; et al. TEAD mediates YAP-dependent gene induction and growth control. Genes Dev. 2008, 22, 1962–1971. [Google Scholar] [CrossRef] [Green Version]
- Yu, F.-X.; Zhao, B.; Panupinthu, N.; Jewell, J.L.; Lian, I.; Wang, L.H.; Zhao, J.; Yuan, H.; Tumaneng, K.; Li, H.; et al. Regulation of the Hippo-YAP pathway by G-protein coupled receptor signaling. Cell 2012, 150, 780–791. [Google Scholar] [CrossRef] [Green Version]
- Harvey, K.F.; Zhang, X.; Thomas, D.M. The Hippo pathway and human cancer. Nat. Rev. Cancer 2013, 13, 246–257. [Google Scholar] [CrossRef]
- Jeong, W.; Kim, S.B.; Sohn, B.H.; Park, Y.Y.; Park, E.S.; Kim, S.C.; Kim, S.S.; Johnson, R.L.; Birrer, M.; Bowtell, D.S.; et al. Activation of YAP1 is associated with poor prognosis and response to taxanes in ovarian cancer. Anticancer Res. 2014, 34, 811–817. [Google Scholar]
- Lee, K.W.; Lee, S.S.; Kim, S.B.; Sohn, B.H.; Lee, H.S.; Jang, H.J.; Park, Y.Y.; Kopetz, S.; Kim, S.S.; Oh, S.C.; et al. Significant association of oncogene YAP1 with poor prognosis and cetuximab resistance in colorectal cancer patients. Clin. Cancer Res. Off. J. Am. Assoc. Cancer Res. 2015, 21, 357–364. [Google Scholar] [CrossRef] [Green Version]
- Sohn, B.H.; Shim, J.J.; Kim, S.B.; Jang, K.Y.; Kim, S.M.; Kim, J.H.; Hwang, J.E.; Jang, H.J.; Lee, H.S.; Kim, S.C.; et al. Inactivation of Hippo Pathway Is Significantly Associated with Poor Prognosis in Hepatocellular Carcinoma. Clin. Cancer Res. Off. J. Am. Assoc. Cancer Res. 2016, 22, 1256–1264. [Google Scholar] [CrossRef] [Green Version]
- Brennan, C.W.; Verhaak, R.G.; McKenna, A.; Campos, B.; Noushmehr, H.; Salama, S.R.; Zheng, S.; Chakravarty, D.; Sanborn, J.Z.; Berman, S.H.; et al. The somatic genomic landscape of glioblastoma. Cell 2013, 155, 462–477. [Google Scholar] [CrossRef] [PubMed]
- Simon, R.; Lam, A.; Li, M.C.; Ngan, M.; Menenzes, S.; Zhao, Y. Analysis of gene expression data using BRB-ArrayTools. Cancer Inform. 2007, 3, 11–17. [Google Scholar] [CrossRef] [PubMed]
- Eisen, M.B.; Spellman, P.T.; Brown, P.O.; Botstein, D. Cluster analysis and display of genome-wide expression patterns. Proc. Natl. Acad. Sci. USA 1998, 95, 14863–14868. [Google Scholar] [CrossRef] [PubMed] [Green Version]
- Ramaswamy, S.; Tamayo, P.; Rifkin, R.; Mukherjee, S.; Yeang, C.H.; Angelo, M.; Ladd, C.; Reich, M.; Latulippe, E.; Mesirov, J.P.; et al. Multiclass cancer diagnosis using tumor gene expression signatures. Proc. Natl. Acad. Sci. USA 2001, 98, 15149–15154. [Google Scholar] [CrossRef] [PubMed] [Green Version]
- Lee, J.S.; Chu, I.S.; Mikaelyan, A.; Calvisi, D.F.; Heo, J.; Reddy, J.K.; Thorgeirsson, S.S. Application of comparative functional genomics to identify best-fit mouse models to study human cancer. Nat. Genet. 2004, 36, 1306–1311. [Google Scholar] [CrossRef]
- Lee, J.S.; Heo, J.; Libbrecht, L.; Chu, I.S.; Kaposi-Novak, P.; Calvisi, D.F.; Mikaelyan, A.; Roberts, L.R.; Demetris, A.J.; Sun, Z.; et al. A novel prognostic subtype of human hepatocellular carcinoma derived from hepatic progenitor cells. Nat. Med. 2006, 12, 410–416. [Google Scholar] [CrossRef]
- Lee, J.S.; Leem, S.H.; Lee, S.Y.; Kim, S.C.; Park, E.S.; Kim, S.B.; Kim, S.K.; Kim, Y.J.; Kim, W.J.; Chu, I.S. Expression signature of E2F1 and its associated genes predict superficial to invasive progression of bladder tumors. J. Clin. Oncol. Off. J. Am. Soc. Clin. Oncol. 2010, 28, 2660–2667. [Google Scholar] [CrossRef]
- Oh, S.C.; Park, Y.Y.; Park, E.S.; Lim, J.Y.; Kim, S.M.; Kim, S.B.; Kim, J.; Kim, S.C.; Chu, I.S.; Smith, J.J.; et al. Prognostic gene expression signature associated with two molecularly distinct subtypes of colorectal cancer. Gut 2012, 61, 1291–1298. [Google Scholar] [CrossRef] [Green Version]
- Mermel, C.H.; Schumacher, S.E.; Hill, B.; Meyerson, M.L.; Beroukhim, R.; Getz, G. GISTIC2.0 facilitates sensitive and confident localization of the targets of focal somatic copy-number alteration in human cancers. Genome Biol. 2011, 12, R41. [Google Scholar] [CrossRef] [Green Version]
- Cherry, J.D.; Olschowka, J.A.; O’Banion, M.K. Neuroinflammation and M2 microglia: The good, the bad, and the inflamed. J. Neuroinflamm. 2014, 11, 98. [Google Scholar] [CrossRef] [PubMed] [Green Version]
- Kobayashi, K.; Imagama, S.; Ohgomori, T.; Hirano, K.; Uchimura, K.; Sakamoto, K.; Hirakawa, A.; Takeuchi, H.; Suzumura, A.; Ishiguro, N.; et al. Minocycline selectively inhibits M1 polarization of microglia. Cell Death Dis. 2013, 4, e525. [Google Scholar] [CrossRef] [PubMed] [Green Version]
- Blank, C.U. The perspective of immunotherapy: New molecules and new mechanisms of action in immune modulation. Curr. Opin. Oncol. 2014, 26, 204–214. [Google Scholar] [CrossRef] [PubMed]
- Ock, C.Y.; Hwang, J.E.; Keam, B.; Kim, S.B.; Shim, J.J.; Jang, H.J.; Park, S.; Sohn, B.H.; Cha, M.; Ajani, J.A.; et al. Genomic landscape associated with potential response to anti-CTLA-4 treatment in cancers. Nat. Commun. 2017, 8, 1050. [Google Scholar] [CrossRef] [PubMed]
- Newman, A.M.; Liu, C.L.; Green, M.R. Robust enumeration of cell subsets from tissue expression profiles. Nat. Methods 2015, 12, 453–457. [Google Scholar] [CrossRef] [PubMed] [Green Version]
- Anido, J.; Saez-Borderias, A.; Gonzalez-Junca, A.; Rodon, L.; Folch, G.; Carmona, M.A.; Prieto-Sanchez, R.M.; Barba, I.; Martinez-Saez, E.; Prudkin, L.; et al. TGF-beta Receptor Inhibitors Target the CD44(high)/Id1(high) Glioma-Initiating Cell Population in Human Glioblastoma. Cancer Cell 2010, 18, 655–668. [Google Scholar] [CrossRef] [PubMed] [Green Version]
- Cheng, W.Y.; Kandel, J.J.; Yamashiro, D.J.; Canoll, P.; Anastassiou, D. A multi-cancer mesenchymal transition gene expression signature is associated with prolonged time to recurrence in glioblastoma. PLoS ONE 2012, 7, e34705. [Google Scholar] [CrossRef]
- Verhaak, R.G.; Hoadley, K.A.; Purdom, E.; Wang, V.; Qi, Y.; Wilkerson, M.D.; Miller, C.R.; Ding, L.; Golub, T.; Mesirov, J.P.; et al. Integrated genomic analysis identifies clinically relevant subtypes of glioblastoma characterized by abnormalities in PDGFRA, IDH1, EGFR, and NF1. Cancer Cell 2010, 17, 98–110. [Google Scholar] [CrossRef] [Green Version]
- Noushmehr, H.; Weisenberger, D.J.; Diefes, K.; Phillips, H.S.; Pujara, K.; Berman, B.P.; Pan, F.; Pelloski, C.E.; Sulman, E.P.; Bhat, K.P.; et al. Identification of a CpG island methylator phenotype that defines a distinct subgroup of glioma. Cancer Cell 2010, 17, 510–522. [Google Scholar] [CrossRef] [Green Version]
- Iwadate, Y. Epithelial-mesenchymal transition in glioblastoma progression. Oncol. Lett. 2016, 11, 1615–1620. [Google Scholar] [CrossRef] [Green Version]
- Lee, B.S.; Park, D.I.; Lee, D.H.; Lee, J.E.; Yeo, M.K.; Park, Y.H.; Lim, D.S.; Choi, W.; Lee, D.H.; Yoo, G.; et al. Hippo effector YAP directly regulates the expression of PD-L1 transcripts in EGFR-TKI-resistant lung adenocarcinoma. Biochem. Biophys. Res. Commun. 2017, 491, 493–499. [Google Scholar] [CrossRef] [PubMed]
- Thaventhiran, J.E.; Hoffmann, A.; Magiera, L.; de la Roche, M.; Lingel, H.; Brunner-Weinzierl, M.; Fearon, D.T. Activation of the Hippo pathway by CTLA-4 regulates the expression of Blimp-1 in the CD8+ T cell. Proc. Natl. Acad. Sci. USA 2012, 109, E2223–E2229. [Google Scholar] [CrossRef] [PubMed] [Green Version]
- Yuan, Y.; Li, D.; Li, H.; Wang, L.; Tian, G.; Dong, Y. YAP overexpression promotes the epithelial-mesenchymal transition and chemoresistance in pancreatic cancer cells. Mol. Med. Rep. 2016, 13, 237–242. [Google Scholar] [CrossRef] [PubMed] [Green Version]
- Colin, C.; Voutsinos-Porche, B.; Nanni, I.; Fina, F.; Metellus, P.; Intagliata, D.; Baeza, N.; Bouvier, C.; Delfino, C.; Loundou, A.; et al. High expression of cathepsin B and plasminogen activator inhibitor type-1 are strong predictors of survival in glioblastomas. Acta Neuropathol. 2009, 118, 745–754. [Google Scholar] [CrossRef] [PubMed]
- Duncan, C.G.; Killela, P.J.; Payne, C.A.; Lampson, B.; Chen, W.C.; Liu, J.; Solomon, D.; Waldman, T.; Towers, A.J.; Gregory, S.G.; et al. Integrated genomic analyses identify ERRFI1 and TACC3 as glioblastoma-targeted genes. Oncotarget 2010, 1, 265–277. [Google Scholar] [CrossRef] [PubMed]
- Patil, S.S.; Gokulnath, P.; Bashir, M.; Shwetha, S.D.; Jaiswal, J.; Shastry, A.H.; Arimappamagan, A.; Santosh, V.; Kondaiah, P. Insulin-like growth factor binding protein-2 regulates beta-catenin signaling pathway in glioma cells and together contributes to poor patient prognosis. Neuro-Oncology 2016. [Google Scholar] [CrossRef] [PubMed] [Green Version]
- Quann, K.; Gonzales, D.M.; Mercier, I.; Wang, C.; Sotgia, F.; Pestell, R.G.; Lisanti, M.P.; Jasmin, J.F. Caveolin-1 is a negative regulator of tumor growth in glioblastoma and modulates chemosensitivity to temozolomide. Cell Cycle 2013, 12, 1510–1520. [Google Scholar] [CrossRef] [Green Version]
- Serres, E.; Debarbieux, F.; Stanchi, F.; Maggiorella, L.; Grall, D.; Turchi, L.; Burel-Vandenbos, F.; Figarella-Branger, D.; Virolle, T.; Rougon, G.; et al. Fibronectin expression in glioblastomas promotes cell cohesion, collective invasion of basement membrane in vitro and orthotopic tumor growth in mice. Oncogene 2014, 33, 3451–3462. [Google Scholar] [CrossRef]
- Jorgenson, A.J.; Choi, K.M.; Sicard, D.; Smith, K.M.; Hiemer, S.E.; Varelas, X.; Tschumperlin, D.J. TAZ activation drives fibroblast spheroid growth, expression of profibrotic paracrine signals, and context-dependent ECM gene expression. Am. J. Physiol. Cell Physiol. 2017, 312, C277–C285. [Google Scholar] [CrossRef]
- Liu, F.; Lagares, D.; Choi, K.M.; Stopfer, L.; Marinkovic, A.; Vrbanac, V.; Probst, C.K.; Hiemer, S.E.; Sisson, T.H.; Horowitz, J.C.; et al. Mechanosignaling through YAP and TAZ drives fibroblast activation and fibrosis. Am. J. Physiol. Lung Cell. Mol. Physiol. 2015, 308, L344–L357. [Google Scholar] [CrossRef] [Green Version]
- Rizvi, N.A.; Hellmann, M.D.; Snyder, A.; Kvistborg, P.; Makarov, V.; Havel, J.J.; Lee, W.; Yuan, J.; Wong, P.; Ho, T.S.; et al. Cancer immunology. Mutational landscape determines sensitivity to PD-1 blockade in non-small cell lung cancer. Science 2015, 348, 124–128. [Google Scholar] [CrossRef] [PubMed] [Green Version]
- Hambardzumyan, D.; Gutmann, D.H.; Kettenmann, H. The role of microglia and macrophages in glioma maintenance and progression. Nat. Neurosci. 2016, 19, 20–27. [Google Scholar] [CrossRef] [PubMed] [Green Version]
- Noy, R.; Pollard, J.W. Tumor-associated macrophages: From mechanisms to therapy. Immunity 2014, 41, 49–61. [Google Scholar] [CrossRef] [Green Version]
- Gentles, A.J.; Newman, A.M.; Liu, C.L.; Bratman, S.V.; Feng, W.; Kim, D.; Nair, V.S.; Xu, Y.; Khuong, A.; Hoang, C.D.; et al. The prognostic landscape of genes and infiltrating immune cells across human cancers. Nat. Med. 2015, 21, 938–945. [Google Scholar] [CrossRef] [PubMed]
- Rutledge, W.C.; Kong, J.; Gao, J.; Gutman, D.A.; Cooper, L.A.; Appin, C.; Park, Y.; Scarpace, L.; Mikkelsen, T.; Cohen, M.L.; et al. Tumor-infiltrating lymphocytes in glioblastoma are associated with specific genomic alterations and related to transcriptional class. Clin. Cancer Res. Off. J. Am. Assoc. Cancer Res. 2013, 19, 4951–4960. [Google Scholar] [CrossRef] [PubMed] [Green Version]
- Pyonteck, S.M.; Akkari, L.; Schuhmacher, A.J.; Bowman, R.L.; Sevenich, L.; Quail, D.F.; Olson, O.C.; Quick, M.L.; Huse, J.T.; Teijeiro, V.; et al. CSF-1R inhibition alters macrophage polarization and blocks glioma progression. Nat. Med. 2013, 19, 1264–1272. [Google Scholar] [CrossRef] [Green Version]
- Santarpia, M.; Gonzalez-Cao, M.; Viteri, S.; Karachaliou, N.; Altavilla, G.; Rosell, R. Programmed cell death protein-1/programmed cell death ligand-1 pathway inhibition and predictive biomarkers: Understanding transforming growth factor-beta role. Transl. Lung Cancer Res. 2015, 4, 728–742. [Google Scholar] [CrossRef]
- Gratchev, A. TGF-beta signalling in tumour associated macrophages. Immunobiology 2016. [Google Scholar] [CrossRef]
- Iser, I.C.; Pereira, M.B.; Lenz, G.; Wink, M.R. The Epithelial-to-Mesenchymal Transition-Like Process in Glioblastoma: An Updated Systematic Review and In Silico Investigation. Med. Res. Rev. 2016. [Google Scholar] [CrossRef]
- Herbertz, S.; Sawyer, J.S.; Stauber, A.J.; Gueorguieva, I.; Driscoll, K.E.; Estrem, S.T.; Cleverly, A.L.; Desaiah, D.; Guba, S.C.; Benhadji, K.A. Clinical development of galunisertib (LY2157299 monohydrate), a small molecule inhibitor of transforming growth factor-beta signaling pathway. Drug Des. Dev. Ther. 2015, 9, 4479. [Google Scholar]
- Okazaki, T.; Kageji, T.; Kuwayama, K.; Kitazato, K.T.; Mure, H.; Hara, K.; Morigaki, R.; Mizobuchi, Y.; Matsuzaki, K.; Nagahiro, S. Up-regulation of endogenous PML induced by a combination of interferon-beta and temozolomide enhances p73/YAP-mediated apoptosis in glioblastoma. Cancer Lett. 2012, 323, 199–207. [Google Scholar] [CrossRef] [PubMed]


© 2020 by the authors. Licensee MDPI, Basel, Switzerland. This article is an open access article distributed under the terms and conditions of the Creative Commons Attribution (CC BY) license (http://creativecommons.org/licenses/by/4.0/).
Share and Cite
Kim, E.H.; Sohn, B.H.; Eun, Y.-G.; Lee, D.J.; Yim, S.Y.; Kang, S.-G.; Lee, J.-S. Silence of Hippo Pathway Associates with Pro-Tumoral Immunosuppression: Potential Therapeutic Target of Glioblastomas. Cells 2020, 9, 1761. https://0-doi-org.brum.beds.ac.uk/10.3390/cells9081761
Kim EH, Sohn BH, Eun Y-G, Lee DJ, Yim SY, Kang S-G, Lee J-S. Silence of Hippo Pathway Associates with Pro-Tumoral Immunosuppression: Potential Therapeutic Target of Glioblastomas. Cells. 2020; 9(8):1761. https://0-doi-org.brum.beds.ac.uk/10.3390/cells9081761
Chicago/Turabian StyleKim, Eui Hyun, Bo Hwa Sohn, Young-Gyu Eun, Dong Jin Lee, Sun Young Yim, Seok-Gu Kang, and Ju-Seog Lee. 2020. "Silence of Hippo Pathway Associates with Pro-Tumoral Immunosuppression: Potential Therapeutic Target of Glioblastomas" Cells 9, no. 8: 1761. https://0-doi-org.brum.beds.ac.uk/10.3390/cells9081761