Glycan Node Analysis of Plasma-Derived Extracellular Vesicles

 , , , ,
Abstract
:
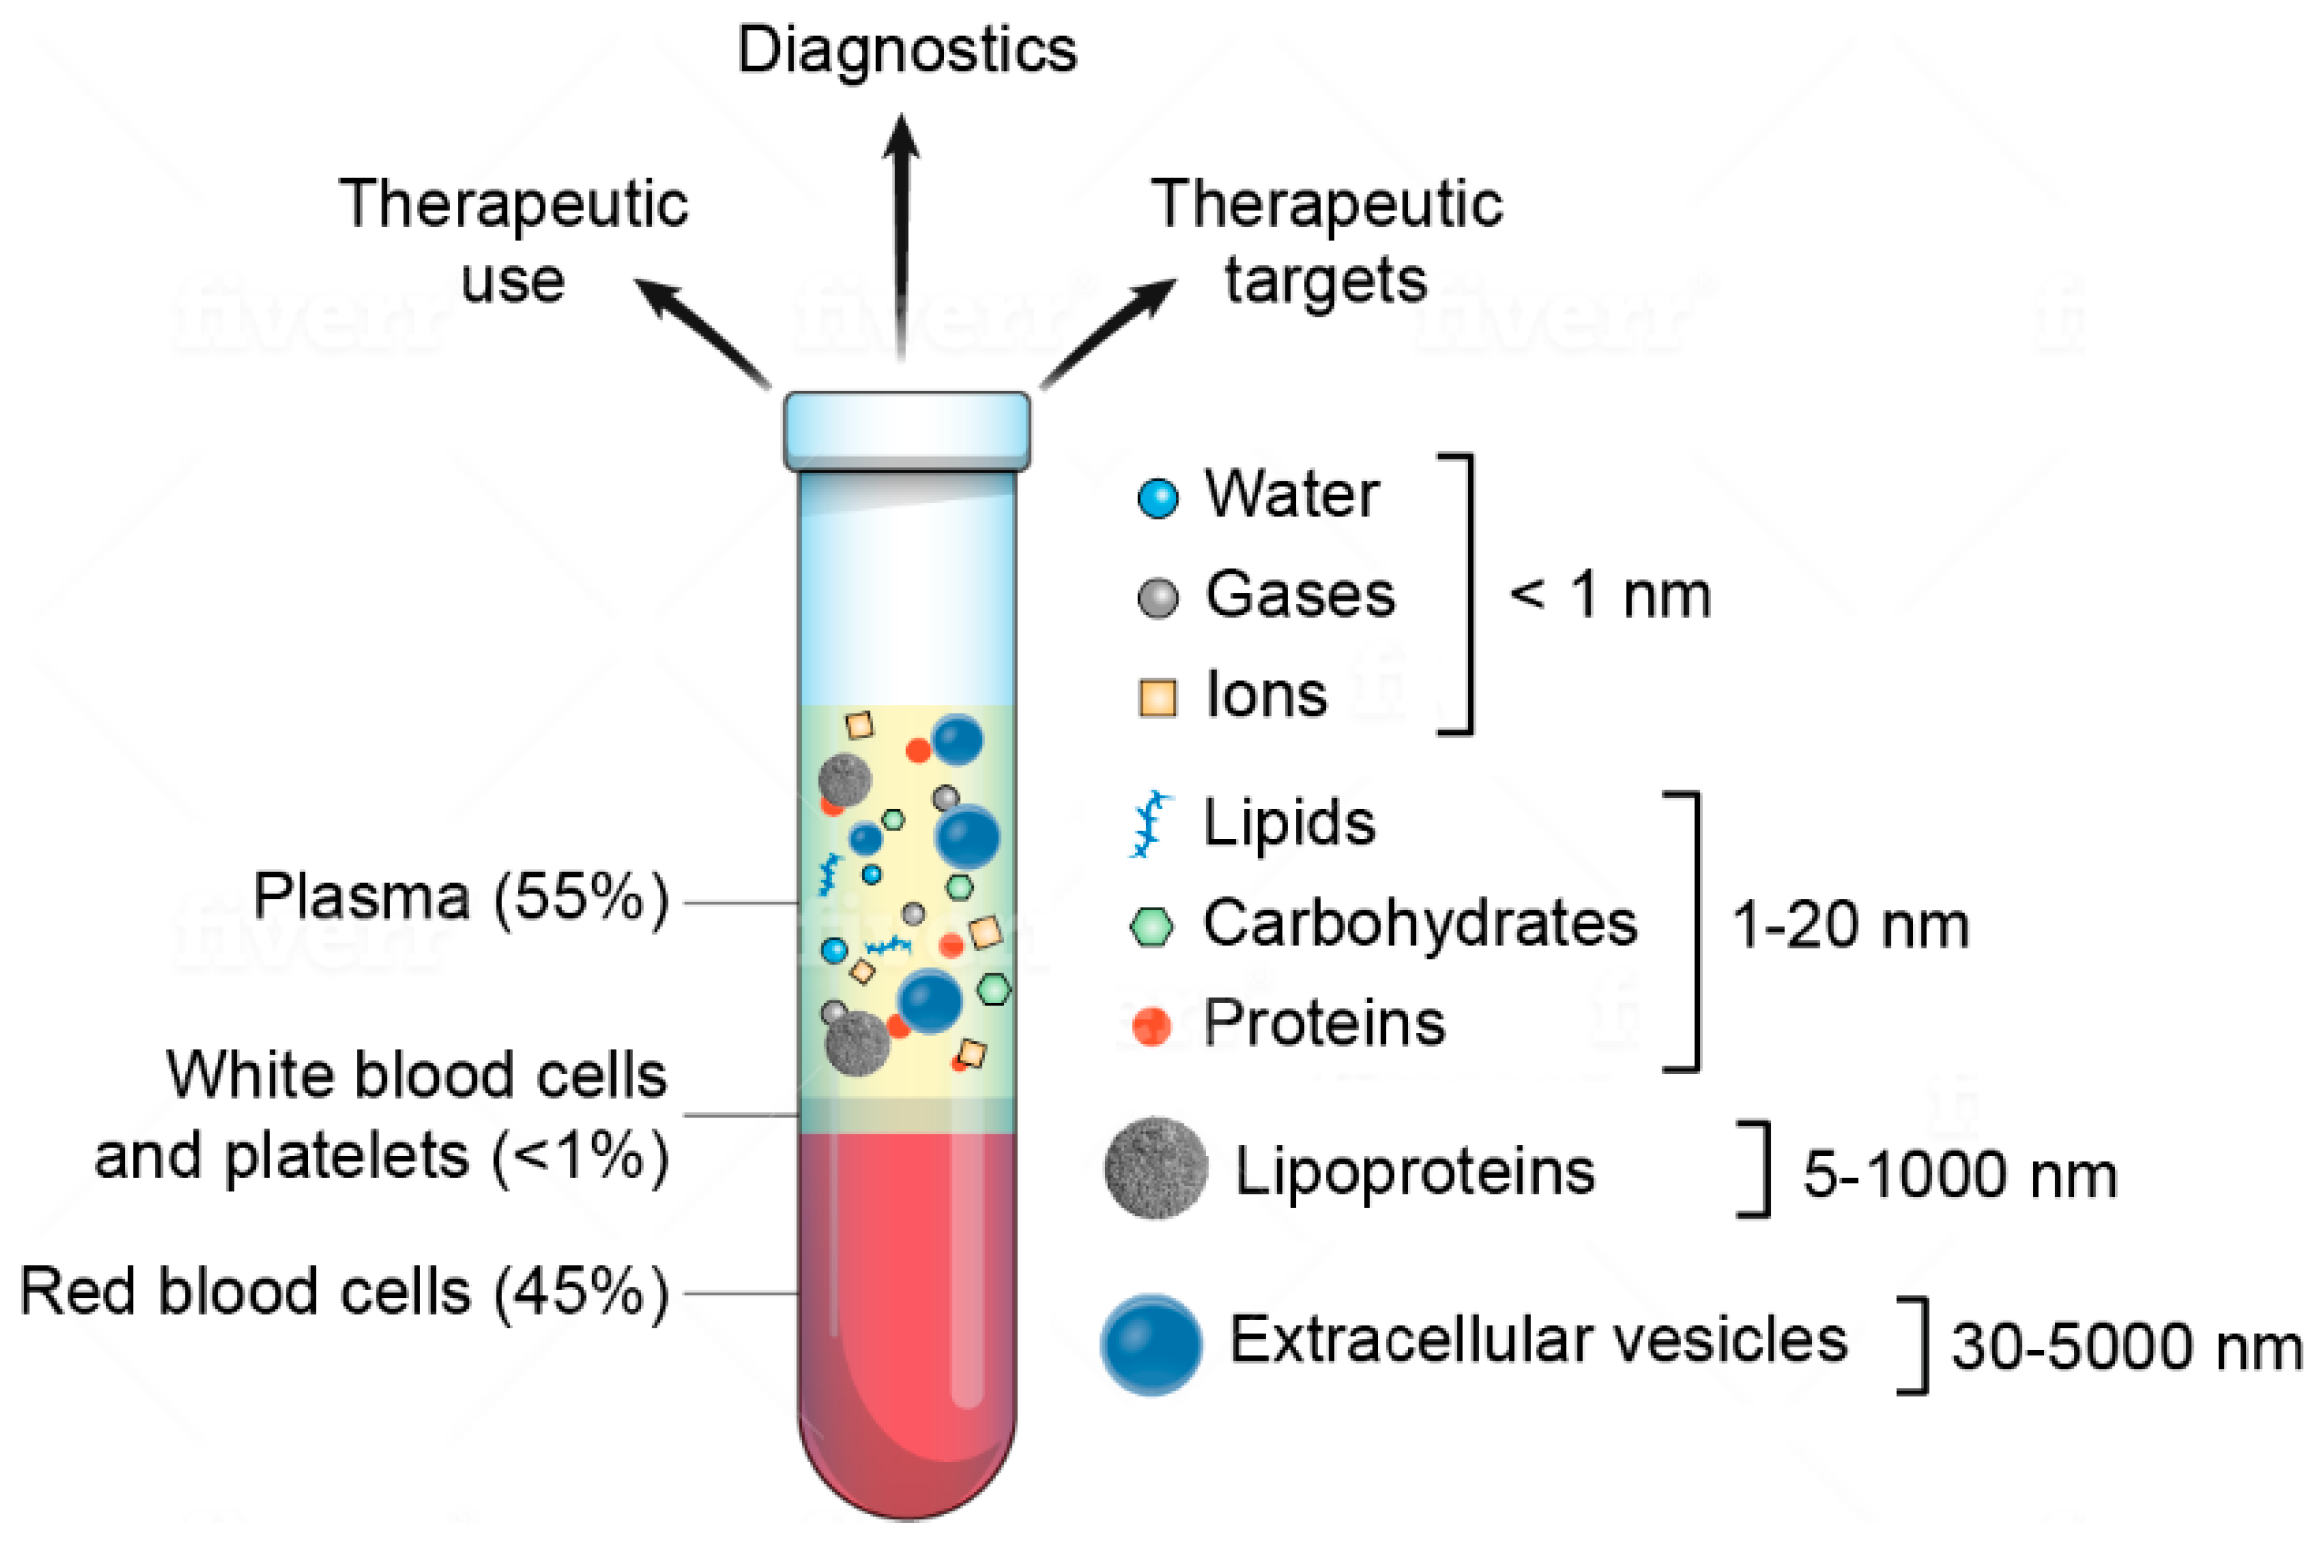
1. Introduction
2. Materials and Methods
2.1. Materials
2.2. Methods
2.2.1. Plasma Collection
2.2.2. EV Isolation
2.2.3. Nanoparticle Tracking Analysis (NTA)
2.2.4. Atomic Force Microscopy (AFM) Imaging
2.2.5. Zeta Potential
2.2.6. BCA
2.2.7. Western Blot
2.2.8. ApoB ELISA
2.2.9. GNA
Permethylation, Nonreductive Release, and Purification of Glycans
Hydrolysis, Reduction, and Acetylation
GC-MS
Data Processing
3. Results
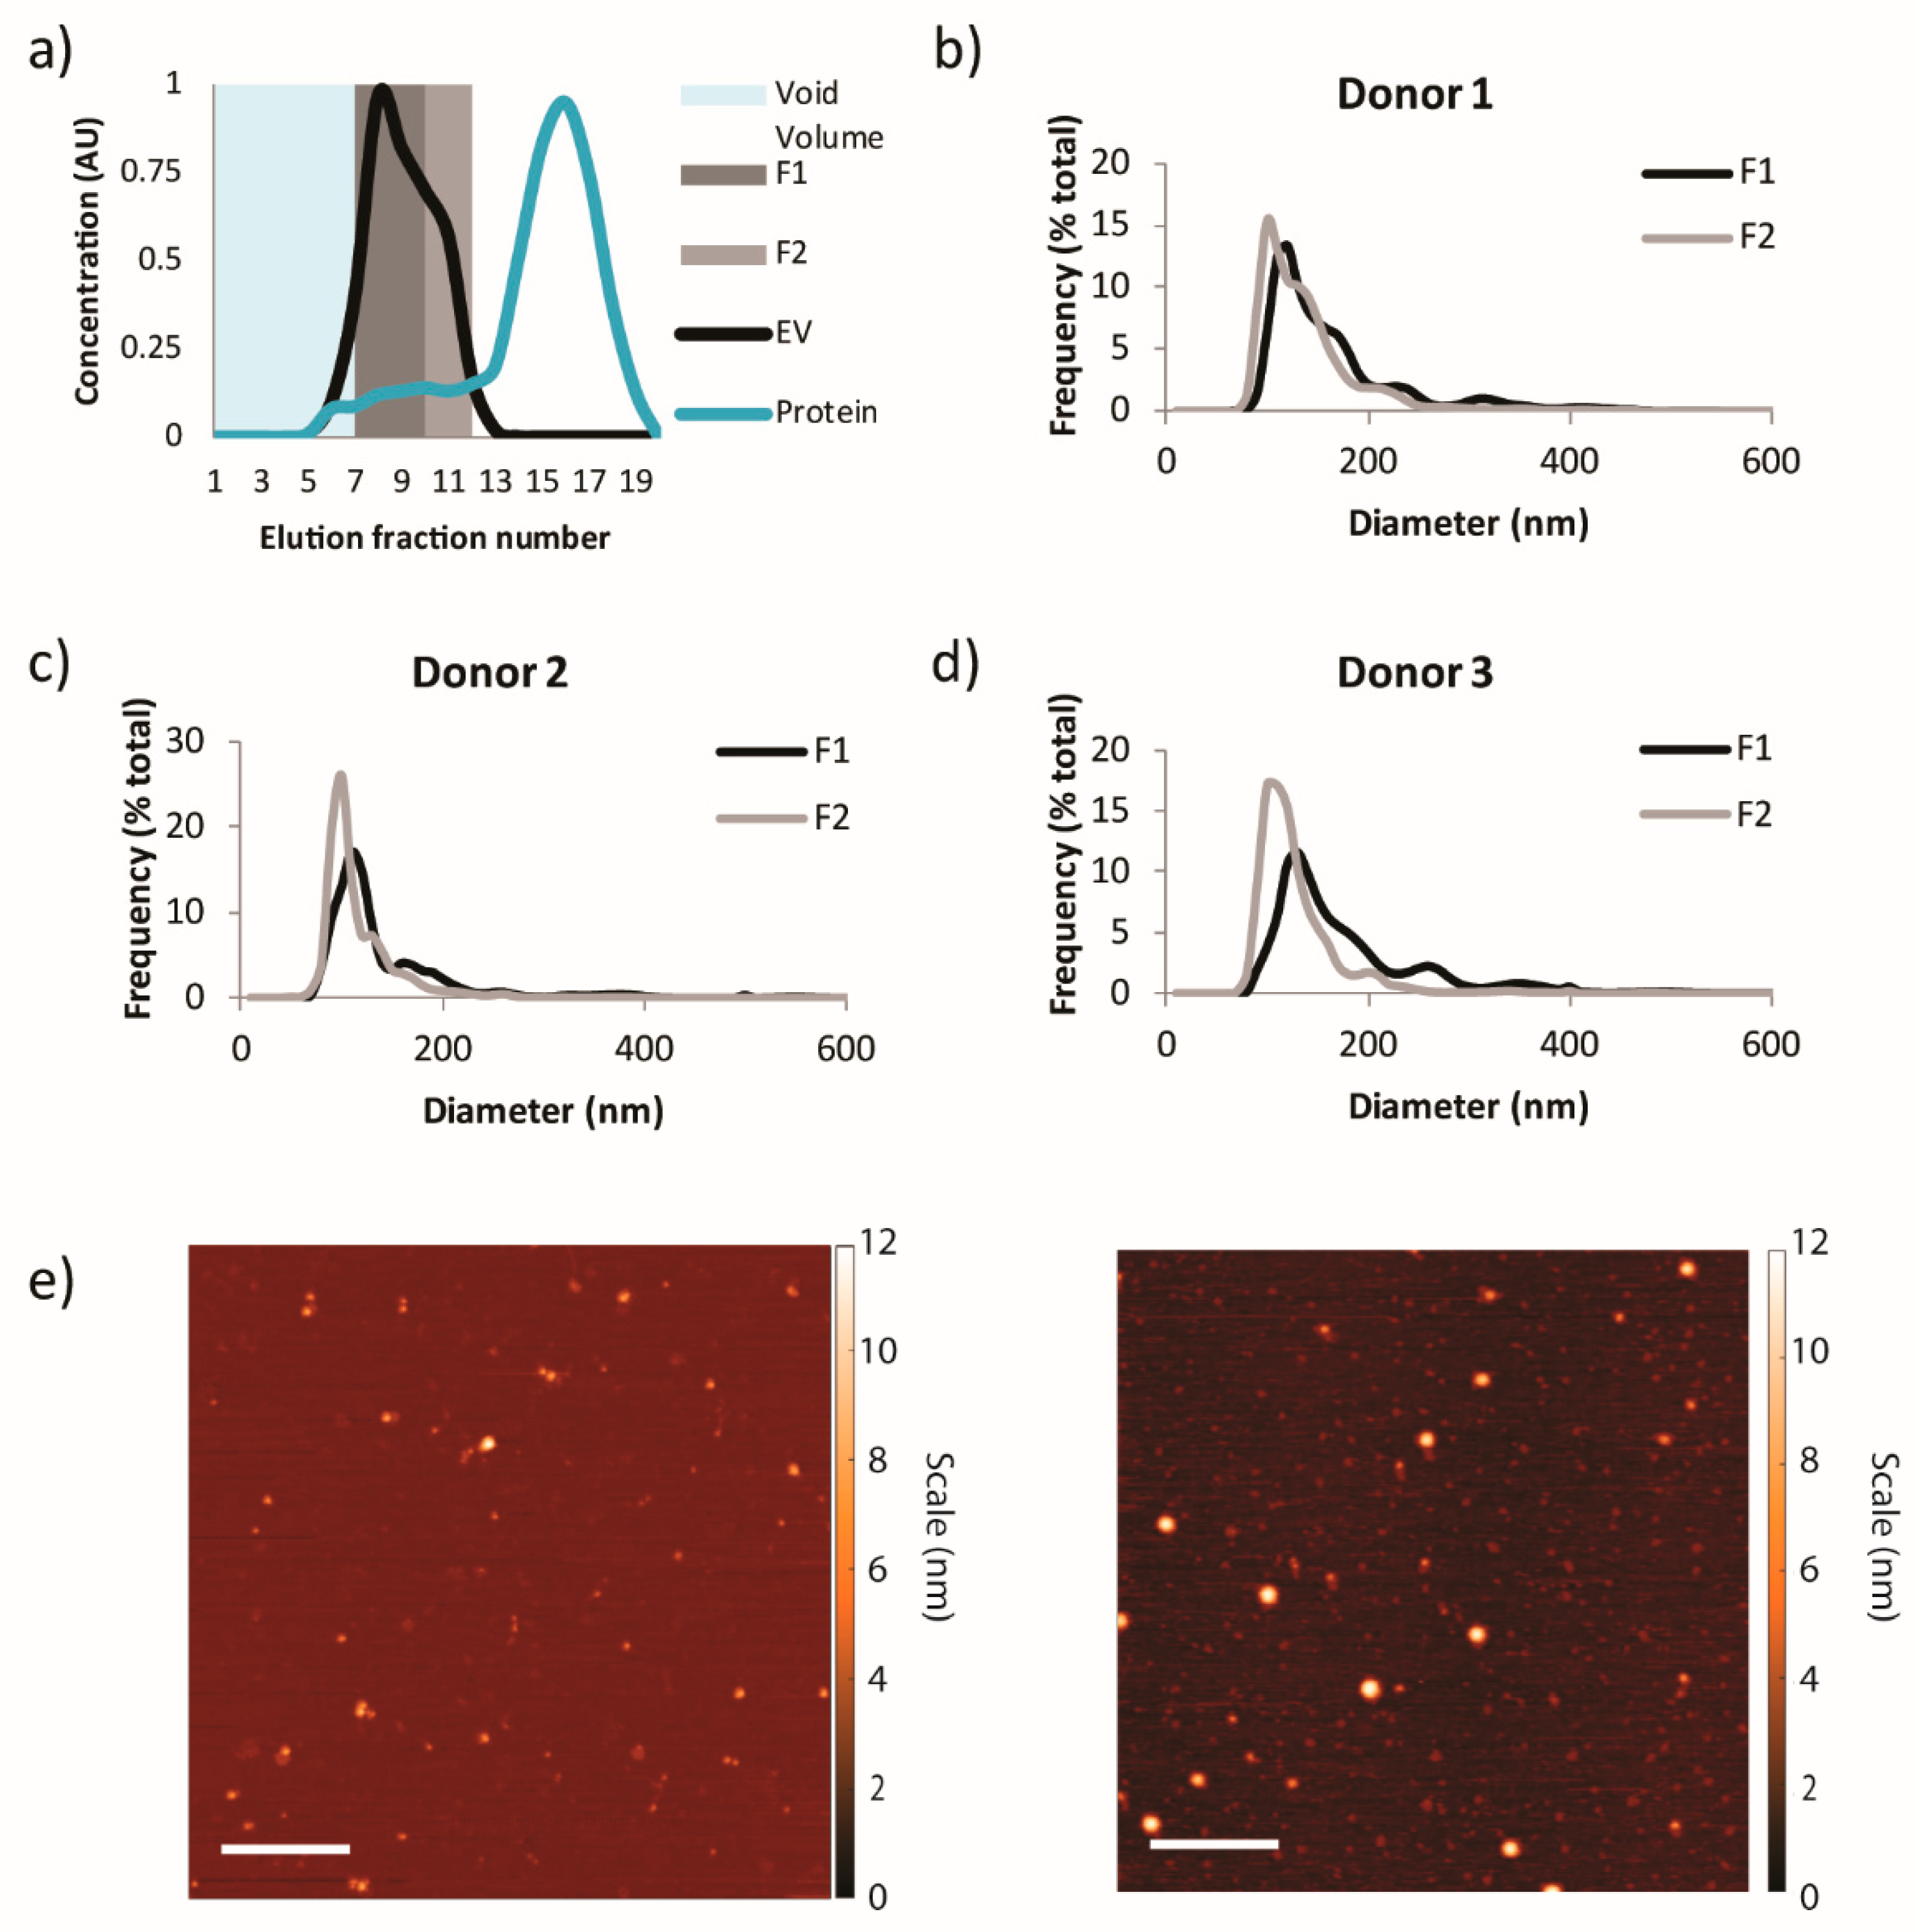
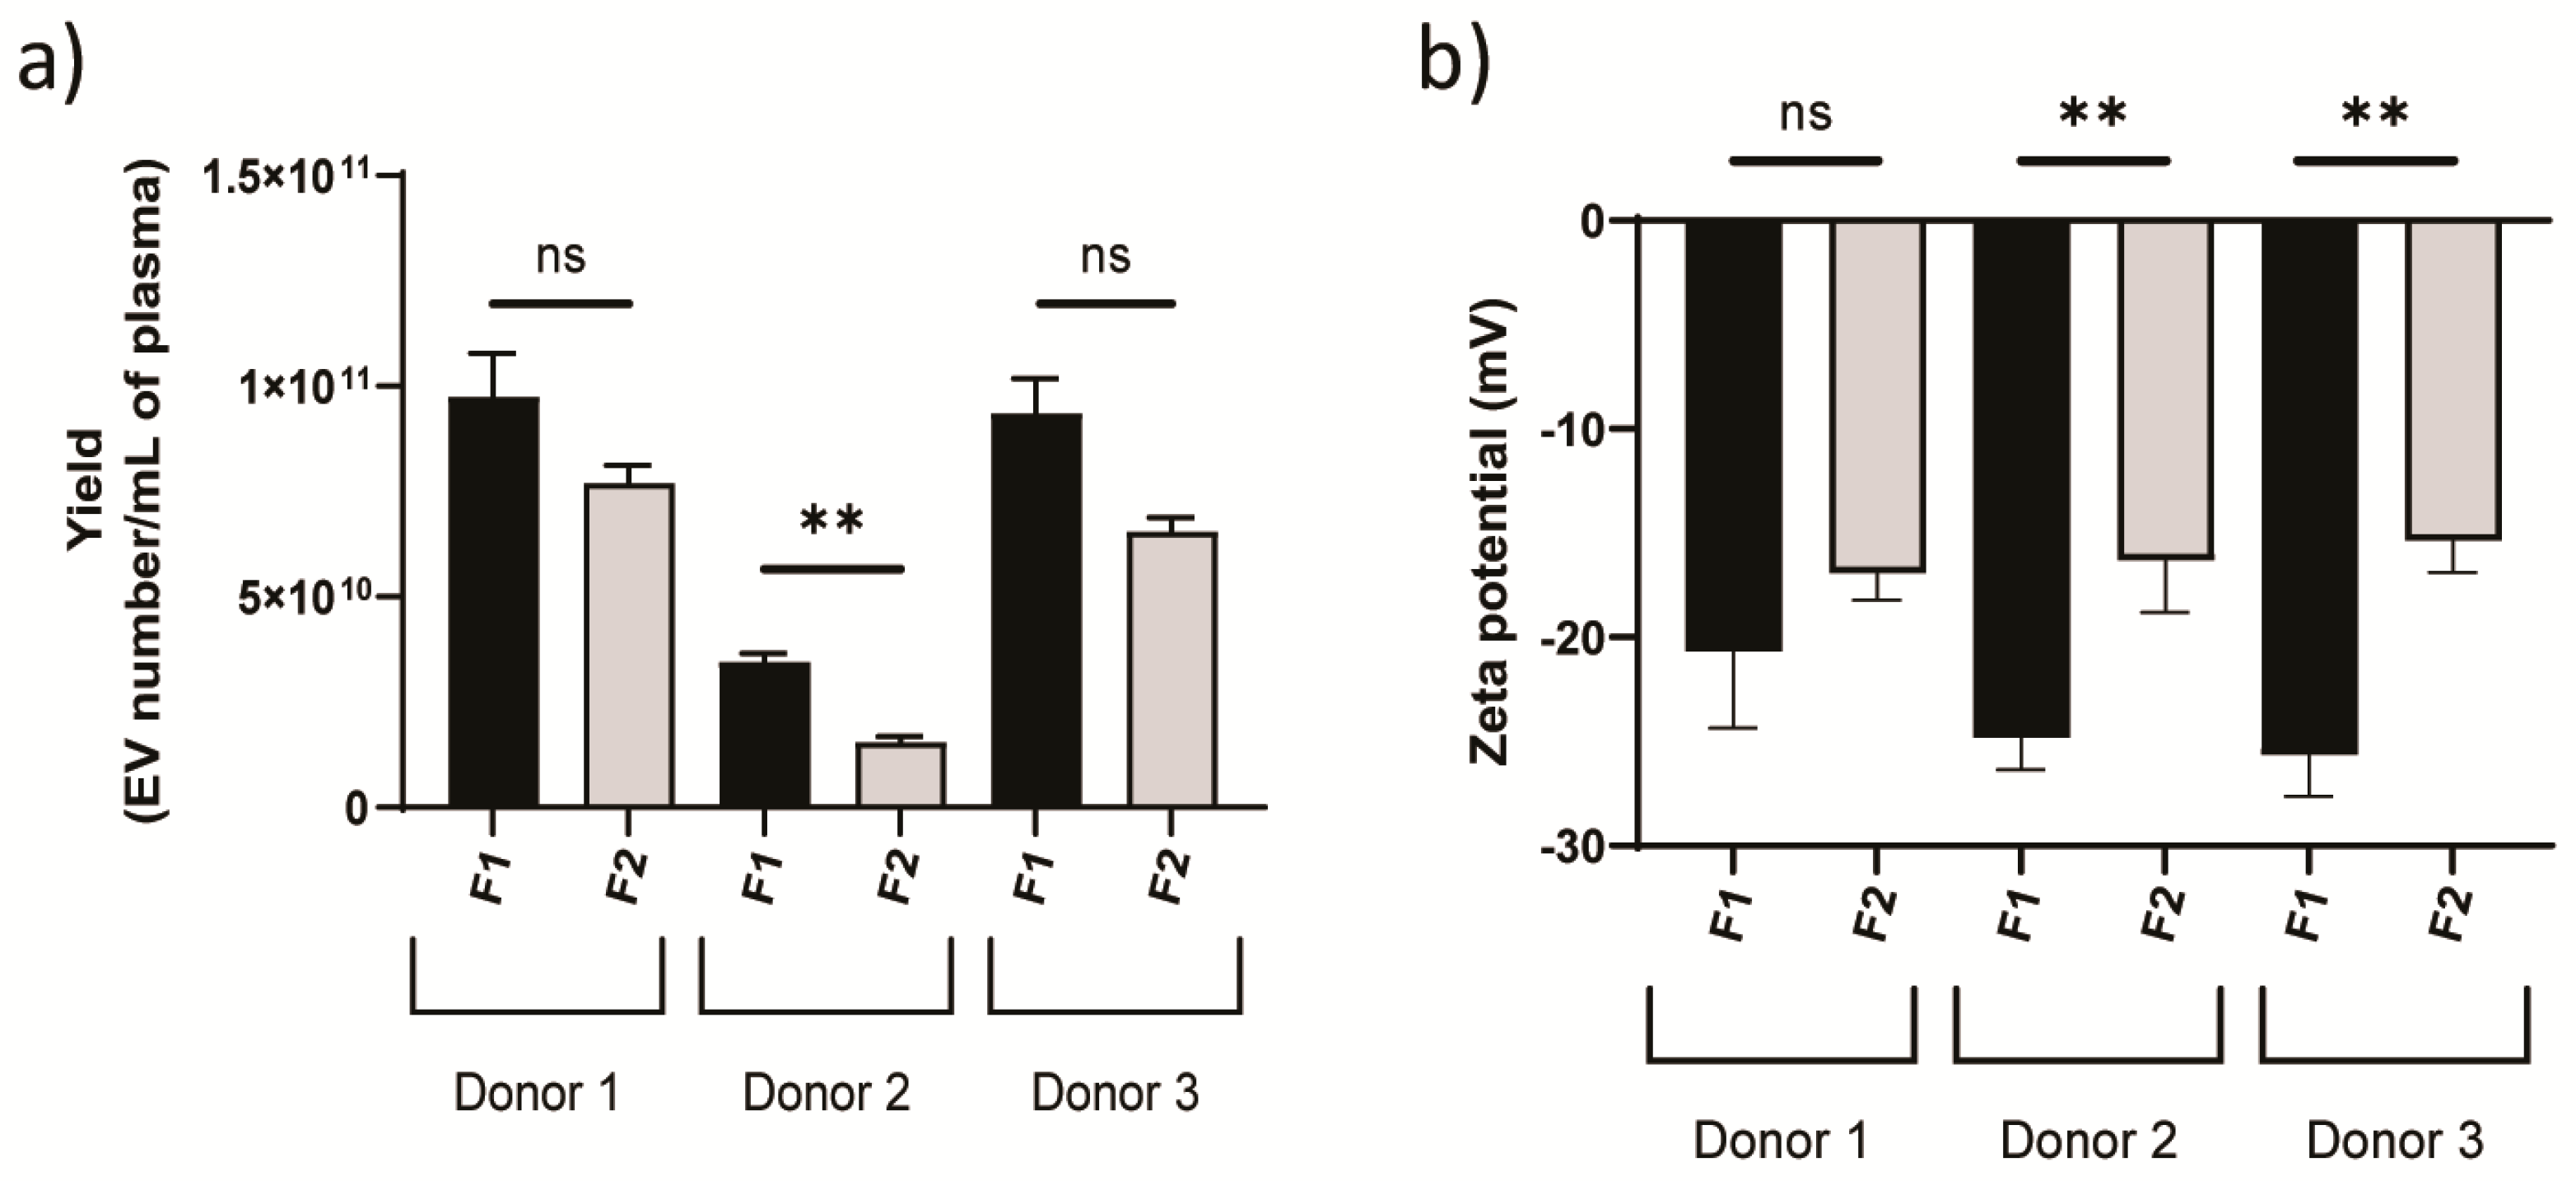
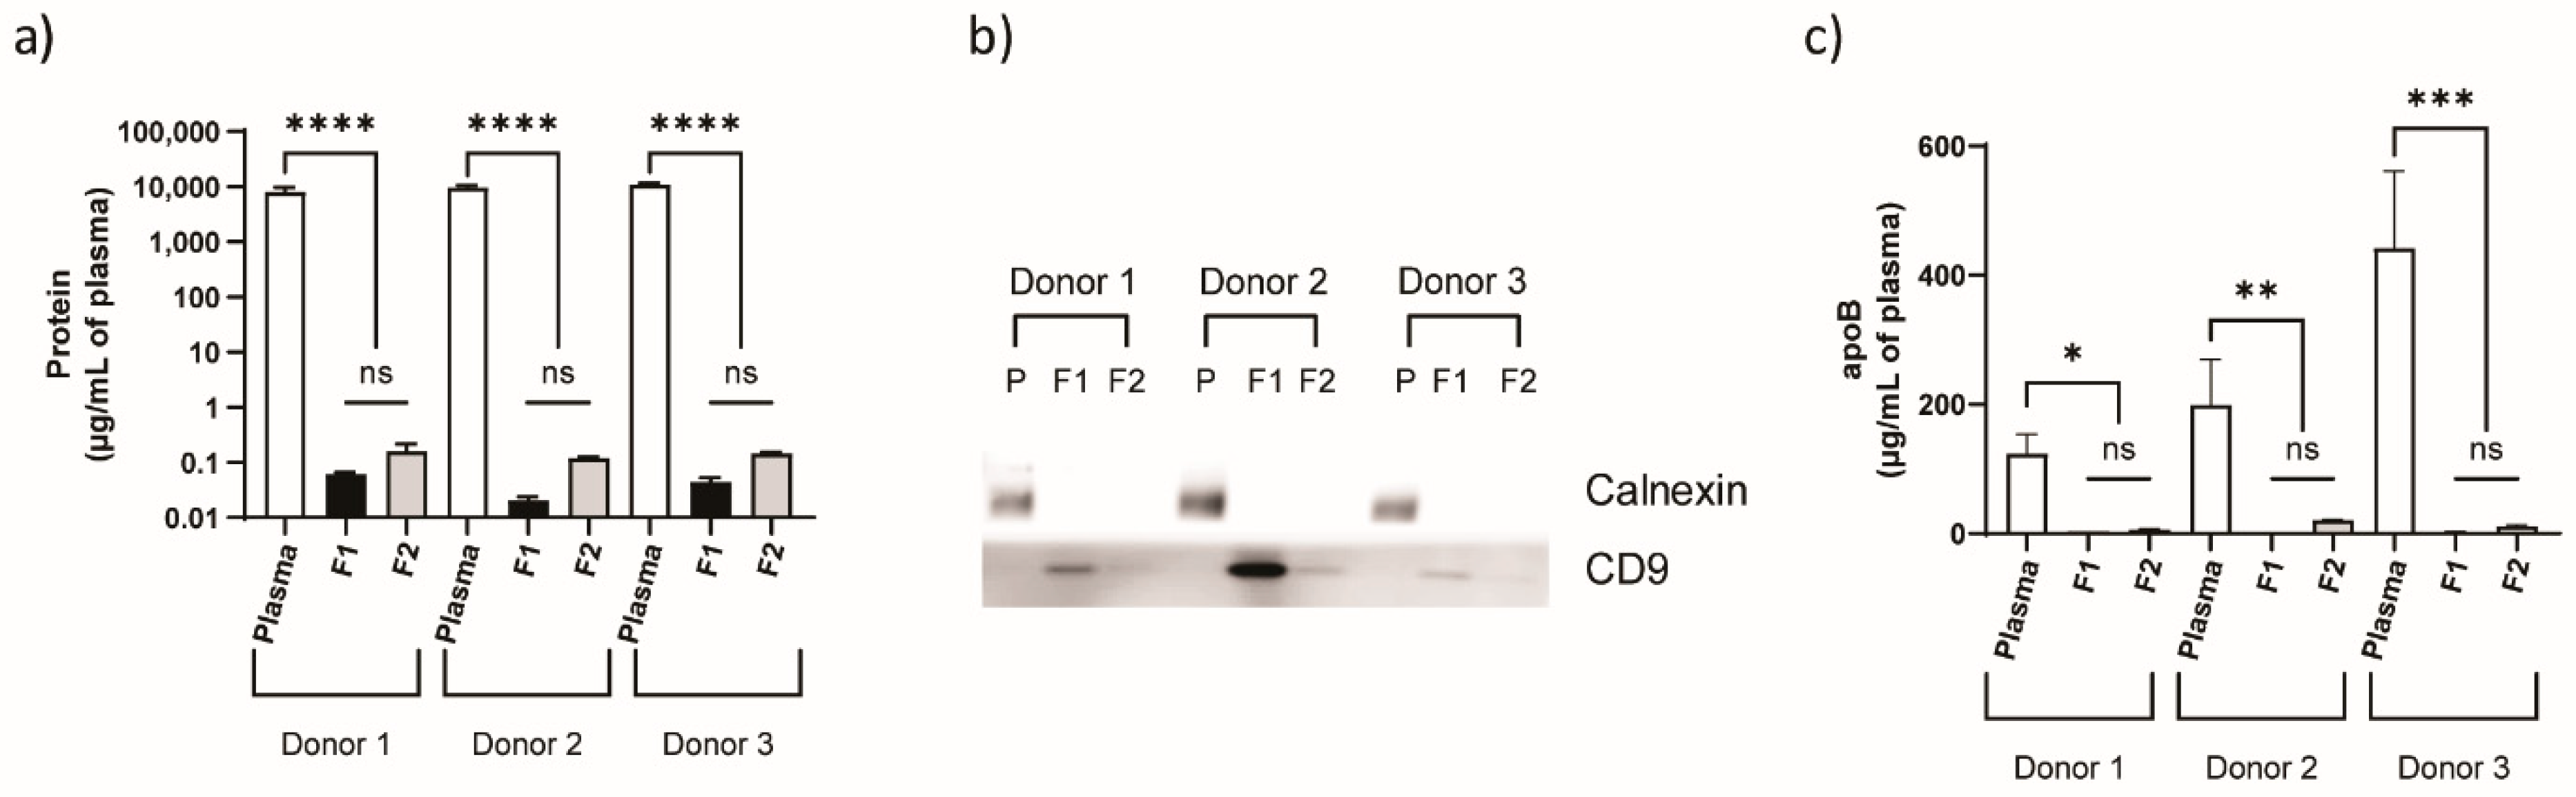
3.1. Physicochemical Characterization of Plasma-Derived EVs
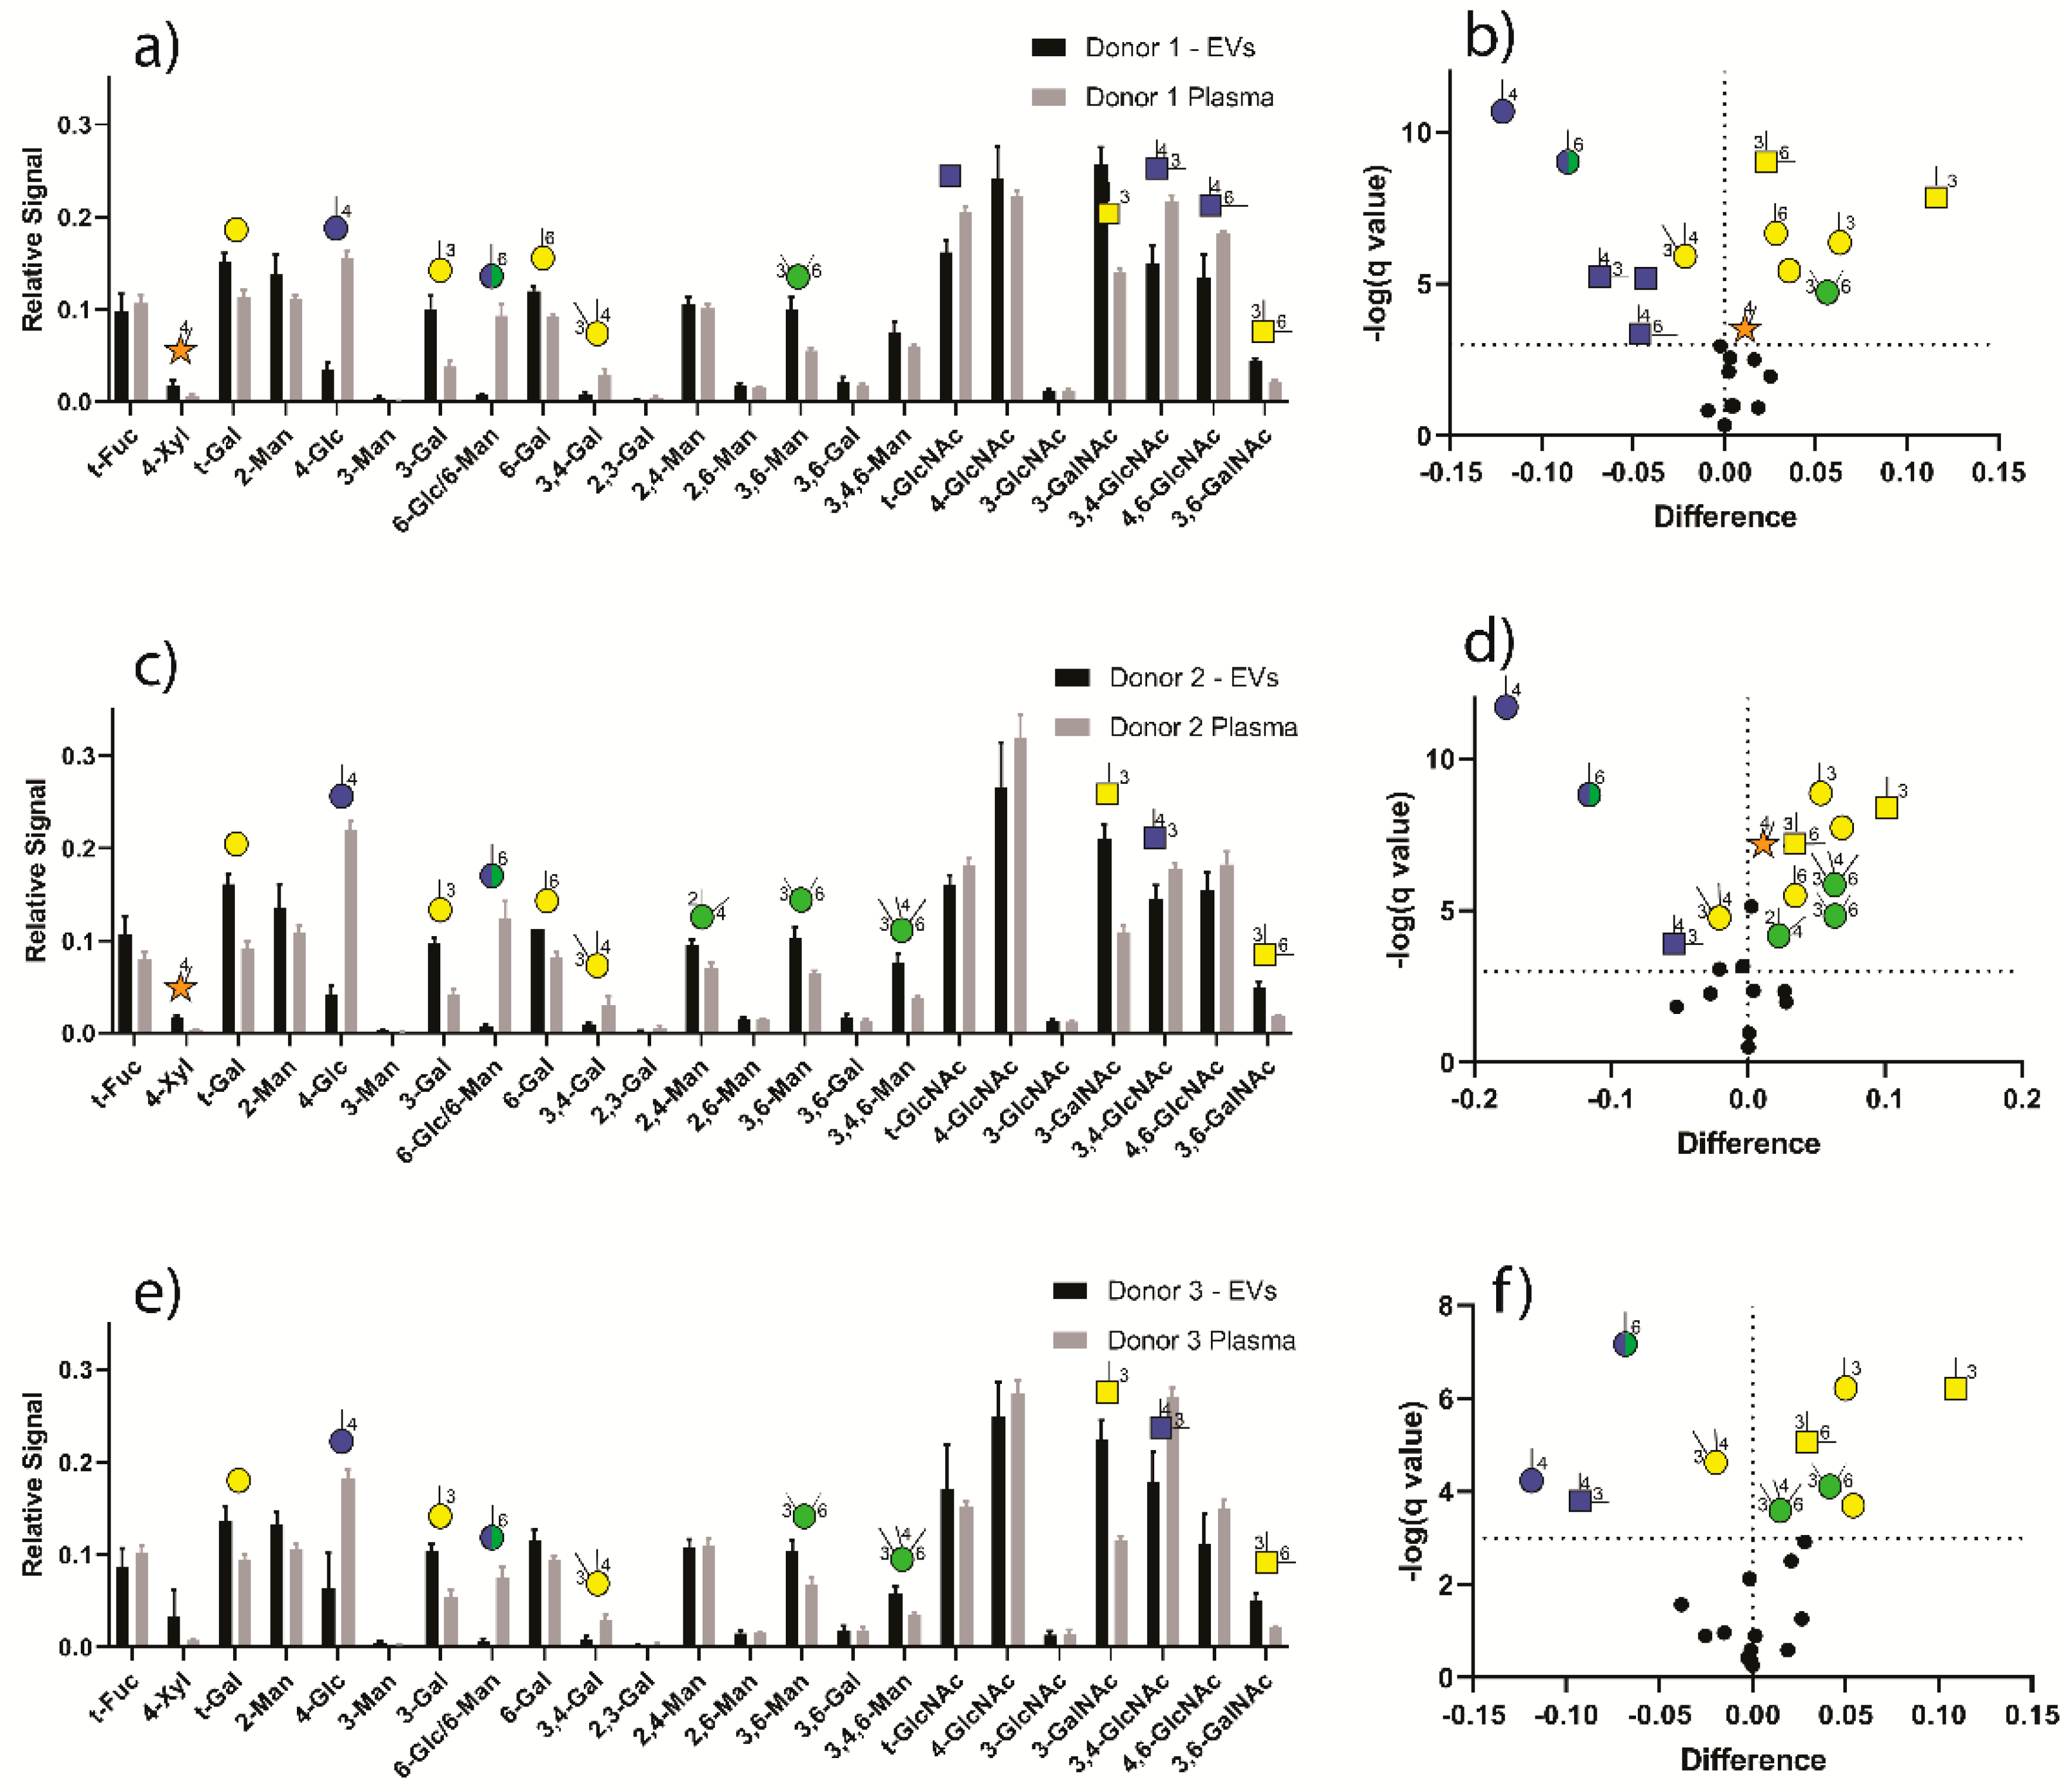
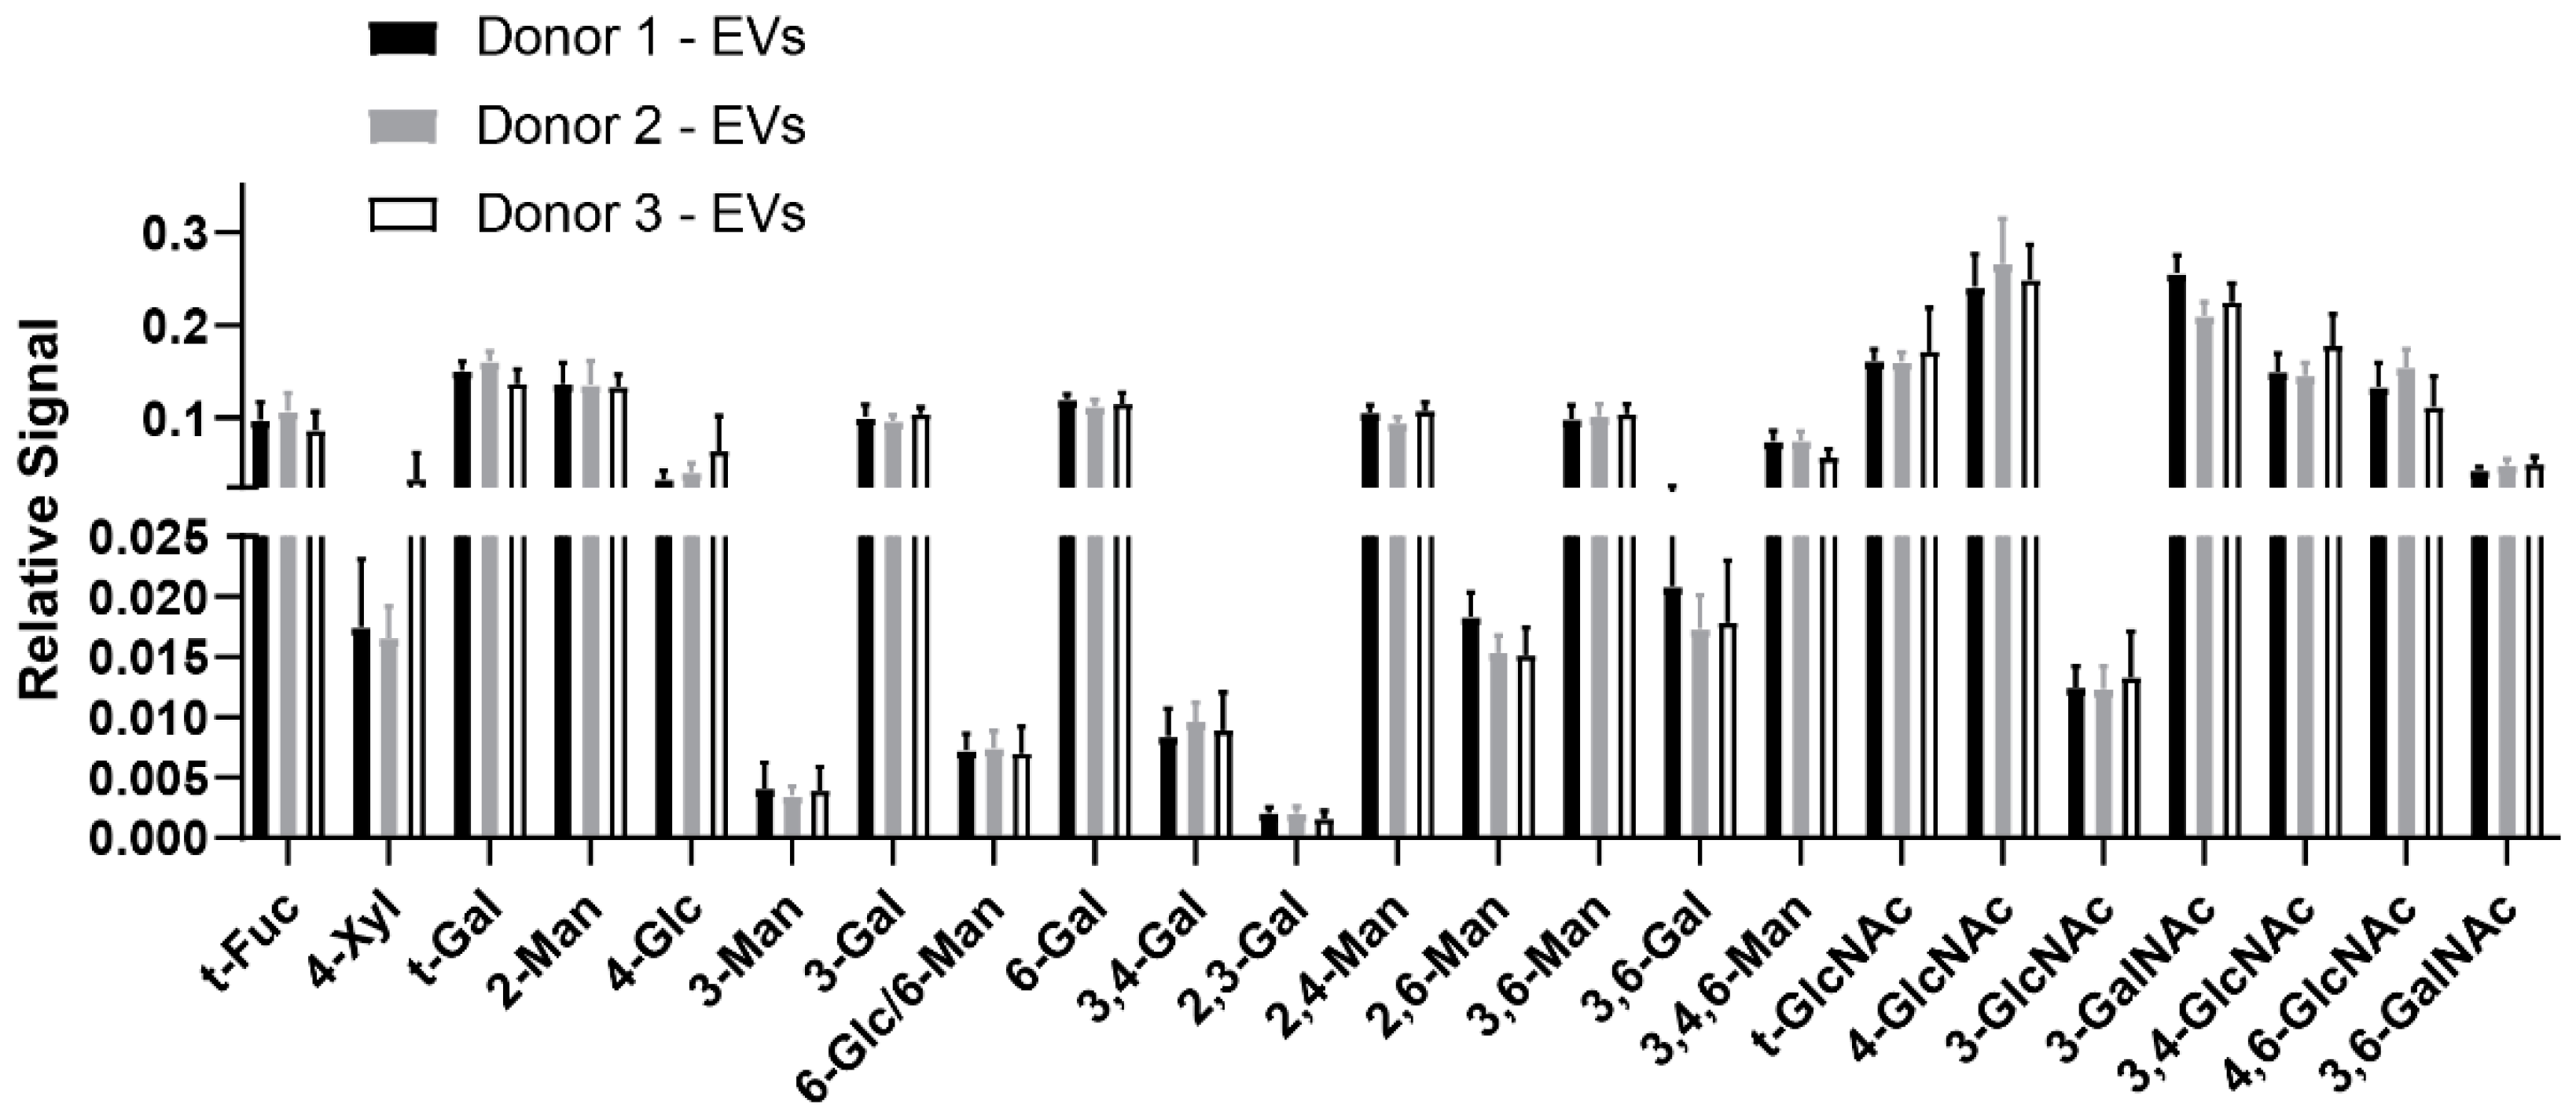
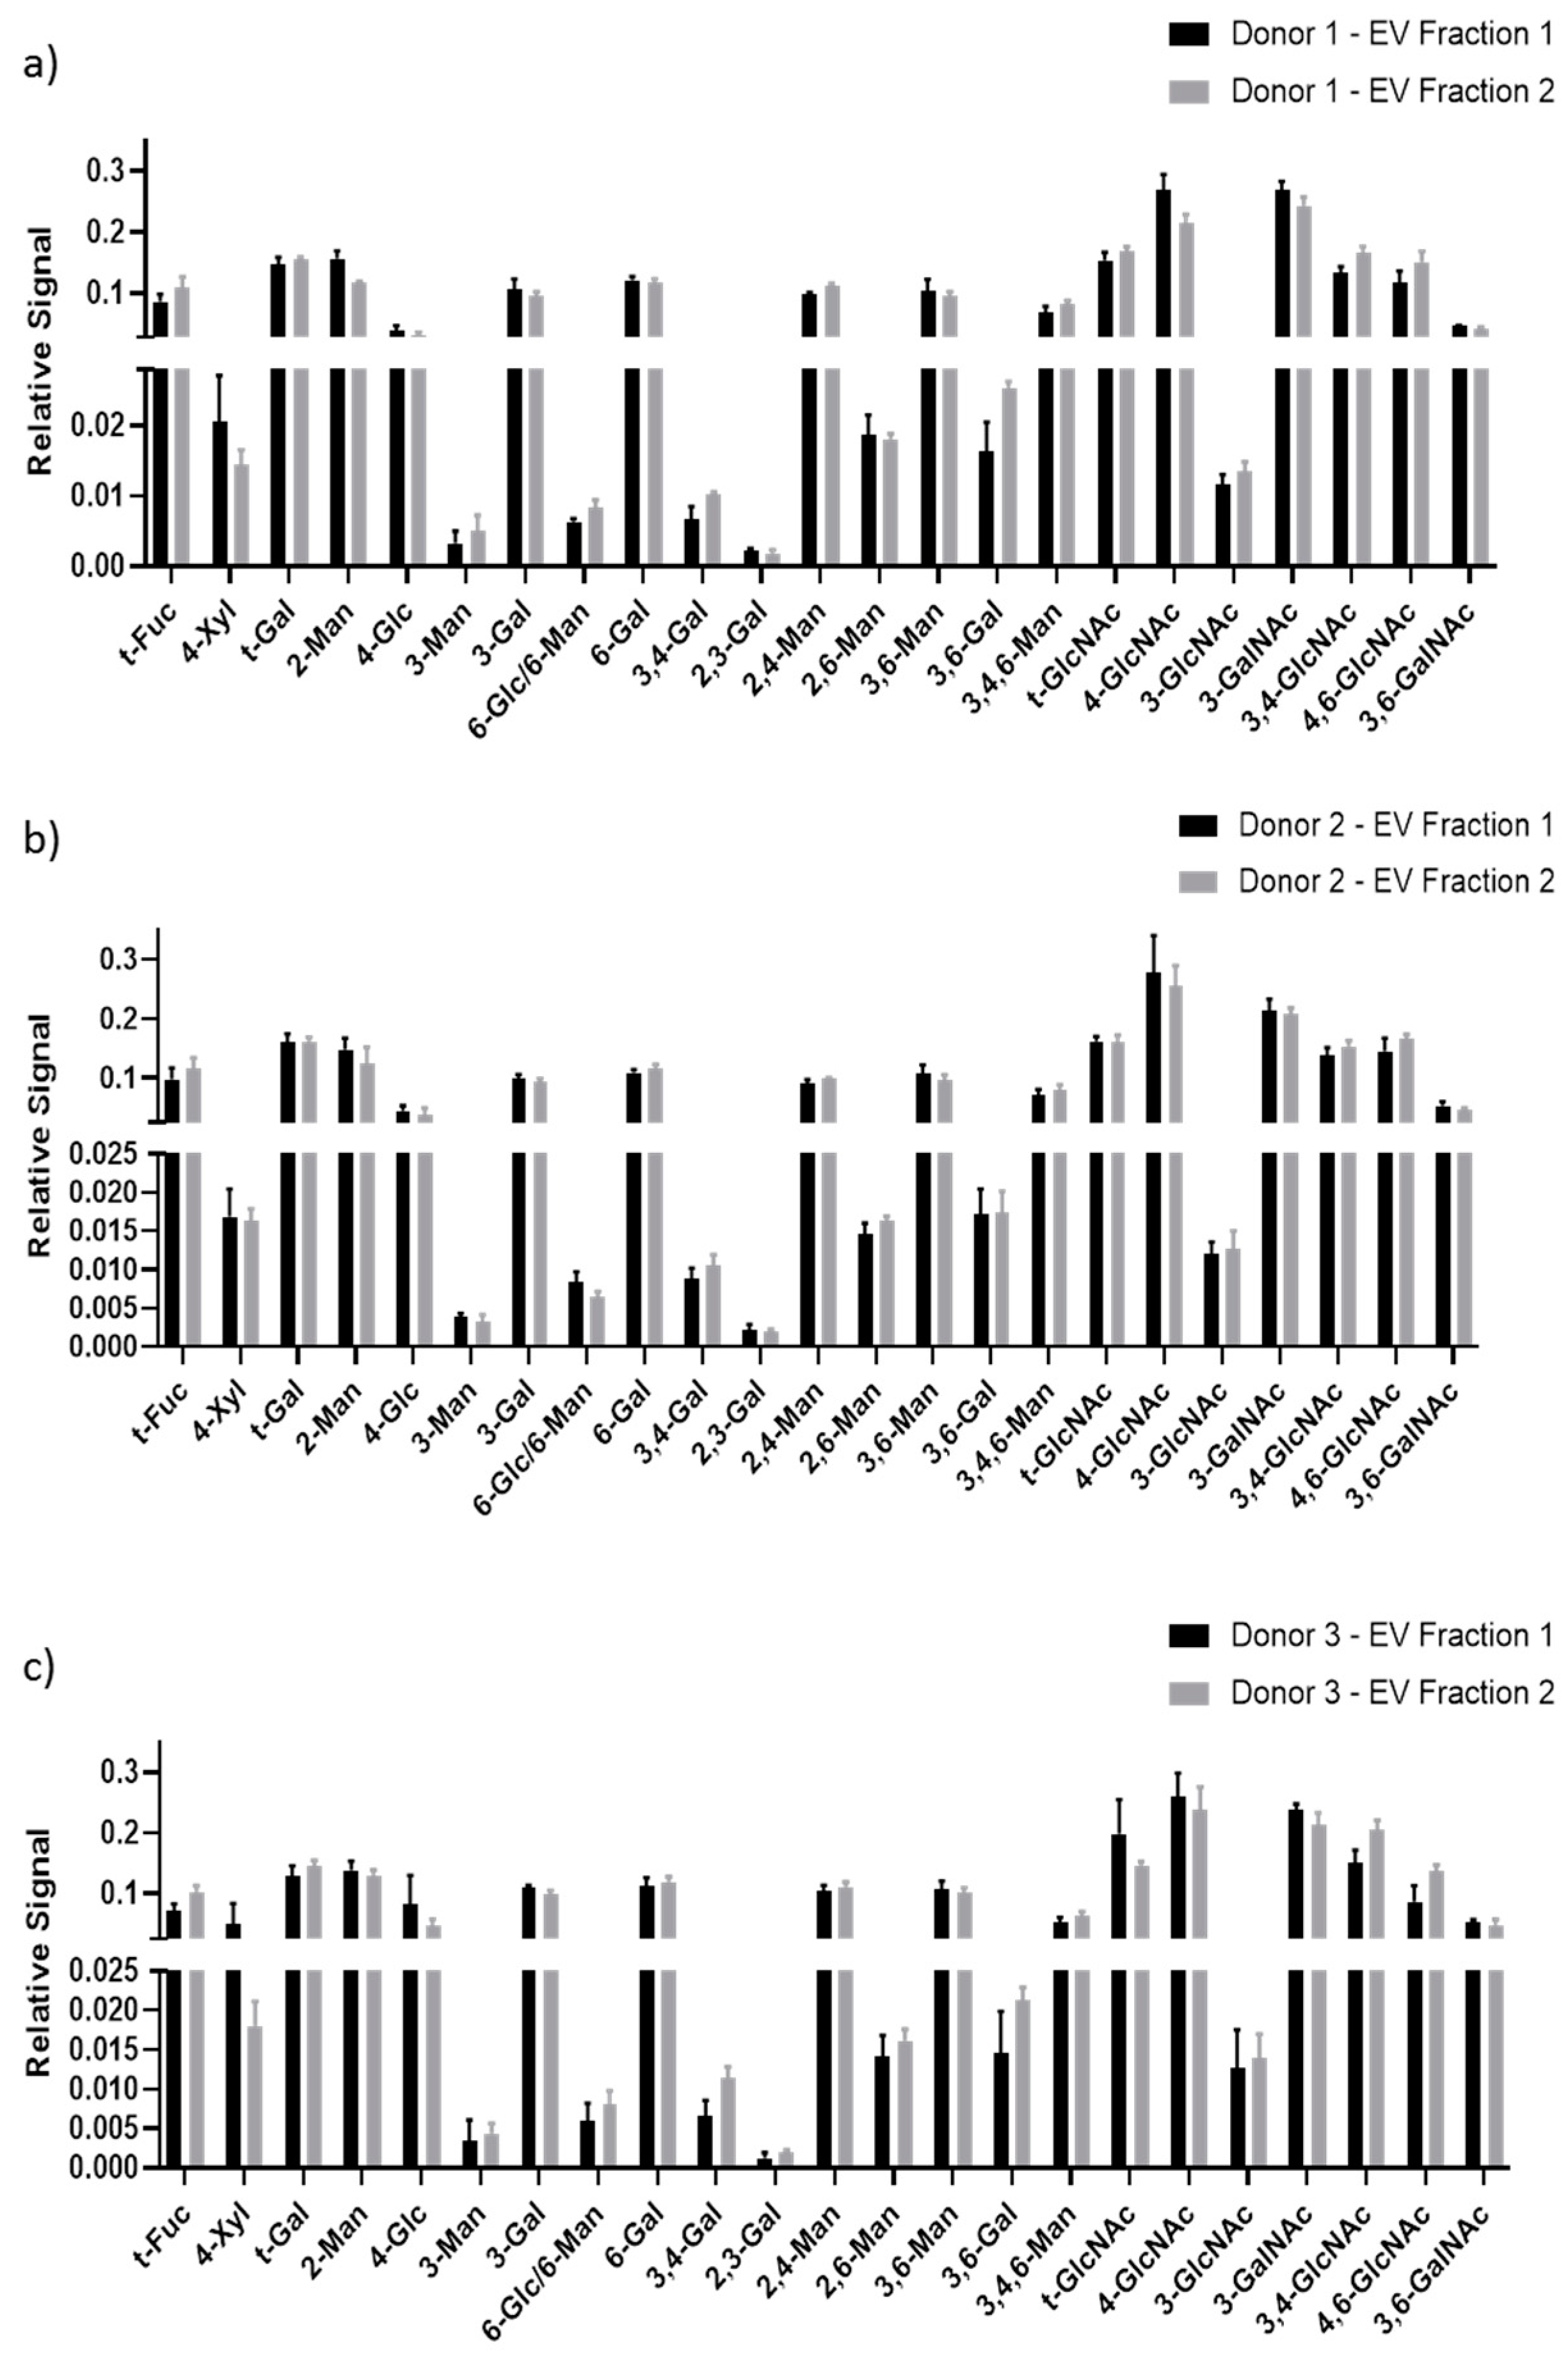
3.2. GNA of Plasma-Derived EVs
4. Discussion
Author Contributions
Funding
Conflicts of Interest
References
- Megyesi, C.; Samols, E.; Marks, V. Glucose Tolerance and Diabetes in Chronic Liver Disease. Lancet 1967, 290, 1051–1056. [Google Scholar] [CrossRef]
- Ehrnst, A.; Sonnerborg, A.; Bergdahl, S.; Strannegard, O. Efficient isolation of HIV from plasma during different stages of HIV infection. J. Med. Virol. 1988, 26, 23–32. [Google Scholar] [CrossRef] [PubMed]
- Abel, J.J.; Rowntree, L.G.; Turner, B.B. Plasma removal with return of corpuscles (plasmaphaeresis). The Journal of Pharmacology and experimental therapeutics Vol. V. No. 6, July, 1914. Transfus. Sci. 1914, 11, 166–177. [Google Scholar]
- Mansouri Taleghani, B.; Buser, A. Therapeutic Apheresis. Transfus. Med. Hemother. 2019, 46, 391–393. [Google Scholar] [CrossRef] [PubMed]
- Skorupka, N.; Miclea, A.; Jalowiec, K.A.; Bocksrucker, C.; Kamber, N.; Chan, A.; Mansouri Taleghani, B.; Hoepner, R.; Salmen, A. Visual Outcomes of Plasma Exchange Treatment of Steroid-Refractory Optic Neuritis: A Retrospective Monocentric Analysis. Transfus. Med. Hemother. 2019, 46, 417–422. [Google Scholar] [CrossRef] [PubMed]
- Schwartz, J.; Padmanabhan, A.; Aqui, N.; Balogun, R.A.; Connelly-Smith, L.; Delaney, M.; Dunbar, N.M.; Witt, V.; Wu, Y.; Shaz, B.H. Guidelines on the Use of Therapeutic Apheresis in Clinical Practice-Evidence-Based Approach from the Writing Committee of the American Society for Apheresis: The Seventh Special Issue. J. Clin. Apher. 2016, 31, 149–162. [Google Scholar] [CrossRef] [PubMed]
- Kwapisz, D. The first liquid biopsy test approved. Is it a new era of mutation testing for non-small cell lung cancer? Ann. Transl. Med. 2017, 5, 46. [Google Scholar] [CrossRef] [Green Version]
- Ho, E.; Van Hees, S.; Goethals, S.; Smits, E.; Huizing, M.; Francque, S.; De Winter, B.; Michielsen, P.; Vanwolleghem, T. Biobanking for Viral Hepatitis Research. Front. Med. 2019, 6, 183. [Google Scholar] [CrossRef]
- Delamare, C.; Burgard, M.; Mayaux, M.J.; Blanche, S.; Doussin, A.; Ivanoff, S.; Chaix, M.L.; Khan, C.; Rouzioux, C. HIV-1 RNA detection in plasma for the diagnosis of infection in neonates. The French Pediatric HIV Infection Study Group. J. Acquir. Immune Defic. Syndr. Hum. Retrovirol 1997, 15, 121–125. [Google Scholar] [CrossRef]
- Thijssen, E.H.; La Joie, R.; Wolf, A.; Strom, A.; Wang, P.; Iaccarino, L.; Bourakova, V.; Cobigo, Y.; Heuer, H.; Spina, S.; et al. Diagnostic value of plasma phosphorylated tau181 in Alzheimer’s disease and frontotemporal lobar degeneration. Nat. Med. 2020. [Google Scholar] [CrossRef]
- Kanada, M.; Bachmann, M.H.; Contag, C.H. Signaling by Extracellular Vesicles Advances Cancer Hallmarks. Trends Cancer 2016, 2, 84–94. [Google Scholar] [CrossRef] [PubMed]
- Mathew, J.; Varacallo, M. Physiology, Blood Plasma. In StatPearls; StatPearls Publishing: Treasure Island, FL, USA, 2020. [Google Scholar]
- Hong, C.S.; Funk, S.; Whiteside, T.L. Isolation of Biologically Active Exosomes from Plasma of Patients with Cancer. Methods Mol. Biol. 2017, 1633, 257–265. [Google Scholar] [CrossRef] [PubMed]
- Nazarenko, I. Extracellular Vesicles: Recent Developments in Technology and Perspectives for Cancer Liquid Biopsy. Recent Results Cancer Res. 2020, 215, 319–344. [Google Scholar] [CrossRef] [PubMed]
- Thery, C.; Witwer, K.W.; Aikawa, E.; Alcaraz, M.J.; Anderson, J.D.; Andriantsitohaina, R.; Antoniou, A.; Arab, T.; Archer, F.; Atkin-Smith, G.K.; et al. Minimal information for studies of extracellular vesicles 2018 (MISEV2018): A position statement of the International Society for Extracellular Vesicles and update of the MISEV2014 guidelines. J. Extracell. Vesicles 2018, 7, 1535750. [Google Scholar] [CrossRef] [Green Version]
- Walker, S.; Busatto, S.; Pham, A.; Tian, M.; Suh, A.; Carson, K.; Quintero, A.; Lafrence, M.; Malik, H.; Santana, M.X.; et al. Extracellular vesicle-based drug delivery systems for cancer treatment. Theranostics 2019, 9, 8001–8017. [Google Scholar] [CrossRef]
- Busatto, S.; Pham, A.; Suh, A.; Shapiro, S.; Wolfram, J. Organotropic drug delivery: Synthetic nanoparticles and extracellular vesicles. Biomed. Microdevices 2019, 21. [Google Scholar] [CrossRef]
- Borrelli, D.A.; Yankson, K.; Shukla, N.; Vilanilam, G.; Ticer, T.; Wolfram, J. Extracellular vesicle therapeutics for liver disease. J. Control. Release 2018, 273, 86–98. [Google Scholar] [CrossRef]
- Suh, A.; Pham, A.; Cress, M.J.; Pincelli, T.; TerKonda, S.P.; Bruce, A.J.; Zubair, A.C.; Wolfram, J.; Shapiro, S.A. Adipose-derived cellular and cell-derived regenerative therapies in dermatology and aesthetic rejuvenation. Ageing Res. Rev. 2019, 54, 100933. [Google Scholar] [CrossRef]
- Kimura, K.; Hohjoh, H.; Yamamura, T. The Role for Exosomal microRNAs in Disruption of Regulatory T Cell Homeostasis in Multiple Sclerosis. J. Exp. Neurosci. 2018, 12, 1179069518764892. [Google Scholar] [CrossRef]
- Guiot, J.; Struman, I.; Louis, E.; Louis, R.; Malaise, M.; Njock, M.S. Exosomal miRNAs in Lung Diseases: From Biologic Function to Therapeutic Targets. J. Clin. Med. 2019, 8, 1345. [Google Scholar] [CrossRef] [Green Version]
- Wang, S.; Yang, Y.; Sun, L.; Qiao, G.; Song, Y.; Liu, B. Exosomal MicroRNAs as Liquid Biopsy Biomarkers in Hepatocellular Carcinoma. Onco Targets Ther. 2020, 13, 2021–2030. [Google Scholar] [CrossRef] [PubMed] [Green Version]
- Li, F.; Xie, X.Y.; Sui, X.F.; Wang, P.; Chen, Z.; Zhang, J.B. Profile of Pathogenic Proteins and MicroRNAs in Plasma-derived Extracellular Vesicles in Alzheimer’s Disease: A Pilot Study. Neuroscience 2020, 432, 240–246. [Google Scholar] [CrossRef] [PubMed]
- Whiteside, T.L. Exosomes carrying immunoinhibitory proteins and their role in cancer. Clin. Exp. Immunol. 2017, 189, 259–267. [Google Scholar] [CrossRef] [PubMed] [Green Version]
- Choi, D.; Spinelli, C.; Montermini, L.; Rak, J. Oncogenic Regulation of Extracellular Vesicle Proteome and Heterogeneity. Proteomics 2019, 19, e1800169. [Google Scholar] [CrossRef] [PubMed] [Green Version]
- Reily, C.; Stewart, T.J.; Renfrow, M.B.; Novak, J. Glycosylation in health and disease. Nat. Rev. Nephrol. 2019, 15, 346–366. [Google Scholar] [CrossRef] [PubMed]
- Hennig, R.; Cajic, S.; Borowiak, M.; Hoffmann, M.; Kottler, R.; Reichl, U.; Rapp, E. Towards personalized diagnostics via longitudinal study of the human plasma N-glycome. Biochim. Biophys. Acta 2016, 1860, 1728–1738. [Google Scholar] [CrossRef] [Green Version]
- Suhre, K.; Trbojevic-Akmacic, I.; Ugrina, I.; Mook-Kanamori, D.O.; Spector, T.; Graumann, J.; Lauc, G.; Falchi, M. Fine-Mapping of the Human Blood Plasma N-Glycome onto Its Proteome. Metabolites 2019, 9, 122. [Google Scholar] [CrossRef] [Green Version]
- Varki, A.; Kannagi, R.; Toole, B.; Stanley, P. Glycosylation Changes in Cancer. In Essentials of Glycobiology, 2nd ed.; Varki, A., Cummings, R.D., Esko, J.D., Stanley, P., Hart, G.W., Aebi, M., Darvill, A.G., Kinoshita, T., Packer, N.H., Etzler, M.E., et al., Eds.; Cold Spring Harbor Laboratory Press: Cold Spring Harbor, NY, USA, 2015; pp. 597–609. [Google Scholar] [CrossRef]
- Hu, Y.; Ferdosi, S.; Kapuruge, E.P.; Diaz de Leon, J.A.; Stucker, I.; Radoi, L.; Guenel, P.; Borges, C.R. Diagnostic and Prognostic Performance of Blood Plasma Glycan Features in the Women Epidemiology Lung Cancer (WELCA) Study. J. Proteome Res. 2019, 18, 3985–3998. [Google Scholar] [CrossRef]
- Ferdosi, S.; Ho, T.H.; Castle, E.P.; Stanton, M.L.; Borges, C.R. Behavior of blood plasma glycan features in bladder cancer. PLoS ONE 2018, 13, e0201208. [Google Scholar] [CrossRef]
- Ferdosi, S.; Rehder, D.S.; Maranian, P.; Castle, E.P.; Ho, T.H.; Pass, H.I.; Cramer, D.W.; Anderson, K.S.; Fu, L.; Cole, D.E.C.; et al. Stage Dependence, Cell-Origin Independence, and Prognostic Capacity of Serum Glycan Fucosylation, β1–4 Branching, β1–6 Branching, and α2–6 Sialylation in Cancer. J. Proteome Res. 2018, 17, 543–558. [Google Scholar] [CrossRef]
- Moyano, A.L.; Li, G.; Boullerne, A.I.; Feinstein, D.L.; Hartman, E.; Skias, D.; Balavanov, R.; van Breemen, R.B.; Bongarzone, E.R.; Mansson, J.E.; et al. Sulfatides in extracellular vesicles isolated from plasma of multiple sclerosis patients. J. Neurosci. Res. 2016, 94, 1579–1587. [Google Scholar] [CrossRef] [PubMed]
- Purushothaman, A.; Bandari, S.K.; Chandrashekar, D.S.; Jones, R.J.; Lee, H.C.; Weber, D.M.; Orlowski, R.Z. Chondroitin sulfate proteoglycan serglycin influences protein cargo loading and functions of tumor-derived exosomes. Oncotarget 2017, 8, 73723–73732. [Google Scholar] [CrossRef] [PubMed] [Green Version]
- Chandran, V.I.; Welinder, C.; Mansson, A.S.; Offer, S.; Freyhult, E.; Pernemalm, M.; Lund, S.M.; Pedersen, S.; Lehtio, J.; Marko-Varga, G.; et al. Ultrasensitive Immunoprofiling of Plasma Extracellular Vesicles Identifies Syndecan-1 as a Potential Tool for Minimally Invasive Diagnosis of Glioma. Clin. Cancer Res. 2019, 25, 3115–3127. [Google Scholar] [CrossRef] [PubMed] [Green Version]
- Lv, J.; Wang, Z.; Li, F.; Zhang, Y.; Lu, H. Reverse capture for selectively and sensitively revealing the N-glycome of serum exosomes. Chem. Commun. 2019, 55, 14339–14342. [Google Scholar] [CrossRef] [PubMed]
- Borges, C.R.; Rehder, D.S.; Boffetta, P. Multiplexed surrogate analysis of glycotransferase activity in whole biospecimens. Anal. Chem. 2013, 85, 2927–2936. [Google Scholar] [CrossRef] [PubMed] [Green Version]
- Zaare, S.; Aguilar, J.S.; Hu, Y.; Ferdosi, S.; Borges, C.R. Glycan Node Analysis: A Bottom-up Approach to Glycomics. J. Vis. Exp. 2016. [Google Scholar] [CrossRef]
- Hu, Y.; Borges, C.R. A spin column-free approach to sodium hydroxide-based glycan permethylation. Analyst 2017, 142, 2748–2759. [Google Scholar] [CrossRef]
- Guo, Y.; Ji, X.; Liu, J.; Fan, D.; Zhou, Q.; Chen, C.; Wang, W.; Wang, G.; Wang, H.; Yuan, W.; et al. Effects of exosomes on pre-metastatic niche formation in tumors. Mol. Cancer 2019, 18, 39. [Google Scholar] [CrossRef] [Green Version]
- King, H.W.; Michael, M.Z.; Gleadle, J.M. Hypoxic enhancement of exosome release by breast cancer cells. BMC Cancer 2012, 12, 421. [Google Scholar] [CrossRef] [Green Version]
- Xu, R.; Rai, A.; Chen, M.; Suwakulsiri, W.; Greening, D.W.; Simpson, R.J. Extracellular vesicles in cancer—Implications for future improvements in cancer care. Nat. Rev. Clin. Oncol. 2018, 15, 617–638. [Google Scholar] [CrossRef]
- Wu, J.; Hu, S.; Zhang, L.; Xin, J.; Sun, C.; Wang, L.; Ding, K.; Wang, B. Tumor circulome in the liquid biopsies for cancer diagnosis and prognosis. Theranostics 2020, 10, 4544–4556. [Google Scholar] [CrossRef] [PubMed]
- Busatto, S.; Vilanilam, G.; Ticer, T.; Lin, W.L.; Dickson, D.W.; Shapiro, S.; Bergese, P.; Wolfram, J. Tangential Flow Filtration for Highly Efficient Concentration of Extracellular Vesicles from Large Volumes of Fluid. Cells 2018, 7, 273. [Google Scholar] [CrossRef] [PubMed] [Green Version]
- Baranyai, T.; Herczeg, K.; Onodi, Z.; Voszka, I.; Modos, K.; Marton, N.; Nagy, G.; Mager, I.; Wood, M.J.; El Andaloussi, S.; et al. Isolation of Exosomes from Blood Plasma: Qualitative and Quantitative Comparison of Ultracentrifugation and Size Exclusion Chromatography Methods. PLoS ONE 2015, 10, e0145686. [Google Scholar] [CrossRef] [Green Version]
- Boing, A.N.; van der Pol, E.; Grootemaat, A.E.; Coumans, F.A.; Sturk, A.; Nieuwland, R. Single-step isolation of extracellular vesicles by size-exclusion chromatography. J. Extracell. Vesicles 2014, 3. [Google Scholar] [CrossRef] [PubMed]
- Getz, G.S.; Reardon, C.A. Apoprotein E as a lipid transport and signaling protein in the blood, liver, and artery wall. J. Lipid Res. 2009, 50, S156–S161. [Google Scholar] [CrossRef] [Green Version]
- Tian, M.; Ticer, T.; Wang, Q.; Walker, S.; Pham, A.; Suh, A.; Busatto, S.; Davidovich, I.; Al-Kharboosh, R.; Lewis-Tuffin, L.; et al. Adipose-Derived Biogenic Nanoparticles for Suppression of Inflammation. Small 2020, 16, e1904064. [Google Scholar] [CrossRef] [Green Version]
- Stranska, R.; Gysbrechts, L.; Wouters, J.; Vermeersch, P.; Bloch, K.; Dierickx, D.; Andrei, G.; Snoeck, R. Comparison of membrane affinity-based method with size-exclusion chromatography for isolation of exosome-like vesicles from human plasma. J. Transl. Med. 2018, 16, 1. [Google Scholar] [CrossRef]
- Imes, C.C.; Austin, M.A. Low-density lipoprotein cholesterol, apolipoprotein B, and risk of coronary heart disease: From familial hyperlipidemia to genomics. Biol. Res. Nurs. 2013, 15, 292–308. [Google Scholar] [CrossRef] [Green Version]
- Lindahl, U.; Couchman, J.; Kimata, K.; Esko, J.D. Proteoglycans and Sulfated Glycosaminoglycans. In Essentials of Glycobiology, 3rd ed.; Varki, A., Cummings, R.D., Esko, J.D., Stanley, P., Hart, G.W., Aebi, M., Darvill, A.G., Kinoshita, T., Packer, N.H., Etzler, M.E., et al., Eds.; Cold Spring Harbor Laboratory Press: Cold Spring Harbor, NY, USA, 2015; pp. 207–221. [Google Scholar] [CrossRef]
- Arrighetti, N.; Corbo, C.; Evangelopoulos, M.; Pasto, A.; Zuco, V.; Tasciotti, E. Exosome-like Nanovectors for Drug Delivery in Cancer. Curr. Med. Chem. 2019, 26, 6132–6148. [Google Scholar] [CrossRef]
- Yamashita, T.; Takahashi, Y.; Takakura, Y. Possibility of Exosome-Based Therapeutics and Challenges in Production of Exosomes Eligible for Therapeutic Application. Biol. Pharm. Bull. 2018, 41, 835–842. [Google Scholar] [CrossRef] [Green Version]
- Wolfram, J.; Yang, Y.; Shen, J.; Moten, A.; Chen, C.; Shen, H.; Ferrari, M.; Zhao, Y. The nano-plasma interface: Implications of the protein corona. Colloids Surf. B Biointerfaces 2014, 124, 17–24. [Google Scholar] [CrossRef] [PubMed] [Green Version]
- Saenz-Cuesta, M.; Osorio-Querejeta, I.; Otaegui, D. Extracellular Vesicles in Multiple Sclerosis: What are They Telling Us? Front. Cell. Neurosci. 2014, 8, 100. [Google Scholar] [CrossRef] [PubMed]


© 2020 by the authors. Licensee MDPI, Basel, Switzerland. This article is an open access article distributed under the terms and conditions of the Creative Commons Attribution (CC BY) license (http://creativecommons.org/licenses/by/4.0/).
Share and Cite
Walker, S.A.; Aguilar Díaz De león, J.S.; Busatto, S.; Wurtz, G.A.; Zubair, A.C.; Borges, C.R.; Wolfram, J. Glycan Node Analysis of Plasma-Derived Extracellular Vesicles. Cells 2020, 9, 1946. https://0-doi-org.brum.beds.ac.uk/10.3390/cells9091946
Walker SA, Aguilar Díaz De león JS, Busatto S, Wurtz GA, Zubair AC, Borges CR, Wolfram J. Glycan Node Analysis of Plasma-Derived Extracellular Vesicles. Cells. 2020; 9(9):1946. https://0-doi-org.brum.beds.ac.uk/10.3390/cells9091946
Chicago/Turabian StyleWalker, Sierra A., Jesús S. Aguilar Díaz De león, Sara Busatto, Gregory A. Wurtz, Abba C. Zubair, Chad R. Borges, and Joy Wolfram. 2020. "Glycan Node Analysis of Plasma-Derived Extracellular Vesicles" Cells 9, no. 9: 1946. https://0-doi-org.brum.beds.ac.uk/10.3390/cells9091946