Image-Based Numerical Modeling of Self-Healing in a Ceramic-Matrix Minicomposite


1
Laboratoire des Composites ThermoStructuraux (LCTS), University of Bordeaux, UMR 5801: CNRS-Safran-CEA-UBx, 3, Allée de La Boétie, 33600 Pessac, France
2
CNRS, Laboratoire des Composites ThermoStructuraux (LCTS), 33600 Pessac, France
3
Team CARDAMOM, Inria Bordeaux Sud-Ouest, 200 Avenue de la Vieille Tour, 33405 Talence CEDEX, France
*
Author to whom correspondence should be addressed.
†
These authors contributed equally to this work.
Ceramics 2019, 2(2), 308-326; https://0-doi-org.brum.beds.ac.uk/10.3390/ceramics2020026
Submission received: 27 February 2019
/
Revised: 19 April 2019
/
Accepted: 29 April 2019
/
Published: 2 May 2019
(This article belongs to the Special Issue Damage and Lifetime of Ceramic Matrix Composites)
Abstract
:Self-healing, obtained by the oxidation of a glass-forming phase, is a crucial phenomenon to ensure the lifetime of new-generation refractory ceramic-matrix composites. The dynamics of oxygen diffusion, glass formation and flow are the basic ingredients of a self-healing model that has been developed here in 2D in a transverse crack of a mini-composite. The presented model can work on a realistic image of the material section and is able to simulate the healing process and to quantify the exposure of the material to oxygen: a prerequisite for its lifetime prediction. Crack reopening events are handled satisfactorily, and healing under cyclic loading can be simulated. This paper describes and discusses a typical case in order to show the model capabilities.
Highlights
- The numerical model features oxidation kinetics and liquid oxide flow
- The model works on material images or on virtual material meshes (incorporates realistic fiber arrangements and size distributions)
- It describes self-healing restart after crack reopening
1. Introduction
Self-healing Ceramic-Matrix Composites (SH-CMCs) are very promising materials for use as civil aircraft jet engine hot parts [1]. Tests in true conditions of use have been carried out, showing excellent lifetimes [2]. SH-CMCs are constituted of a 3D woven fabric of SiC fibers, infiltrated by an interphase and a multilayer matrix.The Pyrocarbon (PyC) interphase acts as a crack deviator and prevents premature fiber failure while the matrix undergoes multiple cracking [3]. In addition, SiC matrix layers bring stiffness and are chemically inert at moderate temperatures: boron-containing phases produce a liquid oxide, which fills cracks above 450 C and prevents further oxidation by a diffusion barrier effect [4]. This increases by large amounts the material lifetime under exposition to high-temperature oxidation [5]. Yet, the massive production of SH-CMC parts in engines can only be foreseen if there is a sufficient confidence in the material lifetime duration. The challenge is that the material is expected to last as long as ten years; hence, a material development cycle based only on experimental characterization is not feasible. Modeling is mandatory to incorporate as much understanding of the material physics as possible and to identify and explain the experiments that have been carried out in “accelerated degradation” conditions or on material parts. The present work has been developed in this frame.
The lifetime of SH-CMCs results from a balance between degradation and self-healing [6]. The network of matrix cracks induced by thermomechanical loadings brings the oxygen in contact with all the inner material constituents; they are transformed gradually into oxides, some of them being gaseous (e.g., carbon), liquid (e.g., boron), or solid (e.g., silica at moderate temperatures). The calculation of the chemical reaction rate everywhere in the material is a key point for lifetime prediction. Past reports have described models that give the time evolution of the oxygen concentration in, say, some key part of the composite (i.e., the weakest, most exposed fiber); they deduce from this quantity a global lifetime because the tensile strength of this fiber can be related to oxygen exposure through an oxygen-dependent slow crack growth rate law [7,8]. These models were developed in zero [9,10] or one [11] space dimension.
In reality, the materials have a complex structure, as illustrated in Figure 1. SiC filament bundles are woven in a 3D interlocking pattern. Then, the multi-layered matrix is deposited, usually by Chemical Vapor Infiltration (CVI), around the fiber, with varying thicknesses depending on the location: large close to the part boundaries and small inside the fiber bundles. Pores and cracks are distributed unevenly throughout the material. Accordingly, it appears interesting to design modeling tools that may address the material complexity and multi-scale organization.
Here, in order to bridge the descriptions of the self-healing phenomenon between fiber and tow scales (Figure 1c,d), we propose an image-based approach, in which the resolution domain is a 2D Finite Element (FE) mesh directly obtained from home-made mesh generation software.
The paper is organized as follows. First, the model is set up and translated into equations. Then, the employed numerical schemes are described, and their validation is discussed. Finally, an application example is presented in detail, to illustrate the capabilities of the modeling toolbox.
2. Model Setup
Though the material has a multi-scale character, we will focus here only on minicomposites, that is straight bundles of filaments with multilayer coatings. The concept of minicomposite has been thoroughly used to build up a comprehension of how a full composite works [12], but with a simplified mechanical stress state. Models addressing minicomposites usually take advantage of the separation of the space coordinates into longitudinal (z) and transverse (), allowing for 1D models after homogenizing on a transverse section.
As far as CMCs are concerned, one of the most important mechanical test configurations is tensile stress along the fibers, since it leads to matrix crack opening and eventually to material failure. This will be the situation considered here.
2.1. Material Description
The transverse section of a typical SH-CMC minicomposite model is depicted in Figure 1d. Several domains are easily recognized:
- The SiC fibers, which are sensitive to oxidation through a subcritical crack growth behavior. Their diameter is in the range of 8–15 m.
- A number of cusp-shaped pores left by the production process. In particular, the PyC, SiC, and boron carbide layers are deposited by Chemical Vapor Infiltration (CVI) [15,16]. This process gives characteristic continuous layers growing in conformal shape with respect to the initial substrate (i.e., the fibers). The layer thicknesses are larger in the outer parts of the fiber bundles, because of the competition between chemical deposition reactions and gas diffusion [17]. As a result, some pores remain between the fibers after infiltration. These imperfections may be connected or not to the ambient atmosphere, depending on whether the crack network intercepts them.
2.2. Phenomena and Scales
Under tensile stress, the minicomposite will undergo matrix transverse multi-cracking [18,19]. In this case, cracks are mostly perpendicular to the fiber direction [20]. Some may exhibit a helicoidal structure [21], but the helix vertical spacing is much larger than the crack thickness. We can thus safely focus on transversal cracks and adjust any micro-mechanical model to the measured behavior through the value of the average spacing between two successive cracks. The thickness of the cracks is of the order of less than 1 m, i.e., 10–10 times the typical diameter of the minicomposite [20]. Even in the presence of these cracks, fibers continue to provide the material with mechanical continuity and tensile resistance [18]. Nevertheless, the cracks provide a path to oxidizing species toward the fibers [22,23]. This constitutes the root of the weakening of the fibers themselves, and thus of the failure of the material [24,25].
The key phenomenon controlling the material lifetime is oxidation [26]. The most sensitive component is the pyrocarbon coating, which undergoes active oxidation above 500 C [27]. At temperatures between 450 C and about 700 C, typical of civil craft engine operating conditions, the oxidation of the boron carbide matrix component is efficient enough to fill active cracks with a liquid boron oxide [28,29]. This is caused by the higher molar volume of the oxide compared to the carbide. At low enough temperatures, the flow of this liquid is dominated by viscous effects, with respect to which both inertial and capillary effects are negligible [26]. The oxide is thus pushed through the crack by its own growth. Oxygen diffusion through the oxide is considerably slower than in the gas phase. Typically, the time scale of the diffusion through the liquid is 10-times larger than that into the gas [30]. Silicon carbide may also produce a solid silica layer upon oxidation [31]; however, the temperatures considered here (<650 C) are not high enough to allow the development of a significant silica thickness [32].
2.3. Problem Equations
The natural ingredients of the model are the concentration balance for gaseous oxygen and for all oxidized materials, namely, pyrocarbon, undergoing active oxidation and giving gaseous CO:
and boron carbide, yielding a liquid BO oxide together with dissolved, then gaseous CO [33]:
Note the stoichiometry of boron carbide, experimentally determined as in excess carbon with respect to the known BC or BC formulae. Transport equations for oxygen mass and for the liquid oxide mass were established by resorting to an asymptotic, crack-averaged, two-dimensional description. We exploited the fact that the ratio of the crack half-thickness e over the minicomposite diameter d was small. As recalled in Section 2.2, this ratio assumes in practice values . In our approach, the three-dimensional governing equations, e.g., Fick’s law for oxygen concentration, were integrated over the crack thickness, and higher order variations (in ) were neglected. This procedure has two effects:
- (i)
- the model provides only an averaged two-dimensional description of the transport processes within the crack. The main unknowns are the local crack averaged values of the O concentration and of the oxide flow velocity and the local height of liquid oxide within the crack;
- (ii)
- mass fluxes associated with chemical reactions, normally appearing in three dimensions as boundary conditions on the upper/lower crack boundaries, are embedded in the equations as source terms, which arise naturally from the integration procedure.
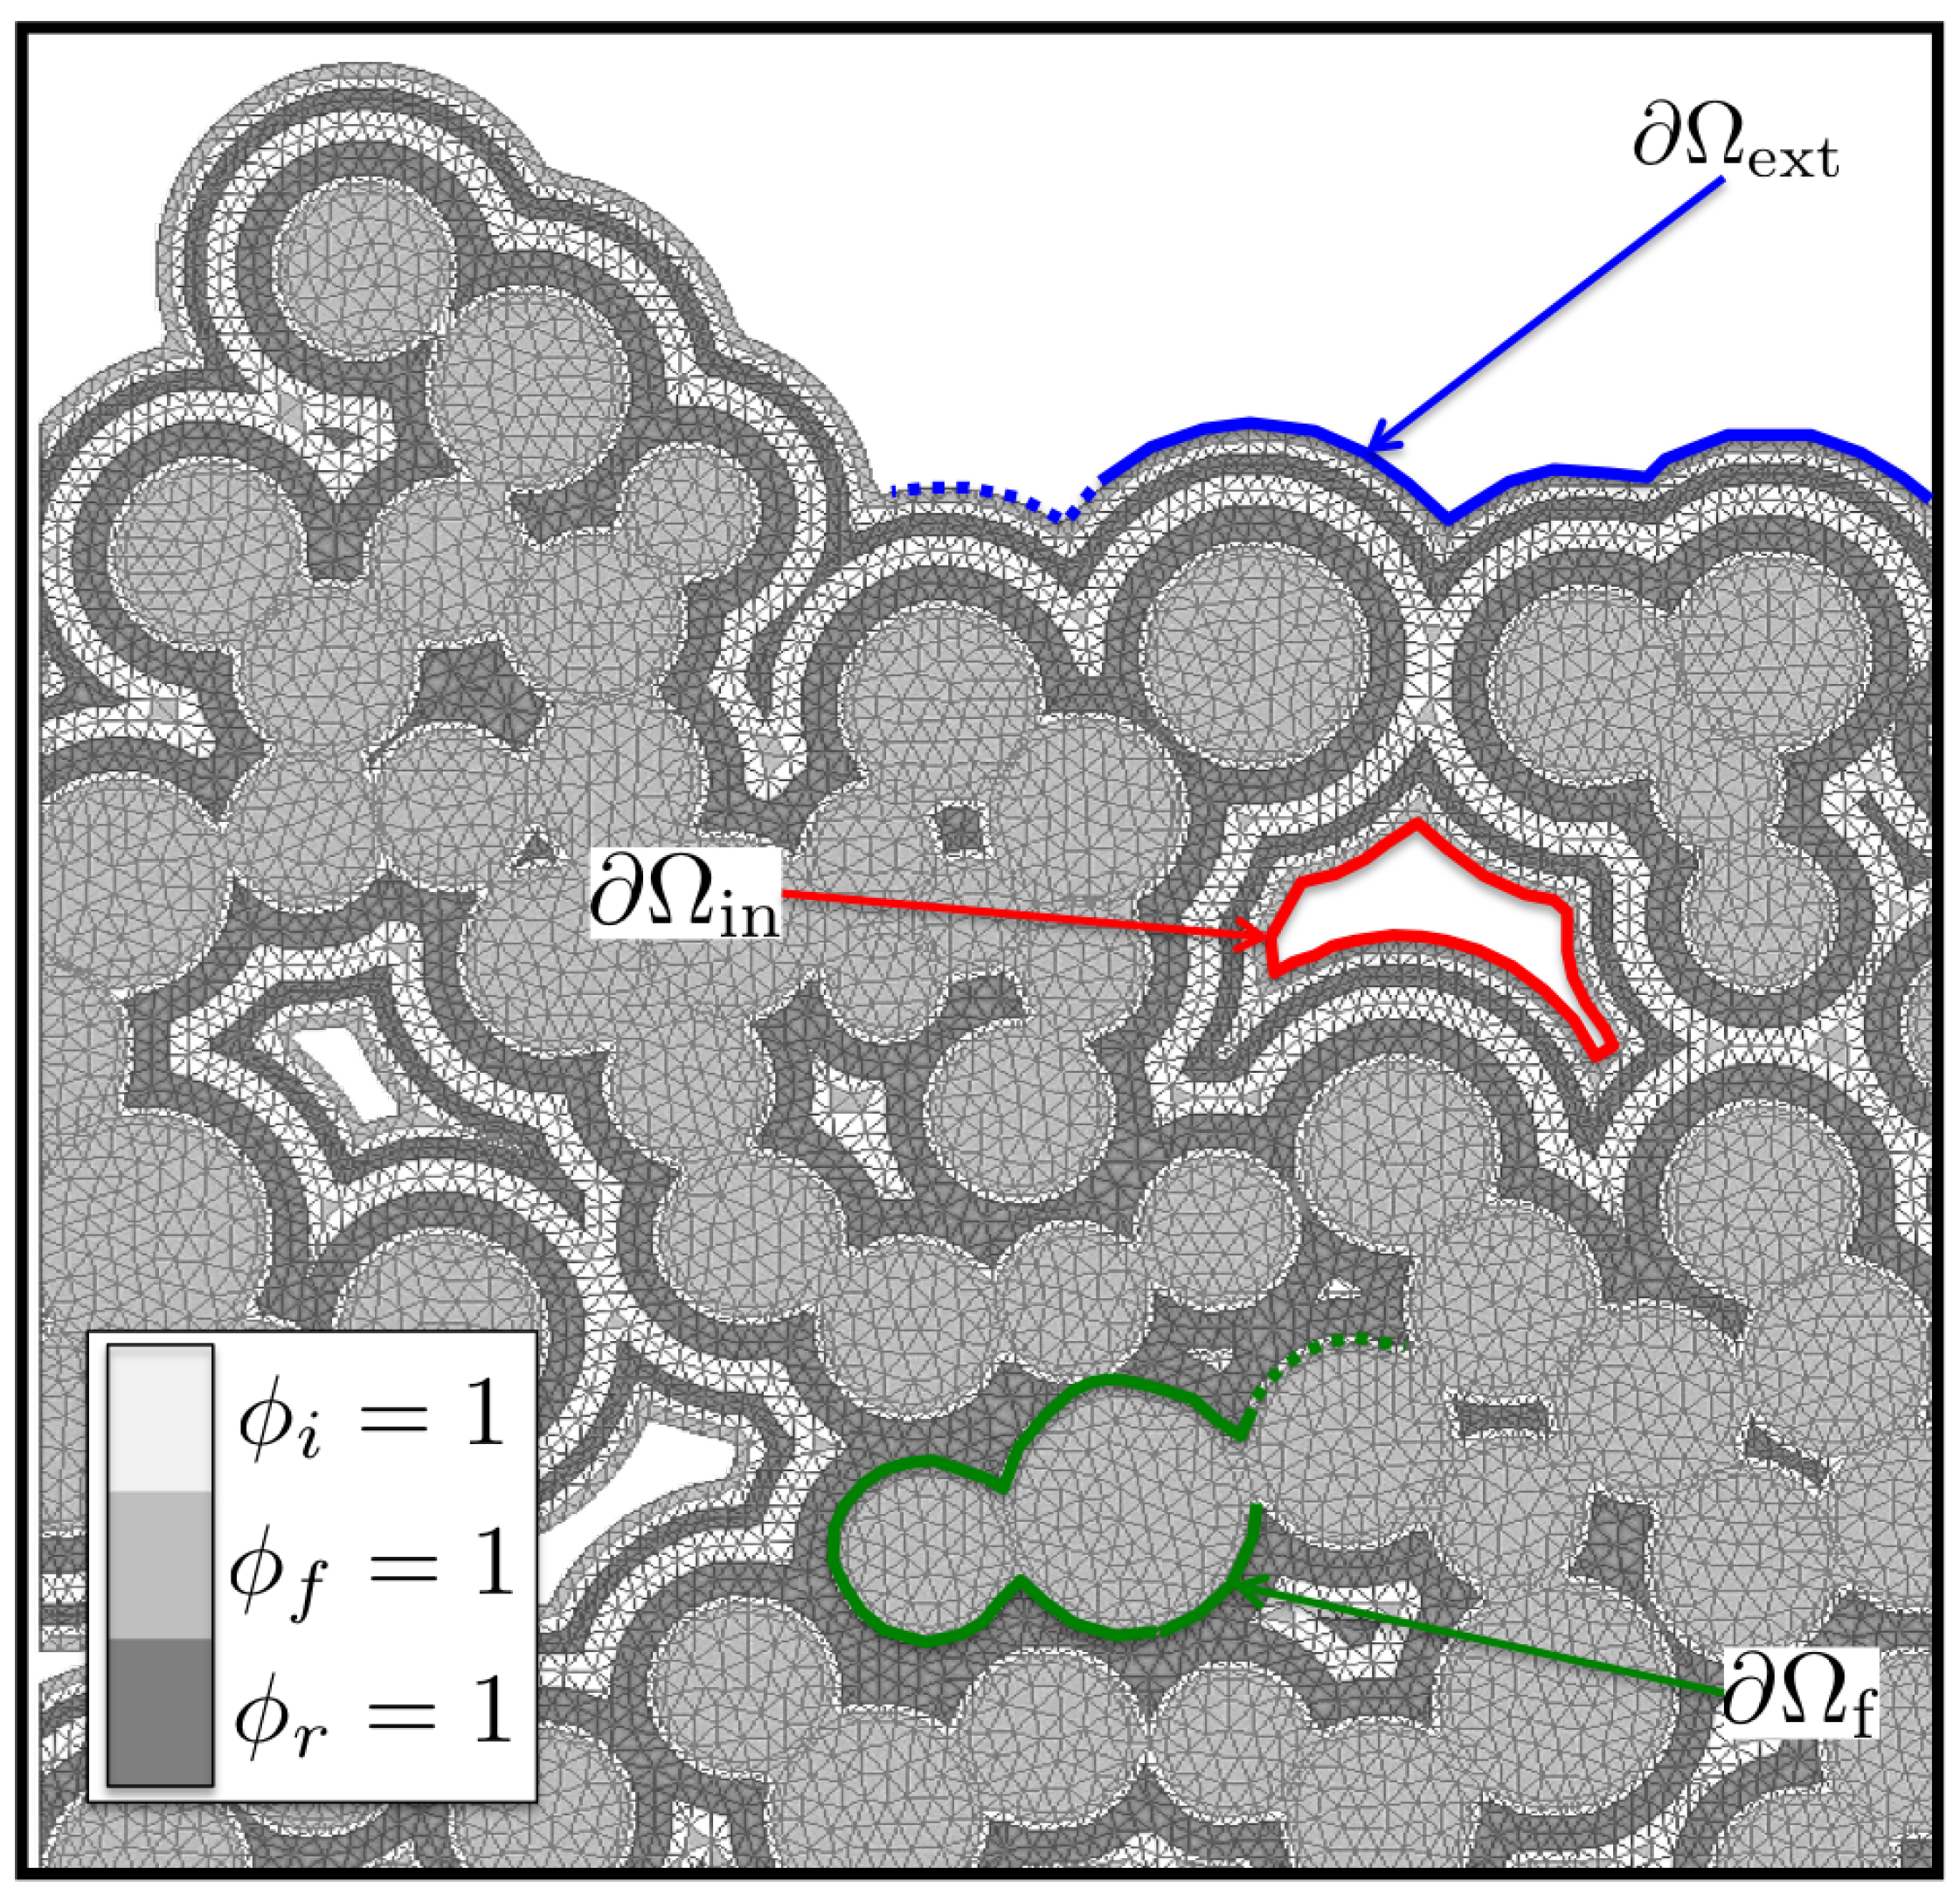
The obtained model is defined on a domain decomposed into several sub-domains and boundaries, as illustrated in Figure 2:
- : reactive regions of the matrix (indicated by if , 0 elsewhere),
- : inert regions (indicated similarly by ),
- : fibers (indicated similarly by ),
- : the external boundary,
- : the internal boundaries delimiting macro-pores, and
- : the fibers’ boundaries.
The balance equation for the oxygen evolution, defined on the reactive and inert domains, reads as follows:
where the effective height h available to oxygen transfer is computed as:
where the phase indicators and take the values 1 or 0 depending on whether the considered point is in a region occupied by the liquid plug () or not. The quantity denotes the local thickness of the crack, and the values of and are determined by both chemical reactions and oxide flow, as we will shortly see. The crack height-averaged oxygen flux is given by:
with and the oxygen diffusion coefficients in the liquid and gas phases, respectively, and with oxygen consumption driven by the (algebraic) source term:
with an effective reaction rate defined using the Deal–Grove model [34] as:
Here, the liquid-phase diffusion coefficient is related to the parabolic kinetic constant of oxidation. The evolution equation for the liquid height , without flow, is an ordinary differential equation:
Simultaneously, the height of available boron carbide decreases according to the following equation:
As a result, the available height for gas circulation above the liquid in the reactive zone obeys:
The pyrocarbon consumed height obeys the following equation:
with an effective reaction rate defined as for the liquid:
In order to close the model, we must specify:
- an initial condition, here uniform in space:
- a boundary condition at , translating exchange with the outer atmosphere through a boundary layer with thickness :
- a boundary condition on , here chosen equal to Equation (14), i.e., assuming that the outer atmosphere also enters the intra-bundle pores,
- and a boundary condition on , representing the oxygen consumption by pyrocarbon oxidation:
When flow occurs, the spreading of the oxide is accounted for by the following propagation equation:
in which the fluid velocity appears. To be able to solve this equation, one needs to define or compute somehow the liquid velocity . In our modeling approach, we have considered a potential approximation for the flow, i.e., that there exists a function such that . Indeed, the flow is very slow and fully laminar, so we can safely assume that it is irrotational. Starting from a classical 3D potential formulation in the (moving boundary) liquid domain, with mass fluxes given on the reactive boundaries, we arrive at a 2D asymptotic crack-averaged potential equation reading:
where all the mass fluxes on the 3D boundaries lead to the appearance of the source term Q condensing reading:
Note that the main unknowns of the model now represent average values across the crack opening of the material concentrations (in particular oxygen) and of the flow speed computed as the gradient of the potential obtained by solving (18).
3. Numerical Solution of the Coupled System
3.1. Overall Coupled Strategy
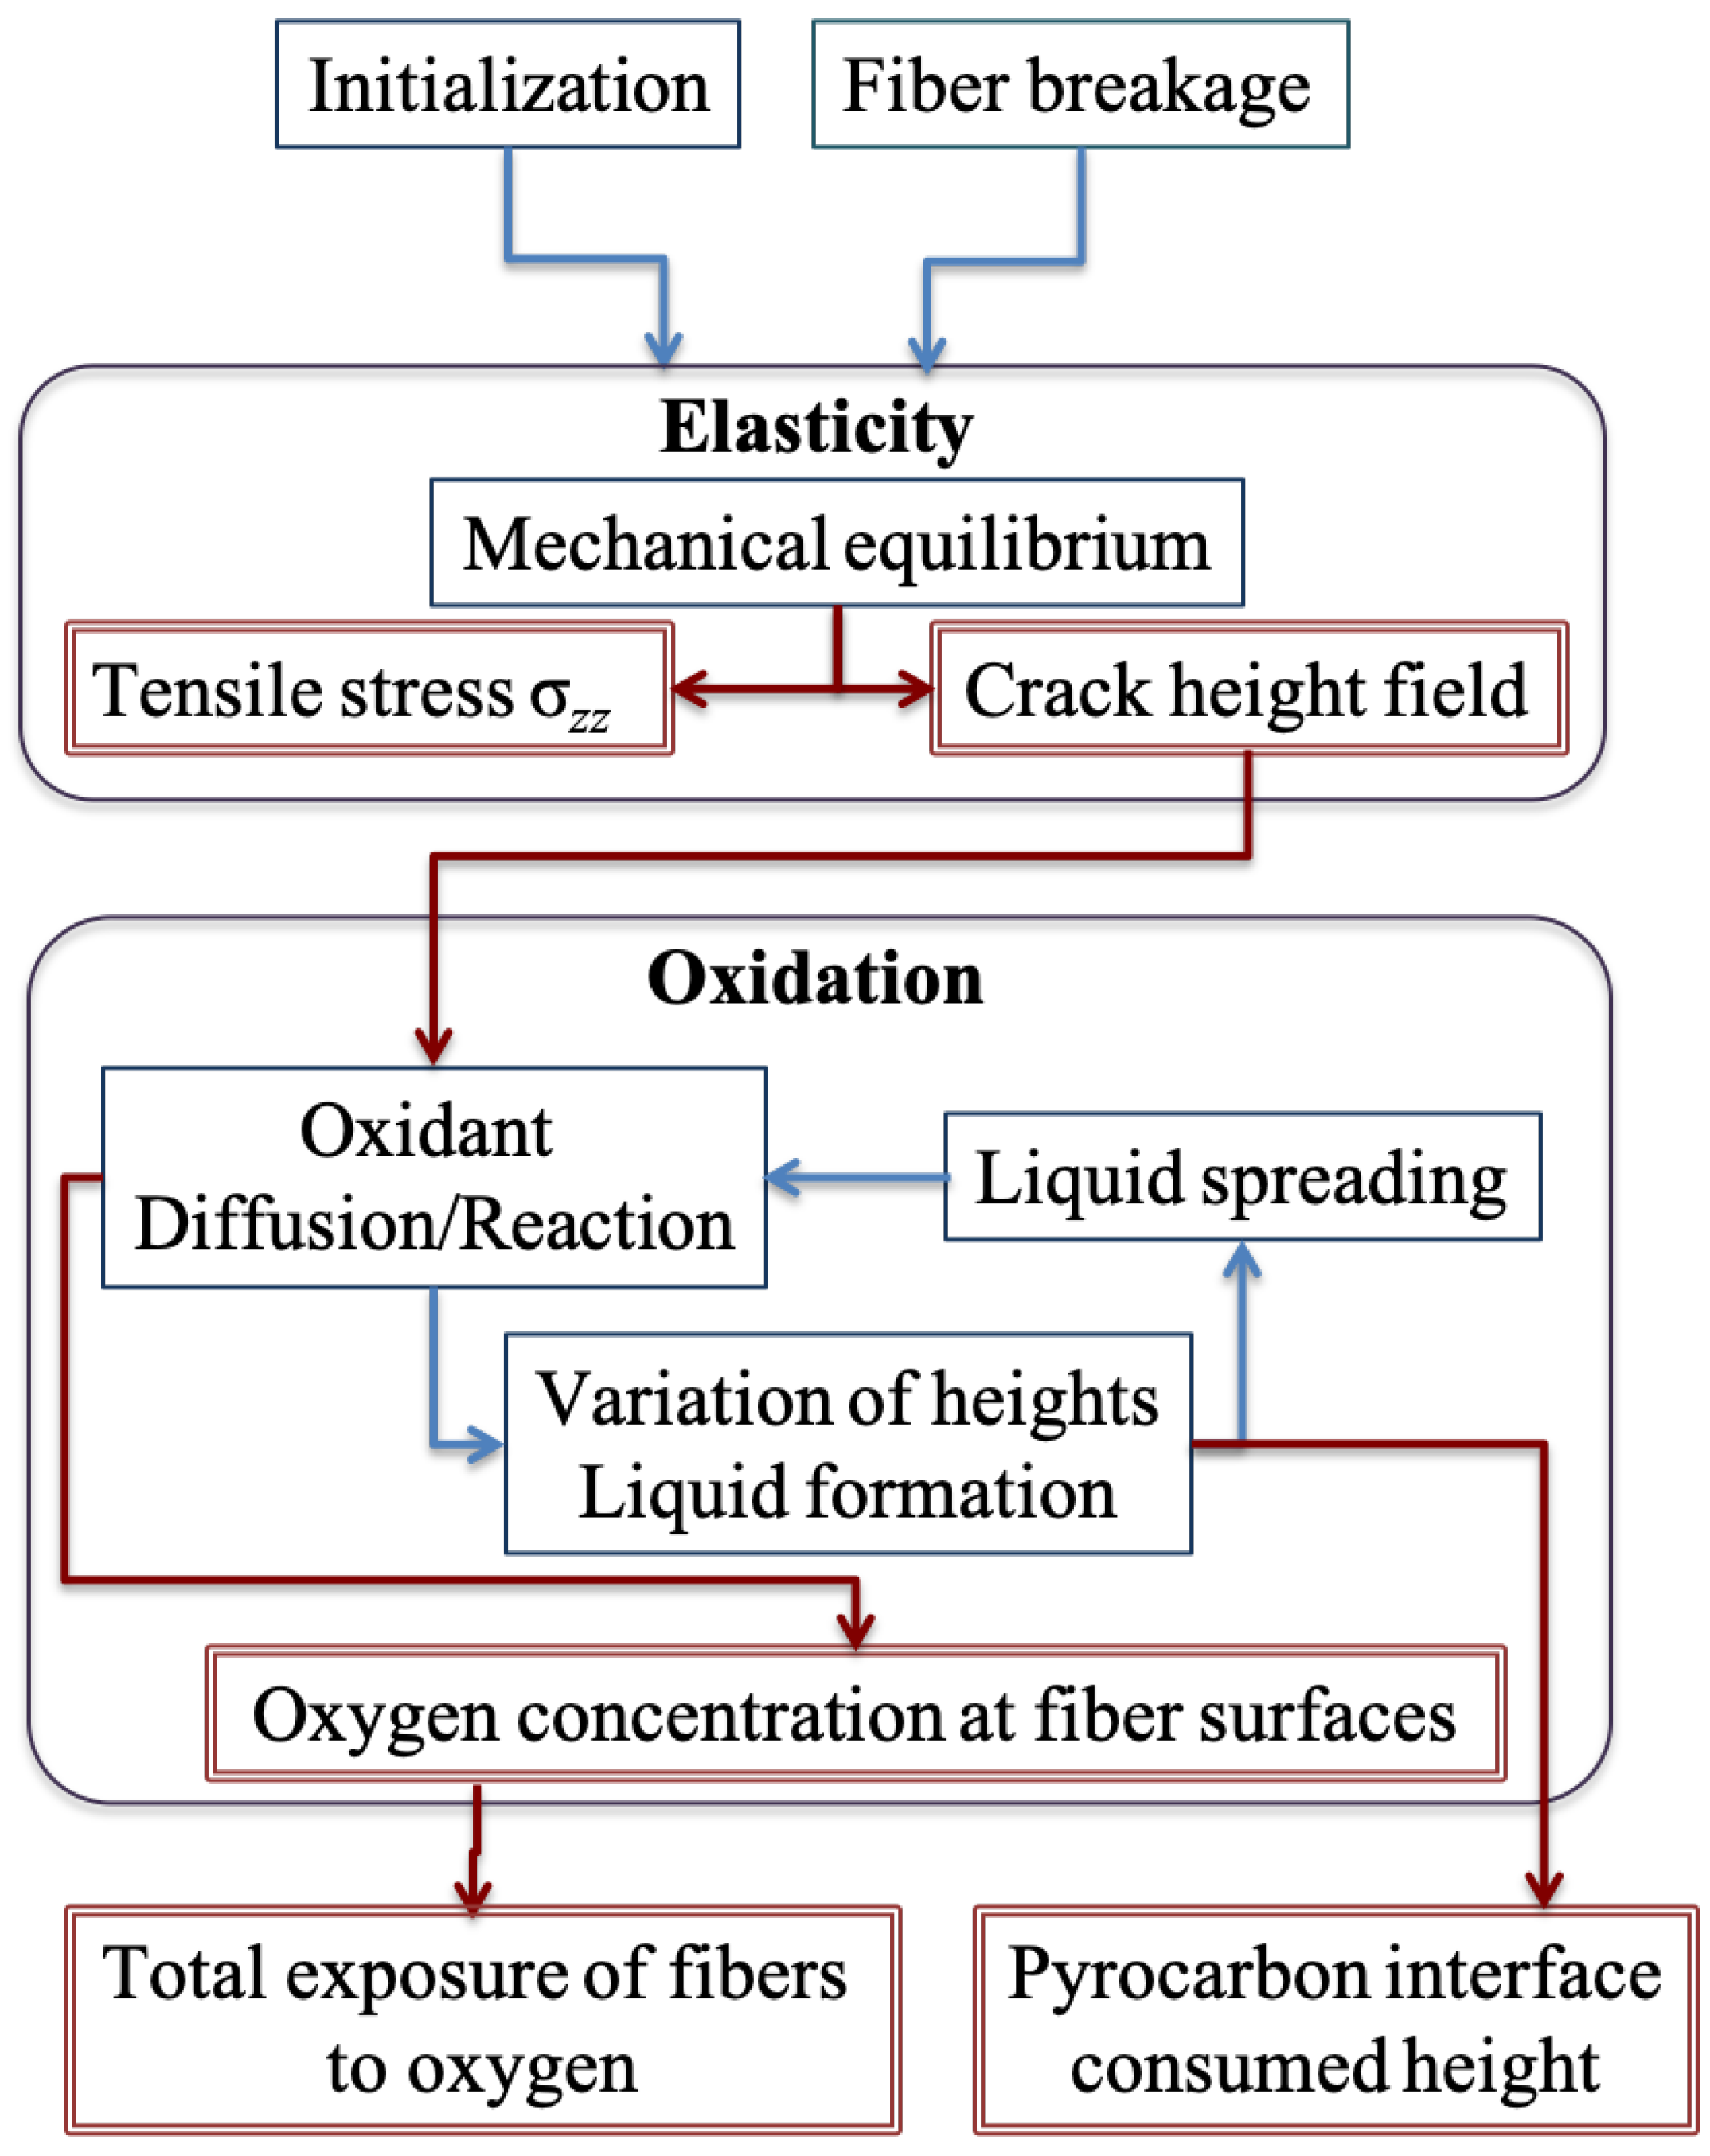
The global algorithm is schematized in Figure 3. The resolution involves three blocks, one for initialisation and two solvers for elasticity and oxidation, respectively.
The initialization block generates two Finite Element (FE) meshes from the initial data containing the position and diameter of all fibers, plus the different matrix (inert and reactive) layers.
The first FE solution block addresses only mechanical equilibrium by solving the elasticity equations on a 3D mesh describing the fibers, the crack in the matrix, and introducing decohesion between fibers and matrix. The crack width at every point of the matrix domain () is utilized in the next block.
The second block addresses oxidation and contains three subsets devoted respectively to the oxygen mass balance (diffusion and reaction, Equations (3)–(7), solid and liquid mass balances (8)–(12)), and liquid flow (Equations (16)–(18). The solution was obtained by chaining to each other the three subsets sequentially. The same 2D mesh was used for the solution of the three subsets. The crack width field was necessary for this block and was recovered from the first block. The output of the second block contained, among others, the total exposure of the fibers to oxygen, which was given as a criterion for life duration of the material.
Additionally, it is possible to restart the computation of the second block after a fiber breakage event. In this case, the mechanical equilibrium was updated and a new crack height field obtained, which may lead to a partial or complete opening of the crack. Then, the oxygen diffusion and oxide production resumed. The area corresponding to the broken fiber was integrated in the domain (inert), but the former fiber boundary had still a reactive character, so that there was an “internal boundary” condition there:
where the brackets denote the flux discontinuity between exterior and interior sides of the boundary.
3.2. Mesh Generation
The starting point for the problem resolution was a 2D image, containing the fibers described by discs; their size distribution and space correlation function were retrieved from the analysis of transverse optical micrographs of a minicomposite or of a bundle inside a composite. Once the fibers were located, the multi-layer matrix was generated by geometric dilation, either homogeneous or biased with a lesser dilation factor in the bundle center. The output of matrix image analysis or of CVI modeling is also a possible alternative as a starting point.
Two meshes were generated: the first was a fine 2D mesh for the oxidation and liquid spreading part; the second one was a coarser 2D mesh of the same image, but extruded in the third direction, in order to perform elasticity computations. An initial fiber/matrix decohesion can be introduced over a given length .
3.3. Space and Time Discretization
The species mass balances were discretized following a classical finite element scheme: Equations (3) and (7) were written in weak (integral) formulation, then the Green–Ostrogradsky formula was applied and the boundary conditions (14)–(15) inserted; the result was discretized over a basis function set and transformed into a linear algebraic system, the unknowns of which were the basis function parameters, chosen for convenience as the variable values at the integration points of the elements. Triangular P1 elements were chosen in this study.
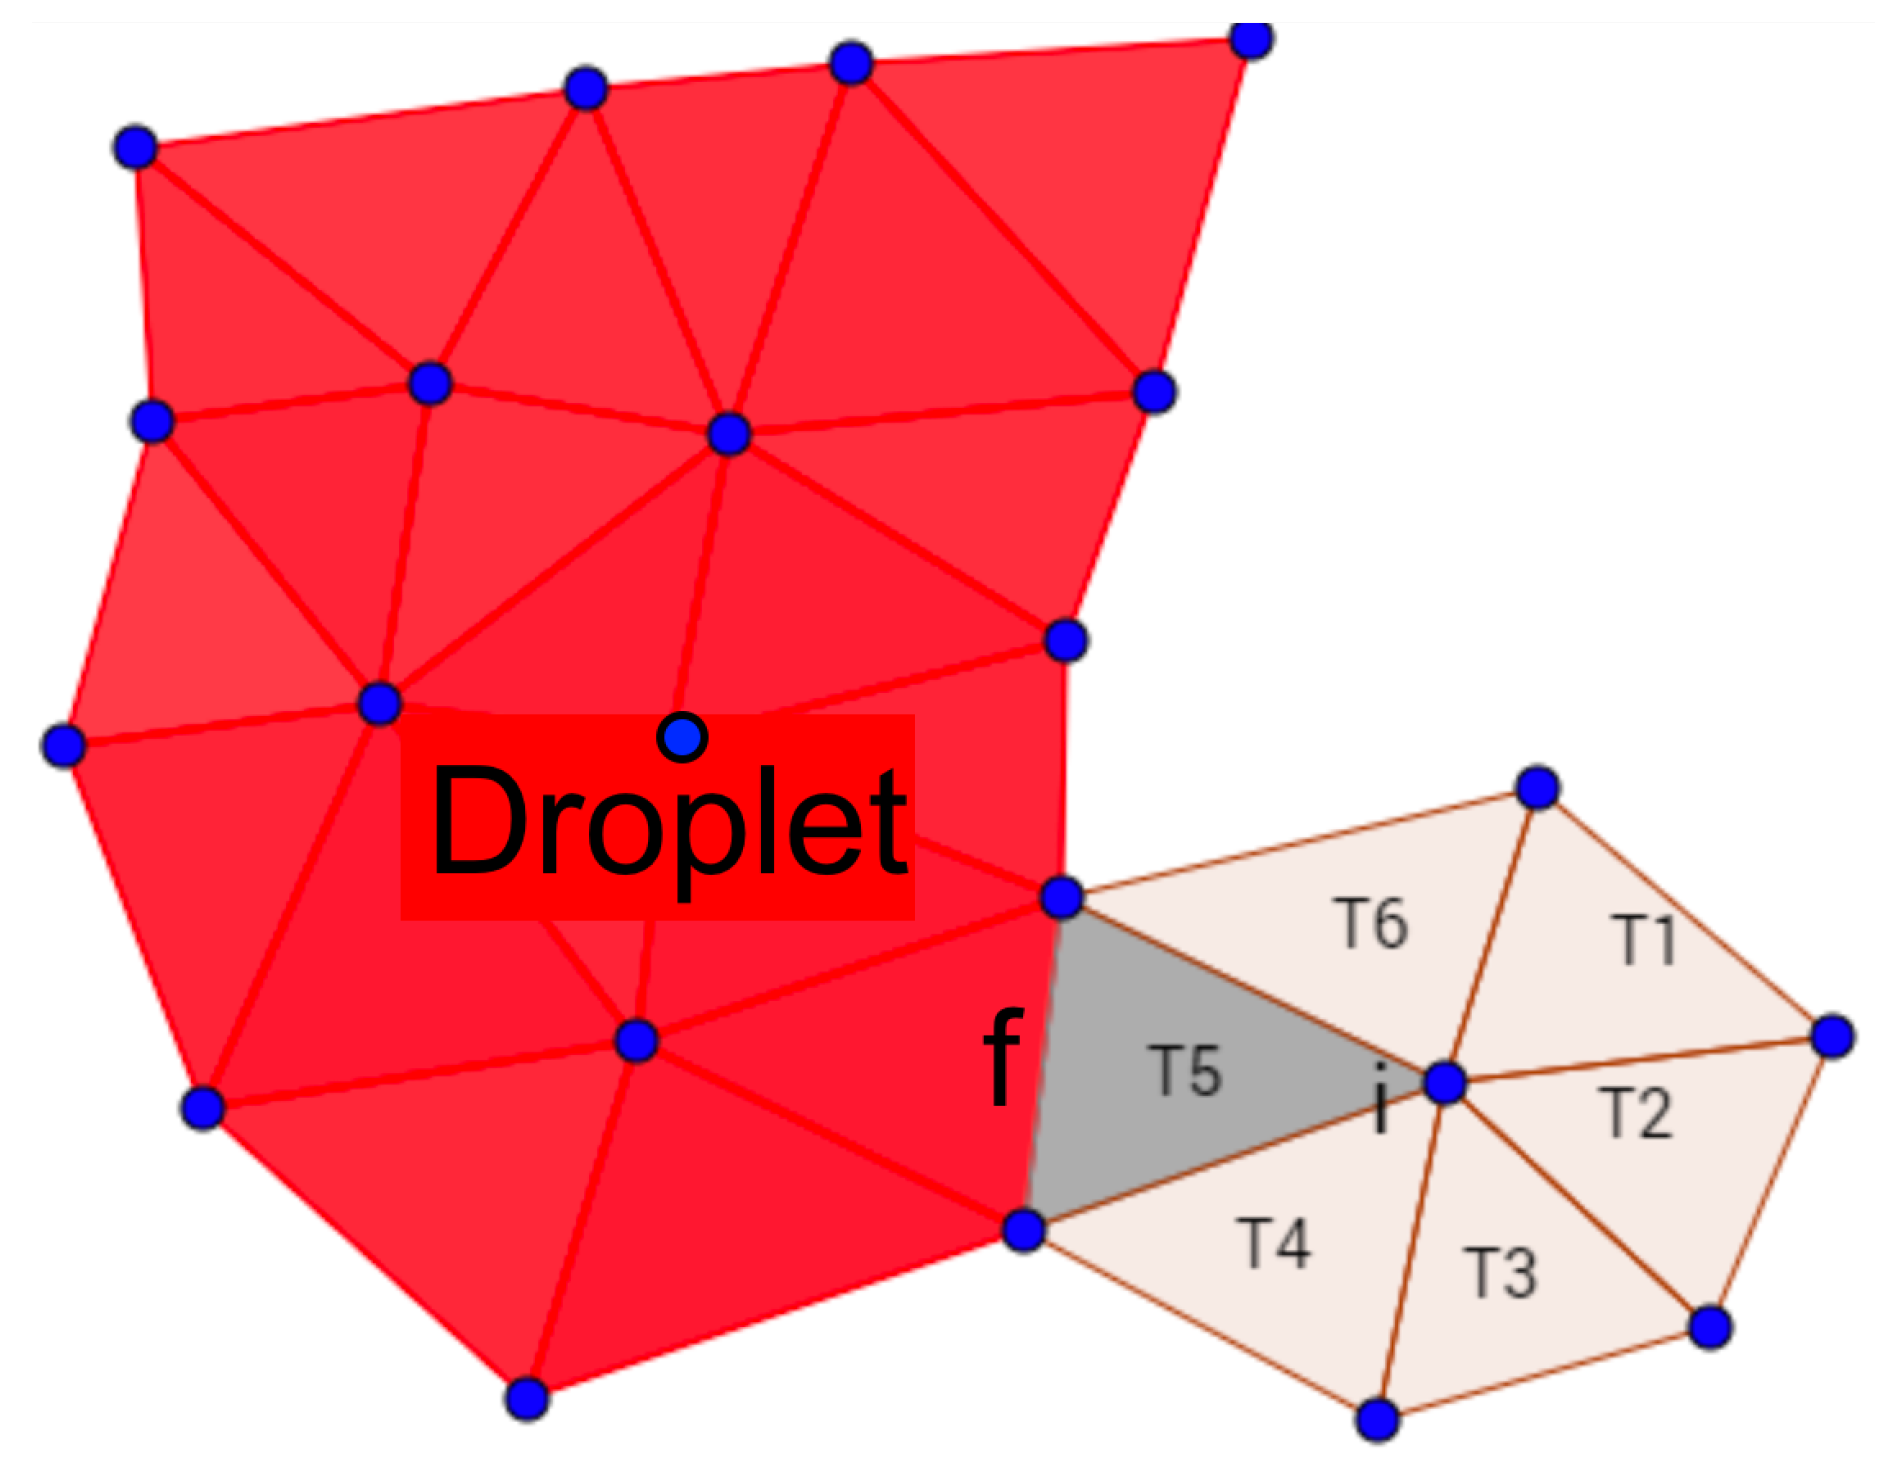
The solution of the fluid spreading equations (Equations (16) and (17) or (17)) was achieved with an inexpensive approximate numerical scheme, consisting of distributing uniformly the amount of fluid created in any connected component of the liquid phase (a “droplet”) during a time increment on all neighboring nodes surrounding the existing droplet. The continuity Equation (17) in its integral form can be written as a mass balance over :
The droplet was discretized over triangles T with faces f. Accordingly, Equation (20) can be rewritten as:
where and are the measures of the face f (length) and triangle T (area).
By analogy with this last equation, one can write:
where designs the set of nodes i lying outside the droplet, but forming a triangle with a face f of the droplet boundary (see Figure 4).
The height increase on the mesh node neighboring the face f and lying outside of the droplet will be:
where is the number of triangles having node i as one summit, as illustrated in Figure 4.
The time discretization of Equation (3) followed a first-order implicit Euler scheme, which is simple but robust. The time integration of the ODEs (9)–(12) describing the evolution of the height variables has been achieved with a Newton–Raphson scheme. For the sake of convenience, the inverses of the heights has been chosen as the variables; an arbitrarily large value was chosen for the initialization.
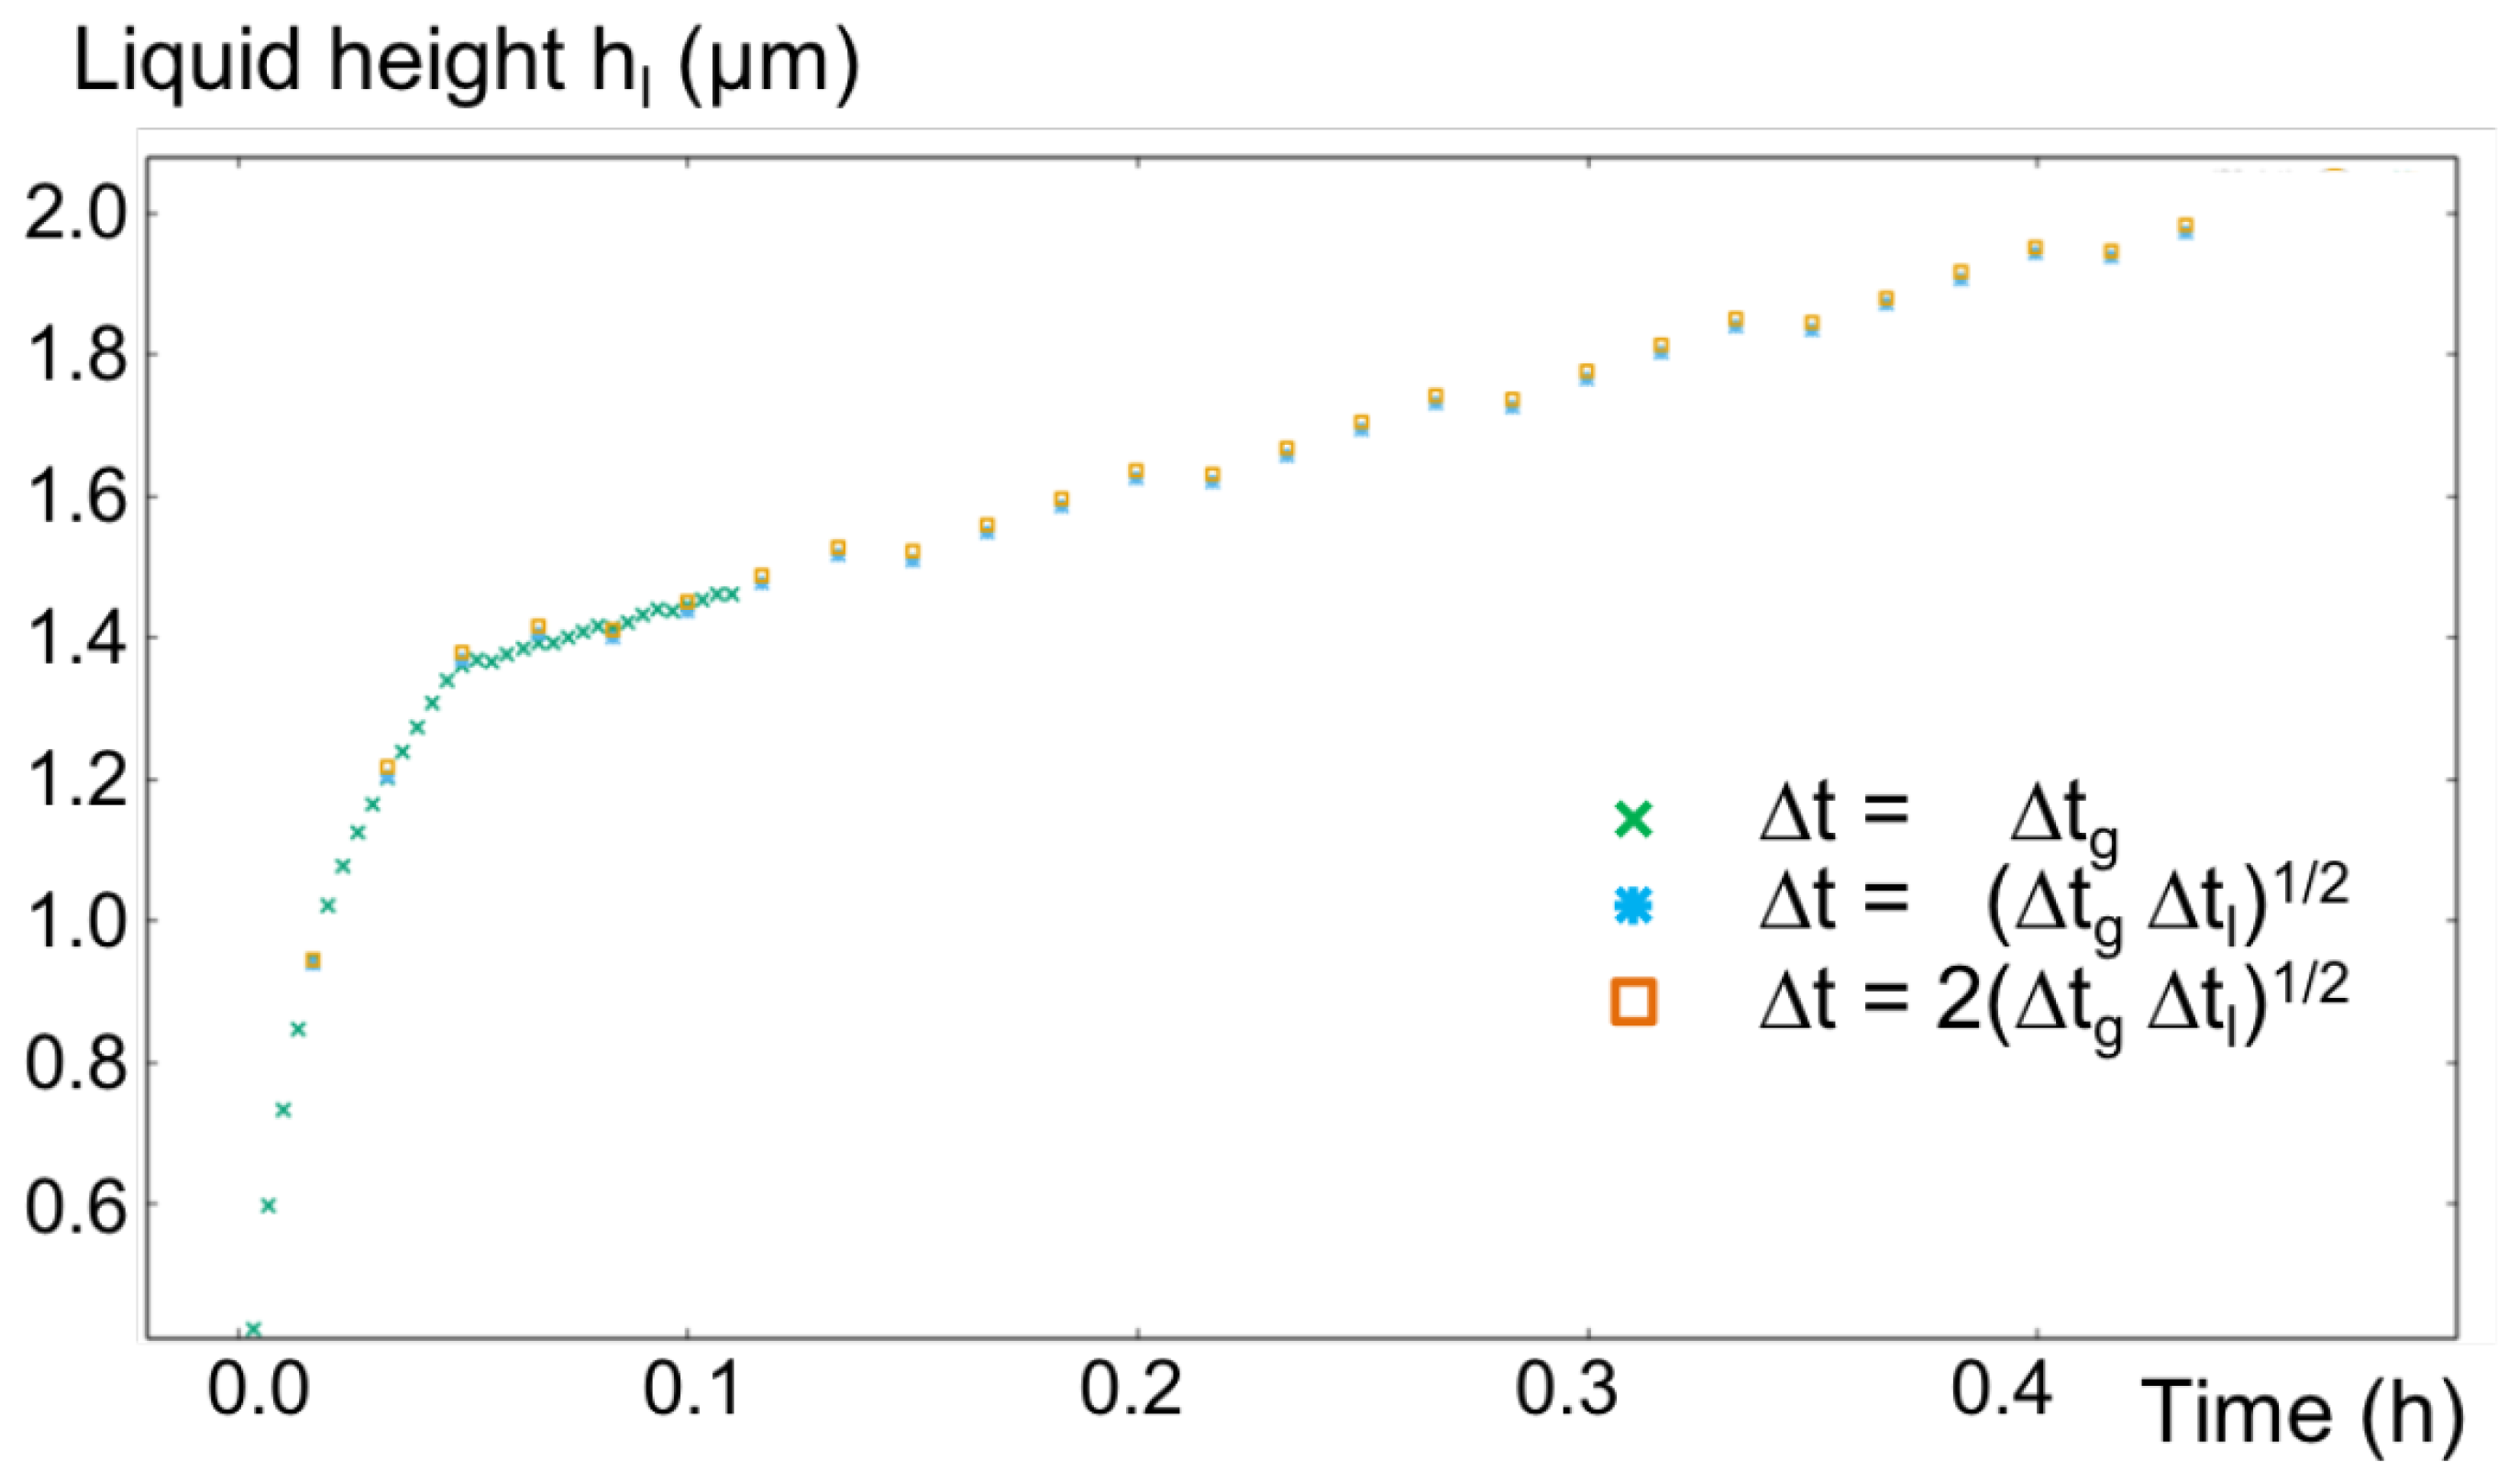
The choice of the time step was rather difficult to address because of the existence of two largely different time scales in the liquid and the gas phases ( and , respectively, where L is the characteristic width of the crack) arising from the ratio between the diffusion coefficients in both phases. Choosing a time step linked to gas diffusion would lead to extremely slow computations. In a first attempt, it had been chosen to consider the diffusion Equation (3) as steady, while the time integration would only rely on Equations (9)–(12) [33], but after the creation of a liquid domain (), this was no longer possible. Therefore, here, the initial time step was set to the geometrical average of both time scales:
and then, after the healing event occurred, the time step was set to . Figure 5 shows that the choice of time step (Equation (24) allows having a solution within 5% accuracy with respect to the finest time step, with a solution time acceleration; doubling this time step still preserved a good quality of the results, even though the precision of the implicit Newton scheme did not guarantee it in principle.
The mechanical equilibrium equations were solved by a classical elastic finite element scheme over P1 tetrahedral elements; the matrix solution made use of the MUMPS (MUltifrontal Massively Parallel Sparse direct solver) linear algebra library [35].
4. Numerical Example
We will now present and discuss in detail an example, in order to illustrate the capabilities of the developed modeling framework. First, the construction of the resolution domain is addressed; then, all physico-chemical parameters will be given. Finally, the results will be displayed and discussed.
4.1. Problem Statement
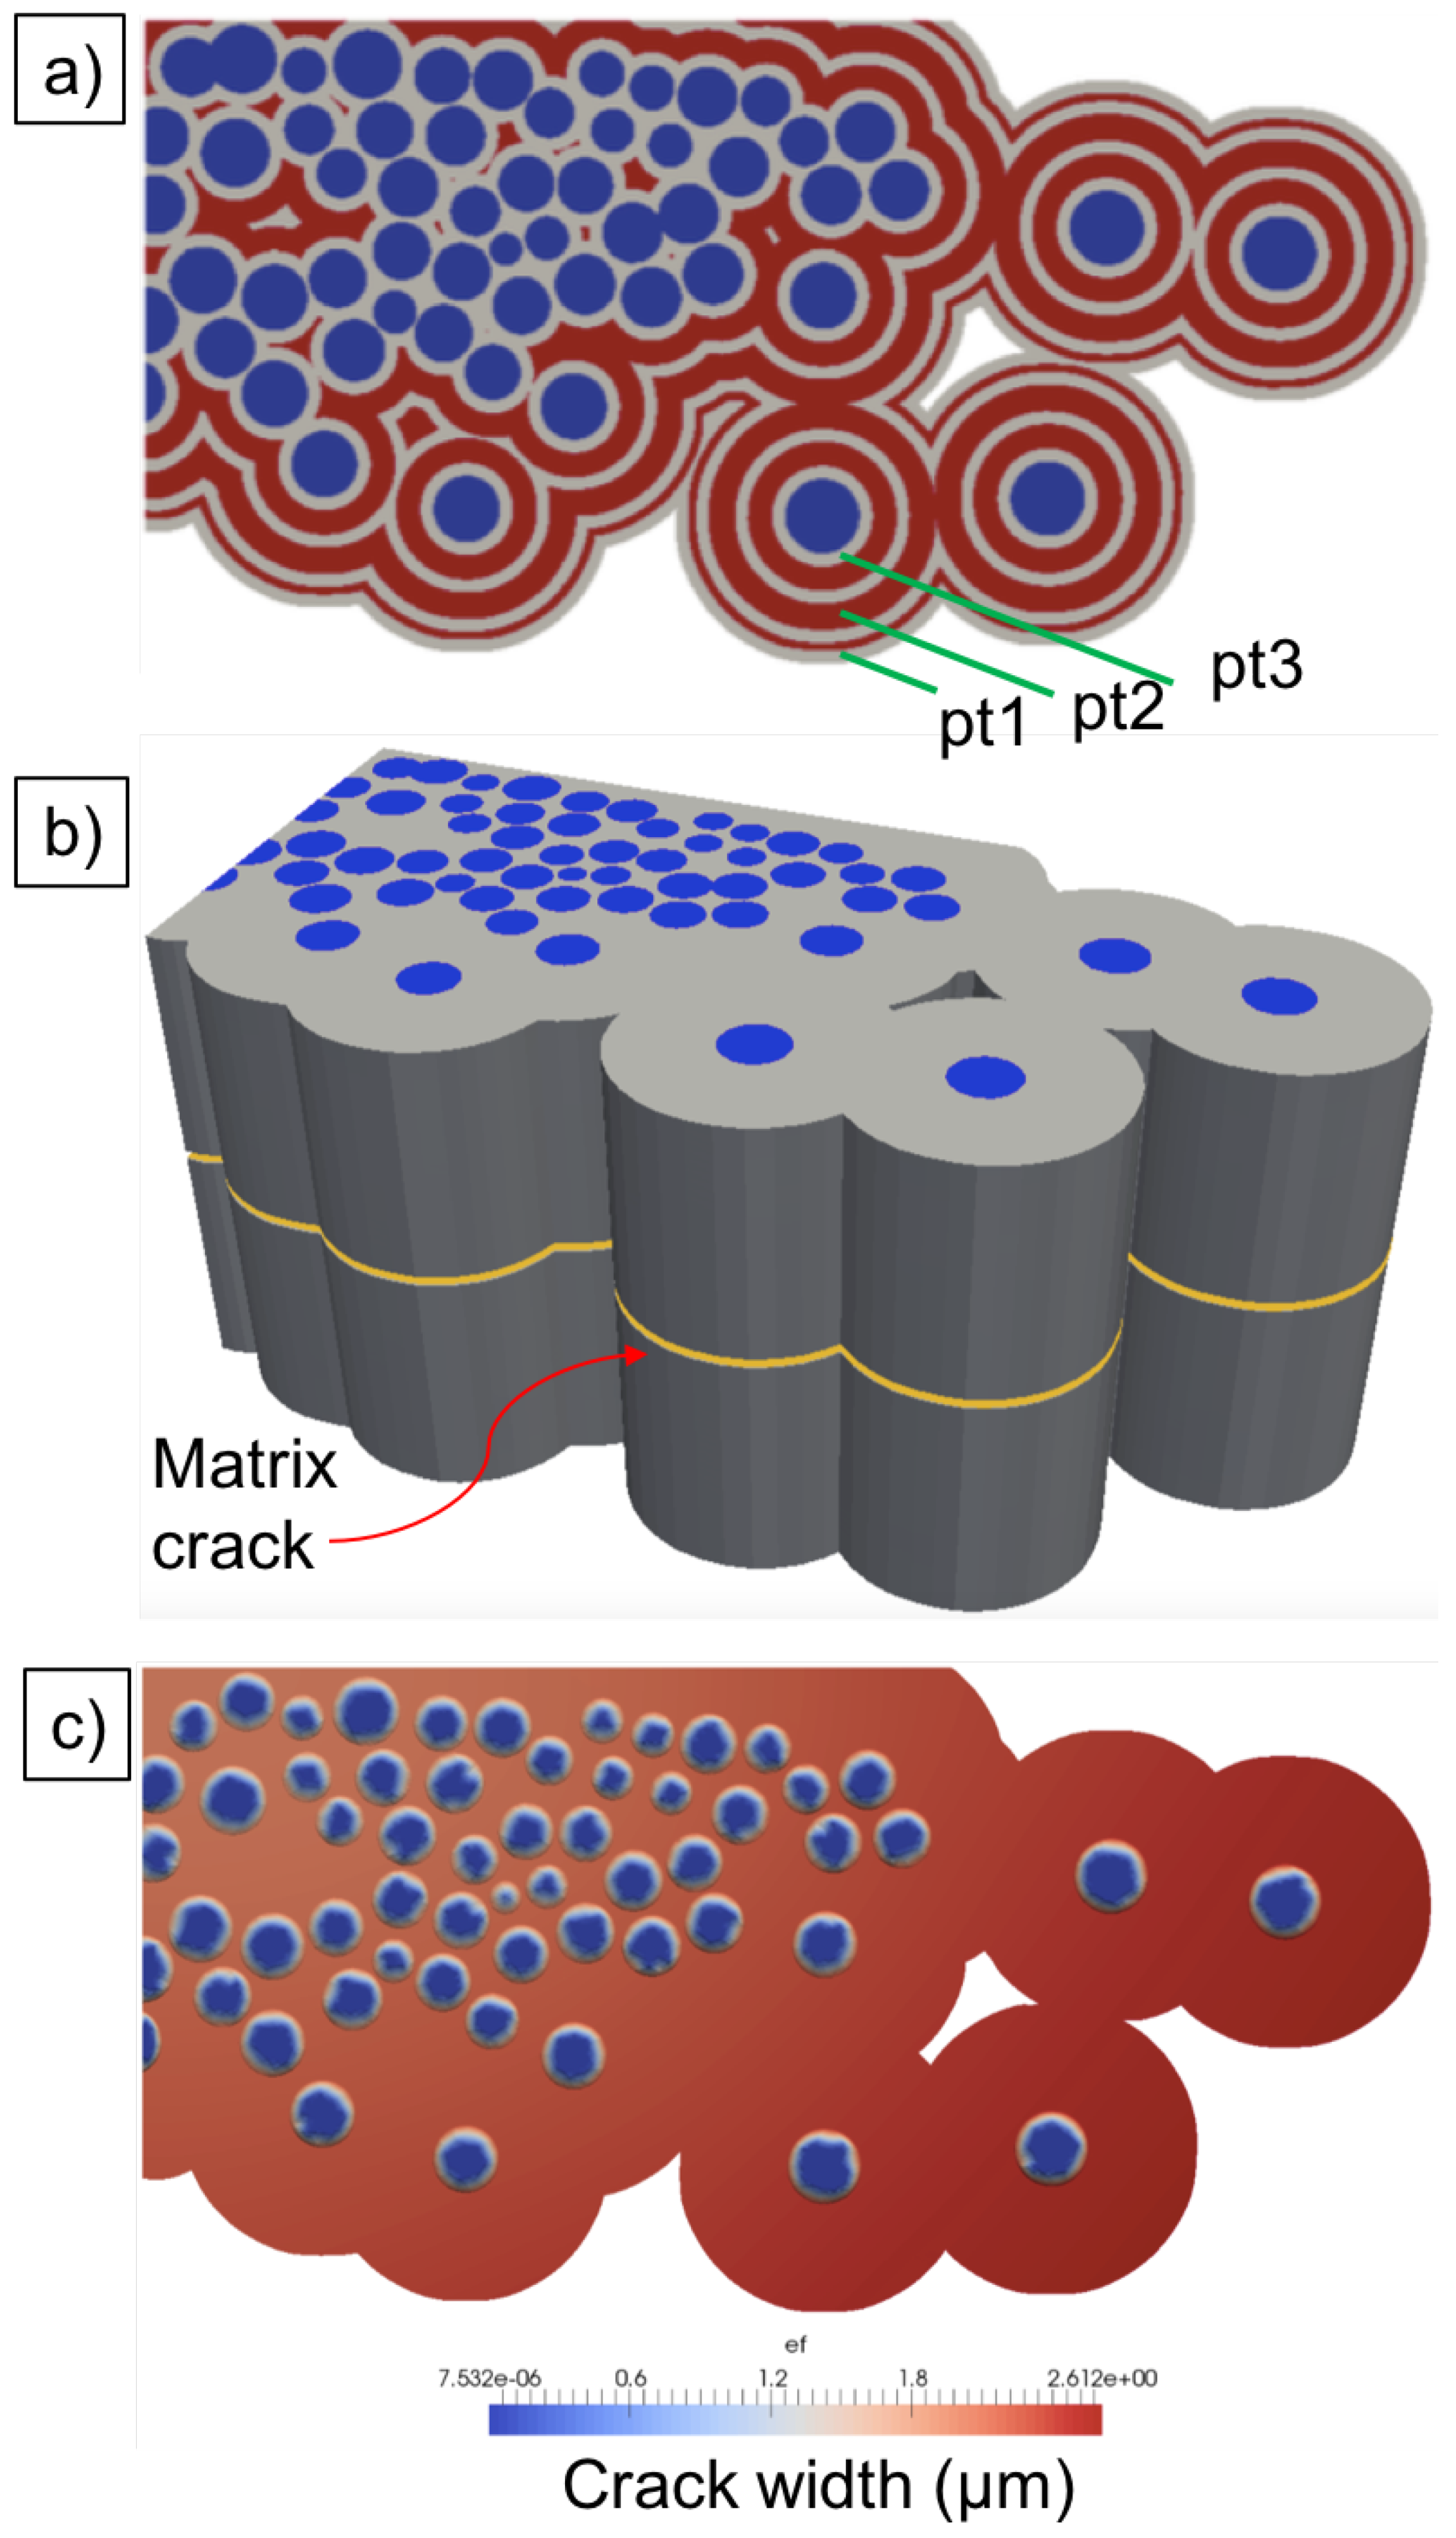
The 2D resolution domain, illustrated in Figure 6a, is representative of a small minicomposite, with 60 fibers, the sizes and positions of which have been extracted from a transverse micrograph of an actual composite. The multilayer matrix was modeled as concentric layers around each fiber; the thicknesses of each layer is reported in Table 1. As previously mentioned, this 2D image has been converted to an FE mesh using a dedicated Python script and the Triangle software [36]. This mesh will serve as a numerical support for the physico-chemistry part of the simulation.
Then, by a simple mesh extrusion technique, a 3D mesh was produced to fully represent a segment of the minicomposite, and a matrix crack was introduced in the middle of the segment, as illustrated in Figure 6b). Note that, for the elastic computations, the matrix layers were not meshed individually, We rather considered a homogenized matrix with averaged properties (rendered as the gray domain in Figure 6b)). This allowed reducing the size of the computational mesh, without any significant influence on the results.
4.2. Geometrical and Physico-Chemical Parameters
All the parameters of the virtual material have been chosen as representative of a realistic situation, such as the ones analyzed in previous reports [26].
4.3. Results and Discussion
4.3.1. Oxygen Diffusion and Plug Formation
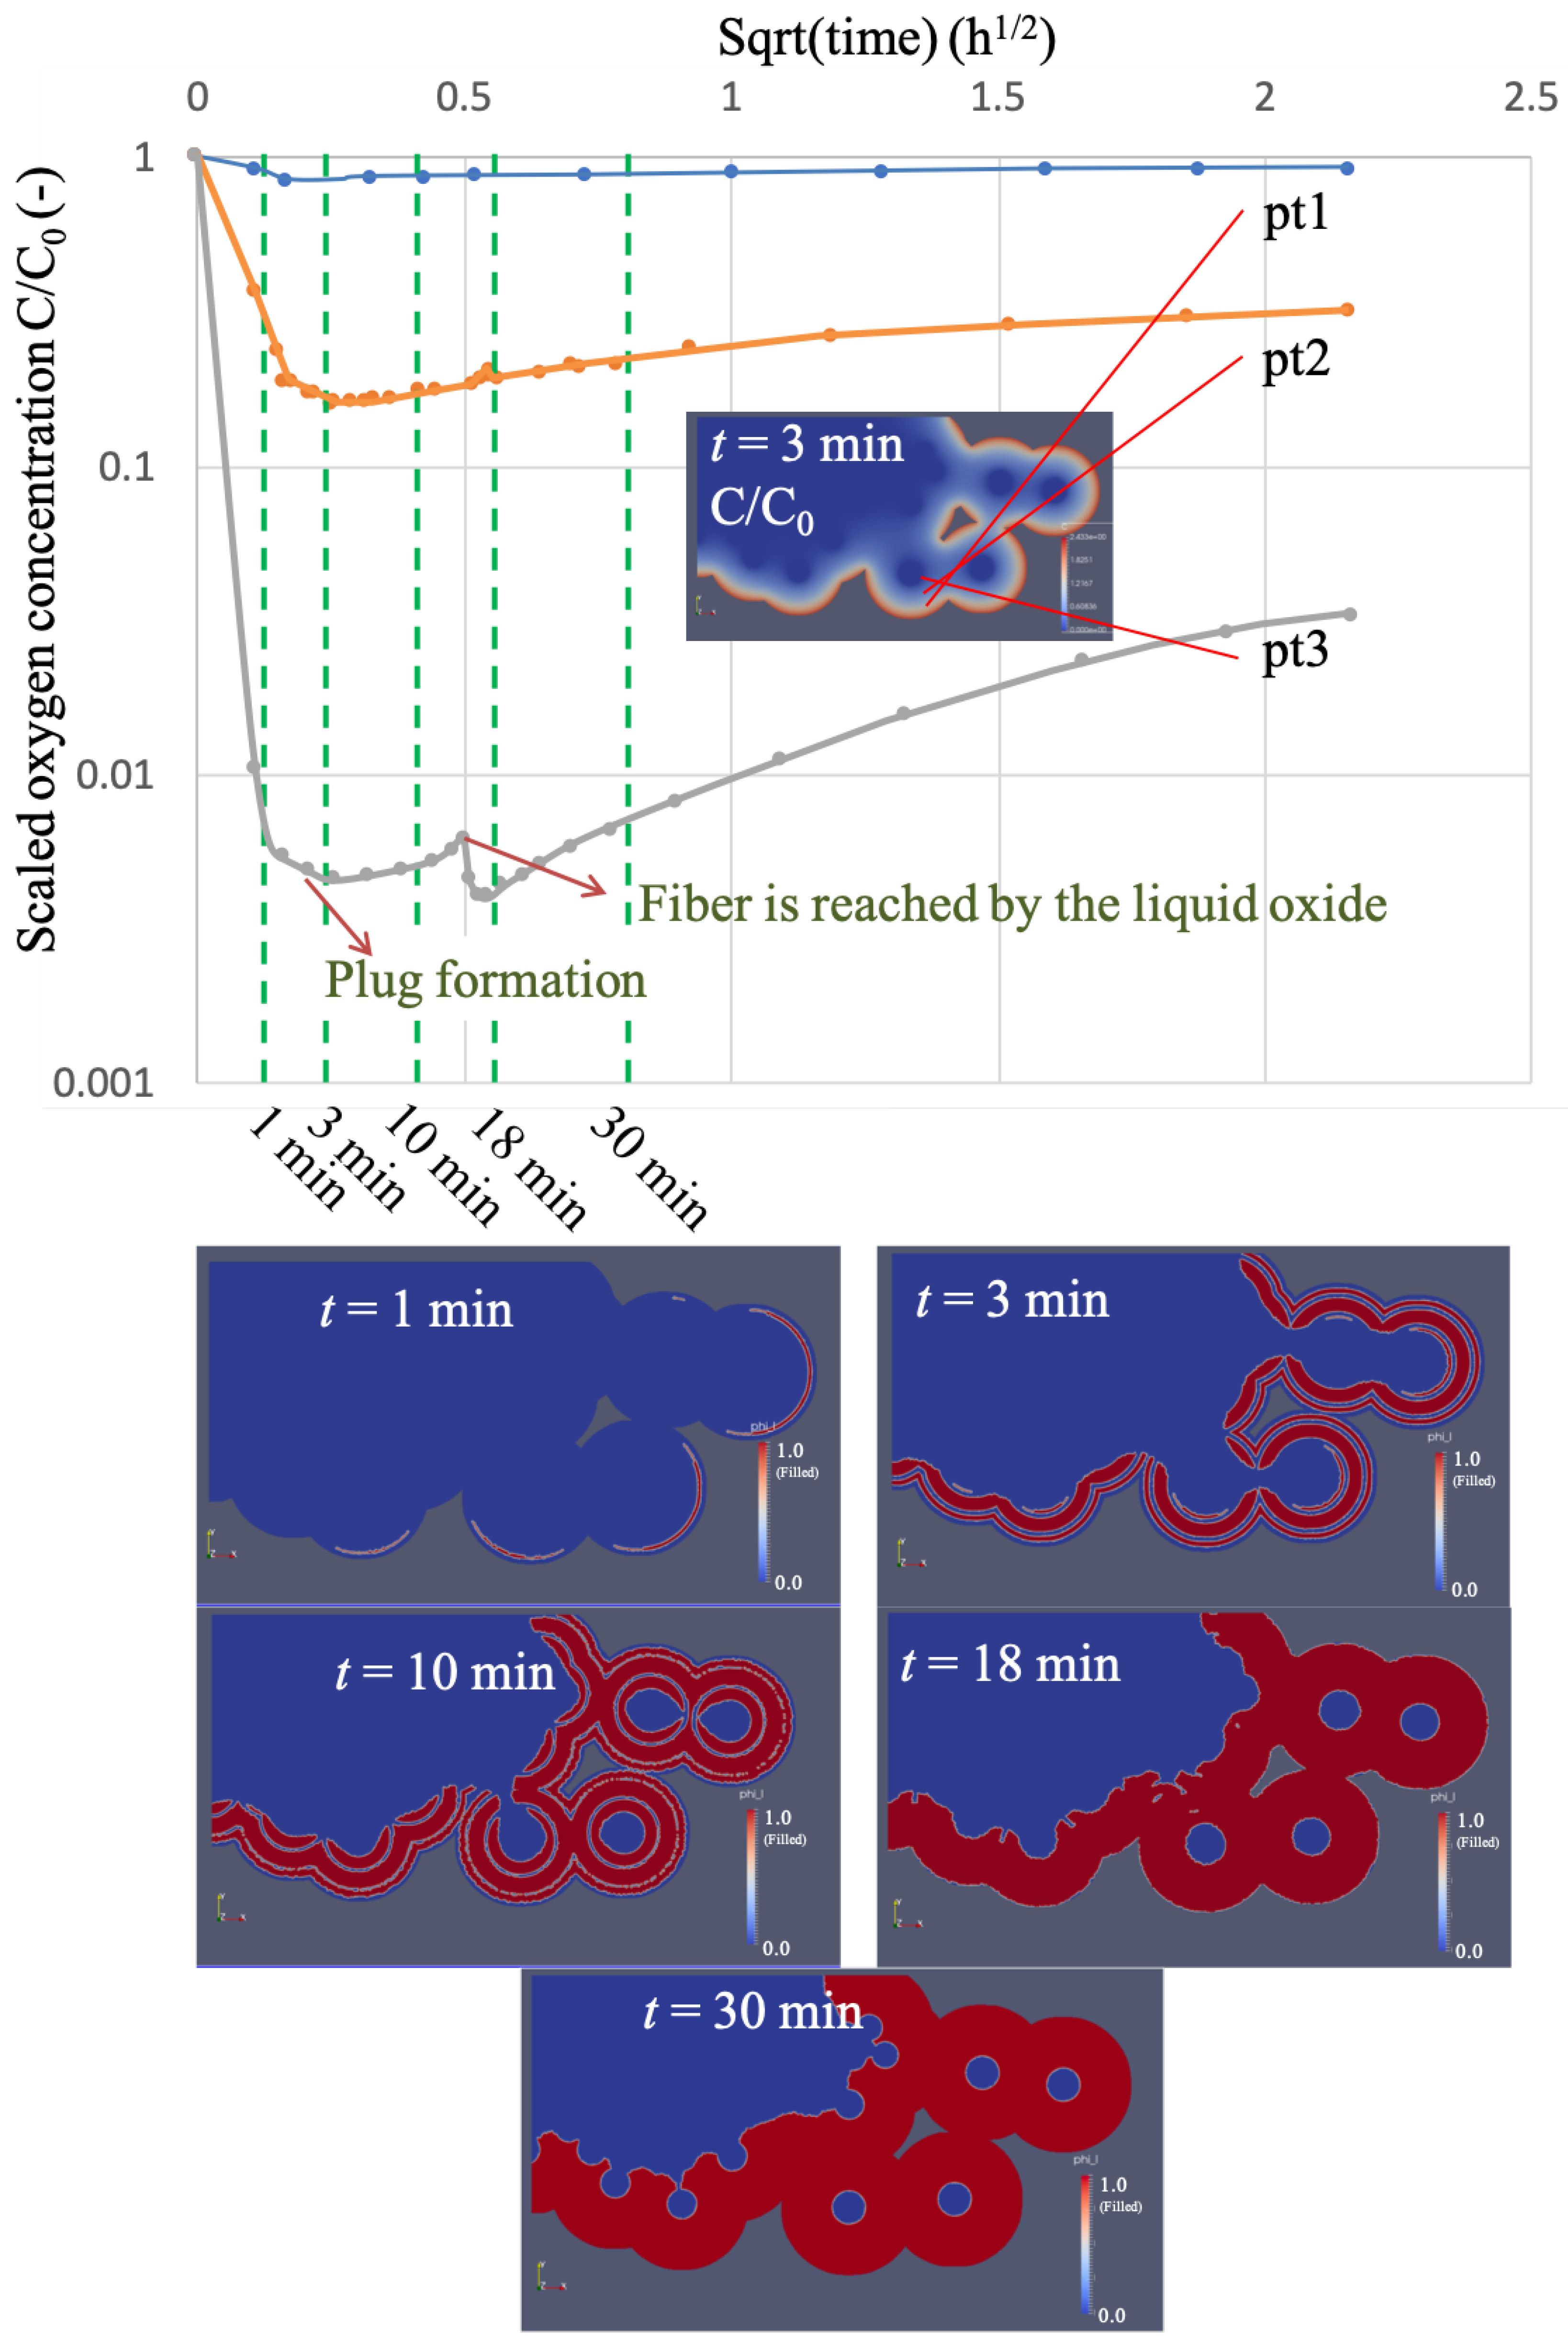
The initial mechanical equilibrium computation yielded a 3D displacement field, from which can be extracted a 2D crack height field projected on the crack surface. This is illustrated in Figure 6c. Once this field was obtained, the oxidation computation took place. Figure 7 summarizes the evolution of the system during the first 5 h of exposition. The upper graph gives the oxygen concentration at three points pt1, pt2, and pt3, one on the external boundary, one in the middle layer, and the other close to a fiber (see also Figure 6a for a localization on the resolution domain). The inset of Figure 7b is a rendering of the concentration field at 0.05 h (i.e., 3 min), illustrating the important oxygen concentration gradient all around the same boundaries. The evolution of the concentration at point illustrates well the whole physico-chemistry at work during this stage: first, a very rapid decrease was linked to the primary oxygen consumption by the pyrocarbon interphase and to a lesser extent by the boron carbide layers; after 3 min, the decrease eventually stopped, because the glass formation had already managed to hinder partially the diffusion of gaseous oxygen through the formation of a continuous external barrier (see the bottom images of Figure 7); at 18 min, the glass reached the fiber, and the oxygen concentration was consequently at its lowest. In the later period, up to 5 h, this concentration gradually increased again, because of diffusion through the liquid barrier.
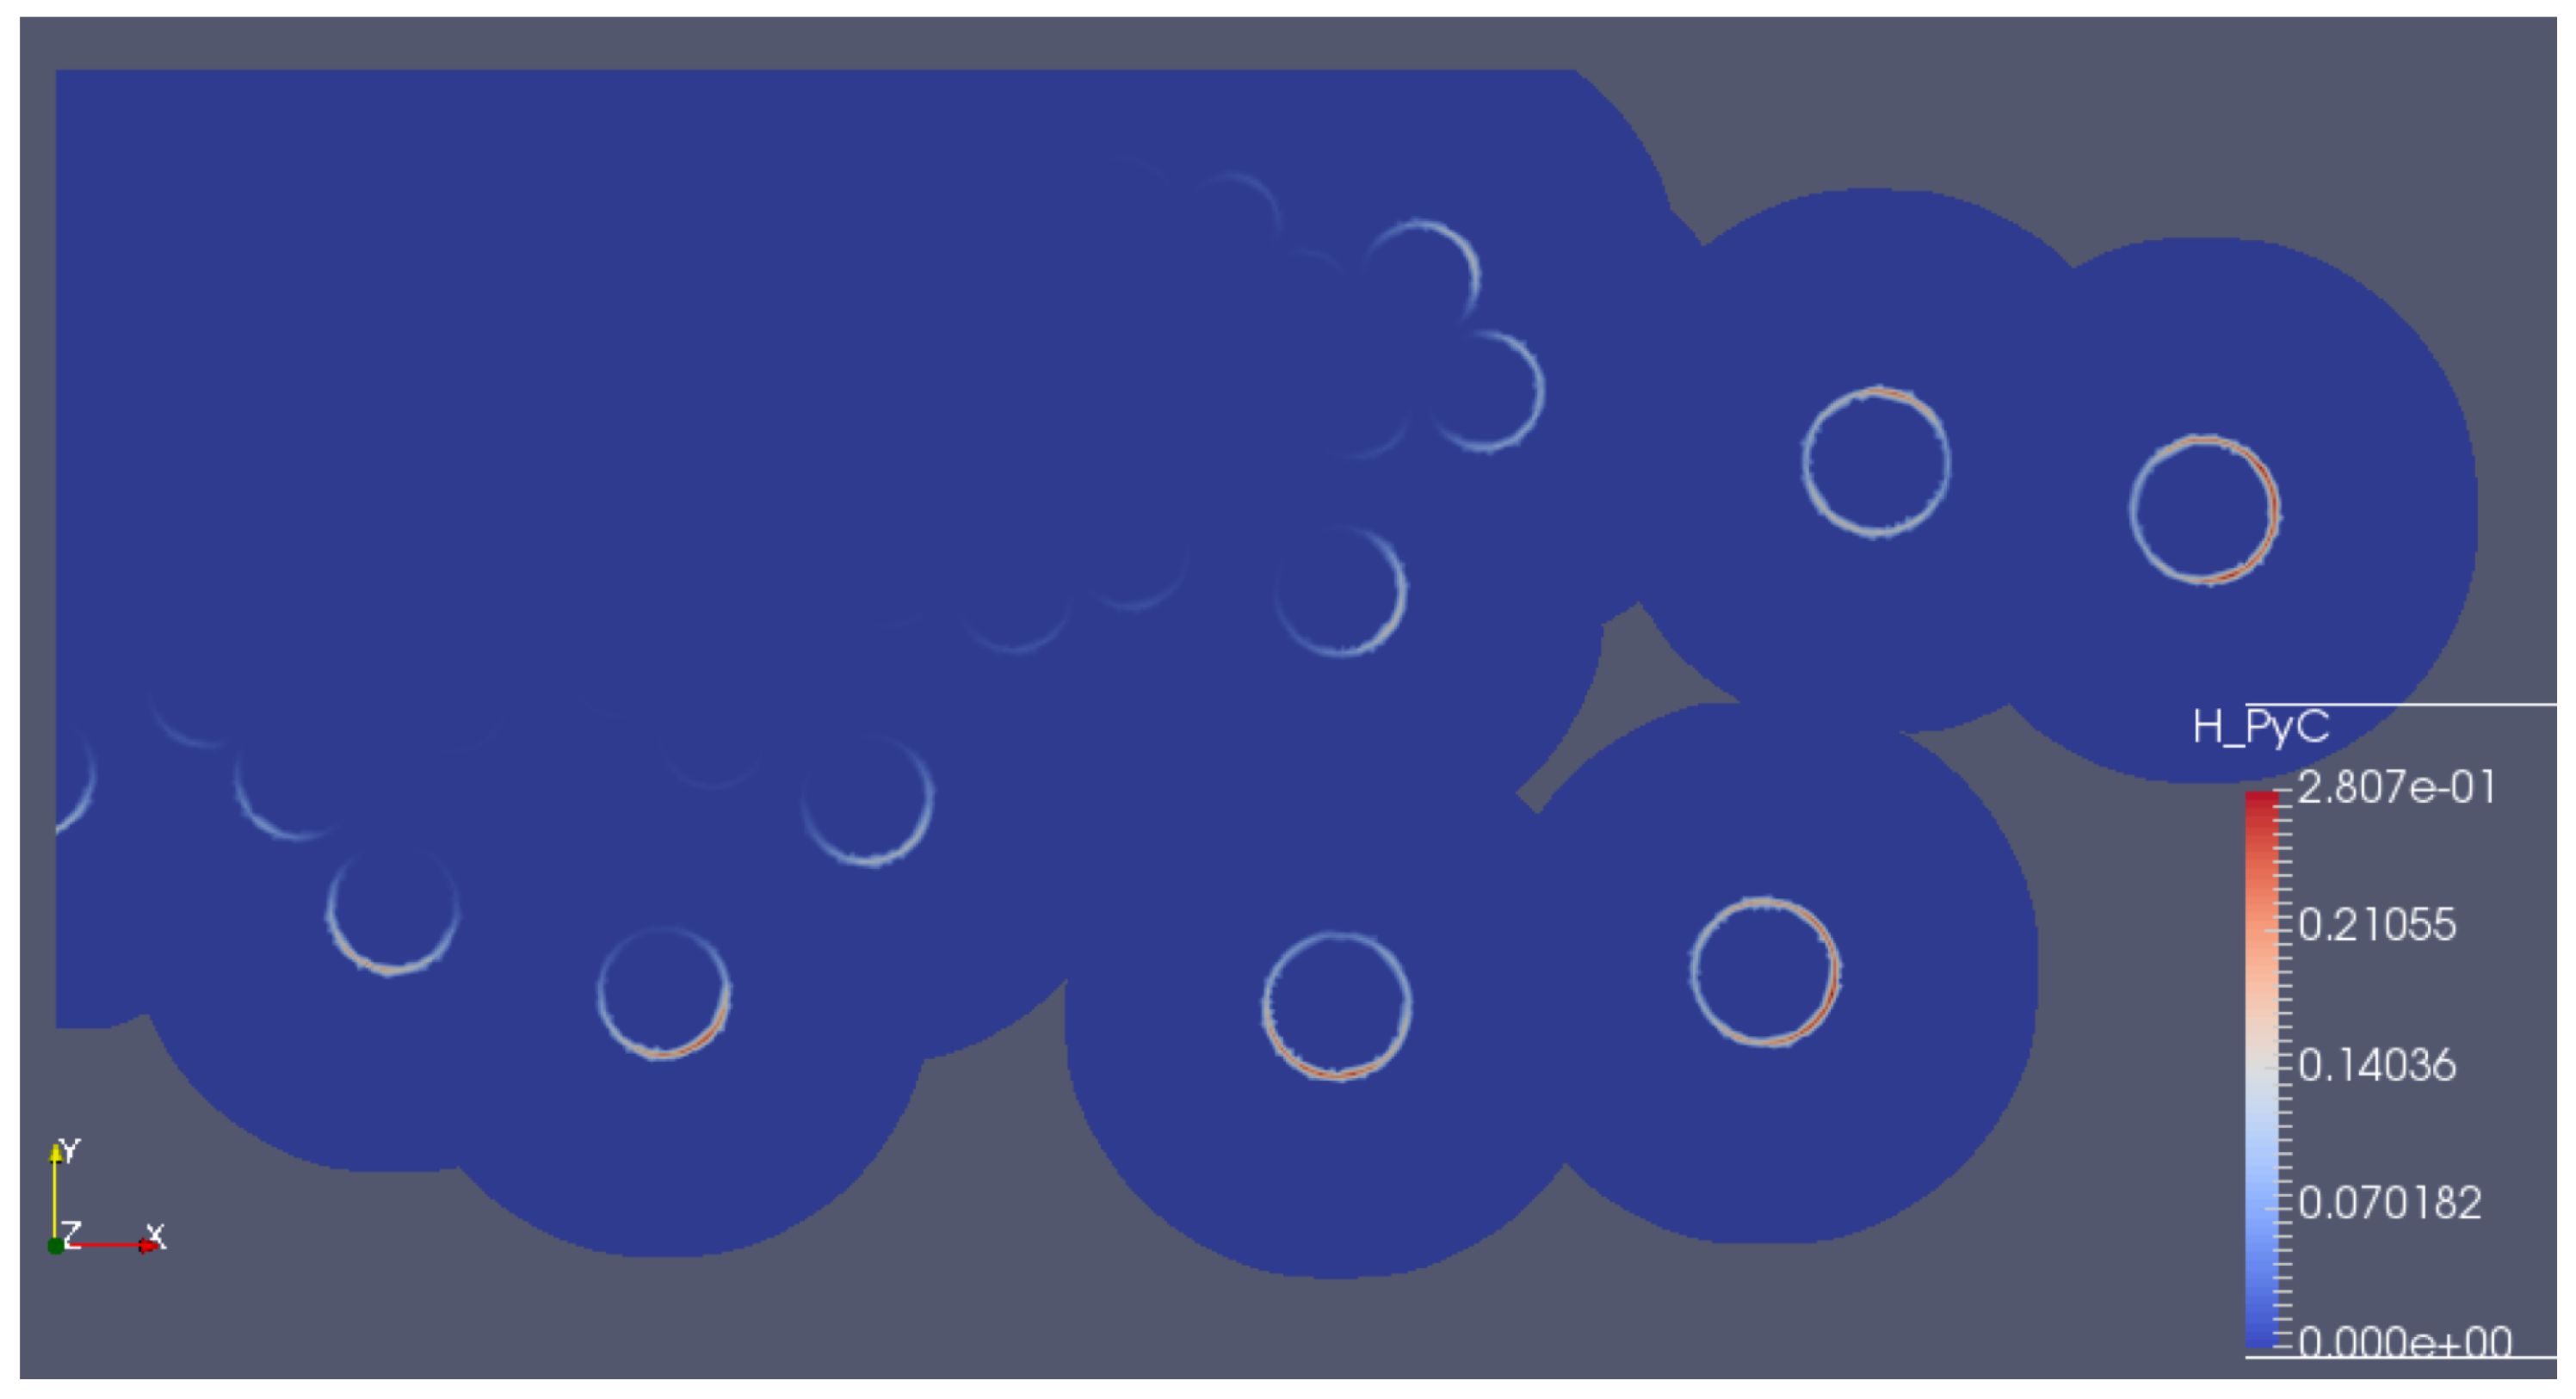
Figure 8 is a map of the consumed pyrocarbon height, showing a marked gradient, not only from the outside to the interior of the minicomposite, but also on the boundary of the most external fibers, with a 1:4 ratio between the less and most exposed parts of the interphase. Even at equal distances from the outer boundary, significant differences appear between points of the interphase, depending on their position with respect to neighboring fibers.
4.3.2. After a Fiber Breakage Event: Crack Re-Opening and Re-Healing
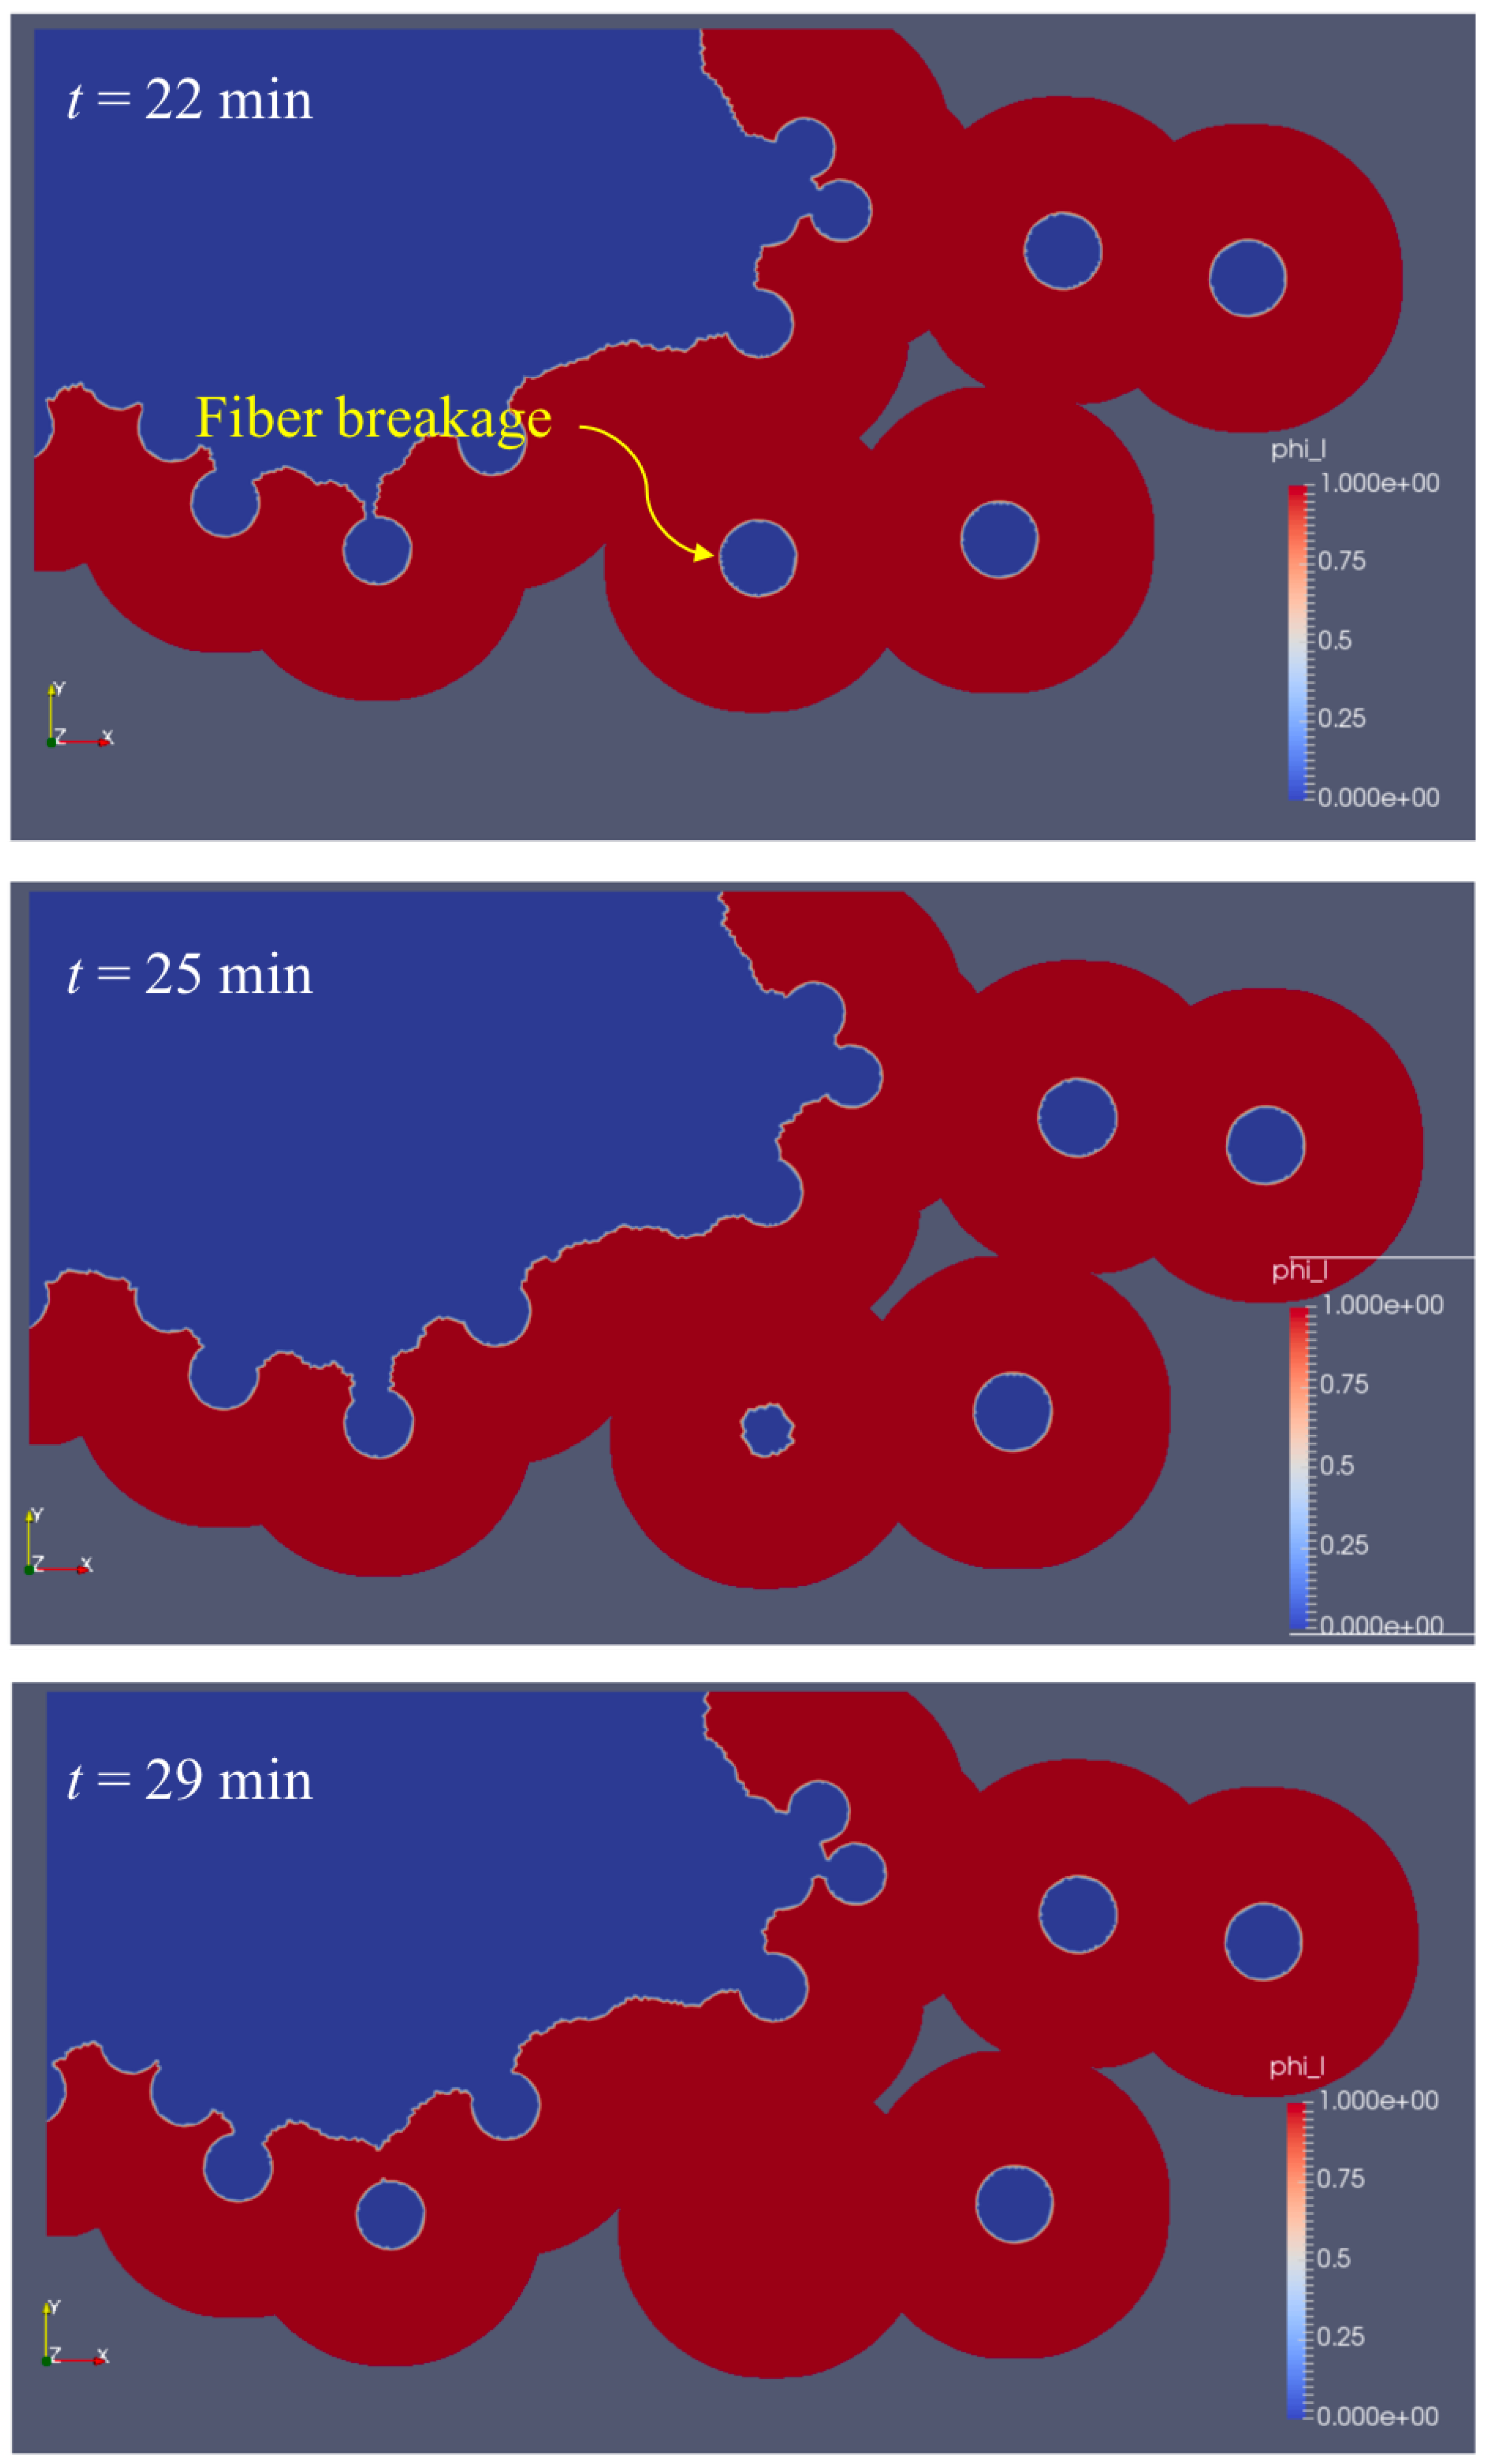
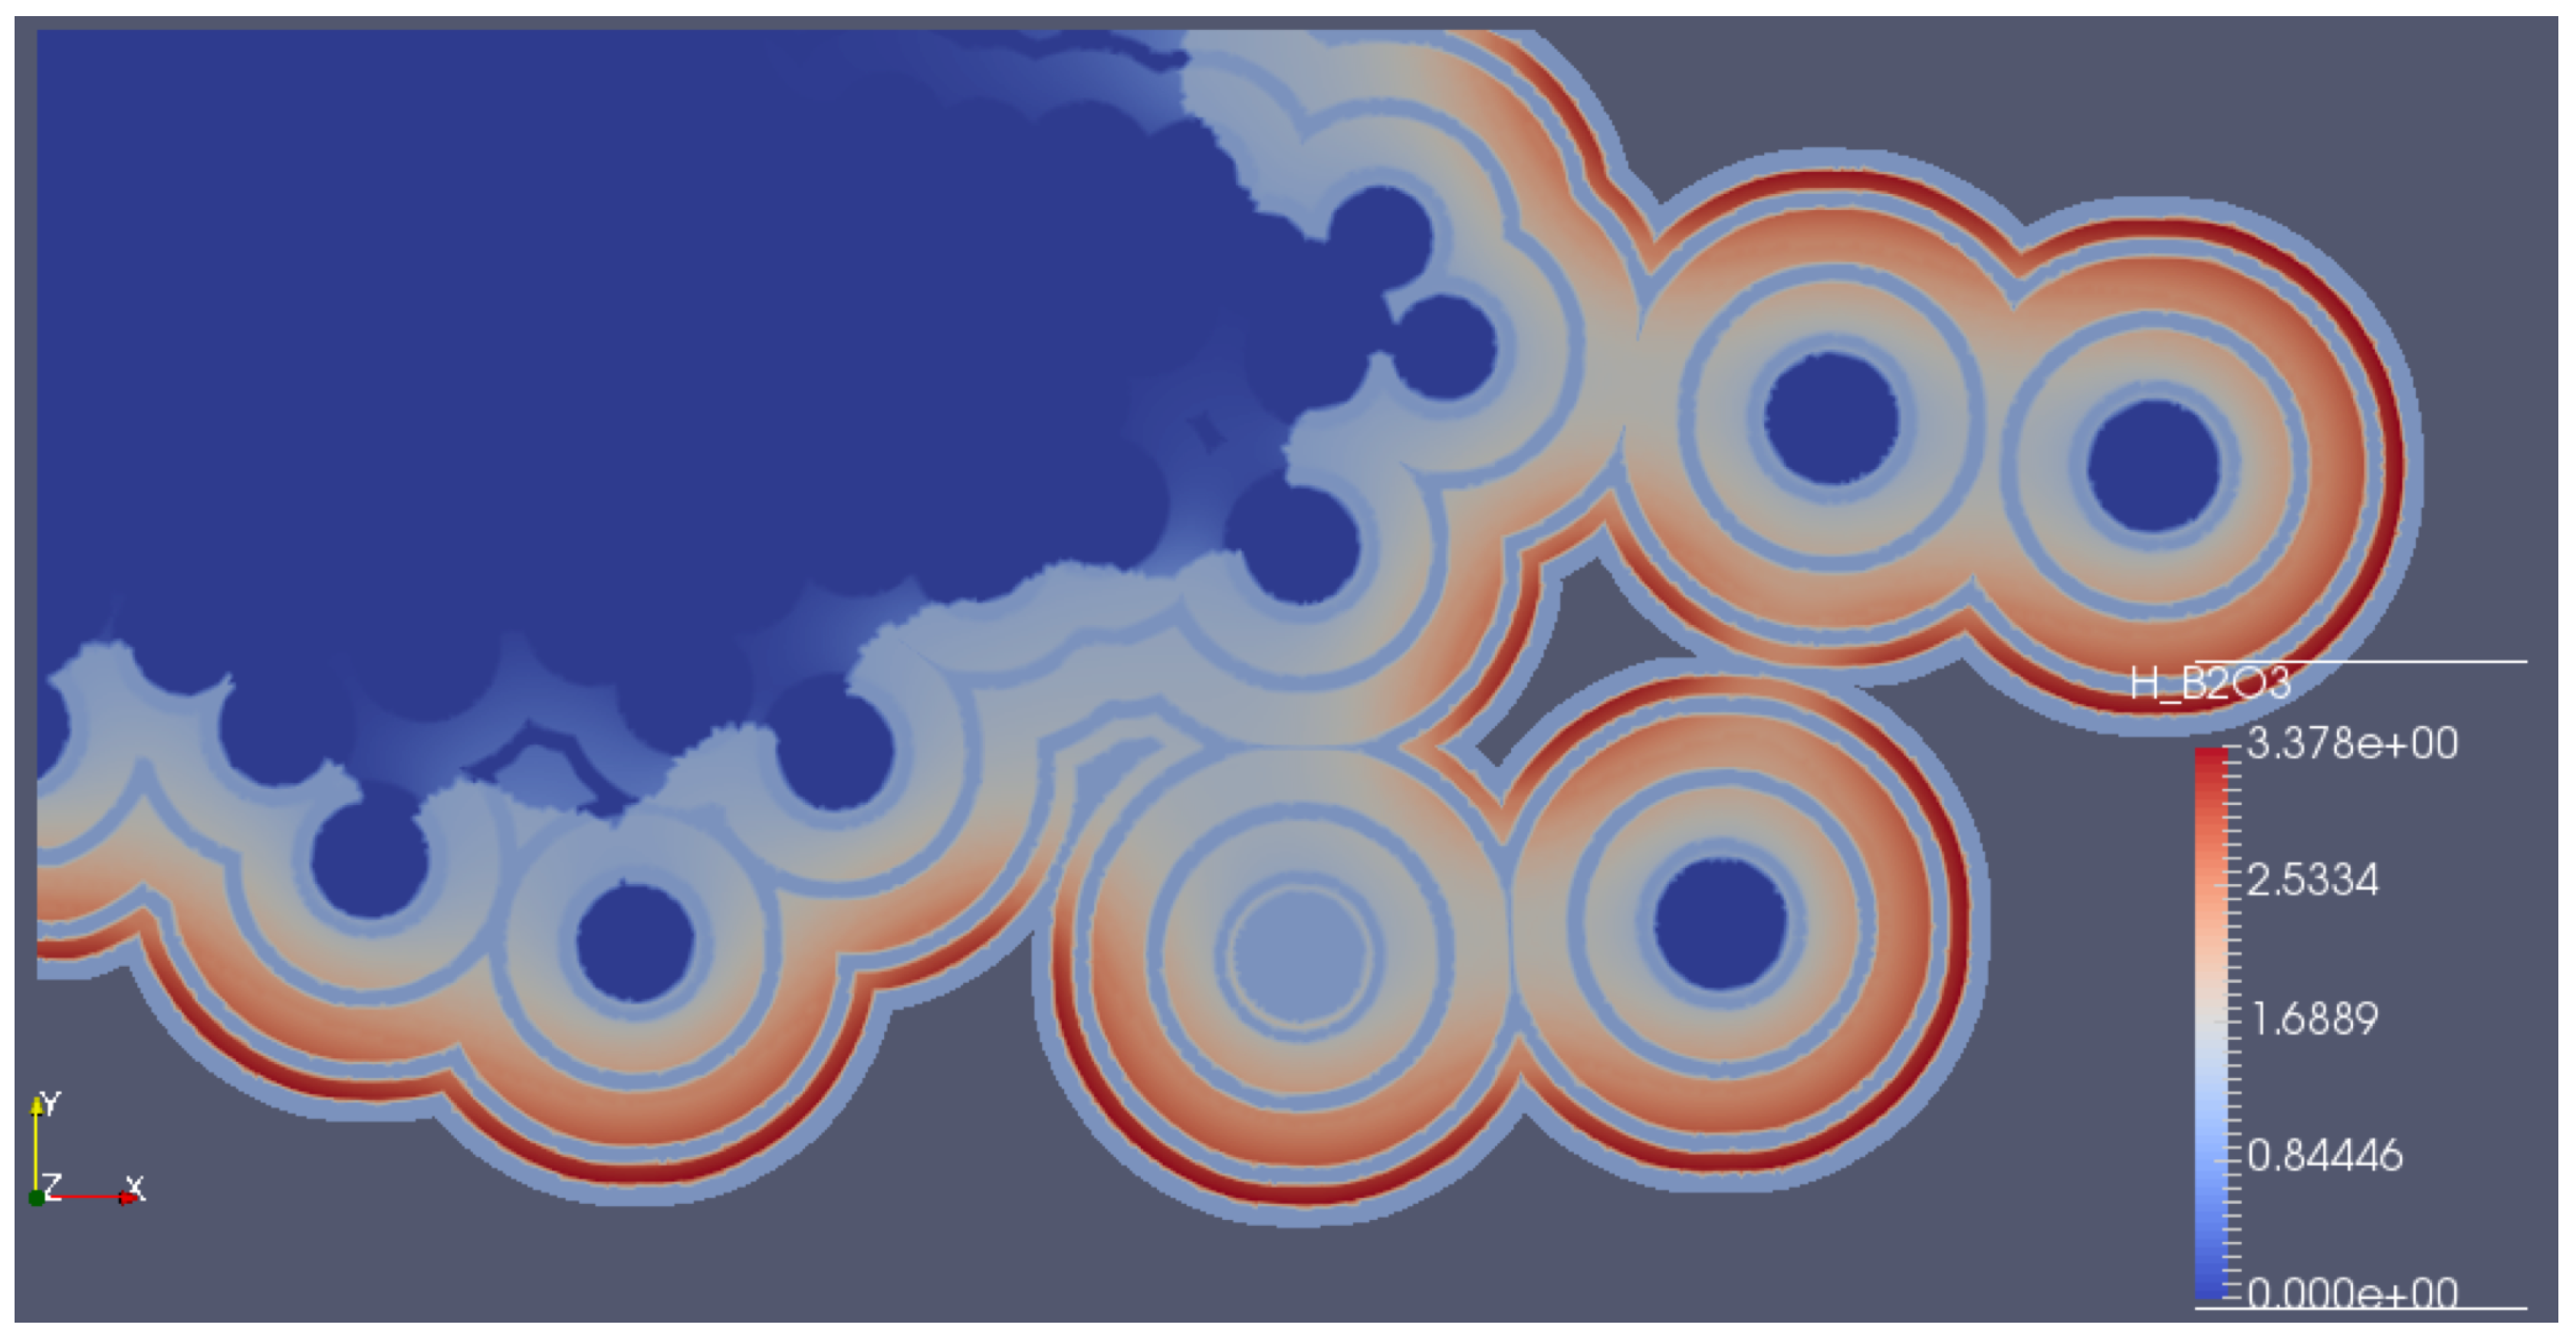
To illustrate the coupling capabilities of the software, a fiber breakage event has been manually introduced at 22 min. The computation has been resumed following the procedure described above, i.e., considering the fiber interior as an inert, wettable domain and letting the pyrocarbon interphase proceed reacting. Figure 9 shows that after less than 7 min, the broken fiber had been fully invaded by the liquid. Figure 10 is a map of the liquid height at 29 min (end of the computation). This quantity was equal to the crack width in all inert domains and was superior to it in all reactive domains, with a marked gradient from the exterior (larger height) to the interior (smaller height); the zones in which the liquid barrier did not yet fill the crack completely are visible in the interior of the minicomposite section.
4.3.3. Towards Lifetime Prediction
So far, the presented model is able to simulate correctly the formation and spreading of the healing oxide in a given preexisting crack, with possible time variations of the crack width and morphology. However, the complete lifetime prediction still requires additional modeling elements, suitably coupled to the current oxide behavior model.
Indeed, the final lifetime duration is controlled by the diffusive processes of oxygen through the healing fluid, with the presence of strong gradients throughout the minicomposite, combined to some law describing the progressive strength reduction of the fibers under the effect of oxygen exposure. This can be addressed, e.g., using an oxygen-sensitive Subcritical Crack Growth (SCG) model, in which the classical SCG model parameters are made dependent on the cumulated oxygen exposure for every fiber [8,9]. Other models for SiC fiber behavior under oxygen exposure are now also available, accounting for phenomena like silica scale formation, crystallization, and residual stresses buildup or relaxation [39]. The presence of water vapor can also be handled in these models, with its main effect of volatilizing the oxides instead of having a liquid phase growth.
One of the most interesting expected outcomes of such a coupling is the possibility of accounting for the interplay between the initial strength distribution and the oxygen exposure gradients. It appears clearly from the simulations shown here that there are severe radial gradient of oxygen exposure inside the bundles (see for instance Figure 7); accordingly, it can be expected that the strength decrease will be larger on the bundle periphery. However, it is still unclear whether this has a strong impact on the life duration, as compared to the natural strength dispersion present in the fibers, which is classically represented by a Weibull distribution of strengths. A comparison of classical load-sharing models containing such a Weibull distribution and of models altered by the presence of an oxygen exposure gradient should be carried out in order to quantify this interaction.
5. Conclusions
A detailed modeling of the behavior of self-healing ceramic-matrix composite has been developed at the scale of a unidirectional bundle. This 2D image-based model takes precisely into account the inner structure of the composite. A series of original numerical tools has been chained in a general algorithm able to describe the progressive creation of the healing fluid, even after a fiber breakage event. A realistic application example has been shown and discussed. It clearly shows significant gradients in liquid height and pyrocarbon consumption throughout the minicomposite section. New insights can be obtained on the interplay of the mechanical and physico-chemical mechanisms at work in the material during its life in use. Many further work directions can be defined from this point. First, varying conditions would allow having a more precise view of the influence of every phenomenon. Second, coupling the current model to a fiber strength reduction model [8,9,39] would allow simulating the material degradation and lifetime and determining the most critical conditions for the composite life duration. This involves coupling the degradation models to mechanical equilibrium computations, allowing for a prediction of stress transfer upon each fiber breakage event until final failure of the bundle. Another improvement to the model is the incorporation of the influence of water vapor, which has the effect of partly volatilizing the boron oxide and reducing the efficiency of the self-healing mechanism [28,38]. Finally, the approach may be extended to other types of CMCs, with different phases, like silicon-infiltrated SiC/SiC composites [40].
Such extensions to the presented approach are currently under investigation.
Author Contributions
Conceptualization, G.C. and G.L.V.; data curation, G.C. and G.L.V.; formal analysis, G.C., M.R. and G.L.V.; funding acquisition, G.L.V.; investigation, G.P.; methodology, G.C.; project administration, G.L.V.; resources, M.R.; software, G.P. and G.C.; supervision, G.C., M.R., and G.L.V.; validation, M.R.; visualization, G.P.; writing, original draft, G.L.V.
Funding
This work has been supported by the French Ministry of Higher Education through a Ph. D. grant to Grégory Perrot and by ANR (Project ViSCAP (Virtual Self-Healing Composites for Aeronautic Propulsion) ANR-17-CE08-0030).
Acknowledgments
Interns C. Boned and L. Halé are acknowledged for their help in coding. Helpful discussion with F. Rebillat (LCTS, University of Bordeaux) is gratefully acknowledged. Some of the computations presented in this paper were carried out using the PlaFRIM (Plateforme Fédérative pour la Recherche en Informatique et Mathématiques) experimental testbed, supported by Inria, CNRS (LaBRI - Laboratoire Bordelais de Recherches en Informatique and IMB - Institut de Mathématiques de Bordeaux), Université de Bordeaux, Bordeaux INP (Institut National Polytechnique), and Conseil Régional de la Nouvelle-Aquitaine.
Conflicts of Interest
The authors declare no conflict of interest.
References
- Christin, F. A global approach to fiber nD architectures and self-sealing matrices: From research to production. Int. J. Appl. Ceram. Technol. 2005, 2, 97. [Google Scholar] [CrossRef]
- Cavalier, J.C.; Berdoyes, I.; Bouillon, E. Composites in aerospace industry. Adv. Sci. Technol. 2006, 50, 153–162. [Google Scholar] [CrossRef]
- Camus, G. Modelling of the mechanical behavior and damage processes of fibrous ceramic matrix composites: Application to a 2-D SiC/SiC. Int. J. Solids Struct. 2000, 37, 919–942. [Google Scholar] [CrossRef]
- Goujard, S.; Charvet, J.L.; Leluan, J.L.; Abbé, F.; Lamazouade, G. Matériau Composite Protégé contre L’oxydation par une Matrice Autocicatrisante et son Procédé de Fabrication (Composite Material Protected from Oxidation by a Self-Healing Matrix, and Method for Making Same). French Patent No. FR95 03606, 28 March 1995. [Google Scholar]
- Forio, P.; Lamon, J. Fatigue behaviour at high temperature in air of a 2D SiC/Si-B-C composite with a self-healing multilayered matrix. Ceram. Trans. 2001, 128, 127–141. [Google Scholar]
- Quémard, L.; Rebillat, F.; Guette, A.; Tawil, H.; Louchet-Pouillerie, C. Self-healing mechanisms of a SiC fiber reinforced multilayered ceramic matrix. J. Eur. Ceram. Soc. 2007, 27, 2085–2094. [Google Scholar] [CrossRef]
- Gauthier, W.; Lamon, J.; Pailler, R. Fatigue statique de monofilaments et de fils SiC Hi-Nicalon à 500 °C et 800 °C. Rev. Compos. Mater. Adv. 2006, 16, 221–241. [Google Scholar]
- Ladevèze, P.; Genet, M. A new approach to the subcritical cracking of ceramic fibers. Compos. Sci. Technol. 2010, 70, 1575–1583. [Google Scholar] [CrossRef]
- Cluzel, C.; Baranger, E.; Ladevèze, P.; Mouret, A. Mechanical behaviour and lifetime modelling of self-healing ceramic-matrix composites subjected to thermomechanical loading in air. Compos. Part A Appl. Sci. Manuf. 2009, 40, 976–984. [Google Scholar] [CrossRef]
- Marcin, L.; Baranger, E.; Ladevèze, P.; Genet, M.; Baroumes, L. Prediction of the lifetime of self-healing ceramic matrix composites: Applications to structural computations. In Proceedings of the 7th International Conference on High Temperature Ceramic Matrix Composites (HT-CMC7), Bayreuth, Germany, 20–22 September 2010; Krenkel, W., Lamon, J., Eds.; AVISO Verlagsgesselschaft mbH: Berlin, Germany, 2010; pp. 194–202. [Google Scholar]
- Rebillat, F. Original 1D oxidation modeling of composites with complex architectures. In Proceedings of the 5th Conference on High Temperature Ceramic Matrix Composites (HT-CMC 5), Seattle, WA, USA, 12–16 September 2004; Singh, M., Kerans, R., Lara-Curzio, E., Naslain, R., Eds.; John Wiley & Sons, Inc.: New York, NY, USA, 2005; pp. 315–320. [Google Scholar]
- Lamon, J. A micromechanics-based approach to the mechanical behavior of brittle-matrix composites. Compos. Sci. Technol. 2001, 61, 2259–2272. [Google Scholar] [CrossRef]
- Drean, V.; Ricchiuto, M.; Vignoles, G. Two-Dimensional Oxydation Modelling of MAC Composite Materials; Research Report RR-7417; INRIA: Bordeaux, France, 2010. [Google Scholar]
- Lamouroux, F.; Camus, G.; Thébault, J. Kinetics and Mechanisms of Oxidation of 2D Woven C/SiC Composites: I, Experimental Approach. J. Am. Ceram. Soc. 1994, 77, 2049–2057. [Google Scholar] [CrossRef]
- Naslain, R.; Langlais, F. Fundamental and practical aspects of the chemical vapor infiltration of porous substrates. High Temp. Sci. 1989, 27, 221–235. [Google Scholar]
- Besmann, T.M.; Sheldon, B.W.; Lowden, R.A.; Stinton, D.P. Vapor-phase fabrication and properties of continuous-filament ceramic composites. Science 1991, 253, 1104–1109. [Google Scholar] [CrossRef]
- Vignoles, G.L. Modelling of the CVI Processes. Adv. Sci. Technol. 2006, 50, 97–106. [Google Scholar] [CrossRef]
- Lissart, N.; Lamon, J. Damage and failure in ceramic matrix minicomposites: Experimental study and model. Acta Mater. 1997, 45, 1025–1044. [Google Scholar] [CrossRef]
- Lamon, J. Approach to Microstructure-Behavior Relationships for Ceramic Matrix Composites Reinforced by Continuous Fibers; John Wiley & Sons, Inc.: Hoboken, NJ, USA, 2014; Chapter 18; pp. 520–547. [Google Scholar] [CrossRef]
- Chateau, C.; Gélébart, L.; Bornert, M.; Crépin, J.; Boller, E.; Sauder, C.; Ludwig, W. In situ X-ray microtomography characterization of damage in SiCf/SiC minicomposites. Compos. Sci. Technol. 2011, 71, 916–924. [Google Scholar] [CrossRef]
- Caty, O.; Ibarroule, P.; Herbreteau, M.; Rebillat, F.; Maire, E.; Vignoles, G.L. Application of X-ray computed micro-tomography to the study of damage and oxidation kinetics of thermostructural composites. Nucl. Instrum. Methods Phys. Res. 2014, 324, 113–117. [Google Scholar] [CrossRef]
- Forio, P.; Lamon, J. High temperature behavior of ceramic matrix composites with a self healing matrix. In Repairing Structures Using Composite Wraps, Proceedings of the 8th Japanese/European Symposium on Composite Materials, Tokyo, Japan, 16–17 April 2002; Bathias, C., Fukuda, H., Kemmoshi, K., Renard, J., Tsuda, H., Eds.; Hermes Penton Science: Paris, France, 2003; pp. 159–170. [Google Scholar]
- Forio, P.; Lavaire, F.; Lamon, J. Delayed failure at intermediate temperatures (600 °C–700 °C) in air in silicon carbide multifilament tows. J. Am. Ceram. Soc. 2004, 87, 888–893. [Google Scholar] [CrossRef]
- Gauthier, W.; Lamon, J. Delayed failure of Hi-Nicalon and Hi-Nicalon S multifilament tows and single filaments at intermediate temperatures (500 °C–800 °C). J. Am. Ceram. Soc. 2009, 92, 702–709. [Google Scholar] [CrossRef]
- Gauthier, W.; Pailler, F.; Lamon, J.; Pailler, R. Oxidation of silicon carbide fibers during static fatigue in air at intermediate temperatures. J. Am. Ceram. Soc. 2009, 92, 2067–2073. [Google Scholar] [CrossRef]
- Rebillat, F. Advances in self-healing ceramic matrix composites. In Advances in Ceramic Matrix Composites; Low, I.M., Ed.; Woodhead Publishing Ltd.: Sawston, UK, 2014; Chapter 16; pp. 369–409. [Google Scholar]
- Labruquere, S.; Bourrat, X.; Pailler, R.; Naslain, R. Structure and oxidation of C/C composites: Role of the interface. Carbon 2001, 39, 971–984. [Google Scholar] [CrossRef]
- Rebillat, F.; Martin, X.; Garitte, E.; Guette, A. Overview on the Self-Sealing Process in the SiCf/[Si,C,B]m Composites under Wet Atmosphere at High Temperature. In Design, Development, and Applications of Engineering Ceramics and Composites; Singh, D., Zhu, D.M., Zhou, Y.C., Singh, M., Eds.; The American Ceramic Society, John Wiley & Sons, Inc.: New York, NY, USA, 2010; Volume 215, pp. 151–166. [Google Scholar]
- Bertrand, R.; Caty, O.; Mazars, V.; Denneulin, S.; Weisbecker, P.; Pailhes, J.; Camus, G.; Rebillat, F. In-situ tensile tests under SEM and X-ray computed micro-tomography aimed at studying a self-healing matrix composite submitted to different thermomechanical cycles. J. Eur. Ceram. Soc. 2017, 37, 3471–3474. [Google Scholar] [CrossRef]
- Martin, X.; Rebillat, F.; Guette, A. Oxidation behavior of boron carbide (B4C) in a complex atmosphere N-2/O2H2O. In High Temperature Corrosion and Materials Chemistry IV; Opila, E., Hou, P., Maruyama, T., Pieaggi, B., Shifler, D., Wuchina, E., Eds.; The Electrochemical Society: Pennington, NJ, USA, 2003; pp. 339–350. [Google Scholar]
- Naslain, R.; Guette, A.; Rebillat, F.; Le Gallet, S.; Lamouroux, F.; Filipuzzi, L.; Louchet, C. Oxidation mechanisms and kinetics of SiC-matrix composites and their constituents. J. Mater. Sci. 2004, 39, 7303–7316. [Google Scholar] [CrossRef]
- Nualas, F.; Rebillat, F. A Multi-Scale Approach of Degradation Mechanisms inside a SiC(f)/Si-B-C(m) Based Self-Healing Matrix Composite in a Dry Oxidizing Environment. Oxid. Met. 2013, 80, 279–287. [Google Scholar] [CrossRef]
- Drean, V.; Perrot, G.; Couégnat, G.; Ricchiuto, M.; Vignoles, G.L. Image-based 2D numerical modeling of oxide formation in self-healing CMCs. In Developments in Strategic Materials and Computational Design III; Kriven, W.M., Gyekenyesi, A.L., Westin, G., Wang, J.Y., Halbig, M., Mathur, S., Eds.; Wiley: New York, NY, USA, 2013; Volume 33, pp. 117–125. [Google Scholar]
- Deal, B.E.; Grove, A.S. General Relationship for the Thermal Oxidation of Silicon. J. Appl. Phys. 1965, 36, 3770–3778. [Google Scholar] [CrossRef]
- Amestoy, P.R.; Duff, I.S.; l’Excellent, J.-Y. Multifrontal parallel distributed symmetric and unsymmetric solvers. Comput. Methods Appl. Mech. Eng. 2000, 184, 501–520. [Google Scholar] [CrossRef]
- Shewchuck, J.R. Delaunay refinement algorithms for triangular mesh generation. Comput. Geom. Theory Appl. 2002, 22, 21–74. [Google Scholar] [CrossRef]
- Reid, R.; Prausnitz, J.; Poling, B.E. The Properties of Gases and Liquids, 4th ed.; McGraw-Hill: New York, NY, USA, 1987. [Google Scholar]
- Rebillat, F.; Martin, X.; Guette, A. Kinetic oxidation laws of boron carbide in dry and wet environments. In Proceedings of the 5th Conference on High Temperature Ceramic Matrix Composites (HT-CMC 5), Seattle, WA, USA, 12–16 September 2004; Singh, M., Kerans, R., Lara-Curzio, E., Naslain, R., Eds.; John Wiley & Sons, Inc.: New York, NY, USA, 2005; pp. 321–326. [Google Scholar]
- Hay, R.S.; Mogilevsky, P. Model for SiC fiber strength after oxidation in dry and wet air. J. Am. Ceram. Soc. 2019, 102, 397–415. [Google Scholar] [CrossRef]
- Morscher, G.N.; Gordon, N.A. Acoustic emission and electrical resistance in SiC-based laminate ceramic composites tested under tensile loading. J. Eur. Ceram. Soc. 2017, 37, 3861–3872. [Google Scholar] [CrossRef]
Figure 1.
Successive close-ups of a self-healing ceramic-matrix composite in an aerospace propulsion device. (a) Engine and part scale (computer-aided sketch); (b) weaving scale (X-ray Computerised Micro-Tomography (CMT)scan); (c) tow scale (X-ray CMT scan); (d) fiber scale (FE mesh).
Figure 1.
Successive close-ups of a self-healing ceramic-matrix composite in an aerospace propulsion device. (a) Engine and part scale (computer-aided sketch); (b) weaving scale (X-ray Computerised Micro-Tomography (CMT)scan); (c) tow scale (X-ray CMT scan); (d) fiber scale (FE mesh).

Figure 2.
Definition of the computational regions.

Figure 3.
Overall flowchart of the resolution algorithm.

Figure 4.
Scheme of a growing droplet.

Figure 5.
Time step acceleration: time evolution of the liquid height at Point 2 (see Figure 6a) for several choices of the time step.
Figure 5.
Time step acceleration: time evolution of the liquid height at Point 2 (see Figure 6a) for several choices of the time step.

Figure 6.
Description of the geometry of the example problem. (a) Localization of the phases (the dark blue disks are the fiber sections, the concentric rings the sealing matrix in dark red and the inert matrix in light grey, respectively). (b) 3D view of the domain used for mechanical equilibrium computations, showing the location of the crack at mid-height. (c) Spatial distribution of the crack width at the initial state. pt, point.

Figure 7.
Effect of oxidation on the microcomposite during the first 5 h. Top: Plot of the local oxygen concentration at selected points , , and (see Figure 6a). Inset: local oxygen concentration field at min. Bottom: extension of the liquid barrier at five selected moments.
Figure 7.
Effect of oxidation on the microcomposite during the first 5 h. Top: Plot of the local oxygen concentration at selected points , , and (see Figure 6a). Inset: local oxygen concentration field at min. Bottom: extension of the liquid barrier at five selected moments.

Figure 8.
Consumed pyrocarbon height after 30 min.

Figure 9.
Evolution of the liquid barrier after a fiber breakage event.

Figure 10.
Liquid height after the fiber breakage event, at min.


Table 1.
Input data for the example case: geometrical parameters.
| Parameter | Symbol | Value | Unit |
|---|---|---|---|
| Outer inert layer thickness | 3.0 | m | |
| Outer healing layer thickness | 2.0 | m | |
| Second inert layer thickness | 3.0 | m | |
| Second healing layer thickness | 6.0 | m | |
| Third inert layer thickness | 3.0 | m | |
| Third healing layer thickness | 6.0 | m | |
| Inner inert layer thickness | 3.0 | m | |
| Pyrocarbon thickness | 0.1 | m | |
| Average fiber diameter | 13.3 | m | |
| Fiber diameter std. deviation | 2.2 | m | |
| Fiber volume fraction | 48.6 | % | |
| Minicomposite section | 0.0167 | mm |
Table 2.
Input data for the example case: physico-chemical parameters.
| Parameter | Symbol | Value | Unit |
|---|---|---|---|
| Temperature | T | 700 | C |
| Pressure | p | 1.015 | hPa |
| External oxygen mole fraction | 0.21 | - | |
| Oxygen/air gas diffusion coefficient | m s | ||
| Oxygen/boria liquid diffusion coefficient | m s | ||
| External boundary layer size | 10 | m | |
| Pyrocarbon oxidation rate constant | m s | ||
| Boron carbide oxidation rate constant | m s | ||
| Boria molar volume | m mol | ||
| Boron carbide molar volume | m mol | ||
| Pyrocarbon molar volume | m mol |
© 2019 by the authors. Licensee MDPI, Basel, Switzerland. This article is an open access article distributed under the terms and conditions of the Creative Commons Attribution (CC BY) license (http://creativecommons.org/licenses/by/4.0/).
Share and Cite
MDPI and ACS Style
Perrot, G.; Couégnat, G.; Ricchiuto, M.; Vignoles, G.L. Image-Based Numerical Modeling of Self-Healing in a Ceramic-Matrix Minicomposite. Ceramics 2019, 2, 308-326. https://0-doi-org.brum.beds.ac.uk/10.3390/ceramics2020026
AMA Style
Perrot G, Couégnat G, Ricchiuto M, Vignoles GL. Image-Based Numerical Modeling of Self-Healing in a Ceramic-Matrix Minicomposite. Ceramics. 2019; 2(2):308-326. https://0-doi-org.brum.beds.ac.uk/10.3390/ceramics2020026
Chicago/Turabian StylePerrot, Grégory, Guillaume Couégnat, Mario Ricchiuto, and Gerard L. Vignoles. 2019. "Image-Based Numerical Modeling of Self-Healing in a Ceramic-Matrix Minicomposite" Ceramics 2, no. 2: 308-326. https://0-doi-org.brum.beds.ac.uk/10.3390/ceramics2020026