
Metallic Calcium as a Precursor for Sol-Gel Synthesis of CaCO3-SiO2 and CaO-SiO2 Systems †


Abstract
:Special note
Abstract
1. Introduction
2. Materials and Methods
2.1. Materials
2.2. Preparation
2.3. Characterization
2.3.1. X-ray Diffraction Analysis
2.3.2. Thermal Analysis
2.3.3. SEM, TEM and EDS (Energy Dispersive X-ray Spectroscopy) Analysis
2.3.4. Porous Structure
2.3.5. FT-IR Measurements
3. Results and Discussion
3.1. X-ray Powder Diffraction
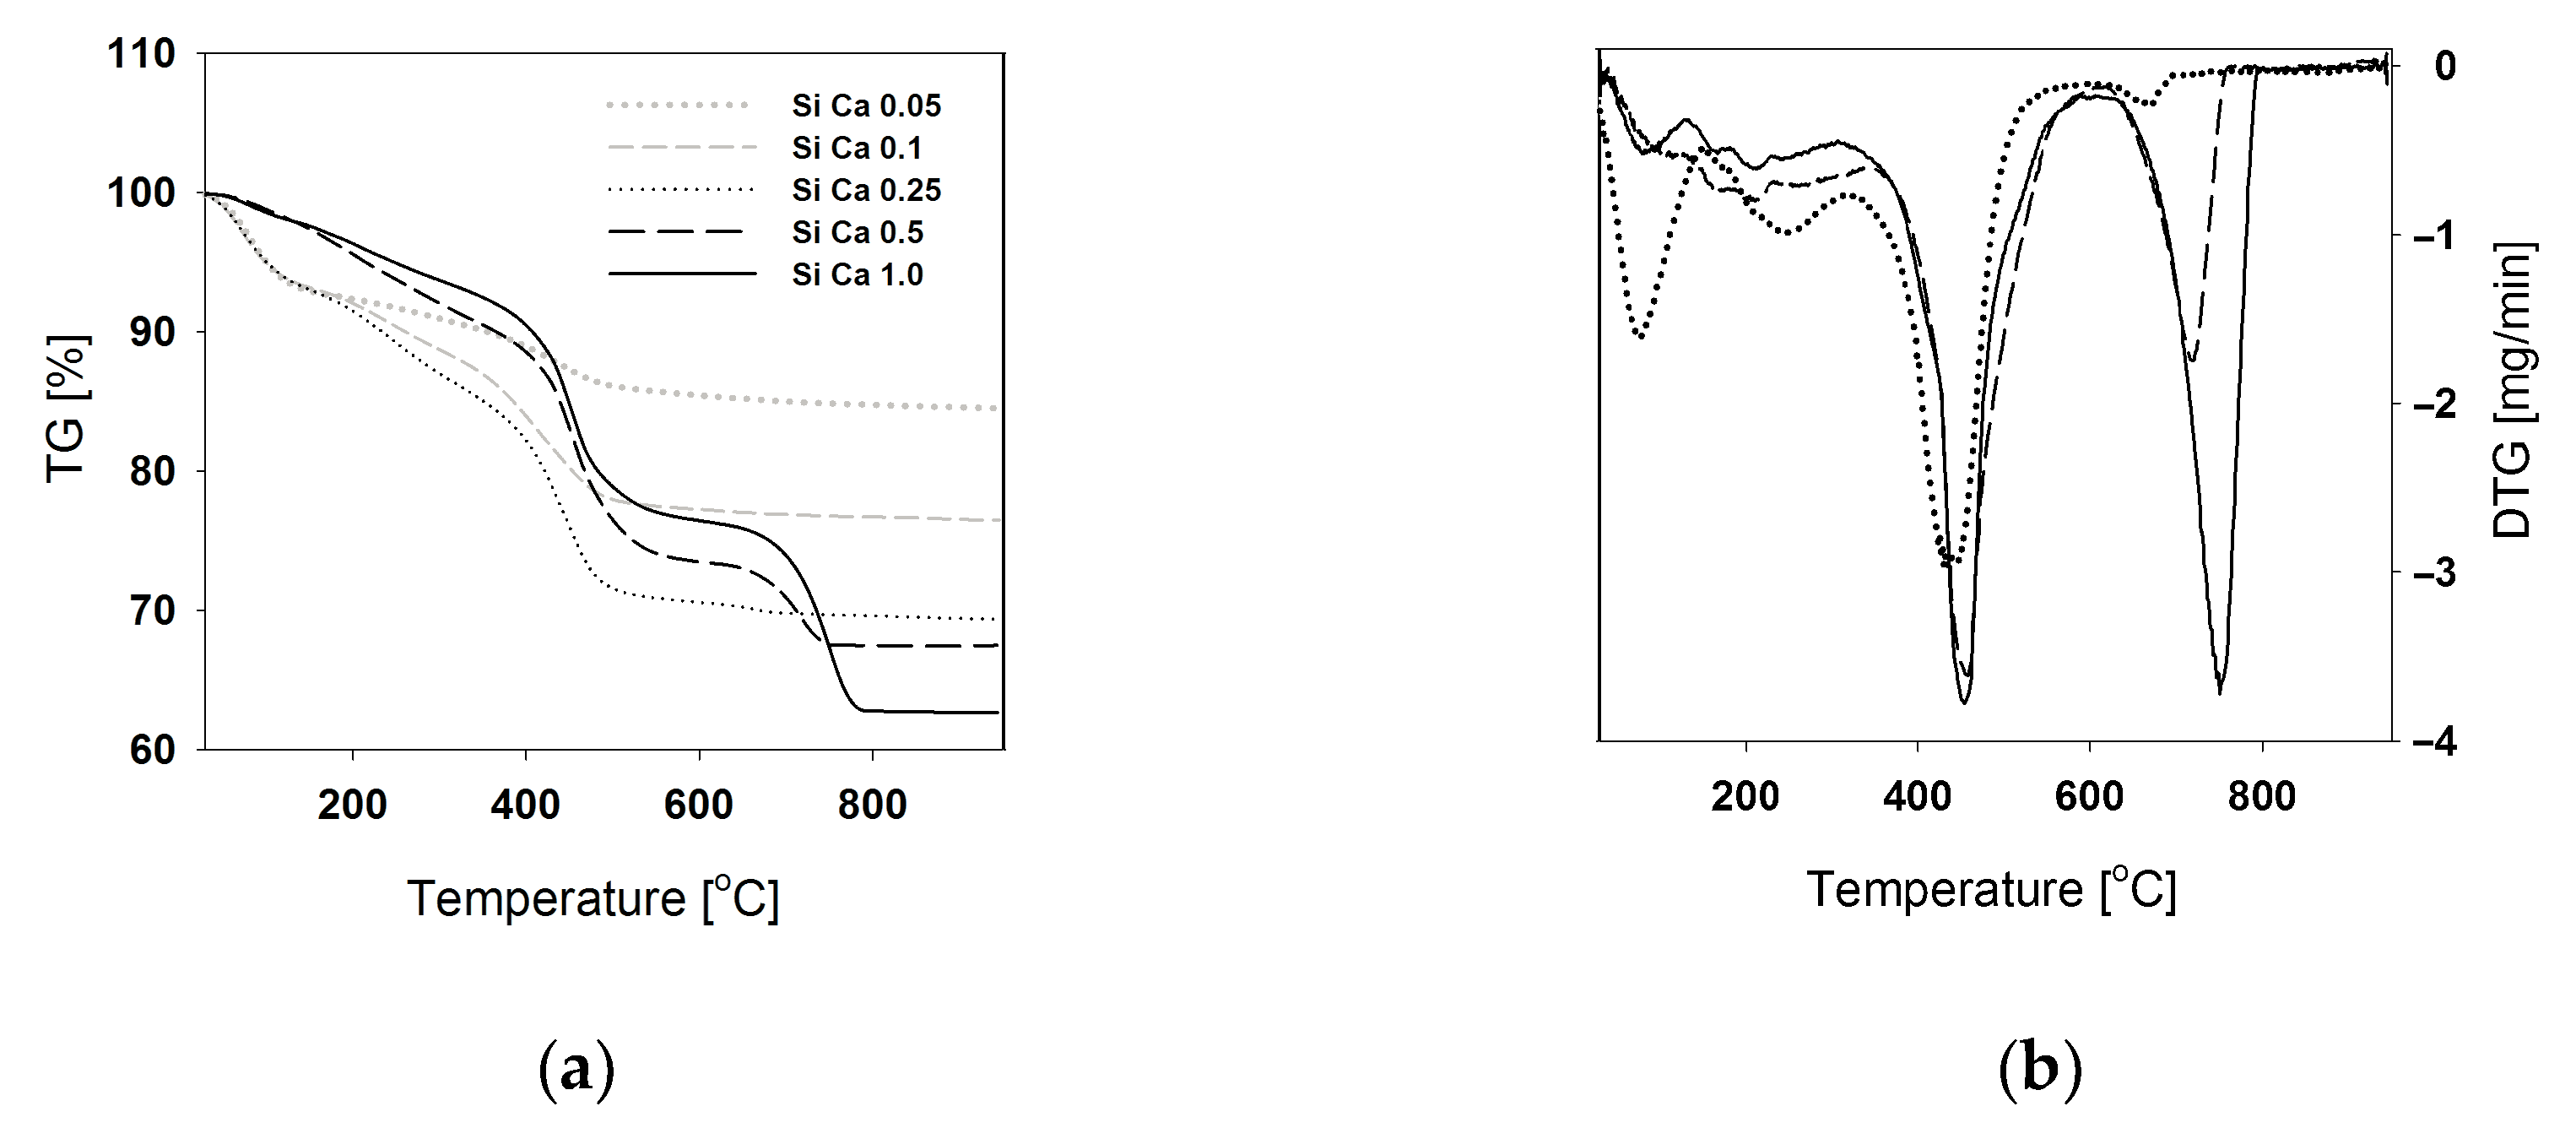
3.2. Thermal Analysis
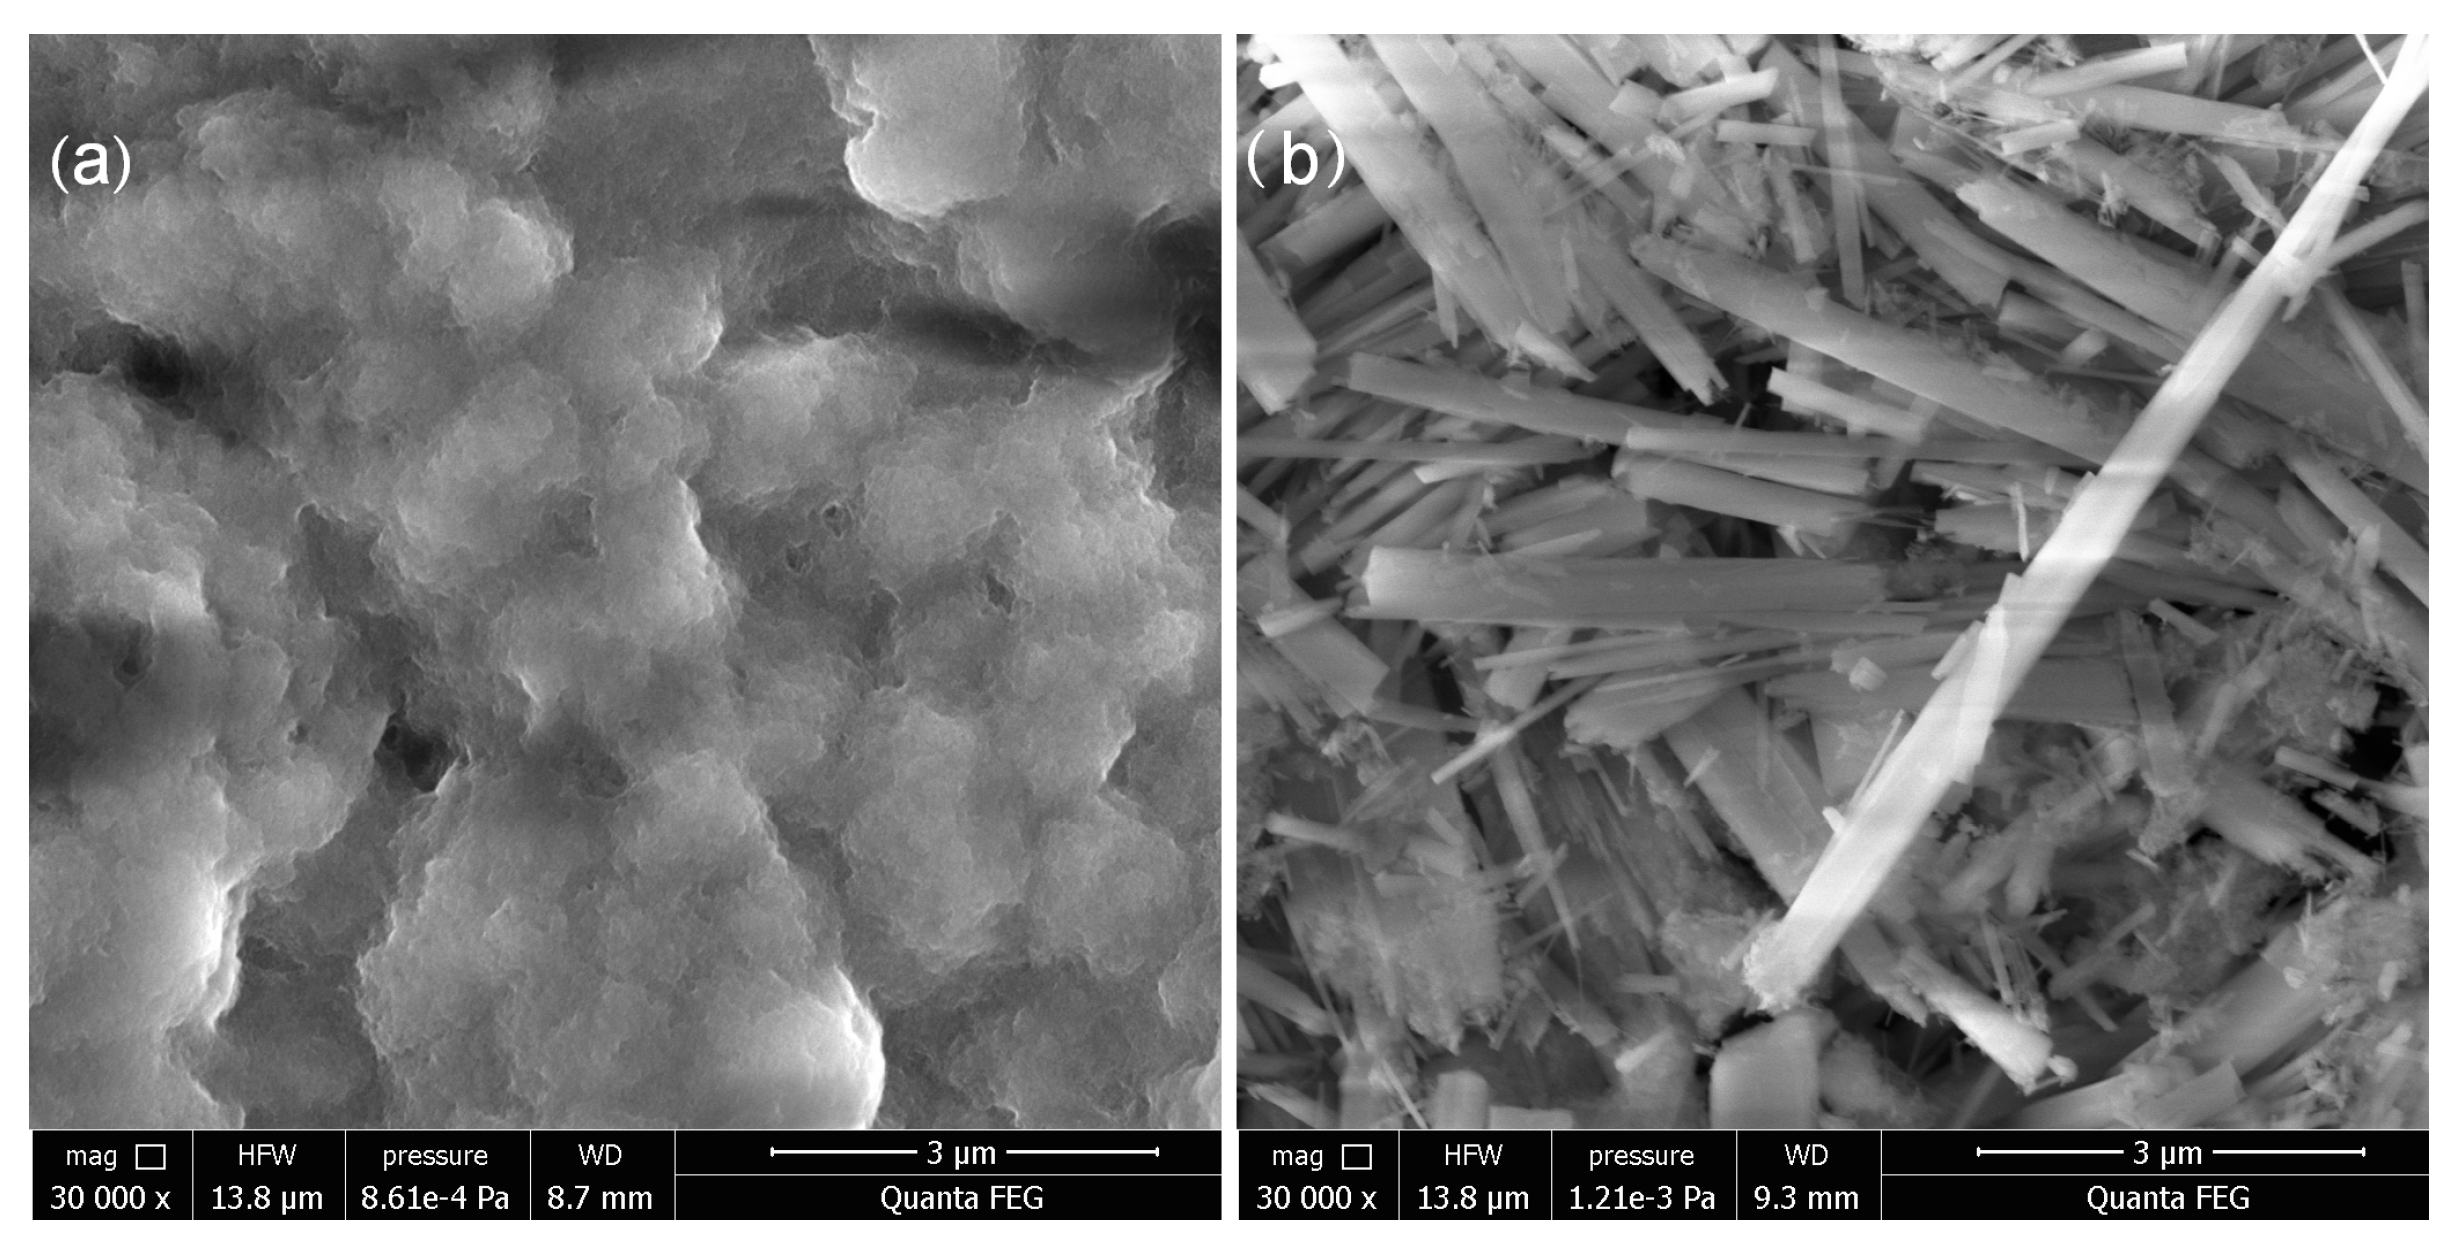
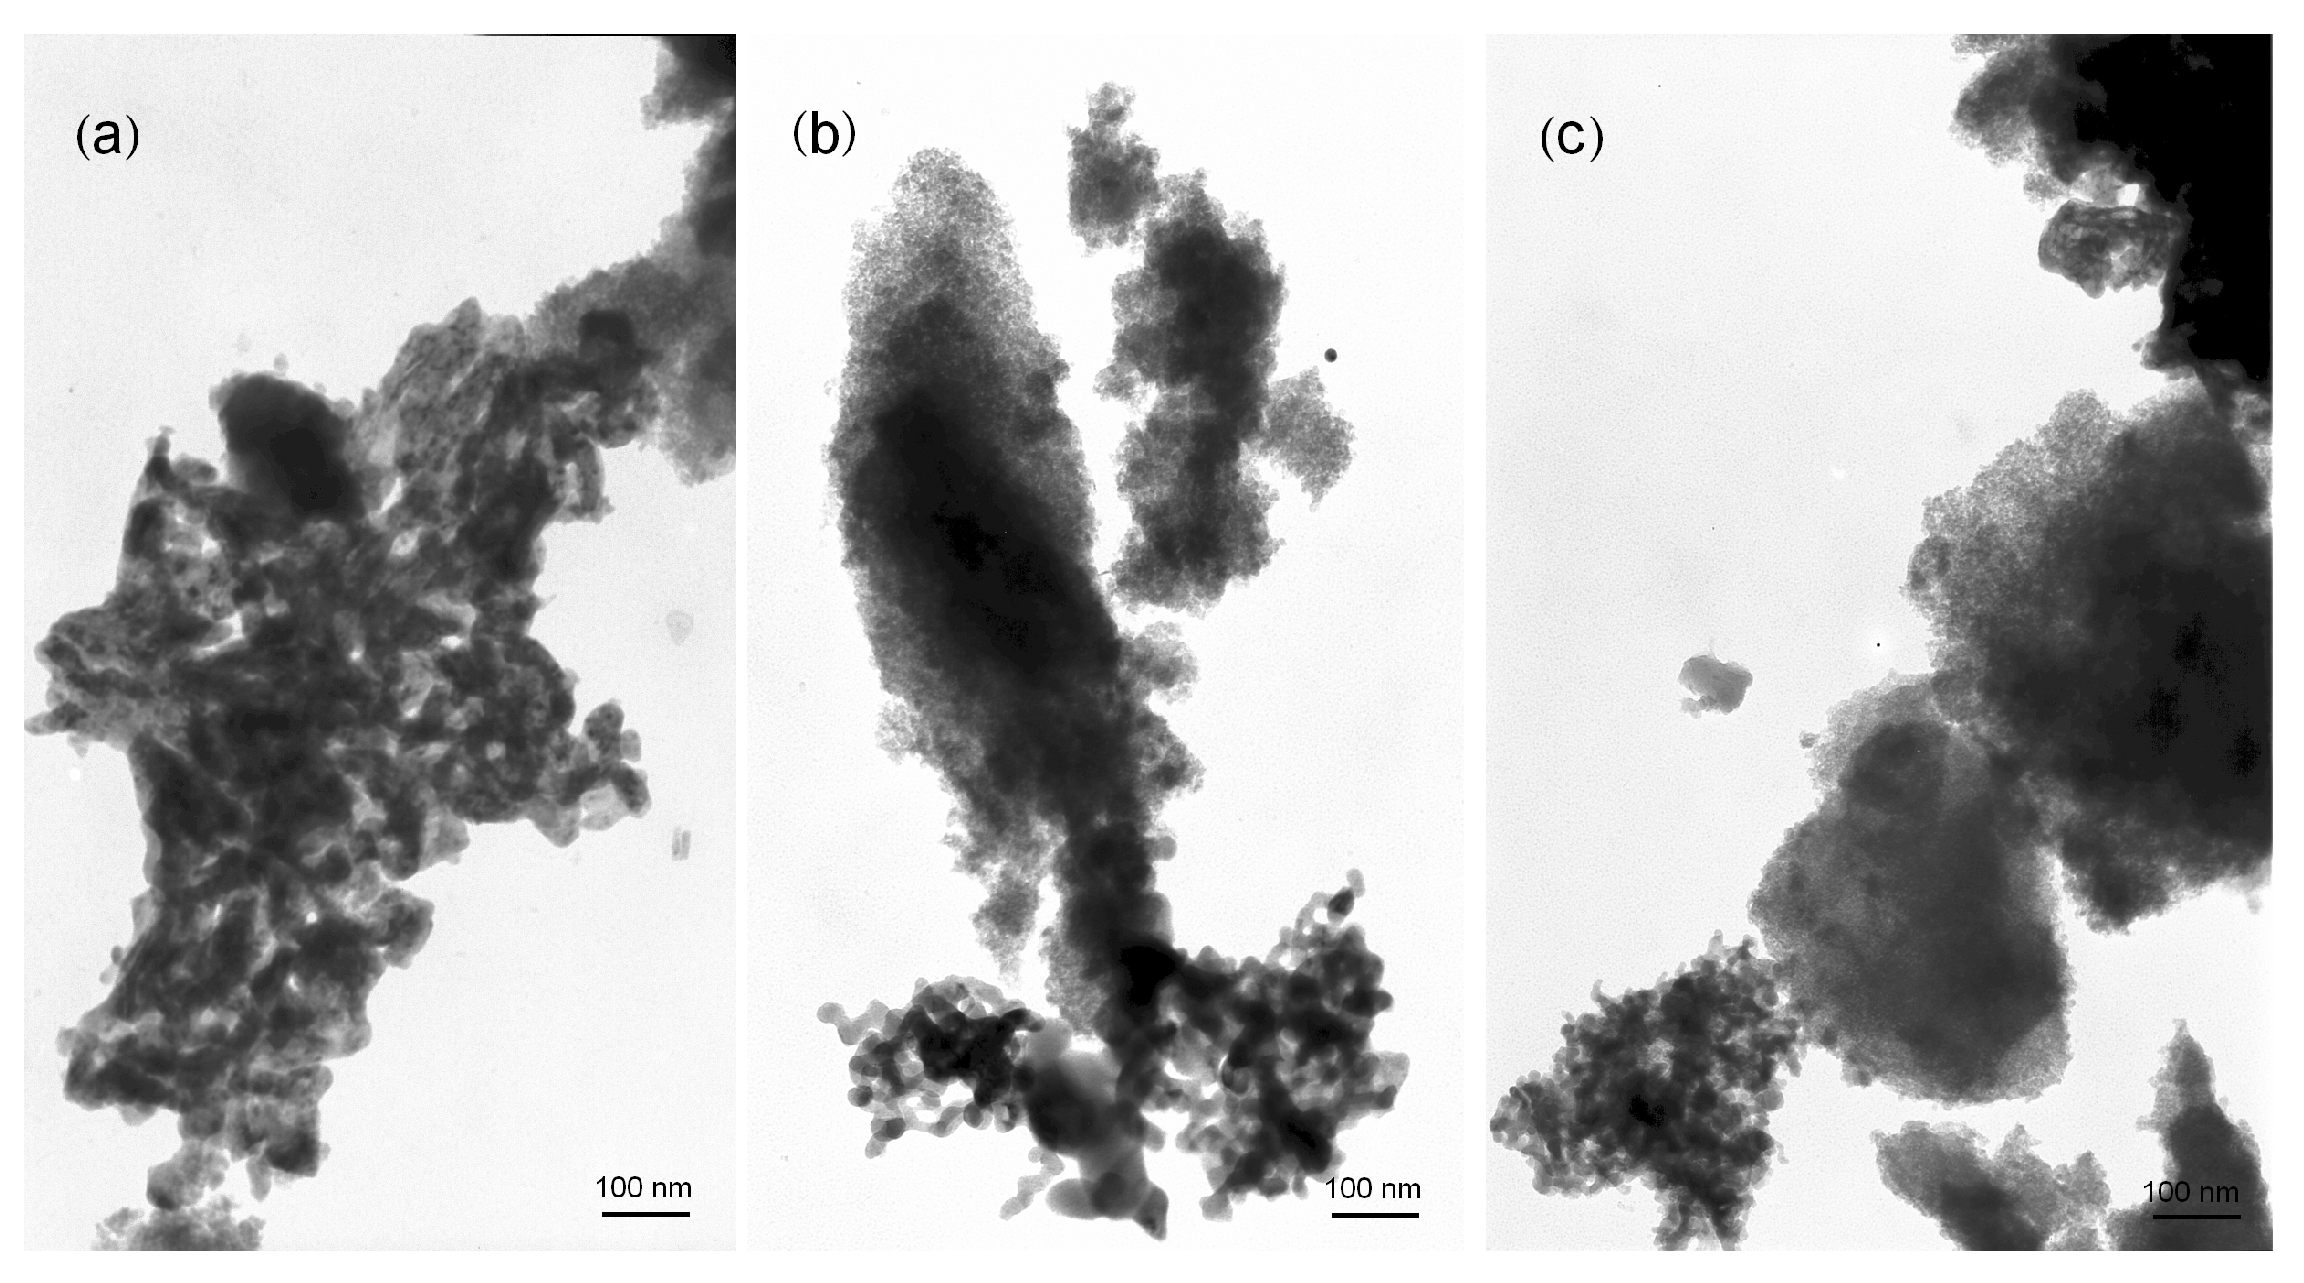
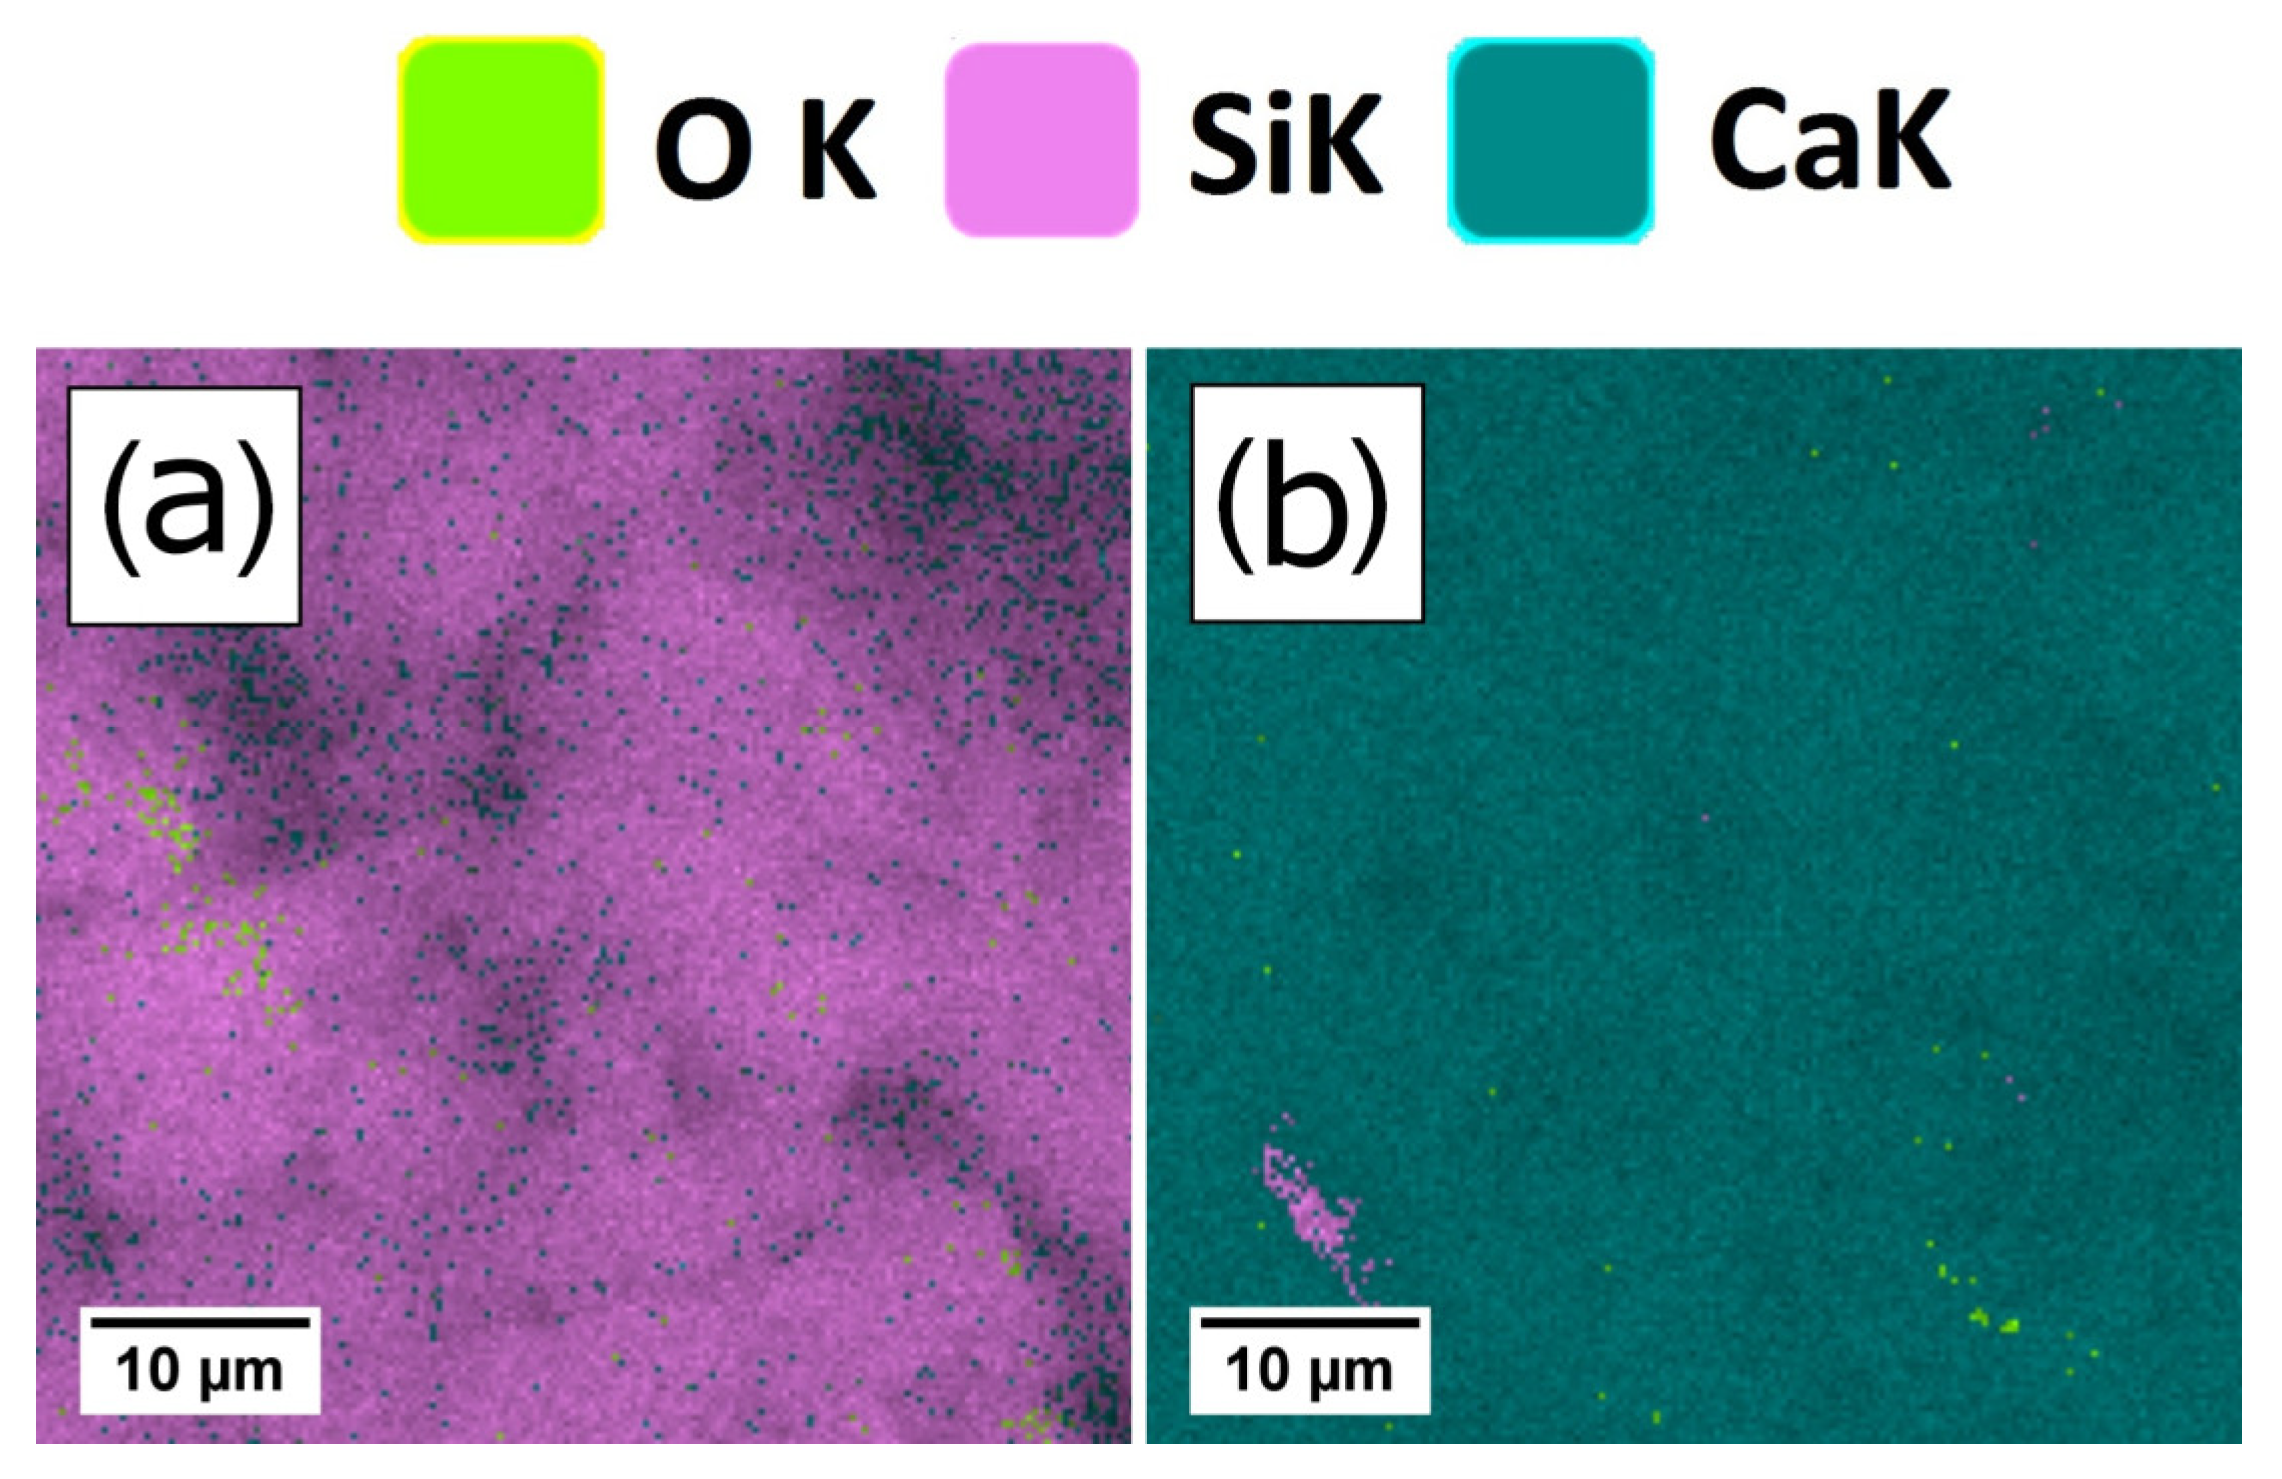
3.3. SEM, TEM and EDS Analysis
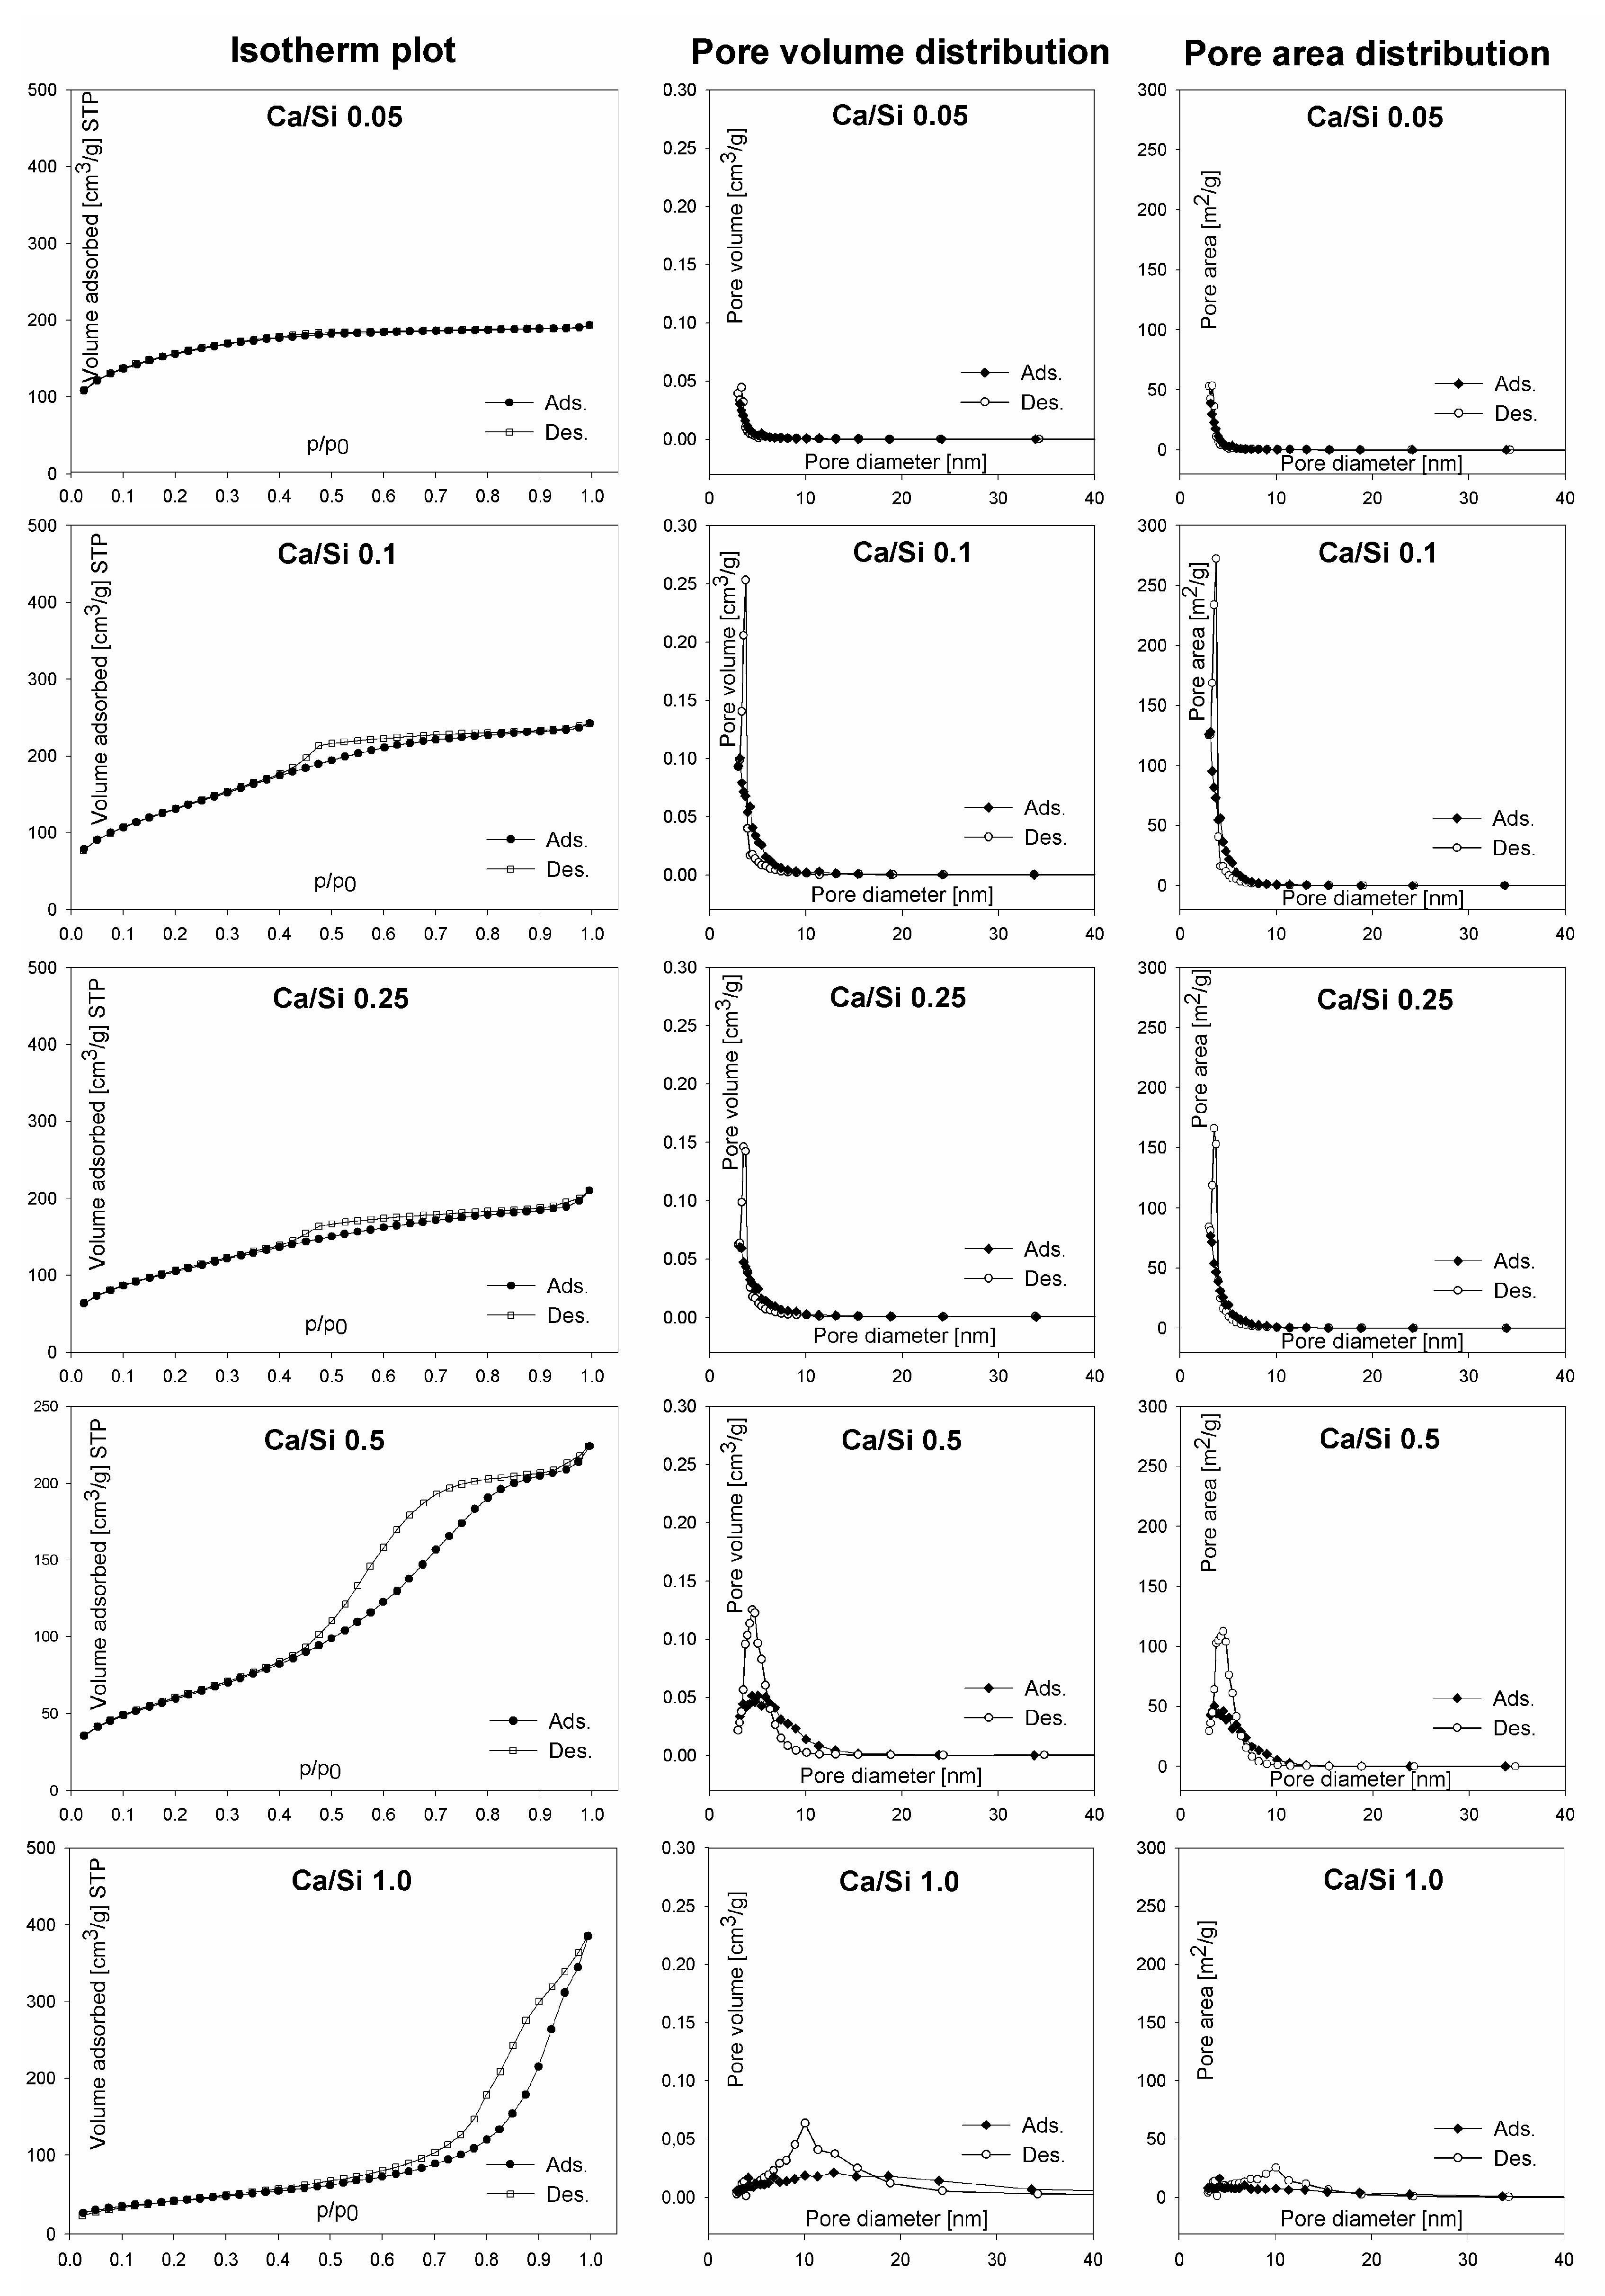
3.4. Porous Structure-Low Temperature Nitrogen Adsorption-Desorption
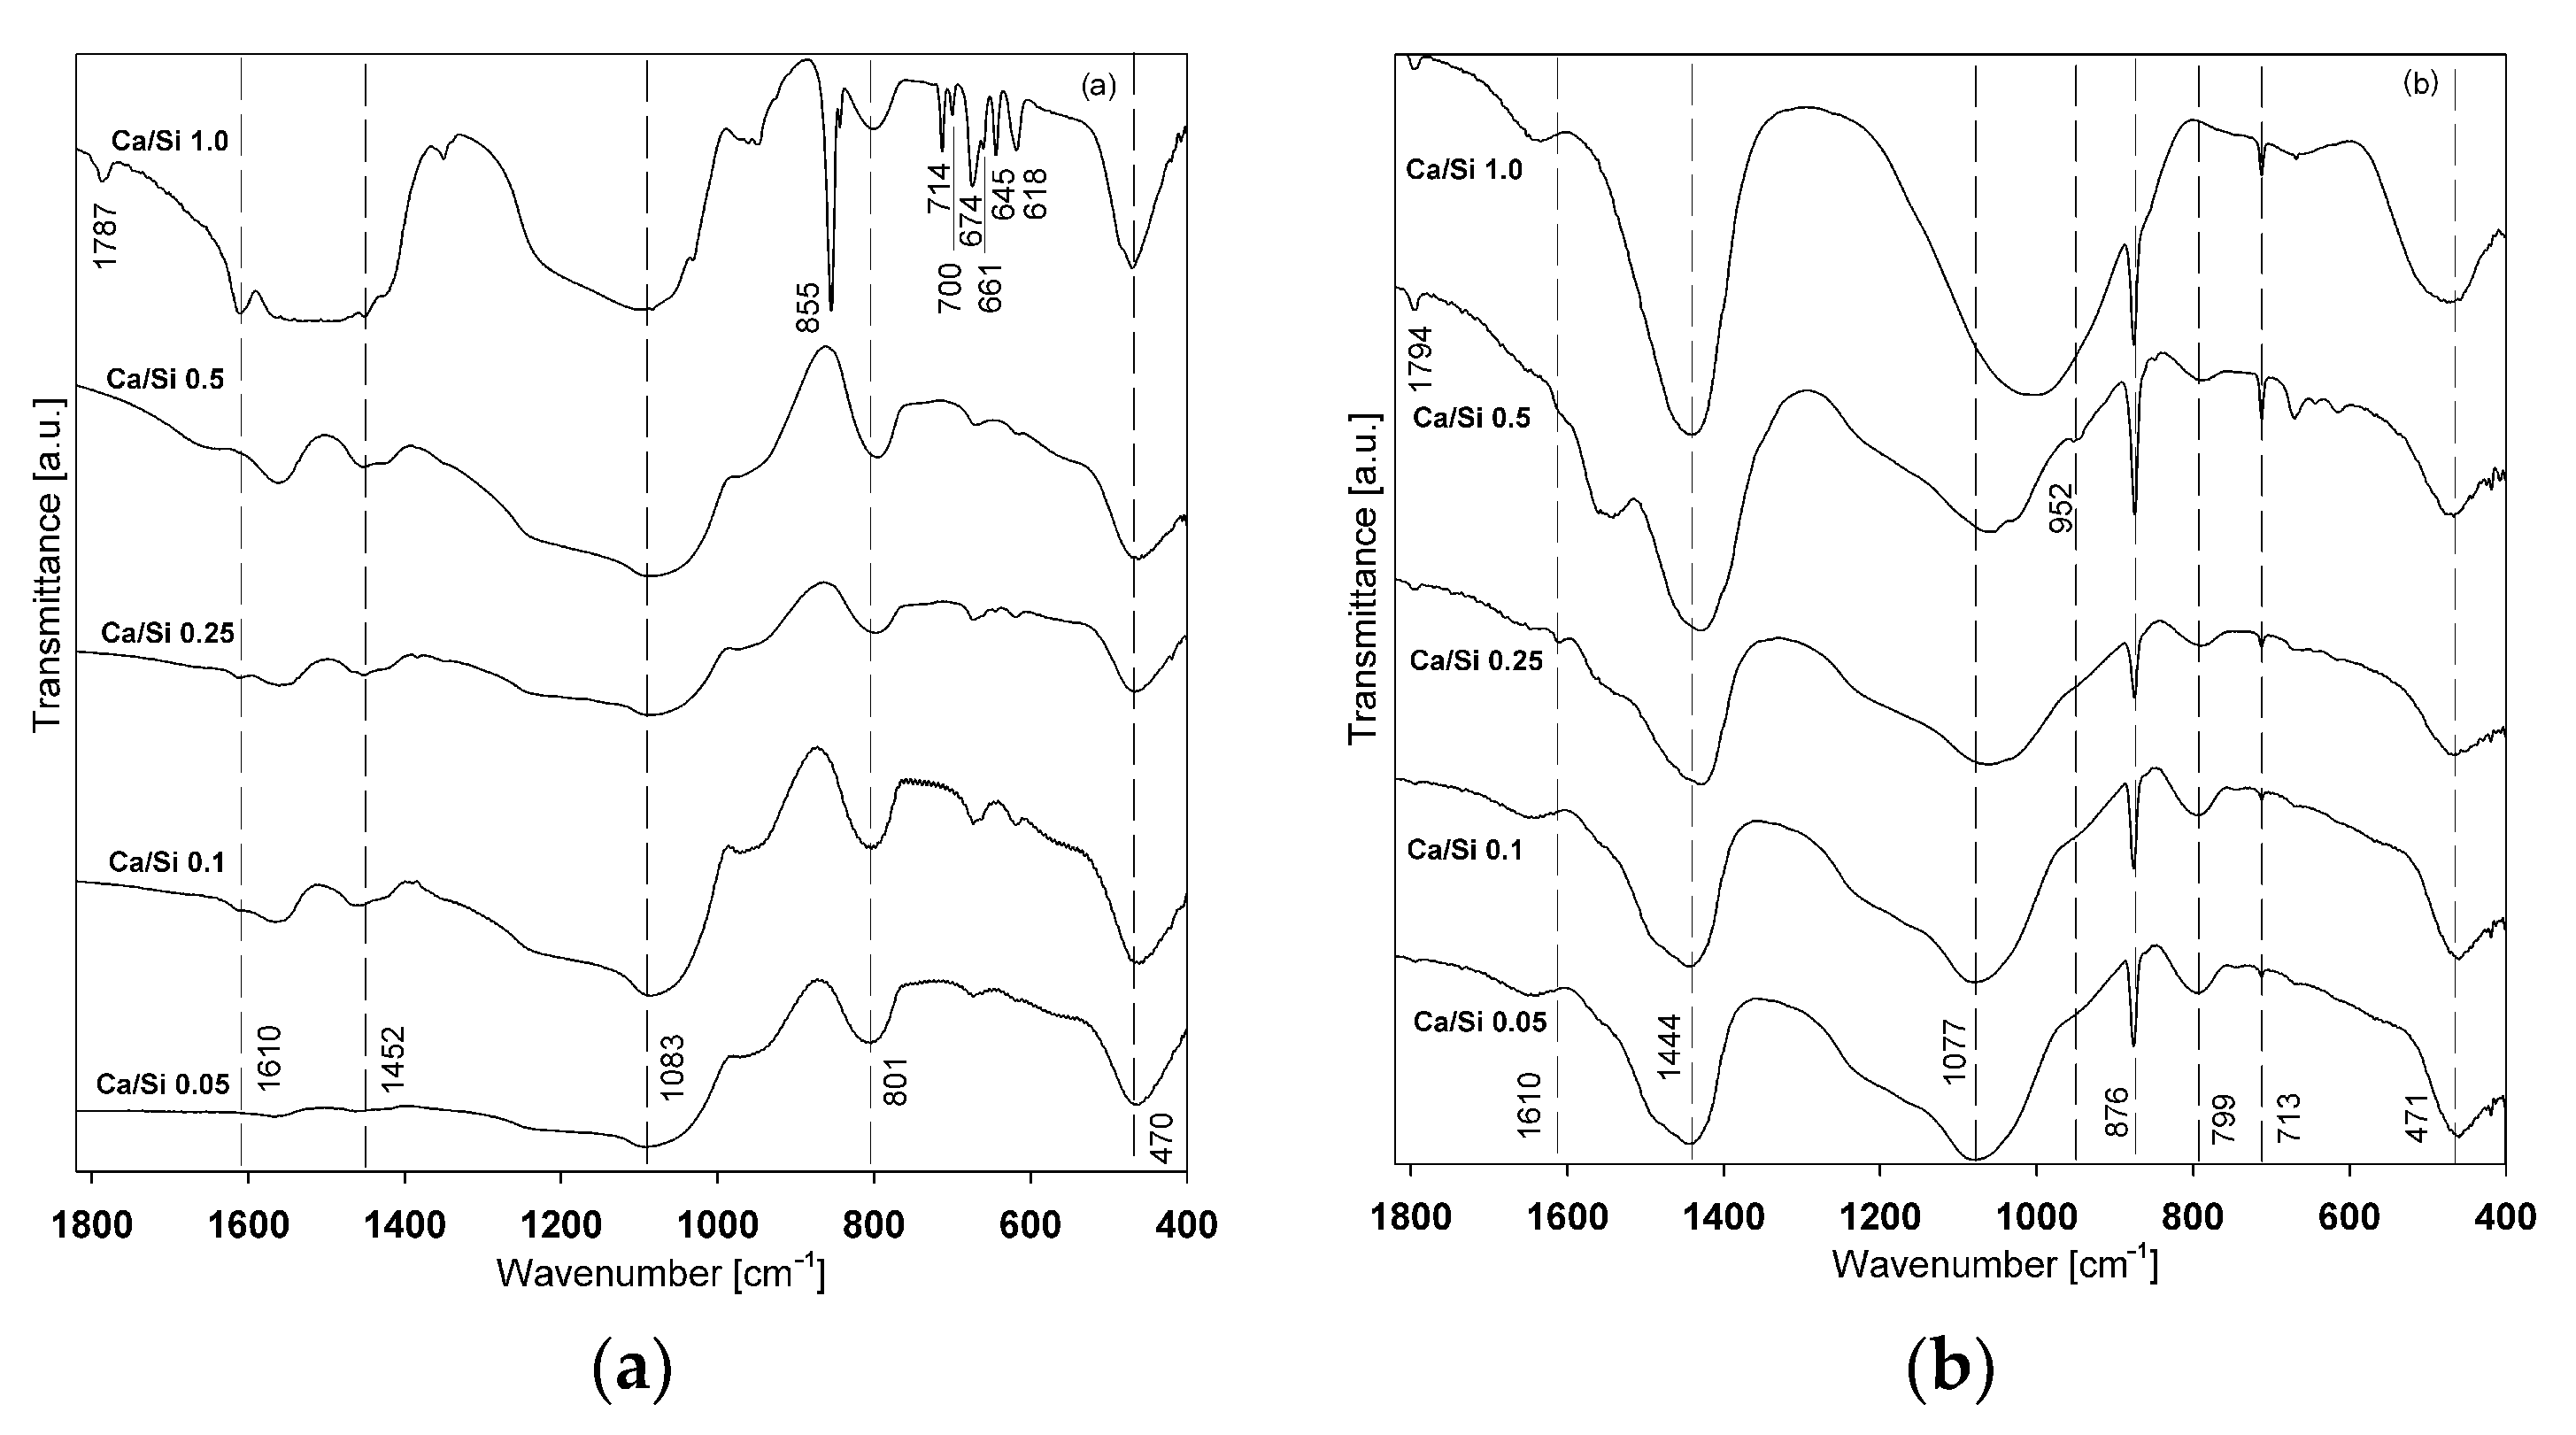
3.5. FTIR Measurement
4. Conclusions
Author Contributions
Funding
Institutional Review Board Statement
Informed Consent Statement
Data Availability Statement
Conflicts of Interest
References
- Schmetterer, C.; Masset, P.J. Heat capacity of compounds in the CaO-SiO2 system—A review. J. Phase Equilib. Diffus. 2012, 33, 261–275. [Google Scholar] [CrossRef]
- Moradi, G.; Mohadesi, M.; Hojabri, Z. Biodiesel production by CaO-SiO2 catalyst synthesized by the sol–gel process. React. Kinet. Mech. Catal. 2014, 113, 169–186. [Google Scholar] [CrossRef]
- Matsuhashi, H.; Kawamura, A. Preparation of a novel solid base catalyst of CaO covered with SiO2. Catal. Today 2012, 185, 236–240. [Google Scholar] [CrossRef]
- Ebisawa, Y.; Kokubo, T.; Ohura, K.; Yamamuro, T. Bioactivity of CaO-SiO2 based glasses in vitro evaluation. J. Mater. Sci. Mater. Med. 1990, 1, 239–244. [Google Scholar] [CrossRef]
- Li, P.; Ohtsuki, C.; Kokubo, T.; Nakanishi, K.; Soga, N.; Nakamura, T.; Yamamuro, T. Apatite formation induced by silica gel in a simulated body fluid. J. Am. Ceram. Soc. 1992, 75, 2094–2097. [Google Scholar] [CrossRef]
- Hench, L.L. Sol-gel materials for bioceramics application. Curr. Opin. Solid State Mater. Sci. 1997, 2, 604–610. [Google Scholar] [CrossRef]
- Vallet–Regi, M.; Romero, A.M.; Ragel, C.V.; LeGeros, R.Z. XRD, SEM-EDS, and FTIR studies of in vitro growth of an apatite-like layer on sol-gel glasses. J. Biomed. Mater. Res. Part A 1999, 44, 416–421. [Google Scholar] [CrossRef]
- Ungureanu, D.N.; Angelescu, N.; Avram, D.; Catangiu, A.; Bratu, V.; Stoian, E.V. Synthesis, characterization and in vitro bioactivity of SiO2–CaO–P2O5 sol–gel glasses highlighted by XRD technique. Sci. Bull. Valahia Univ. Mater. Mech. 2011, 6, 115–119. [Google Scholar]
- Zhao, M.; Yang, X.; Church, T.L.; Harris, A.T. Novel CaO-SiO2 sorbent paceitcellulose. Environ. Sci. Technol. 2012, 46, 2976–2983. [Google Scholar] [CrossRef]
- Yang, R.X.; Chuang, K.H.; Wey, M.Y. Hydrogen production through methanol steam reforming: Effect of synthesis parameters on Ni-Cu/CaO-SiO2 catalysts activity. Int. J. Hydrogen Energy 2014, 39, 19494–19501. [Google Scholar] [CrossRef]
- Papynov, E.; Shichalin, O.; Apanasevich, V.; Portnyagin, A.; Mayorov, V.; Buravlev, I.; Merkulov, E.; Kaidalova, T.; Modin, E.; Afonin, I.; et al. Sol-gel (template) synthesis of osteoplastic CaSiO3/HAp powder biocomposite: “in vitro” and “in vivo” biocompatibility assessment. Powder Technol. 2020, 367, 762–773. [Google Scholar] [CrossRef]
- Papynov, E.; Shichalin, O.; Modin, E.; Mayorov, V.; Portnyagin, A.; Kobylyakov, S.; Golub, A.; Medkov, M.; Tananaev, I.; Avramenko, V. Wollastonite ceramics with bimodal porous structures prepared by sol–gel and SPS techniques. RSC Adv. 2016, 6, 34066–34073. [Google Scholar] [CrossRef]
- Vichaphund, S.; Kitiwan, M.; Atong, D.; Thavorniti, P. Microwave synthesis of wollastonite powder from eggshells. J. Eur. Ceram. Soc. 2011, 31, 2435–2440. [Google Scholar] [CrossRef]
- Papynov, E.K.; Shichalin, O.O.; Apanasevich, V.I.; Plekhova, N.G.; Buravlev, I.Y.; Zinoviev, S.V.; Mayorov, V.Y.; Fedorets, A.N.; Merkulov, E.B.; Shlyk, D.K.; et al. Synthetic nanostructured wollastonite: Composition, structure and “in vitro” biocompatibility investigation. Ceram. Int. 2021, in press. [Google Scholar] [CrossRef]
- Mei, L.; Yin, J.; Xia, Y.; Yao, D.; Liang, H.; Zuo, K.; Zeng, Y.-P. Preparation of high-strength β-CaSiO3 bioceramic with B2O3 and SiO2 sintering additives. Ceram. Int. 2020, 46, 25970–25978. [Google Scholar] [CrossRef]
- Apanasevich, V.; Papynov, E.; Plekhova, N.; Zinoviev, S.; Kotciurbii, E.; Stepanyugina, A.; Korshunova, O.; Afonin, I.; Evdokimov, I.; Shichalin, O.; et al. Morphological Characteristics of the Osteoplastic Potential of Synthetic CaSiO3/HAp Powder Biocomposite. J. Funct. Biomater. 2020, 11, 68. [Google Scholar] [CrossRef]
- Mahdy, E.A.; Ahmed, H.Y.; Farag, M.M. Combination of Na-Ca-phosphate and fluorapatite in wollastonite-diopside glass-ceramic: Degradation and biocompatibility. J. Non Cryst. Solids 2021, 566, 120888. [Google Scholar] [CrossRef]
- Sai Nikhil, P.; Ravichandran, P.T.; Divya Krishnan, K. Stabilisation and characterisation of soil using wollastonite powder. Mater. Today Proc. 2021, 40, S161–S166. [Google Scholar] [CrossRef]
- Zheng, Y.; Wang, C.; Zhou, S.; Luo, C. The self-gelation properties of calcined wollastonite powder. Constr. Build. Mater. 2021, 290, 123061. [Google Scholar] [CrossRef]
- Casas-Luna, M.; Torres-Rodríguez, J.A.; Valdés-Martínez, O.U.; Obradović, N.; Slámečka, K.; Maca, K.; Kaiser, J.; Montúfar, E.B.; Čelko, L. Robocasting of controlled porous CaSiO3-SiO2 structures: Architecture-Strength relationship and material catalytic behavior. Ceram. Int. 2020, 46, 8853–8861. [Google Scholar] [CrossRef]
- Przekop, R.E.; Marciniak, P.; Sztorch, B.; Czapik, A.; Stodolny, M.; Martyła, A. One-pot synthesis method of SiO2-La2O2CO3 and SiO2-La2O3 systems using metallic lanthanum as a precursor. J. Non Cryst. Solids 2019, 520, 119444. [Google Scholar] [CrossRef]
- Przekop, R.E.; Marciniak, P.; Sztorch, B.; Czapik, A.; Stodolny, M.; Martyła, A. New method for the synthesis of Al2O3–CaO and Al2O3–CaO–CaCO3 systems from a metallic precursor by the sol–gel route. J. Aust. Ceram. Soc. 2018, 54, 679–690. [Google Scholar] [CrossRef] [Green Version]
- Kosmulski, M. pH-dependent surface charging and points of zero charge. IV. Update and new approach. J. Colloid Interface Sci. 2009, 337, 439–448. [Google Scholar] [CrossRef]
- Musumeci, A.W.; Frost, R.L.; Waclawik, E.R. A spectroscopic study of the mineral paceite (calcium acetate). Spectrochim. Acta Part A 2007, 67, 649–661. [Google Scholar] [CrossRef] [PubMed] [Green Version]
- García, J.; López, T.; Álvarez, M.; Aguilar, D.H.; Quintana, P. Spectroscopic, structural and textural properties of CaO and CaO–SiO2 materials synthesized by sol–gel with different acid catalysts. J. Non Cryst. Solids 2008, 354, 729–732. [Google Scholar] [CrossRef]
- Commissariat à l’énergie atomique et aux énergies alternatives, L’Institut Rayonnement-Matière de Saclay, What is measured in a Small Angle X-ray Scattering (SAXS)? Available online: http://iramis.cea.fr/Phocea/Vie_des_labos/Ast/ast_sstechnique.php?id_ast=1065 (accessed on 5 November 2018).
- Meiszterics, A.; Rosta, L.; Peterlik, H.; Rohonczy, J.; Kubuki, S.; Henits, P.; Sinko, K. Structural Characterization of Gel-Derived Calcium Silicate Systems. J. Phys. Chem. A 2010, 114, 10403–10411. [Google Scholar] [CrossRef] [PubMed]
- Vazquez, N.I.; Gonzalez, Z.; Ferrari, B.; Castro, Y. Synthesis of mesoporous silica nanoparticles by sol-gel as nanocontainer for future drug delivery applications. Bol. Soc. Esp. Cerám. Vidr. 2017, 56, 139–145. [Google Scholar] [CrossRef]
- Thommes, M.; Kaneko, K.; Neimark, A.V.; Olivier, J.P.; Rodriguez-Reinoso, F.; Rouquerol, J.; Sing, K.S.W. Physisorption of gases, with special reference to the evaluation of surface area and pore size distribution (IUPAC Technical Report). Pure Appl. Chem. 2015, 87, 1051–1069. [Google Scholar] [CrossRef] [Green Version]
- Pappas, G.S.; Liatsi, P.; Kartsonakis, I.A.; Danilidis, I.; Kordas, G. Synthesis and characterization of new SiO2–CaO hollow nanospheres by sol–gel method: Bioactivity of the new system. J. Non Cryst. Solids 2008, 354, 755–760. [Google Scholar] [CrossRef]
- Kalinkin, A.M.; Kalinkina, E.V.; Zalkind, O.A.; Makarova, T.I. Chemical Interaction of Calcium Oxide and Calcium Hydroxide with CO2 during Mechanical Activation. Inorg. Mater. 2005, 41, 1073–1079. [Google Scholar] [CrossRef]


| Sample Name | SiO2 | Ca/Si 0.05 | Ca/Si 0.1 | Ca/Si 0.25 | Ca/Si 0.5 | Ca/Si 1.0 |
|---|---|---|---|---|---|---|
| Relative molar amount of Si | 1 | 1 | 1 | 1 | 1 | 1 |
| Relative molar amount of Ca | 0 | 0.05 | 0.10 | 0.25 | 0.50 | 1 |
| Mass of added Ca [g] | 0 | 0.904 | 1.808 | 4.520 | 9.040 | 18.085 |
| System Composition | pH |
|---|---|
| SiO2 | 3.11 |
| Ca/Si 0.05 | 3.51 |
| Ca/Si 0.1 | 4.24 |
| Ca/Si 0.25 | 5.22 |
| Ca/Si 0.5 | 7.33 |
| Ca/Si 1.0 | 9.24 |
| System Composition | Ca/Si 0.05 | Ca/Si 0.1 | Ca/Si 0.25 | Ca/Si 0.5 | Ca/Si 1.0 |
|---|---|---|---|---|---|
| Temperature Range | Sample Mass Loss [%] | ||||
| I 30–300 °C | 8.2 | 11.3 | 12.9 | 7.9 | 6.3 |
| II 300–600 °C | 6.2 | 11.5 | 16.5 | 18.6 | 17.2 |
| III 600–800 °C | 0.9 | 0.5 | 1.0 | 6.0 | 13.8 |
| Maximum of effect III [°C] (thermal decomposition of CaCO3) | not observed | not observed | 667 | 727 | 750 |
| Total mass loss [%] | 15.3 | 23.3 | 30.3 | 32.5 | 37.3 |
| System Composition | Surface Area SBET [m2/g] | Average Pore Diameter DBJH [nm] | Average Pore Volume DBJH [cm3/g] |
|---|---|---|---|
| Ca/Si 0.05 | 512 | 3 | 0.04 |
| Ca/Si 0.1 | 484 | 3 | 0.20 |
| Ca/Si 0.25 | 385 | 3 | 0.17 |
| Ca/Si 0.5 | 223 | 5 | 0.32 |
| Ca/Si 1.0 | 146 | 13 | 0.59 |
Publisher’s Note: MDPI stays neutral with regard to jurisdictional claims in published maps and institutional affiliations. |
© 2021 by the authors. Licensee MDPI, Basel, Switzerland. This article is an open access article distributed under the terms and conditions of the Creative Commons Attribution (CC BY) license (https://creativecommons.org/licenses/by/4.0/).
Share and Cite
Marciniak, P.; Sztorch, B.; Martyła, A.; Czapik, A.; Stodolny, M.; Przekop, R.E. Metallic Calcium as a Precursor for Sol-Gel Synthesis of CaCO3-SiO2 and CaO-SiO2 Systems. Ceramics 2021, 4, 278-290. https://0-doi-org.brum.beds.ac.uk/10.3390/ceramics4020022
Marciniak P, Sztorch B, Martyła A, Czapik A, Stodolny M, Przekop RE. Metallic Calcium as a Precursor for Sol-Gel Synthesis of CaCO3-SiO2 and CaO-SiO2 Systems. Ceramics. 2021; 4(2):278-290. https://0-doi-org.brum.beds.ac.uk/10.3390/ceramics4020022
Chicago/Turabian StyleMarciniak, Piotr, Bogna Sztorch, Agnieszka Martyła, Agnieszka Czapik, Mikołaj Stodolny, and Robert E. Przekop. 2021. "Metallic Calcium as a Precursor for Sol-Gel Synthesis of CaCO3-SiO2 and CaO-SiO2 Systems" Ceramics 4, no. 2: 278-290. https://0-doi-org.brum.beds.ac.uk/10.3390/ceramics4020022