Article

Enhancing the Photocatalytic Activity of TiO2/Na2Ti6O13 Composites by Gold for the Photodegradation of Phenol

by
Muhamad Diki Permana
1,
Atiek Rostika Noviyanti
1,
Putri Rizka Lestari
2,
Nobuhiro Kumada
2,
Diana Rakhmawaty Eddy
1,* and
Iman Rahayu
1
1
Department of Chemistry, Faculty of Mathematics and Sciences, Universitas Padjadjaran, Jl. Raya Bandung-Sumedang km. 21 Jatinangor, Sumedang 45363, Indonesia
2
Center for Crystal Science and Technology, University of Yamanashi, Kofu 400-8511, Yamanashi, Japan
*
Author to whom correspondence should be addressed.
Submission received: 31 July 2022 / Revised: 1 September 2022 / Accepted: 5 September 2022 / Published: 8 September 2022
(This article belongs to the Special Issue Photocatalytic Degradation of Organic Wastes)

Abstract

:
This study aims to synthesize Au/TiO2/Na2Ti6O13 composites to reduce the occurrence of recombination and increase photocatalytic activity in phenol degradation. Gold was used due to its high stability and strong surface plasmon resonance (SPR) properties which make it operate effectively in the visible light spectrum. The prepared composites were characterized using XRD, SEM, TEM, FTIR, and DRS. The results showed that the composite consisted of rutile TiO2 with a crystal size of 38–40 nm and Na2Ti6O13 with a crystal size of 25 nm. The gold in the composite has a crystallite size of 16–19 nm along with the percentage of gold added. Morphological analysis shows that the composite has the form of inhomogeneous spherical particles with gold spread among composites with sizes less than 20 nm. FTIR analysis showed the presence of Na–O and Ti–O–Ti bonds in the composite. The best composite was 3% Au/TiO2/Na2Ti6O13 which had high crystallinity, small particle size, and bandgap energy of 2.59 eV. Furthermore, it had an efficiency 205% better than without gold. After that, cost estimation is proposed as a large-scale application. This study describes the total cost, break-even analysis, and payback analysis for the commercialization needs of the designed photocatalytic catalyst.

1. Introduction

Water is the most essential natural resource; humans need clean water for survival. However, water pollution caused by human activities such as household and industrial waste can damage water quality. This pollution of water has a negative impact on both health and environmental factors [1,2]. Among the most dangerous contaminants originating from industrial, agricultural, and household wastes are toxic organic compounds, such as phenol. Phenol can destroy the ecological balance of water and is widely used in industry and daily life [3,4,5,6].
Photocatalysis is one of the most widely used methods and has developed into a promising idea to utilize light energy sources because it has the advantages of high degradation efficiency, low-cost, and being environmentally friendly [7,8,9,10]. Photocatalysis is proven to be able to effectively remove organic pollutants from wastewater with various types of metal oxide such as TiO2 and ZnO [11,12,13]. In the photocatalytic oxidation process, organic pollutants are degraded in the presence of a semiconductor photocatalyst, a light source, and an oxidizing agent such as oxygen or air [14]. In addition, the preparation of photocatalysts that is effectively responsive under light irradiation is an emerging topic [15].
Titanium dioxide (TiO2) is an excellent photocatalyst with wide application in various fields [16]. Due to its several advantages, such as high stability and relatively low price, it has become a promising material for various photocatalytic applications [17]. However, the photoactivity of TiO2 has a disadvantage; namely, it only absorbs a small part of the solar spectrum [18]. Lee et al. stated that TiO2 has limited photocatalytic efficiency due to its wide energy bandgap of 3.2 eV, which is a drawback for its use in photocatalysis [19]. Subsequently, a single photocatalytic material cannot absorb light in a broad spectrum due to the occurrence of a hole (h+)/electron (e) recombination which limits the catalytic efficiency [20].
Related materials such as the alkali metal titanate with the general formula A2TinO2n+1 (n = 6, 7, 8) exhibit a structure consisting of a 3D octahedral arrangement of TiO6 connected by corners and edges to form a zigzag structure [21]. Sodium hexatitanate (Na2Ti6O13), and octatitanate (Na2Ti8O17) have excellent applications such as for ion exchange [22], photocatalysis [23,24], and sensors [25]. Sodium hexatitanate exhibits good chemical stability qualities; hence, its layered crystal structure has various technological applications [26]. Na2Ti6O13 has been studied for various photocatalytic purposes such as hydrogen generation [27], dye degradation [28], chlorophenols [23,29], and acetaldehyde [30]. Its unique structure has several advantages that allow for increased unidirectional electron flow and charges transport to the material surface. In addition, the presence of a long axis is suitable for modification with different co-catalysts [31]. The compound Na2Ti6O13 has been modified with various co-catalysts including Ag [32], Au [33], TiO2 [23], poly(o-methoxyaniline) (POMA) [34], RuO2 [35], CuO, and Cu2O to improve reaction performance [31]. However, there are only a few reports for the photocatalysis of phenol degradation.
Torres-Martínez et al. synthesized Na2Ti6O13 with indium using the sol-gel method followed by annealing at 700 °C [29]. In-Na2Ti6O13 was used for the photodecomposition of 2,4-dichlorophenoxyacetic acid using ultraviolet light (254 nm). The role of the dispersed indium oxide is related to the reduction in the electron–hole recombination rate on the titanate surface. Jian et al. also synthesized Na2Ti6O13/TiO2 and the photocatalytic properties were evaluated by degradation of 2,4-dichlorophenol [23]. The results showed that the synthesized Na2Ti6O13/TiO2 had better photocatalytic activity than TiO2 P25, and the degradation rate of 2,4-dichlorophenol with an initial concentration of 0.02 g/L reached 99.4% after 50 min; hence, phenol can be degraded using sodium hexatitanate with suitable co-catalysts.
Although the Na2Ti6O13/TiO2 composite showed good results in photocatalytic activity [23], this material still has a weakness, including a large bandgap value which can only work in UV light. Meanwhile, gold has been used as a composite of TiO2 to enhance photocatalytic ability [36]. It exhibits strong localized surface plasmon resonance (LSPR); hence, it can be used effectively in the visible light spectrum. Additionally, gold acts as an electron trap to promote electron–hole separation [37]. Grover et al. synthesized sodium titanate with 0.5% Au as a photocatalyst for the insecticide imidacloprid [33]. The results showed that the composite produced showed good photocatalytic activity with the reaction constant being 8.9 × 10⁻³ min−1.
However, although several studies have succeeded in synthesizing various Au/TiO2 composites, the degradation efficiency of organic compounds still needs to be improved as previous studies only focused on two types of composites. In addition, there has been no report showing combined gold material with TiO2/Na2Ti6O13 (NTO) composites. Thus, in this study, Au/TiO2/NTO composite materials were tested as photocatalysts for phenol degradation which had not been previously reported. The TiO2/NTO composite was synthesized using the sol-gel method, while TiO2/NTO was composited with various gold concentrations. The synthesized results were then characterized using X-ray diffraction (XRD), scanning electron microscope (SEM), Fourier-transform infrared spectroscopy (FTIR), and UV-vis spectroscopy. The Au/TiO2/NTO composite was synthesized in order to degrade phenol in the presence of visible light. Visible light has the advantage that it can be obtained from sunlight with a higher intensity than UV light. In addition, this study also used a multiphase composite TiO2/NTO which has the ability to promote electron–hole separation, thereby increasing the photocatalytic activity of the material. This implies that the synthesis of photocatalysts with multiphase structure and high degradation efficiency is needed. In this study, we also evaluate the large-scale economies of this process for industrial applications. Total cost, break-even analysis, and payback analysis were calculated to evaluate the commercial applicability of the proposed photocatalytic treatment system.

2. Materials and Methods

2.1. Materials

The materials used in this study were distilled water, hydrochloric acid (HCl, 37%, Sigma Aldrich, St. Louis, MO, USA), chloroauric acid (HAuCl4, Sigma Aldrich, St. Louis, MO, USA), ethanol (C2H5OH, 99%, Merck, Kenilworth, NJ, USA), phenol (C6H5OH, Merck, Kenilworth, NJ, USA), hydroxypropyl cellulose (HPC, 99%, Sigma Aldrich, St. Louis, MO, USA), sodium borohydride (NaBH4, 99%, Merck, Kenilworth, NJ, USA), sodium hydroxide (NaOH, 99%, Merck, Kenilworth, NJ, USA), TiO2 nanoparticles (P25, 20% rutile and 80% anatase), and tetraisopropyl orthotitanate (TTIP, Ti(OC3H7)4, 99%, Sigma Aldrich, St. Louis, MO, USA). All ingredients were used without prior treatment.

2.2. Synthesis of TiO2/Na2Ti6O13 Composite

A total of 0.2 g hydroxypropyl cellulose (HPC), 95 mL ethanol, and 0.48 mL distilled water were dispersed and stirred for 30 min. Next, 2.0 mL of TiO2 precursor TTIP in 18 mL of ethanol was injected into the mixture at a speed of 0.5 mL/min using a syringe pump, then the temperature was raised to 85 °C under reflux conditions at a stirring speed of 900 rpm for 100 min. The precipitate was centrifuged, washed with ethanol, and redispersed in 20 mL of distilled water. A total of 4 mL of 2.5 M NaOH solution was added and stirred for 6 h at room temperature. The TiO2 formed was separated by centrifugation, washed with distilled water and ethanol, then dried in a vacuum. Furthermore, the sample was dispersed in distilled water (150 mg in 10 mL of distilled water), mixed with 1 M HCl solution, and stirred for 30 min. The precipitate formed was isolated by centrifugation, washed with distilled water and ethanol, dried in a vacuum, and calcined at 800 °C for 2 h in air to obtain a crystal composite of TiO2/Na2Ti6O13.

2.3. Synthesis of Au/TiO2/Na2Ti6O13 Composites

A total of 0.8 g TiO2/Na2Ti6O13 was dispersed in 10 mL of distilled water, then the mixture was ultrasonicated for 10 min and stirred for 1 h. A total of 2.03, 4.06, and 6.09 mL of 20 mM HAuCl4 was added for 1, 2, and 3% (wt%) variations of Au/TiO2/Na2Ti6O13 and stirred for 1 h. Subsequently, 10 mM NaBH4 in cold distilled water was added to the solution until the color formed did not change anymore. The mixture was stirred for 3 h, then centrifuged to separate the precipitate. The product was washed in water with ethanol, and then dried in a vacuum oven. The prepared synthesis process for Au/TiO2/NTO crystals is shown in Figure 1.

2.4. Characterization of Catalyst

X-ray diffraction (XRD, Rigaku/MiniFlex 600, Tokyo, Japan) characterization was carried out to identify the synthesized composite crystals. The measurements were carried out at room temperature using Cu Kα radiation (λ = 1.5418) with scans performed in the range of 20–80° (2θ). Vesta software was used to draw the structural illustration. The crystallinity of the sample was calculated by comparing the peaks of the crystalline phase with the total consisting of crystal and amorphous peaks using the software OriginPro 8.5.1 SR2 [38]. The percent crystallinity was determined with Equation (1).
Crystallinity (%) = [Ac/(Ac + Aa)] × 100%
where Ac is the peak area of the crystalline phase and Aa is the area of the amorphous peak, then the crystal size was calculated using the Debye–Scherrer equation. The calculated crystal size is the average of each phase peak in the XRD pattern and was calculated with the standard deviation. The crystal size of the sample was calculated with Equation (2) [39].
D = (Kλ)/(Bcos θ)
where D is the crystal size, K is the Scherrer constant (0.89), λ is the wavelength of X-ray radiation (0.15418 nm), B is the value of the full width at half maximum (FWHM) peak (radians), and θ is the diffraction angle (radians).
Scanning electron microscopy analysis (SEM, Hitachi SU-3500, Tokyo, Japan) was performed with a voltage of 3.00 kV at a magnification of 200–2000×. The analysis was carried out to determine the shape of the surface morphology of the sample. Then, for morphological and crystal analysis, a transmission electron microscope (TEM, JEOL JEM-1400, Tokyo, Japan) was also used and the diffraction ring analysis used the selected area diffraction (SAED). The photocatalysts were further characterized using Fourier-transform infrared spectroscopy (FTIR, PerkinElmer Spectrum 100, Waltham, MA, USA) to determine the functional groups in the composites. FTIR was used with a scanning range of 500–4000 cm−1. UV-vis spectroscopy analysis was carried out to determine the maximum absorbed wavelength and the bandgap formed from the photocatalyst. The UV-vis spectrum was obtained from a UV-vis spectrophotometer (Jasco V-550, Tokyo, Japan), used at room temperature in the wavelength range of 200–800 nm.

2.5. Photocatalysis of Phenol Degradation

Photocatalytic degradation was carried out with 50 mL of 20 mg/L phenol solution and 15 mg of catalyst. The time used was 60 min under dark adsorption with no irradiation source. The mixture was stirred at 300 rpm for 2 h under 300 W Xe lamp irradiation with >340 nm cut off-filter (PE 300BUV, Waltham, MA, USA) at a distance of 150 mm above the surface of the solution.
Subsequently, the parameter tested was time, to observe the remaining phenol concentration using high-performance liquid chromatography (HPLC, Jasco Co-2065Plus, Tokyo, Japan). The HPLC column used was C18 with methanol:water (1:1), with a column temperature of 40 °C and a flow rate of 1.00 mL/minute [40], a UV detector was also used at a wavelength of 254 nm.
The adsorption and degradation percentages for phenol by the catalyst were calculated using Equations (3) and (4):
% Adsorption = Ca/C0 × 100%
% Degradation = Cd/C0 × 100%
where Ca is the concentration of adsorbed phenol (mg/L), Cd is the concentration of degraded phenol (mg/L) and C0 is the initial concentration of phenol (mg/L). The percentage increase in photocatalytic ability was also calculated and compared with the standard TiO2 P25.
Photocatalytic ability (%) = (ks/k0) × 100%
where ks is the first-order reaction rate constant of the catalyst (min−1), and k0 is the first-order reaction rate constant for comparison, namely the standard TiO2 P25 (min−1).
To identify intermediate and pathway mechanisms for phenol degradation, gas chromatography–mass spectrometry analysis (GC-MS, Agilent 7890A, Santa Clara, CA, USA) with a 5977B GCMSD detector and a 5 MS column (30 m × 0.25 mm, × 0.25 m; maximum temperature 350 °C) was performed. The carrier gas used was helium with a flow rate of 1.0 mL/min. The oven temperature is programmed from 90–315 °C (hold time 3 min) at a rate of 5 °C/min. Data were obtained by collecting mass spectra in the scan range of 40–550 amu [41].

3. Results and Discussion

3.1. X-ray Diffraction (XRD) Characterization

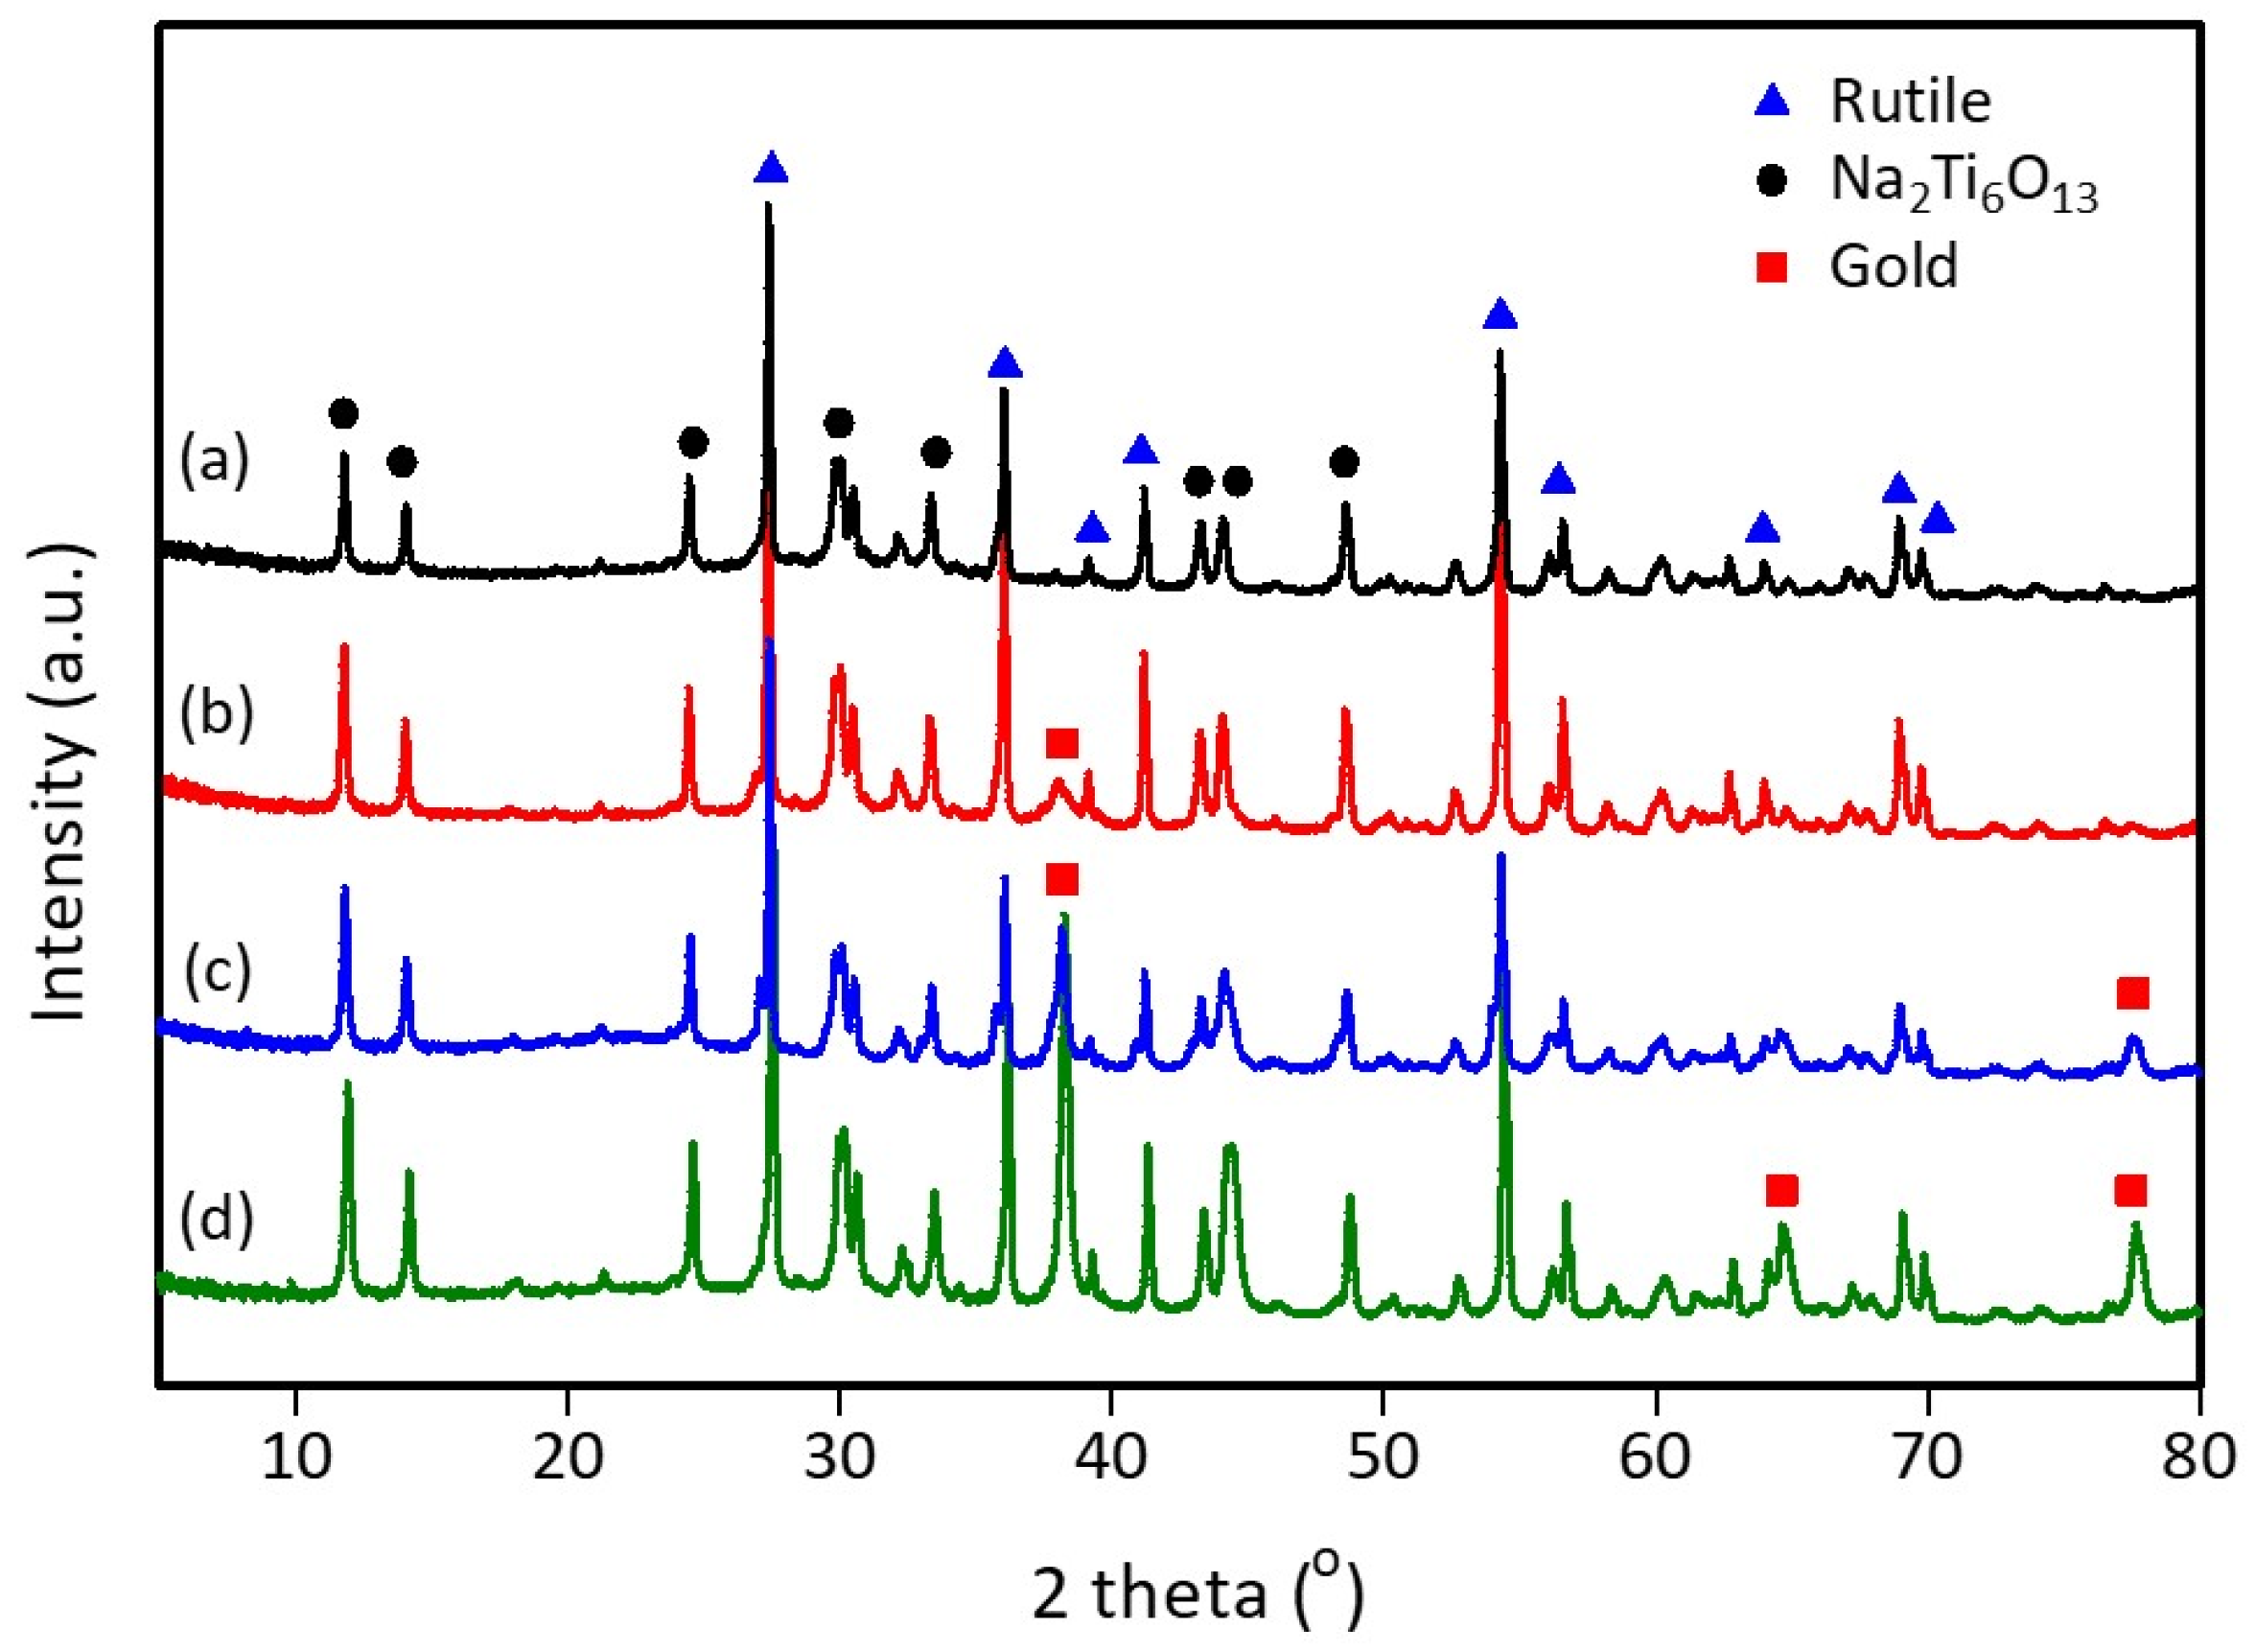
The structures and phases of the composite observed from the diffraction pattern are shown in Figure 2. The standard atomic parameters of rutile TiO2 which is tetragonal with a space group of P42/mnm were taken from the Inorganic Crystal Structure Database (ICSD) 98-016-5920; ICSD 98-016-3491 for the Na2Ti6O13 (NTO) structure was monoclinic with space group C12/m1, and ICSD 98-008-2085 for the gold structure was cubic with a space group of Fm–3m [42,43,44]. The structure of the rutile/NTO composite showed a pattern with peaks at 2θ = 27.5°(110), 36.2°(011), 39.3°(111), 41.2°(111), 54.3°(121), 56.6°(220), 64.0°(002), 69.0°(031), and 69.8°(112) which were derived from the rutile phase structure. Additionally, peaks at 2θ = 11.8°(200), 14.1°(20-1), 24.5°(110), 30.1°(310), 33.4°(402), 43.2°(40-4), 44.1°(602), and 48.6°(020) were obtained from the structure of the Na2Ti6O13 phase. For the Au/TiO2/NTO composites, there were additional peaks at 2θ = 38.3°(111), 64.6°(022), and 77.7°(113) originating from the gold phase structure.
The percentage of crystal structure was calculated with the Rietveld and refined method using the HighScore Plus software (PANalytical 3.0.5), while scale factors, zero shift, and coefficients of shifted polynomial functions were used to match the background [45]. The goodness of fit (GoF) match value for the experimental XRD pattern was calculated to confirm the accuracy of the Rietveld refinement. GoF is a statistical model which describes how well the experimental results are obtained with a series of observations and is calculated using Equation (6).
GoF = (Rwp/Rexp)2
where Rwp (weighted profile R-factor) is the simplest difference index and Rexp (expected R-factor) is the expected “best Rwp” quantity. Table 1 shows that the GoF value in the sample ranged from 3 to 5, proving the fair purity and good crystallization for our samples [46].
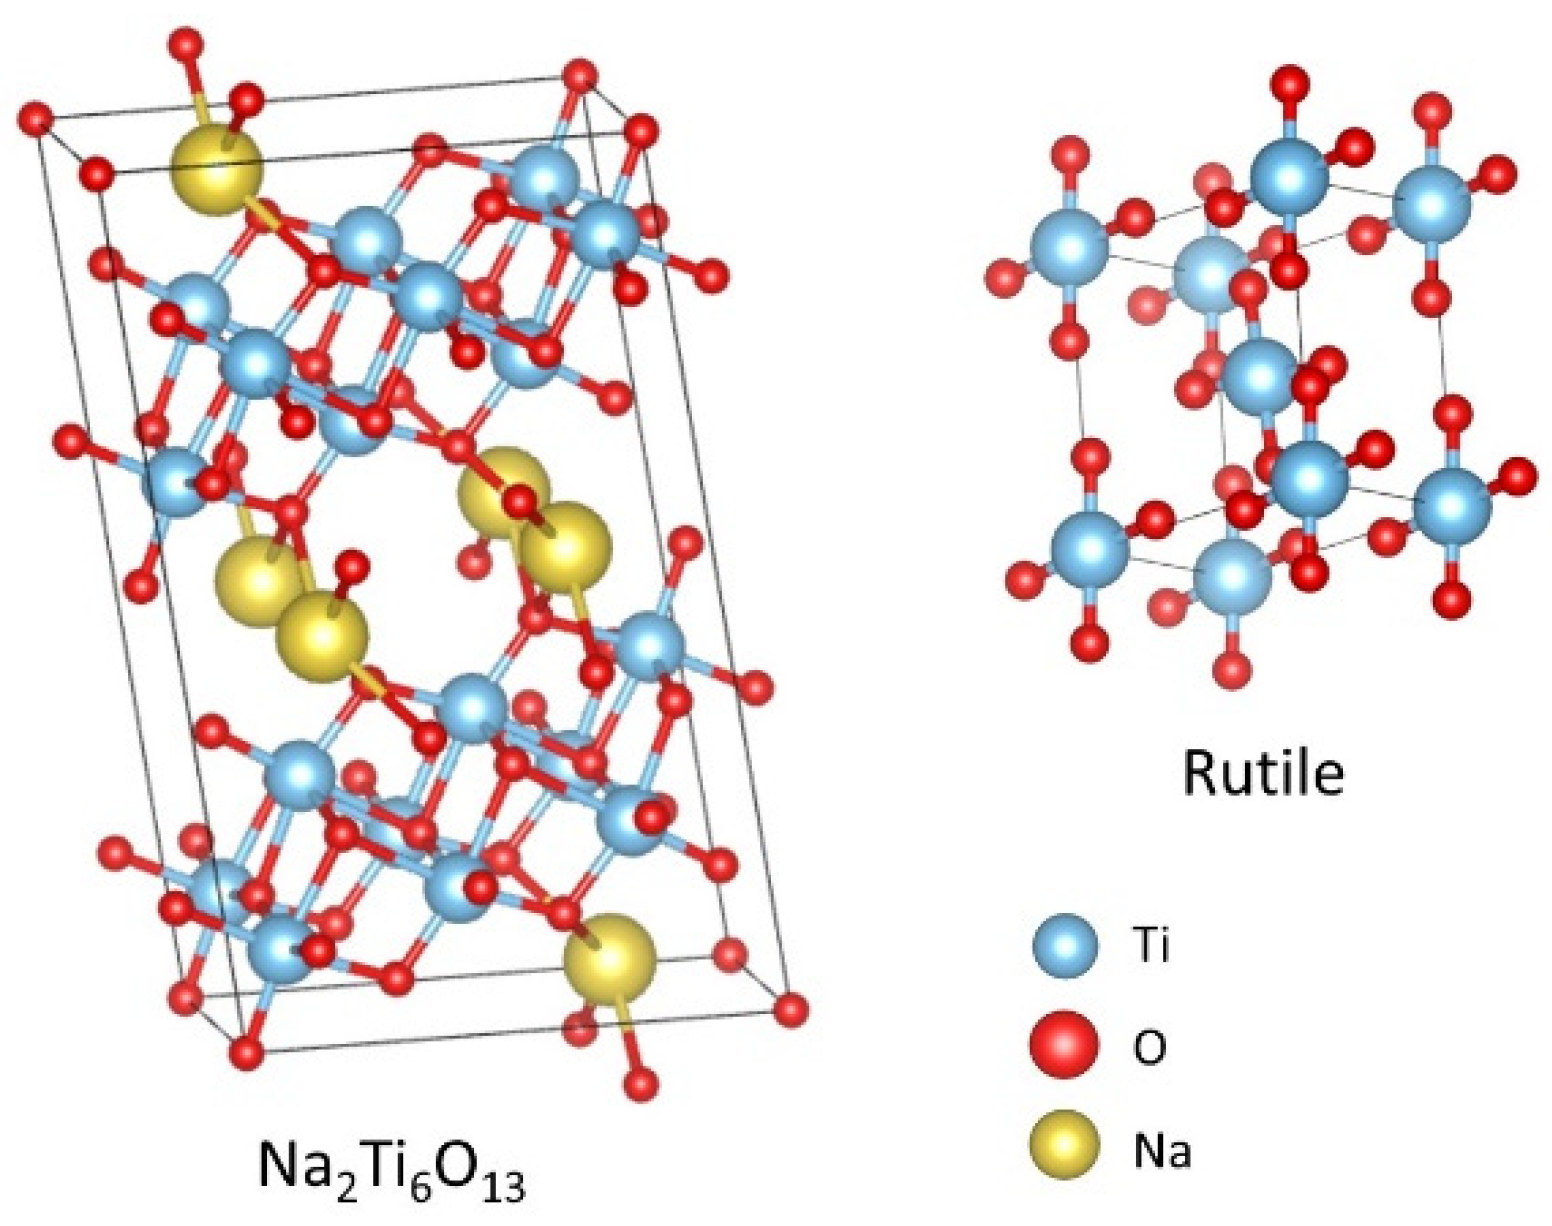
Table 2 presents the percentage of the Rietveld refinement phase. The results show that before the addition of gold, two phases were formed, namely rutile TiO
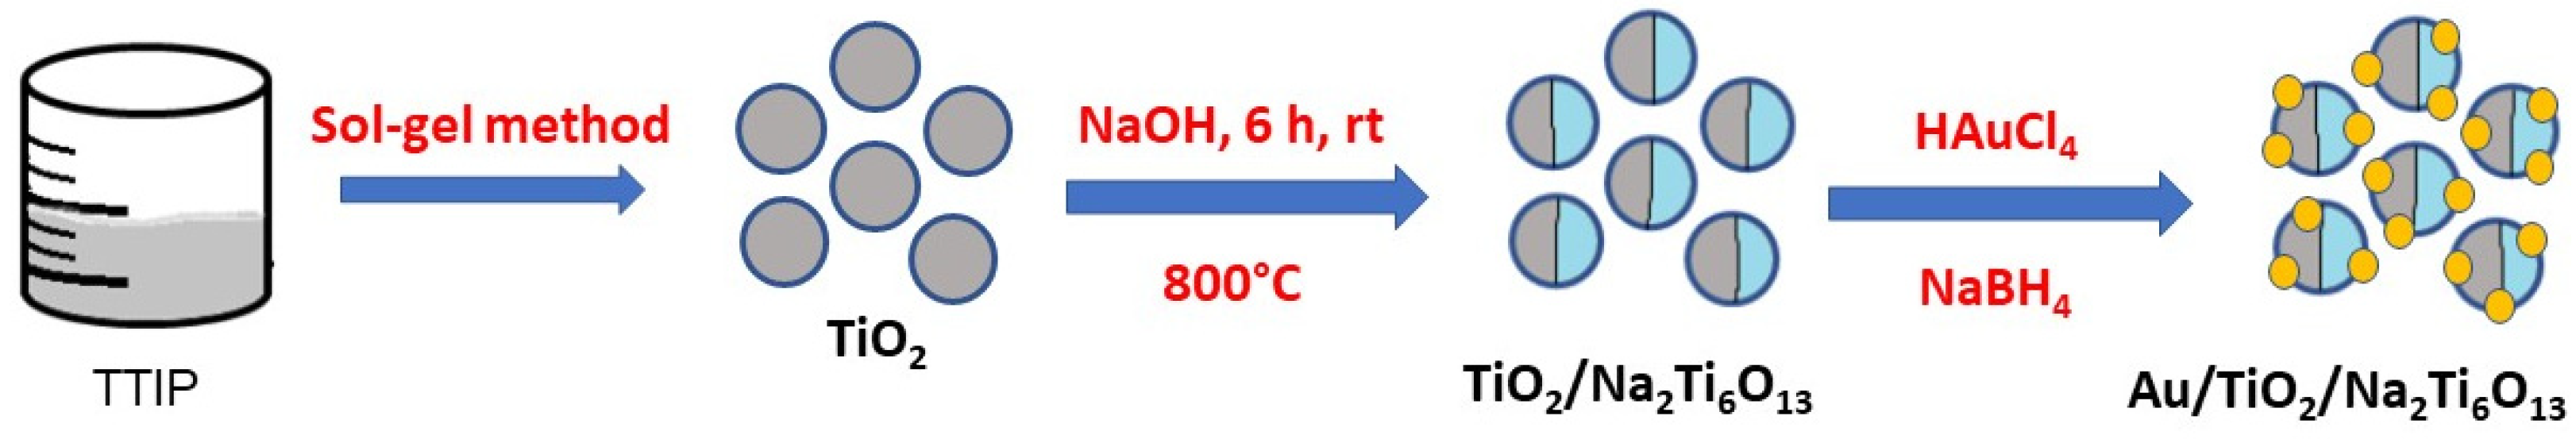
2 by 43.4% and NTO by 56.6%. NTO was formed because the synthesis process carried out using the sol-gel method with a strong alkali NaOH intercalated Na+ ions into the TiO2 structure which then form sodium titanate with a monoclinic structure [
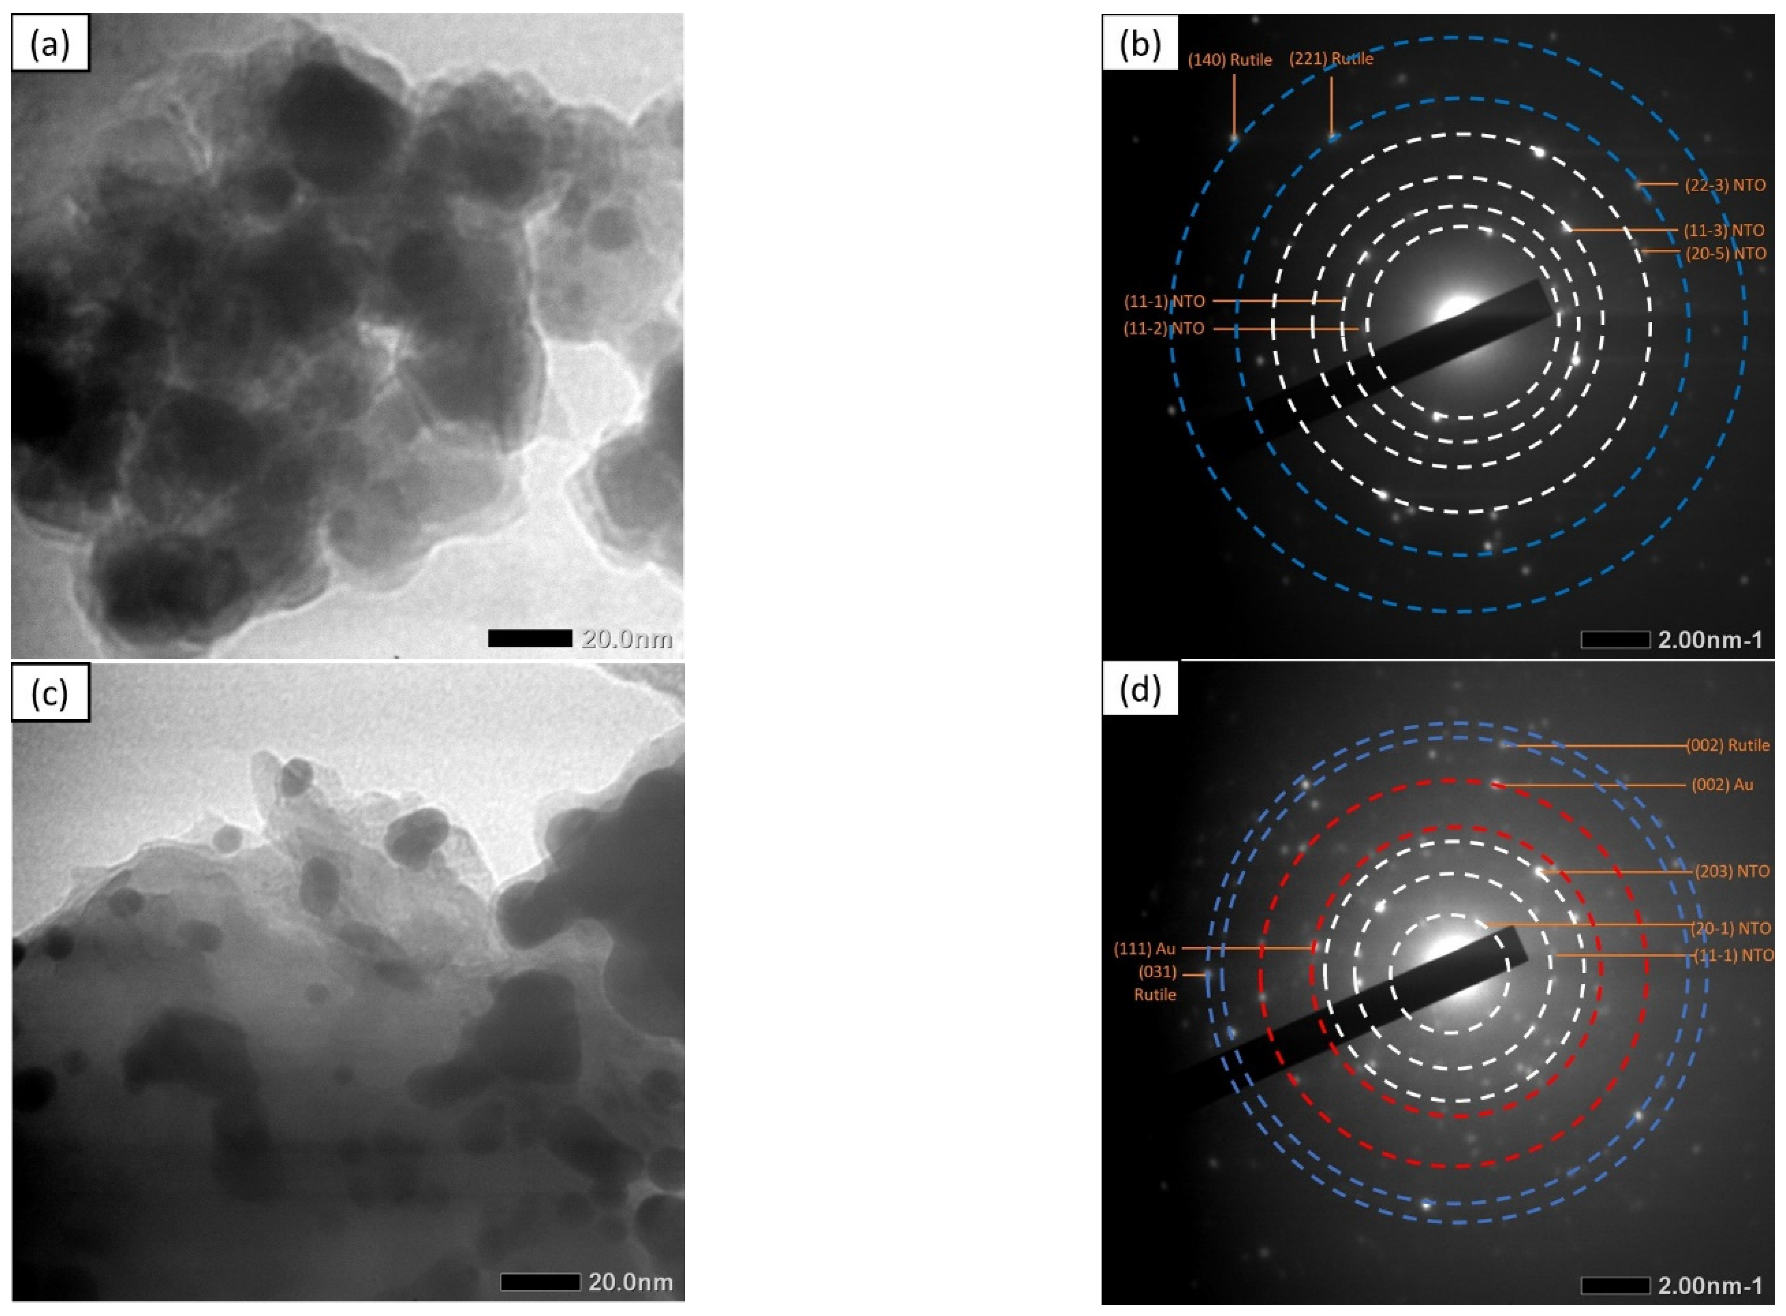
21]. The crystal structure of NTO was rutile as shown in Figure 3. After composition was performed, the percentage of gold increased with the higher addition of the HAuCl4 precursor. The gold percentages in a row were 0.2, 3.8, and 6.0% for 1, 2, and 3% Au/TiO2/NTO composites, respectively.
Table 2 shows the percentage crystallinity of the samples. Based on the results, the crystallinity of the composite increased with the addition of gold. The crystallinity of the TiO2/NTO composite was 76.05%, while that of Au/TiO2/NTO increased to 83–84%, and the highest with 3% increase was found in Au/TiO2/NTO of 84.48%. Large crystallinity is needed in photocatalysis to avoid the possibility of electron–hole recombination and increase photocatalytic activity [36].
The unit cell parameters of the sample are shown in Table 3. The rutile crystal of the synthesized composite had a smaller lattice volume compared to the standard, namely ICSD 98-016-5920 [42]. Based on the results, the rutile lattice volume of the TiO2/NTO composite was 62.414 Å3, while in the 1% Au/TiO2/NTO composite, the volume decreased to 62.371 Å3. Moreover, at higher concentrations of gold composite, the volume also decreased. The rutile lattice volumes for 2 and 3% Au/TiO2/NTO were 62.436 Å3 and 62.416 Å3, respectively. The results also showed that the synthesized NTO had a larger lattice volume than the standard, namely ICSD 98-016-3491 [43]. With the addition of gold, the volume of the crystal lattice decreased at 1 and 2% Au/TiO2/NTO, but increased at 3%. Meanwhile, in gold crystals, the synthesized product had a different lattice volume, which was larger or smaller than the standard, namely ICSD 98-008-2085 [44]. The trend of the gold concentration effect on decreasing or increasing lattice volumes for rutile, NTO, and gold were further examined.

3.2. Scanning Electron Microscope (SEM) Analysis

The morphology of the composite was studied using SEM. Figure 3 shows the synthesized composite has inhomogeneous spherical particles. However, some particle agglomeration occurred in various composite samples. TiO2/NTO (Figure 4a,b) shows agglomeration into quite large particles. The results showed that the addition of gold reduced the occurrence of aggregation, thereby reducing the particle size. Based on the SEM results, there was a significant reduction in the size of the synthesized TiO2/NTO particles after the addition of gold. TiO2/NTO has a particles size of about 100 μm, and Au/TiO2/NTO has particle size between 1 and 12 μm. These results indicate that gold can reduce the occurrence of aggregation in TiO2/NTO.

3.3. Transmission Electron Microscope (TEM) Analysis

The morphology and crystal structure of the Au/TiO2/NTO composites were investigated with TEM observations (Figure 5). Figure 5a shows that the TiO2/NTO composite has agglomerated particles. Meanwhile, Figure 5c shows that the gold spread among composites TiO2/NTO with sizes less than 20 nm. This size corresponds to the XRD results highlighted above. The SAED pattern in Figure 5b shows rutile TiO2 (ICSD 98-016-5920) with the interplane spacing corresponding to the diffraction ring is d(221) = 1.42, d(131) = 1.29, and d(140) = 1.11. In addition, the SAED pattern also shows the presence of NTO (ICSD 98-016-3491), namely d(11-1) = 3.46, d(11-2) = 2.85, d(11-3) = 2.37, d(20-5) = 1.83, and d(22-3) = 1.58. The SAED pattern in Figure 5d shows the presence of a gold phase (ICSD 98-008-2085), with a distance between planes d(111) = 2.36 and d(002) = 2.03. The lattice plane between gold, rutile, and NTO causes the signal to overlap in the SAED pattern [47,48].

3.4. Fourier-Transform Infrared Spectroscopy (FTIR)

FTIR analysis was performed to identify the functional groups in the synthesized composites. The FTIR spectrum was recorded in the wavenumber range of 500–4000 cm−1. Figure 6 shows the infrared spectrum of the sample. In all composites, there is a band at 3400 cm−1 associated with the vibration of the water stretching mode [49]. The peak at 900 cm−1 indicated the characteristic Ti–O bonding in the TiO6 octahedral [50]. The absorption band is at about 700 cm−1 and is associated with O–Ti–O vibrations. In addition, a sharp peak at 1200–1300 cm−1 indicates the presence of Na–O bonds [51]. However, the difference in the amount of gold did not cause a shift in the vibrational absorption of the catalyst.

3.5. UV-Vis Spectroscopy Analysis

Figure 7a shows the absorption spectrum of the Au/TiO2/NTO composite. UV absorption was observed longitudinally at 350–400 nm in all variations, which was ascribed to the NTO [31]. After the addition of gold, localized surface plasmon resonance (LSPR) was formed at the same position. The highest LSPR absorption value was shown in the 3 wt% gold composites, while at larger amounts, namely 1 and 2 wt%, the intensity of absorption decreased. Moreover, with increasing gold loading, a bathochromic shift in LSPR was produced [52]. The peak position, intensity, and band shape of the LSPR depend on factors such as shape, size, composition [53], and NaBH4 concentration [54].
The TiO2/NTO composites only had ultraviolet light absorption characteristics. However, there was a decrease in the bandgap with the addition of gold composites; this indicates that gold provides a change in the electronic state of the composite. The bandgap energy value (Eg) was obtained using the Tauc equation in Equation (7) [55].
(αhν)1/n = A(hν − Eg)
where α is the absorption coefficient, hν is the photon energy (eV), and A represents the constant of proportionality. The transition properties are represented by n, where n = 2 for the allowed indirect band gap [37]. The bandgap energy was calculated by plotting (αhν)1/2 vs. hν (Figure 7b). The bandgap values of the composites are shown in Table S1.

3.6. Photocatalytic Activity Test on Phenol Degradation

Several previous studies have reported a composite of NTO as a photocatalyst. Examples of studies that used NTO composites with various compounds are presented in Table 4. NTO used in this study was synthesized from the addition of a NaOH base to TiO2. However, studies on TiO2/NTO composites with Au have not been previously reported.
The photocatalysis activity was tested against a decrease in the concentration of phenol to determine the performance of the synthesized photocatalyst compared to P25 TiO2. Phenol is found in industrial waste with different concentrations depending on the type of industry. For example, the pulp and paper industry produces 20–80 mg/L of phenol, the rubber industry 3–10 mg/L, and the textile industry 100–150 mg/L [57,58,59]. This study used a concentration of 20 mg/L because it is the value that exists in industrial waste. The test was carried out using a simulated sample of phenol standard solution which was analyzed using high-performance liquid chromatography (HPLC)
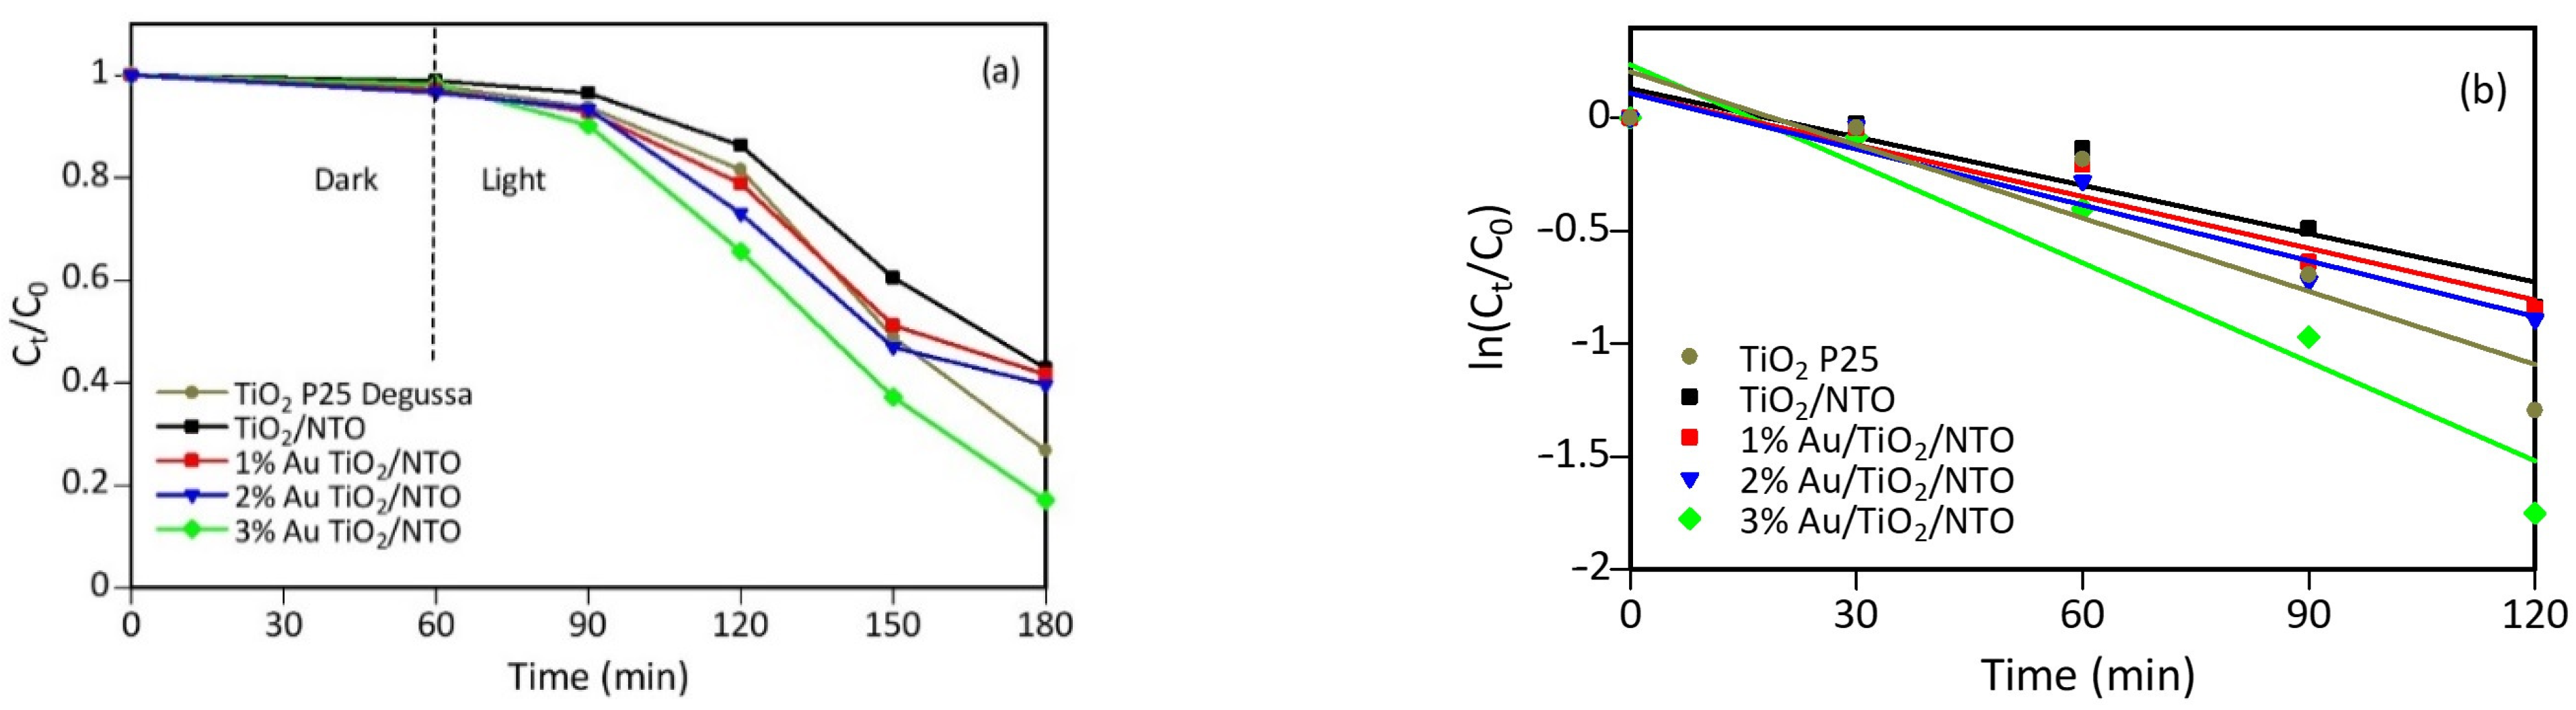
Figure 8a shows that the decrease in concentration until the 60th minute is an adsorption effect of the composite and the test was carried out without UV irradiation. Meanwhile, the test with UV irradiation was conducted at 60 to 180 min and the results showed a significant decrease in concentration after photocatalyst activation by light. The efficiency of reducing phenol concentration is demonstrated in Table 5. Based on the results, the 3% Au/TiO2/NTO composite had the largest degradation percentage of 82.94% with an adsorption percentage of 3.39%, while TiO2/NTO in the absence of gold showed a small percentage of degradation, namely 57.17%. This proves that the presence of gold enhances the photocatalyst to efficiently degrade phenol. In addition, the best photocatalysis was shown with 3% gold composite, while at 1 and 2% there was a decrease in the efficiency. However, the 3% gold composite also showed the best phenol adsorption of 3.39% compared to the 2% composite with 2.88% and the lowest was found in the 1% composite of 1.81%. This shows that the higher the gold composited, the better the photocatalyst adsorption capacity, leading to more active sites for better photocatalytic activity.
Another factor that enhanced photocatalysis in the presence of gold was the higher crystallinity of the Au/TiO2/NTO composite which ranged from 83 to 85% compared to the composite without gold, namely 76.05%. Crystallinity reduces the occurrence of recombination [36], thereby increasing photocatalysis efficiency. In addition, the presence of heterophase also enhances the formation of a synergistic effect of electrons, which effectively stimulates their transfer from one phase to another [60,61].
The reaction between the photocatalyst and phenol corresponds to a multiphase surface reaction. The Langmuir–Hinshelwood first-order kinetic model was used to evaluate the reaction kinetics [62,63].
r0 = −dC/dt = (kKCs)/(1 + KCs)
where r0 is the initial photocatalytic efficiency (mg/L·min), t is reaction time (min), k is reaction efficiency constant (min−1), K is reaction equilibrium constant, and Cs is reactant concentration (mg/L); k and K are determined by several factors in the reaction system, including the catalyst concentration, light intensity, initial concentration of reactants, reaction temperature, physical properties of reactants, and amount of oxygen available.
When the substrate reaction concentration is low, KC ≥ 1; this can be simplified to a first-order equation, namely [39]:
r0 = −dC/dt = kKC = k1C
where k1 is the reaction constant for the first-order reaction. At the start of the reaction, t = 0 and Ct = C0; the equation can be obtained after deformation as follows [64]:
ln (Ct/C0) = −k1t + b
where Ct is the concentration of phenol in solution at t minutes, C0 is the initial concentration of phenol, and b represents the constant.
Figure 7b shows that ln (Ct/C0) and t are in a good linear relationship and their performance is consistent with the first-order reaction. The kinetic constant of the reaction can be determined to estimate the total reaction rate, and then compare the photocatalytic efficiency under different conditions. The first-order kinetic equations, reaction rate constants, and correlation coefficient (R2) of the photocatalytic reactions on different catalysts are shown in Table 5. Based on the results, the reaction constant k1 increases in the presence of the gold composite, indicating that the composite promotes the photocatalytic reaction process. In addition, k1 showed the highest value in 3% gold composite, namely 0.0146 min−1, which was higher than P25 TiO2 at 0.0108 min−1. These results indicate that the photocatalytic reaction efficiency of phenol degradation with a 3% Au/TiO2/NTO catalyst is 200% and 140% more effective than without gold composite and commercial P25 TiO2, respectively. This implies that the appropriate amount of gold on the TiO2/Na2Ti6O13 composite surface will significantly increase its photocatalytic ability.
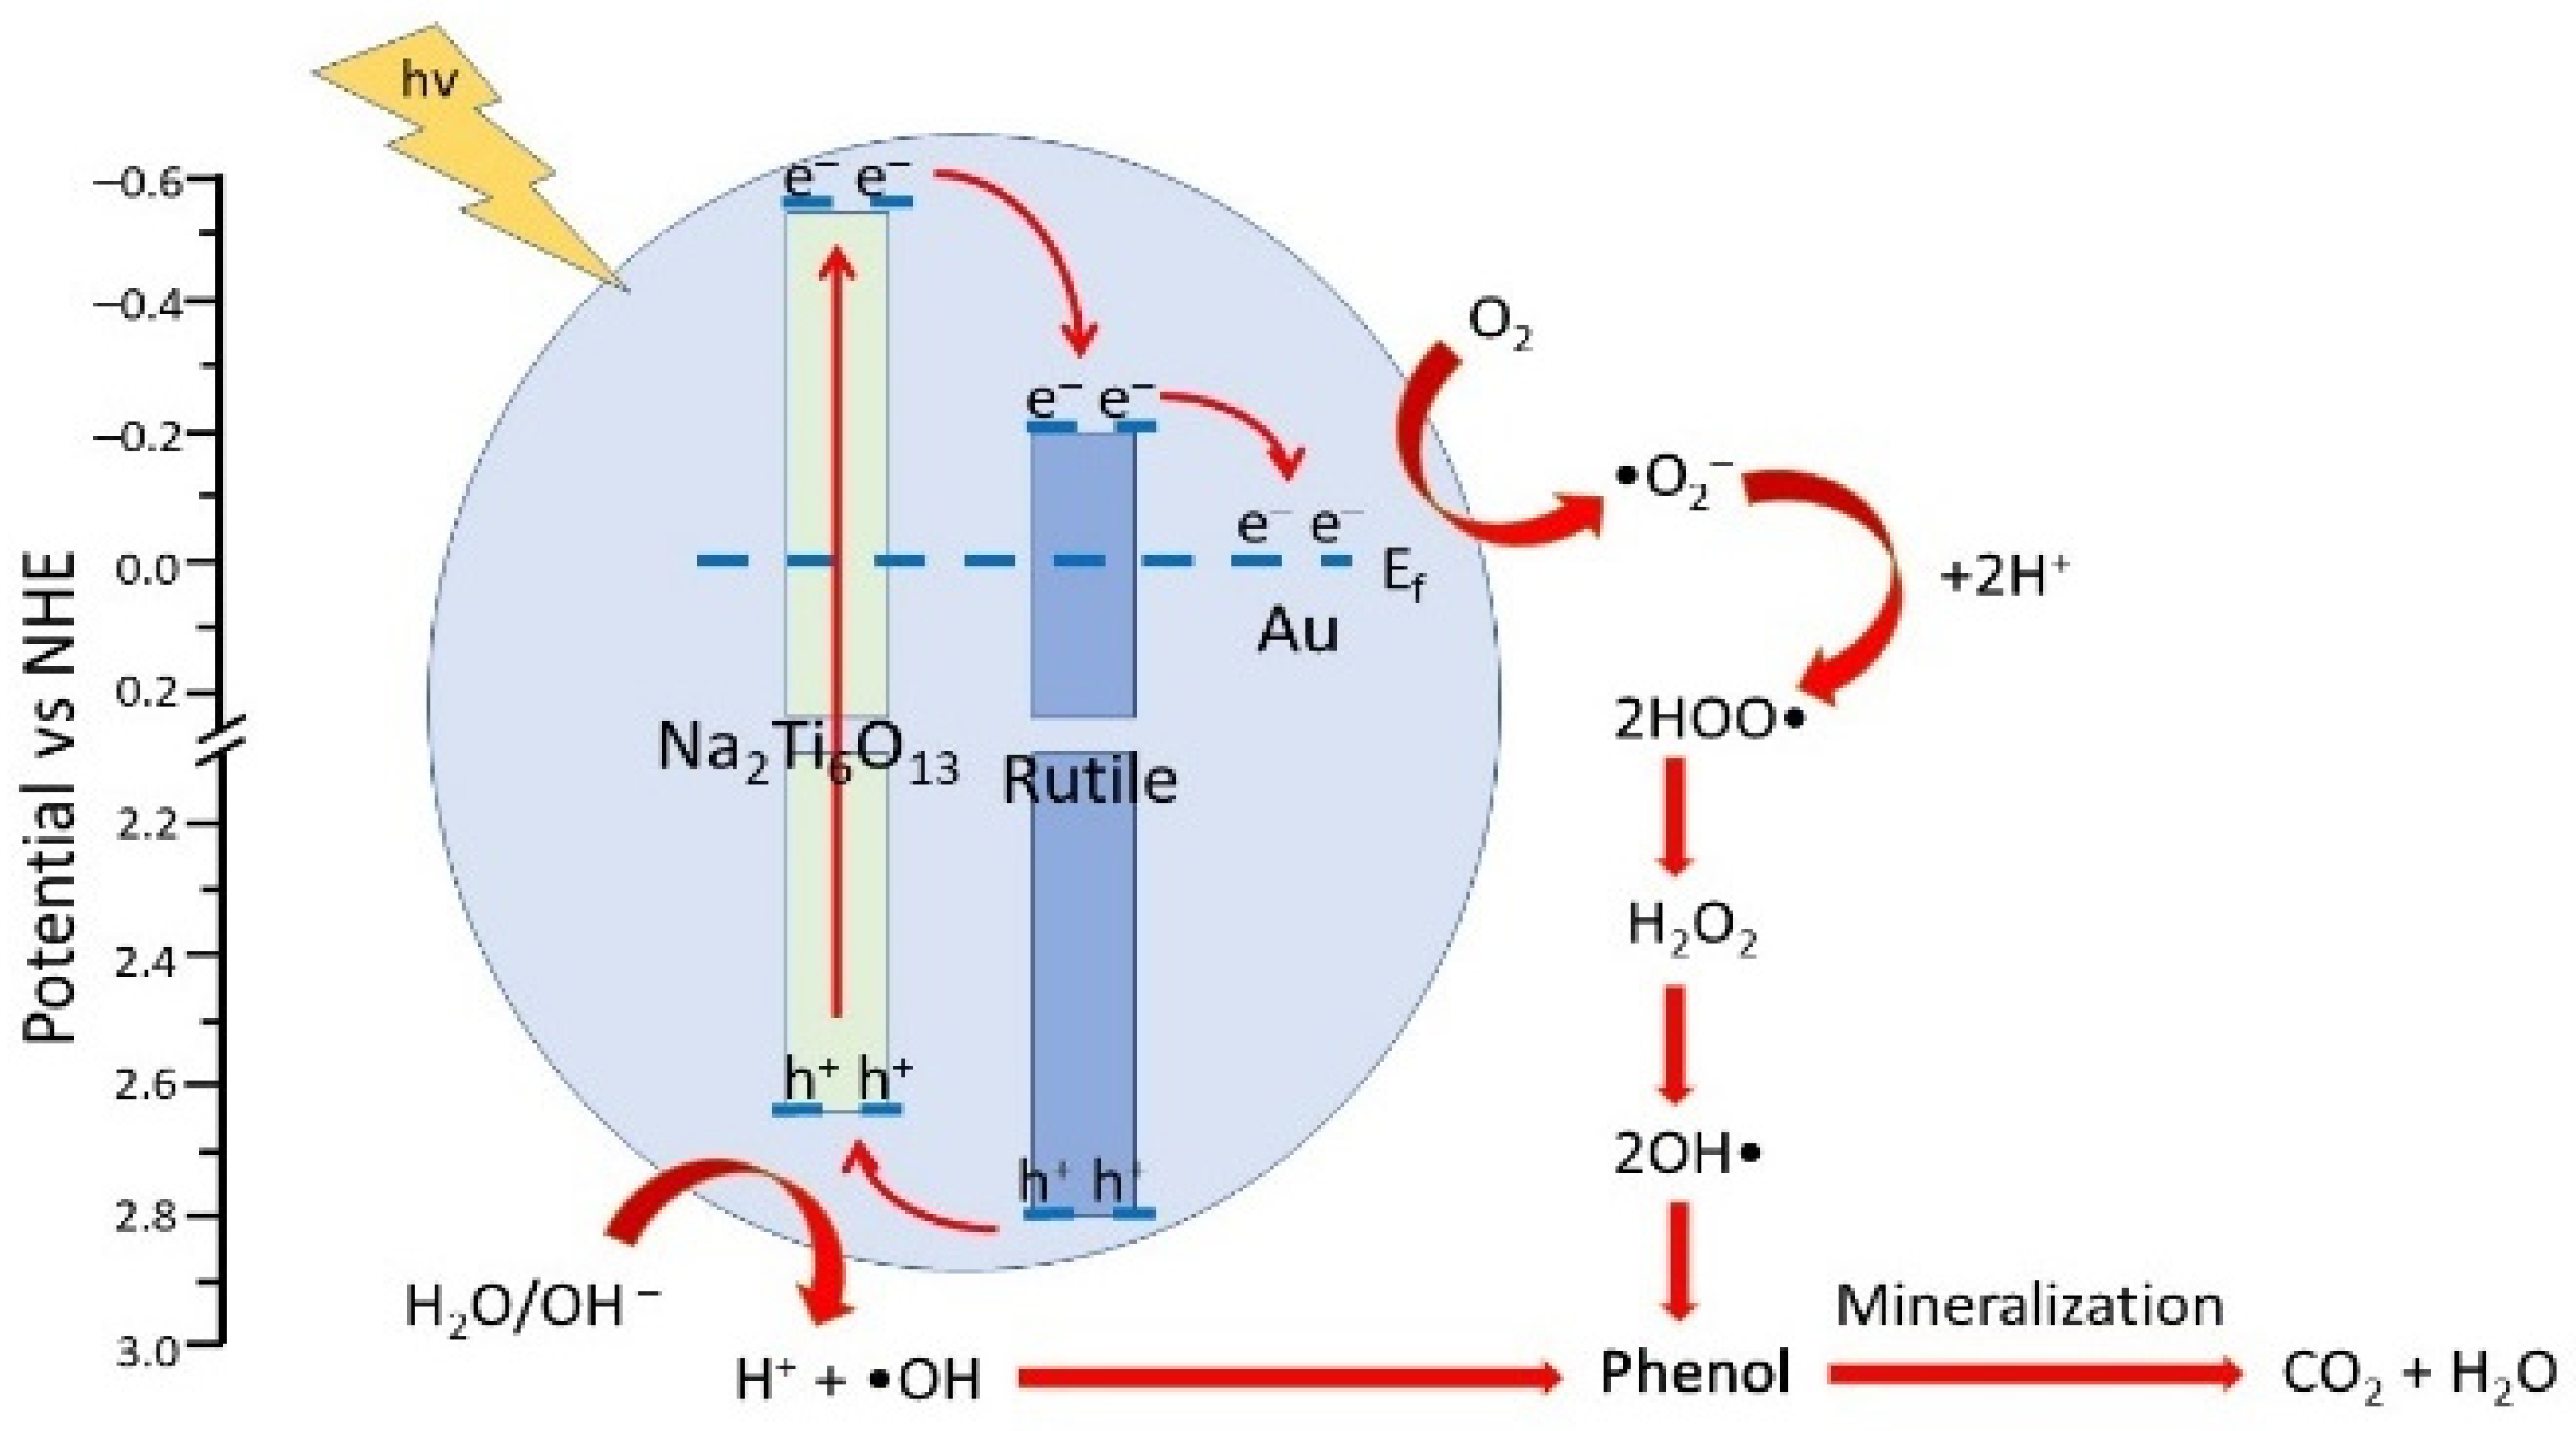
Under visible light irradiation, the light-generated hole–electron pair appeared in the gold electron state due to surface plasmon resonance (SPR) [65]. The conduction band energy of TiO2 and NTO was lower than the Fermi energy level of gold, but the electrons generated from gold can move to the conduction band of TiO2 or NTO. Furthermore, the reduction of O2 by light-induced electrons on the rutile surface was not efficient, but in the presence of NTO, the electrons were more active for O2 reduction. Therefore, electron-preferential transfer from TiO2 to NTO can effectively suppress photogenerated electron–hole pair recombination and accelerate the photodegradation process [66]. The excited electrons were transferred to rutile TiO2 and then NTO to initiate the reaction with dissolved oxygen, while the holes reacted with H2O or OH, thereby avoiding electron–hole recombination, which can enhance the photocatalytic effect. In other words, the combination of gold and TiO2/NTO is expected to produce charge separation conditions with relatively low oxidation potential (Au+) and with the same reduction potential for the NTO conduction band as TiO2/NTO.
A schematic representation of the mechanism of phenol degradation by Au/TiO2/NTO is shown in Figure 9. In the literature, it has been reported that the conduction and valence band potentials in NTO are more negative than in rutile [67]. The hole charge transfer process will lead from the valence band of the rutile phase to the valence band of the NTO phase because it has a higher potential, which will further oxidize the compounds present in the medium. Meanwhile, the photo-induced electrons from the conduction band of the NTO phase will migrate to the conduction band of the rutile phase because of the lower potential. Moreover, the presence of Au can trap the resulting photo-induced electrons in the conduction band and prevent them from returning through the Schottky barrier formed between Au and TiO2/NTO. This interface is beneficial because it contributes to reducing the electron–hole recombination rate and improving photocatalytic performance [68].

3.7. Degradation Pathway and Identification of the Intermediates

Analysis of reaction intermediates is useful for revealing some details of the reaction process. This study used gas chromatography–mass spectrometry (GC-MS, Agilent 7890A, Santa Clara, CA, USA) with a 5977B GCMSD detector and a 5 MS column to determine intermediates and the mechanism of phenol degradation. The results of the GC-MS chromatogram showed that the resulting hydroxyl radicals attack phenol molecules, leading to the formation of dihydroxy benzene [69]. Further degradation by hydroxyl radicals results in two different intermediate pathways, namely complete hydroxylation of the benzene ring and cleavage of carbon to aliphatic acids. The two intermediate pathways are then further oxidized to oxalic acid which will eventually become CO2 and H2O [70]. The structure of phenol and other intermediates did not reappear on the chromatogram after 120 min of catalytic processing (Figure S4). This indicates that phenol has been almost completely mineralized, which is important for its practical use in environmental remediation [71]. The proposed mechanism of phenol degradation with an Au/TiO2/NTO composite catalyst is shown in Figure 10.

3.8. Large-Scale Economic Evaluation

In order to evaluate the possible use of this technology further in real industry, it is important to carry out a cost analysis of each process to determine whether it can be applied in real case scenarios [72,73,74]. A similar methodology was carried out by Durán et al. [75] to determine the chemicals and energy cost. The engineering design of the phenol removal unit using the Au/TiO2/NTO catalyst was proposed based on the experimental results of the batch obtained, catalyst dose of 0.15 g/L, contact time of 2 h, and light intensity of 300 watts. In this case, the reactor is designed to be able to treat phenol waste with a phenol effluent flow rate of 3 L/min, based on previous research [76]. In large-scale photocatalysis, reactor design will determine the effectiveness and efficiency of photocatalysis [77], one of which is reactor geometry [78]. In this study, the reactor to be used is cylindrical, with the volume calculated based on Equations (11) and (12) [79].
Q = 24 V/t
V = (nπD2L)/4
where Q is the volume flow rate of phenol waste (m3/day), V is the required volume of the photocatalysis unit (m3), t is the contact time (h), n is the number of tanks, D is the tank diameter (cm), and L is the tank length (cm).
The designed reactor volume is 0.36 m3 with a diameter and tube length of 68 and 100 cm, respectively. Wastewater containing phenol with a flow rate of 3 L/min is assisted by using two pumps. Then, in the wastewater reactor, it was stirred at a speed of 300 rpm while UV light was directed using a 300 W UV lamp. Then, an economic feasibility assessment is carried out which is presented in Table 6. The factory operating hours are 24 h a day and five days a week (288 days/year). The total cost is calculated based on the aspects of fabrication, mechanics, operations, and energy. The fabrication cost for a photocatalytic reactor with a volume of 0.36 m3 is USD 1440 and for spare parts including electrical and mechanical equipment, it is USD 900 [79]. Furthermore, the total operating cost is determined as the sum of the material, energy, and labor costs [80]. The cost of preparing the Au/TiO2/NTO composite catalytic material is calculated to be 0.961 USD/m3 for TTIP, 0.370 USD/m3 for HPC, 0.057 USD/m3 for NaOH, 0.011 USD/m3 for HCl, 0.097 USD/m3 for NaBH4, and 269.4 USD/m3 for HAuCl4 based on the chemical cost at the local supplier. The cost of energy consumption is calculated for a 300 W lamp, pump, and photocatalytic reactor stirrer with a total of 0.493 USD/m3 based on the tariff in Indonesia (0.074 USD/kWh) [81]. The cost of the catalyst material treatment is 5% of the material cost, which is USD 13.545 [79]. The total salary of a technician working in Indonesia for three people is around USD 1500 gross per month (14.467 USD/m3).
The reuse of catalytic materials can reduce operating costs. In addition, conducting research in sunlight significantly lowers research costs. In this case, a UV light simulator was not used and could reduce the total cost by up to 76% based on previous studies [82]. However, without gold, the total operational cost without technician cost can be calculated to be 2.064 USD/m3 cheaper than the previous study for the degradation of 2,4-dicholorophenoxyacetic acid of 11.71 USD/m3 [83]. In the presence of gold, the cost of the catalyst increases considerably to 284.934 USD/m3, which is a limitation in this study to be applied in industry.
Break-even analysis is determined to obtain the minimum requirement of the production capacity and profitability index to obtain information about the profit [84]. In this study, the processing cost of the treatment outside the factory is estimated at 75 USD/m3 [79]. In this study, profit can be achieved if the catalyst material design is calculated without using gold (TiO2/Na2Ti6O13). Therefore, in this analysis, the cost of expenditure is calculated without using gold. To determine the number of break-even points/QBE (m3) and profit/P (USD), Equations (13) and (14) [79] are used.
QBE = FC/(r − v)
P = (r − v)Q − FC
where FC is fixed cost (USD), r is revenue (USD), v is variable cost (USD), and Q is the volume flow rate of phenol waste (m3/year).
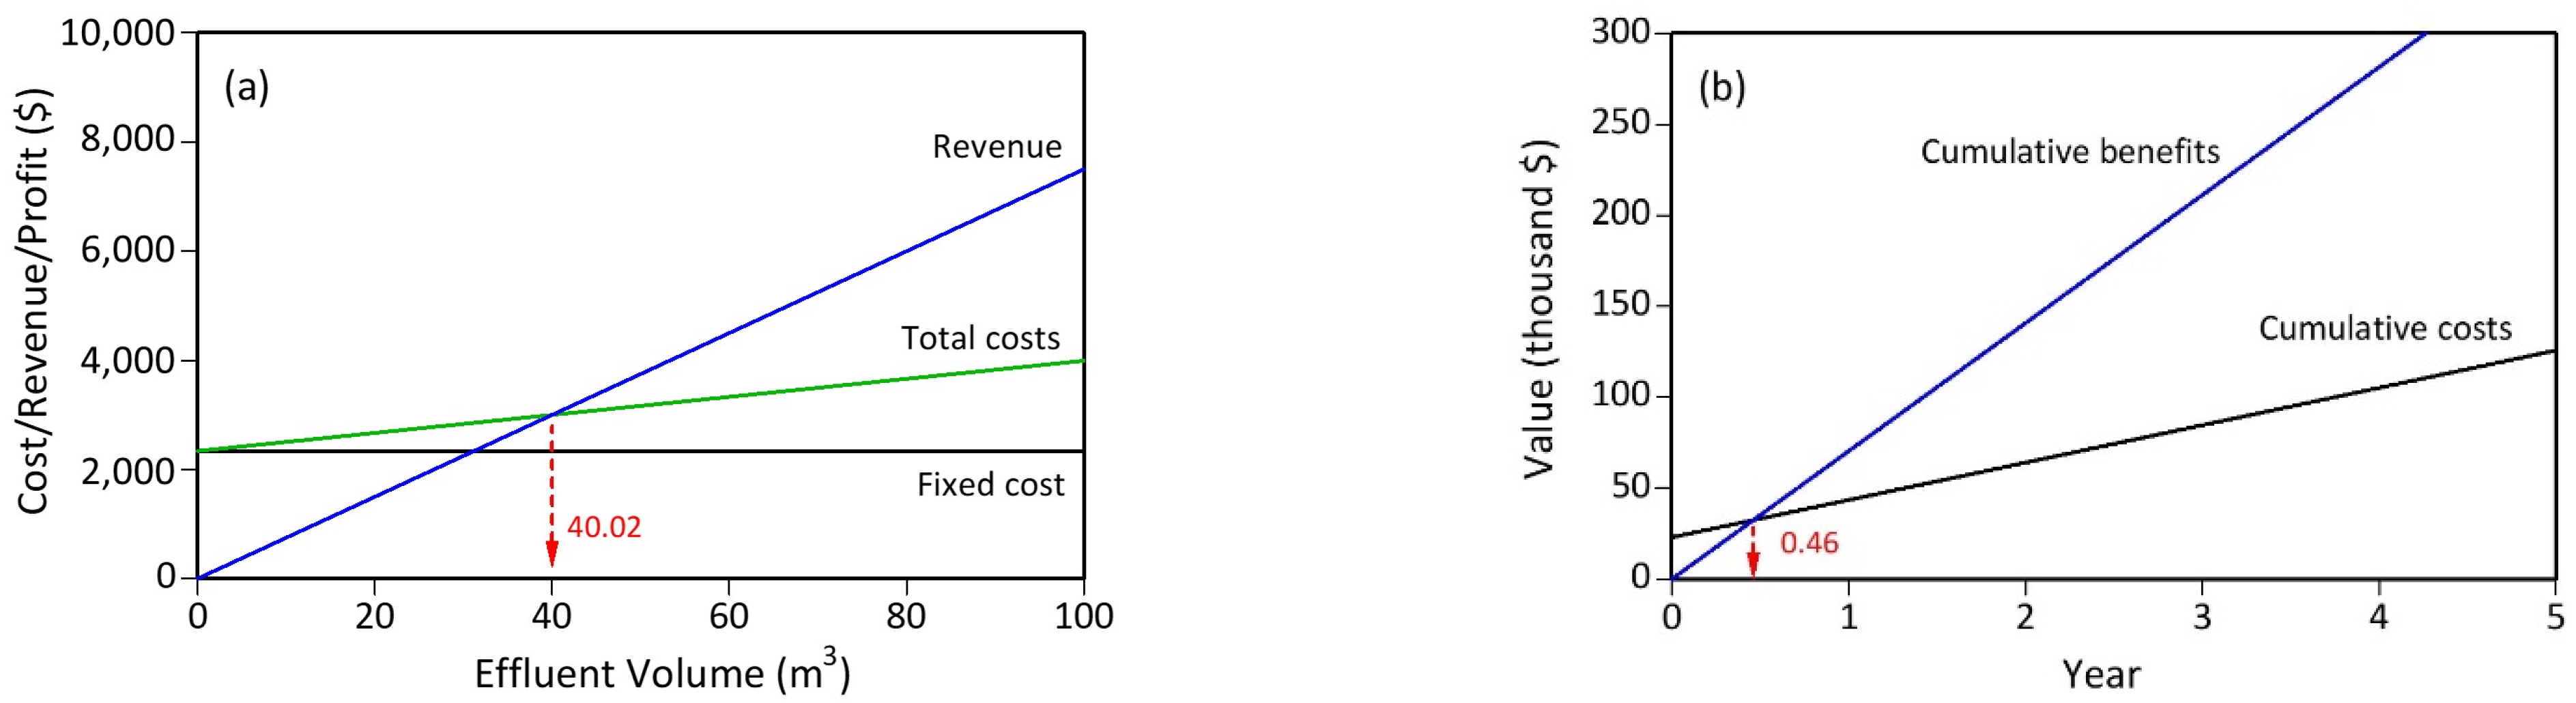
The fixed cost used is USD 2340 which comes from the photo-catalysis reactor fabrication and the required spare parts, while the operating cost is taken as a variable cost of USD 16.53 (cost without gold). The break-even analysis is shown in Figure 11a. It is found that the break-even quantity is 40.02 m3. After that, a payback analysis was carried out to estimate the possibility for the year of profit [85]. The payback period for 5 years of operation is shown in Figure 11b. The benefit from treated waste is 1244.16 m3/year for USD 70,405. Thus, it is obtained that the return can be determined as 0.46 years. These results indicate that the pilot-scale design proposed for phenol wastewater treatment has the great advantage of using composites without gold. However, future research should find alternative materials to replace gold so that costs can be reduced.

4. Conclusions

The varying Au loadings of 1, 2, and 3 wt% using the sol-gel method on the TiO2/Na2Ti6O13 composite significantly improved the photodegradation of phenol. The 3% Au/TiO2/NTO composite with high crystallinity properties as well as small particle size and bandgap showed a remarkable increase in photocatalytic activity. After 120 min, the 3% composite showed photodegradation activity of 25.8% which was higher than that of the catalyst without gold. The Langmuir–Hinshelwood first-order kinetic model data showed that this composite has a reaction constant of 0.0146 min−1, 200% more effective than without gold, and 140% more effective than standard P25 TiO2. This indicates that the addition of gold significantly increases the photocatalytic ability of the TiO2/Na2Ti6O13 composite. In addition, photocatalytic processing is studied for its commercial potential. The catalyst can be calculated to be 1.496 USD/m3 without gold, but in the presence of gold the cost of the catalyst increases to 270.896 USD/m3, which is a limitation in this study to be applied in industry.

Supplementary Materials

The following supporting information can be downloaded at: https://0-www-mdpi-com.brum.beds.ac.uk/article/10.3390/chemengineering6050069/s1, Figure S1: X-ray diffraction pattern (a) TiO2/NTO, (b) 1% Au/TiO2/NTO, (c) 2% Au/TiO2/NTO, (d) 3% Au/TiO2/NTO, (e) rutile TiO2 (ICSD 98-016-5920), (f) Na2Ti6O13 (NTO) (ICSD 98-016-3491), and (g) gold (ICSD 98-008-2085); Figure S2: Rietveld refinement of XRD pattern of (a) TiO2/NTO, (b) 1% Au/TiO2/NTO, (c) 2% Au/TiO2/NTO, and (d) 3% Au/TiO2/NTO; Figure S3: The UV-vis absorption spectrum of gold synthesis with HAuCl4 precursor before (orange line) and after (pink line) the addition of NaBH4 reducing agent; Figure S4: Chromatogram of phenol intermediate using GC-MS analysis; Table S1: Bandgap energy values of the samples. References [42,43,44,86] are cited in the supplementary materials.

Author Contributions

Conceptualization, D.R.E. and A.R.N.; methodology, M.D.P.; software, M.D.P.; validation, N.K., D.R.E. and I.R.; formal analysis, M.D.P. and P.R.L.; investigation, M.D.P.; resources, M.D.P.; data curation, M.D.P.; writing—original draft preparation, M.D.P.; writing—review and editing, M.D.P. and D.R.E.; visualization, M.D.P.; supervision, A.R.N. and D.R.E.; project administration, D.R.E.; funding acquisition, D.R.E. and I.R. All authors have read and agreed to the published version of the manuscript.

Funding

This research was funded by Academic Leadership Grant (ALG) Prof. Iman Rahayu, Universitas Padjadjaran, grant number ID: 2203/UN6.3.1/PT.00/2022, and “The APC was funded by them”.

Institutional Review Board Statement

Not applicable.

Informed Consent Statement

Not applicable.

Data Availability Statement

Not applicable.

Conflicts of Interest

The authors declare no conflict of interest.

References

  1. Wetchakun, K.; Wetchakun, N.; Sakulsermsuk, S. An overview of solar/visible light-driven heterogeneous photocatalysis for water purification: TiO2-and ZnO-based photocatalysts used in suspension photoreactors. J. Ind. Eng. Chem. 2019, 71, 19–49. [Google Scholar] [CrossRef]
  2. Dutta, K.; Rana, D. Polythiophenes: An emerging class of promising water purifying materials. Eur. Polym. J. 2019, 116, 370–385. [Google Scholar] [CrossRef]
  3. Babich, H.; Davis, D.L. Phenol: A review of environmental and health risks. Regul. Toxicol. Pharmacol. 1981, 1, 90–109. [Google Scholar] [CrossRef]
  4. Norouzi, M.; Fazeli, A.; Tavakoli, O. Phenol contaminated water treatment by photocatalytic degradation on electrospun Ag/TiO2 nanofibers: Optimization by the response surface method. J. Water Process Eng. 2020, 37, 101489. [Google Scholar] [CrossRef]
  5. Peiró, A.M.; Ayllón, J.A.; Peral, J.; Doménech, X. TiO2-photocatalyzed degradation of phenol and ortho-substituted phenolic compounds. Appl. Catal. B 2001, 30, 359–373. [Google Scholar] [CrossRef]
  6. Anku, W.W.; Mamo, M.A.; Govender, P.P. Phenolic Compounds in Water: Sources, Reactivity, Toxicity and Treatment Methods. In Phenolic Compounds-Natural Sources, Importance and Applications; Soto-Hernández, M., Tenango, M.P., del Rosario Garcia-Mateos, M., Eds.; IntechOpen: London, UK, 2017; pp. 419–443. [Google Scholar]
  7. Lestari, P.R.; Takei, T.; Kumada, N. Novel ZnTi/C3N4/Ag LDH heterojunction composite for efficient photocatalytic phenol degradation. J. Solid State Chem. 2021, 294, 121858. [Google Scholar] [CrossRef]
  8. Permana, M.D.; Noviyanti, A.R.; Lestari, P.R.; Kumada, N.; Eddy, D.R.; Rahayu, I. Synthesis and Photocatalytic Activity of TiO2 on Phenol Degradation. Kuwait J. Sci. 2021, 49, 3. [Google Scholar] [CrossRef]
  9. Ameta, R.; Ameta, S.C. Photocatalysis: Principles and Applications, 1st ed.; CRC Press: Boca Raton, FL, USA, 2016. [Google Scholar]
  10. Chong, M.N.; Jin, B.; Chow, C.W.; Saint, C. Recent developments in photocatalytic water treatment technology: A review. Water Res. 2010, 44, 2997–3027. [Google Scholar] [CrossRef]
  11. Baaloudj, O.; Kenfoud, H.; Badawi, A.K.; Assadi, A.A.; El Jery, A.; Assadi, A.A.; Amrane, A. Bismuth Sillenite Crystals as Recent Photocatalysts for Water Treatment and Energy Generation: A Critical Review. Catalysts 2022, 12, 500. [Google Scholar] [CrossRef]
  12. Shahzad, W.; Badawi, A.K.; Rehan, Z.A.; Khan, A.M.; Khan, R.A.; Shah, F.; Ali, S.; Ismail, B. Enhanced visible light photocatalytic performance of Sr0.3(Ba, Mn)0.7ZrO3 perovskites anchored on graphene oxide. Ceram. Int. 2022, 48, 24979. [Google Scholar] [CrossRef]
  13. Baaloudj, O.; Assadi, I.; Nasrallah, N.; El Jery, A.; Khezami, L.; Assadi, A.A. Simultaneous removal of antibiotics and inactivation of antibiotic-resistant bacteria by photocatalysis: A review. J. Water Process Eng. 2021, 42, 102089. [Google Scholar] [CrossRef]
  14. Ahmed, S.; Rasul, M.G.; Martens, W.N.; Brown, R.; Hashib, M.A. Heterogeneous photocatalytic degradation of phenols in wastewater: A review on current status and developments. Desalination 2010, 261, 3–18. [Google Scholar] [CrossRef]
  15. Eddy, D.R.; Permana, M.D.; Lutfiah, A.; Noviyanti, A.R.; Deawati, Y.; Rahayu, I. Challenges of TiO2-composite, as a visible active photocatalyst material for SARS-CoV-2 antiviral compared with the other viruses. Quím. Nova 2022, 45, 74–82. [Google Scholar] [CrossRef]
  16. Nakata, K.; Fujishima, A. TiO2 photocatalysis: Design and applications. J. Photochem. Photobiol. C Photochem. Rev. 2012, 13, 169–189. [Google Scholar] [CrossRef]
  17. Eddy, D.R.; Rahayu, I.; Wyantuti, S.; Hartati, Y.W.; Firdaus, M.L.; Bahti, H.H. Photocatalytic activity of gadolinium doped TiO2 particles for decreasing heavy metal chromium (VI) concentration. J. Phys. Conf. Ser. 2018, 1080, 012013. [Google Scholar] [CrossRef]
  18. Park, S.M.; Razzaq, A.; Park, Y.H.; Sorcar, S.; Park, Y.; Grimes, C.A.; In, S.I. Hybrid CuxO–TiO2 Heterostructured Composites for Photocatalytic CO2 Reduction into Methane Using Solar Irradiation: Sunlight into Fuel. ACS Omega 2016, 1, 868–875. [Google Scholar] [CrossRef]
  19. Lee, M.S.; Hong, M.S.-S.; Mohseni, M. Synthesis of photocatalytic nanosized TiO2–Ag particles with sol–gel method using reduction agent. J. Mol. Catal. A Chem. 2005, 242, 135–140. [Google Scholar] [CrossRef]
  20. Roy, P.; Ho, L.; Periasamy, A.P.; Lin, Y.; Huang, M.; Chang, H. Graphene-ZnO-Au nanocomposites based photocatalytic oxidation of benzoic acid. Sciencejet 2015, 4, 1–7. [Google Scholar]
  21. Xia, Y.; Yang, P.; Sun, Y.; Wu, Y.; Mayers, B.; Gates, B.; Yin, Y.; Kim, F.; Yan, H. One-Dimensional Nanostructures: Synthesis, Characterization, and Applications. Adv. Mater. 2003, 15, 353–389. [Google Scholar] [CrossRef]
  22. Papp, S.; Kõrösi, L.; Meynen, V.; Cool, P.; Vansant, E.F.; Dékány, I. The influence of temperature on the structural behaviour of sodium tri-and hexa-titanates and their protonated forms. J. Solid State Chem. 2005, 178, 1614–1619. [Google Scholar] [CrossRef]
  23. Jian, Z.; Huang, S.; Zhang, Y. Photocatalytic degradation of 2,4-dichlorophenol using nanosized Na2Ti6O13/TiO2 heterostructure particles. Int. J. Photoenergy 2013, 2013, 1–7. [Google Scholar] [CrossRef] [Green Version]
  24. Zhang, X.K.; Yuan, J.J.; Yu, H.J.; Zhu, X.R.; Yin, Z.; Shen, H.; Xie, Y.M. Synthesis, conversion, and comparison of the photocatalytic and electrochemical properties of Na2Ti6O13 and Li2Ti6O13 nanobelts. J. Alloys Compd. 2015, 631, 171–177. [Google Scholar] [CrossRef]
  25. Zhang, Y.; Zhang, Y.; Fu, B.; Li, W.; Guo, W.; Ruan, S.; Liu, D.; Chen, Y. Sodium Titanate Nanorod Moisture Sensor and Its Sensing Mechanism. IEEE Electron Device Lett. 2013, 34, 424–1426. [Google Scholar] [CrossRef]
  26. Wang, B.L.; Chen, Q.; Wang, L.H.; Peng, L.M. Synthesis and characterization of K2Ti6O13 nanowires. Chem. Phys. Lett. 2003, 376, 726–731. [Google Scholar] [CrossRef]
  27. Alam, U.; Ali, D.; Bahnemann, D.; Muneer, M. Surface modification of Na-K2Ti6O13 photocatalyst with Cu (II)-nanocluster for efficient visible-light-driven photocatalytic activity. Mater. Lett. 2018, 220, 50–53. [Google Scholar]
  28. Štengl, V.; Bakardjieva, S.; Šubrt, J.; Večerníková, E.; Szatmary, L.; Klementová, M.; Balek, V. Sodium titanate nanorods: Preparation, microstructure characterization and photocatalytic activity. Appl. Catal. B 2006, 63, 20–30. [Google Scholar] [CrossRef]
  29. Torres-Martínez, L.M.; Sánchez-Trinidad, C.; Rodríguez-González, V.; Lee, S.W.; Gómez, R. Synthesis, characterization, and 2,4-dichlorophenoxyacetic acid degradation on In-Na2Ti6O13 sol–gel prepared photocatalysts. Res. Chem. Intermed. 2010, 36, 5–15. [Google Scholar] [CrossRef]
  30. Yang, J.; Liu, B.; Zhao, X. A visible-light-active Au-Cu(I)@Na2Ti6O13 nanostructured hybrid pasmonic photocatalytic membrane for acetaldehyde elimination. Chin. J. Catal. 2017, 38, 2048–2055. [Google Scholar] [CrossRef]
  31. Ibarra-Rodríguez, L.I.; Huerta-Flores, A.M.; Torres-Martínez, L.M. Development of Na2Ti6O13/CuO/Cu2O heterostructures for solar photocatalytic production of low-carbon fuels. Mater. Res. Bull. 2020, 122, 110679. [Google Scholar] [CrossRef]
  32. Zhu, X.; Anzai, A.; Yamamoto, A.; Yoshida, H. Silver-loaded sodium titanate photocatalysts for selective reduction of carbon dioxide to carbon monoxide with water. Appl. Catal. B 2019, 243, 47–56. [Google Scholar] [CrossRef]
  33. Grover, I.S.; Singh, S.; Pal, B. A comprehensive systematic review of photocatalytic degradation of pesticides using nano TiO2. RSC Adv. 2014, 4, 51342–51348. [Google Scholar] [CrossRef]
  34. da Silva, J.P.; Biondo, M.M.; Nobre, F.X.; Anglada-Rivera, J.; Almeida, A.; Agostinho-Moreira, J.; Sanches, E.A.; Paula, M.D.S.; Aguilera, L.; Leyet, Y. Structure and electrical properties of the composite Na2Ti3O7/Na2Ti6O13/POMA: A study of the effect of adding POMA. J. Alloys Compd. 2021, 867, 159025. [Google Scholar] [CrossRef]
  35. Vázquez-Cuchillo, O.; Gómez, R.; Cruz-López, A.; Torres-Martínez, L.M.; Zanella, R.; Sandoval, F.A.; Del Ángel-Sánchez, K. Improving water splitting using RuO2-Zr/Na2Ti6O13 as a photocatalyst. J. Photochem. Photobiol. A 2013, 266, 6–11. [Google Scholar] [CrossRef]
  36. Zheng, H.; Svengren, H.; Huang, Z.; Yang, Z.; Zou, X.; Johnsson. Hollow titania spheres loaded with noble metal nanoparticles for photocatalytic water oxidation. Microporous Mesoporous Mater. 2018, 264, 147–150. [Google Scholar] [CrossRef]
  37. Chowdhury, I.H.; Roy, M.; Kundu, S.; Naskar, M.K. TiO2 hollow microspheres impregnated with biogenic gold nanoparticles for the efficient visible light-induced photodegradation of phenol. J. Phys. Chem. Solids 2019, 129, 329–339. [Google Scholar] [CrossRef]
  38. Stevenson, K.J. Review of originpro 8.5. J. Am. Chem. Soc. 2011, 133, 5621. [Google Scholar] [CrossRef]
  39. Eddy, D.R.; Ishmah, S.N.; Permana, M.D.; Firdaus, M.L. Synthesis of titanium dioxide/silicon dioxide from beach sand as photocatalyst for Cr and Pb remediation. Catalysts 2020, 10, 1248. [Google Scholar] [CrossRef]
  40. Lestari, P.R.; Takei, T.; Yanagida, S.; Kumada, N. Facile and controllable synthesis of Zn-Al layered double hydroxide/silver hybrid by exfoliation process and its plasmonic photocatalytic activity of phenol degradation. Mater. Chem. Phys. 2020, 250, 122988. [Google Scholar] [CrossRef]
  41. Al-Owaisi, M.; Al-Hadiwi, N.; Khan, S.A. GC-MS analysis, determination of total phenolics, flavonoid content and free radical scavenging activities of various crude extracts of Moringa peregrina (Forssk.) Fiori leaves. Asian Pac. J. Trop. Biomed. 2014, 4, 964–970. [Google Scholar] [CrossRef]
  42. Murugesan, S.; Kuppusami, P.; Mohandas, E. Rietveld X-ray diffraction analysis of nanostructured rutile films of titania prepared by pulsed laser deposition. Mater. Res. Bull. 2010, 45, 6–9. [Google Scholar] [CrossRef]
  43. Torres-Martínez, L.M.; Juárez-Ramírez, I.; Del Ángel-Sánchez, K.; Garza-Tovar, L.; Cruz-López, A.; Del Ángel, G. Rietveld refinement of sol–gel Na2Ti6O13 and its photocatalytic performance on the degradation of methylene blue. J. Sol-Gel Sci. Technol. 2008, 47, 158–164. [Google Scholar] [CrossRef]
  44. Tatge, E.; Swanson, H.E. Zeitschrift fuer Kristallographie, Kristallgeometrie, Kristallphysik. Kristallchemie 1956, 107, 357–361. [Google Scholar]
  45. Degen, T.; Sadki, M.; Bron, E.; König, U.; Nénert, G. The highscore suite. Powder Diffr. 2014, 29, S13–S18. [Google Scholar] [CrossRef] [Green Version]
  46. Toby, B.H. R factors in Rietveld analysis: How good is good enough? Powder Diffr. 2006, 21, 67–70. [Google Scholar] [CrossRef]
  47. Yang, W.; Shen, H.; Min, H.; Ge, J. Enhanced visible light-driven photodegradation of rhodamine B by Ti3+ self-doped TiO2@Ag nanoparticles prepared using Ti vapor annealing. J. Mater. Sci. 2020, 55, 701–712. [Google Scholar] [CrossRef]
  48. Bargui, M.; Messaoud, M.; Elleuch, K. Electrophoretic impregnation of porous anodizing layer by synthesized TiO2 nanoparticles. Surf. Eng. Appl. Electrochem. 2017, 53, 467–474. [Google Scholar] [CrossRef]
  49. Alam, N.; Khatoon, T.; Chandel, V.S.; Azam, A. Comparative Analysis of Sodium Hexa-titanate (Na2Ti6O13) & Sodium-Potassium Hexa-titanate (Na1.5K0.5Ti6O13). J. Phys. Conf. Ser. 2020, 1495, 012034. [Google Scholar]
  50. Shirpour, M.; Cabana, J.; Doeff, M. New materials based on a layered sodium titanate for dual electrochemical Na and Li intercalation systems. Energy Environ. Sci. 2013, 6, 2538–2547. [Google Scholar] [CrossRef]
  51. Bobrova, A.M.; Zhigun, I.G.; Bragina, M.I.; Fotiev, A.A. Infrared absorption spectra of various titanium compounds. Appl. Spectrosc. 1968, 8, 59–63. [Google Scholar] [CrossRef]
  52. Kowalska, E.; Rau, S.; Ohtani, B. Plasmonic titania photocatalysts active under UV and visible-light irradiation: Influence of gold amount, size, and shape. J. Nanotechnol. 2012, 2012, 1–11. [Google Scholar] [CrossRef]
  53. Haiss, W.; Thanh, N.T.; Aveyard, J.; Fernig, D.G. Determination of size and concentration of gold nanoparticles from UV−Vis spectra. Anal. Chem. 2007, 79, 4215–4221. [Google Scholar] [CrossRef] [PubMed]
  54. Oliveira, J.P.; Prado, A.R.; Keijok, W.J.; Ribeiro, M.R.; Pontes, M.J.; Nogueira, B.V.; Guimaraes, M.C. A helpful method for controlled synthesis of monodisperse gold nanoparticles through response surface modeling. Arab. J. Chem. 2020, 13, 216–226. [Google Scholar] [CrossRef]
  55. Eddy, D.R.; Ishmah, S.N.; Permana, M.D.; Firdaus, M.L.; Rahayu, I.; El-Badry, Y.A.; Hussein, E.E.; El-Bahy, Z.M. Photocatalytic Phenol Degradation by Silica-Modified Titanium Dioxide. Appl. Sci. 2021, 11, 9033. [Google Scholar] [CrossRef]
  56. Kolaei, M.; Tayebi, M.; Lee, B.K. The synergistic effects of acid treatment and silver (Ag) loading for substantial improvement of photoelectrochemical and photocatalytic activity of Na2Ti3O7/TiO2 nanocomposite. Appl. Surf. Sci. 2021, 540, 148359. [Google Scholar] [CrossRef]
  57. Swamy, N.K.; Singh, P.; Sarethy, I.P. Precipitation of phenols from paper industry wastewater using ferric chloride. Rasayan J. Chem. 2011, 4, 452–456. [Google Scholar]
  58. Massoudinejad, M.; Mehdipour-Rabori, M.; Dehghani, M.H. Treatment of natural rubber industry wastewater through a combination of physicochemical and ozonation processes. J. Adv. Environ. Health Res. 2015, 3, 242–249. [Google Scholar]
  59. Yaseen, D.A.; Scholz, M. extile dye wastewater characteristics and constituents of synthetic effluents: A critical review. Int. J. Environ. Sci. Technol. 2019, 16, 1193–1226. [Google Scholar] [CrossRef]
  60. Hu, J.; Zhang, S.; Cao, Y.; Wang, H.; Yu, H.; Peng, F. Novel highly active anatase/rutile TiO2 photocatalyst with hydrogenated heterophase interface structures for photoelectrochemical water splitting into hydrogen. ACS Sustain. Chem. Eng. 2018, 6, 10823–10832. [Google Scholar] [CrossRef]
  61. Ding, L.; Yang, S.; Liang, Z.; Qian, X.; Chen, X.; Cui, H.; Tian, J. TiO2 nanobelts with anatase/rutile heterophase junctions for highly efficient photocatalytic overall water splitting. J. Colloid Interface Sci. 2020, 567, 181–189. [Google Scholar] [CrossRef]
  62. Pu, S.; Hou, Y.; Chen, H.; Deng, D.; Yang, Z.; Xue, S.; Zhu, R.; Diao, Z.; Chu, W. An efficient photocatalyst for fast reduction of Cr (VI) by ultra-trace silver enhanced titania in aqueous solution. Catalysts 2018, 8, 251. [Google Scholar] [CrossRef]
  63. Mostafa, N.Y.; El-Bahy, Z.M. Effect of microwave heating on the structure, morphology and photocatalytic activity of hydrogen titanate nanotubes. J. Environ. Chem. Eng. 2015, 3, 744–751. [Google Scholar] [CrossRef]
  64. Salama, T.M.; El-Bahy, Z.M.; Zidan, F.I. Aqueous H2O2 as an oxidant for CO over Pt–and Au–NaY catalysts. J. Mol. Catal. A Chem. 2007, 264, 128–134. [Google Scholar] [CrossRef]
  65. Wu, T.; Liu, G.; Zhao, J.; Hidaka, H.; Serpone, N. Photoassisted degradation of dye pollutants. V. Self-photosensitized oxidative transformation of rhodamine B under visible light irradiation in aqueous TiO2 dispersions. J. Phys. Chem. B 1998, 102, 5845–5851. [Google Scholar] [CrossRef]
  66. Yu, Y.; Wen, W.; Qian, X.Y.; Liu, J.B.; Wu, J.M. UV and visible light photocatalytic activity of Au/TiO2 nanoforests with Anatase/Rutile phase junctions and controlled Au locations. Sci. Rep. 2017, 7, 141253. [Google Scholar] [CrossRef] [PubMed]
  67. Garay-Rodríguez, L.F.; Torres-Martínez, L.M. Photocatalytic CO2 reduction over A2Ti6O13 (A= Na and K) titanates synthesized by different pH-catalyzed sol–gel. J. Sol-Gel Sci. Technol. 2020, 93, 428–437. [Google Scholar] [CrossRef]
  68. Chenchana, A.; Nemamcha, A.; Moumeni, H.; Rodríguez, J.D.; Araña, J.; Navío, J.A.; Díaz, O.G.; Melián, E.P. Photodegradation of 2,4-dichlorophenoxyacetic acid over TiO2 (B)/anatase nanobelts and Au-TiO2 (B)/anatase nanobelts. Appl. Surf. Sci. 2019, 467, 1076–1087. [Google Scholar] [CrossRef]
  69. Sin, J.C.; Lam, S.M.; Zeng, H.; Lin, H.; Li, H.; Tham, K.O.; Mohamed, A.R.; Lim, J.W.; Qin, Z. Magnetic NiFe2O4 nanoparticles decorated on N-doped BiOBr nanosheets for expeditious visible light photocatalytic phenol degradation and hexavalent chromium reduction via a Z-scheme heterojunction mechanism. Appl. Surf. Sci. 2021, 559, 149966. [Google Scholar] [CrossRef]
  70. Ren, T.; Jin, Z.; Yang, J.; Hu, R.; Zhao, F.; Gao, X.; Zhao, C. Highly efficient and stable p-LaFeO3/n-ZnO heterojunction photocatalyst for phenol degradation under visible light irradiation. J. Hazard. Mater. 2019, 377, 195–205. [Google Scholar] [CrossRef]
  71. Chowdhury, P.; Nag, S.; Ray, A.K. Degradation of phenolic compounds through UV and visible-light-driven photocatalysis: Technical and economic aspects. In Phenolic Compounds-Natural Sources, Importance and Applications; Soto-Hernandez, M., Palma-Tenango, M., Garcia-Mateos, M.R., Eds.; IntechOpen: London, UK, 2017; Volume 16, pp. 395–417. [Google Scholar]
  72. Bockenstedt, J.; Vidwans, N.A.; Gentry, T.; Vaddiraju, S. Catalyst recovery, regeneration and reuse during large-scale disinfection of water using photocatalysis. Water 2021, 13, 2623. [Google Scholar] [CrossRef]
  73. Ray, A.K. Design, modelling and experimentation of a new large-scale photocatalytic reactor for water treatment. Chem. Eng. Sci. 1999, 54, 3113–3125. [Google Scholar] [CrossRef]
  74. Mueses, M.A.; Colina-Márquez, J.; Machuca-Martínez, F.; Puma, G.L. Recent advances on modeling of solar heterogeneous photocatalytic reactors applied for degradation of pharmaceuticals and emerging organic contaminants in water. Curr. Opin. Green Sustain. Chem. 2021, 30, 100486. [Google Scholar] [CrossRef]
  75. Durán, A.; Monteagudo, J.M.; San Martín, I. Photocatalytic treatment of an industrial effluent using artificial and solar UV radiation: An operational cost study on a pilot plant scale. J. Environ. Manag. 2012, 98, 1–4. [Google Scholar] [CrossRef]
  76. Feitz, A.J.; Boyden, B.H.; Waite, T.D. Evaluation of two solar pilot scale fixed-bed photocatalytic reactors. Water Res. 2000, 34, 3927–3932. [Google Scholar] [CrossRef]
  77. Alalm, M.G.; Djellabi, R.; Meroni, D.; Pirola, C.; Bianchi, C.L.; Boffito, D.C. Toward scaling-up photocatalytic process for multiphase environmental applications. Catalysts 2021, 11, 562. [Google Scholar] [CrossRef]
  78. Sacco, O.; Vaiano, V.; Sannino, D. Main parameters influencing the design of photocatalytic reactors for wastewater treatment: A mini review. J. Chem. Technol. Biotechnol. 2020, 95, 2608–2618. [Google Scholar] [CrossRef]
  79. Baaloudj, O.; Badawi, A.K.; Kenfoud, H.; Benrighi, Y.; Hassan, R.; Nasrallah, N.; Assadi, A.A. Techno-economic studies for a pilot-scale Bi12TiO20 based photocatalytic system for pharmaceutical wastewater treatment: From laboratory studies to commercial-scale applications. J. Water Process Eng. 2022, 48, 102847. [Google Scholar] [CrossRef]
  80. Boczkaj, G.; Fernandes, A. Wastewater treatment by means of advanced oxidation processes at basic pH conditions: A review. Chem. Eng. J. 2017, 320, 608–633. [Google Scholar] [CrossRef]
  81. Fernandes, A.; Gągol, M.; Makoś, P.; Khan, J.A.; Boczkaj, G. Integrated photocatalytic advanced oxidation system (TiO2/UV/O3/H2O2) for degradation of volatile organic compounds. Sep. Purif. Technol. 2019, 224, 1–14. [Google Scholar] [CrossRef]
  82. Sponza, D.T.; Güney, G. Photodegradation of some brominated and phenolic micropollutants in raw hospital wastewater with CeO2 and TiO2 nanoparticles. Water Sci. Technol. 2017, 76, 2603–2622. [Google Scholar] [CrossRef]
  83. Balakrishnan, A.; Gopalram, K.; Appunni, S. Photocatalytic degradation of 2,4-dicholorophenoxyacetic acid by TiO2 modified catalyst: Kinetics and operating cost analysis. Environ. Sci. Pollut. Res. 2021, 28, 33331–33343. [Google Scholar] [CrossRef]
  84. Ragadhita, R.; Nandiyanto, A.B.D.; Maulana, A.C.; Oktiani, R.; Sukmafitri, A.; Machmud, A.; Surachman, E. Techno-economic analysis for the production of titanium dioxide nanoparticle produced by liquid-phase synthesis method. J. Eng. Sci. Technol. 2019, 14, 1639–1652. [Google Scholar]
  85. Nurdiana, A.; Astuti, L.; Dewi, R.P.; Ragadhita, R.; Nandiyanto, A.B.D.; Kurniawan, T. Techno-economic analysis on the production of zinc sulfide nanoparticles by microwave irradiation method. ASEAN J. Sci. Eng. 2022, 2, 143–156. [Google Scholar] [CrossRef]
  86. Eustis, S.; Hsu, H.Y.; El-Sayed, M.A. Gold nanoparticle formation from photochemical reduction of Au3+ by continuous excitation in colloidal solutions. A proposed molecular mechanism. J. Phys. Chem. B 2005, 109, 4811–4815. [Google Scholar] [CrossRef] [PubMed]
Figure 1. Synthesis preparation for Au/TiO2/NTO composites.
Chemengineering 06 00069 g001
Figure 2. X-ray diffraction pattern (a) TiO2/NTO, (b) 1% Au/TiO2/NTO, (c) 2% Au/TiO2/NTO, and (d) 3% Au/TiO2/NTO.
Chemengineering 06 00069 g002
Figure 3. Crystal structure of NTO and rutile.
Chemengineering 06 00069 g003
Figure 4. SEM image with of (a,b) TiO2/NTO, (c,d) 1% Au/TiO2/NTO, (e,f) 2% Au/TiO2/NTO, (g,h) 3% Au/TiO2/NTO.
Chemengineering 06 00069 g004aChemengineering 06 00069 g004b
Figure 5. (a) TEM image and (b) SAED pattern of TiO2/NTO, (c) TEM image and (d) SAED pattern of Au/TiO2/NTO.
Chemengineering 06 00069 g005
Figure 6. Infrared spectra of (a) 1% Au/TiO2/NTO, (b) 2% Au/TiO2/NTO, and (c) 3% Au/TiO2/NTO.
Chemengineering 06 00069 g006
Figure 7. (a) Absorption spectrum UV-vis spectroscopy of TiO2/NTO with varying Au loading (1, 2, and 3 wt%), and (b) Tauc plot obtained through the application of Equation (6) for the samples.
Chemengineering 06 00069 g007
Figure 8. (a) Decreased phenol concentration from Au/TiO2/NTO composite and TiO2 P25 standard, and (b) first-order Langmuir–Hinshelwood kinetics study on phenol degradation photocatalyst, with the initial concentration of 20 mg/L and 25 mg catalyst.
Chemengineering 06 00069 g008
Figure 9. Photocatalytic mechanism of phenol degradation by Au/TiO2/NTO composites.
Chemengineering 06 00069 g009
Figure 10. Proposed phenol degradation pathway of the Au/TiO2/NTO catalyst detected with GC-MS.
Chemengineering 06 00069 g010
Figure 11. (a) Break-even analysis and (b) the payback period using the proposed plant maintenance system in 5 years of operation using TiO2/Na2Ti6O13 composites.
Chemengineering 06 00069 g011
Table 1. Comparison of various composites of Na2Ti6O13 and their applications.
SampleRietveld Refinement Parameters
RexpRwpGoF
TiO2/NTO3.076.003.82
1% Au/TiO2/NTO2.775.734.28
2% Au/TiO2/NTO2.735.904.67
3% Au/TiO2/NTO2.575.023.81
Table 2. Percentage of phase composition and Rietveld refinement parameters of the samples.
SampleCrystal Phase (%)Crystallite Size (nm) *Crystallinity (%)
RutileNa2Ti6O13GoldRutileNa2Ti6O13Gold
TiO2/NTO43.456.6-38.08 ± 5.9825.20 ± 4.35-76.05
1% Au/TiO2/NTO48.950.90.238.96 ± 4.7725.60 ± 3.5916.42 ± 4.7283.32
2% Au/TiO2/NTO41.854.43.839.48 ± 4.2525.39 ± 6.2116.95 ± 4.0783.00
3% Au/TiO2/NTO44.050.06.040.10 ± 4.9025.08 ± 5.4819.57 ± 4.9084.48
* Mean ± standard deviation.
Table 3. Crystal lattice parameters of the samples.
SampleRutileNa2Ti6O13Gold
a = b (Å)c (Å)V (Å3)a (Å)b (Å)c (Å)β (°)V (Å3)a = b = c (Å)V (Å3)
ICSD 98-016-59204.6002.96062.630-------
ICSD 98-016-3491---15.0953.7459.17499.010512.210--
ICSD 98-006-4701--------4.07967.870
TiO2/NTO4.5932.95862.41415.1313.7409.17199.110512.451--
1% Au/TiO2/NTO4.5922.95862.37115.1233.7399.17399.081512.1834.07967.867
2% Au/TiO2/NTO4.5942.95862.43615.1473.7419.17099.128513.0044.08167.982
3% Au/TiO2/NTO4.5932.95862.41615.1313.7409.17399.087512.5814.07967.865
Table 4. Comparison of various composites of Na2Ti6O13 and their applications.
CompositeApplicationRef.
CuO/Cu2O/Na2Ti6O13Photocatalytic H2 evolution and CO2 reduction[31]
In/Na2Ti6O13Photocatalytic degradation of 2,4-dichlorophenoxyacetic acid[29]
TiO2/Na2Ti6O13Photocatalytic degradation of 2,4-dichlorophenol[23]
Ag/TiO2/Na2Ti3O7Photocatalytic degradation of RhB[56]
Au/TiO2/Na2Ti6O13Photocatalytic degradation of phenolThis research
Table 5. Percentage of adsorption and degradation for phenol photodegradation and parameters of kinetic studies.
SamplePhenol Adsorption (%)Phenol Degradation (%)Langmuir-Hinshelwood Kinetic
k1 (min−1)r0 (mg/L·min)R2
TiO2 P251.4173.130.01080.21600.8663
TiO2/NTO1.6857.170.00710.14200.8859
1% Au/TiO2/NTO1.8158.400.00760.15200.9246
2% Au/TiO2/NTO2.8860.400.00820.16400.9355
3% Au/TiO2/NTO3.3982.940.01460.29200.9092
Table 6. Economic evaluation for the proposed Au/TiO2/Na2Ti6O13-based photocatalytic treatment system.
Capitals Cost
Fabrication reactor cost (V = 0.36 m3)4000 USD/m3USD 1440
Mechanical and electrical equipment2500 USD/m3USD 900
TotalUSD 2340
Operating Costs
Catalytic material preparation cost Au/TiO2/NTO (for 0.15 g/L dose)
TTIP (4 g for 1 g TiO2/NTO)0.534 kg TTIP/m3 RC = 1800 USD/ton 0.961 USD/m3
HPC (0.4 g for 1 g TiO2/NTO)0.057 kg HPC/m3 RC = 6500 USD/ton 0.370 USD/m3
NaOH (0.8 g for 1 g TiO2/NTO) 0.114 kg NaOH/m3 RC = 500 USD/ton 0.057 USD/m3
HCl (0.38 g for 1 g TiO2/NTO) 0.055 kg HCl/m3 RC = 200 USD/ton 0.011 USD/m3
NaBH4 (0.011 g for 1 g TiO2/NTO) 3.246 g NaBH4/m3RC = 30 USD/kg 0.097 USD/m3
HauCl4 (0.047 g for 1 g TiO2/NTO) 13.47 g HauCl4/m3 RC = 20,000 USD/kg 269.400 USD/m3
Total270.896 USD/m3
Energy Consumption Cost
UV lamps (2 × 400 kWh)4.44 kWh/m30.074 USD/kWh0.329 USD/m3
Pump and stirrer (400 kWh)2.22 kWh/m30.074 USD/kWh0.164 USD/m3
Total0.493 USD/m3
Material Treatment Cost 13.545 USD/m3
Technicians Cost 14.467 USD/m3
Total28.012 USD/m3
Publisher’s Note: MDPI stays neutral with regard to jurisdictional claims in published maps and institutional affiliations.

