Article

Facile Synthesis Method of Zeolite NaY and Zeolite NaY-Supported Ni Catalyst with High Catalytic Activity for the Conversion of CO2 to CH4

by
Somkiat Krachuamram
1,
Pinit Kidkhunthod
2,
Yingyot Poo-arporn
2 and
Kingkaew Chayakul Chanapattharapol
1,*
1
Materials Chemistry Research Center, Department of Chemistry and Center of Excellence for Innovation in Chemistry, Faculty of Science, Khon Kaen University, Khon Kaen 40002, Thailand
2
Synchrotron Light Research Institute, Nakhon Ratchasima 30000, Thailand
*
Author to whom correspondence should be addressed.
Submission received: 2 January 2024 / Revised: 6 February 2024 / Accepted: 7 February 2024 / Published: 1 March 2024

Abstract

:
In this work, the facile reflux method was used as a crystallization procedure for zeolite NaY synthesis. The zeolite mixture was aged for 7 days and then refluxed for crystallization at 100 °C for 12 h. The synthesized zeolite NaY was impregnated with 10, 20 and 30 wt%Ni solution to use as a catalyst for CO2 methanation. The 30 wt% of Ni on the zeolite NaY catalyst showed the highest CO2 methanation catalytic activity, with almost 100% CH4 selectivity. This can be explained by an appropriate H2 and CO2 adsorption amount on a catalyst surface being able to facilitate the surface reaction between them and further react to form products. The oxidation state of Ni and the stability of the catalyst were monitored by time-resolved X-ray absorption spectroscopy. The oxidation state of Ni2+ was reduced during the catalyst reduction prior to the CO2 methanation and it was completely reduced to Ni° at 600 °C. During CO2 methanation, Ni° remained unchanged. In addition, the stability test of the catalyst was conducted by exposing the catalyst to a fluctuating condition (CO2 + H2 and only CO2). The oxidation state of Ni° remained unchanged under the fluctuating condition. This indicated that the Ni/zeolite catalyst has high stability, which can be attributed to an appropriate binding strength between Ni and the zeolite support.

1. Introduction

CO2 hydrogenation or CO2 methanation is a promising method for solving CO2 emissions by utilizing the waste CO2 as a starting feed chemical. The CO2 methanation is expressed as Equation (1):
CO2 + 4H2 ⇌ CH4 + 2H2O   ΔH298K = −165 kJ/mol
However, this reaction exhibits large exothermic energy and it has a high kinetic barrier; thus, a catalyst is required to accelerate the reaction. One approach for enhancing catalytic activity is to increase the reactants’ adsorption probability. For the CO2 methanation reaction, CO2 and H2 are usually adsorbed on different sites on the catalyst’s surface. In a typical heterogeneous catalytic system, the dissociative adsorption of H2 often occurs on a metal active site, which is deposited on a catalyst support, while the adsorption of CO2 often occurs on a catalyst support [1,2,3]. It is accepted that Ni was a suitable active metal for this reaction because of its high activity, high selectivity and low price [4,5,6]. For catalyst support, mesoporous solid oxides with high surface area and pore volume such as SiO2, Al2O3 and zeolite are usually used for this reaction. It has been reported that tuning the surface properties of the catalyst support can also alter the active metal properties [7,8,9,10,11]. A high surface area and pore volume of supports can promote the dispersion of metal active species, which then facilitates the adsorption of H2 molecules. Moreover, the interaction between the support and metal active species or metal–support interaction also plays an important role in catalyst reducibility, which affects the adsorption behavior of both reactants. From our previous work [2,12,13], we found that the surface area and pore volume of a catalyst support plays important roles in the reducibility and basicity properties of catalysts, which plays a dominant role in CO2 methanation catalytic activity. Zeolite NaY with faujasite (FAU)-type zeolite has been extensively used as a catalyst or catalyst support for hydrocracking reactions, CO2 hydrogenation, biodiesel production and CO2 methanation [14,15,16,17]. The advantage of using zeolite NaY as a catalyst support is its high surface area (400–600 m2/g), which can increase the dispersion of deposited particles of metals and consequently reduce the sintering of those metals during high reaction temperatures. In addition to its high surface area, the high pore volume of zeolite NaY (0.74 nm supercage) can also enhance CO2 diffusion [8]. Moreover, the sodium form of zeolite is beneficial for CO2 methanation since compensating Na ions in zeolite present higher basicity than the protonic (H+) form, which can increase the CO2 adsorption capacity. In addition, the Na form of zeolite can also improve the Ni reducibility of a zeolite-supported nickel catalyst [18,19].
Typical zeolite synthesis procedures are usually conducted under a high-pressure reactor; thus, an instrumental setup with a high degree of safety must be a major concern. Normally, the zeolite synthesis procedure consists of two main steps: nucleation and crystallization. For nucleation, silicon and aluminum source solutions are mixed together to obtain a zeolite mixture. In this step, the zeolite mixture is usually aged for a period of time to produce a nucleation precursor. For the crystallization step, the zeolite mixture is heated, which leads to the growth of the nucleation precursor and the formation of a zeolite. In this step, a high-pressure vessel is usually used to promote the crystallization of the zeolite. However, the heating of the high-pressure vessel must be carefully handled. A large number of research groups have proposed a facile zeolite synthesis method under mild conditions (ambient pressure) to reduce the risk of a high-pressure reactor explosion [20,21,22]. Wang et al. [20] reported a zeolite Y synthesis method under ambient pressure. The synthesis procedure was conducted in an open system using a glass tube as a reactor. Sun and coworkers [21] also reported a general method for LTA, FAU, BEA and MFI zeolite synthesis methods under atmospheric pressure using a conventional device (a reflux flask as a reactor). The zeolite precursors can be synthesized by heating and stirring liquid reflux. Herein, a facile crystallization method using reflux was used for zeolite synthesis. The as-synthesized zeolite NaY exhibited a high surface area and it was used as the catalyst support for the CO2 methanation reaction. Scheme 1 presents the scope of this work. Zeolite NaY was synthesized by mixing feed and seed gels to obtain a zeolite mixture. The zeolite mixture, which consisted of a nucleation precursor (aluminosilicate anion), was aged for 7 days. After that, the aged zeolite mixture was heated for crystallization by refluxing at 100 °C for 12 h. The obtained zeolite NaY had a high surface area. This indicates that this facile crystallization method has high potential to synthesize zeolite NaY. As-prepared zeolite NaY was used as a catalyst support, impregnated with 10, 20 and 30 wt%Ni solution. All modified catalysts were tested for CO2 methanation catalytic activity under atmospheric pressure in the temperature range of 100–500 °C. All synthesized samples were characterized by X-ray diffraction, transmission electron microscopy, N2 adsorption–desorption and temperature-programmed (H2-TPR, H2-TPD and CO2-TPD) techniques. Furthermore, we focused on describing the role of the catalyst in enhancing the CO2 methanation catalytic activity by in situ X-ray absorption spectroscopy (in situ XAS). The information obtained on the molecular level from the XAS technique can indicate the electronic changes to Ni during the reaction and also describe the stability of the catalyst.

2. Materials and Methods

2.1. Catalyst Preparation

2.1.1. Zeolite NaY Preparation

Zeolite NaY was prepared by mixing seed gel and feed gel. The seed gel contained 4.62 Na2O:Al2O3:10 SiO2:180 H2O and the feed gel was 10.67 Na2O:Al2O3:10 SiO2:180 H2O. The ratio of seed gel to feed gel was 1:9.
In a typical preparation, the seed gel was prepared by dissolving 2.96 g silica (SiO2) in sodium hydroxide solution to obtain a sodium silicate solution. Next, 0.80 g of sodium aluminate anhydrous was dissolved in a sodium hydroxide solution to attain a sodium aluminate solution. The sodium silicate solution and sodium aluminate solution were then mixed and stirred for a few minutes to obtain a seed gel. The seed gel was aged at room temperature for 1 day. The feed gel was prepared by dissolving 26.70 g of SiO2 in a sodium hydroxide solution. Next, 7.29 g of sodium aluminate anhydrous was dissolved in a sodium hydroxide solution. The two solutions were then mixed and stirred to obtain the feed gel. For the next step, the seed gel was mixed into the feed gel and transferred into a polypropylene bottle. The mixture was aged at room temperature. Then, the zeolite mixture was heated for crystallization at 100 °C for 12 h by reflux. Finally, the sample was filtered and dried at 80 °C for 12 h. The sample was denoted as ZY_xD, where D was the aging time of the zeolite mixture before crystallization.

2.1.2. Zeolite-Supported Ni Catalyst Preparation

We prepared 10, 20 and 30 wt%Ni/zeolite NaY catalysts using the wet impregnation method. The desired amount of Ni(NO3).6H2O was dissolved in distilled water and the synthesized zeolite NaY was immersed in this solution. The immersed sample was dried in an oven at 110 °C for 12 h and calcined at 450 °C for 2 h.

2.1.3. Characterization

X-ray diffraction patterns of all samples were obtained using a Panalytical Empyrean X-ray diffractometer (Marvern Panalytical Ltd., Marlvern, UK). The diffractogram was obtained in the 2θ range of 5° to 50°. The scan speed was 30 s/step and the increment was 0.02°.
The N2 adsorption–desorption isotherms of synthesized samples were carried out at −196 °C using a BELSORP MINI X surface area analyzer instrument (MicrotracBEL Corp., Osaka, Japan). The sample was degassed at 300 °C for 4 h prior to the gas adsorption experiment. The multipoint BET method was used to determine the specific surface area with the relative pressure (P/Po) range of 0.05 to 0.30.
The actual metal content was determined by atomic absorption spectroscopy (PerkinElmer Atomic Absorption Spectrometer PinAAcle 900F; PerkinElmer, CT, USA) with a wavelength of 232.00 nm for the Ni element.
The morphologies of all samples were obtained from a LEO1450VP Scanning Electron Microscope (Carl Zeiss, New York, NY, USA). The sample was first dispersed on carbon tape and then coated with gold ions under vacuum for 240 s. The TEM images of the synthesized samples were obtained from an FEI Tecnai G2 20 TWIN transmission electron microscope (FEI company, Hillsboro, OR, USA). Ethanol was used as the dispersing solvent. The sample was dispersed in ethanol and then the solution was dropped on the copper grid. The prepared copper grid was left out to dry the ethanol prior to measurement.
The H2-temperature program reduction (H2-TPR) profiles of all samples were obtained using Belcat B apparatus (MicrotracBEL Crop., Osaka, Japan). A 20 mg sample was first pretreated by He flowing at 120 °C for 30 min. After the sample had cooled down, a gas mixture of 5% H2 and 95% Ar was switched over the sample. The reduction temperature was increased up to 800 °C with a ramp rate of 10 °C/min. A thermal conductivity detector was used as a detector and a H2-TPR profile was constructed by plotting H2 consumption against temperature.
A CO2-tempreature program desorption (CO2-TPD) technique was used to determine the binding strength between CO2 and the catalyst. The CO2-TPD profiles were obtained from a Belcat II apparatus (MicrotracBEL Crop., Osaka, Japan). The sample was first pretreated under He (50 mL/min) at 150 °C for 60 min, and then the sample was cooled down to 50 °C. After that, a flow of CO2 was switched over the sample (30 mL/min) for 30 min at the same temperature. Then, a flow of He was switched back to remove any excess adsorbed CO2 at 50 °C for 60 min. Finally, the temperature of the system was increased up to 750 °C with a ramp rate of 10 °C/min to desorb the adsorbed CO2 on the catalyst surface. The desorbed CO2 was detected using the TCD detector.
The H2-tempreature program desorption (H2-TPD) technique was used to determine the strength of the binding between H2 and Ni active sites. An H2-TPD profile was obtained from the Belcat B apparatus (MicrotracBEL Crop., Osaka, Japan). A sample (50 mg) was pretreated under gas mixture (5%H2/95%Ar) with a flow rate of 50 mL/min at 600 °C for 90 min. After the pretreatment process, the sample was then cooled down to 50 °C under an Ar flow to remove weakly adsorbed H2 on the surface of the catalyst. Next, the sample was heated from 50 °C to 800 °C (10 °C /min) under an Ar flow with a rate of 60 mL/min. The TCD detector was used to detect the desorbed H2. An H2-TPD profile was constructed by plotting the desorbed H2 signal against temperature. To determine the dispersion of active metal on the surface of the catalyst, the H2-TPR information was also used. The dispersion of active metal can be calculated using the following equation [23].
D   ( % ) = 100   ×   2 × V ad × M × SF P × V m × d r   ,
where Vad (mL) is the chemisorbed H2 volume at standard temperature and pressure (STP), measured by TPD, M is the molar mass of Ni (58.69 g/mol), and P is the weight fraction of Ni in the sample, which was obtained by AAS. SF is the stoichiometric factor between Ni and H in the chemisorption, which was equal to 1, and Vm is the molar volume of H2 (22,414 cm3/mol) at STP. The dr is the reduction degree of nickel, which was obtained from H2-TPR.

2.1.4. CO2 Methanation Catalytic Activity Test

The CO2 methanation test was carried out using a fix-bed continuous-flow quartz reactor. Briefly, 50 mg of sample was packed into the reactor between two layers of quartz wool and the reactor was placed inside the temperature-controllable furnace. The reaction temperature inside the reactor was measured using a K-type thermocouple, which was placed on the top of the catalyst bed. The sample was first activated by H2 flowing at 600 °C for 90 min. Next, the reactor was cooled down to 100 °C. To start the CO2 methanation reaction, the mixed gas feed (24 mL/min H2, 6 mL/min CO2 and 10 mL/min He) was switched through the sample for 30 min. The remaining reactants and products were analyzed by an on-line GC Agilent 6890N Series, Agilent technology Gas Chromatography (Agilent, Santa Clara, CA, USA) with HEYSEPD Packed Column and TCD detector. The reaction temperature was increased by 50 °C for each step, up to 500 °C.
The catalyst activity was reported as the percentage of carbon dioxide conversion ( X C O 2 ) and selectivity to methane and carbon monoxide ( S C H 4 and S CO ) by the following equations:
X C O 2 = C C O 2 in   -   C C O 2 out C C O 2 in × 100 %
S C H 4 = C C H 4 C C H 4 + C CO × 100 %
S CO = C CO C C H 4 + C CO × 100 % ,
where C C O 2 in is the concentration of CO2 in the pre-reaction, C C O 2 out is the concentration of CO2 in the post-reaction, and C C H 4 ,   C CO were the concentrations of CH4 and CO in the post-reaction, respectively.
A separate experiment for kinetic study was carried out using the reaction temperature range of 175–275 °C (% conversion < 15%). Under this condition, the heat and mass transfer can be excluded. The rate of reaction can be determined by following equation:
Rate = ( F CO 2 W )   ×   X CO 2 ,
where F CO 2 is the total flow rate of CO2 (mol s−1) and W is the weight of the sample (g).

2.1.5. In Situ X-ray Absorption Spectroscopy

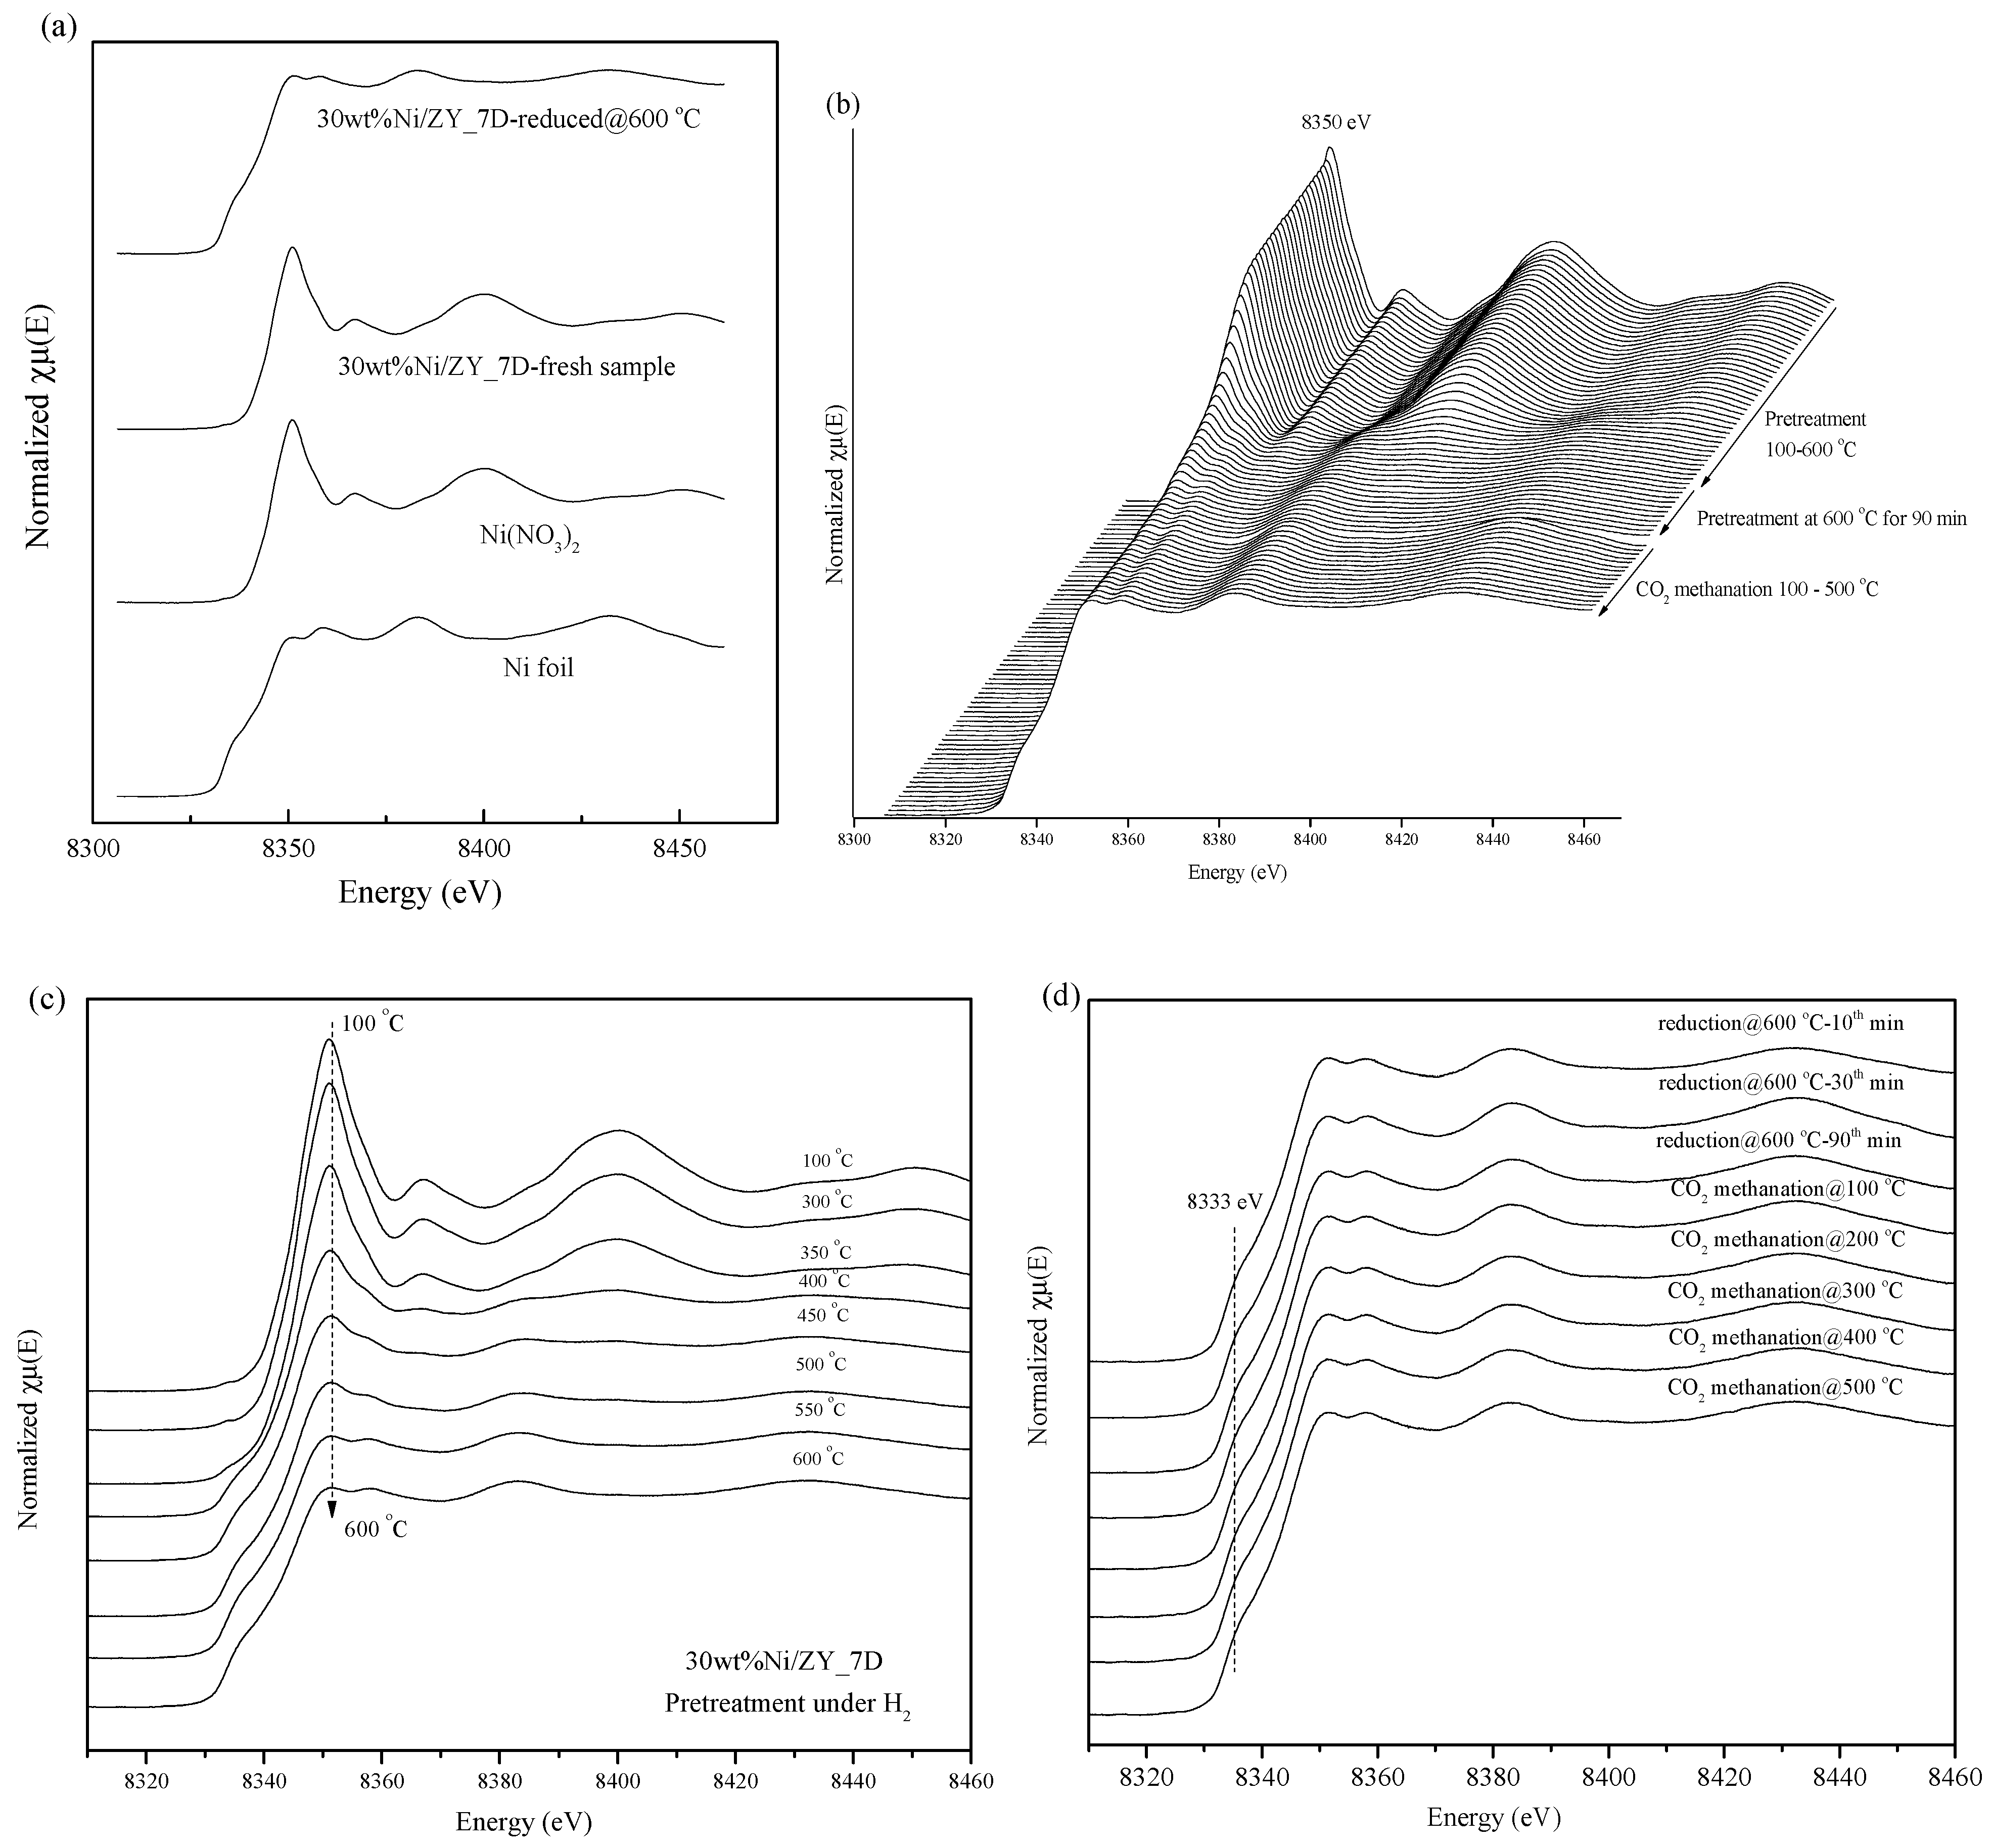
Oxidation State of Ni during CO2 Methanation

The oxidation state of Ni during the reduction process and CO2 methanation reaction was monitored by analyzing the data of the Ni K edge XANES spectra of the 30 wt%Ni/zeolite NaY sample. An in situ experiment was conducted at Beamline 2.2, with Time-Resolved X-ray absorption spectroscopy, at the Synchrotron Light Research Institute, Nakhon Ratchasima, Thailand. The XAS experiment was performed in transmission mode using an energy dispersive monochromator (EDM) with a bent Si (111) crystal (photon energy = 4–12 keV). An NMOS linear image sensor was used as a detector. The in situ experimental procedure was similar to the CO2 methanation catalytic activity test. First, the sample was mixed with boron nitride using a ball mill for 15 min. Then, the mixed sample was pressed into a pellet and put inside an in situ cell. The sample was reduced under H2 atmosphere (24 mL/min). After that, the in situ cell was heated from ambient temperature to 600 °C. XANES spectra were recorded at every 10 °C increment during the reduction temperature increases. The sample was reduced at this temperature (600 °C) for 90 min and the XANES spectra were recorded every 10 min. After pretreatment by gas reduction, the sample was cooled down to 100 °C and the mixed feed gas (H2; 24 mL/min and CO2; 6 mL/min) was then switched over the sample to start the CO2 methanation reaction with a total flow rate of 30 mL/min. The temperature was held for 10 min and the XANES spectra were recorded. The reaction temperature was increased every 50 °C until 500 °C and the XANES spectra at each temperature were collected. The XANES spectra were first corrected by the pre-processing program and then analyzed by the Athena program (Demeter, version 0.9.25).

Local Environment of Ni during CO2 Methanation

The local environmental changes of the Ni probe atom, during the CO2 methanation reaction, were carried out at the SUT-NANOTEC-SLRI XAS Beamline (BL5.2) of the Synchrotron Light Research Institute (SLRI), Nakhon Ratchasima, Thailand. The EXAFS of the Ni K edge of 30 wt%Ni/zeolite NaY was obtained by transmission mode. The ionization chamber, which was installed in front of and behind the sample, was used as a detector to measure the incident (I0) and transmitted (I1) beam, respectively. The Ge (220) was used as a double crystal monochromator (DCM) to select an appropriate photon energy. An in situ experiment was started by placing the pressed sample in an in situ cell and then reducing the sample under H2 flow (24 mL/min) at 600 °C for 90 min. At this reduction state, the EXAFS spectra were recorded. Next, the CO2 methanation was started by cooling down the sample to 100 °C and switching the feed stream (H2:CO2 ratio = 4:1) over the sample (30 mL/min). The sample was kept at this temperature for 30 min and the EXAFS spectra was recorded at this state. Following this, the sample was heated up by 50 °C for each step until it reached to 500 °C. The EXAFS spectra were collected during the holding period at each temperature. All EXFAS spectra were analyzed by the Athena and Artemis programs (Demeter, version 0.9.25).

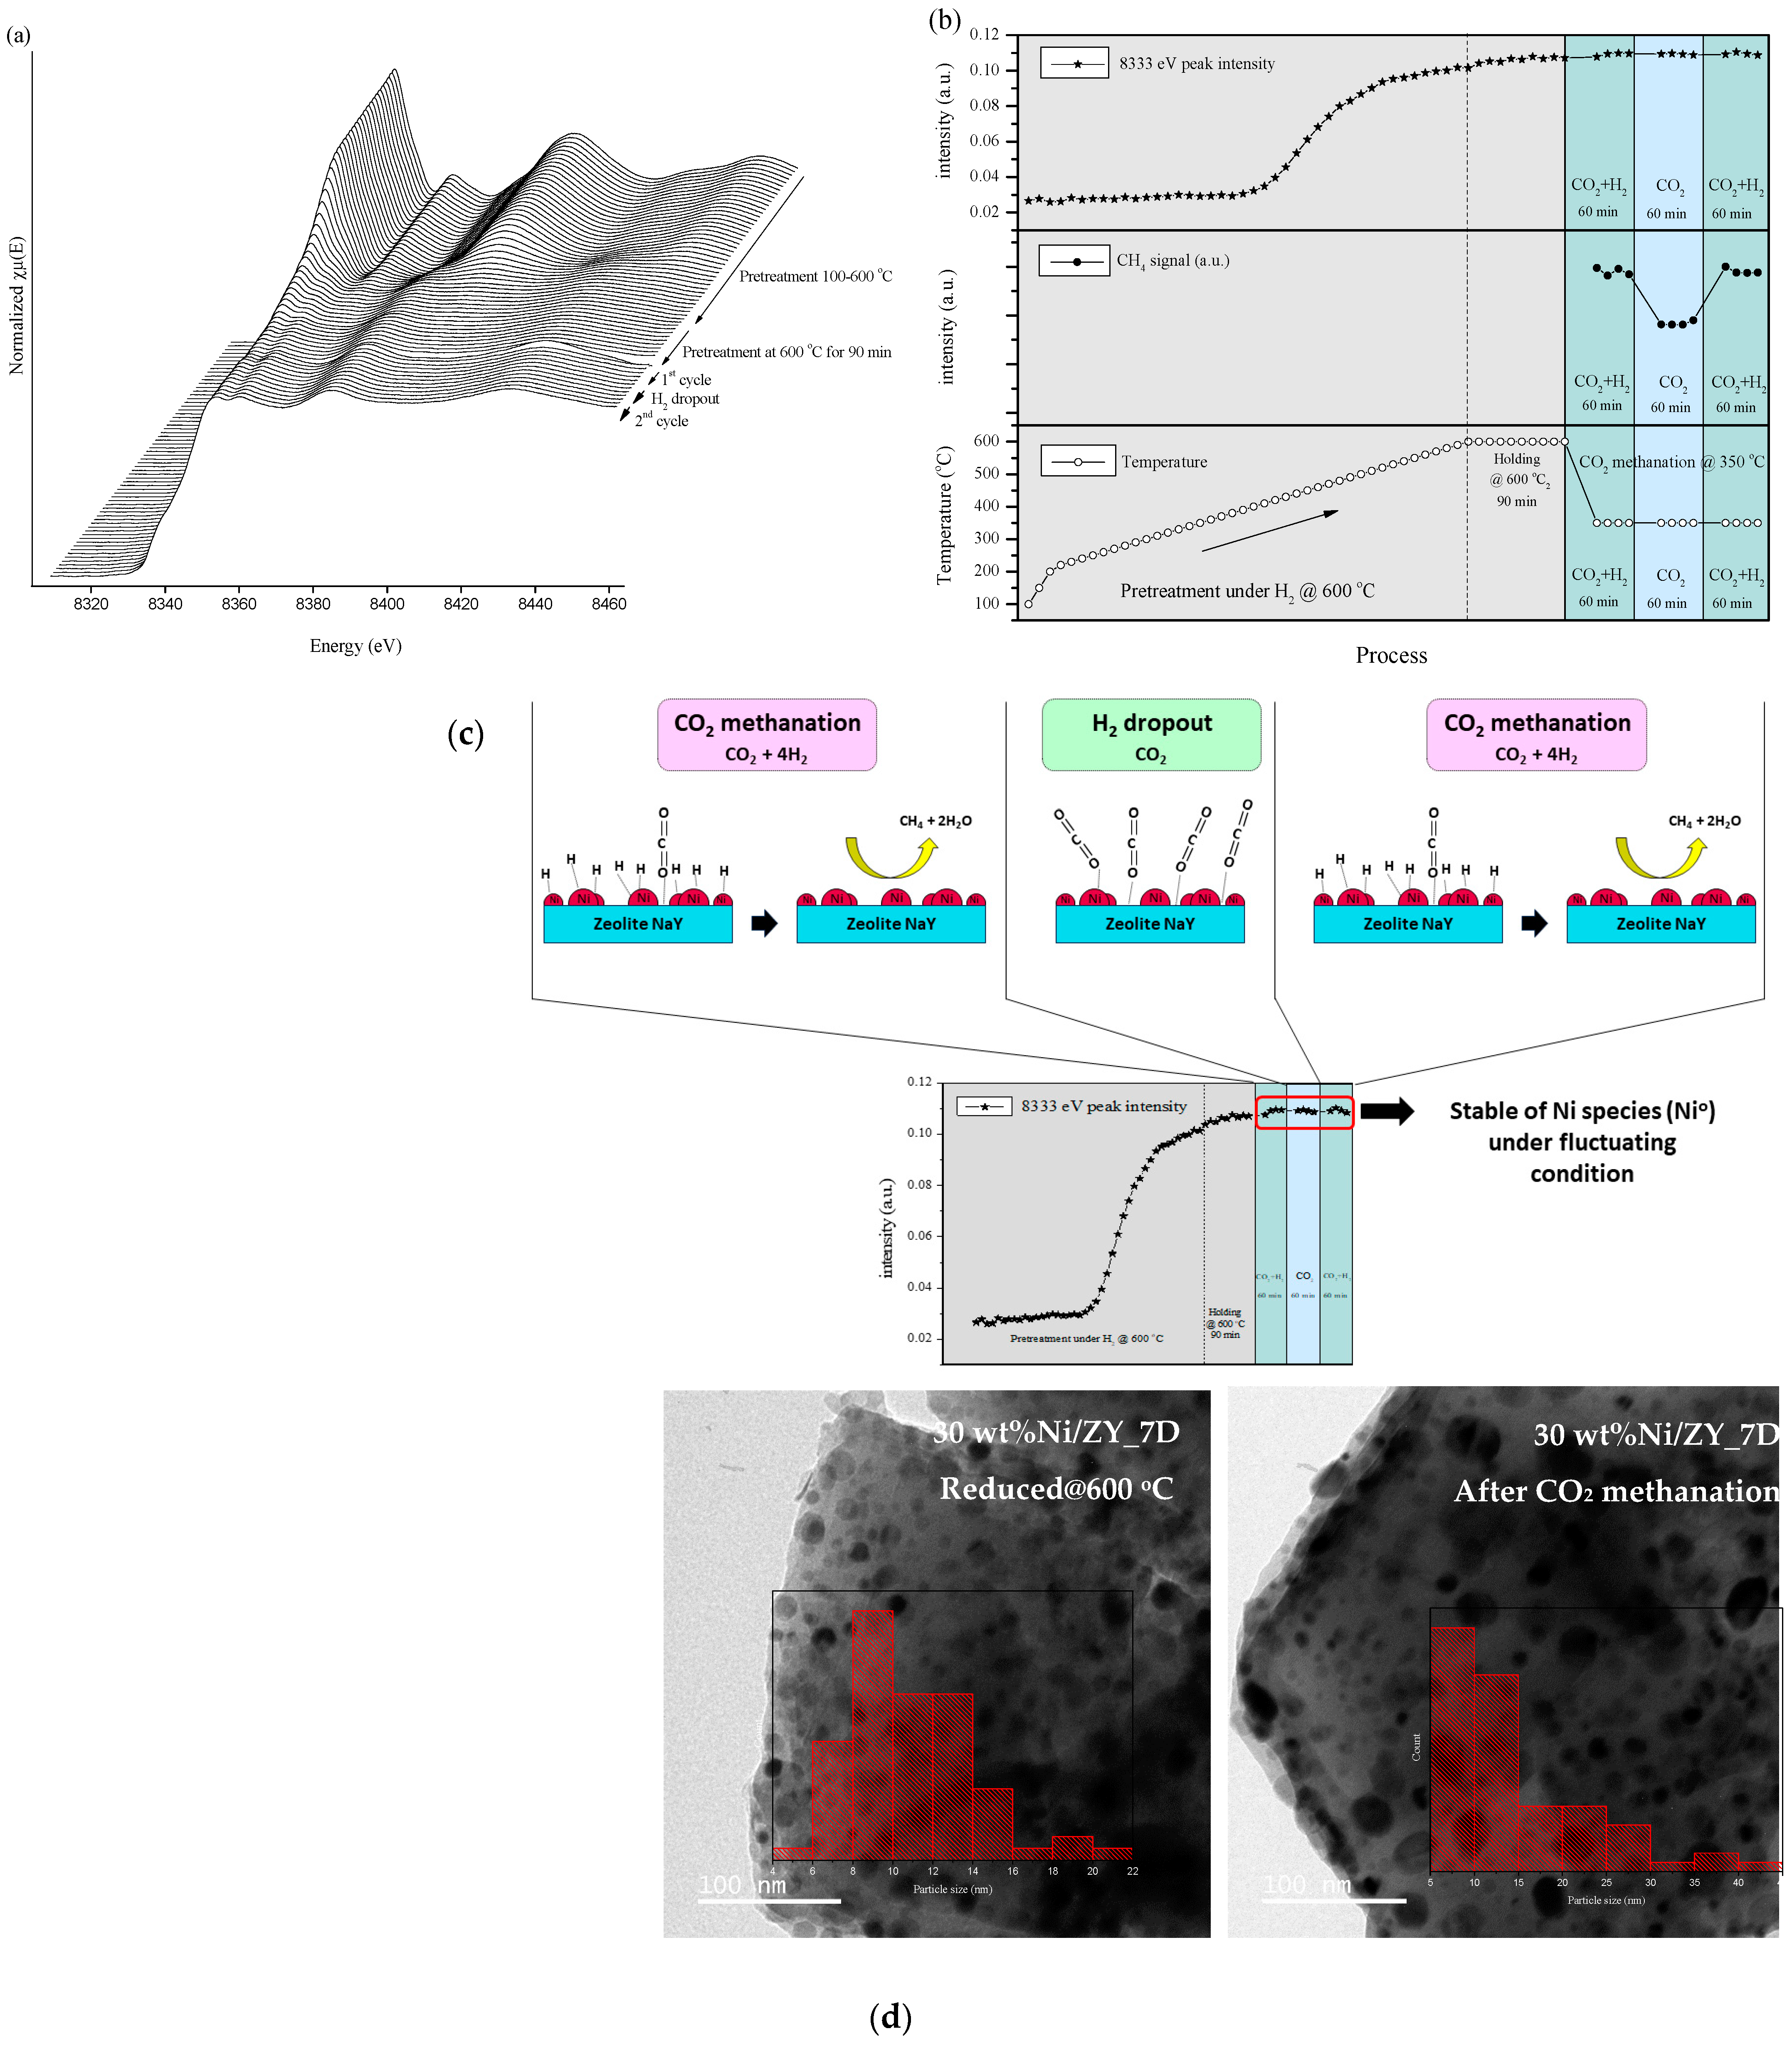
Stability Test Carried out by Monitoring the Ni Oxidation State Changes during Fluctuating Conditions

The stability of the Ni/zeolite catalyst under fluctuating conditions was conducted at the BL 2.2 time-resolved X-ray absorption spectroscopy beamline. The fluctuating condition was carried out by switching the feed stream between the feed gas with and without H2. The sample was first pretreated under H2 flow by increasing the temperature to 600 °C and the XANES spectra were recorded at every 10 °C temperature increment. The reduction temperature was then maintained at 600 °C for 90 min and XANES spectra were collected every 10 min. Next, the sample was cooled down under a H2 atmosphere to 100 °C and then the CO2 methanation reaction was started by switching the feed gas of CO2 (6 mL/min), H2 (24 mL/mi) and He (10 mL/min) over the sample. The sample was then heated to 350 °C and held at this point for 60 min. The XANES spectra were collected every 10 min from the 30th min until the 60th min, together with mass spectrometry profile collection. After the CO2 methanation condition, there were H2 dropouts from the feed gas, which indicated that only CO2 and He were present in the feed stream. The sample was held at this temperature for 60 min and spectra were also collected every 10 min from the 30th min until the 60th min. The fluctuating condition was repeated again and the spectra were collected in the same manner as above. All XANES spectra were corrected by a pre-processing program and then analyzed by Athena software (Demeter, version 0.9.25).

3. Results and Discussion

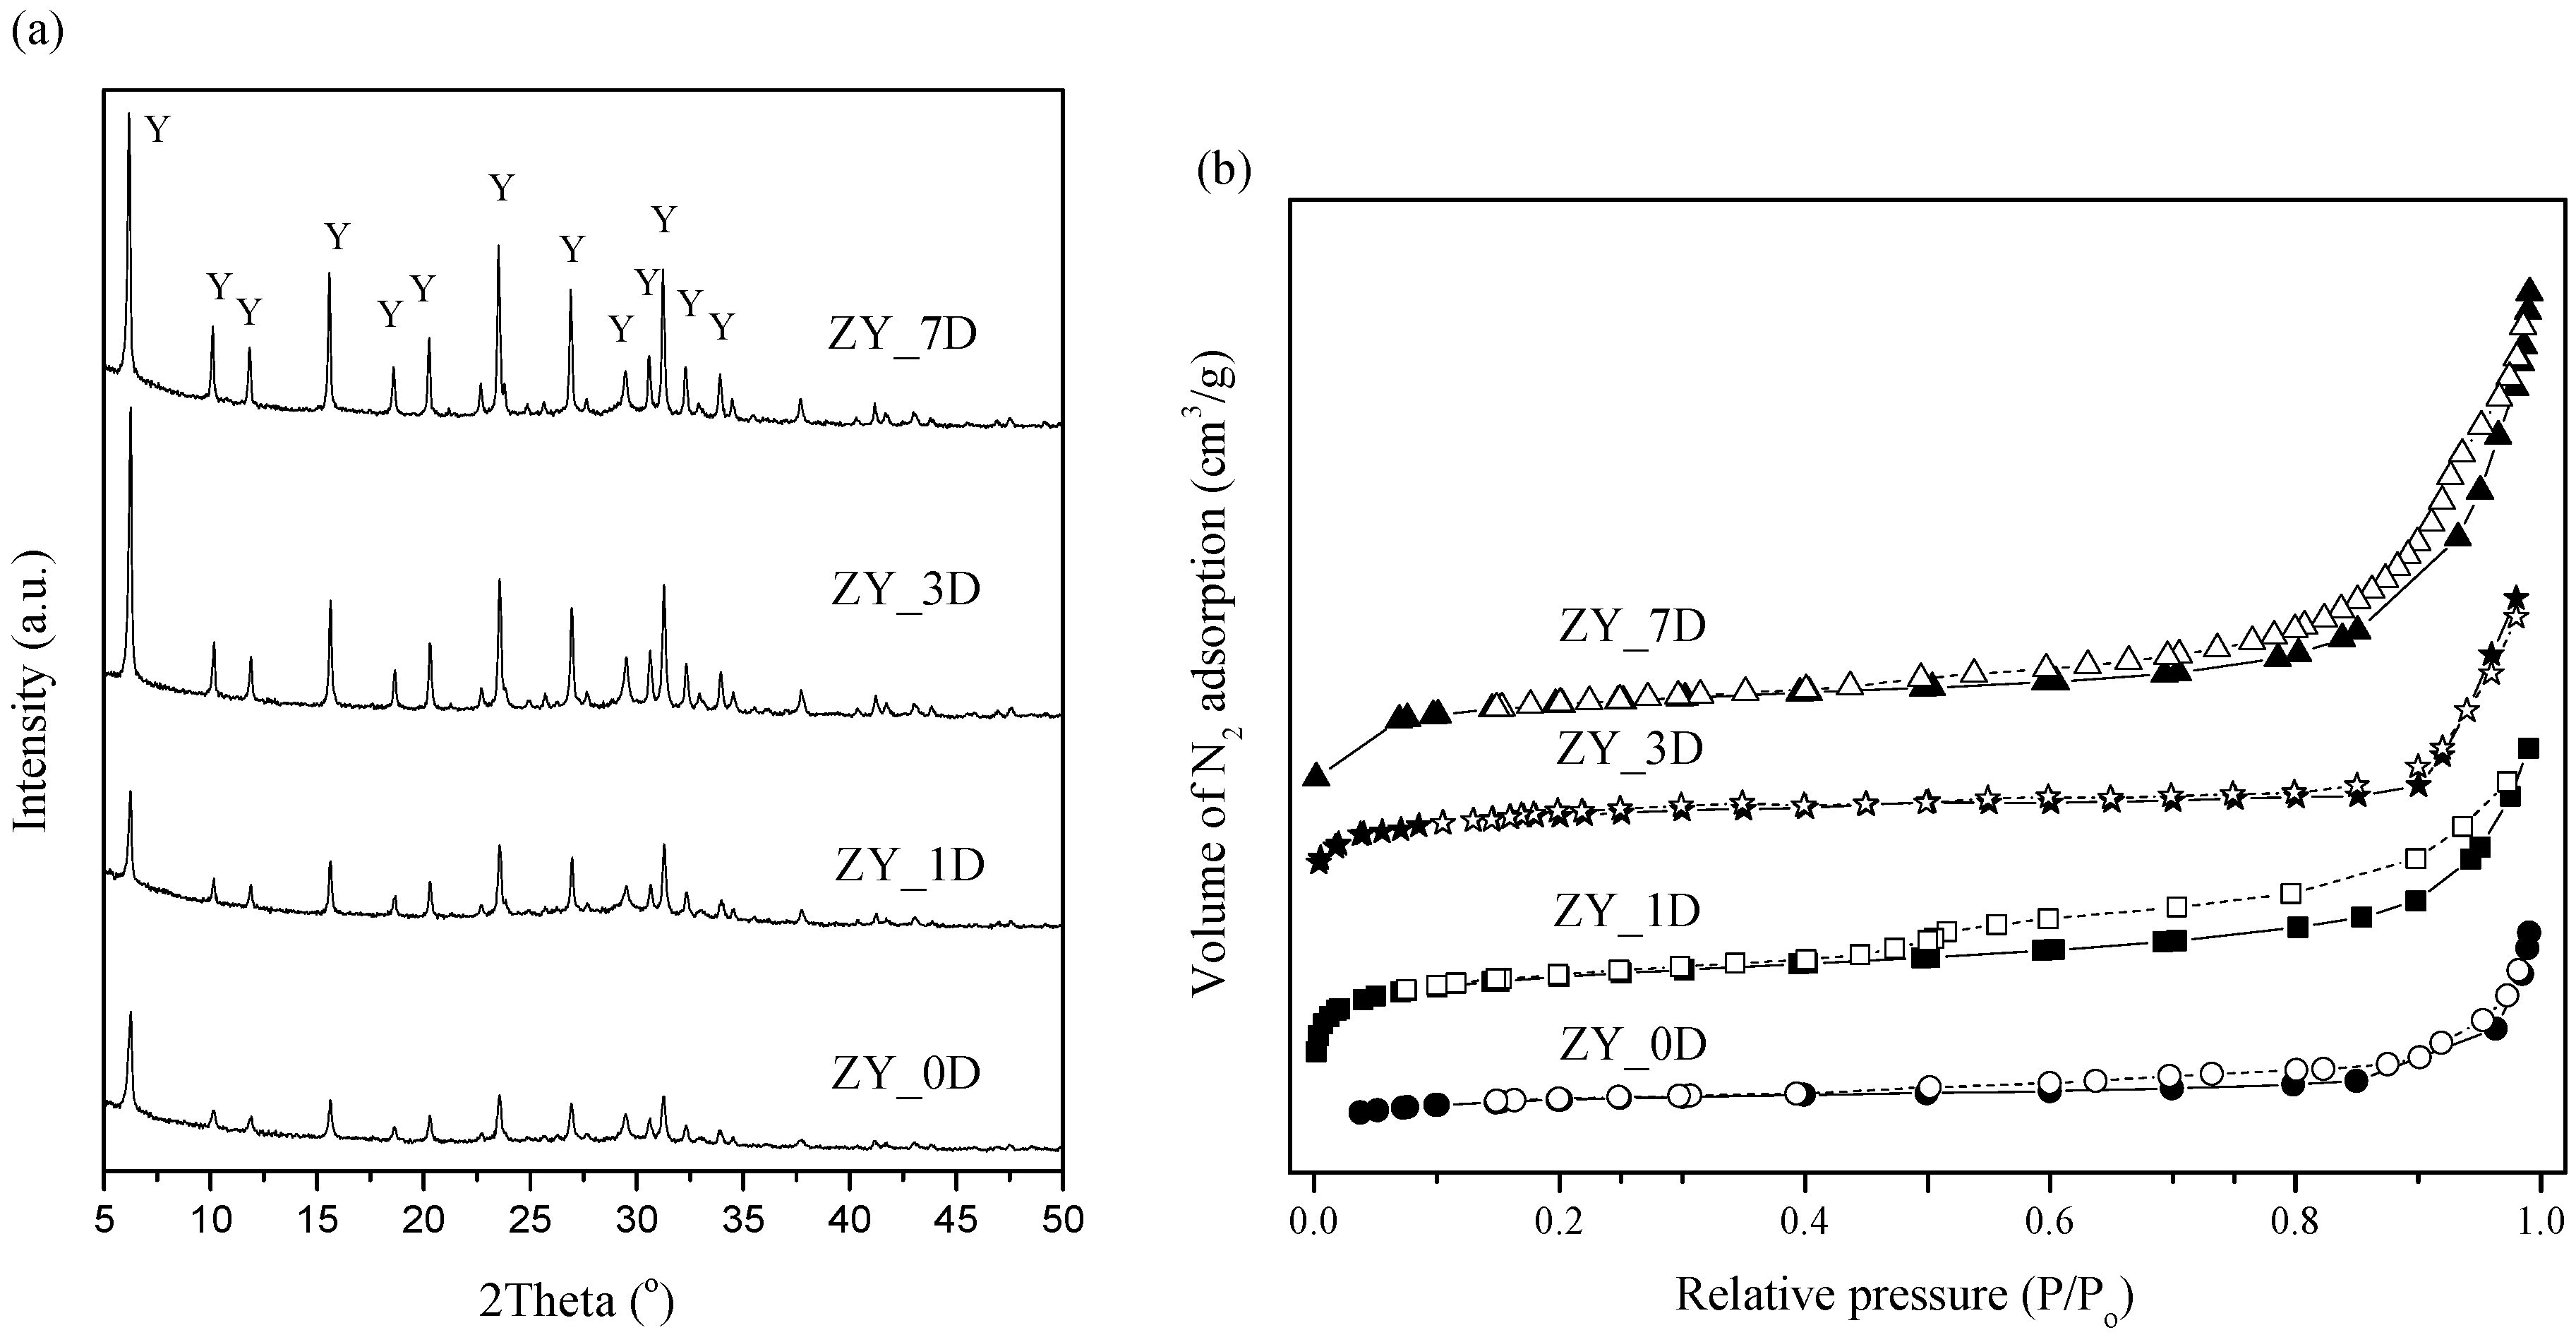
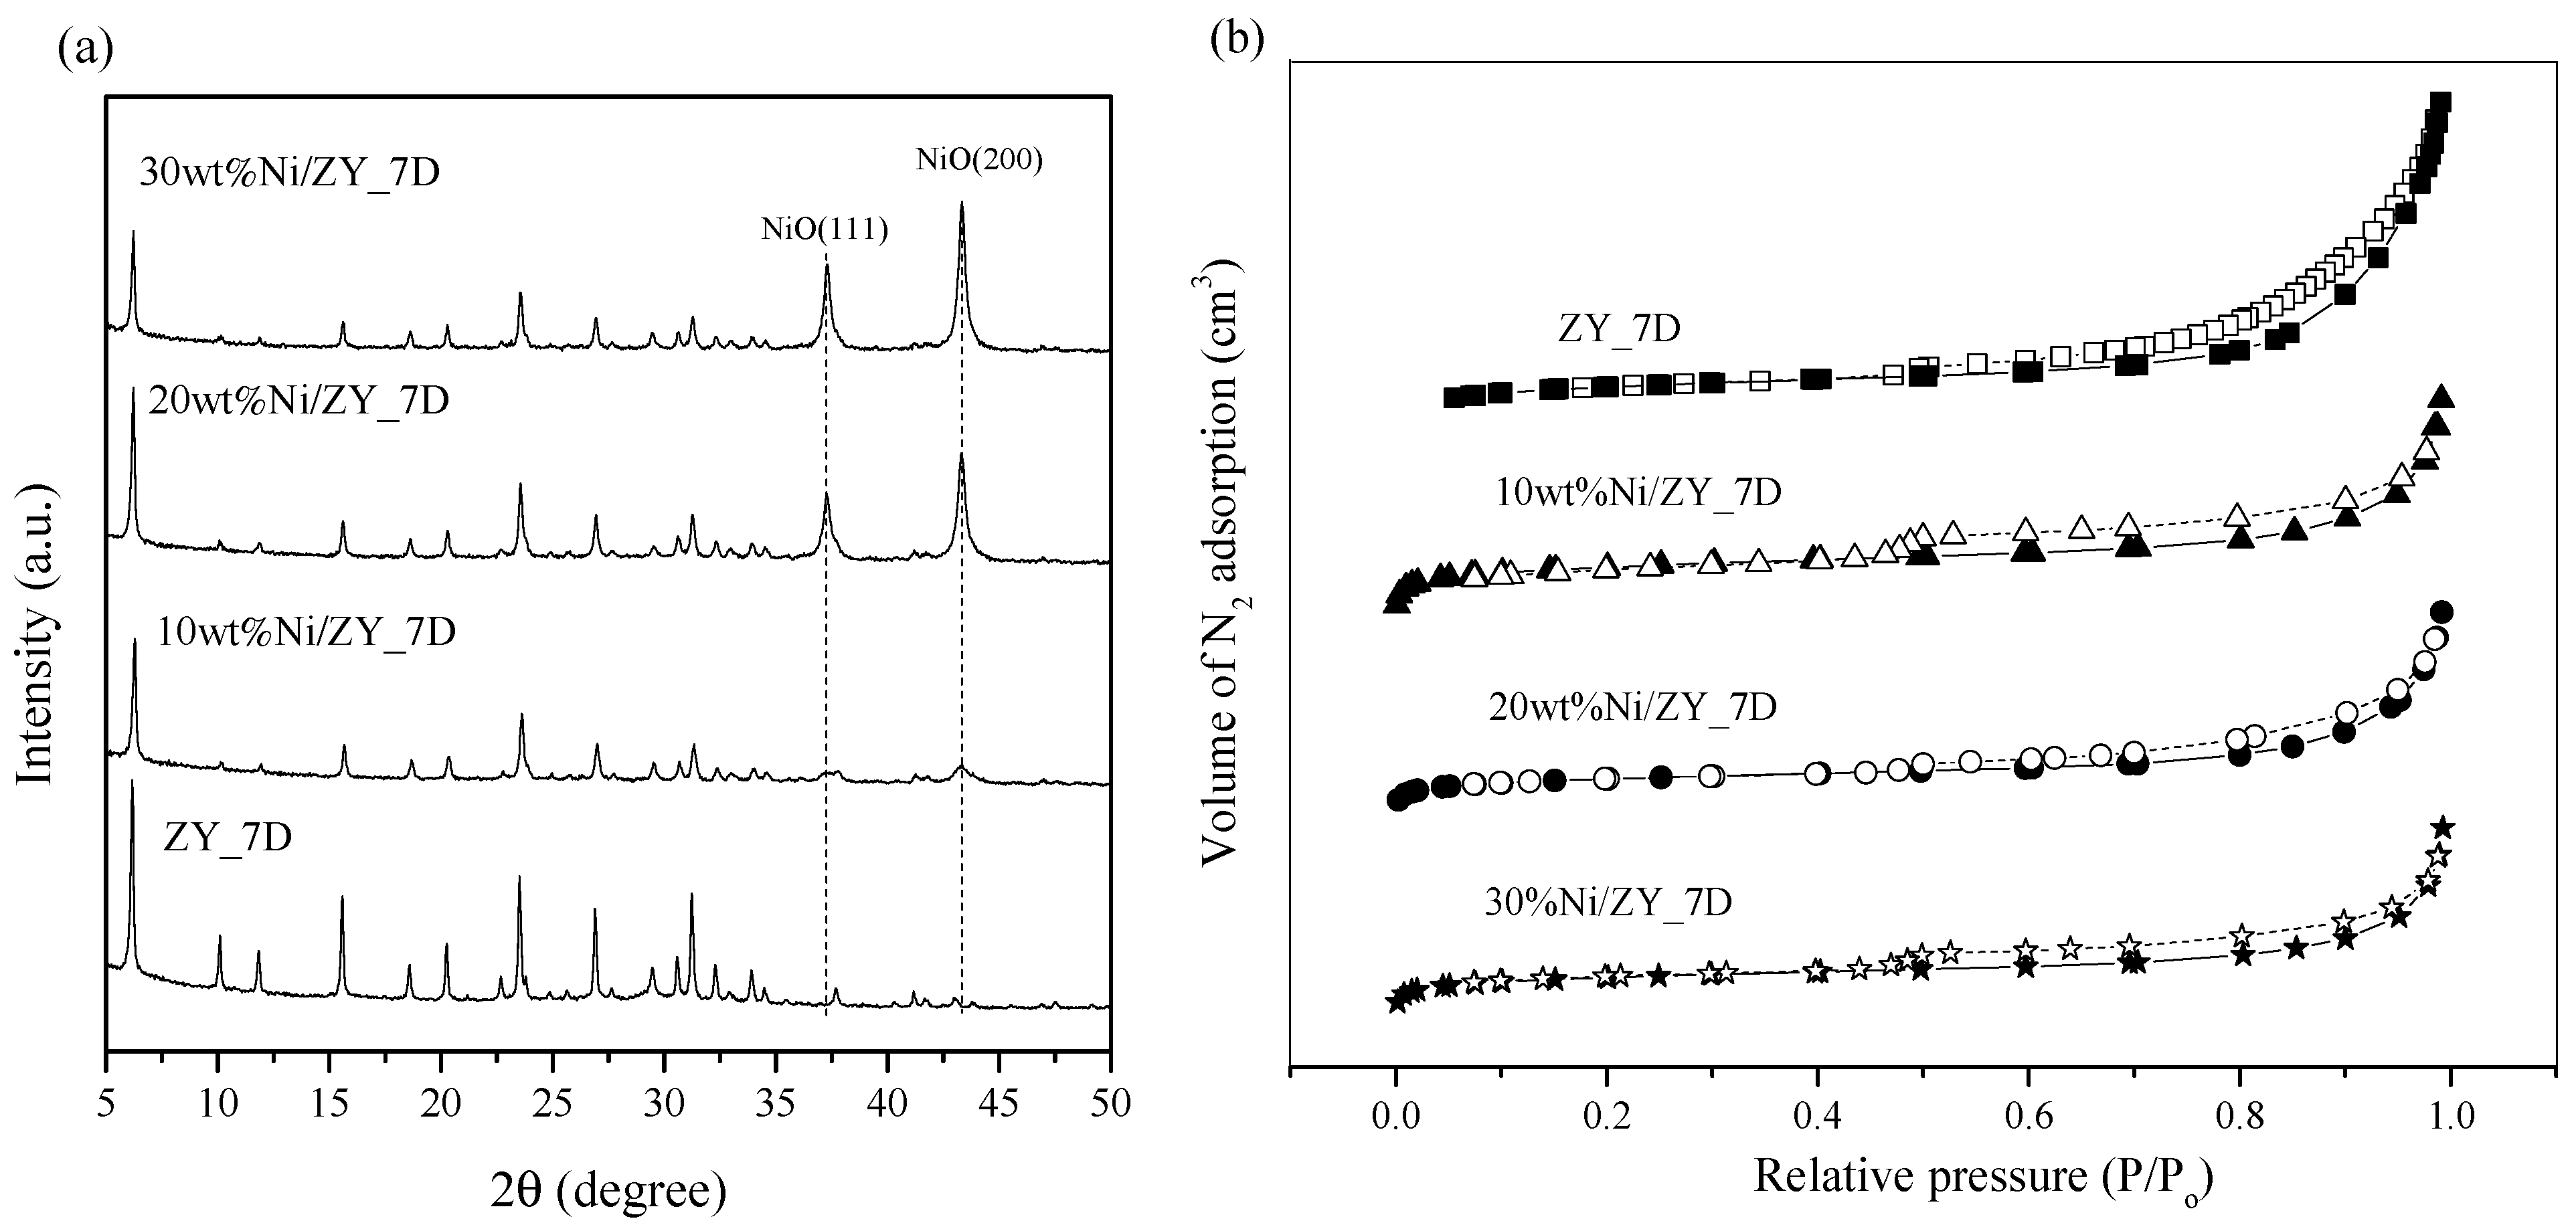
3.1. Zeolite NaY Support and Zeolite-Supported Ni Catalyst

Zeolite NaY is usually synthesized by mixing seed and feed gels. In keeping with this method, after mixing these two zeolite precursors, the zeolite mixture was then aged for different times, i.e., 0, 1, 3 and 7 days. After that, the aged zeolite mixture was heated for crystallization by refluxing at 100 °C for 12 h. Figure 1a illustrates the XRD patterns of synthesized zeolite with the different aging times of the zeolite mixture. All as-prepared samples exhibited the characteristic peaks of the FAU type of zeolite with different peak intensity [17,22]. Increasing the aging time resulted in increased peak intensity, which indicated high crystallinity levels in the zeolite. The advantage of aging the zeolite mixture before crystallization is to increase the nucleation precursor (aluminosilicate anion), which is the origin of zeolite crystal growth [24,25]. By increasing the number of nucleation precursors, the crystallite size is reduced and zeolite crystallinity is promoted [26,27]. However, aging the zeolite mixture for more than 7 days would not increase the zeolite crystallinity. Therefore, the optimum aging time was 7 days.
Figure S1 (in Supplementary Materials) displays SEM images of synthesized zeolite with different aging times. It can be seen that all samples exhibited an octahedral shape, which is a characteristic of FAU zeolite. The octahedral shape became noticeably sharper with an increase in the aging of the zeolite mixture, which is consistent with the XRD results. Figure 1b illustrates N2 adsorption–desorption isotherms of zeolite with 0, 1, 3 and 7 days’ aging time. All as-prepared zeolite exhibited type IV adsorption isotherms. The N2 uptake improved upon increases of aging time and the multipoint method was used to determine the specific surface area. The data for this are summarized in Table 1. From Table 1, the specific surface areas of ZY_0D, ZY_1D, ZY_3D and ZY_7D increased with the increased aging times, which corresponds to the crystallite sizes. The ZY_7D sample expressed the highest specific surface area of 468.8 m2/g, which was comparable to other works in which zeolite was obtained under ambient conditions, as shown in Table 1. From these results, it can be seen that zeolite NaY can be formed without aging the zeolite mixture before crystallization. This would seem to indicate that the refluxing method has great potential for use as a zeolite NaY crystallization method at ambient pressure.
As-prepared zeolite NaY with 7 days’ aging time (ZY_7D) was selected for use as a support for the impregnation of various amounts of Ni. The actual Ni contents used were 8.6, 20.8 and 30.6 wt% for 10, 20 and 30 wt%Ni addition, respectively. It is seen that the actual Ni content was close to the nominal content. Figure 2a displays the XRD patterns of Ni/zeolite NaY with contents of 10, 20 and 30 wt% compared with that of the bare zeolite NaY support. The zeolite NaY characteristic peaks were reduced upon an increase in Ni loading, which was attributed to a lowering of crystallinity. However, peaks at 37.3° and 43.3°, which corresponded to the NiO(111) and NiO(200) crystallographic planes, were observed [28,29]. The peak intensity of the NiO phase was increased upon an increase in the Ni content. The crystallite sizes of the zeolite support and NiO were calculated by Scherrer’s equation and the results are summarized in Table 1. The results show that the zeolite and NiO crystallite size increased with an increase in Ni content. Figure S2 displays SEM images and the elemental mapping of zeolite support and Ni/zeolite catalysts. The pristine zeolite NaY showed an octahedral characteristic shape of faujasite zeolite type with an average particle size of around 700 nm. Upon impregnation with Ni, a distorted octahedral shape and increase in the degree of agglomeration of the catalyst particle was observed. The average particle sizes of the 10, 20 and 30 wt%Ni loading catalysts were 675, 700 and 800 nm, respectively. The distribution of Ni seems low when the Ni loading amount is increased, which can be observed in the Ni mapping images. Figure 2b displays the N2 adsorption–desorption of all Ni/catalysts compared with zeolite NaY support. All samples exhibited type IV adsorption isotherms which are associated with mesoporous materials. The specific surface areas of all samples are summarized in Table 1. The specific surface area of the modified samples was reduced upon an increase in Ni loading, indicating that zeolite porosity was partially reduced by the added Ni. However, a reduction in surface area can suppress the diffusion of reactants into the pores [30].

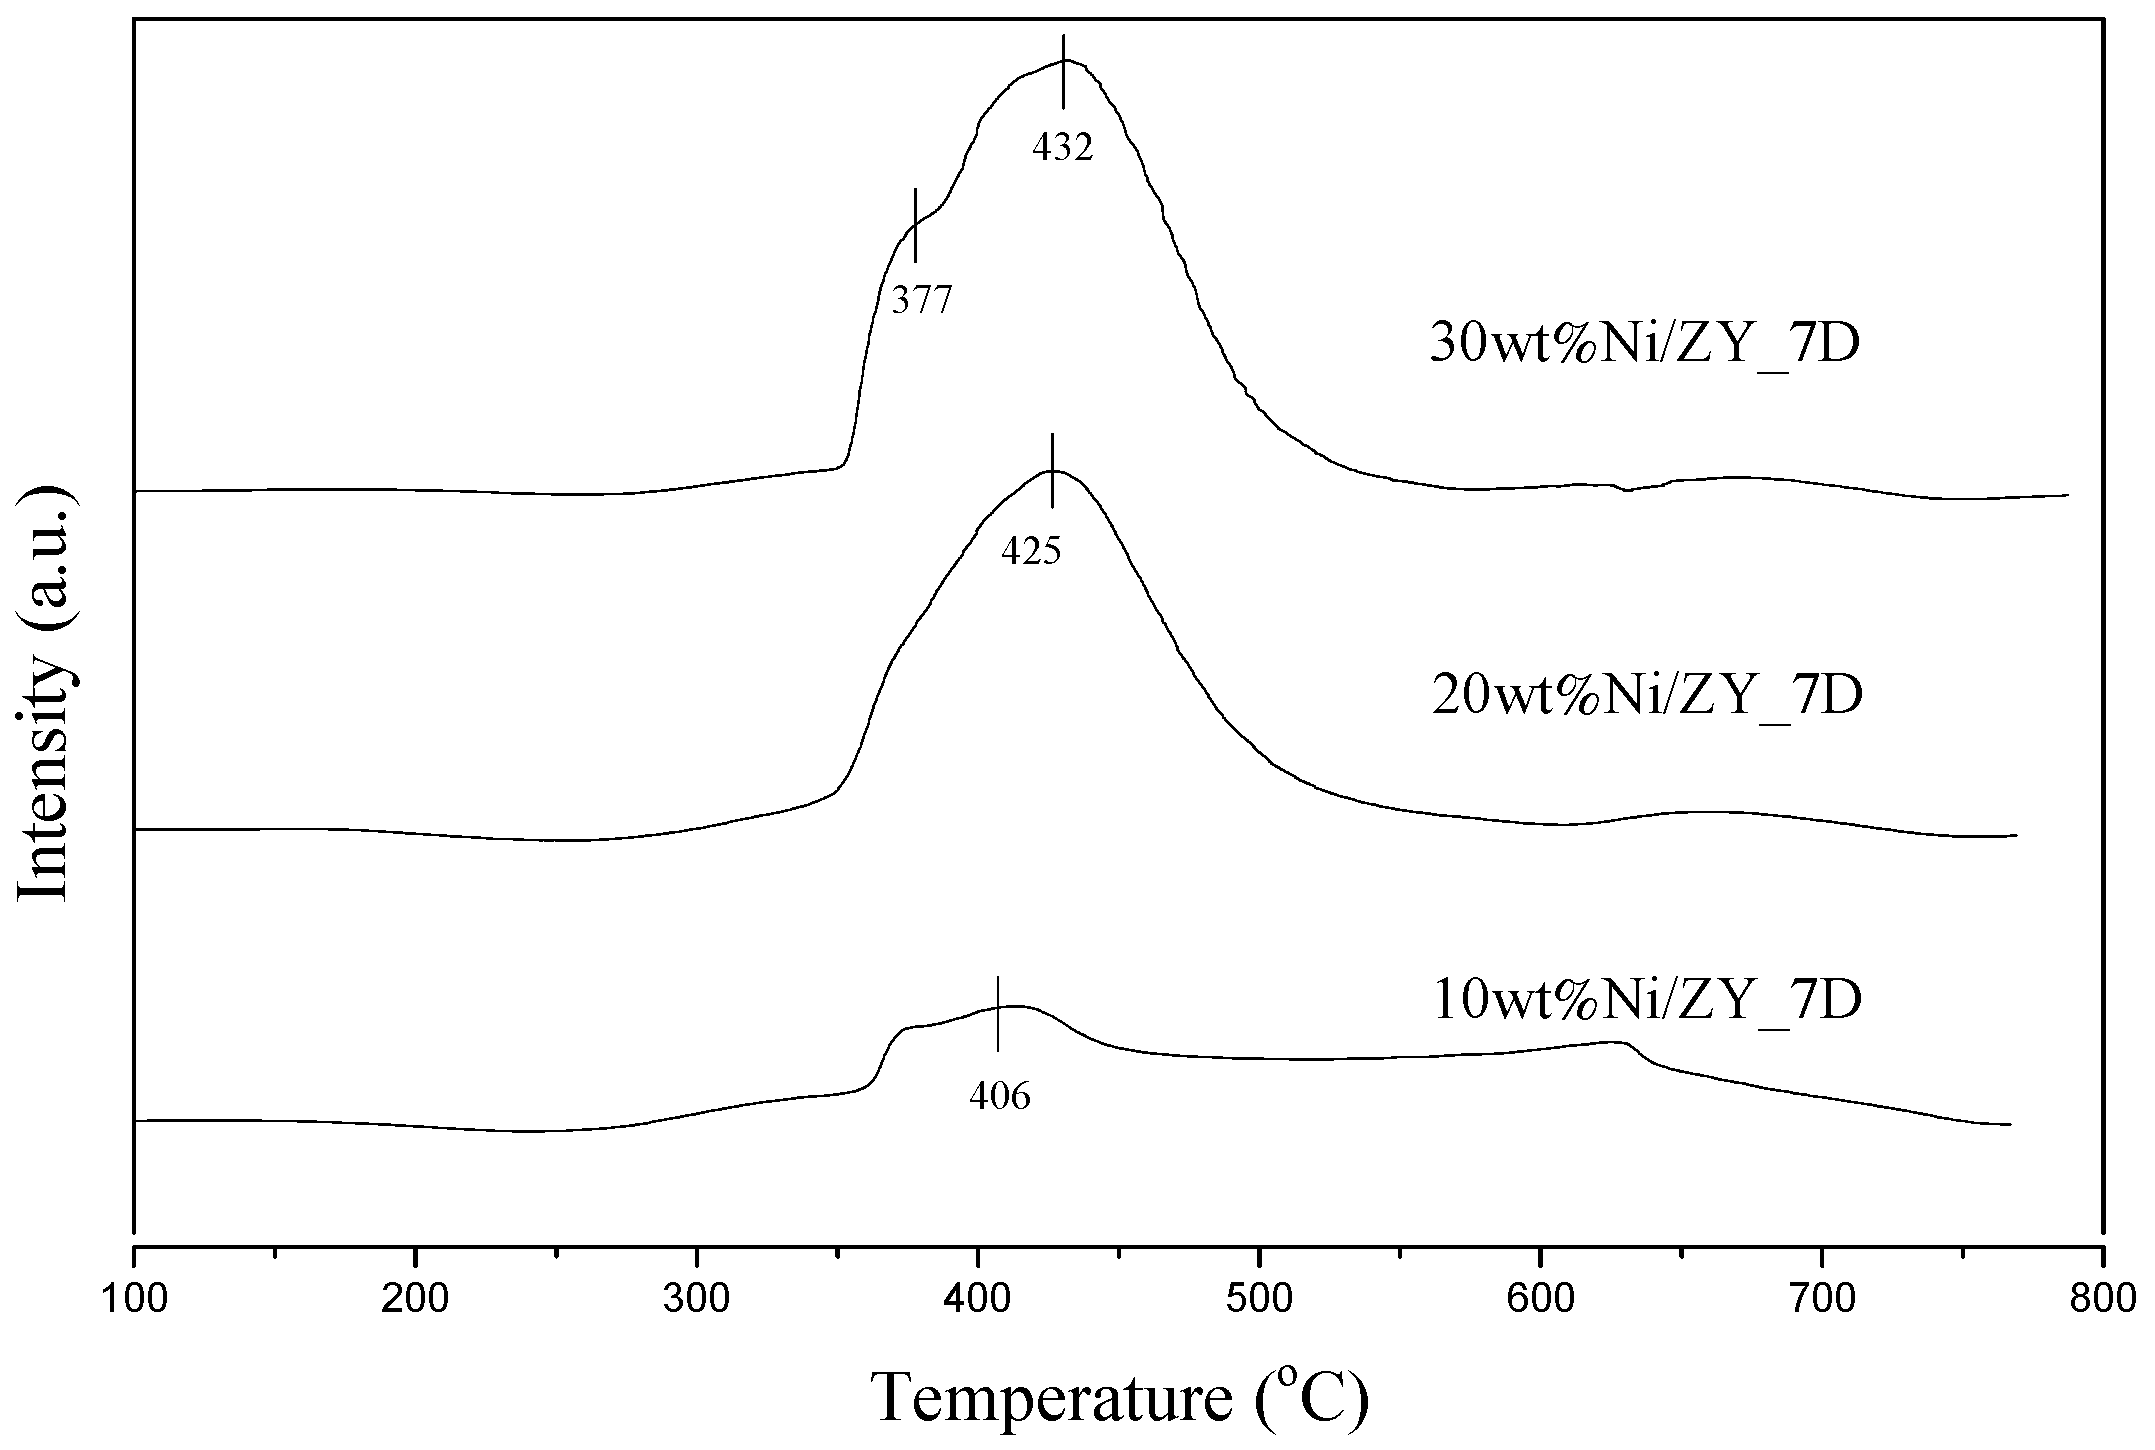
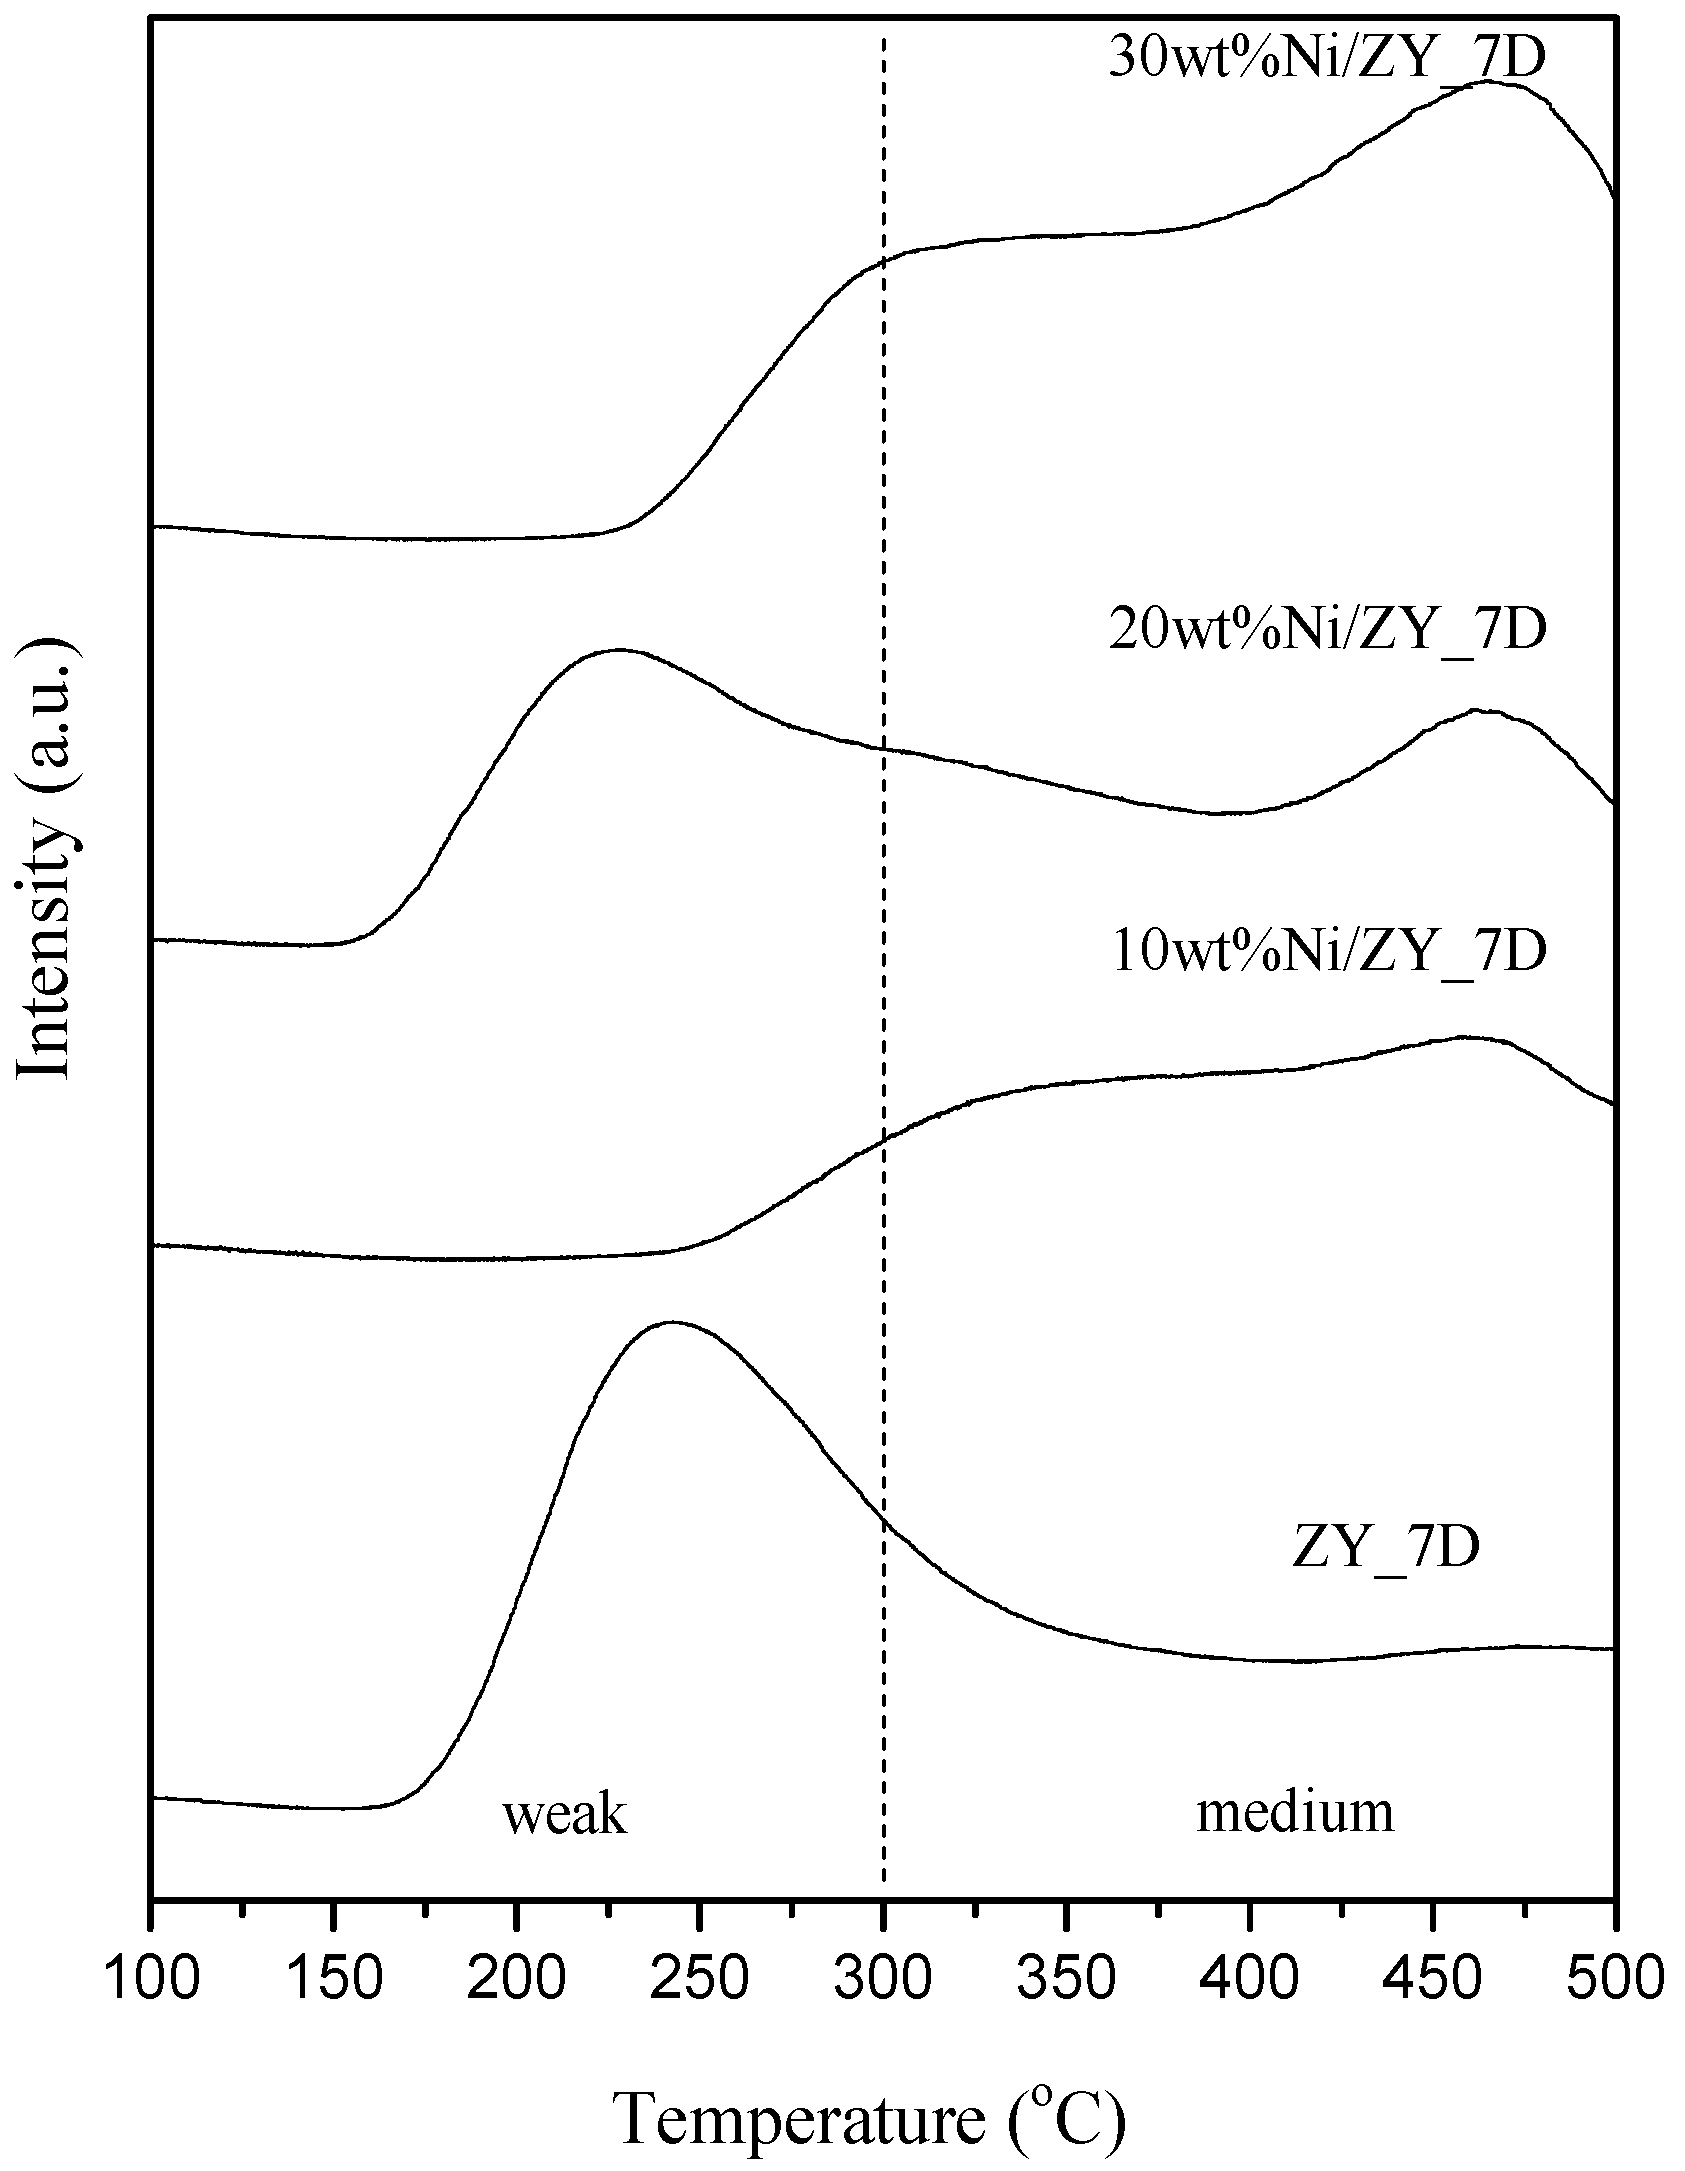
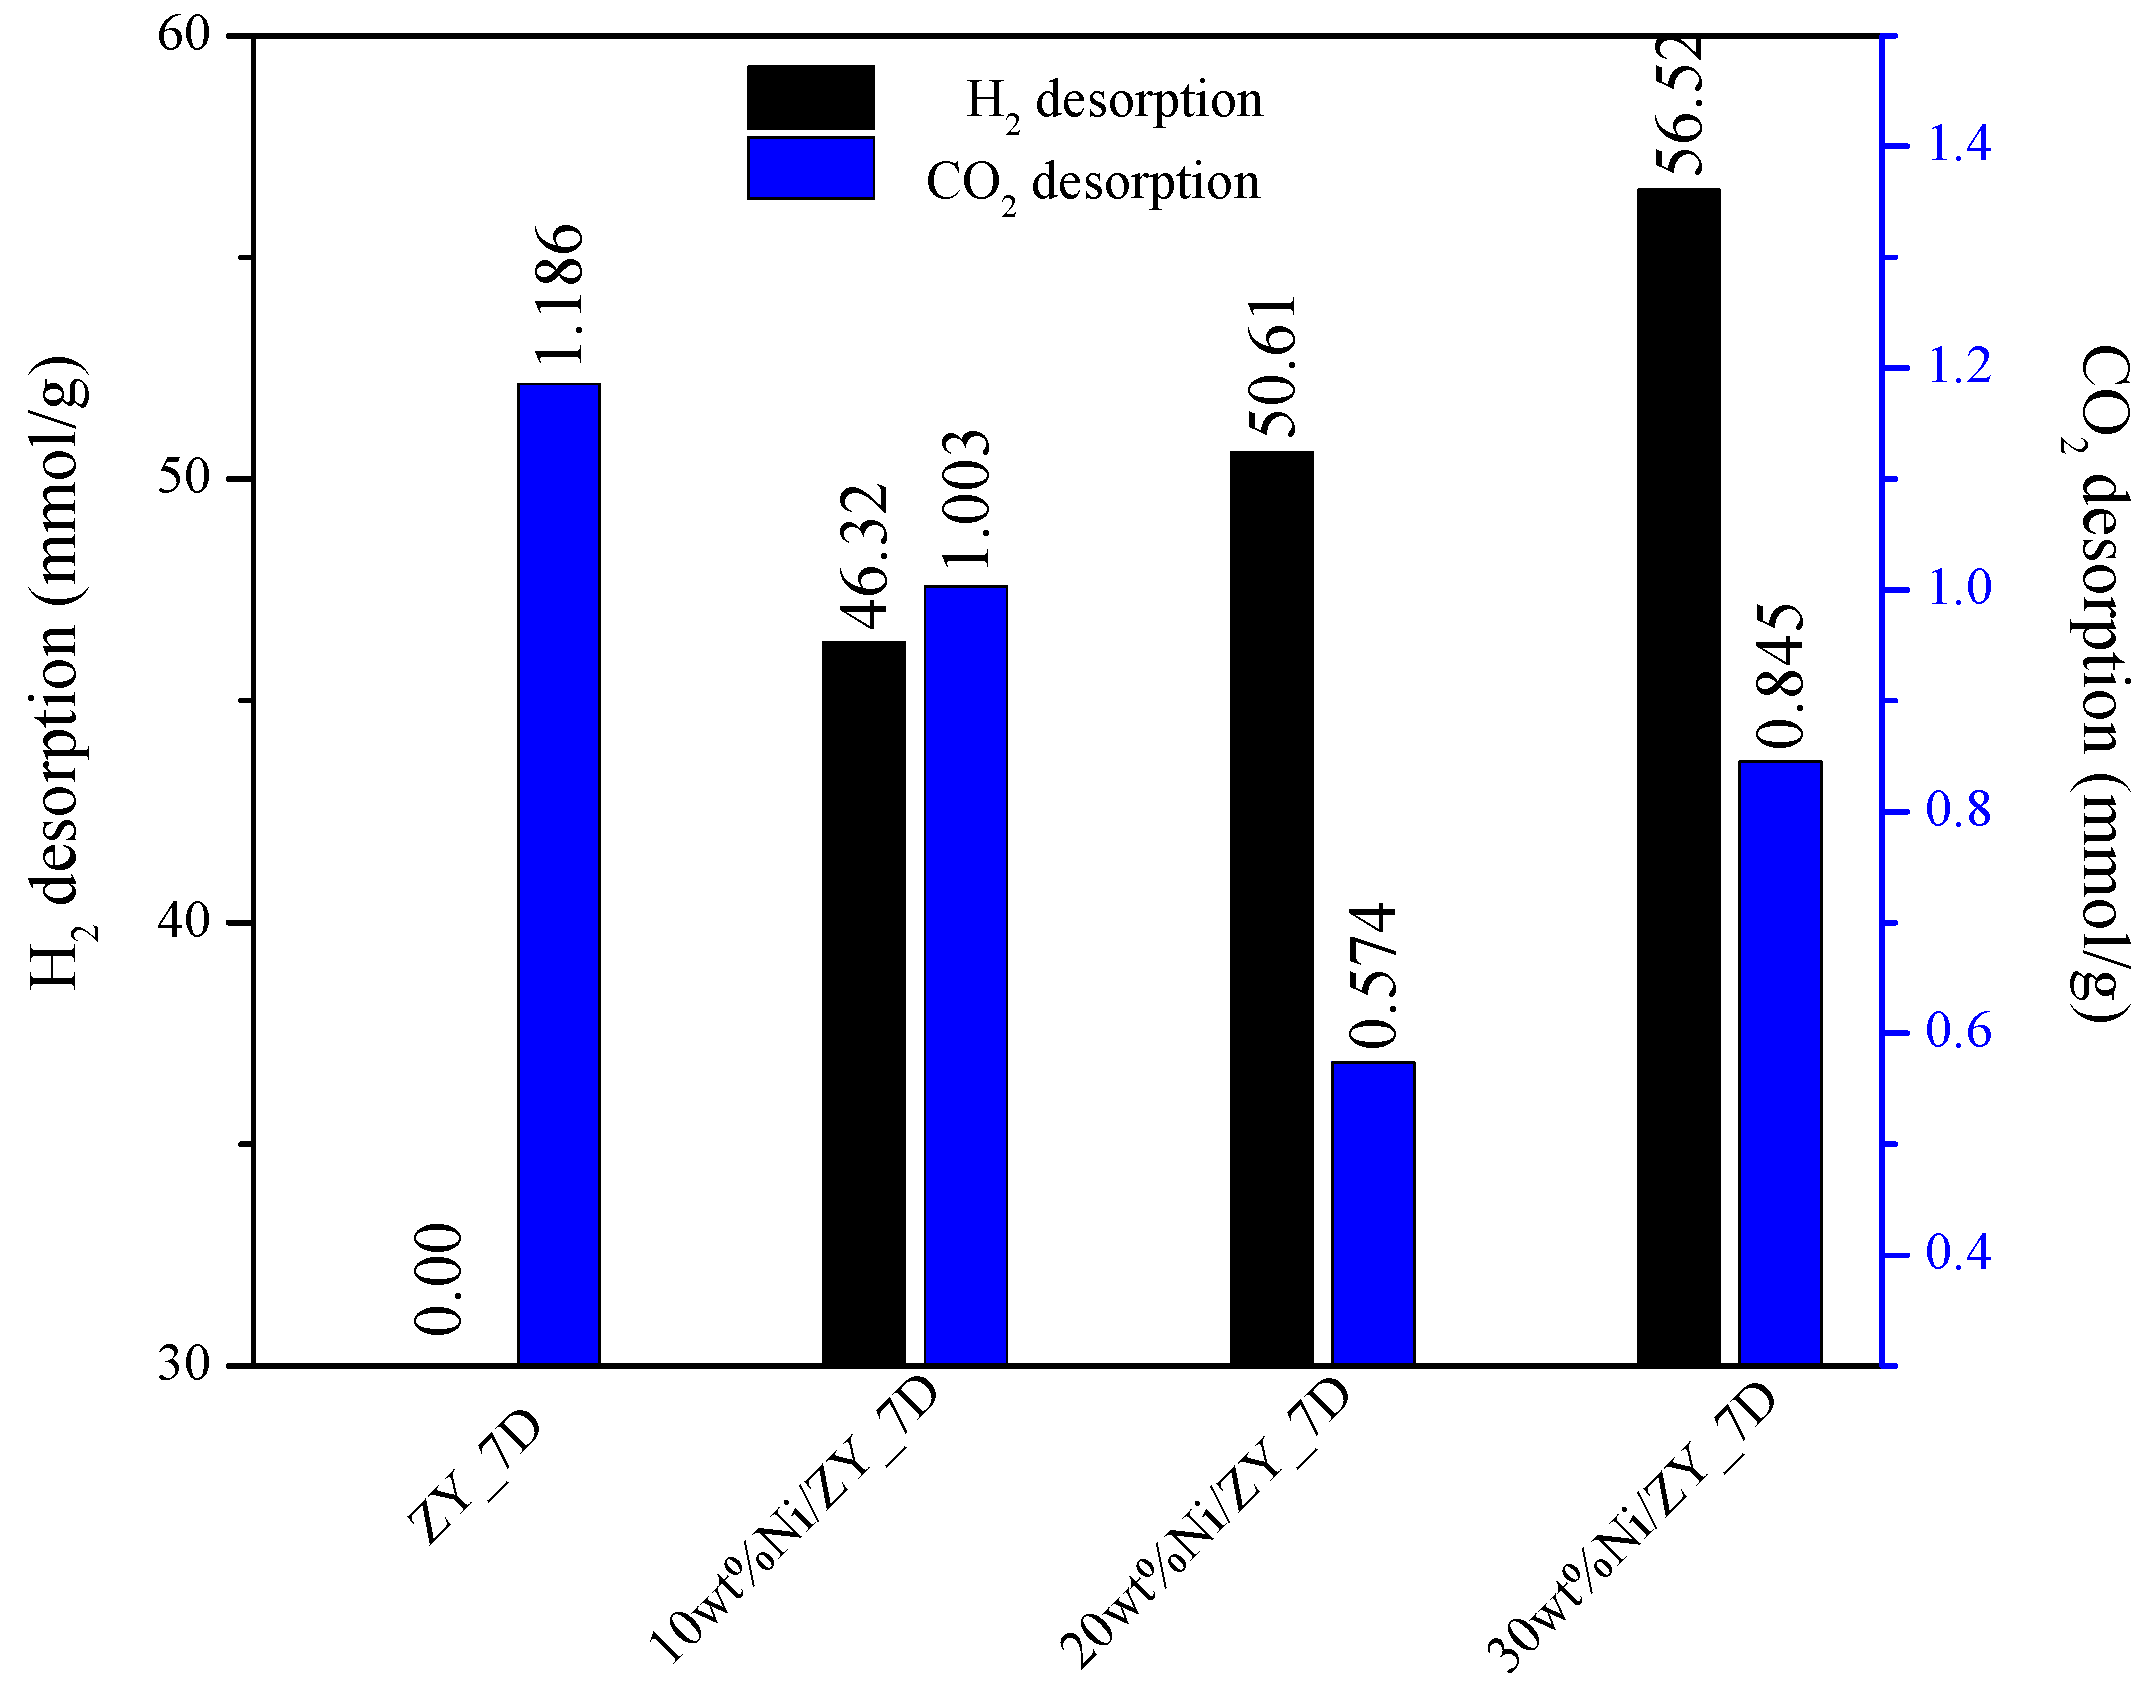
3.2. Temperature-Programmed Results

The reducibility of catalysts can be investigated using the H2 temperature program reduction technique. Figure 3 displays the H2-TPR profiles of 10, 20 and 30 wt% of Ni impregnated on zeolite. All H2-TPR profiles exhibited reduction peaks, which were attributed to a reduction in NiO to metallic Ni. All of those reduction peaks exhibited a different peak intensity and peak position, which corresponded to the binding strength of NiO to the zeolite support and the location of NiO, respectively [31,32]. A small reduction peak around 370 °C was attributed to the NiO, which was located on the external surface of the zeolite [8,33]. This reduction peak intensity increased with an increase in Ni content, which suggested the existence of a larger amount of external NiO on the catalyst surface. The higher reduction peak at around 400 °C was attributed to the reduction in deposited NiO inside the zeolite pore [31]. This reduction peak intensity also increased with an increase in the amount of Ni. Moreover, the peak position shifted toward a higher reduction temperature, which indicated a higher binding strength between the NiO and zeolite support or a strong metal support interaction [8]. It was reported that high binding strength between Ni active species with catalyst support can prevent the agglomeration or sintering of Ni active species under reaction streams [34]. The amount of H2 consumption of all catalysts is presented in Table 2, which shows that that an increase in consumed H2 corresponds to an increase in Ni loading.
Temperature program desorption (TPD) is usually used to investigate the amount of desorbed gas from a catalyst’s surface, which relates to the binding strength and the affinity of the catalyst surface to the adsorbed gas. Since H2 was the key reactant for CO2 methanation, H2-TPD was used to investigate the desorption of H2 from the catalyst surface, which can directly indicate the amount of adsorbed H2 molecules. Figure 4 shows that all of the H2-TPD profiles exhibited a single prominent desorption signal at around 350–450 °C. This can be attributed to H2 adsorption on surface defects and dispersed Ni nanoparticles, which can promote the diffusion of surface hydrogen [35]. The TPD peak intensity increased with an increase in Ni content, which indicated a higher amount of H2 adsorption on the catalyst’s surface. The total amount of desorbed H2 is expressed in Table 2. The percentage of Ni dispersion on the catalyst’s surface can be calculated using the data from H2-TPR together with H2-TPD, the results of which are summarized in Table 2. It can be seen that the dispersion decreased with an increase in Ni loading. This was probably due to the agglomeration of the high Ni amount, which can be evidenced in the SEM mapping images.
CO2-TPD results can indicate the CO2 adsorption capacity and the binding strength between CO2 and the catalyst’s surface. The amount of desorbed CO2 directly represented the amount of CO2 uptake and the desorption temperature can indicate the strength between adsorbate and adsorbent. Normally, the three main regions in the CO2-TPD profile can indicate the binding strength of CO2 with the catalyst’s surface as weak (<300 °C), medium (300–600 °C) or strong (>600 °C) [8,14]. The binding strength between CO2 and the catalyst’s surface plays an important role in catalyzing the reaction. In the case of weak binding strength, CO2 was physically bound with the surface and could leave the surface more easily than when the surface reaction was suppressed. Meanwhile, the strong binding strength of CO2 with the surface can lead to the hindering of CO2 dissociation to a key reaction intermediate (carbon monoxide or formate species). Consequently, an appropriate binding strength between CO2 and the catalyst is an important consideration in catalytic performance. However, the strong region was negligible in this case, since the maximum reaction temperature was 500 °C. Figure 5 illustrates the CO2-TPD profiles of zeolite NaY support, 10, 20 and 30 wt%Ni/zeolite for weak and medium ranges. The contribution of weak and medium regions can be calculated from the areas under the desorption peaks, which are presented in Table 2.

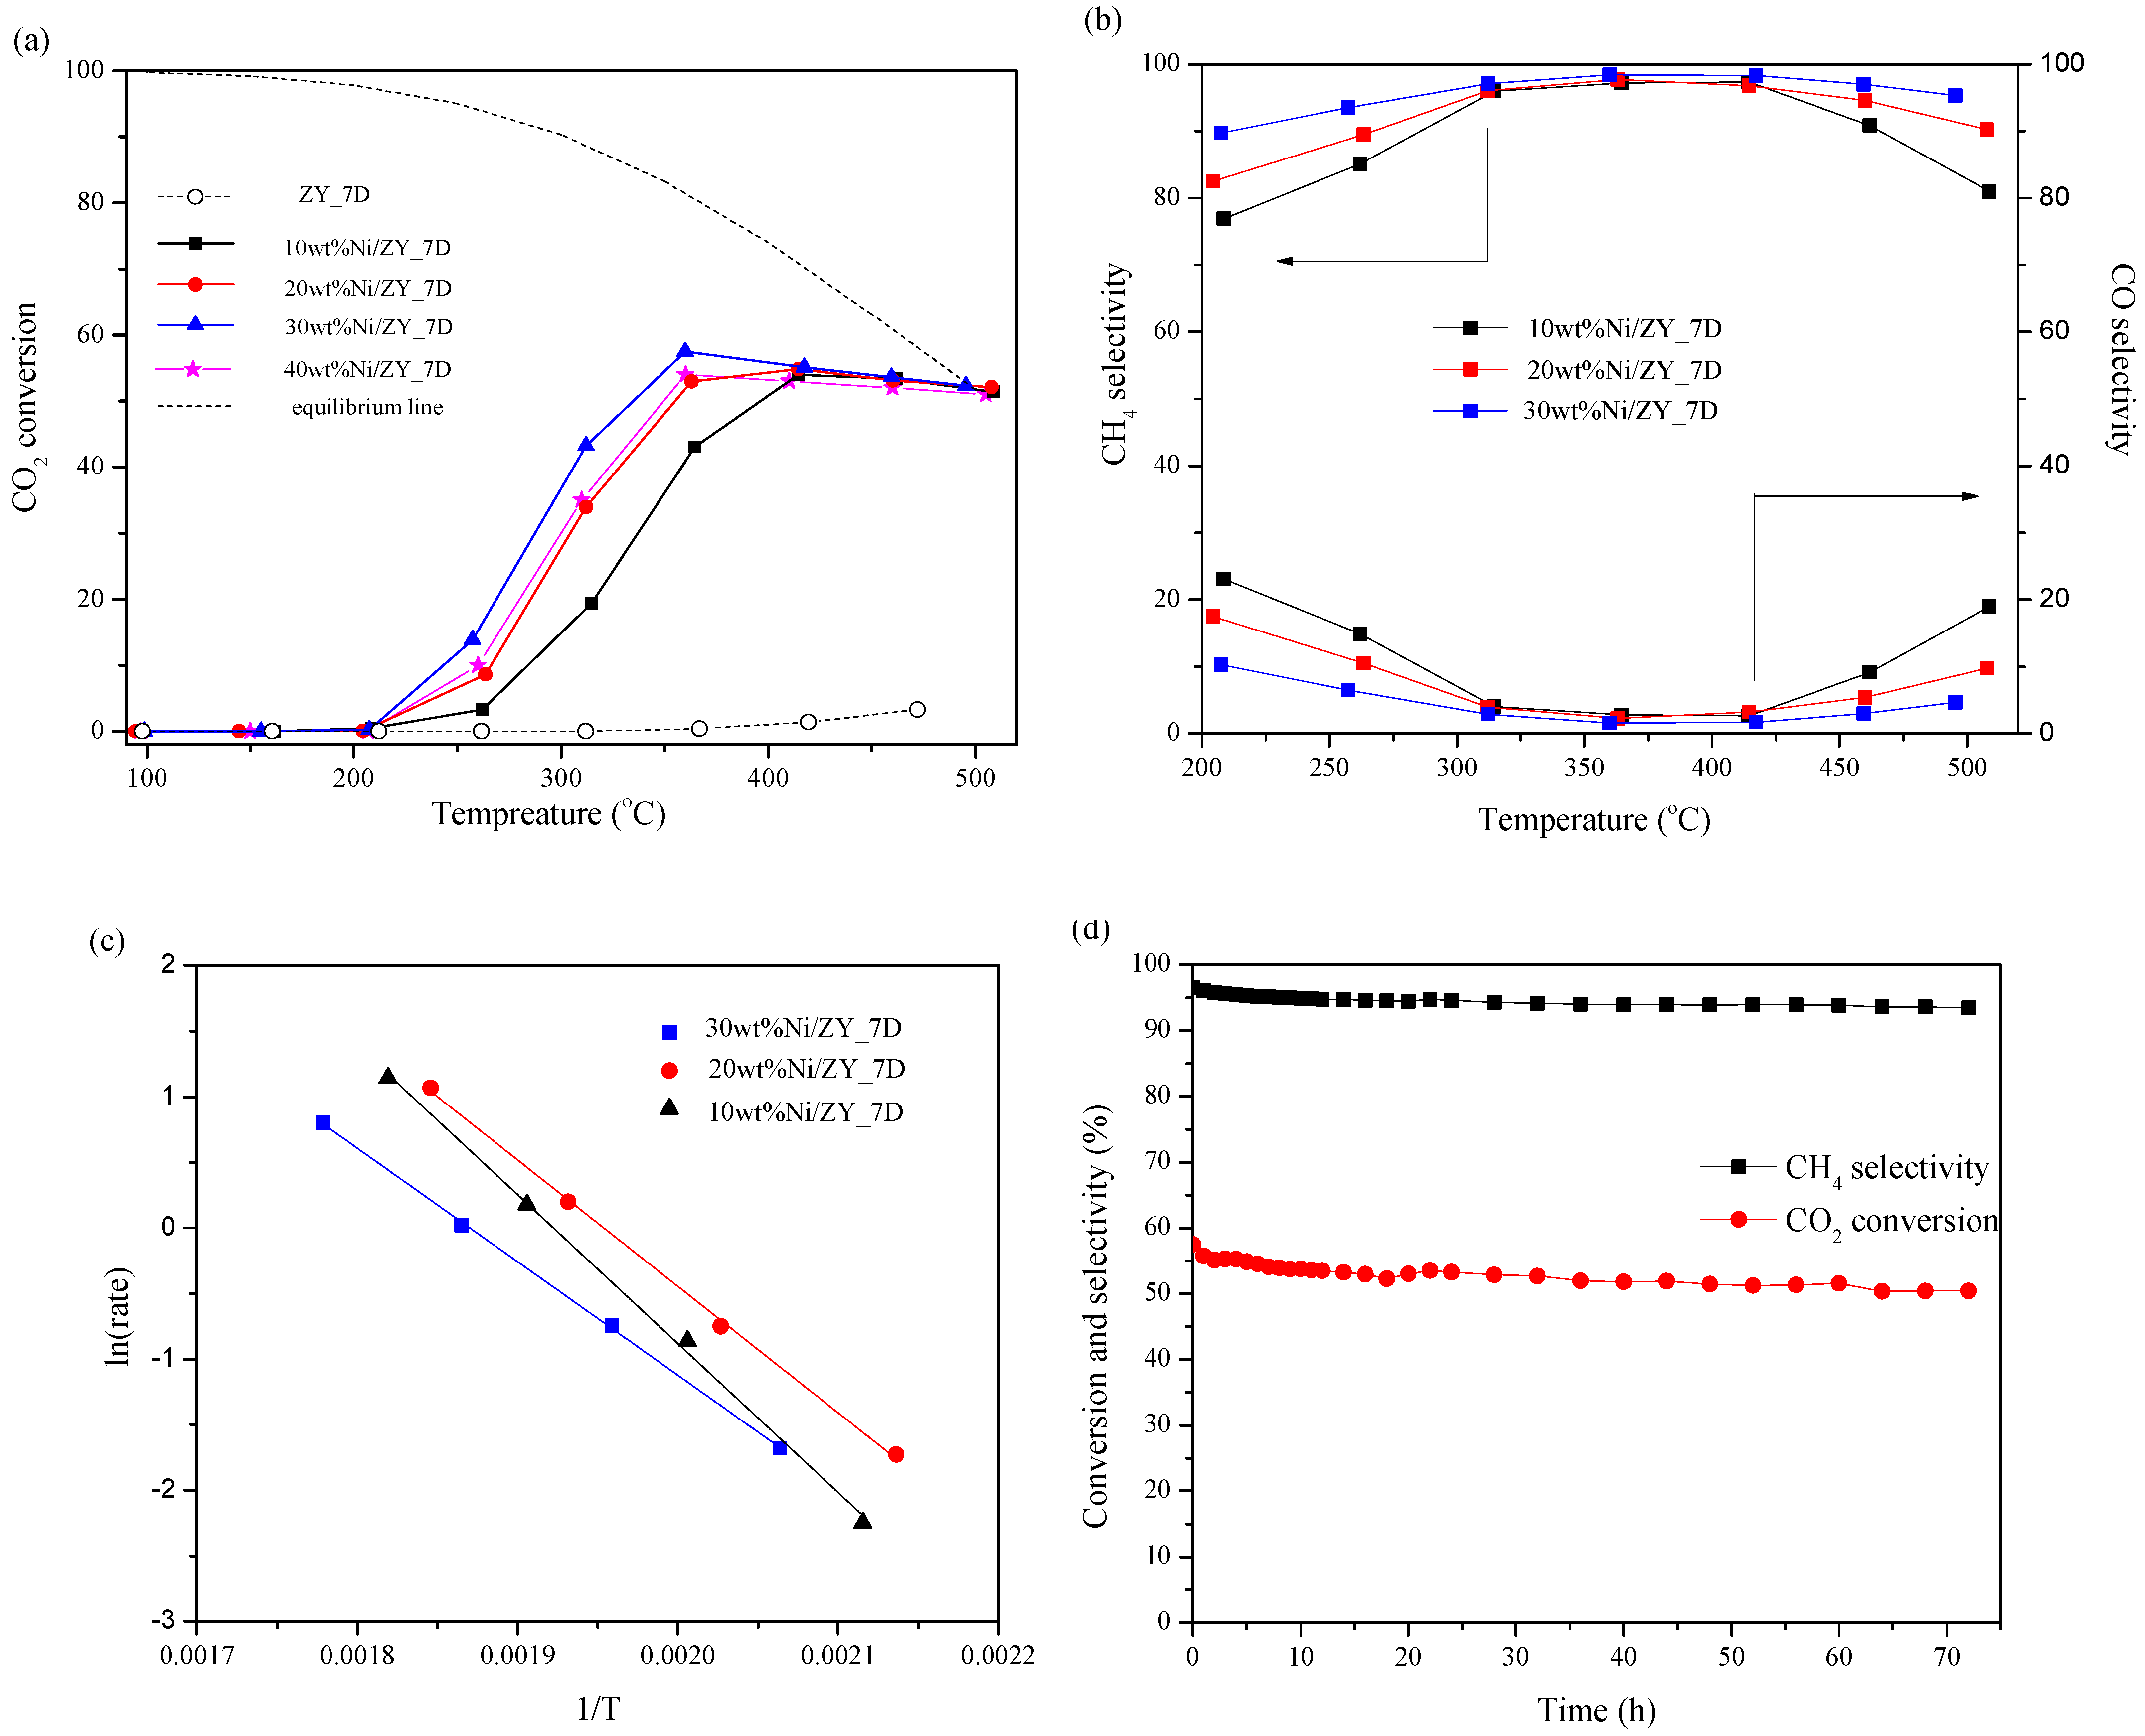
3.3. CO2 Methanation Catalytic Activity

All synthesized Ni/zeolite catalysts were tested for CO2 methanation catalytic activity under atmospheric pressure in the reaction temperature range of 100–500 °C. The CO2 methanation catalytic performance is reported in terms of the percentage of CO2 conversion as a function of reaction temperature, as shown in Figure 6a. The bare zeolite NaY support was not active for this reaction even though the reaction temperature had reached around 500 °C. The CO2 methanation catalytic activity was greatly enhanced upon the addition of Ni to the zeolite. Due to increased Ni loading, CO2 conversion was enhanced, which was indicated by a CO2 conversion of 50%. The temperature at the CO2 conversion of 50% was shifted toward a lower temperature with an increased Ni content, from 400, 353 and 335 °C for 10, 20 and 30 wt%Ni loading, respectively. However, further increases in the amount of Ni (40 wt%Ni) led to a decrease in CO2 conversion. This might be due to Ni agglomeration from an excess amount of loaded Ni, which then blocked the CO2 adsorption site. Therefore, the optimum Ni loading for a maximum reaction was 30 wt%. It can be seen that the CO2 conversion of all catalysts did not increase, even at higher temperatures, i.e., the CO2 conversion dropped slightly and was much lower than the equilibrium line. This can be explained by the fact that the catalyst diluent was not used in the catalyst bed, during the catalytic activity test. Therefore, the reported temperature might be much lower than that inside the catalyst bed in the reactor. Figure 6b shows the desired (CH4) product selectivity compared with the undesirable (CO) product. It was found that CH4 selectivity increased with the amount of Ni and the selectivity almost reached 100% in the temperature range of 300–450 °C. The undesirable product increased with an increased reaction temperature, which was due to the occurrence of a side reaction (reversed water gas shift; CO2 + H → CO + H2O). The kinetic study was analyzed in terms of apparent activation energy (Ea), which is calculated using the temperature range of 175–275 °C (CO2 conversion less than 15%), as shown in Figure 6c. The activation energies of all modified catalysts were 94.46, 80.20 and 72.01 kJ/mol for 10, 20 and 30 wt%Ni, respectively. This shows that 30 wt%Ni/zeolite exhibited the lowest activation energy, which corresponds to its highest catalytic activity. The stability of 30 wt%Ni/zeolite was tested under a feed stream at 350 °C for 72 h, as shown in Figure 6d. It was found that the CO2 conversion and CH4 selectivity were constant during the time on stream. This indicates the great stability of the catalyst. Table 3 illustrates the comparison of CO2 methanation catalytic activity between our catalysts and other works.

3.4. X-ray Absorption Spectroscopy

X-ray absorption spectroscopy is a useful technique for monitoring the electronic state of the probe atom in the catalyst during the reaction. Since Ni was an active species for this reaction, an in-situ experiment for investigating the electronic state changing of Ni was conducted by time-resolved X-ray absorption spectroscopy. Figure 7a displays the Ni K edge XANES spectra of 30 wt%Ni/zeolite NaY before and after reduction by H2 at 600 °C compared with metallic Ni and Ni2+ standards. For the Ni° standard, an edge energy at 8333 eV, attributed to the 1s to 3d electronic transition, was observed. The edge energy of Ni2+ was found at 8350 eV, which is attributed to electron transition from the 1s to 4p state [38,39]. It was found that the XANES spectral feature of the fresh catalyst was similar to that of the Ni2+ standard, while the pretreated catalyst showed the same spectral feature as the Ni foil standard. This indicated that the oxidation state of Ni was Ni2+ and Ni° for before and after pretreatment, respectively. Figure 7b displays the Ni K edge XANES spectra of 30 wt%Ni/zeolite NaY during the pretreatment step and the CO2 methanation reaction. The oxidation state of Ni2+ for the fresh catalyst was gradually reduced to Ni° during the increase in the reduction temperature and it was completely turned to Ni° at 600 °C. This is indicated by the lowering of the Ni2+ peak at 8350 eV during the increase in reduction temperature, as shown in Figure 7c. The metallic Ni was unchanged when the reduction temperature was held at 600 °C (for 90 min), as shown in Figure 7d. After the pretreatment step, the mixed feed gas (CO2 and H2) was switched to the catalyst and the Ni K edge XANES spectra were recorded during the increase in reaction temperatures from 100 to 500 °C. It was found that the oxidation state of Ni° was still unchanged, which was indicated by the same edge energy being observed in the Ni K edge XANES spectra at each temperature, as shown in Figure 7d. This indicated that Ni species had high stability under the reaction stream. The local environment of Ni during the CO2 methanation reaction was also investigated by analyzing the data in the EXAFS region. Figure S3 (left hand side) shows the Ni K-edge EXAFS spectra for the pretreatment step (600 °C), and CO2 methanation at 350 and 450 °C. All spectra were amplified by a k2 weight with a window k range of 2–9 Å−1 and an R space of 1–6 Å. The Fourier transformed function without phase correction of the in-situ Ni K-edge EXAFS oscillation for 30 wt%Ni/ZY_7D at each state is shown in Figure S3 (right hand side). The cubic closed-packed (CCP) Ni structure was used as the model for fitting. The best fitting parameters of the 30 wt%Ni/ZY_7D catalyst at different states are shown in Table S1. The first strongest peak at around 2.0 Å (2.48 Å from fitting) originated from a single scattering path between the Ni probe atom and the nearest neighboring Ni atoms (Ni–Ni). Following an increase in the reaction temperature, the distance between Ni-Ni was slightly decreased, which might indicate the agglomeration of Ni [40,41].
Since the deactivation of the catalyst usually results from the sintering or agglomeration of the Ni species during a reaction, monitoring of the electronic state of Ni during the fluctuating condition (CO2 + H2 and H2 dropout conditions) was used to describe the stability of this catalyst. Figure 8a illustrates the Ni K edge XANES spectra of 30 wt%Ni/zeolite NaY during the pretreatment step and under fluctuating conditions. The oxidation state of Ni2+ was reduced to Ni° during the reduction process, which can be indicated by an increasing Ni° peak (8333 eV). The Ni° state was constant during the holding time (600 °C for 90 min), as shown in Figure 8b. After the reduction process, the mixed feed gas of CO2 and H2 was first switched to the catalyst for 60 min. In this state, the Ni K edge XANES spectra and CH4 were recorded at the 30th, 40th and 60th min. It was found that the oxidation state of Ni remained unchanged during the CO2 methanation, which can be observed by the same spectral feature of Ni (Figure 8a) and the peak at 8333 eV also being constant (Figure 8b). Next, H2 was removed from the feed gas for 60 min and those two pieces of data were collected in the same manner as above. Figure 8b revealed that the oxidation state of Ni remained unchanged and the CH4 signal was also dropped during the H2 dropout process. After that, H2 was re-purged in the feed gas again. In this state, the oxidation state of Ni was Ni° and the product signal increased. The proposed CO2 methanation reaction on the catalyst’s surface during fluctuating conditions is presented in Figure 8c. During CO2 methanation, CO2 and H2 molecules were adsorbed on the active site of the catalyst’s surface. After that, the surface reaction between adsorbed species occurred, and products were formed and then left the surface. In this step, the oxidation state of Ni was Ni°. After removing H2 from the feed gas, the oxidation state of Ni was still unchanged. This indicated that the Ni species was stable under only a CO2 atmosphere. Then, the CO2 methanation was aged again by re-purging the H2 into the feed stream. At this step, two reactants were then adsorbed on the catalyst’s surface and reacted to form products. The oxidation state of Ni was also still unchanged. This indicated that the Ni species on the catalyst’s surface had high stability [42,43]. The stability of the catalyst can be evidenced by comparing the TEM images of 30 wt%Ni/ZY_7D catalyst (fresh catalyst) after the reduction by H2 at 600 °C for 90 min and that catalyst after CO2 methanation, as shown in Figure 8d. The Ni particle distribution of the former sample was 6–14 nm, while that of the latter sample exhibited broader distribution (5–30 nm), as shown in the distribution graph (inset). Therefore, the TEM images indicate that the surface morphology was maintained after CO2 methanation. This confirmed that zeolite can support the distribution of Ni species by strong metal support interaction and that the active Ni species was stable.
In order to elucidate the role of catalysts on the catalytic activity, the amount of H2 and CO2 adsorption was taken into account. Figure 9 illustrates the H2 and CO2 desorption amounts which were obtained from H2-TPD and CO2-TPD (weak + medium peaks), respectively. The desorption amount was directly related to the amount of adsorbed species on the catalyst’s surface. For H2 desorption, the H2 signal was not detected for bare zeolite NaY, which indicated that H2 cannot be adsorbed on zeolite support; therefore, zeolite was not active for this reaction. Increasing Ni loading on the catalyst’s surface increased the H2 adsorption. This resulted from a higher Ni area being available for the dissociative adsorption of H2 molecules. In the case of CO2 desorption, the weak and medium binding strength of CO2 with the catalyst tended to increase following the impregnation of Ni. For the CO2 methanation reaction, four molecules of H2 were required to react with one molecule of CO2; therefore, a larger amount of H2 molecules are needed than CO2 molecules. It was found that 30 wt%Ni/ZY_7D presented the highest H2 adsorption amount, together with an appropriate amount of CO2 uptake, which in turn promoted the highest CO2 methanation catalytic activity. In addition, zeolite support can promote stability by providing an appropriate interaction between metal and support, as evidenced by the H2-TPR results. For the most part, the NiO species located on different sites on the zeolite surface showed different reduction peaks. A large number of works have reported that lower reduction temperatures (<350 °C) of NiO in the H2-TPR profiles indicated weak binding strength between NiO and zeolite support. However, higher reduction peaks (>500 °C) would lead to strong interactions between those two species. Weak interactions between NiO and zeolite support cannot suppress the agglomeration of NiO during reactions, while strong interactions cannot facilitate the reducibility of NiO during the reactions. Therefore, an appropriate interaction between NiO and zeolite support can promote CO2 methanation catalytic activity.

4. Conclusions

Zeolite NaY with a high surface area was successfully synthesized via the facile reflux method under atmospheric pressure. The optimized aging time of zeolite mixtures before crystallization was 7 days. As-prepared zeolite NaY was further used as a catalyst support for CO2 methanation reactions. Amounts of 10, 20 and 30 wt%Ni were impregnated on the catalyst and the modified catalysts were tested for CO2 methanation catalytic activity. The 30 wt%Ni/zeolite NaY exhibited the highest CO2 methanation catalytic activity and high stability during a time on stream of 72 h. The high surface area of zeolite support can provide an area for Ni dispersion and large amounts of Ni can be added on the catalyst’s surface, which can promote H2 adsorption. The 30 wt%Ni/zeolite NaY also exhibited the highest H2 adsorption amount, which indicated its highest reducibility. Likewise, this catalyst also expressed the highest CO2 uptake. Therefore, the appropriate adsorption amount of both reactants can promote CO2 methanation catalytic activity. In situ X-ray absorption spectroscopy was used to confirm the stability of the catalyst. The Ni active species on the catalyst’s surface were monitored when the feed gas was switched between CO2 methanation conditions (H2 + CO2) and H2 dropout conditions. The results showed that the oxidation state of metallic Ni, which originated from a reduction under the H2 atmosphere in the pretreatment step, was unchanged during two cycles of fluctuating experiments. This indicated that zeolite support can prevent the agglomeration of the Ni species by an appropriate metal support interaction.

Supplementary Materials

The following supporting information can be downloaded at: https://0-www-mdpi-com.brum.beds.ac.uk/article/10.3390/chemengineering8020028/s1, Figure S1: SEM images of zeolite NaY with different aging times (0, 1, 3 and 7 days); Figure S2. SEM images and elemental mapping of zeolite NaY support (ZY_7D), with 10, 20 and 30 wt%Ni/ZY_7D catalysts; Figure S3. Ni K-edge EXAFS oscillation data with k2χ(k) (left hand side) and Fourier transformation data of Ni K-edge EXAFS for 30 wt%Ni/ZY_7D; Table S1: The best fitting parameters obtained from 30 wt%Ni/ZY_7D during CO2 methanation.

Author Contributions

Conceptualization, K.C.C.; Methodology, P.K. and Y.P.-a.; Writing—original draft, S.K. and K.C.C.; Writing—review and editing, K.C.C. All authors have read and agreed to the published version of the manuscript.

Funding

This research received no external funding.

Data Availability Statement

The data generated in this study may be provided by the corresponding authors upon reasonable request.

Acknowledgments

This work was supported by the Department of Chemistry, Faculty of Science, Khon Kaen University, the Center of Excellence for Innovation in Chemistry (PERCH-CIC), Ministry of Higher Education, Science, Research and Innovation.

Conflicts of Interest

The authors declare no conflicts of interest.

References

  1. Onrubia-Calvo, J.A.; Quindimil, A.; Davó-Quiñonero, A.; Bermejo-López, A.; Bailón-García, E.; Pereda-Ayo, B.; Lozano-Castelló, D.; González-Marcos, J.A.; Bueno-López, A.; González-Velasco, J.R. Kinetics, Model Discrimination, and Parameters Estimation of CO2 Methanation on Highly Active Ni/CeO2 Catalyst. Ind. Eng. Chem. Res. 2022, 61, 10419–10435. [Google Scholar] [CrossRef]
  2. Makdee, A.; Chanapattharapol, K.C.; Kidkhunthod, P.; Poo-arporn, Y.; Ohno, T. The role of Ce addition in catalytic activity enhancement of TiO2-supported Ni for CO2 methanation reaction. RSC Adv. 2020, 10, 26952–26971. [Google Scholar] [CrossRef]
  3. Al-Fatesh, A.S.; Kaydouh, M.-N.; Ahmed, H.; Ibrahim, A.A.; Alotibi, M.F.; Osman, A.I.; Hassan, N.E. Sr Promoted Ni/W–Zr Catalysts for Highly Efficient CO2 Methanation: Unveiling the Role of Surface Basicity. Langmuir 2023, 39, 17723–17732. [Google Scholar] [CrossRef] [PubMed]
  4. Ridzuan, N.D.M.; Shaharun, M.S.; Anawar, M.A.; Ud-Din, I. Ni-Based Catalyst for Carbon Dioxide Methanation: A Review on Performance and Progress. Catalysts 2022, 12, 469. [Google Scholar] [CrossRef]
  5. Wang, Z.; Wang, L.; Cui, Y.; Xing, Y.; Su, W. Research on nickel-based catalysts for carbon dioxide methanation combined with literature measurement. J. CO2 Util. 2022, 63, 102117. [Google Scholar] [CrossRef]
  6. Shen, L.; Xu, J.; Zhu, M.; Han, Y.-F. Essential Role of the Support for Nickel-Based CO2 Methanation Catalysts. ACS Catal. 2020, 10, 14581–14591. [Google Scholar] [CrossRef]
  7. Costa-Serra, J.F.D.; Cerdá-Moreno, C.; Chica, A. Zeolite-Supported Ni Catalysts for CO2 Methanation: Effect of Zeolite Structure and Si/Al Ratio. Appl. Sci. 2020, 10, 5131. [Google Scholar] [CrossRef]
  8. Sholeha, N.A.; Mohamad, S.; Bahruji, H.; Prasetyoko, D.; Widiastuti, N.; Fatah, N.A.A. Enhanced CO2 methanation at mild temperature on Ni/zeolite from kaolin: Effect of metal–support interface. RSC Adv. 2021, 11, 16376. [Google Scholar] [CrossRef]
  9. Guilera, J.; Valle, J.; Alarcón, A.; Díaz, J.A.; Andreu, T. Metal-oxide promoted Ni/Al2O3 as CO2 methanation micro-size catalysts. J. CO2 Util. 2019, 30, 11–17. [Google Scholar] [CrossRef]
  10. Ye, R.-P.; Liao, L.; Reina, T.R.; Liu, J.; Chevella, D.; Jin, Y. Engineering Ni/SiO2 catalysts for enhanced CO2 methanation. Fuel 2021, 285, 119151. [Google Scholar] [CrossRef]
  11. Zeng, L.; Wang, Y.; Li, Z.; Song, Y.; Zang, J.; Wang, J. Highly Dispersed Ni Catalyst on Metal–Organic Framework-Derived Porous Hydrous Zirconia for CO2 Methanation. ACS Appl. Mater. Interfaces 2020, 12, 17436. [Google Scholar] [CrossRef]
  12. Unwiset, P.; Chanapattharapol, K.C.; Kidkhunthod, P.; Poo-Arporn, Y.; Ohtani, B. Catalytic activities of titania-supported nickel for carbon-dioxide methanation. Chem. Eng. Sci. 2020, 228, 115955. [Google Scholar] [CrossRef]
  13. Krachuamram, S.; Kidkhunthod, P.; Poo-arporn, Y.; Kamonsutthipaijit, N.; Chanapattharapol, K.C. On the Optimization of Ni/A and Ni/X Synthesis Procedure toward Active and Selective Catalysts for the Production of CH4 from CO2. Catalysts 2022, 12, 823. [Google Scholar] [CrossRef]
  14. Czuma, N.; Zarębska, K.; Motak, M.; Gálvez, M.E.; Costa, P.D. Ni/zeolite X derived from fly ash as catalysts for CO2 methanation. Fuel 2020, 267, 117139. [Google Scholar] [CrossRef]
  15. Kostyniuk, A.; Bajec, D.; Likozar, B. Catalytic hydrogenation, hydrocracking and isomerization reactions of biomass tar model compound mixture over Ni-modified zeolite catalysts in packed bed reactor. Renew. Energy 2021, 167, 409. [Google Scholar] [CrossRef]
  16. Alismaeel, Z.T.; Al-Jadir, T.M.; Albayati, T.M.; Abbas, A.S.; Doyle, A.M. Modification of FAU zeolite as an active heterogeneous catalyst for biodiesel production and theoretical considerations for kinetic modeling. Adv. Powder Technol. 2022, 33, 103646. [Google Scholar] [CrossRef]
  17. Parise, J.B.; Corbin, D.R.; Abrams, L.; Cox, D.E. Structure of dealuminated Linde Y-zeolite; Si139.7Al52.3O384 and Si173.1Al18.9O384: Presence of non-framework Al species. Acta Crystallogr. C 1984, 40, 1493. [Google Scholar] [CrossRef]
  18. Quindimil, A.; Torre, U.; Pereda, B.; Gonzalez-Marcos, J.A.; Gonzalez-Velasco, J.R. Ni catalysts with La as promoter supported over Y- and Beta- zeolites for CO2 methanation. Appl. Catal. B Environ. 2018, 238, 393–403. [Google Scholar] [CrossRef]
  19. Bacariza, M.C.; Bértolo, R.; Graça, I.; Lopes, J.M.; Henriques, C. The effect of the compensating cation on the catalytic performances of Ni/USY zeolites towards CO2 methanation. J. CO2 Util. 2017, 21, 280–291. [Google Scholar] [CrossRef]
  20. Wang, J.; Li, M.; Fu, Y.; Amoo, C.C.; Jiang, Y.; Yang, R.; Sun, X.; Xing, C.; Maturura, E. An ambient pressure method for synthesizing NaY zeolite. Microporous Mesoporous Mater. 2021, 320, 111073. [Google Scholar] [CrossRef]
  21. Sun, X.; Wang, J.; Jiang, Y.; Maturura, E.; Wang, W.; Yang, R.; Xing, C.; Chen, J.; Tsubaki, N. Facile synthesis of zeolites under an atmospheric reflux system. Microporous Mesoporous Mater. 2022, 331, 111646. [Google Scholar] [CrossRef]
  22. Zhang, L.; Wang, X.; Chen, Y. Rapid synthesis of uniform nano-sized silicalite-1 zeolite crystals under atmospheric pressure without wastes discharge. Chem. Eng. J. 2020, 382, 122913. [Google Scholar] [CrossRef]
  23. Liu, Q.; Gao, J.; Zhang, M.; Li, H.; Gu, F.; Xu, G.; Zhong, Z.; Su, F. Highly active and stable Ni/g-Al2O3 catalysts selectively deposited with CeO2 for CO methanation. RSC Adv. 2014, 4, 16094. [Google Scholar] [CrossRef]
  24. Koroglu, H.J.; Sarioglan, A.; Tatlier, M.; Erdem-Senatalar, A.; Savasci, O.T. Synthesis of zeolites in the absence of organic structure-directing agents: Factors governing crystal selection and polymorphism. J. Cryst. Growth 2002, 241, 481. [Google Scholar]
  25. Krachuamram, S.; Chanapattharapol, K.C.; Kamonsutthipaijit, N. Synthesis and characterization of NaX-type zeolites prepared by different silica and alumina sources and their CO2 adsorption properties. Microporous Mesoporous Mater. 2021, 310, 110632. [Google Scholar] [CrossRef]
  26. Maia, A.B.; Dias, R.N.; Angélica, R.S.; Neves, R.F. Influence of an aging step on the synthesis of zeolite NaA from Brazilian Amazon kaolin waste. J. Mater. Res. Technol. 2019, 8, 2924–2929. [Google Scholar] [CrossRef]
  27. Nguyen, D.-K.; Dinh, V.-P.; Dang, N.T.; Khan, T.; Hungg, N.T.; Tran, N.H.T. Effects of aging and hydrothermal treatment on the crystallization of ZSM-5 zeolite synthesis from bentonite. RSC Adv. 2023, 13, 20565. [Google Scholar] [CrossRef]
  28. Sharma, R.K.; Ghose, R. Synthesis of porous nanocrystalline NiO with hexagonal sheet-like morphology by homogeneous precipitation method. Superlattices Microstruct. 2015, 80, 169. [Google Scholar] [CrossRef]
  29. Bacariza, M.C.; Amjad, S.; Teixeira, P.; Lopes, J.; Henriques, C. Boosting Ni Dispersion on Zeolite-Supported Catalysts for CO2 Methanation: The Influence of the Impregnation Solvent. Energy Fuels 2020, 34, 14656. [Google Scholar] [CrossRef]
  30. Li, H.; Zhang, W.; Wang, L.; Li, H.; Fan, Y.; Yang, X.; Du, H.; Zhang, Y.; Li, Z. Ni-derived electronic/ionic engineering on NiSe/Ni@C for ultrafast and stable sodium storage. Chem. Commun. 2023, 59, 11859. [Google Scholar] [CrossRef]
  31. Graca, I.; González, L.V.; Bacariza, M.C.; Fernandes, A.; Henriques, C.; Lopes, J.M. CO2 hydrogenation into CH4 on NiHNaUSY zeolites. Appl. Catal. B Environ. 2014, 147, 101–110. [Google Scholar] [CrossRef]
  32. Branco, J.B.; Brito, P.E.; Ferreira, A.C. Methanation of CO2 over nickel-lanthanide bimetallic oxides supported on silica. Chem. Eng. J. 2020, 380, 122465. [Google Scholar] [CrossRef]
  33. Le, T.A.; Kim, J.; Kang, J.K.; Park, E.D. CO and CO2 methanation over M (MMn, Ce, Zr, Mg, K, Zn, or V)-promoted Ni/Al@Al2O3 catalysts. Catal. Today 2020, 348, 80–88. [Google Scholar] [CrossRef]
  34. Bacariza, M.C.; Graça, I.; Lopes, J.M.; Henriques, C. Enhanced Activity of CO2 Hydrogenation to CH4 over Ni Based Zeolites through the Optimization of the Si/Al Ratio. Microporous Mesoporous Mater. 2018, 267, 9. [Google Scholar] [CrossRef]
  35. Zhang, F.; Lu, B.; Sun, P. Highly stable Ni-based catalysts derived from LDHs supported on zeolite for CO2 methanation. Int. J. Hydrogen Energy 2020, 45, 16183. [Google Scholar] [CrossRef]
  36. Guo, X.; Traitangwong, A.; Hu, M.; Zuo, C.; Meeyoo, V.; Peng, Z.; Li, C. Carbon Dioxide Methanation over Nickel-Based Catalysts Supported on Various Mesoporous Material. Energy Fuels 2018, 32, 3681–3689. [Google Scholar] [CrossRef]
  37. Spataru, D.; Canastreiro, D.; Swirk Da Costa, K.; Quindimil, A.; Lopes, J.M.; Costa, P.; Henriques, C.; Bacariza, C. Doping Ni/USY zeolite catalysts with transition metals for CO2 methanation. Int. J. Hydrogen Energy 2024, 53, 468–481. [Google Scholar] [CrossRef]
  38. Garbarino, G.; Riani, P.; Magistri, L.; Busca, G. A study of the methanation of carbon dioxide on Ni/Al2O3 catalyst at atmospheric pressure. Int. J. Hydrogen Energy 2014, 39, 11557. [Google Scholar] [CrossRef]
  39. Li, Y.; Men, Y.; Liu, S.; Wang, J.; Wang, K.; Tang, Y. Remarkably efficient and stable Ni/Y2O3 catalysts for CO2 methanation: Effect of citric acid addition. Appl. Catal. B Environ. 2021, 293, 120206. [Google Scholar] [CrossRef]
  40. Serrer, M.-A.; Gaur, A.; Jelic, J.; Weber, S.; Fritsch, C.; Clark, A.H.; Saraçi, E.; Studt, F.; Grunwaldt, J.-D. Structural dynamics in Ni–Fe catalysts during CO2 methanation—Role of iron oxide clusters. Catal. Sci. Technol. 2020, 10, 7542. [Google Scholar] [CrossRef]
  41. Kesavana, J.K.; Luisettoa, I.; Tutia, S.; Meneghinia, C.; Iuccia, G.; Battocchioa, C.; Mobilioa, S.; Casciardib, S.; Sistob, R. Nickel supported on YSZ: The effect of Ni particle size on the catalytic activity for CO2 methanation. J. CO2 Util. 2018, 23, 200. [Google Scholar] [CrossRef]
  42. Wierzbicki, D.; Baran, R.; Dębek, R.; Motak, M.; Gálvez, M.E.; Grzybek, T.; Da Costa, P.; Glatzel, P. Examination of the influence of La promotion on Ni state in hydrotalcite-derived catalysts under CO2 methanation reaction conditions: Operando X-ray absorption and emission spectroscopy investigation. Appl. Catal. B Environ. 2018, 232, 409. [Google Scholar] [CrossRef]
  43. Mutz, B.; Carvalho, H.W.P.; Mangold, S.; Kleist, W.; Grunwaldt, J.-D. Methanation of CO2: Structural response of a Ni-based catalyst under fluctuating reaction conditions unraveled by operando spectroscopy. J. Catal. 2015, 327, 48. [Google Scholar] [CrossRef]
Scheme 1. A schematic representation of the scope of this work, including the synthesis of the 30 wt%Ni/ZY_7D catalyst using the facile reflux method (for crystallization), CO2 methanation tested by synthesized catalysts and in situ XAS investigation.
Chemengineering 08 00028 sch001
Figure 1. (a) XRD patterns and (b) N2 adsorption–desorption isotherms of zeolite NaY with different aging times (0, 1, 3 and 7 days). Solid and open symbols represent adsorption and desorption branches, respectively.
Chemengineering 08 00028 g001
Figure 2. (a) XRD patterns and (b) N2 adsorption–desorption isotherms of zeolite NaY support (ZY_7D), with 10, 20 and 30 wt%Ni/ZY_7D catalysts.
Chemengineering 08 00028 g002
Figure 3. H2-TPR profiles of zeolite NaY support, with 10, 20 and 30 wt%Ni/zeolite NaY catalysts.
Chemengineering 08 00028 g003
Figure 4. H2 TPD of zeolite support and x wt%Ni/zeolite catalysts (x = 10, 20 and 30 wt%Ni).
Chemengineering 08 00028 g004
Figure 5. The CO2 TPD of zeolite support and x wt%Ni/zeolite catalysts (x = 10, 20 and 30 wt%Ni).
Chemengineering 08 00028 g005
Figure 6. (a) Catalytic activity (b), CH4 and CO selectivity, (c) Arrhenius plot of 10, 20 and 30 wt%Ni/zeolite NaY and (d) stability test of 30 wt%Ni/zeolite NaY at 350 °C.
Chemengineering 08 00028 g006
Figure 7. Ni K edge XANES spectra of the 30 wt%Ni/ZY_7D catalyst (a) before and after reduction at 600 °C and Ni standards, (b) during the reduction process and CO2 methanation, (c) during the reduction process at various temperatures and (d) during the reduction process and CO2 methanation.
Chemengineering 08 00028 g007
Figure 8. (a) Ni K edge XANES spectra of the 30 wt%Ni/ZY_7D catalyst during fluctuating conditions, (b) relationship between Ni° peak intensity, product (CH4) GC-MS signal and temperature during the process, (c) proposed reaction during fluctuating condition related to the oxidation state of the Ni species for each state and (d) comparison of TEM images of 30 wt%Ni/ZY_7D after reduction at 600 °C and after CO2 methanation reaction.
Chemengineering 08 00028 g008
Figure 9. Comparing the H2 and CO2 desorption amounts for all synthesized samples.
Chemengineering 08 00028 g009
Table 1. Surface area and crystallite size of zeolite and NiO and zeolite synthesis methods of other works.
SamplesSBET (m2/g)Crystallite Size of Zeolite (nm) aCrystallite Size of NiO (nm) bSynthesis MethodReference
ZY_0D285.341.1-
-
Age zeolite mixture at room temperature for 0, 1, 3 and 7 days;
-
Crystallization by reflux at 100 °C for 12 h under ambient pressure.
This work
ZY_1D313.033.6-
ZY_3D390.127.5-
ZY_7D468.823.6-
Zeolite NaY384.0--
-
Crystallization by reflux at 90 °C for 4 h under ambient pressure;
-
Heating at 400 °C for 3 h.
[20]
Zeolite NaY564.0--
-
Age zeolite mixture for 30 min;
-
Crystallization in conventional lab oven at 90 °C for 18 h.
[21]
silicalite-1 zeolite466.2--
-
Crystallization by reflux at 90 °C for 9 h under ambient pressure.
[22]
10 wt%Ni/ZY_7D377.337.013.2Wet impregnationThis work
20 wt%Ni/ZY_7D300.438.816.4
30 wt%Ni/ZY_7D282.839.218.9
a Calculated from (111) crystallographic plane of zeolite NaY. b Calculated from (200) crystallographic plane of NiO.
Table 2. H2 consumption, H2 and CO2 desorption, %Ni dispersion and activation energy of all synthesized samples.
SampleH2 Consumption (mmol/g) aH2 Desorption (mmol/g) bCO2 Desorption
(mmol/g) c
%
Dispersion
Ea (kJmol−1)
WeakMedium
ZY_7D--0.2940.406--
10 wt%Ni/ZY_7D132.546.320.4820.62229.594.46
20 wt%Ni/ZY_7D184.350.610.3020.40514.680.20
30 wt%Ni/ZY_7D195.556.250.4780.60111.072.01
a Estimated from H2-TPR. b Estimated from H2-TPD. c Estimated from CO2-TPD.
Table 3. Comparison of CO2 methanation catalytic activity between our catalyst and other works.
CatalystsTemperature (°C)CO2 Conversion (%)CH4 Selectivity (%)ConditionReference
5Ni/ITQ-2(∞)3506899H2/CO2 = 4:1, 1 atm, GHSV = 3500 h−1[7]
15 wt%Ni/zeolite NaY25033100H2/CO2 = 4:1, 1 atm, GHSV = 12,500 h−1[8]
10 wt%Ni/ZSM-54007677H2/CO2 = 4:1, 1 atm, GHSV = 2400 h−1[36]
Ni-10%La2O3/Na-BETA35065100H2/CO2 = 4:1, 1 atm, GHSV = 10,000 h−1[19]
15 wt%Ni/USY
(Cs+ = compensating cation)
32535100H2/CO2 = 6:1, 5 atm[37]
30 wt%Ni/ZY_7D3505897H2/CO2 = 4:1, 1 atm, GHSV = 4250 h−1This work
Disclaimer/Publisher’s Note: The statements, opinions and data contained in all publications are solely those of the individual author(s) and contributor(s) and not of MDPI and/or the editor(s). MDPI and/or the editor(s) disclaim responsibility for any injury to people or property resulting from any ideas, methods, instructions or products referred to in the content.

