
Surface-Enhanced Raman Spectroscopy for the Investigation of Chromogenic Motion Picture Films: A Preliminary Study


Abstract
:1. Introduction
2. Materials and Methods
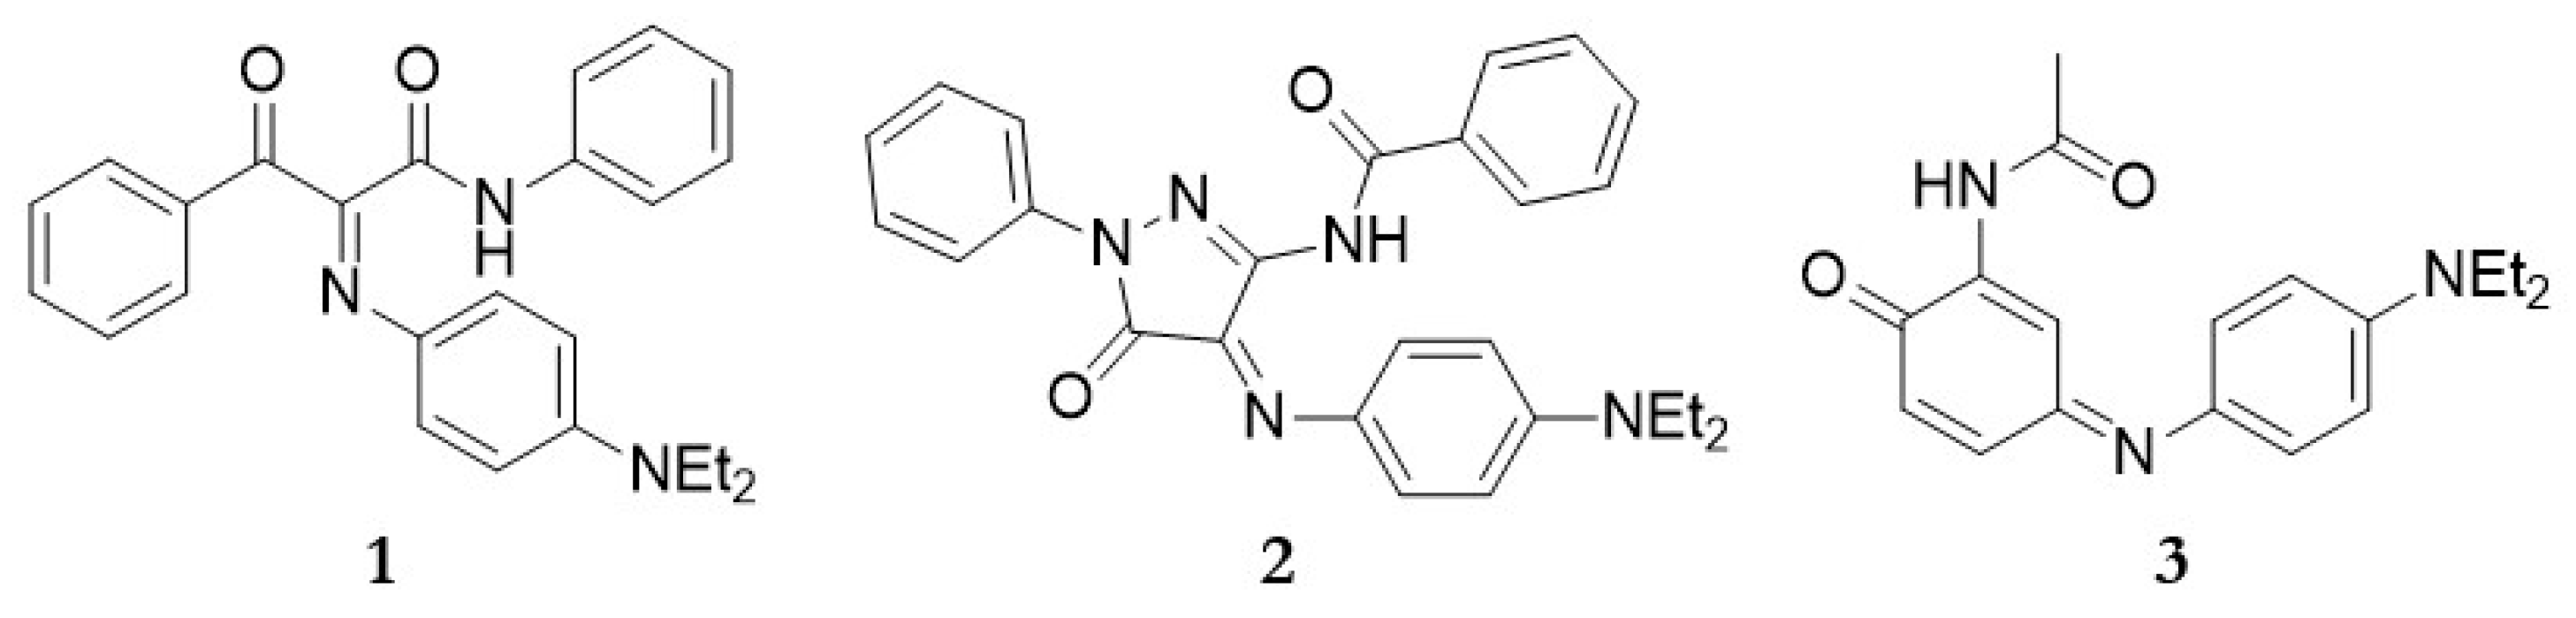
2.1. Synthesis of Dyes
2.2. Synthesis of Silver Nanostars
2.3. Sample Preparation
2.4. SERS and Raman Analysis
3. Results and Discussion
4. Conclusions
Supplementary Materials
Author Contributions
Funding
Institutional Review Board Statement
Informed Consent Statement
Data Availability Statement
Acknowledgments
Conflicts of Interest
References
- Timeline of Historical Film Colors. Available online: https://filmcolors.org (accessed on 18 January 2022).
- Di Pietro, G. Examples of using advanced analytical techniques to investigate the degradation of photographic materials. In Physical Techniques in the Study of Art, Archaeology and Cultural Heritage; Creagh, D., Bradley, D., Eds.; Elsevier: Amsterdam, The Netherlands, 2007; pp. 155–197. [Google Scholar]
- Lima da Silva, J.S. Ângelo de Sousa’s Photographic and Film Collection: Strategies for the Preservation of Colour Slide-Based Artworks. Ph.D. Thesis, Universidade Nova de Lisboa, Lisbon, Portugal, 2019. [Google Scholar]
- Friedrich, L.E.; Capecki, J.A. Color-Forming Photographic Materials. In Handbook of Imaging Materials, 2nd ed.; Diamond, A.S., Weiss, D.S., Eds.; Marcel Dekker, Inc.: New York, NY, USA, 2002; pp. 35–62. [Google Scholar]
- Theys, R.D.; Sosnovsky, G. Chemistry and Processes of Color Photography. Chem. Rev. 1997, 97, 83–132. [Google Scholar] [CrossRef] [PubMed]
- Conti, C.; Botteon, A.; Bertasa, M.; Colombo, C.; Realini, M.; Sali, D. Portable Sequentially Shifted Excitation Raman spectroscopy as an innovative tool for in situ chemical interrogation of painted surfaces. Analyst 2016, 141, 4599–4607. [Google Scholar] [CrossRef] [PubMed] [Green Version]
- Jeanmaire, D.L.; Van Duyne, R.P. Surface Raman Spectroelectrochemistry Part1. Heterocyclic, aromatic and aliphatic amines adsorbed on the anodized silver electrode. J. Electroanal. Chem. 1977, 84, 1–20. [Google Scholar] [CrossRef]
- Pozzi, F.; Leona, M. Surface-enhanced Raman spectroscopy in art and archaeology. J. Raman Spectrosc. 2016, 47, 67–77. [Google Scholar] [CrossRef]
- Chen, K.; Leona, M.; Vo-Dinh, T. Surface-enhanced Raman scattering for identification of organic pigments and dyes in works of art and cultural heritage material. Sens. Rev. 2007, 27, 109–120. [Google Scholar] [CrossRef]
- Casadio, F.; Leona, M.; Lombardi, J.R.; Van Duyne, R. Identification of organic colorants in fibers, paints, and glazes by surface enhanced Raman spectroscopy. Acc. Chem. Res. 2010, 43, 782–791. [Google Scholar] [CrossRef] [PubMed]
- Leona, M.; Decuzzi, P.; Kubic, T.A.; Gates, G.; Lombardi, J.R. Nondestructive identification of natural and synthetic organic colorants in works of art by surface enhanced Raman scattering. Anal. Chem. 2011, 83, 3990–3993. [Google Scholar] [CrossRef]
- Leona, M.; Stenger, J.; Ferloni, E. Application of surface-enhanced Raman scattering techniques to the ultrasensitive identification of natural dyes in works of art. J. Raman Spectrosc. 2006, 37, 981–992. [Google Scholar] [CrossRef]
- Lee, P.C.; Meisel, D. Adsorption and surface-enhanced Raman of dyes on silver and gold sols. J. Phys. Chem. 1982, 86, 3391–3395. [Google Scholar] [CrossRef]
- Guerrero-Martínez, A.; Barbosa, S.; Pastoriza-Santos, I.; Liz-Marzán, L.M. Nanostars shine bright for you. Curr. Opin. Colloid Interface Sci. 2011, 16, 118–127. [Google Scholar] [CrossRef]
- Wang, Y.; Camargo, P.H.C.; Skrabalak, S.E.; Gu, H.; Xia, Y. A Facile, Water-Based Synthesis of Highly Branched Nanostructures of Silver. Langmuir 2008, 24, 12042–12046. [Google Scholar] [CrossRef] [PubMed]
- Garcia-Leis, A.; Garcia-Ramos, J.V.; Sanchez-Cortes, S. Silver Nanostars with High SERS Performance. J. Phys. Chem. C 2013, 117, 7791–7795. [Google Scholar] [CrossRef]
- Zalaffi, M.S.; Litti, L.; Canton, P.; Meneghetti, M.; Moretto, L.M.; Ugo, P. Preparation and characterization of Ag-nanostars@Au-nanowires hierarchical nanostructures for highly sensitive surface enhanced Raman spectroscopy. Nano Express 2020, 1, 020006. [Google Scholar] [CrossRef]
- Reijers, E.B. How to Preserve Photographic Artworks for the Future: Chemical and Physical Interactions and Implications for Conservation Strategies. Ph.D. Thesis, Utrecht University, Utrecht, The Netherlands, 2017. [Google Scholar]
- Sano, K. Alkaline hydrolysis of yellow azomethine dyes. J. Org. Chem. 1969, 34, 2076–2080. [Google Scholar] [CrossRef]
- Vittum, P.W.; Duennebier, F.C. The Reaction between Pyrazolones and their Azomethine Dyes. J. Am. Chem. Soc. 1950, 72, 1536–1538. [Google Scholar] [CrossRef]
- Cusan, C.; Spalluto, G.; Prato, M.; Adams, M.; Bodensieck, A.; Bauer, R.; Tubaro, A.; Bernardi, P.; Da Ros, T. Synthesis and biological evaluation of a new class of acyl derivatives of 3-amino-1-phenyl-4,5-dihydro-1H-pyrazol-5-one as potential dual cyclooxygenase (COX-1 and COX-2) and human lipoxygenase (5-LOX) inhibitors. Il Farmaco 2005, 60, 327–332. [Google Scholar] [CrossRef] [PubMed]
- Vittum, P.W.; Brown, G.H. Indoaniline Dyes. I. Some Phenol Blue Derivatives with Substituents in the Phenol Ring. J. Am. Chem. Soc. 1946, 68, 2235–2239. [Google Scholar] [CrossRef]
- Fujifilm: Value from Innovation. Available online: https://www.fujifilm.com (accessed on 18 January 2022).
- Zalaffi, M.S.; Agostinelli, I.; Karimian, N.; Ugo, P. Ag-nanostars for the sensitive SERS detection of dyes in artistic cross-sections— Madonna della Misericordia of the National Gallery of Parma: A case study. Heritage 2020, 3, 74. [Google Scholar] [CrossRef]
- Gao, X.; Davies, J.P.; Weaver, M.J. A test of surface selection rules for surface-enhanced Raman scattering: The orientation of adsorbed benzene and monosubstituted benzenes on gold. J. Phys. Chem. 1990, 94, 6858–6864. [Google Scholar] [CrossRef]
- Smith, D.L.; Barrett, E.K. The crystal structures of two pyrazolinone azomethine dyes. Acta Cryst. 1971, B27, 2043–2057. [Google Scholar] [CrossRef]
- Ichijima, S.; Fukunaga, H.; Kobayashi, H.; Ishihara, M.; Kogay, N. Theoretical study on the structures and absorption properties of yellow azomethine dyes. Bull. Chem. Soc. Jpn. 2003, 76, 733–742. [Google Scholar] [CrossRef]
- Adachi, M.; Murata, Y.; Nakamura, S. Theoretical and experimental studies of indoaniline dyes. A novel relationship between absorption spectra and molecular structure. J. Am. Chem. Soc. 1993, 115, 4331–4338. [Google Scholar] [CrossRef]
- Gardner, A.M.; Wright, T.G. Consistent assignment of the vibrations of monosubstituted benzenes. J. Chem. Phys. 2011, 135, 114305. [Google Scholar] [CrossRef] [PubMed]
- Socrates, G. Infrared and Raman Characteristic Group Frequencies, 3rd ed.; John Wiley & Sons: Chichester, UK, 2001. [Google Scholar]
- Alam, M.S.; Lee, D.-U. Spectral (FT-IR, FT-Raman, UV, and fluorescence), DFT, and solid state interaction analyses of (E)-4-(3,4-dimethoxybenzylideneamino)-1,5-dimethyl-2-phenyl-1H-pyrazol-3(2H)-one. J. Mol. Struct. 2017, 1128, 174–185. [Google Scholar] [CrossRef]
- Alam, M.S.; Lee, D.-U. Molecular structure, spectral (FT-IR, FT-Raman, Uv-Vis, and fluorescent) properties and quantum chemical analyses of azomethine derivative of 4-aminoantipyrine. J. Mol. Struct. 2021, 1227, 129512. [Google Scholar] [CrossRef]
- Durig, J.R.; Mamula Bergana, M.; Zunic, W. Fourier transform Raman spectrum of polycrystalline pyrazole, vibrational assignment and ab initio calculations. J. Raman Spectrosc. 1992, 23, 157–363. [Google Scholar] [CrossRef]
- Arjunan, V.; Kalaivani, M.; Senthilkumari, S.; Mohan, S. Vibrational, NMR and quantum chemical investigations of acetoacetanilde, 2-chloroacetoacetanilide and 2-methylacetoacetanilide. Spectrochim. Acta A 2013, 115, 154–174. [Google Scholar] [CrossRef]
- Yamaguchi, T.; Kimura, Y.; Hirota, N. Solvent and solvent density effects on the spectral shifts and the bandwidths of the absorption and the resonance Raman spectra of Phenol Blue. J. Phys. Chem. A 1997, 101, 9050–9060. [Google Scholar] [CrossRef]
- Brouwer, A.M.; Wilbrandt, R. Vibrational spectra of N,N-dimethylaniline and its radical cation. An interpretation based on quantum chemical calculations. J. Phys. Chem. 1996, 100, 9678–9688. [Google Scholar] [CrossRef] [Green Version]


| Raman | SERS | Tentative Assignment |
|---|---|---|
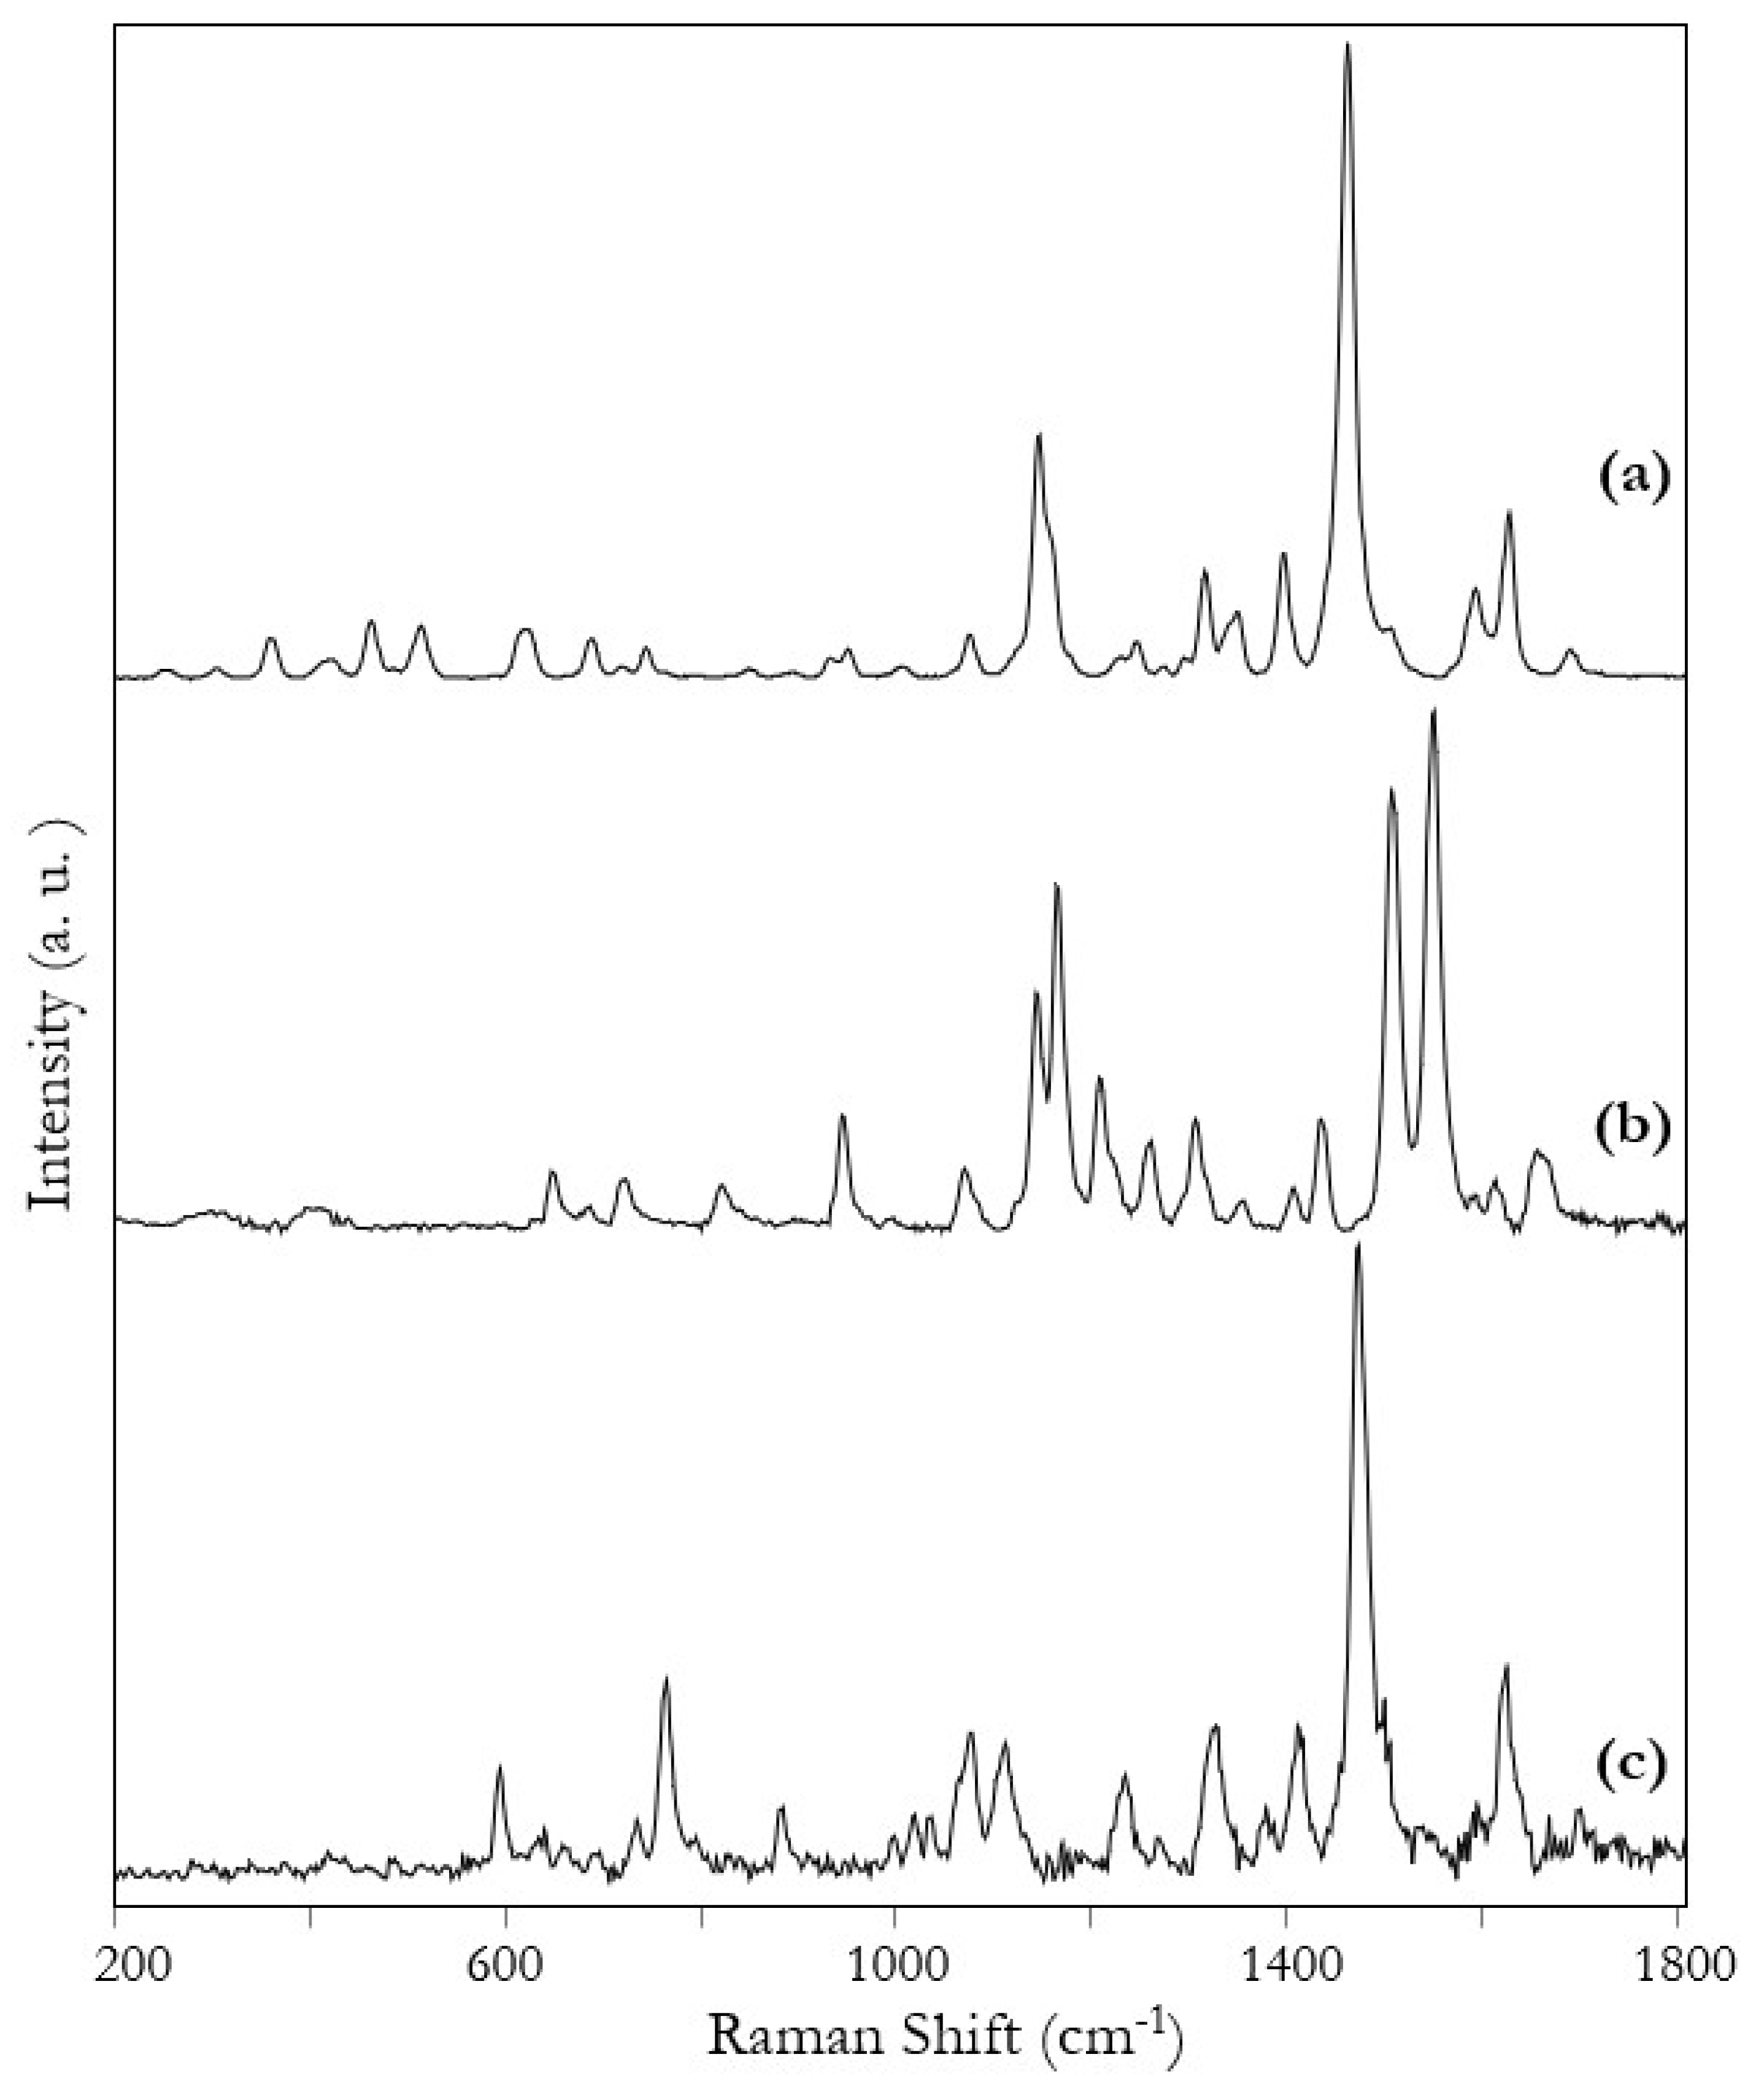
| Magenta [30,31,32,33] | ||
| 1699 w | - | ν (C=O) amide |
| 1667 w | 1667 m | ν(C=O) pyrazolone + ν(C=N) |
| 1624 m | 1624 s | ν (C=C) + ν(C=N) |
| 1473 vs | 1484 mw | ν (C=C) |
| 1411 m | - | β(C-H) |
| 1325 m | 1325 ms | pyrazolone ring stretching + β(C-H) |
| 1230 m | - | β(C-H) |
| - | 1194 mw | β(C-H) ring + ν(C-C) + β(CNN) |
| 1110 m | - | β(C-H) |
| 1076 m | - | β(C-H) |
| 883 mw | - | γ(C-H) |
| - | 840 mw | γ(C-H) |
| 765 m | 765 mw | ring deformation |
| 638 w | 638 mw | aromatic and heterocyclic ring deformation |
| 595 mw | 595 mw | aromatic and heterocyclic ring deformation |
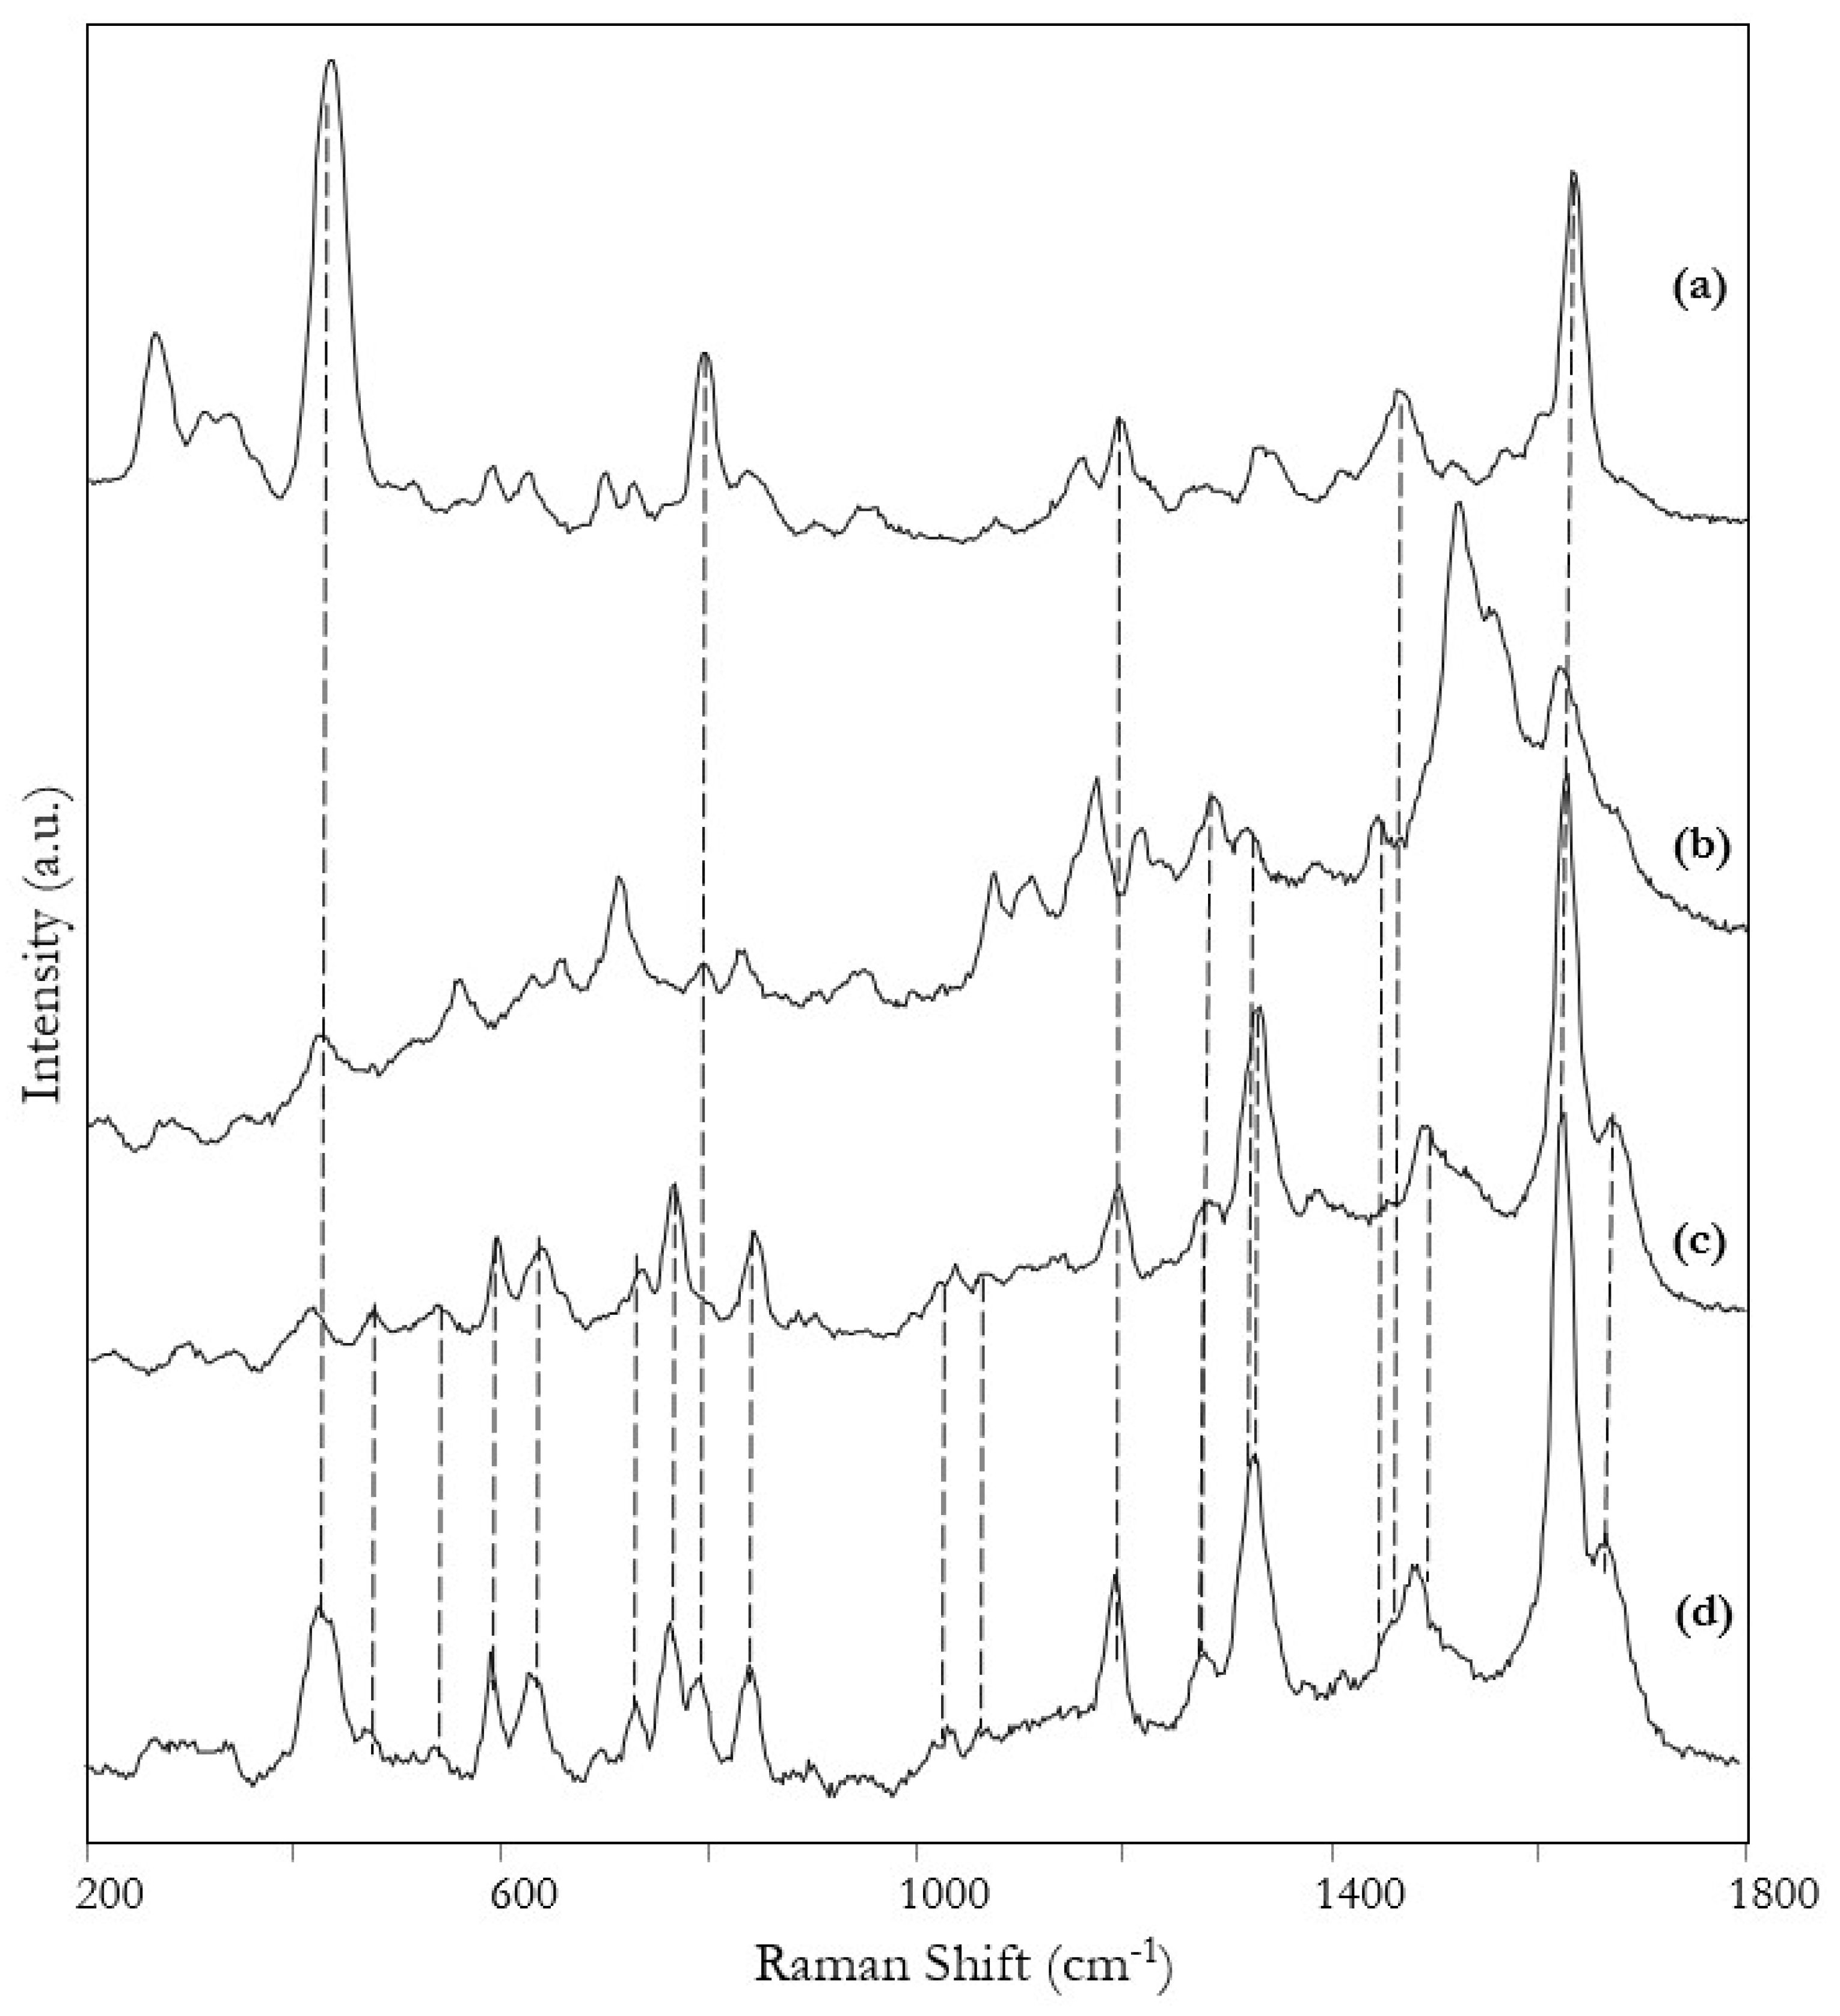
| Yellow [30,34] | ||
| 1670, 1660 mw | 1670, 1660 sh | ν(C=O) amide, ν(C=N) |
| 1619 w | 1620 m | ν(C=C) |
| 1555 vs | 1550 ms, sh | ν(C=C) + β(N-H) |
| 1513 vs | 1515 vs | ν(C=C) |
| 1440 mw | 1440 w | ν(C=C) |
| 1311 mw | 1316 w | ν(C=C) |
| - | 1284 mw | - |
| 1266 mw | 1269 sh | - |
| 1214 m | 1214 mw | - |
| 1170 s | 1172 m | β(C-H) |
| 1150 s | 1151 sh | β(C-H) |
| - | 1110 w | - |
| 1075 w | 1073 w | β(C-H) |
| 950 mw | 950 mw | ν(C=C) |
| 828 w | 828 w | β(C=O) anilide? |
| - | 712 m | γ(N-H)? |
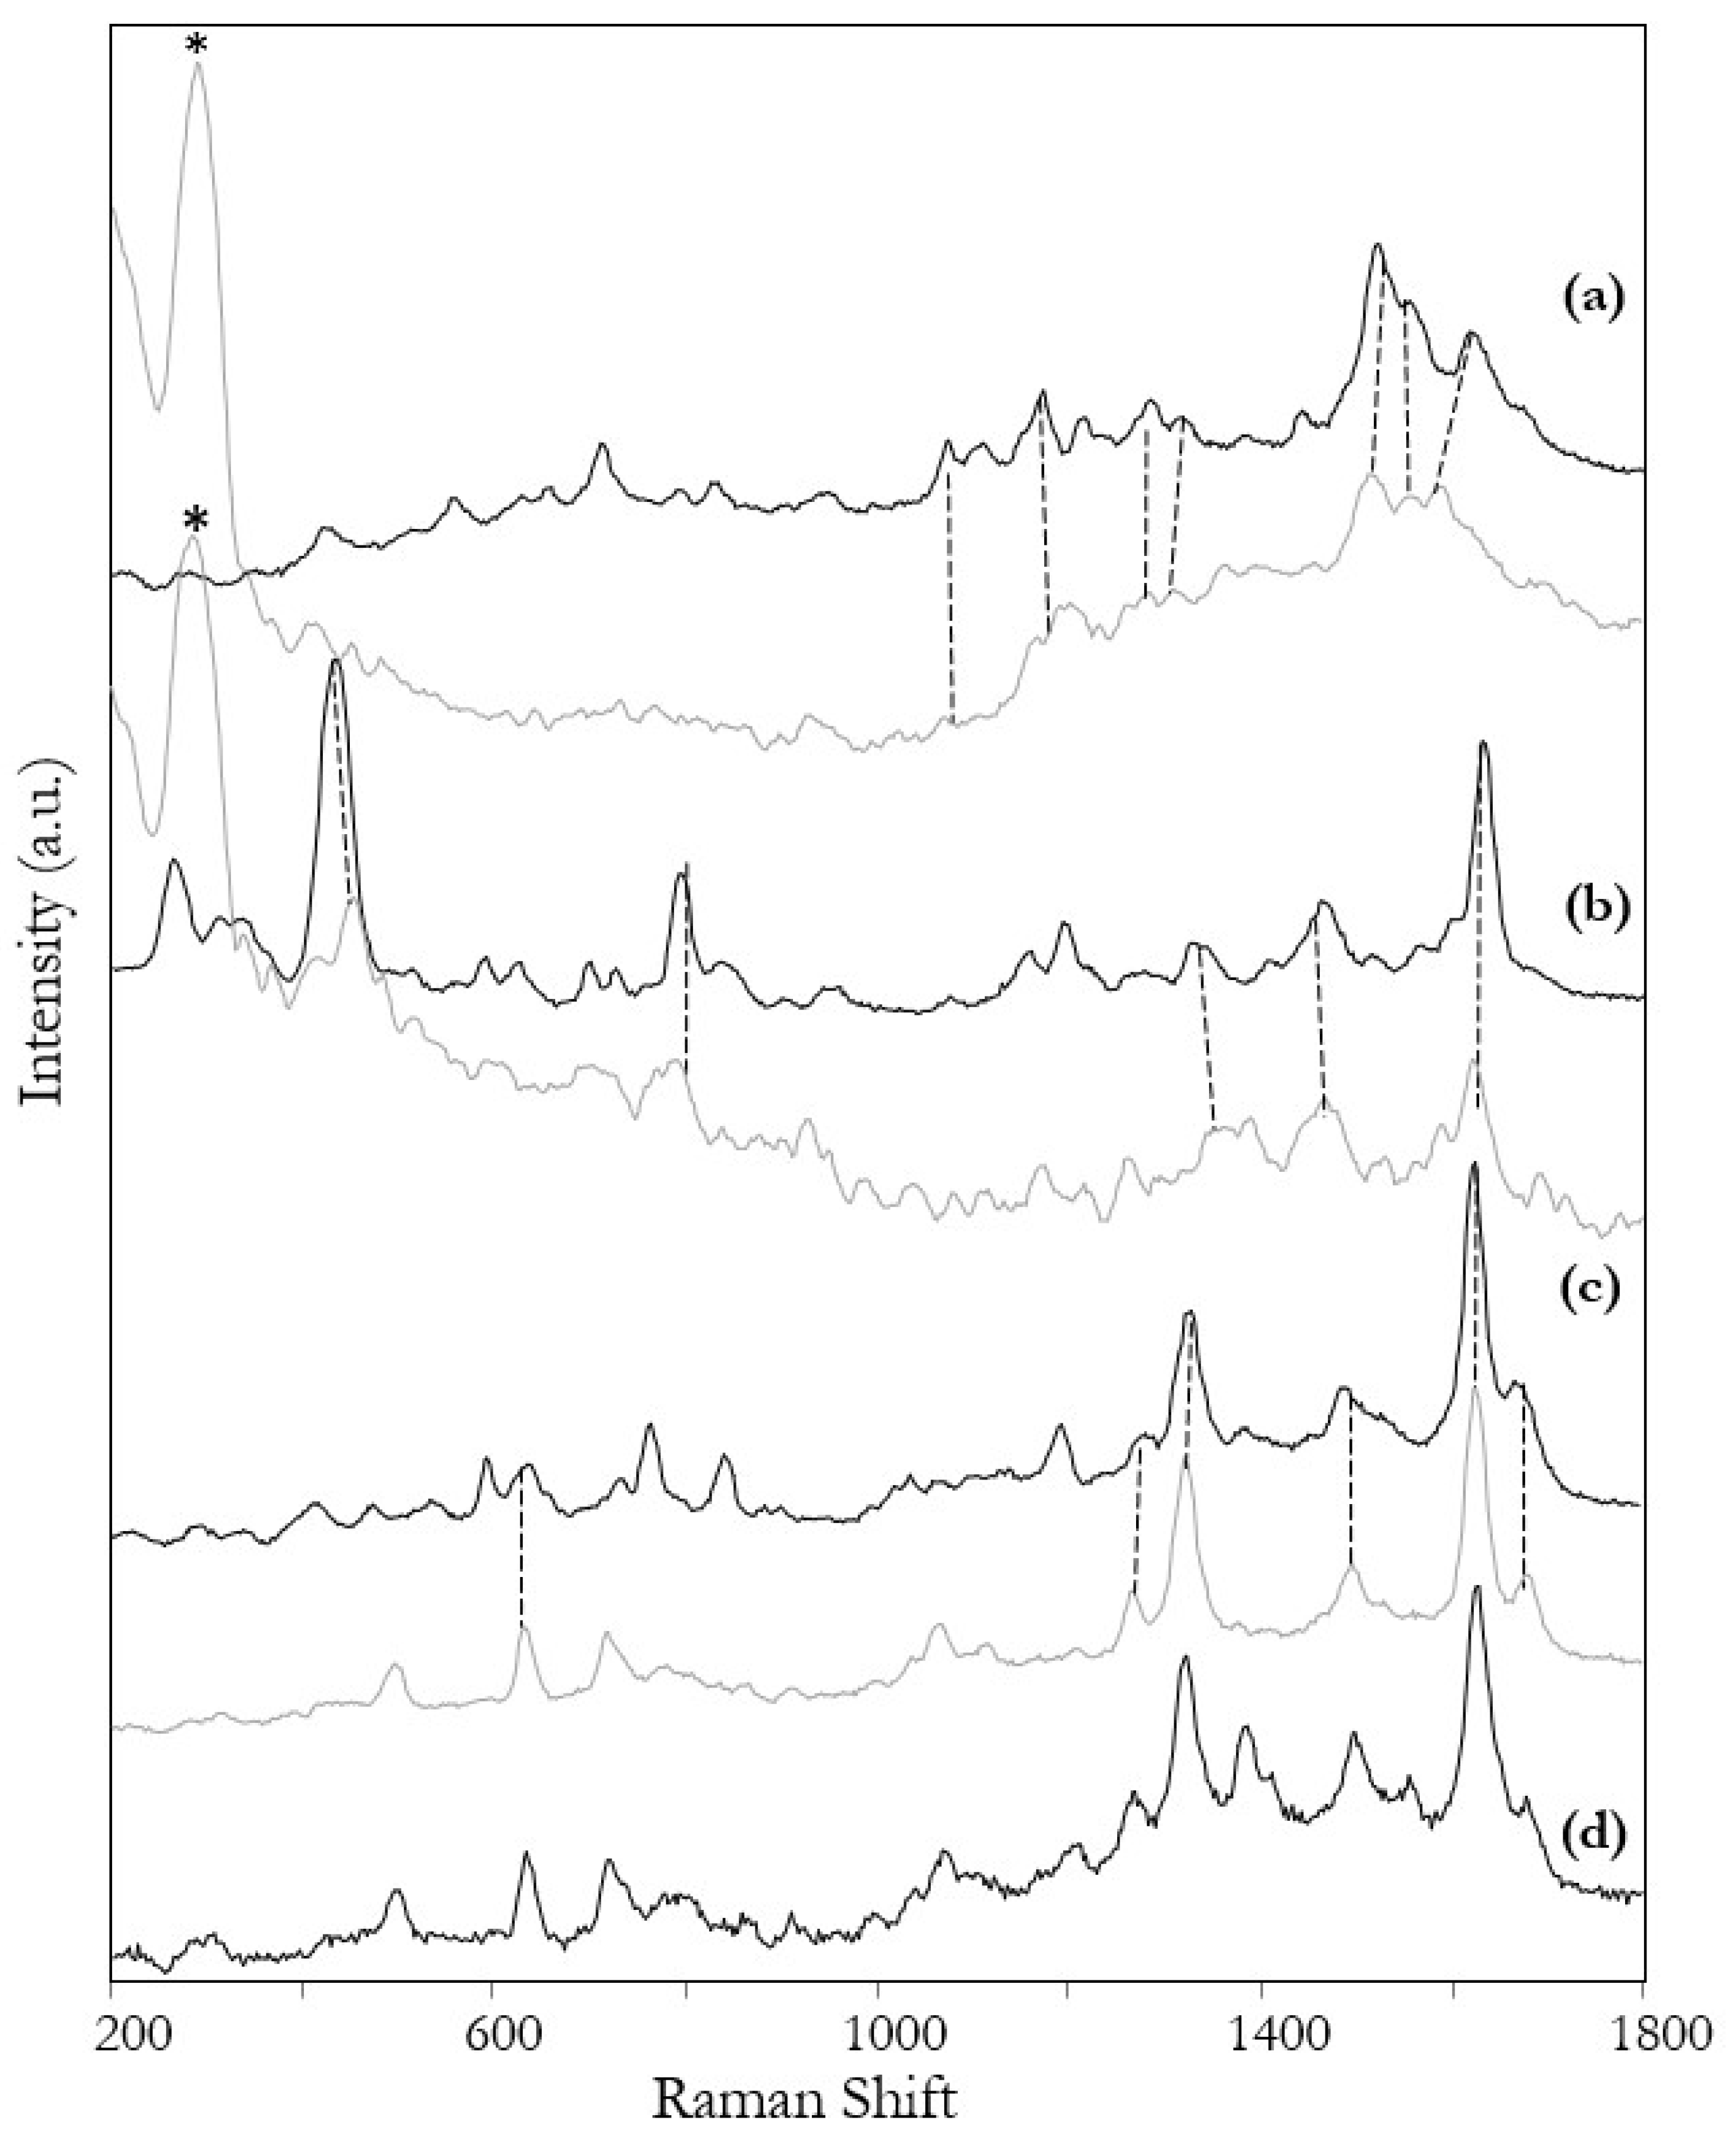
| Cyan [30,35,36] | ||
| 1683 w | - | ν(C=O) amide |
| 1628 m | 1630 s | ν(C=O) indoaniline |
| 1594 mw | 1601 sh | 8a a diethylaniline |
| - | 1567 sh | ν(C=C) |
| 1511 sh | 1514 w | ν(C=N) |
| 1464 vs | 1464 m | ν(C=C)? |
| 1401 m | 1401 vw | δ(C-H) ethyl? |
| 1352 mw | - | δ(C-H) ethyl? |
| - | 1340 mw | ν(C-N) |
| 1321 m | 1327 mw | - |
| - | 1191 m | 9a a diethylaniline? |
| 1150 s | 1153 m | ν(C-N) |
| - | 791 ms | 10 a diethylaniline? |
| 428 w | 433 vs | 16a a diethylaniline? |
Publisher’s Note: MDPI stays neutral with regard to jurisdictional claims in published maps and institutional affiliations. |
© 2022 by the authors. Licensee MDPI, Basel, Switzerland. This article is an open access article distributed under the terms and conditions of the Creative Commons Attribution (CC BY) license (https://creativecommons.org/licenses/by/4.0/).
Share and Cite
Longoni, M.; Ferretti, F.; Zucca, S.; Caielli, L.; Bruni, S. Surface-Enhanced Raman Spectroscopy for the Investigation of Chromogenic Motion Picture Films: A Preliminary Study. Chemosensors 2022, 10, 101. https://0-doi-org.brum.beds.ac.uk/10.3390/chemosensors10030101
Longoni M, Ferretti F, Zucca S, Caielli L, Bruni S. Surface-Enhanced Raman Spectroscopy for the Investigation of Chromogenic Motion Picture Films: A Preliminary Study. Chemosensors. 2022; 10(3):101. https://0-doi-org.brum.beds.ac.uk/10.3390/chemosensors10030101
Chicago/Turabian StyleLongoni, Margherita, Francesco Ferretti, Sofia Zucca, Letizia Caielli, and Silvia Bruni. 2022. "Surface-Enhanced Raman Spectroscopy for the Investigation of Chromogenic Motion Picture Films: A Preliminary Study" Chemosensors 10, no. 3: 101. https://0-doi-org.brum.beds.ac.uk/10.3390/chemosensors10030101