Article

Dynamic Potentiometry with an Ion-Selective Electrode: A Tool for Qualitative and Quantitative Analysis of Inorganic and Organic Cations

by
José Antonio González-Franco
1,
Alberto Ruiz
2 and
Joaquín Ángel Ortuño
3,*
1
Department of Chemical Engineering, University of Murcia, 30100 Murcia, Spain
2
Department of Informatics and Systems, University of Murcia, 30100 Murcia, Spain
3
Department of Analytical Chemistry, University of Murcia, 30100 Murcia, Spain
*
Author to whom correspondence should be addressed.
Submission received: 8 February 2022 / Revised: 3 March 2022 / Accepted: 16 March 2022 / Published: 18 March 2022
(This article belongs to the Special Issue Modern Directions in Ion Electroanalysis for Real World Applications)

Abstract

:
A study of the transient potential signals obtained with a cation-selective electrode based on an ion-exchanger was carried out for solutions of the following individual cations at different concentrations: H+, Li+, Na+, K+, Rb+, Mg2+, Ca2+, choline (Ch+), acetylcholine (AcCh+), and procaine (Pr+). Three different general types of transient signals were distinguished depending on the value of the selectivity coefficient of the corresponding ion. A principal component analysis (PCA) was performed on the signals, finding that the qualitative identification of the corresponding ion from the scores of two principal components is possible. The study was extended to the transient signals of solutions containing an analyte in the presence of an interfering ion. The PCA of the corresponding signal allows for the detection of the presence of interfering ions, thus avoiding biased results in the determination of the analyte. Moreover, the two principal components of the transient signals obtained for each of the ions at different concentrations allow for the construction of calibration graphs for the quantitative determination of the corresponding ion. All the transient signals obtained experimentally in this work can be reconstructed accurately from principal components and their corresponding scores.

1. Introduction

Most potentiometric analysis methods use the equilibrium potential reached after an ion-selective electrode and a reference electrode are brought into contact with the sample [1]. The equilibrium potential in this context corresponds to the potential once it has reached a stable value. Potentiometers used for analytical measurements usually provide an indication of the attainment of a stable potential value, using a preset stability criterion.
As the available ion-selective electrodes are not specific, the presence in the sample of ions other than the target ion that contribute to the measured potential (interfering ions) will lead to an excess error in the determination of the target ion. From the equilibrium potential, it is not possible to know the nature of the ion or ions behind the measured potential. Therefore, to obtain unbiased results in the determination of the target ion concentration, it is necessary to have prior information about all the ions present in the sample that may contribute to the potential and to introduce suitable chemical conditions (pH, complexing agents, and so on) to avoid their contribution. In some cases, it may even be necessary to separate them beforehand [2].
A route in the research field of ion-selective electrodes followed by our group for a long time lies in the analysis of the transient potential signal from the moment the electrode comes into contact with the sample. It was proven that the corresponding transient signal contains relevant analytical information in some cases. In a seminal paper [3], it was shown how the shape of the signal of a hexachloroantimonate-selective electrode, exposed to nitrate, perchlorate, various anionic metal chlorocomplexes, and tetraphenylborate using a flow-injection (FI) system, was characteristic of the ion measured. Thus, a dynamic parameter was introduced to characterize the signals of each ion, which remained constant over a certain concentration range. This concept was extended by studying the FI transient signals obtained with a membrane-based electrode containing a cation ionophore with a general selectivity pattern toward various cations [4]. The application of the principal component analysis to FI transient signals even allowed for the quantitative determination of two ions of a mixture from the transient signal of a single ion-selective electrode [5]. Calvo et al. [6] developed an electronic tongue using the transient response of an array of non-specific-response potentiometric sensors in a sequential-injection system.
From some time ago, several authors have been engaged in the development of theoretical models to describe the dynamic response of different types of ion selective electrodes in the absence and presence of interfering ions [7,8,9]. These models enable us to obtain insights into their working mechanism.
For the description of the dynamic potential response of ion-selective electrodes based on plasticized polymeric membranes, such as that used in this work, the phase-boundary potential model [10] has proved to be very useful. This model assumes that the membrane potential at the aqueous/organic interface governs the membrane potential response and that the diffusion potential within the membranes is negligible. It is also assumed that local equilibrium holds at the aqueous/membrane interface. The method of finite differences applied by Morf [11,12] and Egorov [13,14] to this model allows for the transient response to be simulated without much computational complication. Hambly et al. have also included in their model the kinetics of the interfacial ion-exchange [15]. The model used by Lewenstam and colleagues [16,17] is the most complete. However, it is limited by the requirement of knowing numerous parameters that may not be easily determined.
This paper shows the transient signals obtained by exposing an electrode based on an ion exchanger to different inorganic and organic cations. The signals are applied to the qualitative and quantitative analysis of the corresponding cations and the signals can be described satisfactorily on the basis of reported models.

2. Materials and Methods

2.1. Reagents and Solutions

Poly(vinyl chloride) (PVC) of high molecular weight, 2-nitrophenyl octyl ether (NPOE), potassium tetrakis [4-chlorophenyl] borate (KTClPB, cation exchanger), and tetrahydrofuran (THF) were Selectophore grade from Sigma. All other reagents used were of analytical reagent grade. Cation standard solutions 1 M of hydrogen, lithium, sodium, potassium, rubidium, magnesium, and calcium, as well as 1 × 10⁻² M of choline, acetylcholine, and procaine, were prepared from their chloride salts by dissolving them in water. Milli-Q water was used throughout. More diluted working solutions were prepared by diluting them with water.

2.2. Apparatus and Electrodes

A Fluka ISE body and Orion Ag/AgCl double-junction reference electrode (Orion 900200) containing 1 M Li2SO4 solution in the outer compartment were used. A homemade high-impedance data acquisition 16-channel box connected to a personal computer by USB and software were used for the potentiometric measurements with constant magnetic stirring, and the potential versus time was recorded.

2.3. Membrane Preparation

The membrane was prepared by dissolving 200 mg (66.3% w/w) plasticizer (NPOE), 100 mg (33.2% (w/w) polymer (PVC), and 1.5 mg (0.5% w/w) ion-exchanger (KTClPB) in 3 mL of THF. The membrane solution was poured into a Fluka glass plate and allowed to settle overnight until total evaporation of THF, thus obtaining a thin plastic membrane. A 6 mm diameter piece was cut out with a punch and incorporated into the ISE body whose inner compartment was refilled with 1 × 10⁻³ M KCl as internal solution. The electrode was conditioned by immersing in 1 × 10⁻⁵ M KCl solution.

2.4. Measurement Procedure

The ISE and the reference electrode were immersed in 50 mL of 1 × 10⁻⁵ M KCl solution with constant stirring (700 rpm) for 50 s. Then, a small volume (10–500 uL) of an appropriate working solution of the corresponding cation solution was added by an automatic micropipette to reach the required concentration. The potential was registered during the entire process. Before measuring a new sample, the electrodes were washed with water and gently dried. Each experiment was carried out in duplicate.

2.5. Selectivity Coefficients

The selectivity coefficients of the ions studied with respect to K+ were obtained using the separate solutions method [18], from the final potential value (at 50 s) of a signal of the corresponding cation and the calibration graph, E versus log C, for potassium, obtained from the final potential values for the different potassium concentrations.

2.6. Data Processing

The processing of the obtained potentiometric transient signals was performed using principal component analysis (PCA) [19]. The aim was to associate the principal component (PC) scores found for each raw signal with the sample composition. Multivariate linear calibrations were obtained by principal component regression (PCR) using standard Python data analysis tools (numpy, scikit-learn, matplotlib, and pandas).

3. Results and Discussion

The exposure of a liquid or plasticized polymeric membrane selective electrode containing an R-I+ ion exchanger, where I+ is an exchangeable ion, to a solution containing a J+ ion, leads to an ion exchange between I + and J+ at the interface and to the corresponding transport processes of these ions in both phases. These processes give rise to a transient membrane potential [10,12,14].

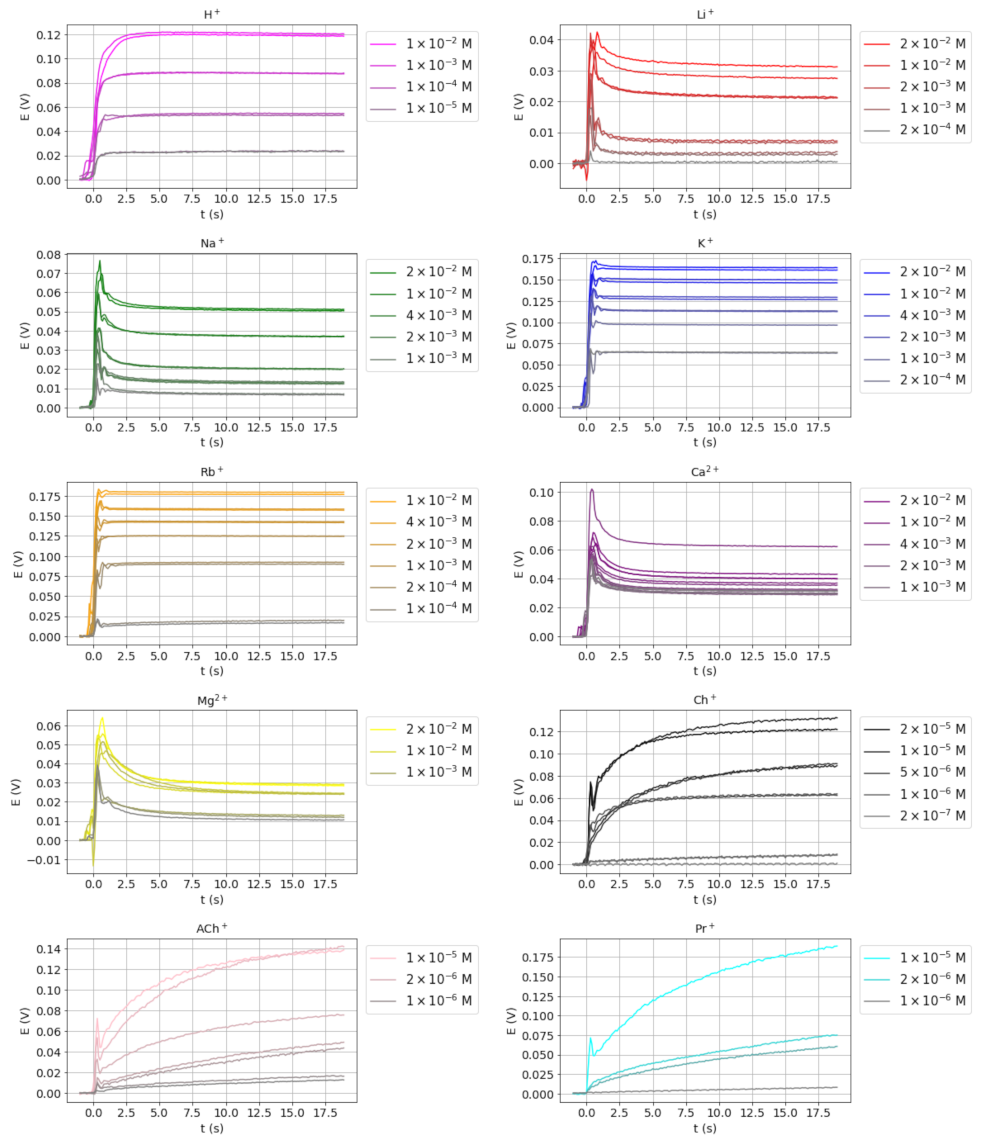
3.1. Transient Potential Signals for Different Ions

Preliminary experiments were carried out in order to determine the experimental conditions under which reproducible transient signals could be achieved. The stirring rate did not significantly affect the transient signals in the range 500–900 rpm. Good results were obtained under the conditions described in Section 2.4.
The transient potential signals for H+, Li+, Na+, K+, Rb+, Mg2+, Ca2+, choline (Ch+), acetylcholine (AcCh+), and procaine (Pr+) at different concentrations, obtained as described in Section 2.4, are shown in Figure 1 (note that different scales are used). Only the signal obtained during the initial part of the recording time was used, as this is where the relevant information of the transient is found. A simple visual inspection reveals different signals shapes that can be roughly classified into three basic types. The first type of signal comprises those corresponding to Li+, Na+, Mg2+, and Ca2+ in which a fast potential overshoot is observed, followed by a slower relaxation towards a stable value. This type of signal has been previously observed by some authors using different types of electrodes [3,5,14] and they are known as nonmonotonic. The second type of transient signal includes those that display a rapid increase in potential and soon reach a stable value. The signals obtained for K+ and Rb+ belong to this type, as well as that for H+, although with a somewhat slower response. In the third type of signal, such as those obtained for Ch+, AcCh+, and Pr+, a very slow potential increase is observed, so the steady-state potential is not fully achieved during the recording period.
From the apparent selectivity coefficient values of the ions studied with respect to K+ obtained as described in Section 2.5 (Table 1), it can be observed that the type of transient signal obtained for each ion depends of the magnitude of the selectivity coefficients. Thus, the first type of transient signal was obtained for ions with log KK,j ≤ −2.2 (low values), the second type for log KK,j values between −0.7 and 0.6 (medium), and the third type for log KK,j ≥ 1.6 (high).
It has been reported that the exposure of ion-selective electrodes to a step change of the interfering ion concentration at a low concentration of the primary ion results in a potential overshoot followed by a slow potential relaxation (non-monotonic potential transient signals). This has been observed with glass electrodes [20], precipitate-based electrodes [21], and electrodes based on a plasticized polymeric membrane [4,14]. This peculiar type of transient potential signal (so-called type 1 signals in the present paper) has been qualitatively rationalized and quantitatively simulated in the case of plasticized polymeric membranes by the following processes towards the local equilibrium: rapid diffusion of interfering ions to the membrane-solution interface and rapid ion-exchange reaction between the interfering ions and the primary ions present in the membrane. As a result, a local excess of primary ions arises at the interface, giving rise to a phase-boundary potential overshoot. Finally, the diffusion of the generated primary ions from the interface towards the bulk of the sample solution and of the interfering ions entering the membrane to the membrane bulk gives rise to the potential relaxation [11,14,15]. In these references, the different authors succeeded in simulating nonmonotonic signals and Morf et al. also succeeded in simulating the slow monotonic potential responses obtained upon the exposure of the electrode to very low concentrations of highly interfering ions (Kij greater than 1). These are the type 3 signals obtained in the present work.

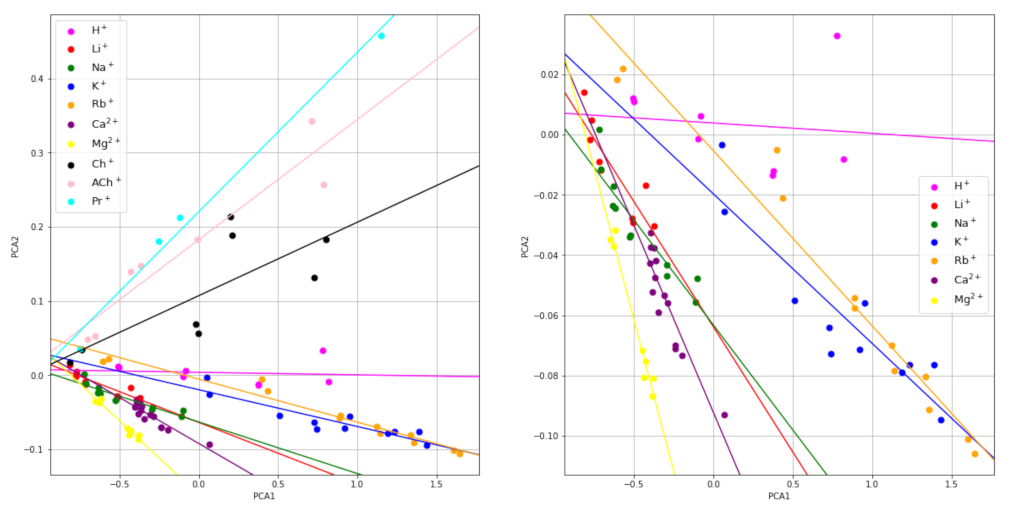
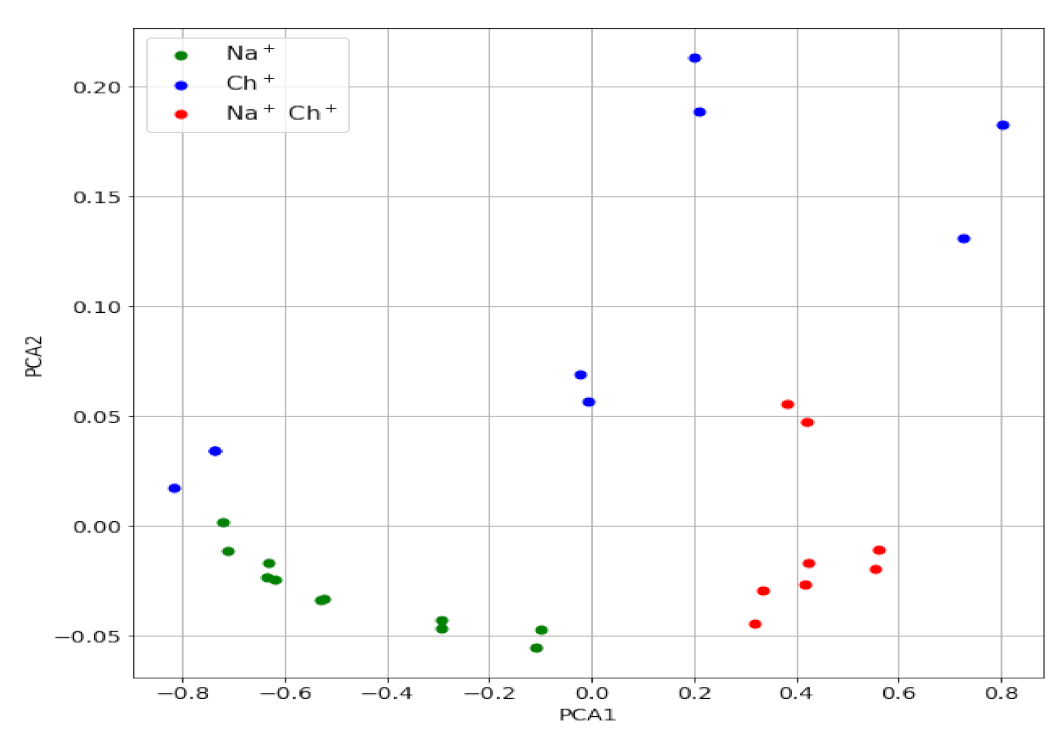
3.2. Principal Components Analysis of the Transient Signals

PCA is a technique commonly used for dimensionality reduction, based on projecting the original signals onto a new basis (the principal components of the data set) in such a way that a small number of the new coordinates of the signals (the PC scores) preserve as much of the data’s variation as possible. Mathematically, the principal components are the eigenvectors of the covariance matrix of the data set, with the corresponding eigenvalues being the variances in those directions. The usual data reduction method consists of taking the first few principal components that account for most of the signal variation.
Principal component analysis has proven to be a powerful tool in sample classification from potentiometric measurements obtained from an array of electrodes [22,23] and from transient potential signals. For this reason, a principal component analysis of the whole pool of transient signals shown in Figure 1 was performed. The first principal component was found to preserve 97.75% of the total variance and the first two components were found to preserve 99.75%.
The scores of the first two principal components can also be displayed on a 2D map, which may visually reveal some similarity relations among the raw signals that are not apparent in the original measurement domain. The map of the PC1 versus PC2 principal component scores is shown in Figure 2. The different colors represent the different ions tested. Interestingly, the points corresponding to the signals obtained for different concentrations of the same ion are somewhat aligned. The corresponding least squares regression lines were obtained and they are shown in the figure. As can be seen, the slopes obtained are different for each ion studied, except those for Li+ and Na+, which are similar to each other, which may enable for the ion identification. Thus, from the experimental signals of an unknown ion sample obtained at two different dilutions, the corresponding slope of the plot PC2 versus PC1 can be calculated and, from the value obtained, the ion can be identified.

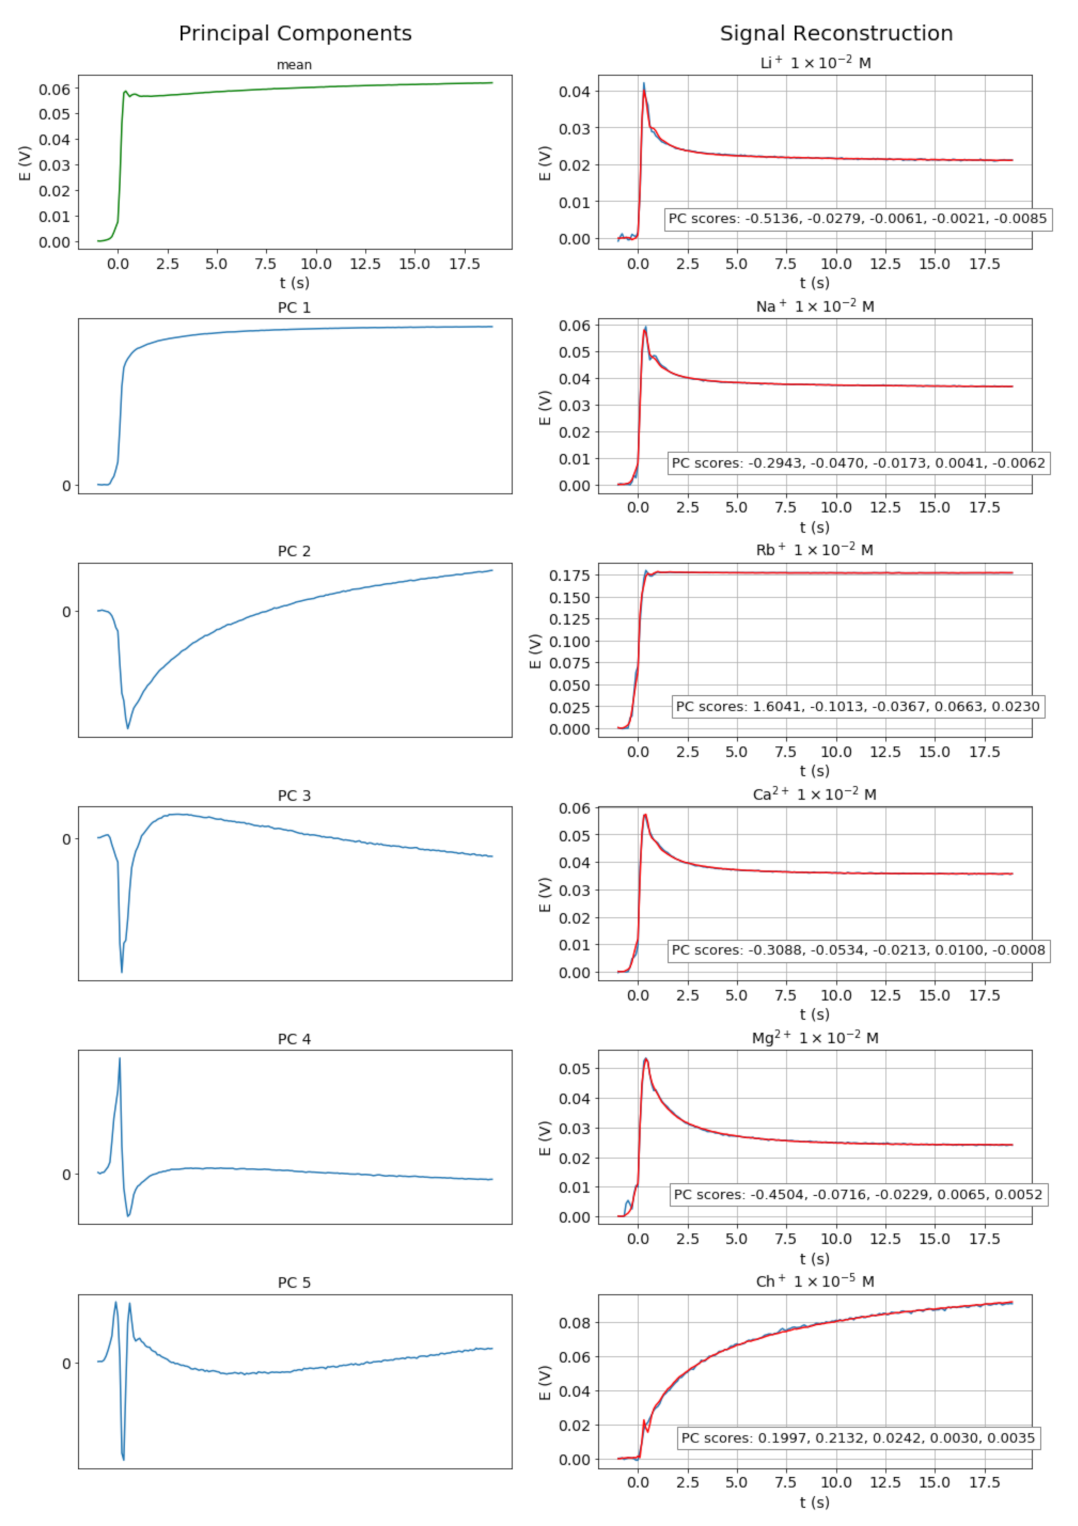
3.3. Reconstruction of the Signals from PCAs

In our case, the first five components preserve 99.96% of the total dataset variance. Thus, the original dynamic signals, normalized to 200 samples following the sample insertion, are reduced to five-dimensional vectors with minimal loss of information, as shown in Figure 3. Each sample of the reconstructed signal is a linear combination of the corresponding samples of the principal components, with weights given by the five-dimensional score vectors.
The signal reconstruction can serve several purposes. Thus, the comparison of the reconstructed signals with the experimental transient signals provides information on the goodness of the chemometric model. Moreover, the reconstruction enables us to eliminate or reduce the noise present in the experimental signals.
All reconstructed signals from the five principal components, together with the corresponding experimental signals, are shown in Figure S1. A representative selection is shown in Figure 3, illustrating the high degree of agreement obtained between the reconstructed and experimental signals.

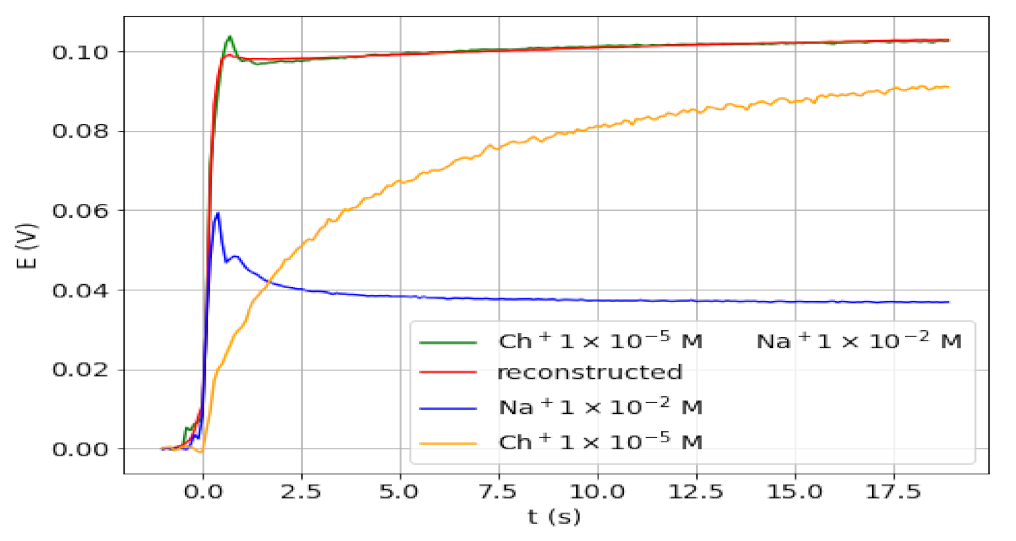
3.4. Transient Signals for Mixture of Ions: Detection of Interference

The value of the analysis of the transient signals for detecting the presence of an interfering ion along with the analyte ion was assessed in a further study. Note that the use of the equilibrium potential for the determination of the analyte would lead to an excess error. As a proof of concept, the transient signals were obtained for different solutions containing Ch+ as analyte in the presence of much higher Na+ concentration. These ions were chosen because the corresponding signals are very different (types 3 and 1, respectively) and because of being close to real samples. In the cases studied, molar ratios Na+/Ch+ of 200, 1000, 2000, and 5000 were employed. Figure 4 shows the transient signal obtained for a sample with a molar ratio of 1000, together with the signals corresponding to solutions of one of the two ions. The signals for other Na+/Ch+ ratios are shown in Figure S1. As anticipated, from the comparison in Figure 4 between the final potential values obtained for Ch+ in the presence and absence of Na+, it can be concluded that an excess error in the determination of Ch+ would be obtained from the final potential value of the mixture. However, the transient signal clearly differs from that of the third type and, therefore, from that expected for a procaine-only solution. In fact, the signal shape is a combination of the signals obtained for both ions separately. In addition, the reconstructed and experimental signals for the ion mixture, also shown in Figure 4, are in very good agreement (overlapped).
For a more rigorous study, the PC scores of the mixture signals were obtained, using the same principal components shown above for the individual ions. The values are plotted in Figure 5 (PC2 vs. PC1 map) together with those for the individual ions. As can be seen, the points corresponding to all mixtures of Ch+ and Na+ lie far enough from those corresponding to Ch+ alone, which alerts about the presence of an interfering ion in the sample that contributes to the potential measured.

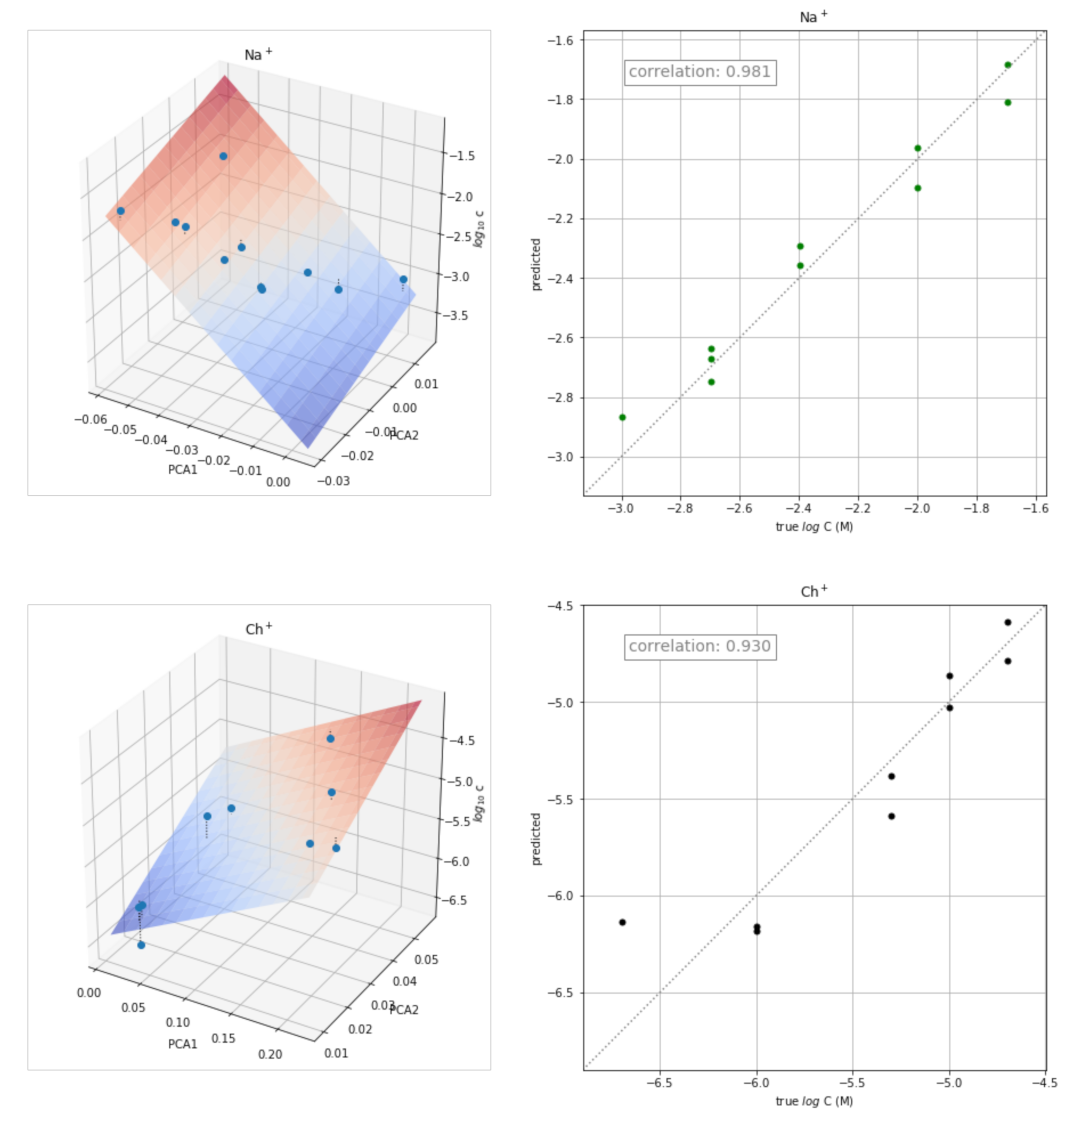
3.5. Application of the Transient Signals to Quantitative Analysis

The transient signals obtained at different concentrations of each of the ion ions were also used for the quantitative determination of the corresponding ion. The approach used consisted of determining the calibration plot for each ion from the corresponding scores of the two principal components obtained in the previous PCA study. The three-dimensional plot obtained by plotting PC1 and PC2 scores versus log C is shown in Figure 6 (left) for some ions. The corresponding plots for the remaining ions are shown in Figure S2. The points were fitted to the following equation:
log C = a PC1 + b PC2 + c
The values of a, b, and c obtained for each ion are shown in Table 2, as well as the values of the corresponding correlation coefficients (r) and coefficients of determination (R2 score).
The corresponding plots of the concentration values predicted by the equation versus the actual values are shown in Figure 6 (right). Reasonably good results were obtained for all the ions tested.

3.6. Comparison with Other Quantitative Analytical Methods Based on Potential Transient Signals

There are very few works reported where the transient signal of ion-selective electrodes is employed for quantitative analysis of the corresponding ions [5,6]. Such previous works considered flow systems, while batch conditions are used in the method described here, which is easier to implement. With respect to the cations studied, the present work extends the study to organic cations. However, the analysis of the transient signal of a binary mixture of ions at a single electrode is employed here to alert about errors in the determination of the analyte, rather than for multi-ion quantitative determinations at individual electrodes [5] or at electrode arrays (electronic tongue) [6].

4. Conclusions

The transient potential signals obtained for the various cations tested and their treatment by principal component analysis allow for the qualitative identification and quantitative determination of each ion. In addition, the detection of an interfering cation in the sample is possible, thereby avoiding excess errors. Transient signals have been classified into three different types depending on the selectivity coefficient of the corresponding ion; that is, nonmonotonic signals for low interfering ions, slow monotonic signals for high interfering ions, and fast monotonic signals for intermediate interfering ions in between. The theoretical models reported allow us to account for the nonmonotonic and slow signals obtained.

Supplementary Materials

The following are available online at https://0-www-mdpi-com.brum.beds.ac.uk/article/10.3390/chemosensors10030116/s1, Figure S1: Transient potential signals obtained for individual cations and mixtures (blue) and their corresponding reconstructed signals superimposed (red). Figure S2: Three-dimensional plots PC1 and PC2 scores versus log C (left) and plots of the concentration values predicted versus the actual values (right) for H+, Li+, Ca2+, Mg2+, AcCh+, and Pr+.

Author Contributions

Conceptualization, J.Á.O.; methodology, J.Á.O. and J.A.G.-F.; software, A.R.; validation, J.A.G.-F.; formal analysis, A.R.; investigation, J.A.G.-F.; writing, J.Á.O., J.A.G.-F. and A.R. All authors have read and agreed to the published version of the manuscript.

Funding

This research was funded by Ministerio de Ciencia e Innovación, Spain, grant number PID2019-106097GB-I00/AEI/10.13039/501100011033 and by the Spanish Ministry of Science, Innovation and Universities, State Research Agency, FEDER funds, under Grant RTI2018-095855-B-I00.

Institutional Review Board Statement

Not applicable.

Informed Consent Statement

Not applicable.

Data Availability Statement

Not applicable.

Conflicts of Interest

The authors declare no conflict of interest.

References

  1. Serjeant, E.P. Potentiometry and Potentiometric Titrations; Chemical Analysis; Wiley: New York, NY, USA, 1984; ISBN 978-0-471-07745-9. [Google Scholar]
  2. Cuartero, M.; Crespo, G.; Cherubini, T.; Pankratova, N.; Confalonieri, F.; Massa, F.; Tercier-Waeber, M.-L.; Abdou, M.; Schäfer, J.; Bakker, E. In Situ Detection of Macronutrients and Chloride in Seawater by Submersible Electrochemical Sensors. Anal. Chem. 2018, 90, 4702–4710. [Google Scholar] [CrossRef] [PubMed] [Green Version]
  3. Ortuño, J.; Sánchez-Pedreño, C.; Fernández De Bobadilla, R. Transient Signals with an Antimony(V) Ion-Selective Electrode: The Relative Signal Return Rate as a Selectivity Parameter. Talanta 1994, 41, 627–630. [Google Scholar] [CrossRef]
  4. Ortuño, J.A.; Sánchez-Pedreño, C.; Martinez, D. Nonmonotonic Transient Potential Signals with an 18-Crown-6 Based Ion-Selective Electrode in a Flow-Injection System. Electroanalysis 2003, 15, 1536–1540. [Google Scholar] [CrossRef]
  5. Cuartero, M.; Ruiz, A.; Oliva, D.J.; Ortuño, J.A. Multianalyte Detection Using Potentiometric Ionophore-Based Ion-Selective Electrodes. Sens. Actuators B Chem. 2017, 243, 144–151. [Google Scholar] [CrossRef]
  6. Calvo, D.; Durán, A.; del Valle, M. Use of Pulse Transient Response as Input Information for an Automated SIA Electronic Tongue. Sens. Actuators B Chem. 2008, 131, 77–84. [Google Scholar] [CrossRef]
  7. Lindner, E.; Tóth, K.; Pungor, E. Dynamic Characteristics of Ion-Selective Electrodes; CRC Press: Boca Ratón, FL, USA, 2018; p. 136. ISBN 978-1-351-07153-6. [Google Scholar]
  8. Morf, W.E. The Principles of Ion-Selective Electrodes and of Membrane Transport; Studies in Analytical, Chemistry; Akadémiai Kiadó: Budapest, Hungary; Elsevier Scientific Pub. Co.: Amsterdam, The Netherlands, 1981; ISBN 978-963-05-2511-4. [Google Scholar]
  9. Mikhelson, K.N. Ion-Selective Electrodes; Lecture Notes in Chemistry; Springer: Berlin/Heidelberg, Germany, 2013; Volume 81, ISBN 978-3-642-36885-1. [Google Scholar]
  10. Bakker, E. The Phase-Boundary Potential Model. Talanta 2004, 63, 3–20. [Google Scholar] [CrossRef] [PubMed]
  11. Morf, W.E.; Pretsch, E.; de Rooij, N.F. Theory and Computer Simulation of the Time-Dependent Selectivity Behavior of Polymeric Membrane Ion-Selective Electrodes. J. Electroanal. Chem. 2008, 614, 15–23. [Google Scholar] [CrossRef] [PubMed] [Green Version]
  12. Morf, W.E.; Pretsch, E.; de Rooij, N.F. Memory Effects of Ion-Selective Electrodes: Theory and Computer Simulation of the Time-Dependent Potential Response to Multiple Sample Changes. J. Electroanal. Chem. 2009, 633, 137–145. [Google Scholar] [CrossRef] [Green Version]
  13. Egorov, V.V.; Novakovskii, A.D.; Zdrachek, E.A. Modeling of the Effect of Diffusion Processes on the Response of Ion-Selective Electrodes by the Finite Difference Technique: Comparison of Theory with Experiment and Critical Evaluation. J. Anal. Chem. 2017, 72, 793–802. [Google Scholar] [CrossRef]
  14. Egorov, V.V.; Novakovskii, A.D.; Zdrachek, E.A. An Interface Equilibria-Triggered Time-Dependent Diffusion Model of the Boundary Potential and Its Application for the Numerical Simulation of the Ion-Selective Electrode Response in Real Systems. Anal. Chem. 2018, 90, 1309–1316. [Google Scholar] [CrossRef] [PubMed]
  15. Hambly, B.; Guzinski, M.; Pendley, B.; Lindner, E. Kinetic Description of the Membrane–Solution Interface for Ion-Selective Electrodes. ACS Sens. 2020, 5, 2146–2154. [Google Scholar] [CrossRef]
  16. Sokalski, T.; Lingenfelter, P.; Lewenstam, A. Numerical Solution of the Coupled Nernst−Planck and Poisson Equations for Liquid Junction and Ion Selective Membrane Potentials. J. Phys. Chem. B 2003, 107, 2443–2452. [Google Scholar] [CrossRef]
  17. Sokalski, T.; Lewenstam, A. Application of Nernst–Planck and Poisson Equations for Interpretation of Liquid-Junction and Membrane Potentials in Real-Time and Space Domains. Electrochem. Commun. 2001, 3, 107–112. [Google Scholar] [CrossRef]
  18. Umezawa, Y.; Bühlmann, P.; Umezawa, K.; Tohda, K.; Amemiya, S. Potentiometric Selectivity Coefficients of Ion-Selective Electrodes. Part I. Inorganic cations (technical report). IUPAC Pure Appl. Chem. 2000, 72, 1851–2082. [Google Scholar] [CrossRef]
  19. Bishop, C.M. Pattern Recognition and Machine Learning; Information Science and Statistics; Springer: New York, NY, USA, 2006; ISBN 978-0-387-31073-2. [Google Scholar]
  20. Karlberg, B. The Transient Characteristics of the Two-Ion Response of Hydrogen Selective Glass Electrodes. J. Electroanal. Chem. Interfacial Electrochem. 1973, 42, 115–126. [Google Scholar] [CrossRef]
  21. Gratzl, M.; Lindner, E.; Pungor, E. Theoretical Interpretation of Transient Signals Obtained with Precipitate-Based Ion-Selective Electrodes in the Presence of Interfering Ions. Anal. Chem. 1985, 57, 1506–1511. [Google Scholar] [CrossRef]
  22. Cuartero, M.; Carretero, A.; García, M.S.; Ortuño, J.A. New Potentiometric Electronic Tongue for Analysing Teas and Infusions. Electroanalysis 2015, 27, 782–788. [Google Scholar] [CrossRef]
  23. Shishkanova, T.V.; Pospíšilová, E.; Prokopec, V. Screening of Synthetic Cathinones by Potentiometric Sensor Array and Chemometrics. Electroanalysis 2022, 34, 1–9. [Google Scholar] [CrossRef]
Figure 1. Transient potential signals obtained for the ions studied at different concentrations.
Chemosensors 10 00116 g001
Figure 2. PC2 vs. PC1 maps. Global (left) and extended low zone, only inorganic cations (right).
Chemosensors 10 00116 g002
Figure 3. Principal components of the pool of signals (left) and reconstructed (red) over experimental (blue) signals (right).
Chemosensors 10 00116 g003
Figure 4. Transient signals obtained for 1 × 10⁻⁵ M Ch+ alone (yellow) and in the presence of 1 × 10⁻² M Na+ (green), and for 1 × 10⁻² M Na+ (blue). Reconstructed signal for the mixture from PCs (red).
Chemosensors 10 00116 g004
Figure 5. PC2 vs. PC1 map for the Ch+, Na+ mixtures (red) and for Ch+ (blue) and Na+ (green).
Chemosensors 10 00116 g005
Figure 6. Three-dimensional plots PC1 and PC2 scores versus log C (left) and plots of the concentration values predicted versus the actual values (right) for K+, Rb+, Na+, and Ch+.
Chemosensors 10 00116 g006aChemosensors 10 00116 g006b
Table 1. Potentiometric selectivity coefficients, log KK,j, of the cation-selective electrode.
H+Li+Na+K+Rb+Mg2+Ca2+Ch+AcCh+Pr+
−0.65 ± 0.01−2.62 ± 0.01−2.24 ± 0.0100.59 ± 0.01−3.56 ± 0.01−3.35 ± 0.011.62 ± 0.012.14 ± 0.042.63 ± 0.11
Table 2. Values of a, b, c, r, and R2 obtained for each ion (log C = a ∙ PC1 + b ∙ PC2 + c).
CabcrR2
H+−60.21560.939−5.4690.9710.942
Li+−43.49318.149−3.0810.9780.956
Na+−33.19013.167−3.2960.9810.962
K+−33.87717.088−4.7240.9960.992
Rb+−14.998−2.282−3.7540.9850.970
Ca2+−34.58921.681−3.8280.8790.773
Mg2+−24.877−2.469−3.8650.9910.982
Ch+5.66424.544−6.6650.9300.865
AcCh+4.94410.496−6.3010.9820.964
Pr+−0.223−12.133−5.8990.9930.986
Publisher’s Note: MDPI stays neutral with regard to jurisdictional claims in published maps and institutional affiliations.

