
Plasmonic Nanomaterials for Colorimetric Biosensing: A Review
by
 , , , , and
Adriano Acunzo
1 ,
,
Emanuela Scardapane
1,
Maria De Luca
1 ,
,
Daniele Marra
1 ,
,
Raffaele Velotta
1 and
and
Antonio Minopoli
2,* 1
Department of Physics, University of Naples “Federico II”, Via Cintia 26, 80126 Naples, Italy
2
Max Planck Institute of Molecular Cell Biology and Genetics, Pfotenhauerstraße 108, 01307 Dresden, Germany
*
Author to whom correspondence should be addressed.
Chemosensors 2022, 10(4), 136; https://0-doi-org.brum.beds.ac.uk/10.3390/chemosensors10040136
Submission received: 28 February 2022
/
Revised: 22 March 2022
/
Accepted: 1 April 2022
/
Published: 5 April 2022
(This article belongs to the Special Issue Progress of Nanomaterials for Colorimetric Sensing)
Abstract
:In the last few decades, plasmonic colorimetric biosensors raised increasing interest in bioanalytics thanks to their cost-effectiveness, responsiveness, and simplicity as compared to conventional laboratory techniques. Potential high-throughput screening and easy-to-use assay procedures make them also suitable for realizing point of care devices. Nevertheless, several challenges such as fabrication complexity, laborious biofunctionalization, and poor sensitivity compromise their technological transfer from research laboratories to industry and, hence, still hamper their adoption on large-scale. However, newly-developing plasmonic colorimetric biosensors boast impressive sensing performance in terms of sensitivity, dynamic range, limit of detection, reliability, and specificity thereby continuously encouraging further researches. In this review, recently reported plasmonic colorimetric biosensors are discussed with a focus on the following categories: (i) on-platform-based (localized surface plasmon resonance, coupled plasmon resonance and surface lattice resonance); (ii) colloid aggregation-based (label-based and label free); (iii) colloid non-aggregation-based (nanozyme, etching-based and growth-based).
1. Introduction
In the last few decades, outstanding progresses in nanotechnology has allowed nanomaterials to make a breakthrough in several fields of applications (to cite a few, integrated circuitry [1], cancer treatment [2], photovoltaics [3], ultrasensitive molecule detection [4], optoelectronics [5], and quantum optics [6]). In particular, plasmonic nanomaterials are of great interest in applications that would benefit from a strong enhancement and confinement of the electromagnetic fields at subwavelength scale [7]. For instance, plasmonic nanomaterials are already conveniently adopted in Raman and fluorescence spectroscopy to achieve signal amplifications up to several orders of magnitude [8,9,10,11,12,13,14].
Recently, plasmonic nanomaterials are also overwhelmingly established in diagnostics for the realization of colorimetric biosensors [15,16,17,18,19]. Indeed, the uncontrolled spreading of the current SARS-CoV-2 pandemics definitely persuaded researchers to conceive alternative diagnostic tools to flank the conventional laboratory techniques [20,21]. Although enzyme-linked immunosorbent assay (ELISA) and reverse transcriptase-polymerase chain reaction (RT-PCR) still remain the gold standards in diagnostics due to their high sensitivity and accuracy, their ineffective capability in providing an easy-to-use and fast assessment of the health status reveals the urgent need for rapid, reliable, and point of care (POC) tests [22,23,24,25]. In this regards, colorimetric biosensors offer a smart and affordable approach for realizing simple and user friendly POC tests.
Generally, when designing a biosensor, sensing parameters such as linear range (LR), resolution, limit of detection (LOD), and recovery are crucial since they characterize the sensing performance. Briefly, LR is defined as the range in which the sensor response changes linearly with the variation of the physical quantity of interest (e.g., analyte concentration/mass, pH, medium refractive index). Resolution represents the minimum variation of the physical quantity that entails a measurable variation of the device response. According to IUPAC, LOD is the smallest value of the physical quantity that produces a signal statistically larger than the background and it is defined as LOD = , where is the mean background signal and is the associated standard deviation. Recovery is defined as the ratio between the theoretical value of the physical quantity provided by the calibration curve and the corresponding nominal value. Conventionally, a biosensor is considered reliable if it owns a recovery of 95–105%.
A multitude of colorimetric biosensors were developed in the last two years aimed at establishing themselves as valid diagnostic tools [15,16,17,18,19]. Although most of them exhibit remarkable performance in terms of sensitivity, recovery, and rapidity, only a tiny fraction is actually available on the market [26]. Possible reasons are a challenging technology transfer from the academic research to the industry [26], lower sensitivities as compared to ELISA and RT-PCR, and the difficulty involved when being used as tools for assessing quantitatively the target concentration. Thus, constant efforts are required to improve the scalability and feasibility of these devices.
Commonly, biosensors rely upon label-based or label-free detection depending on whether a specific target-directed bioreceptor is adopted or not. Label-based biosensors are the most widely used thanks to their versatile and straightforward approach that virtually allows one to detect any target with high specificity by simply changing the bioreceptor. On the other hand, the use of bioreceptors (e.g., antibodies, enzymes, and aptamers) introduces technical issues related to the transducer biofunctionalization and logistic issues such as the inherent bioreceptor shelf-life and the need for a cold-chain for device transportation and storage. Label-free biosensors usually provide a simpler detection strategy since being not inherently affected by the aforementioned issues for the lack of bioreceptors. Indeed, in this case, the response results from physical, biological, or chemical processes triggered by a direct target-transducer interaction. However, such a detection mechanism requires the design of transducer that specifically and freely interact with targets. Thus, the range of detectable targets is far shorter than that borne by bioreceptor-mediated methods.
In general, plasmonic colorimetric biosensors rely on plasmon-related effects exhibited by subwavelength nanomaterials (e.g., metal nanoparticles (NPs)), which can be studied within the Mie’s theory [27]. Plasmonic nanomaterials exhibit unique optical features when resonantly excited by an external electromagnetic radiation. Indeed, the absorption of the impinging light can lead to a resonant collective oscillation of the conduction electrons—the so-called localized surface plasmon resonance (LSPR)—that entails an electromagnetic enhancement of the near-field surrounding the nanostructure [27]. Shape, size and material of a nanostructure as well as the surrounding environment significantly affect its optical response [28]. In addition, plasmonic coupled modes, such as coupled-LSPR (c-LSPR) and surface lattice resonance (SLR), can be activated in nano-assemblies (e.g., two-dimensional periodic arrays) by properly tailoring the pattern architecture [12,29]. Therefore, nanotechnologists and material scientists are continuously spurred to explore new nanofabrication techniques aimed at widely tuning the nanomaterial response in such a way as to virtually meet any demand in biosensing.
Colorimetric biosensors based on plasmonic nanomaterials take advantage of predictable modifications in their optical properties that generally entail a visual colour change [28,30]. These modifications can arise as a result of either a variation in the refractive index (RI) of the surrounding environment [28] or a plasmon coupling among the nanostructures [12,31]. In the former case, the RI variations lead to a shift of the LSPR wavelength that can be conveniently exploited for both molecular sensing and bulk RI sensing [32,33].
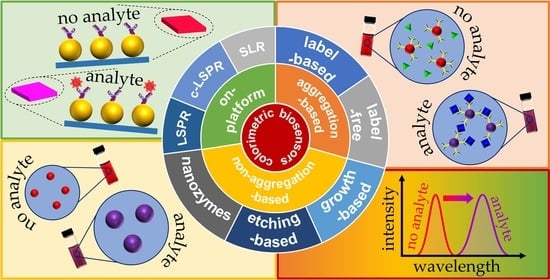
Given the large variety of newly-developing plasmonic colorimetric biosensors, a systematic and clever classification of working principles, sensing performance, pattern designs, and applications is highly desirable. In this work, we reviewed recently reported plasmonic colorimetric biosensors relying on either nanostructured platforms or colloidal solutions. Specifically, three major categories were considered (Scheme 1): (i) on-platform colorimetric biosensors; (ii) aggregation-based colorimetric biosensors; and (iii) non-aggregation-based colorimetric biosensors. In particular, on-platform devices exploit variations in plasmonic modes (LSPR, c-LSPR, and SLR) exhibited by given pattern architectures when interacting with the targets. On the contrary, colloidal colorimetric biosensors (aggregation-, non-aggregation-based) take advantage of the nanomaterial-target interaction that induces variations of the colloid plasmonic response due to changes in the refractive index of the surrounding environment or in nanomaterial conformation and morphology.
2. Platform-Based Colorimetric Biosensors
Nanostructured platforms can be employed for both bulk RI and molecular sensing since variations in the refractive index of the surrounding medium can trigger shifts of the plasmon resonances [28], that can be thus employed as sensing parameters. We classified the platform-based colorimetric biosensors according to the plasmonic phenomena they are based on: (i) LSPR-based, (ii) c-LSPR-based, and (iii) SLR-based. Such a classification has not to be meant as strict since even a slight variation in the nanostructure geometry may lead to different plasmonic effects. However, we believe it can provide a logic and clear picture of such a complex landscape.
2.1. LSPR-Based Biosensing
Electromagnetic waves can interact with sub-wavelength metal nanoparticles to excite standing oscillations of the conduction electrons against the metal ion core. These excited modes are called localized surface plasmons (LSPs) (Figure 1a) and entail a strong field enhancement and confinement all around the metal nanostructure as soon as they oscillate resonantly with the external perturbation [27,36]. Absorption and scattering of the incident radiation by a metal NP increase very much on resonance, too [30]. The quasi-static approximation of Mie theory predicts that the LSPR wavelength () of a spherical NP is approximately linear in the RI () of the surrounding medium over small ranges of optical frequencies [28]
Here, is the plasma wavelength associated to the metal nanoparticle and strongly depends on both its shape and size [37].
As an example, the of a Au nanosphere can be finely tuned over 60 nm as its diameter is modified over the range of 10–100 nm (Figure 1b) [38], with the transition from the absorption-dominated to the scattering-dominated optical response phase occurring at ~50 nm in diameter [39]. It is worth mentioning that higher order plasmon modes generally contribute to broaden the plasmon resonance line width as the nanoparticle size increases [38]. Hence, both the and the plasmon resonance line width strongly depend on the nanoparticle geometry (Figure 1b).
![Chemosensors 10 00136 g001]()
Figure 1.
(a) Schematic illustration of the LSP excitation. (b) Extinction efficiency as a function of NP diameter. (c) Sketch of the visual colour change of a nanostructured substrate as a consequence of the LSPR redshift. Adapted from Refs. [12,40] Copyright (2021) The Authors. Advanced Materials Interfaces published by Wiley-VCH GmbH and (2018) The Authors, published by IOP Publishing Ltd. These articles are distributed under a Creative Commons Attribution (CC-BY) license.

The LSPR peak shift provides a visual measure of the RI variations occurring inside a nanoscale volume around the nanoparticle since the depends on the local RI variations (Figure 1c) [28]. Usually, the RI sensitivity is defined as
that is the nanometers of peak shift per RI unit (RIU).
In the quasi-static approximation, Equation (2) can be rewritten as [41]
here is the permittivity of the vacuum and , with ε′ the real part of the nanoparticle dielectric function ε = ε′ − jε″. In order to better characterize the sensing performance of a given nanostructure, the plasmon resonance line width is taken into account alongside the sensitivity by the figure of merit (FOM) parameter [42]
where is the plasmon resonance full width at half maximum. It follows that larger nanoparticles are unsuitable for high-sensitive LSPR-based biosensors despite the higher sensitivity since their resonance peaks are consistently broadened by higher order plasmon modes as well as radiative damping [28].
The sensitivity strongly depends on the nanoparticle shape and material, too. For example, 50–60 nm diameter gold nanospheres have = 60 nm/RIU at = 530 nm [43], while silver nanospheres of the same size have = 160 nm/RIU at = 435 nm [44]. Gold nanocubes of size 30–50 nm have = 83 nm/RIU at = 538 nm [45], while silver nanocubes of the same size have = 146 nm/RIU at = 510 nm [46].
Thanks to its surface chemistry, high biocompatibility and resistance to oxidation, gold is usually the first choice for the design of biosensors nanostructures. However, silver is sometimes preferred for its higher RI sensitivity as well as its sharper resonances [47]. This is the case of Austin Suthanthiraraj and Sen’s work [48]. They employed electron beam evaporation and a subsequent thermal annealing to realize a random array of spheroidal AgNPs on a silicon substrate. The resulting nanostructure exhibited a at 430 nm and was the transducer element of a membrane-integrated device for the detection of NS1 dengue antigen in human whole blood (Figure 2a). The biosensor showed a spectral sensitivity of 9.2 nm/(μg/mL) and reached a LOD of 0.06 μg/mL (Figure 2a). Some issues have still to be addressed as low reproducibility; narrow LR (0.25–2 μg/mL); and optimization of the fabrication process (the AgNPs diameters lye in a range as wide as 20–80 nm). However, the proposed device made the detection of NS1 dengue antigen very fast, within 30 min, and worked with small volumes of blood (10 μL) which required no pre-treatments thanks to the integrated blood-plasma separation membrane.
An interesting comparison between Au hemispheres and their complementary shapes (i.e., Au nanocups) can be addressed by the works of Park et al. [49] and Focsan et al. [50]. In fact, both the structures proved to be better than spheroidal AuNPs for biosensing applications. Park et al. [49] used block copolymer chemistry and electron beam evaporation to realize a hexagonal array of Au nano-hemispheres integrated into a nano-optoelectronic device (Figure 2b). The nanostructure LSPR peak was at 650 nm and its shift modified the underlying MoS2 channel photoconductivity, whose variations represented the biosensor response (Figure 2b). The device demonstrated a sensitivity of 300 nm/RIU and was used for the label-free detection of citrullinated histone H3 (CitH3) (an early-stage sepsis biomarker) in serum. It displayed a large LR over 5 decades, from 0.1 to 104 pg/mL (Figure 2b) and reached a LOD of 0.87 pg/mL-(56 × 10−15 M), that is a remarkable result since it is 250 times lower than the LOD obtained by ELISA assay.
Instead, Focsan et al. [50] employed colloidal and soft lithography techniques to realize a hexagonal array of Au nanocups onto a polydimethylsiloxane matrix (PDMS), thus obtaining a flexible device (Figure 2c). The authors first simulated the sensing performance of arrays with 527, 600, and 719 nm nanocup diameters, retrieving values of 211, 201, and 195 nm/RIU, respectively; secondly, they selected the latter one for a proof-of-concept experiment as the detection of anti-human immunoglobulin G (IgG) in buffer serum (Figure 2c). Implemented as a surface-enhanced Raman spectroscopy (SERS)-based assay, the biosensor reached a LOD of 1.5 μg/mL.
Nanoparticles with more complex morphologies such as nanorods, nanotriangles, and nanoshells are still challenging for applications but may offer higher RI sensitivities [51]. In the case of elongated nanoparticles, this is a consequence of a high aspect ratio. For instance, the sensitivity of Au bipyramids passes from 150 to 540 nm RIU−1 as the aspect ratio increases from 1.5 to 4.7 [45]. Similarly, if the aspect ratio of 10 nm radius Au nanorods increases from 1.0 to 3.4, then an increase in sensitivity from 157 to 497 nm/RIU takes place [52].
Additionally, thanks to a surface plasmon with a longer oscillation length, Au stripes can provide a higher RI sensitivity than Au nanorods [41,53]. Na et al. [54] took full advantage of this plasmonic property to design a high sensitive and specific micro-RNA biosensor. In fact, they used nanoimprint lithography (NIL) to make a flexible nanograting whose top and side faces were then covered by inverted L-shaped Au strips (Figure 3a). Hairpin probes containing immobilized nucleic acids were placed atop the strips: such probes could detect single base mismatches, so that a high specificity was guaranteed (Figure 3a). Furthermore, binding of target micro-RNAs to the probes triggered the enzymatic conversion of a soluble solute into an insoluble precipitate and this process increased the RI of the Au stripes surrounding medium: as a consequence, the nanostructure LSPR peak red-shifted (Figure 3a). The large LSPR redshift provided by the 3D Au stripe arrays―up to 37 nm―allowed the authors to obtain a LOD of 13 × 10−15 M for micro-RNA let-7a in saline buffer. The sensor demonstrated to detect targets in biological samples such as cancer cell extracts, therefore it is also candidate as a POC device.
The work of Lednický and Bonyár [55] provides a further example of 3D nanostructure. They presented a novel template-assisted technology for the synthesis of Au nanodisks and their transfer on a hexagonal array of epoxy nanopillars (Figure 3b). The proposed method allowed a precise control over both the nanodisks sizes and distances, and thus a fine-tuning of the nanostructure LSPR in the range of 535–625 nm (Figure 3b). Moreover, the nanostructure bulk RI sensitivity was between 83 and 108 nm/RIU. The device was able to label-free detect a 20 bp long DNA specific sequence from the Giardia lamblia (β-giardin gene) in buffer, with a LOD of 5 nM (Figure 3b). It is worth to note that the reported biosensor was one of the first ever AuNP/polymer nanocomposites-based sensor that successfully achieved label-free detection of DNA.
Nanoparticles with sharp tips or cavities show RI sensitivities much higher than those expected from their geometrical aspect ratio since higher-order plasmonic modes occur [41,56]. For instance, Au nanoshells of 50 nm diameter and 4.5 nm thickness have RI sensitivities of 409 nm/RIU while Au nanospheres of 50 nm diameter only 60 nm/RIU [43]; or, Ag nanotriangles of 55–120 nm side show a RI sensitivity of 350 nm/RIU whereas Ag nanospheres of 40–90 nm diameter only 160 nm/RIU [44]. Moreover, pairs of nanotriangles arranged as bowtie-like nanoantennas provide even higher sensitivities thanks to an enhanced field in between the gap. In this regard, Wang et al. [57] numerically designed and investigated an array of Al bowtie nanoantennas with a metal-insulator-metal configuration. By varying the nanostructure geometry as well as the light source features, they found out a LSPR peak broadband tuneable from UV to NIR region (from 200 to 2000 nm), with a maximum field enhancement of 102 at = 1064 nm (Figure 3c). Eventually, for the optimized array with 300 nm long and 60 nm thick antennas, and tip-tip gap of 10 nm, they found out a RI sensitivity of 500 nm/RIU (Figure 3c).
![Chemosensors 10 00136 g003]()
Figure 3.
(a) Working scheme of the 3D Au stripe arrays for the detection of micro-RNA let-7a in saline buffer; typical LSPR shift of device response, dose-response curve, nanostructure’s SEM images (inset scale bar: 500 nm) after enzyme precipitation when target micro-RNAs are absent or present. Reused from Ref. [54] Copyright (2018), Elsevier B.V. This article is distributed under a Creative Commons Attribution (CC-BY-NC-ND) license. (b) 3D model and 45°-tilted SEM image of an array of epoxy nanopillars with Au nanodisks atop; normalized absorbance spectra measured in different environments; calibration curve for the target DNA sequence from Giardia lamblia; control experiments. Adapted from Ref. [55] Copyright (2020), American Chemical Society. This article is distributed under a Creative Commons Attribution (CC-BY) license. (c) Schematic of the bowtie-like nanoantenna array with metal-insulator-metal structure; electric field intensity enhancements at 1064 nm for arrays with different geometries; simulated calibration curve for superstrate RI in the case of an optimized platform. Adapted from Ref. [57] Copyright (2019), with permission from Springer Nature.

Table 1 shows a more comprehensive list of LSPR-based colorimetric biosensors.
2.2. c-LSPR-Based On-Platform Colorimetric Biosensors
Nanoparticles placed close to each other offer novel optical responses when the near-field couplings among their LSPs occur. The new coupled modes are called coupled-LSPs (c-LSPs) and can offer a strong electric field enhancement and confinement at the interparticle gaps whenever they resonate with the external perturbation [60]. Generally, the resonant conditions are associated to c-LSPR wavelengths that are red-shifted or blue-shifted with respect to the corresponding (single-particle) LSPR wavelengths. These novel phenomena have been described applying the so-called plasmon hybridization method to dimers of nanoparticles [61,62]. In fact, ab initio (i.e., fully quantum mechanical) calculations predicted a scenario analogous to molecular hybridization: whenever the interparticle gap is of few nanometres, the single particle LSPs mix and give rise to bonding and antibonding hybrid plasmon modes depending on whether the induced charge distribution corresponds to a low-energy or a high-energy configuration, respectively [63].
When the external radiation is linearly polarized along the dimer axis (longitudinal polarization), a lower energy (or bonding) mode results from the in-phase coupling of the single particle dipoles, whereas a higher energy (or antibonding) mode * results from the out-of-phase dipolar coupling [64]. It is easily understood that the and * modes occur at c-LSPR wavelengths that are, respectively, red-shifted and blue-shifted if compared to the single particle LSPR [64]. Furthermore, the mode exhibits an electric field strongly enhanced and confined (i.e., hot spots) at the dimer gap while the * mode exhibits a field localized at the dimer edges. Conversely, if the polarization is orthogonal to the dimer axis (transverse polarization), a lower energy (or bonding) mode (red-shifted) is associated to the out-of-phase dipolar coupling, whereas a higher energy (or antibonding) mode * (blue-shifted) is associated to the in-phase dipolar coupling [64].
Figure 4a shows a graphical representation of the plasmon hybridization model in the case of a homodimer (i.e., two equivalent nanoparticles) as well as a heterodimer (i.e., two non-equivalent nanoparticles). It is worth noting that a linearly polarized light cannot excite the out-of-phase modes * and in a homodimer (dark modes), but specific illuminations such as a focused cylindrical vector beam can [65]. However, * and modes are allowed by the heterodimer configuration (under linearly polarized light) and, in this case, they are characterized by weaker intensities than and * in-phase modes. These facts can readily be addressed by the dipole-dipole model (in the quasistatic approximation): the oppositely oriented dipole moments neutralize each other (dark modes) in the case of homodimers while an incomplete cancellation takes place for heterodimer (Figure 4a) [63].
When dealing with 2D arrays of nanoparticles (Figure 4b), in a first approximation the plasmonic features depend on the ratio , where is the nanoparticle diameter and is the interparticle distance. If > 2/3, i.e., when nanoparticles are relatively close to their nearest neighbours, their LSPs do couple through near-field interactions and give rise to c-LSP modes [31] (Figure 4c). Instead, if < 2/3 the couplings are negligible and the array acts as a system of decoupled LSPs [31] (Figure 3c). These properties can be recovered from the following semiempirical law for the fractional plasmon shift of a dimer of nanoparticles [66]
where k is the maximum c-LSPR shift for the dimer and is the decay length of the c-LSP. By varying the separation distance between two metal nanoparticles in an extremely fine manner through lithographic techniques, it turned out a c-LSP decay length ~ /5 in all of the cases [67].
Many on-platform colorimetric biosensors can benefit from the fine-tuning of the nanostructure geometry since it leads to a very fine control over the optical response of the device. This is particularly true for c-LSPR-based platforms and makes them very appealing for biosensing purposes. However, the quest for cost-effective and scalable biosensors does not match with the fabrication cost and effort of such high-tech arrays of nanoparticles with arbitrary patterns and shapes. In fact, almost any conceivable nanostructured pattern can be designed by high-precision techniques as, e.g., electron-beam lithography (EBL) or focus ion beam lithography (FIB), but high costs, time consumption, and high complexity limit their actual adoption. On the other hand, these techniques often allow one to make breakthroughs.
For instance, EBL was employed by Sadeghi and Gutha [68] to realize templates (rectangular lattices) of rectangular unit regions holding Au nanoislands. The optical response of such hierarchical lattices was investigated for samples with many nanoisland morphologies. Here, Figure 5a shows two architectures distinct from the others: the former has unit regions containing small and tightly packed nanoislands (left side) while the latter has large and loosely packed nanoislands (right side). The Au nanoislands had diameters in the range of 50–100 nm. When x-polarized light hit such lattices (blue lines of the graphs), resonance peaks were observed at 706 nm (left graph) and 780 nm (right graph), respectively. As suggested by field-enhancement simulations (Figure 5a), those peaks resulted from c-LSP modes (near-field couplings among the nanoislands within a unit region) that further coupled with lattice diffractive modes. It is also worth noting that the architecture with loosely packed but larger Au nanoislands supported stronger c-LSPs modes due to a higher ratio.
Helium FIB milling technique was recommended by Das et al. [69] for the realization of a novel plasmonic nanostructure for both bulk and localized RI ultrasensitive sensing. The proposed platform consists of a periodic array of Au crossed-bowtie nanoantennas interspaced with Au nanocross walls onto a SiO2 substrate (Figure 5b). Its plasmonic features were investigated by finite-difference time-domain (FDTD) simulations: two main plasmonic resonances were found in the near-IR (NIR) region, whose wavelengths could be tuned by simply varying the nanostructure geometry. These resonances are c-LSPRs resulting from the (resonant) coupling between the Au crossed-bowtie nanoantennas LSPs and the interspacing Au walls LSPs [70]. The same can be also said about the higher-order resonances at shorter wavelengths [70]. Although the fabrication of such a plasmonic platform would be laborious and unpractical due to the need for FIB technique, it would offer the highest sensitivities reported so far. In fact, for the optimized platforms, simulations yielded a = 1753 nm/RIU (with a FOM of 3.65 RIU−1) in the case of bulk RI sensing, whereas and 70 nm/RIU (with a FOM of 0.33 nm−1) in the case of localized RI sensing (Figure 5b).
NIL represents a promising alternative for the design of nanometre scale patterns since it is a simple technique with low cost, high throughput, and high resolution. It can create arbitrary patterns through the mechanical deformation of a soft imprint resist by a hard mould [71,72]. However, the fabrication of such moulds may represent a drawback of NIL as well, especially if they are obtained by EBL. Nevertheless, EBL (and nickel electrocasting) was used by Su et al. [73] to fabricate master moulds for Au finger-like hexagonal arrays onto flexible copolymer films. Figure 5c clearly shows the high quality and regularity of the array; furthermore, it is readily understood that the optical response of the array could be finely tuned by simply engineering the master mould geometry. In this specific case, a c-LSPR was observed at ~605 nm when the finger-like protrusions had diameters of 300 nm and were 150 nm far from each other ( = 2). The platform was employed just for a proof-of-concept experiment, i.e., the label-free detection of DNA sequences related to Alzheimer’s disease (Figure 5c). Moreover, the authors did not report the device performance. Nevertheless, their work paves the way to miniaturized and wearable biosensors suitable for diagnostics thanks to the extremely high reliability and reproducibility guaranteed by NIL technique.
![Chemosensors 10 00136 g005]()
Figure 5.
(a) SEM images associated extinction spectra (when the superstrate RI is 1.33) and x-polarized field enhancement profiles (at 797 nm) of two Au nanobar arrays with different morphologies. Adapted from Ref. [68] Copyright (2021), with permission from American Physical Society. (b) Schematic of the array of Au crossed-bowtie nanoantennas and Au nanocross walls; bulk RI calibration curves for arrays with different values W of the Au walls width (the inset shows the bulk RI sensing scheme); typical reflectance spectra before (solid line) and after (dotted line) the addition of a 2 nm thick layer with RI of 1.53 over the nanostructure (the inset shows the localized RI sensing scheme). Adapted from Ref. [69] Copyright (2021), Royal Society of Chemistry. This article is distributed under a Creative Commons Attribution (CC-BY) license. (c) Absorption spectra of the Au finger-like hexagonal array before and after immobilization of different probes and targets; associated c-LSPR peak wavelengths and intensities. Tilted SEM image of the substrate. Adapted from Ref. [73] Copyright (2017), with permission from Elsevier B.V.

In addition to hard moulds, polymer moulds are commercially available. A moth-eye structured cycloolefin polymer film was employed by Kawasaki et al. [33] as mould to make (via NIL technique) hexagonal lattices of dielectric-core/Au-shell structured nanocones (Figure 6a). The optical response of such arrays strongly depended on the gold layer thickness, thus allowing the tuning of the c-LSPR peak over the visible range without any changes in the mould (in fact, without changing the mould). The platform achieved remarkable results in both bulk RI and molecular sensing: the optimized array with 80 nm Au layer thickness exhibited a RI sensitivity S of 417.5 nm/RIU and was used for label-free detection of DNA hybridization in the range of 1 pM–100 nM, reaching a LOD of 161 fM and single-base mismatch detection (Figure 6a).
Polymer-based moulds can have macroscopic surface areas; indeed, in the previous work [33] nanostructured platforms with 5 mm2 areas were obtained by means of such moulds. However, the most widely used technique for patterning large areas (cm2) is colloidal lithography (CL) [74], whose success is due to the high quality and low cost of self-assembly arrays of colloidal nanoparticles. Monolayers of closely packed polystyrene nanospheres onto a substrate are generally employed as template masks, which can then be further transferred by etching or lift-off [75,76].
In this regard, Misbah et al. [77] used a polystyrene beads template to design a hexagonal lattice (460 nm pitch) of optically coupled Au-Ag alloy nanodisks (350 nm diameter, 80 nm thickness). The use of a 30–70% Au-Ag alloy rather than pure gold opened up a higher energy c-LSPR at 540 nm (Figure 6b), otherwise largely suppressed by pure gold interband damping [78]. On the one hand, this additional resonance allowed the colorimetric detection even by low-cost RGB cameras and, on the other hand, it entailed a higher local RI sensitivity thanks to a stronger field coupling all over the array. Furthermore, the platform exhibited a lower energy c-LSPR at 750 nm which could be used for multiplexing measurements. The device offered the highest RI sensitivity so far reported for the green band, being = 344 nm/RIU with a FOM of 3 RIU−1 (Figure 6b). Finally, the well-known biotin-streptavidin complex was employed to study the feasibility of the higher energy mode for RGB colorimetric biosensing: a LOD of 0.1 nM was obtained by using a simple smartphone camera and a white lamp (Figure 6b). Visual colorimetric detection, low-cost and high-yield fabrication process candidate this biosensor as a potential POC diagnostic device under resource-limited conditions.
A similar approach was adopted by Kasani et al. [79] to fabricate a hexagonal array of Au nanorings. The plasmonic features of such array could be tuned over hundreds of nanometres in the NIR region by simply varying the lattice as well as the nanoring geometry [80] (Figure 6c): in particular, a strong field enhancement up to 4.3 × 10⁴ was calculated for a nanoring gap as narrow as 2 nm. It can be also noted in Figure 6c that a lower energy (bonding) mode as well as a higher energy (antibonding) mode became more and more manifest while decreasing the nanoring gap. This feature could make the device appealing for signal redundancy (i.e., the possibility to measure multiple independent observables at the same time for detecting a given target). Thus, redundant biosensors maximize analytical reliability and repeatability.
![Chemosensors 10 00136 g006]()
Figure 6.
(a) Conceptual illustration for the label-free DNA hybridization detection by the hexagonal core–shell-structured Au nanocone array, together with a simulation of the electric field enhancement around a nanocone (once irradiated by white light); calibration curve for target DNA; peak wavelength shifts due to hybridization of noncomplementary DNA (Mis.), 1-base mismatch DNA (1-Mis.), and fully complementary DNA (Comp.). Adapted from Ref. [33] Copyright (2019), with permission from American Chemical Society. (b) Schematic of the hexagonal Au–Ag alloy nanodisk array and its working scheme; LSPR position of the green band peak as a function of the bulk RI; green band peak shifts (black line) and red/green ratio reduction (blue line) induced at different concentrations of streptavidin, with the inset showing smartphone images of bare sample (top), thiol-PEG-biotin modified sample (middle), and 10–6 M streptavidin incubated sample (bottom). Adapted from Ref. [77] Copyright (2018), with permission from American Chemical Society. (c) SEM image of a Au nanoring array; simulated reflectance spectra for a 500 nm periodic nanoring array at reducing nanoring gap distance (the dashed green lines underline the occurrence of bonding and antibonding c-LSPs modes while reducing the gap); experimental reflectance spectra for a 600 nm periodic nanoring array as a function of the nanoring gap distance. Adapted from Ref. [79] Copyright (2017), with permission from American Chemical Society.

Table 2 reports examples of c-LSPR-based on-platform colorimetric biosensors.
2.3. SLR-Based On-Platform Colorimetric Biosensors
Metal nanoparticles arranged in a periodic lattice can diffract light whenever the lattice constant is comparable with the wavelength of the incident radiation (Figure 7a). Such diffractive waves may couple with the single-particle LSPs to give rise to hybrid plasmonic-photonic modes delocalized all over the array, called lattice plasmon modes [29]. According to the coupled dipole model, as soon as the single-particle LSPR wavelength and the lattice constant match (i.e., under resonant condition) a strong and sharp surface lattice resonance (SLR) may occur (Figure 7b). In fact, single-particle LSP modes offer a set of scattered wavelengths out of which the lattice periodicity selects (through the Bragg condition) the one undergoing constructive interference [29]. Generally, the SLR exhibited by a lattice of metal nanoparticles is red-shifted if compared to the LSPR of the nanoparticles forming that same lattice [29].
When dealing with the excitation of lattice plasmon modes, the external illumination geometry and the RI in the nanoparticles surroundings are both crucial. For instance, a radiation normal to the lattice can excite SLRs only if a uniform environment completely surrounds the nanoparticles [83]. Such a set-up has no utility in biosensing field since the RIs of substrate and superstrate are generally quite different. Oblique light incidence could overcome this issue since such illumination geometry can excite lattice plasmons even in asymmetric environments [84,85]. In this case, lattice plasmon modes occur at the Rayleigh cut-off wavelengths for substrate and superstrate and so they split into substrate-related and medium-related modes, respectively. However, the latter as well as the former geometries are not fully suitable for biosensing since they require light to travel through a superstrate whose RI fluctuations certainly affect the SLR-related sensing parameters. An illumination geometry that can address all of the above-mentioned issues is the attenuated total reflection (ATR) geometry. Here, the nanoparticle array is illuminated from the (transparent) substrate side resulting in the excitation of high-quality SLRs [84].
The quality factor of an SLR can be estimated as [29]
where is the SLR wavelength, and FWHM is its full width at half maximum.
The work by Danilov et al. [86] provided examples of the above-mentioned general facts. The authors used EBL to fabricate square lattices of single and double 320 nm diameter Au nanodots on glass substrates and evaluated the RI sensitivities in both direct oblique and ATR illumination geometries (by means of ethanol-water solutions at different concentrations). In the former case, the measurements returned a S value of 310–360 nm/RIU for medium-related modes while 190–200 nm/RIU for substrate-related modes (Figure 8a). Instead, in the latter case, an value as low as 50–55 nm/RIU was recorded for substrate-related modes whereas the medium-related modes exhibited two different values according to the incident light angle. If it was below ~63°, then the value was 300–340 nm RIU−1. Instead, for incident light angles above ~63°, was 400–420 nm RIU−1 (Figure 8a). Recall that ~63° is the total internal reflection angle for a glass/water interface.
In-plane diffraction is commonly matched to single-particle LSPR by choosing specific unit cells and lattice constants. Measurable SLRs occur only if the lattice constants lie within the single-particle LSPR linewidth. Moreover, intensity, linewidth, and spectral position of a SLR can be tuned by varying the nanoparticles sizes and shapes as well as the lattice total length. For instance, Ag spheres smaller than 30 nm produce SLRs that are too weak to be measured in most of the cases [87,88]. Conversely, rectangular lattices (lattice constants of 500 nm and 300 nm) of 120 nm diameter and 50 nm height Au nanodisks provide SLRs with a high-quality factor Q that increases with the array size (saturation reached for array with few hundreds of nanodisks) [89]. In fact, SLRs need multiple scattered waves to be excited, a request satisfied by larger nanoparticles and arrays, which then provide stronger and narrower SLRs.
The quest for proper geometries is thus essential to get narrow SLRs. For instance, Ponomareva et al. [90] demonstrated that even tiny changes of the lattice periodicity can have a big impact on the optical response of the array. They employed a colloidal self-assembly approach to produce hexagonal arrays of core@shell NPs with wavelength-scale lattice constants. In particular, the authors chose Au cores and hydrogel shells to gain full control over the NP size and the lattice constant (Figure 8b). In fact, this was carried out by tuning the gold cores overgrown and the hydrogel shells polymerization, respectively. The high versatility offered by such approach allowed them to finely tune the plasmonic features of the arrays. When dealing with bulk RI sensing, the device was most sensitive when substrate and superstrate had similar RI values (Figure 8b). Although the biosensing potential of such a device was not studied, it exhibited SLRs with high -factors (20) (Figure 8b) that make it suitable for ultra-sensitive molecular detection.
The work by Li et al. [91] further showed the crucial role played by geometrical parameters. Indeed, the nanostructured lattice they proposed exhibited two broad plasmonic resonances instead of sharp SLRs despite the lattice periodicity was apt to support diffractive modes. In particular, they fabricated a hexagonal lattice (500 nm pitch) of Au nanospheres (185 nm size) on quartz substrate with an additional Ag coating all over the structure (i.e., covering both the NPs and the underlying substrate (Figure 8c)). Such a nanostructure was used as an H2S sensor relying on the following mechanism: in a humid atmosphere containing oxygen, H2S reacts with Ag to give out Ag2S. This meant a partial conversion of the original Ag coating to an Ag2S coating and, in turn, an increase of the RIs around both the nanospheres and the substrate (both covered by Ag). A sensible redshift of the SLR peak from 669 to 707 nm was found for H2S concentrations in the range of 0–30 μM (Figure 8c). The device was used for the detection of H2S in 10-fold diluted plasma samples with addition of Na2S donors, obtaining a LOD of 0.79 μM (Figure 8c).
When the external radiation is normal to the nanostructured platform, the single-particle LSPs can oscillate in phase with each other and, in this case, the SLRs—resulting from their further coupling with in-plane diffractive modes—can exhibit as narrow linewidths as 1 nm and even narrower [87,92,93]. Therefore, the -factor of a SLR (usually ~102) is much higher if compared to a LSPR -factor (usually ~10). The extremely narrow linewidths also imply that the effective detection sensitivity associated with SLRs (i.e., their FOM) is increased of a factor of 102 with respect to LSPRs, even though the sensitivity of a SLR is constrained by diffraction phenomena to be not higher than the lattice constants (200–450 nm RIU−1) [86]. Thanks to higher -factors, FOMs, and local electric field enhancements, SLR-based on-platform colorimetric biosensors can thus achieve lower LODs and higher sensitivities with respect to LSPR-based ones.
-factors strongly depend on the specific arrangements of the nanoparticles. In fact, nanoparticles arranged as honeycomb lattices show better performance than rectangular and hexagonal ones [94]. In this regard, Li et al. [95] employed soft lithography to realize honeycomb lattices of Al nanodisks on silica substrate that sustained two high-quality SLRs in the visible and NIR ranges at the same time (Figure 8d). It is worth noting that such a feature lacks, e.g., in similar hexagonal lattices and is ascribable to the non-Bravais nature of the honeycomb lattice. This unique feature was obtained by the following choice of geometrical parameters: 110 nm diameter and 100 nm height nanodisks; 400 nm lattice constant. The NIR SLR (Γ1) appeared at 873 nm and had a FWHM of ~9 nm, while the visible SLR (Γ2) was at 506 nm with a FWHM of ~5 nm (Figure 8d). The former resonance resulted from the coupling of a diffractive mode with a mixture of in-phase dipole and out-of-phase quadrupole LSP modes; instead, the latter resonance corresponded to the coupling between a first-order diffractive mode and an out-of-plane quadrupole LSP mode (Figure 8d). The platform was not employed in a biosensing experiment. However, it paves the way for the use of non-Bravais lattices, especially when multiplexing is needed.
![Chemosensors 10 00136 g008a]()
![Chemosensors 10 00136 g008b]()
Figure 8.
(a) Schematics of SLRs excitation in direct geometry over the Au nanodot lattices, together with their SEM images; single-particle array RI calibration curves for medium-related (red line) and substrate-related (blue line) modes in direct geometry; double-particle array RI calibration curves for medium-related (red lines) and substrate-related (blue lines) modes in ATR geometry (solid lines refers to measurements at the total internal reflection (TIR) angle while dotted lines to measurements before TIR). Adapted from Ref. [86] Copyright (2017), with permission from Elsevier B.V. (b) Schematics of the hexagonal array of hydrogel-coated AuNPs on glass substrate in the case of a (quasi-)symmetric environment; absorbance spectra for arrays with increasing lattice constants in the case of a (quasi-)symmetric environment; experimental peak wavelengths (filled and empty black circles) and Q-factors (filled and empty red circles) as a function of Δλ = λdiffraction − λLSPR in the case of a (quasi-)symmetric environment (grey area corresponds to the region where SLRs do not occur, i.e., there are only LSPRs). Adapted from Ref. [90] Copyright (2020), with permission from American Chemical Society. (c) SEM images of the Ag-coated AuNPs array before (top) and after (bottom) the H2S detection; calibration curve for H2S detection with inset showing the LR; device responses to possible interfering agents. Adapted from Ref. [91] Copyright (2020), with permission from American Chemical Society. (d) SEM image of the Al nanodisk honeycomb array sustaining two high-quality SLRs in the visible and NIR ranges at the same time; associated experimental transmission spectrum; simulated electric field magnitude and phase profile of the Γ2 mode. Adapted from Ref. [95] Copyright (2019), with permission from American Chemical Society.


The SLR-based on-platform colorimetric biosensors discussed so far are resumed in Table 3.
3. Nanoparticle Aggregation-Based Colorimetric Biosensing
Although platform-based colorimetric biosensors usually exhibit high tunability and impressive sensing performance, their implementation as POC tests is often hampered by nanofabrication complexity and poor scalability. On the contrary, colorimetric assays based on colloidal solutions of nanoparticles are generally realized through chemical synthesis and, hence, boast high scalability, fabrication simplicity and cost-effectiveness.
Clearly, colloidal solutions do not offer the same degree of plasmonic tunability as nanostructured platforms since, on the one hand, they cannot support lattice modes at all, and, on the other hand, possible coupled modes arise from nanoparticle aggregation processes (i.e., processes inherently not controllable). Indeed, the optical response of a colloidal solution mainly arise from the LSPR modes of isolated nanoparticles and, hence, strongly depends on their morphology (size and shape), material and medium refractive index. However, when practicality and responsiveness are desirable—as it is the case of POC devices—colloidal solutions of nanoparticles represent a convenient strategy.
Generally, colorimetric biosensor whose optical response arise from nanoparticle aggregation/dispersion—the so-called nanoparticle aggregation-based colorimetric biosensors—rely upon two different detection methods: labelled and label-free. The labelled method directly attaches ligands—usually bioreceptors such as antibodies and aptamers—onto the nanoparticles through chemical bonds. Ligand-modified nanoparticles exhibit higher steric hindrance, stronger interparticle repulsion, and are more stable at high ionic strength conditions than bare nanoparticles [100].
3.1. Label-Based Colorimetric Biosensors
The analyte detection in label-based colorimetric approaches can be achieved by (i) cross-linking, (ii) non-cross-linking, or (iii) destabilization-induced aggregation. In cross-linking method, nanoparticle aggregation is induced by the assembly of ligand-functionalized nanoparticles (f-NPs) through intermolecular bonds between ligands and analytes, which overpower the interparticle electrostatic repulsion (Figure 9a). In such a case, the analytes can act either as linkers among f-NPs inducing their aggregation (Figure 9b) or as anchoring sites for multiple f-NPs (Figure 9c). In both the cases the LSPR shifts arise from the close-packing of f-NPs.
A very simple approach for cross-linking-based colorimetric biosensors was presented by Iarossi et al. [101], who realized an antibody-functionalized AuNPs (f-AuNPs) for the detection of human IgG. Anti-human IgGs were immobilized onto the surface of AuNPs by an innovative UV light-induced functionalization technique known as photochemical immobilization technique (PIT) [102,103]. Such a technique allows the covalent tether of antibodies to the surface of noble metals in an oriented way, thereby significantly improving the robustness and effectiveness as compared to more complex functionalization techniques [104]. Human IgGs acted as linker among nanoparticles, facilitating their aggregation visually detected by a change of colour suspension from red to purple (Figure 10a). The size of aggregates depended on the concentration of human IgG, reaching the maximum for a concentration of 350 ng/mL. To be noted that the increase of the concentration beyond this value (hook point) prevented the nanoparticle aggregation due to the saturation of the binding antibody sites (hook effect). The proposed immunosensor provided a LR of 50–500 ng/mL with a LOD < 100 ng/mL. Although the assay is an “on−off” type, the cost effectiveness, the ease of use and the fast response make it suitable for a wide range of medical diagnostic applications.
Benefiting from the simple approach and robust functionalization technique, PIT-functionalized AuNPs were subsequently employed by Minopoli et al. [105] in an attempt of developing a POC assay for the detection of small molecules (a few hundred of Da). As a case study, 17β-oestradiol (E2) (272.4 Da) was considered since of relevance for environment safety and human health. As an oestrogen, E2 is involved in several hormonal (e.g., menopause, gynecomastia, pregnancy, infertility) [106] and carcinogenesis processes (e.g., ovary and breast cancers) [107]. Its bioaccumulation in the environment and abundance in food caused by its massive use in livestock industry may entail serious risks for aquatic fauna (e.g., fish feminization [108]) and human health. Thus, a rapid and effective strategy to monitor the oestrogen abundance in matrices such as wastewater and river water is highly attractive. The proposed cross-linking-based approach mediated by PIT-functionalized AuNPs and E2 molecules allowed one to achieve a remarkable LOD of 3 pg/mL (11 pM) (Figure 10b). Although the colorimetric response extended over five decades (up to 105 pg/mL), the extremely narrow LR (4–10 pg/mL) is detrimental from practical applications in which a quantitative response is required. However, the measurable signal even at higher oestradiol concentrations (10–105 pg/mL) (Figure 10b) would allow the biosensor to be used as an alert system for routinely oestrogen monitoring in the environment.
![Chemosensors 10 00136 g010a]()
![Chemosensors 10 00136 g010b]()
Figure 10.
(a) Absorption spectra at different human IgG concentrations; dynamic light scattering (DLS) measurements at different human IgG concentrations; visual colour change from pink to purple induced by the aggregation of AuNPs; representative SEM images at different human IgG concentrations; calibration curve for human IgG. Adapted from Ref. [101]. Copyright (2018), American Chemical Society. This article is distributed under a Creative Commons Attribution (CC-BY-NC-ND) license. (b) Absorption spectra at different E2 concentrations; DLS measurements at different E2 concentrations; visual colour change from pink to purple induced by the aggregation of AuNPs; representative TEM images at different E2 concentrations; calibration curve for E2. Adapted from Ref. [105]. Copyright (2020), with permission from Elsevier B.V. (c) Schematic illustration of the rationale behind the SARS-CoV-2-directed colorimetric immunosensor; optical density (OD) of the colloidal suspension at 560 nm as a function of the PCR cycle threshold measured in 50 positive and 50 negative specimens; calibration curve for SARS-CoV-2 viruses. Adapted from Ref. [109]. Copyright (2020), with permission from American Chemical Society. (d) Schematic illustration of the nanoparticle-virus aggregation mechanism as a function of the virus concentrations; simulated extinction spectra as a function of the virus concentration; OD readings at different excitation wavelengths. Adapted from Ref. [110]. Copyright (2021), Author(s). This article is distributed under a Creative Commons Attribution (CC-BY) license.


The challenges raised by the current corona pandemics spurred countless researchers to develop cost-effective, rapid and reliable POC tests directed against SARS-CoV-2 viruses. Although plenty of innovative and outstanding strategies were proposed in the last two years, only few of them managed to be commercialised due to the poor scalability and the lack of complete pilot tests. In this regard, the colorimetric cross-linking strategy proposed by Della Ventura et al. [109] inherently paved the way to mass production and commercialisation thanks to its immediate scalability, simple and effective antibody functionalization technique (PIT), and reliability evaluated with real infected patents. In this approach, the colorimetric response arose from the interparticle plasmonic coupling among f-AuNPs that recognized virus proteins (Figure 10c). Envelope-, membrane-, and spike-directed antibodies were employed to functionalize AuNPs in order to optimise the virus covering and, hence, the plasmonic response. In comparison with PCR cycle threshold (Ct), impressive results were achieved in terms of LOD (Ct = 36.5), LR over seven decades of virus concentrations (Ct = 30–7), specificity (94–100%), and sensitivity (94–96%) (Figure 10c). Numerical simulations confirmed that such remarkable results were achieved thanks to the concurrence of two ingredients [110] (Figure 10d): (i) Adoption of different virus protein-directed antibodies that maximize the plasmonic response, and (ii) PIT-functionalization that allowed antibodies to lie onto nanoparticle surface in oriented configuration in such a way that the average nanoparticle-target distance was approximately 5 nm, the latter being of extremely importance to avoid the undesired hook effect. Indeed, AuNPs experienced the relatively high refractive index of the virus so to bear a strong plasmonic response even at high virus concentrations (i.e., when the number of AuNPs was much lower that the number of viruses and, hence, no interparticle plasmonic coupling occurred) (Figure 10d).
The feasibility and simplicity of such an approach was also demonstrated by Liu et al. [111], who employed an AuNPs-based immunosensor for the colorimetric detection of H3N2 influenza A virus (IAV). In particular, anti-hemagglutinin f-AuNPs were used as virus probes directed against the multiple hemagglutinin (HA) glycoproteins surrounding the IAV surface (Figure 11a). After the virus recognition, a plasmonic mode at 700 nm arose due to the optical coupling among the tightly packed f-AuNPs around the virus surface. As a side effect, the depletion of isolated f-AuNPs led to a decrease of the LSPR peak at 525 nm. As a consequence, the colour of the solution moved from red to purple. The ratiometric response A700/A525 provided a LR of 40–320 hemagglutination units (HAU)/mL with a LOD of 31.2 HAU/mL. A comparison with a clinically available HA inhibition test revealed relative standard deviation (RSD) values within 3.4%, thereby confirming the clinical suitability of the proposed assay.
An alternative cross-linking-based approach for detecting viruses by using aptamers instead of antibodies as bioreceptor was proposed by Bosak et al. [112]. Specifically, they reported a novel colorimetric aptasensor based on CFA0335 aptamer-conjugated AuNPs for detecting salivary proteins of vector mosquitos Aedes aegypti and albopictus and the Zika virus envelope protein (ZIKV-E). All of the experiments were conducted in a diagnostic buffer solution containing sucrose suitable for mosquitoes. Sucrose-capped AuNPs were preferred to citrate capped AuNPs for their lower non-specific aggregation. A solution of aptamers at an optimal concentration of 2 μM was used to functionalise sucrose-capped AuNPs (Figure 11b). The presence of the analyte (salivary mosquito proteins or ZIKV-E) caused the aggregation of f-AuNPs that entailed a visual colour change from red to blue. The measured LR for proteins in Aedes aegypti salivary gland extracts was 10–250 ng while the lowest detectable amount was 10 ng by UV-vis spectroscopy and 50 ng by naked-eye (Figure 11b). As it concerns the ZIKV-E protein, the lowest measurable concentration was 0.4 nM with a visual colour change from 4 nM to 100 nM. A colorimetric detection of the Zika virus (ZIKV) through the recognition of the ZIKV-E proteins was not accomplished. Indeed, despite the presence of 105 plaque-forming units (PFU) of ZIKV (in 10μL of buffer solution) caused the aggregation of f-AuNPs, no visible colour change arose due to the sudden precipitation of ZIKV-f-AuNPs complexes.
A more comprehensive list of cross-linking-based colorimetric biosensors are reported in Table 4.
Although cross-linking aggregation is a convenient colorimetric assay method, its sensitivity is usually limited to the nanomolar levels due to the lack of feasible amplification steps. Moreover, the LR offered by these colorimetric strategy usually spans only few decades over the analyte concentration due to the occurrence of the hook effect (i.e., the saturation of ligand binding sites that prevents the nanoparticle aggregation at higher analyte concentrations) [28,100]. In non-cross-linking (NCL) method, the aggregation of ligand-functionalized nanoparticles is induced by increasing the ionic strength of the aqueous solution. It has been demonstrated that only specific ligands allow nanoparticles to aggregate in a medium of high ionic strength since the interparticle electrostatic and steric repulsion between ligand-modified nanoparticles can hinder their aggregation (Figure 12) [117,118].
This is the case of the NCL-based colorimetric assay proposed by Deng et al. [119] for real-time monitoring of the inorganic pyrophosphatase (PPase) activity (Figure 13a). PPase is an enzyme involved in the hydrolysis of inorganic pyrophosphate ion (PPi) whose transformation into orthophosphate (Pi) plays an essential role in many metabolic events [119]. Thus, the need of real-time monitoring of the PPase activity required to find a better alternative to the current irreversibility of the aggregation/dispersion state of conventional cross-linking methods. Indeed, it was demonstrated that a reversible aggregation/dispersion state could be triggered into a suspension of cysteine-stabilized AuNPs by tuning the concentration of Cu2+ ions and PPi. While Cu2+ entailed the aggregation of AuNPs due to the binding affinity between Cu2+ and cysteine, the addition of PPi counteracted the aggregation due to the higher binding affinity between PPi and Cu2+ (Figure 13a). This simple aggregation/dispersion-triggered method relying on the PPi/Cu2+ balance was adopted for real-time monitoring the PPase activity. The presence of PPase into the nanoparticle suspension catalysed PPi into Pi entailing a Cu2+-triggered aggregation of AuNPs. Further addition of PPi restored the PPi-triggered dispersion state. The assay provided a linear response of the PPase activity in water in the range of 0.054–0.86 U/mL with a LOD of 0.02 U/mL (Figure 13a). Eventually, this approach was also employed to evaluate the PPase inhibition by using sodium fluoride (NaF) obtaining a half maximal inhibitory concentration (IC50) of 7.1 μM with a PPase activity of 0.38 U/mL.
A smart strategy to remarkably enhance the sensitivity of NCL-based colorimetric biosensors was proposed by Lu et al. [120]. Indeed, they demonstrated that the adoption of Au nanorods (AuNRs)—rather than spherical nanoparticles—introduced a significant plasmonic enhancement due to their capability to end-to-end self-assembly in presence of cysteine (Figure 13b). Such elongated patterns enriched the plasmonic coupled-modes along the longitudinal axis of AuNRs giving rise to a strong increase of the absorbance at 1030 nm while a decrease at 742 nm (Figure 13b). Thus, an ultrasensitive ratiometric biosensor was developed for detecting cholinesterase and organophosphate pesticides in human blood. Specifically, acetylthiocholine was used as substrate so that it was catalysed by cholinesterase into thiocholine and acetate acid. The resulting thiocholine bound the ends of AuNRs due to the higher affinity of S−Au conjunction as compared to cysteine−Au thereby preventing the cysteine-triggered aggregation of AuNRs. The addition of organophosphate pesticides inhibited the enzymatic activity of cholinesterase counteracting the AuNR aggregation. The sensing performance of cholinesterase activity were evaluated in buffer solution obtaining a LR of 0.042–8.4 μU/mL with a LOD of 0.018 μU/mL (Figure 13b), whereas recovery test carried out in diluted human serum samples achieved values in the range of 89–96%. As it concerns the organophosphate pesticide efficiency, the amount required to inhibit 30% of cholinesterase activity (IC30) turned out to be 1.2 pM. Importantly, the cholinesterase is an essential glycoprotein involved in several disease including Alzheimer’s and Parkinson’s diseases [120]. Thus, its detection at ultralow concentrations may play a crucial role in the prognosis of these diseases.
Outstanding studies demonstrated that telomerase can be explored as a valuable cancer biomarker since its over-expression in ~85% of human cancers [121,122]. This spurred the researchers to devise POC diagnostic tools based on colorimetric methods apt to be implemented in high-throughput screening devices. In this regard, two NCL-based colorimetric assays were developed by Wang et al. [123,124] with unique sensing features. The first approach they developed employed primer-modified AuNPs [123]. Specifically, telomerase substrate oligonucleotides (TS primer) were conjugated to the nanoparticle surface (TS-AuNPs) in such a way that they elongated in presence of telomerase (extracted from HeLa cells) and protected AuNPs from aggregation in highly ionic environment (Figure 14a). Without oligonucleotide elongation, TS primers were not able to fold in a protective G-quadruplex shell and, hence, AuNPs underwent ionic-induced aggregation. Although this method turned out to be extremely sensitive (LOD = 1 cell/μL), the limited LR (1–8 cells/μL) compromised its applicability for clinical purposes.
Subsequently, to overcome this issue, Wang et al. proposed a different approach for detecting telomerase activity [124]. In this case, AuNPs were modified with telomere complementary oligonucleotides (TC-AuNPs) while TS primers were dispersed in the suspension (Figure 14b). The addition of telomerase caused the elongation of TS primers in such a way that the telomerase reaction products (TRP) can be recognized by TC oligonucleotides. Thus, the hybridization of TC and TRP via sequence-specific bonds prevented the aggregation of AuNPs in highly ionic environment. This alternative strategy allowed one to dynamically extend the LR by tuning the concentration of TRP and AuNPs. In particular, at 2 nM (5 nM) concentration of AuNPs the LR was 100–4000 HeLa cells (500–10,000 HeLa cells) with a LOD of 100 HeLa cells (500 HeLa cells) (Figure 14b). The assay was also employed for measuring the inhibition efficiency (IC50) of curcumin finding out to be 2.8 μM with telomerase extracts from 4000 HeLa cells (Figure 14b).
Another promising enzyme-based assay to detect telomerase activity was proposed by Zhang et al. [125]. Here, the ionicity of the solution was such that it did not induce the aggregation of telomerase primer-modified AuNPs (TP-AuNPs). However, the addition of exonuclease I in the suspension of TP-AuNPs entailed the hydrolysis of the TP primers thereby triggering the nanoparticle aggregation (Figure 14c). On the contrary, in presence of telomerase, TP primers were elongated so to form G-quadruplex surrounding AuNPs that were resistant to the exonuclease I digestion. Thus, a competitive NCL-based colorimetric assay for detecting telomerase activity was developed with impressive sensing performance achieved with telomerase extracted from human leukaemia cells (HL-60) (LR = 0–200 cells/mL, LOD = 29 cells/mL) (Figure 14c). Moreover, the telomerase inhibition efficiency of BIBR1532 was tested achieving a IC50 value of 50 nM (with 300 HL-60 cancer cells/mL).
The main features of the above-mentioned NCL-based colorimetric biosensors are resumed in Table 5.
The destabilization-induced aggregation (DIA) method relies on reducing the electrosteric repulsion between functionalized nanoparticles by cleaving a part of the ligand (Figure 15). Such a method is widely used for monitoring the enzymatic activity [16].
A very simple approach to devise a DIA colorimetric biosensor was proposed by Aldewachi et al. [126] who measured the activity of dipeptidyl peptidase IV (DPP-IV) in human serum. The cleavage of peptide ligands surrounding AuNPs resulted in a reduction of the electrosteric stabilizing forces and, hence, in AuNP aggregation (Figure 16a). Satisfying LODs of 1.2 U/L and 1.5 U/L were achieved by using Gly-Pro-Asp-Cys (GPDC) and Val-Pro-ethylene diamine-Asp-Cys (VPED-DC) as peptide ligands, respectively (Figure 16a). The assay performance was estimated in buffer solution. However, a recovery of 83.6–114.9% was obtained from serum samples spiked with DPP-IV by using VPEN-DC-modified AuNPs, thus confirming its suitability as diagnostic tool.
A remarkable DIA-based approach was suggested by Kim et al. [127]. Here, the ionic strength among N,N′-diBoc-dityrosine-glycine-phenylalanine-3-(methylthio)-propylamine (DBDY-Gly-Phe-MTPA)-stabilized AuNPs was affected by the balance between cathepsin B and cathepsin B inhibitors (Figure 16b). Specifically, the enzymatic activity of cathepsin B catalysed the hydrolysis of DBDY-Gly-Phe-MTPA (negatively charged) into Phe-MTPA (positively charged) thereby weakening the electrostatic repulsion among AuNPs in a highly ionic environment. On the contrary, the presence of cathepsin B inhibitors (e.g., leupeptin, antipain, chymostatin) prevented the DBDY-Gly-Phe-MTPA hydrolysis and, hence, the nanoparticle aggregation. Cathepsin B is a tumour biomarker whose enzymatic activity is strongly related to many cancer development such as thyroid cancer, gastric cancer, breast cancer, glioma, oesophageal cancer, brain cancer, lung cancer, melanoma, ovarian cancer, and colon cancer [127]. Thus, a sensitive and POC detection of cathepsin B and its inhibitors in body fluids would represent a noteworthy tool in cancer prognosis and diagnosis as well as in anticancer drug delivery. The proposed biosensor was able to detect the cathepsin B activity within a clinically relevant nanomolar range down to 5 nM (Figure 16b). Moreover, the IC50 inhibitor efficiency of leupeptin, antipain, chymostatin was measured to be 0.11 μM, 0.48 μM and 1.78 μM, respectively, with 50 nM of cathepsin B.
Among the SARS-CoV-2-directed biosensors recently developed, a promising visual DIA-based colorimetric assay was proposed by Moitra et al. [128]. Their strategy consisted of a two-step approach: (i) viral RNA-mediated nanoparticle aggregation; and (ii) RNaseH-mediated cluster precipitation. This strategy entailed a sensitive and visual response, the latter being a feature highly desirable for realizing a SARS-CoV-2-directed POC test. Particularly, they employed thiol-modified antisense oligonucleotide (ASO)-capped AuNPs that selectively aggregated in presence of nucleocapsid phosphoproteins (N-gene) extracted from SARS-CoV-2 viruses (Figure 16c). Aiming at producing a naked-eye response, additional destabilization-induced agglomeration among the AuNPs was inducing by cleaving the RNA strands from the RNA-DNA hybrids (Figure 16c). To this aim, RNaseH enzymes were added into the solutions. The proposed assay was able to produce a visual response down to 0.18 ng/μL within 10 min from the extracted RNA specimens (Figure 16c).
DIA-based methods were successfully applied also to detect small molecules such as aflatoxin (~300 Da). Indeed, a colorimetric competitive assay was proposed by Shahi et al. [129] to detect aflatoxin B1 (AFB1) (312.3 Da) in food samples. AFB1 is a carcinogenic agent secreted by fungi whose awareness is recently realised. Gelatine functionalized AuNPs were employed to produce a visual response when incubated with bacterial supernatant containing gelatinase enzyme capable of digesting the nanoparticle gelatine coating (Figure 16d). The colour of the solution moved from red to purple due to the aggregation of unstabilised AuNPs. However, the addition of AFB1 in the bacterial supernatant inhibited the gelatinase activity thereby preventing the nanoparticle aggregation. The proposed assay provided a linear response in the range of 10–140 pg/mL with a LOD of 4 pg/mL (Figure 16d). A recovery of 92.4–95.3% was estimated in real saffron samples.
Table 6 shows a more comprehensive list of DIA-based colorimetric biosensors.
3.2. Label-Free Colorimetric Biosensors
Unlike the label-based detection methods, the label-free colorimetric approaches are mostly regulated by electrostatic stabilization. The analyte-triggered aggregation for chemical and biological sensing applications relies on the affinity of analytes—such as electrostatic or hydrogen-bonding interaction—toward unmodified nanoparticles. In this case, a repulsive electric layer can be generated from the surface charges of nanoparticles to stabilize the colloids. Thus, the neutralization of the surface charges results in the formation of unstable nanoparticles promoting their aggregation [134].
Aptamers are widely used in label-free colorimetric assays since the adsorption of negatively charged aptamers onto the nanoparticle surface leads to well-dispersed negatively charged aptamer-capped nanoparticles in media of moderately high ionic strength. The presence of analyte promotes the detachment of the aptamers from the nanoparticle surface entailing salt-induced aggregation (Figure 17) [135].
Label-free aptasensors were largely adopted to face the issue of 17β-estradiol (E2) detection, a toxic chemical often found in natural waters and wastewaters [136]. As for most long-sequence aptamers, the 76 mer aptamer commonly used for E2 detection yields a poor sensitivity [137]. In order to improve this performance, Liu et al. [135] developed a AuNP-based colorimetric aptasensor in which the 76 mer aptamers were split into two shorter strands (P1 + P2). In presence of E2, the analyte recognition by P1 + P2 aptamers resulted into a visual aggregation of AuNPs in highly saline buffer with a subsequent colour change from red to purple (Figure 18a). Interestingly, the colour change was visually appreciable (by naked-eye) from a concentration of 1 ng/mL of E2. Such a value was 10 times lower that that measured by using the no-split 76 mer aptamer. In order to obtain a quantitative response, the absorption spectra were measured and the OD620/OD520 ratio as a function of the E2 concentration was plotted. (Figure 18a). The LOD in the case of P1 + P2 was 0.1 ng/mL with a LR of 0.1–105 ng/mL. To determine whether P1 + P2 still retained the specificity of the original 76 mer aptamer, they tested the assay with the two separate aptamer fragments against similar target molecules (Figure 18a). The result showed no significant differences in specificity between P1 + P2 and the original aptamer.
Similar results were obtained by Alsager et al. [138] who realized a highly sensitive colorimetric aptasensor for detecting E2 in water and urine samples (Figure 18b). Here, the sensing performance were remarkably enhanced by truncating the 75-mer aptamer into 35-mer and 22-mer strands obtaining a 25-fold improvement in sensitivity. The disadvantage of adopting the longer 75 mer aptamer was likely ascribable to the excess flanking sequences not directly related to the target recognition that induced higher non-specific affinity toward AuNPs (Figure 18b). Using a colloidal solution of 35-mer aptamer-conjugated AuNPs, the E2 was detected in water down to 200 pM. The blue colour shift was visible by naked-eye down to 800 pM. A superb sensing performance was also achieved in spiked rat urine samples, where E2 was detected in the range of 5 nM–1 μM, with a LR of 50–800 nM. Additionally, a high specificity was measured with respect to potentially interfering molecules (Figure 18b).
The adoption of a single truncated E2 aptamer instead of two strands entailed a worsening of the sensor performance as demonstrated by the work of Qiao et al. [139]. Here, the original 76-mer aptamer was truncated at different sites generating a group of truncated aptamer variants to be investigated in highly ionic medium. Among them, 15-mer aptamer showed higher affinity towards E2 and enhanced specificity which allowed to detect E2 in water down to 0.02 μg/mL (Figure 18c). In the LR 0.02–10 μg/mL, the solution changed colour from red to blue. Additionally, the recovery was evaluated in mineral water and milk pre-treated samples obtaining values in the range of 96.15–108.70% and 96.18–114.37% with RSD values of 3.16–11.88% and 2.31–7.50%, respectively.
The possibility of tuning the biosensor response is highly desirable to satisfy clinical and diagnostic expectations. This is the case of the highly sensitive label-free colorimetric biosensor developed by Li et al. [140] to detect alkaline phosphate (ALP). The detection scheme was based on AuNPs capped with ecyltrimethyl ammonium bromide (CTAB) and conjugated with adenosine triphosphate (ATP). The latter was chosen as substrate for the phosphorylation reaction of ALP. The ATP induced the aggregation of AuNPs resulting in a colour change from red to grey with a pronounced absorbance redshift at 600 nm. After the ALP addition, the phosphorylation reaction converted the ATP in adenosine that broke the nanoparticle aggregates with a consequent blue-shift to 528 nm and a trend colour reversal to red (Figure 18d) The absorbance ratio A600/A525 as function of the ALP concentrations provided a LOD of 10 unit/L with a LR of 100–600 unit/L (Figure 18d). To match the clinically relevant concentrations of ALP (46–190 unit/L for adults and more than 500 unit/L for children and pregnant women), the LR was tuned by introducing metal ions. Specifically, Ca2+ and Pb2+ were added into the CTAB-stabilized AuNPs/ATP suspension obtaining a LR of 5.0–100 unit/L and 0.2–20 unit/L, respectively. In the case of Pb2+, the measured LOD was 0.1 unit/L. Eventually, the AuNPs/ATP/Pb2+ system was also used to evaluate the ALP concentration in real blood samples and the results were compatible with those obtained by clinical methods (Figure 18d).
Table 7 shows a more comprehensive list of DIA-based colorimetric biosensors.
4. Non-Aggregation-Based Colorimetric Biosensors
Newly-developing strategies being beyond the aggregation-based mode are the so-called non-aggregation colorimetric biosensors [145]. So far, despite a lack of a thorough awareness, this category of biosensors exhibited remarkable sensing performance without suffering from the main constraints of the aggregation-based mode (e.g., lack of amplification steps, auto-aggregation, hook effect, complex biofunctionalization) [145,146,147]. Generally, their colorimetric response arises from a modification of the size, shape or conformation of the nanostructures or from a change of the refractive index of the solution. Benefiting from such a non-aggregation strategy, practical POC tests may be designed in which nanostructures are immobilized on test strips and mediate the colorimetric response. Additionally, since ligand-mediated aggregation is not required, their chemical stability may be highly enhanced by using surfactants such as CTAB so to extend their applicability to complex matrices such as body fluids, milk, and sea water [148]. Finally, their label-free approach endows them with extremely high simplicity as compared to colorimetric biosensors based on bioreceptor-modified nanostructures.
In this section, three main categories of non-aggregation-based colorimetric biosensors are described: (i) nanozyme-based, (ii) etching-based, and (iii) growth-based.
4.1. Nanozyme-Based Colorimetric Biosensors
Recently, nano-based artificial enzymes, the so-called nanozymes, attracted more and more scientific interest thanks to their far-reaching applications in medicine, biology, and chemistry [149,150]. Unlike natural enzymes that suffer from high cost of synthesis, need for suitable pH and temperature conditions and poor stability, nanozymes boast robust catalytic activity even in extreme conditions of pH and temperature, low cost production, and bulk preparation [150,151,152]. So far, plenty of nanomaterials were demonstrated to possess inherent enzyme-like activity [152]. To cite a few, [153], [154], [155], [156], [157] exhibited excellent peroxidase-activity. Nevertheless, their practical adoption is still hindered by the limited substrate selectivity, single enzyme mimic activity and poor awareness of the reaction mechanism [158].
A label-free colorimetric method with remarkable peroxidase-like activity was proposed by Song et al. [34]. It consisted of FeS2NPs fabricated through one-step sulfidation of Fe3O4NPs (Figure 19a). TMB was used as substrate to entail a visual response in presence of . Indeed, the peroxidase-like activity of FeS2NPs led to the catalytic oxidation of TMB that generated blue products oxTMB (Figure 19a). Consequently, the colour of the solution turned deep-blue with a pronounced absorbance at 652 nm. Concentrations of down to 0.91 μM were measured in acetate buffer. Additionally, the proposed method was used to competitively detect glutathione (GSH) in -TMB solution. Indeed, the antioxidant properties of GSH sustained the reduction of oxTMB [151,159] thereby leading to a trend reversal of the colorimetric properties. The colour of the solution moved from deep-blue to colourless with a striking reduction of the absorbance at 652 nm (Figure 19a). A superb LOD of 0.15 μM was achieved in acetate buffer, whereas recovery values in the range of 98.4–103.4% were measured in diluted (1–3%) human serum samples.
An interesting approach to significantly enhance the catalytic activity of enzyme mimic nanomaterials was recently reported by Zhao et al. [160]. In particular, it was proven that the peroxidase-like activity of MoS2 nanosheets (NSs) can be enhanced up to 4.3-fold when modified with single-strand DNA (ssDNA) aptamers. Indeed, the higher affinity of DNA/MoS2-NSs toward the TMB (adopted as colorimetric substrate) facilitated the electron transfer from TMB and . Thus, DNA/MoS2-NSs were employed to develop a portable test for detecting carcinoembryonic antigen in agarose hydrogel. Taking advantage from the weak catalytic activity possessed by MoS2-NSs, a competitive strategy was conceived by using carcinoembryonic antigen aptamers (Figure 19b). The colour suspension from deep-blue (due to the massive presence of TMBox products) turned into colourless after the addition of carcinoembryonic antigen proteins. Indeed, the higher affinity of aptamers toward recognizing proteins caused the detachment of aptamers from MoS2-NSs thereby leading to a drastically decrease of the MoS2-NSs catalytic activity (Figure 19b). This simple approach provided a label free detection of carcinoembryonic antigen in acetate buffer solution within a clinically relevant range for gastroenteric tumour diagnosis and prognosis of 50–1000 ng/mL with a LOD of 50 ng/mL (Figure 19b).
An intriguing label-free strategy for detecting glucose level in human serum was proposed by Rashtbari et al. [161]. In particular, they reported an innovative nanolayered manganese-calcium oxide (NL-MnCaO2) exhibiting excellent glucose oxidase-like activity (Figure 19c). The presence of glucose non-enzymatically generated gluconic acid and . Then, the colorimetric response at 452 nm arose from the reaction between and ammonium metavanadate added into the solution. The sensing performance were evaluated in glucose-spiked acetate buffer solution and human serum samples yielding remarkable LODs of 23.86 μM and 6.12 μM, respectively (Figure 19c). Importantly, RSD and recovery values for serum samples ranged in 0.72–1.68% and 95.4–108.9%, respectively.
Innovative nanocomposites were recently reported exhibiting multiple enzyme mimetic activities. For example, FeCo co-doped carbon sphere (oxidase-like, peroxidase-like) [162], biomass-based hierarchical porous carbon (oxidase-like, peroxidase-like) [163], porous MnOx/MnFe2O4 (oxidase-like, peroxidase-like) [164], (peroxidase-like, glucose oxidase-like) [165], Pt nanoparticles coated with a bovine serum albumin scaffold (oxidase-like, peroxidase-like, catalase-like) [166], Au/CeO2 nanocomposite (peroxidase-like, catalase-like and superoxide dismutase-like) [167]. Nevertheless, although these nanozymes possess multiple enzyme mimetic activities, their feasibility in biosensing is still challenging due to the complex fabrication and the harsh reaction conditions (e.g., high temperature, low pH).
In this regard, Wu et al. [162] reported a unique colorimetric biosensor consisting of FeCo co-doped carbon spheres (FeCo@Cs) that possessed dual-enzyme catalytic property. In particular, FeCo@Cs exhibited high oxidase-like activity at pH 3.6 while peroxidase-like activity at pH 4.4 (Figure 20a). In the former case, FeCo@Cs were employed to catalytically oxidize 2-3,3′,5,5′-tetramethylbenzidine (TMB). The resulting oxTMB produced a colour change of the solution to deep-blue with an absorption peak at 652 nm. As reducing agent, hydroquinone was added into the solution to trigger a colour fading and, hence, a reduction of the absorption peak. This simple strategy was adopted for measuring hydroquinone concentration in acetate buffer solution (pH 3.6) in the range of 1–30 μM with a remarkable LOD of 0.8 μM (Figure 20a). Recovery and RSD assays were evaluated in tap water and river water obtaining values of 97.4–105.3% and within 4.2%, respectively. Additionally, the peroxidase-like activity of FeCo@Cs was tested in acetate buffer solution (pH 4.4) to detect within a LR of 1–240 μM and with a LOD of 1 μM (Figure 20a).
The unique enzyme mimic features possessed by advanced nanomaterials can be conveniently coupled with specific enzymes not only to develop competitive or cooperative cascade biosensors, but also to significantly enhance the enzyme catalytic activity. This is the case of the enzyme mimic colorimetric biosensor proposed by Zhao et al. [168] based on Mo, S co-doped carbon quantum dots (Mo-CQDs). Indeed, the Mo, S doping in CQDs facilitate the transfer of electrons in redox reactions thereby endowing the CQDs with highly enhanced catalytic activity. The strong peroxidase-like activity of Mo-CQDs was employed alongside cholesterol oxidase (Chox) for detecting cholesterol in human serum (Figure 20b). Specifically, Chox catalysed the oxidation of cholesterol which released . Thus, Mo-CQDs triggered the oxidation of TMB in presence of , thereby leading to the typical colour change of the solution from colourless to blue. The performance of the proposed biosensor was firstly evaluated in acetate buffer solution (pH 4.0) obtaining a clinically relevant LR of 10–600 μM with a LOD of 7 μM (Figure 20b). Moreover, RSD values within 10% obtained with diluted serum specimens safely supported the biosensor potentiality in clinical trials.
Finally, Liu et al. [169] took advantage of the tremendous tetra-enzyme mimetic activities (i.e., peroxidase, oxidase, catalase, and superoxide dismutase-like activity) exhibited by magnetic hierarchical Co3O4 nanoflowers to develop a highly sensitive bifunctional colorimetric sensing platform (Figure 20c). In particular, their oxidase-like activity originated from the oxygen vacancies of Co3O4, whereas the peroxidase-like activity derived from the •OH radical triggered by . The enzymatic behaviour can be selected by modifying the pH or adding specific scavengers. The proposed approach was employed to detect acid phosphatase (ACP) in acetate buffer and in air with LODs of 0.062 U/L and 2 μM, respectively (Figure 20c). The presence of the ACP or resulted into a reduction of the absorbance at 652 nm. Additionally, recovery studies were performed in human serum and water to assess the biosensor reliability in matrices with highly interfering background. RSD values within 3% for ACP in human serum and a recovery of 98–103% for in water confirmed its capability to be used in actual samples.
The main features of the above-mentioned nanozyme-based colorimetric biosensors are listed in Table 8.
4.2. Etching-Based Colorimetric Biosensors
Although noble metals such as Ag and Au exhibit strong resistance to oxidation due to their high redox potential, several techniques were recently developed to increase their capability to be oxidised (etched). Some examples include target-mediated etching [148,170], alloy-promoted etching [171,172], enzyme-mediated etching [173,174]. In target-mediated etching, the nanostructure oxidation is induced by the ligands that decrease the redox potential of noble nanostructures thereby allowing their etching under suitable conditions. However, this strategy is limited to specific targets with relatively high redox potential or that act as complexing agents of metal ions and, hence, it is not generally applicable. In alloy-promoted etching, the nanostructure oxidation is facilitated by the formation of alloys on the nanostructure surface. Indeed, Chen et al. [171] demonstrated that Pb-Au alloys formed onto the surface of AuNPs in detecting Pb2+ drastically enhanced the Au etching. On the contrary, when targets do not directly affect the surface chemistry of the nanostructures, intermediate ligands can be adopted to trigger the nanostructure etching. For example, Zhang et al. [175] developed an enzymatic-like etching-based biosensor for detecting molybdate in aqueous media. Indeed, in the presence of and , molybdate catalysed the formation of , whose moderate oxidase activity etched Au nanorods preferably along the longitudinal direction.
An intriguing approach to tremendously amplify the colorimetric response without inducing nanoparticle aggregation was proposed by Wang et al. [35]. It relied on enzyme-mediated etching of Au nanobipyramids (AuNBPs), which transformed into spherical AuNPs leading to a strong blue-shift of the LSPR peak (Figure 21a). In particular, this strategy was used to measure the telomerase activity in HeLa cells. To this aim, telomerase extracts from HeLa cells were incubated with magnetic bead probes in telomerase extension reaction buffer. The extension of probe endings allowed the magnetic beads to tether horseradish peroxidase-encapsulated liposomes (HRP-Ls). The following addition of -3,3′,5,5′-tetramethylbenzidine (TMB) triggered the peroxidase activity that entails the oxidation of TMB. Thus, AuNBPs etched under the effect of TMB2+. A LOD of 20 HeLa cells was achieved visually, whereas a quantitative analysis of the optical response yielded an impressive LOD of 1 HeLa (Figure 21a).
An innovative and highly tunable etching-based biosensor exhibiting excellent sensing performance was proposed by Zhang et al. [176] for detecting exosomes in human serum. Exosomes are vesicles of 30–100 nm diameter whose role is to bear specific molecules involved in several biological signal transduction and immune response [177]. Moreover, exosome-associated proteins are strongly expressed in cancer angiogenesis and metastasis [178]. Thus, the concern to detect exosomes at ultralow concentrations would pave the way to facilitate the chronic disease and cancer diagnosis at early stage [179]. However, colorimetric biosensors are usually limited in sensitivity due to the lack of amplification steps. On the contrary, the biosensor proposed by Zhang et al. can boast of enhanced sensitivity due to a signal amplification inherently ensured by its detection procedure (Figure 21b). Schematically, biotinylated CD63 aptamers and streptavidin-functionalized magnetic beads were employed as anchoring site for alkaline phosphatases (ALPs). Magnetic separation of ALP-conjugated magnetic beads allowed one to preconcentrate the sample while drastically reducing interfering background. Then, the addition of exosomes initiated a competitive reaction with the designed placeholder chains which released ALPs. Gold nanobipyramid@MnO2 nanosheets (AuNBP@MnO2NSs) were adopted as etching substrate (Figure 21b). In particular, the released ALPs catalysed the hydrolysis of L-ascorbic acid 2-phosphate (conveniently added into the solution) so that the AuNBP@MnO2NSs were etched by the resulting acid ascorbic. The pronounced blue-shift of the absorbance arose not only from the morphological change of the nanostructure, but also from the significant variation of the refractive index of the nanostructure surrounding environment. The sensing performance turned out to be aspect ratio (AR)-dependent achieving impressive LODs (down to 135 exosomes/μL) with high-AR AuNBPs (Figure 21b). The reason relied on the greatly enhanced longitudinal LSPR shift provided by elongated and sharp nanostructures.
As a cancer-related protein, poly(ADP-ribose) polymerase-1 (PARP-1) activity is of significance in the cancer prognosis and treatment [180]. In this regard, Liu et al. [181] proposed a colorimetric and label-free etching-based biosensor for competitively detecting PARP-1 in human cells. AuNRs were adopted as etching substrate so that their reduction in size entailed a pronounced blue-shift of the LSPR peak, whereas DNA-modified AuNPs constituted the substrates for the PARP-1 activity expression (Figure 22a). Firstly, PARP-1 was incubated with DNA-modified AuNPs to form hyperbranched PAR on the surface of AuNPs. The relatively high amount of contained in PAR branches reacted with (conveniently added into the solution) to form . Thus, the depletion of prevented the catalysis of and thereby inhibiting the etching of AuNRs. The assay performance was retrieved in buffer solution achieving a LR of 0.05–2 U with a LOD of 0.02 U (Figure 22a). Additionally, PARP-1 activity was detected in vitro with lysate A2780 ovarian cancer cells and MCF-7 epithelial cancer cells to assess the biosensor reliability. Satisfactory results (RSD ≲ 6%) corroborated the potential applicability of the proposed competitive assay for cancer diagnosis and treatment purposes.
Superb sensing performance down to femtomolar level (LR = 0.3 – 3 × 10⁴ fM, LOD = 0.1 fM) were achieve by the etching-based colorimetric biosensor proposed by Liang et al. [182] in detecting prostate-specific antigen (PSA) in human serum. Specifically, such a remarkable feature was accomplished thanks to the adoption of two amplification rounds (Figure 22b): (i) PSA recognition by magnetic beads coated with glucose oxidase (GOx)-conjugated antibodies (Ab–GOx–MBs); and (ii) substantial blue-shift entailed by -etched triangular silver nanoprisms (AgNPRs). In particular, highly GOx-loaded magnetic beads (76,000 GOx proteins per particle) warranted the first cascade amplification of the PSA signal (1 PSA molecule was converted into 76,000 GOx molecules), whereas the GOx-triggered enzymatic reaction catalysed the glucose (conveniently added into the solution) to form gluconic acid and . As strong oxidising agent, was able to etch AgNPRs. Subsequently, the colour of the solution turned from blue to purple as a consequence of the robust smoothing of the sharp AgNPR morphology (Figure 22b). Quantitative results obtained from patient serum samples were consistently compared with PSA levels measured by the time resolved fluorescence immunoassay (TRFIA) confirming the high robustness and reliability of the proposed assay.
Table 9 shows a more comprehensive list of etching-based colorimetric biosensors.
4.3. Growth-Based Colorimetric Biosensors
Growth-based plasmonic colorimetric biosensors generally rely on the modification of shape, size, and morphology of pre-existing metal seeds. Usually, the growth can be mediated by enzymes or reducing agents which trigger the reduction of metal precursors that induce the sedimentation of fresh metal atoms onto pre-existing seeds via heterogeneous nucleation, resulting in LSPR peak shifts [185,186].
In this regard, Shaban et al. [187] developed an AgNPs-based colorimetric sensor for the detection of p-aminophenol (pAP), a nephrotoxic and teratogenic chemical frequently found in human urine and paracetamol drugs since used as an intermediate product for the synthesis of paracetamol. The sensor was based on the ability of pAP to reduce Ag+, thus facilitating the growth of AgNP seeds with a subsequent solution colour change (Figure 23a). To confirm the seed-mediated growth of AgNPs, changes in the absorption intensity at 407 nm were measured (Figure 23a) obtaining a LR of 0–85 μM with a LOD of 0.32 μM. Colorimetric detection of pAP with the naked-eye was possible above 15 μM. The experiment on real samples was carried out with human urine samples from volunteer and with Panadol tablets (paracetamol derivatives) for evaluating the residual pAP amount in the drug. The pAP level in the initial urine sample and that extracted from paracetamol-based solution was 0 μM and 1.79 μM, respectively. The recovery values ranged from 94.71% to 102.44%, showing high accuracy and applicability of this biosensor in real urine samples. The selectivity of the sensor was evaluated against competitive compounds: there were no colour changes with all of the tested interfering ions, except for p-nitrophenol (pNP) (Figure 23a). However, this drawback was overcome measuring the absorbance at 520 nm instead of 407 nm.
Elongated nanostructures are particularly suitable for this seed-mediated strategy thanks to the opportunity of fine-tuning their plasmonic features by tailoring the aspect ratio. In this regard, Wang et al. [188] presented a colorimetric immunosensor to detect ellagic acid (EA), a polyphenolic antioxidant used in skin-whitening cosmetics. The assay employed the seed-mediated growth of the Au@Ag core-shell nanoparticles with AuNRs as seeds and AgNO3 as Ag precursor. In presence of EA, Ag+ reduced and sedimented onto the AuNRs (via heterogeneous nucleation) (Figure 23b). The LSPR peak of AuNRs could be largely tuned by engineering the nanorod aspect ratio during the synthesis. For this study, the ratio was chosen as 3.3 (45/13.5 nm) that provided a longitudinal LSPR at 790 nm and a transversal LSPR at 530 nm (Figure 23b). As a result of the silver growth, the longitudinal LSPR largely blue-shifted with a colour change from purple to green (Figure 23b). The calibration curve (LSPR shift as a function of EA concentration) exhibited a LR of 0–20 μM with a LOD of 40 nM.
Many enzymes have been used to mediate the growth process and were applied to detect a large variety of targets (bacteria [189], biomarkers [190], viruses [191]). For instance, Cheng et al. [189] presented a colorimetric assay to detect Escherichia coli by monitoring the beta-galactosidase (β-gal) activity. E. coli cells released β-gal when infected with T7 bacteriophages. Then, β-gal cleaved the p-aminophenyl-β-D-galactopyranosied producing p-aminophenol (reducing agent) that triggered the deposition of an Ag shell onto AuNRs seeds.
Sharp nanostructures exhibit enhanced plasmonic properties as compared to smooth nanoparticles [56]. This is the case of gold nanobipyrimids (AuNBs) proposed by Xu et al. [191] who realized an ultrasensitive colorimetric immunoassay for the detection of the H5N1 virus by an enzyme-induced Ag growth onto AuNBs surface. Experiments were carried out in a 96-well plate in which antibody-antigen-antibody sandwiches were first immobilized and then linked to alkaline phosphatase (ALP) enzyme via biotin-avidin complexes (Figure 24a). The hydrolyzation of 4-aminophenyl phosphate in presence of ALP produced 4-aminophenol entailing the reduction of Ag+ into Ag, which eventually deposited onto the AuNBs. The silver growth onto the AuNBs entailed a blue-shift of the original AuNBs LSPR peak (750 nm) and a visual colour change of the solution (Figure 24a). The striking visual response was ascribed to the high monodispersity of the AuNBs that guaranteed a narrow LSPR linewidth. The LOD achieved for the detection of the H5N1 virus was 1 pg/mL and the LR was 1 pg/mL–2.5 ng/mL (Figure 24a). As the analyte concentration varied in the LR, the colour of the solution distinctly changed from green to blue (Figure 24a), so that a semiquantitative measure of the analyte concentration could be retrieved. Recovery and RSD in human serum resulted to be 99–102% and 2.07–9.41%, respectively.
An intriguing approach consists in tuning the surface morphology of metal NPs during the crystal growth by means of DNA molecules (e.g., aptamers) [192]. In this regard, Soh et al. [193] reported a colorimetric assay based on an aptamer-controlled growth strategy of AuNPs which was successfully tested to detect three different targets (ochratoxin, cocaine and E2). A colloidal solution of 5 nm diameter AuNPs functionalized with aptamers (ochratoxin A, ochratoxin A aptamer complement, cocaine aptamer, and estradiol aptamer) was incubated with a solution containing the corresponding target in a 96-well plate. The target recognition caused the desorption of the aptamers from the AuNPs surfaces (Figure 24b). When a growth solution containing NH2OH and HAuCl4 was added, AuNPs with no aptamers on their surface grew preserving a spherical shape and the absorbance slightly red-shifted (the solution appeared red-purple). Conversely, AuNPs coated with aptamers grew with an irregular and branched morphology, resulting in a blue solution (Figure 24b). According to the target concentration, the colour changed from blue to red-purple, providing a semiquantitative estimation of concentration by naked-eye (Figure 24b). It is worth noticing that the LSPR shift is strongly related to the effective desorption of aptamers from AuNPs, which ultimately depends on both aptamer-target affinity and aptamer-AuNP affinity. Thus, the length of aptamers plays a crucial role in tuning the features of the sensor [138,139]. Remarkably, the assay showed a LOD of 1 nM for both ochratoxin A in water and cocaine in spiked urine samples, while a LOD of 0.2 nM for E2 in spiked synthetic saliva samples (Figure 24b).
![Chemosensors 10 00136 g024]()
Figure 24.
(a) Working principle of the enzyme-mediated growth-based immunosensor for detecting H5N1 virus; visual colour change, TEM images and absorption spectra as a function of the analyte concentration; calibration curve for H5N1 virus (the inset shows the LR). Adapted from Ref. [191] Copyright (2016), with permission from American Chemical Society. (b) Schematic representation of the growth-based mechanism for the detection of small molecules; calibration curve and corresponding visual colour change for E2, cocaine and ochratoxin (OTA). Representative TEM image of AuNPs before (top) and after (bottom) the growth. Adapted from Ref. [193] Copyright (2015), with permission from American Chemical Society.

The main features of the above-mentioned nanozyme-based colorimetric biosensors are listed in Table 10.
5. Conclusions and Perspectives
In this review, we presented different nanomaterial-based strategies adopted to devise colorimetric biosensors. In particular, recently reported-on platform-based and colloid-based plasmonic colorimetric biosensors were described alongside their nanomaterial designs, working principles, sensing features, and relevant applications.
Generally, plasmonic colorimetric biosensors boast unique sensing features and are excellent tools for realizing simple and visual detectors which can easily and very quickly signalize presence/absence of desired targets. However, when an accurate quantitative measurement is preferred to an on/off output, most of them suffer from several drawbacks such as operator-dependent results and poor resolutions as compared to the conventional laboratory techniques. Indeed, the recognition by naked-eye of the exact hue/wavelength peak of a certain colour exhibited by the biosensor is inherently subjective (even if a colour chart is provided). Furthermore, the interplay among many complex elements (e.g., nanofabrication, biofunctionalization, fluidics, detection mechanisms) makes unfeasible to control the whole process at the desired extent. This critically reflects on the poor repeatability as inferable from the relatively large statistical errors exhibited by the biosensors generally reported in literature. Thus, competitive resolutions (comparable with ELISA’s and RT-PCR’s) are still far from being achieved. The aforementioned issues are usually addressed by pairing up the colorimetric biosensors with a suitable apparatus (e.g., a camera and an image-processing software). However, this strategy unavoidably complicates the systems and increases drastically the costs, thus effectively nulling their initial advantages and significantly hampering their implementation as simple and fast POC devices.
In addition, aiming at commercializing these devices, several further demands have to be satisfied such as fulfilment of industrial standards, rigorous clinical trials, high scalability. However, these aspects are not always considered within a research framework hindering the technology transfer from research laboratory to industry. Therefore, plasmonic colorimetric biosensors do not still offer an actual alternative to the conventional analytical methods, such as RT-PCR, ELISA, high-performance liquid chromatography (HPLC), and liquid chromatography-mass spectrometry (LC-MS). Thus, researchers are continuously spurred to improve biosensors feasibility and scalability for industrialization and commercialization purposes. In this regard, on-platform based and colloid-based plasmonic colorimetric biosensors are a viable pathway although some challenges have still to be addressed. As it concerns the on-platform devices, the greatest strength is the extremely high tunability of their plasmonic response; indeed, LSPRs, c-LSPRs, and SLRs can be selectively borne by properly engineering the nanostructure morphology and pattern architecture. However, this high tunability generally requires high-tech and expensive nanolithography techniques such as EBL, FIB, and NIL that usually limit their scalability. On the other hand, colloid-based biosensors are preferred when responsiveness and practicality is demanded thanks to the possibilities of realizing POC tests with visual response. In fact, the high versatility and simplicity offered by chemical synthesis represent the major strength of this approach, at the expense of a limited plasmonic tunability and a relatively poor sensitivity.
Additionally, surface biofunctionalization of nanomaterials is another important issue to address when dealing with biosensors since it strongly affects their sensitivity and efficacy. Indeed, expensive, complex and time-consuming biofunctionalization procedures usually hamper the feasibility of the biosensors for POC and high-throughput applications (e.g., mass screening). Therefore, cost-effective, simple, and fast strategies are highly attractive for devising both platform-based and colloid-based plasmonic colorimetric biosensors. This issue is inherently linked to effectiveness of the fluidic system used for either the nanomaterial functionalization or the bioparticle sorting and mixing. Indeed, an unoptimized fluidics may extend the assay time, increase the costs (due to larger volume of specimens required to carry out the assay), and worsen the overall sensing performance.
As futuristic perspectives, several aspects should be more deeply investigated to improve the feasibility of plasmonic colorimetric biosensors. Firstly, simple nanofabrication techniques such as chemical-based synthesis, soft-lithography, block copolymer micelle nanolithography may be preferred to the more complex EBL, FIB, and NIL in order to enhance the industrial scalability and reduce the production costs. Moreover, tailored nanostructure designs (e.g., sharp nanoparticles, specific materials, and pattern architectures) could be devised to remarkably augment the sensing performance. In this regard, multi-resonant nanostructures could also be conceived (e.g., combining nanomaterials exhibiting different plasmonic modes), thus opening up the possibility for multiplexed measurements. Secondly, the experimental methods should be more rigorously described (and, if possible, standardised) to warrant a higher measure reproducibility. Clever strategies bearing signal amplifications (e.g., nanozyme-based or destabilization-induced approaches) may be extensively adopted in future to enhance sensing performance such as LR and LOD. In addition, aptamers could be preferred as bioreceptors to the more expensive antibodies in label-based approaches to drastically reduce the assay costs, extend the assay shelf life and address the need for a cold chain. Eventually, the design of tailored microfluidic systems would lead to a drastic reduction of the assay time and costs as well as a significant improvement of the sensing effectiveness thanks to the fine conveyance of the solution at nanoscale. Thus, nanomaterial design, surface biofunctionalization, fluidics, signal amplification are still flourishing research fields that will likely face these issues in the future.
Author Contributions
Conceptualization: A.A. and A.M.; writing and original draft preparation of Section 2: A.A. and A.M.; writing and original draft preparation of Section 3 and Section 4: A.A., E.S., M.D.L., D.M. and A.M.; review and editing: A.A., E.S. and A.M.; supervision: R.V. and A.M. All authors have read and agreed to the published version of the manuscript.
Funding
This research received no external funding.
Institutional Review Board Statement
Not applicable.
Informed Consent Statement
Not applicable.
Data Availability Statement
Not applicable.
Acknowledgments
We thank the anonymous reviewers for their valuable contribution to the peer review of this work.
Conflicts of Interest
The authors declare no conflict of interest.
References
- Fang, Y.; Sun, M. Nanoplasmonic waveguides: Towards applications in integrated nanophotonic circuits. Light Sci. Appl. 2015, 4, e294. [Google Scholar] [CrossRef] [Green Version]
- El-Sayed, I.H.; Huang, X.; El-Sayed, M.A. Selective laser photo-thermal therapy of epithelial carcinoma using anti-EGFR antibody conjugated gold nanoparticles. Cancer Lett. 2006, 239, 129–135. [Google Scholar] [CrossRef] [PubMed]
- Ferry, V.E.; Sweatlock, L.A.; Pacifici, D.; Atwater, H.A. Plasmonic nanostructure design for efficient light coupling into solar cells. Nano Lett. 2008, 8, 4391–4397. [Google Scholar] [CrossRef] [PubMed] [Green Version]
- Anker, J.N.; Hall, W.P.; Lyandres, O.; Shah, N.C.; Zhao, J.; Van Duyne, R.P. Biosensing with plasmonic nanosensors. Nat. Mater. 2008, 7, 442–453. [Google Scholar] [CrossRef] [PubMed]
- Koller, D.M.; Hohenau, A.; Ditlbacher, H.; Galler, N.; Reil, F.; Aussenegg, F.R.; Leitner, A.; List, E.J.W.; Krenn, J.R. Organic plasmon-emitting diode. Nat. Photonics 2008, 2, 684–687. [Google Scholar] [CrossRef]
- Akimov, A.V.; Mukherjee, A.; Yu, C.L.; Chang, D.E.; Zibrov, A.S.; Hemmer, P.R.; Park, H.; Lukin, M.D. Generation of single optical plasmons in metallic nanowires coupled to quantum dots. Nature 2007, 450, 402–406. [Google Scholar] [CrossRef] [PubMed]
- Pelton, M.; Aizpurua, J.; Bryant, G. Metal-nanoparticle plasmonics. Laser Photonics Rev. 2008, 2, 136–159. [Google Scholar] [CrossRef] [Green Version]
- Cao, X.; Wang, Z.; Bi, L.; Bi, C.; Du, Q. Gold nanocage-based surface-enhanced Raman scattering probes for long-term monitoring of intracellular microRNA during bone marrow stem cell differentiation. Nanoscale 2020, 12, 1513–1527. [Google Scholar] [CrossRef] [PubMed]
- Wang, Z.; Xue, J.; Bi, C.; Xin, H.; Wang, Y.; Cao, X. Quantitative and specific detection of cancer-related microRNAs in living cells using surface-enhanced Raman scattering imaging based on hairpin DNA-functionalized gold nanocages. Analyst 2019, 144, 7250–7262. [Google Scholar] [CrossRef] [PubMed]
- Jung, J.Y.; Yang, W.G.; Hong, S.H.; Kim, G.H.; Hwang, K.; Chae, W.S. Amplified fluorescence imaging using photonic Ag nanotip array: A comparative study on surface morphology effects. Appl. Surf. Sci. 2020, 529, 147139. [Google Scholar] [CrossRef]
- Fothergill, S.M.; Joyce, C.; Xie, F. Metal enhanced fluorescence biosensing: From ultra-violet towards second near-infrared window. Nanoscale 2018, 10, 20914–20929. [Google Scholar] [CrossRef] [PubMed] [Green Version]
- Minopoli, A.; Acunzo, A.; Della Ventura, B.; Velotta, R. Nanostructured Surfaces as Plasmonic Biosensors: A Review. Adv. Mater. Interfaces 2021, 2101133, 2101133. [Google Scholar] [CrossRef]
- Minopoli, A.; Della Ventura, B.; Campanile, R.; Tanner, J.A.; Offenhäusser, A.; Mayer, D.; Velotta, R. Randomly positioned gold nanoparticles as fluorescence enhancers in apta-immunosensor for malaria test. Microchim. Acta 2021, 188, 88. [Google Scholar] [CrossRef] [PubMed]
- Minopoli, A.; Scardapane, E.; Ventura, B.D.; Tanner, J.A.; Offenhäusser, A.; Mayer, D.; Velotta, R. Double-Resonant Nanostructured Gold Surface for Multiplexed Detection. ACS Appl. Mater. Interfaces 2022, 14, 6417–6427. [Google Scholar] [CrossRef]
- Pashchenko, O.; Shelby, T.; Banerjee, T.; Santra, S. A Comparison of Optical, Electrochemical, Magnetic, and Colorimetric Point-of-Care Biosensors for Infectious Disease Diagnosis. ACS Infect. Dis. 2018, 4, 1162–1178. [Google Scholar] [CrossRef] [PubMed]
- Aldewachi, H.; Chalati, T.; Woodroofe, M.N.; Bricklebank, N.; Sharrack, B.; Gardiner, P. Gold nanoparticle-based colorimetric biosensors. Nanoscale 2018, 10, 18–33. [Google Scholar] [CrossRef] [PubMed] [Green Version]
- Choi, Y.; Hwang, J.H.; Lee, S.Y. Recent Trends in Nanomaterials-Based Colorimetric Detection of Pathogenic Bacteria and Viruses. Small Methods 2018, 2, 1700351. [Google Scholar] [CrossRef]
- Zhao, V.X.T.; Wong, T.I.; Zheng, X.T.; Tan, Y.N.; Zhou, X. Colorimetric biosensors for point-of-care virus detections. Mater. Sci. Energy Technol. 2020, 3, 237–249. [Google Scholar] [CrossRef] [PubMed]
- Zhu, D.; Liu, B.; Wei, G. Two-dimensional material-based colorimetric biosensors: A review. Biosensors 2021, 11, 259. [Google Scholar] [CrossRef] [PubMed]
- Iravani, S. Nano-And biosensors for the detection of SARS-CoV-2: Challenges and opportunities. Mater. Adv. 2020, 1, 3092–3103. [Google Scholar] [CrossRef]
- Vázquez, M.; Anfossi, L.; Ben-Yoav, H.; Diéguez, L.; Karopka, T.; Della Ventura, B.; Abalde-Cela, S.; Minopoli, A.; Di Nardo, F.; Shukla, V.K.; et al. Use of some cost-effective technologies for a routine clinical pathology laboratory. Lab Chip 2021, 21, 4330–4351. [Google Scholar] [CrossRef] [PubMed]
- Olofsson, S.; Brittain-Long, R.; Andersson, L.M.; Westin, J.; Lindh, M. PCR for detection of respiratory viruses: Seasonal variations of virus infections. Expert Rev. Anti. Infect. Ther. 2011, 9, 615–626. [Google Scholar] [CrossRef] [PubMed]
- Appak, Ö.; Duman, M.; Belet, N.; Sayiner, A.A. Viral respiratory infections diagnosed by multiplex polymerase chain reaction in pediatric patients. J. Med. Virol. 2019, 91, 731–737. [Google Scholar] [CrossRef] [PubMed] [Green Version]
- Li, Z.; Yi, Y.; Luo, X.; Xiong, N.; Liu, Y.; Li, S.; Sun, R.; Wang, Y.; Hu, B.; Chen, W.; et al. Development and Clinical Application of A Rapid IgM-IgG Combined Antibody Test for SARS-CoV-2 Infection Diagnosis. J. Med. Virol. 2020, 92, 1518–1524. [Google Scholar] [CrossRef] [PubMed]
- Dou, M.; Zhu, K.; Fan, Z.; Zhang, Y.; Chen, X.; Zhou, X.; Ding, X.; Li, L.; Gu, Z.; Guo, M.; et al. Reproductive Hormones and Their Receptors May Affect Lung Cancer. Cell. Physiol. Biochem. 2017, 44, 1425–1434. [Google Scholar] [CrossRef] [PubMed]
- Maddali, H.; Miles, C.E.; Kohn, J.; O’Carroll, D.M. Optical Biosensors for Virus Detection: Prospects for SARS-CoV-2/COVID-19. ChemBioChem 2021, 22, 1176–1189. [Google Scholar] [CrossRef] [PubMed]
- Maier, S.A. Plasmonics: Fundamentals and Applications; Springer: New York, NY, USA, 2007; ISBN 0387331506. [Google Scholar]
- Mayer, K.M.; Hafner, J.H. Localized surface plasmon resonance sensors. Chem. Rev. 2011, 111, 3828–3857. [Google Scholar] [CrossRef] [PubMed]
- Kravets, V.G.; Kabashin, A.V.; Barnes, W.L.; Grigorenko, A.N. Plasmonic Surface Lattice Resonances: A Review of Properties and Applications. Chem. Rev. 2018, 118, 5912–5951. [Google Scholar] [CrossRef]
- Njoki, P.N.; Lim, I.I.S.; Mott, D.; Park, H.Y.; Khan, B.; Mishra, S.; Sujakumar, R.; Luo, J.; Zhong, C.J. Size correlation of optical and spectroscopic properties for gold nanoparticles. J. Phys. Chem. C 2007, 111, 14664–14669. [Google Scholar] [CrossRef]
- Ghosh, S.K.; Pal, T. Interparticle Coupling Effect on the Surface Plasmon Resonance of Gold Nanoparticles: From Theory to Applications. Chem. Rev. 2007, 107, 4797–4862. [Google Scholar] [CrossRef]
- Kaye, S.; Zeng, Z.; Sanders, M.; Chittur, K.; Koelle, P.M.; Lindquist, R.; Manne, U.; Lin, Y.; Wei, J. Label-free detection of DNA hybridization with a compact LSPR-based fiber-optic sensor. Analyst 2017, 142, 1974–1981. [Google Scholar] [CrossRef]
- Kawasaki, D.; Yamada, H.; Maeno, K.; Sueyoshi, K.; Hisamoto, H.; Endo, T. Core-Shell-Structured Gold Nanocone Array for Label-Free DNA Sensing. ACS Appl. Nano Mater. 2019, 2, 4983–4990. [Google Scholar] [CrossRef]
- Song, C.; Ding, W.; Zhao, W.; Liu, H.; Wang, J.; Yao, Y.; Yao, C. High peroxidase-like activity realized by facile synthesis of FeS2 nanoparticles for sensitive colorimetric detection of H2O2 and glutathione. Biosens. Bioelectron. 2020, 151, 111983. [Google Scholar] [CrossRef]
- Wang, D.; Zhang, Y.; Zhao, X.; Xu, Z. Plasmonic colorimetric biosensor for visual detection of telomerase activity based on horseradish peroxidase-encapsulated liposomes and etching of Au nanobipyramids. Sens. Actuators B Chem. 2019, 296, 126646. [Google Scholar] [CrossRef]
- Klimov, V. Nanoplasmonics; CRC Press: Boca Raton, FL, USA, 2013; ISBN 9789814267427. [Google Scholar]
- Karimi, S.; Moshaii, A.; Abbasian, S.; Nikkhah, M. Surface Plasmon Resonance in Small Gold Nanoparticles: Introducing a Size-Dependent Plasma Frequency for Nanoparticles in Quantum Regime. Plasmonics 2019, 14, 851–860. [Google Scholar] [CrossRef]
- Link, S.; El-Sayed, M.A. Size and temperature dependence of the plasmon absorption of colloidal gold nanoparticles. J. Phys. Chem. B 1999, 103, 4212–4217. [Google Scholar] [CrossRef]
- Jain, P.K.; Lee, K.S.; El-Sayed, I.H.; El-Sayed, M.A. Calculated absorption and scattering properties of gold nanoparticles of different size, shape, and composition: Applications in biological imaging and biomedicine. J. Phys. Chem. B 2006, 110, 7238–7248. [Google Scholar] [CrossRef] [Green Version]
- Shafiqa, A.R.; Abdul Aziz, A.; Mehrdel, B. Nanoparticle Optical Properties: Size Dependence of a Single Gold Spherical Nanoparticle. J. Phys. Conf. Ser. 2018, 1083, 012040. [Google Scholar] [CrossRef] [Green Version]
- Miller, M.M.; Lazarides, A.A. Sensitivity of metal nanoparticle surface plasmon resonance to the dielectric environment. J. Phys. Chem. B 2005, 109, 21556–21565. [Google Scholar] [CrossRef] [PubMed]
- Zhang, Z.; Yang, J.; He, X.; Zhang, J.; Huang, J.; Chen, D.; Han, Y. Plasmonic refractive index sensor with high figure of merit based on concentric-rings resonator. Sensors 2018, 18, 116. [Google Scholar] [CrossRef] [Green Version]
- Sun, Y.; Xia, Y. Increased sensitivity of surface plasmon resonance of gold nanoshells compared to that of gold solid colloids in response to environmental changes. Anal. Chem. 2002, 74, 5297–5305. [Google Scholar] [CrossRef] [PubMed]
- Mock, J.J.; Smith, D.R.; Schultz, S. Local refractive index dependence of plasmon resonance spectra from individual nanoparticles. Nano Lett. 2003, 3, 485–491. [Google Scholar] [CrossRef]
- Chen, H.; Kou, X.; Yang, Z.; Ni, W.; Wang, J. Shape- and size-dependent refractive index sensitivity of gold nanoparticles. Langmuir 2008, 24, 5233–5237. [Google Scholar] [CrossRef] [PubMed]
- Sherry, L.J.; Chang, S.H.; Schatz, G.C.; Van Duyne, R.P.; Wiley, B.J.; Xia, Y. Localized surface plasmon resonance spectroscopy of single silver nanocubes. Nano Lett. 2005, 5, 2034–2038. [Google Scholar] [CrossRef] [PubMed]
- Chaudhary, A.; Khan, S.; Gupta, A.; Nandi, C.K. Effect of surface chemistry and morphology of gold nanoparticle on the structure and activity of common blood proteins. New J. Chem. 2016, 40, 4879–4883. [Google Scholar] [CrossRef]
- Austin Suthanthiraraj, P.P.; Sen, A.K. Localized surface plasmon resonance (LSPR) biosensor based on thermally annealed silver nanostructures with on-chip blood-plasma separation for the detection of dengue non-structural protein NS1 antigen. Biosens. Bioelectron. 2019, 132, 38–46. [Google Scholar] [CrossRef]
- Park, Y.; Ryu, B.; Deng, Q.; Pan, B.; Song, Y.; Tian, Y.; Alam, H.B.; Li, Y.; Liang, X.; Kurabayashi, K. An Integrated Plasmo-Photoelectronic Nanostructure Biosensor Detects an Infection Biomarker Accompanying Cell Death in Neutrophils. Small 2020, 16, 1905611. [Google Scholar] [CrossRef] [PubMed]
- Focsan, M.; Craciun, A.M.; Potara, M.; Leordean, C.; Vulpoi, A.; Maniu, D.; Astilean, S. Flexible and Tunable 3D Gold Nanocups Platform as Plasmonic Biosensor for Specific Dual LSPR-SERS Immuno-Detection. Sci. Rep. 2017, 7, 14240. [Google Scholar] [CrossRef] [PubMed] [Green Version]
- Badshah, M.A.; Koh, N.Y.; Zia, A.W.; Abbas, N.; Zahra, Z.; Saleem, M.W. Recent developments in plasmonic nanostructures for metal enhanced fluorescence-based biosensing. Nanomaterials 2020, 10, 1749. [Google Scholar] [CrossRef] [PubMed]
- Lee, K.S.; El-Sayed, M.A. Gold and silver nanoparticles in sensing and imaging: Sensitivity of plasmon response to size, shape, and metal composition. J. Phys. Chem. B 2006, 110, 19220–19225. [Google Scholar] [CrossRef] [PubMed]
- Kazuma, E.; Tatsuma, T. Localized surface plasmon resonance sensors based on wavelength-tunable spectral dips. Nanoscale 2014, 6, 2397–2405. [Google Scholar] [CrossRef] [Green Version]
- Na, H.K.; Wi, J.S.; Son, H.Y.; Ok, J.G.; Huh, Y.M.; Lee, T.G. Discrimination of single nucleotide mismatches using a scalable, flexible, and transparent three-dimensional nanostructure-based plasmonic miRNA sensor with high sensitivity. Biosens. Bioelectron. 2018, 113, 39–45. [Google Scholar] [CrossRef] [PubMed]
- Lednický, T.; Bonyár, A. Large Scale Fabrication of Ordered Gold Nanoparticle–Epoxy Surface Nanocomposites and Their Application as Label-Free Plasmonic DNA Biosensors. ACS Appl. Mater. Interfaces 2020, 12, 4804–4814. [Google Scholar] [CrossRef] [PubMed]
- Mock, J.J.; Barbic, M.; Smith, D.R.; Schultz, D.A.; Schultz, S. Shape effects in plasmon resonance of individual colloidal silver nanoparticles. J. Chem. Phys. 2002, 116, 6755–6759. [Google Scholar] [CrossRef]
- Wang, B.; Singh, S.C.; Lu, H.; Guo, C. Design of Aluminum Bowtie Nanoantenna Array with Geometrical Control to Tune LSPR from UV to Near-IR for Optical Sensing. Plasmonics 2020, 15, 609–621. [Google Scholar] [CrossRef]
- Qi, X.; Bi, J. Plasmonic sensors relying on nanoparticle arrays created by a template-directed dewetting process. Opt. Commun. 2019, 453, 124328. [Google Scholar] [CrossRef]
- Rapisarda, A.; Giamblanco, N.; Marletta, G. Kinetic discrimination of DNA single-base mutations by localized surface plasmon resonance. J. Colloid Interface Sci. 2017, 487, 141–148. [Google Scholar] [CrossRef]
- Zhen, Y.R.; Fung, K.H.; Chan, C.T. Collective plasmonic modes in two-dimensional periodic arrays of metal nanoparticles. Phys. Rev. B Condens. Matter Mater. Phys. 2008, 78, 035419. [Google Scholar] [CrossRef] [Green Version]
- Nordlander, P.; Oubre, C.; Prodan, E.; Li, K.; Stockman, M.I. Plasmon Hybridization in Nanoparticle Dimers. Nano Lett. 2004, 4, 899–903. [Google Scholar] [CrossRef]
- Prodan, E.; Nordlander, P. Plasmon hybridization in spherical nanoparticles. J. Chem. Phys. 2004, 120, 5444–5454. [Google Scholar] [CrossRef] [PubMed]
- Sheikholeslami, S.; Jun, Y.W.; Jain, P.K.; Alivisatos, A.P. Coupling of optical resonances in a compositionally asymmetric plasmonic nanoparticle dimer. Nano Lett. 2010, 10, 2655–2660. [Google Scholar] [CrossRef] [PubMed]
- Jain, P.K.; Eustis, S.; El-Sayed, M.A. Plasmon Coupling in Nanorod Assemblies: Optical Absorption, Discrete Dipole Approximation Simulation, and Exciton-Coupling Model. J. Phys. Chem. B 2006, 110, 18243–18253. [Google Scholar] [CrossRef] [PubMed]
- Deng, T.-S.; Parker, J.; Yifat, Y.; Shepherd, N.; Scherer, N.F. Dark Plasmon Modes in Symmetric Gold Nanoparticle Dimers Illuminated by Focused Cylindrical Vector Beams. J. Phys. Chem. C 2018, 122, 27662–27672. [Google Scholar] [CrossRef]
- Jain, P.K.; Huang, W.; El-Sayed, M.A. On the Universal Scaling Behavior of the Distance Decay of Plasmon Coupling in Metal Nanoparticle Pairs: A Plasmon Ruler Equation. Nano Lett. 2007, 7, 2080–2088. [Google Scholar] [CrossRef]
- Jain, P.K.; El-Sayed, M.A. Plasmonic coupling in noble metal nanostructures. Chem. Phys. Lett. 2010, 487, 153–164. [Google Scholar] [CrossRef]
- Sadeghi, S.M.; Gutha, R.R. Coherent Networks of Plasmonic Dipole Domains: Long-Range Optical Coupling of Phase-Correlated Packages of Metallic Nanoparticles. Phys. Rev. Appl. 2021, 15, 034018. [Google Scholar] [CrossRef]
- Das, A.; Kumar, K.; Dhawan, A. Periodic arrays of plasmonic crossed-bowtie nanostructures interspaced with plasmonic nanocrosses for highly sensitive LSPR based chemical and biological sensing. RSC Adv. 2021, 11, 8096–8106. [Google Scholar] [CrossRef]
- Verellen, N.; Van Dorpe, P.; Huang, C.; Lodewijks, K.; Vandenbosch, G.A.E.; Lagae, L.; Moshchalkov, V.V. Plasmon line shaping using nanocrosses for high sensitivity localized surface plasmon resonance sensing. Nano Lett. 2011, 11, 391–397. [Google Scholar] [CrossRef]
- Zhou, L.; Ding, F.; Chen, H.; Ding, W.; Zhang, W.; Chou, S.Y. Enhancement of immunoassay’s fluorescence and detection sensitivity using three-dimensional plasmonic nano-antenna-dots array. Anal. Chem. 2012, 84, 4489–4495. [Google Scholar] [CrossRef] [PubMed]
- Yu, C.C.; Chen, H.L. Nanoimprint technology for patterning functional materials and its applications. Microelectron. Eng. 2015, 132, 98–119. [Google Scholar] [CrossRef]
- Su, H.; Cheng, X.R.; Endo, T.; Kerman, K. Photonic crystals on copolymer film for label-free detection of DNA hybridization. Biosens. Bioelectron. 2018, 103, 158–162. [Google Scholar] [CrossRef] [PubMed]
- Dickreuter, S.; Gleixner, J.; Kolloch, A.; Boneberg, J.; Scheer, E.; Leiderer, P. Mapping of plasmonic resonances in nanotriangles. Beilstein J. Nanotechnol. 2013, 4, 588–602. [Google Scholar] [CrossRef] [PubMed] [Green Version]
- Yin, Y.; Lu, Y.; Gates, B.; Xia, Y. Template-assisted self-assembly: A practical route to complex aggregates of monodispersed colloids with well-defined sizes, shapes, and structures. J. Am. Chem. Soc. 2001, 123, 8718–8729. [Google Scholar] [CrossRef] [PubMed]
- Cheung, C.L.; Nikolić, R.J.; Reinhardt, C.E.; Wang, T.F. Fabrication of nanopillars by nanosphere lithography. Nanotechnology 2006, 17, 1339–1343. [Google Scholar] [CrossRef]
- Misbah, I.; Zhao, F.; Shih, W.-C. Symmetry Breaking-Induced Plasmonic Mode Splitting in Coupled Gold–Silver Alloy Nanodisk Array for Ultrasensitive RGB Colorimetric Biosensing. ACS Appl. Mater. Interfaces 2019, 11, 2273–2281. [Google Scholar] [CrossRef]
- Zhao, F.; Arnob, M.M.P.; Zenasni, O.; Li, J.; Shih, W.C. Far-field plasmonic coupling in 2-dimensional polycrystalline plasmonic arrays enables wide tunability with low-cost nanofabrication. Nanoscale Horiz. 2017, 2, 267–276. [Google Scholar] [CrossRef] [PubMed]
- Kasani, S.; Zheng, P.; Wu, N. Tailoring Optical Properties of a Large-Area Plasmonic Gold Nanoring Array Pattern. J. Phys. Chem. C 2018, 122, 13443–13449. [Google Scholar] [CrossRef]
- Larsson, E.M.; Alegret, J.; Kǎll, M.; Sutherland, D.S. Sensing characteristics of NIR localized surface plasmon resonances in gold nanorings for application as ultrasensitive biosensors. Nano Lett. 2007, 7, 1256–1263. [Google Scholar] [CrossRef]
- Zhu, S.; Li, H.; Yang, M.; Pang, S.W. Label-free detection of live cancer cells and DNA hybridization using 3D multilayered plasmonic biosensor. Nanotechnology 2018, 29, 365503. [Google Scholar] [CrossRef]
- Li, C.; Li, Z.; Li, S.; Zhang, Y.; Sun, B.; Yu, Y.; Ren, H.; Jiang, S.; Yue, W. LSPR optical fiber biosensor based on a 3D composite structure of gold nanoparticles and multilayer graphene films. Opt. Express 2020, 28, 6071. [Google Scholar] [CrossRef] [PubMed]
- Auguié, B.; Barnes, W.L. Collective Resonances in Gold Nanoparticle Arrays. Phys. Rev. Lett. 2008, 101, 143902. [Google Scholar] [CrossRef] [PubMed] [Green Version]
- Kravets, V.G.; Schedin, F.; Kabashin, A.V.; Grigorenko, A.N. Sensitivity of collective plasmon modes of gold nanoresonators to local environment. Opt. Lett. 2010, 35, 956. [Google Scholar] [CrossRef] [Green Version]
- Kravets, V.G.; Schedin, F.; Grigorenko, A.N. Extremely narrow plasmon resonances based on diffraction coupling of localized plasmons in arrays of metallic nanoparticles. Phys. Rev. Lett. 2008, 101, 087403. [Google Scholar] [CrossRef] [PubMed]
- Danilov, A.; Tselikov, G.; Wu, F.; Kravets, V.G.; Ozerov, I.; Bedu, F.; Grigorenko, A.N.; Kabashin, A.V. Ultra-narrow surface lattice resonances in plasmonic metamaterial arrays for biosensing applications. Biosens. Bioelectron. 2018, 104, 102–112. [Google Scholar] [CrossRef] [Green Version]
- Zou, S.; Janel, N.; Schatz, G.C. Silver nanoparticle array structures that produce remarkably narrow plasmon lineshapes. J. Chem. Phys. 2004, 120, 10871–10875. [Google Scholar] [CrossRef]
- Markel, V.A. Comment on “Silver nanoparticle array structures that produce remarkably narrow plasmon line shapes” [J. Chem. Phys. 120, 10871 (2004)]. J. Chem. Phys. 2005, 122, 097101. [Google Scholar] [CrossRef] [Green Version]
- Rodriguez, S.R.K.; Schaafsma, M.C.; Berrier, A.; Gmez Rivas, J. Collective resonances in plasmonic crystals: Size matters. Phys. B: Condens. Matter 2012, 407, 4081–4085. [Google Scholar] [CrossRef] [Green Version]
- Ponomareva, E.; Volk, K.; Mulvaney, P.; Karg, M. Surface Lattice Resonances in Self-Assembled Gold Nanoparticle Arrays: Impact of Lattice Period, Structural Disorder, and Refractive Index on Resonance Quality. Langmuir 2020, 36, 13601–13612. [Google Scholar] [CrossRef] [PubMed]
- Li, X.X.; Zhang, T.; Yu, J.; Xing, C.; Li, X.X.; Cai, W.; Li, Y. Highly Selective and Sensitive Detection of Hydrogen Sulfide by the Diffraction Peak of Periodic Au Nanoparticle Array with Silver Coating. ACS Appl. Mater. Interfaces 2020, 12, 40702–40710. [Google Scholar] [CrossRef]
- Zou, S.; Schatz, G.C. Narrow plasmonic/photonic extinction and scattering line shapes for one and two dimensional silver nanoparticle arrays. J. Chem. Phys. 2004, 121, 12606–12612. [Google Scholar] [CrossRef]
- Zou, S.; Schatz, G.C. Theoretical studies of plasmon resonances in one-dimensional nanoparticle chains: Narrow lineshapes with tunable widths. Nanotechnology 2006, 17, 2813–2820. [Google Scholar] [CrossRef]
- Wang, B.; Yu, P.; Wang, W.; Zhang, X.; Kuo, H.C.; Xu, H.; Wang, Z.M. High-Q Plasmonic Resonances: Fundamentals and Applications. Adv. Opt. Mater. 2021, 9, 2001520. [Google Scholar] [CrossRef]
- Li, R.; Bourgeois, M.R.; Cherqui, C.; Guan, J.; Wang, D.; Hu, J.; Schaller, R.D.; Schatz, G.C.; Odom, T.W. Hierarchical Hybridization in Plasmonic Honeycomb Lattices. Nano Lett. 2019, 19, 6435–6441. [Google Scholar] [CrossRef] [PubMed]
- Du, Y.; Shi, L.; Hong, M.; Li, H.; Li, D.; Liu, M. A surface plasmon resonance biosensor based on gold nanoparticle array. Opt. Commun. 2013, 298–299, 232–236. [Google Scholar] [CrossRef]
- Ahmed, T.; Paul, A.K.; Anower, M.S.; Razzak, S.M.A. Surface plasmon resonance biosensor based on hexagonal lattice dual-core photonic crystal fiber. Appl. Opt. 2019, 58, 8416. [Google Scholar] [CrossRef]
- Wu, T.; Shao, Y.; Wang, Y.; Cao, S.; Cao, W.; Zhang, F.; Liao, C.; He, J.; Huang, Y.; Hou, M.; et al. Surface plasmon resonance biosensor based on gold-coated side-polished hexagonal structure photonic crystal fiber. Opt. Express 2017, 25, 20313. [Google Scholar] [CrossRef] [Green Version]
- Li, Z.; Butun, S.; Aydin, K. Ultranarrow band absorbers based on surface lattice resonances in nanostructured metal surfaces. ACS Nano 2014, 8, 8242–8248. [Google Scholar] [CrossRef]
- Chang, C.C.; Chen, C.P.; Wu, T.H.; Yang, C.H.; Lin, C.W.; Chen, C.Y. Gold nanoparticle-based colorimetric strategies for chemical and biological sensing applications. Nanomaterials 2019, 9, 861. [Google Scholar] [CrossRef] [PubMed] [Green Version]
- Iarossi, M.; Schiattarella, C.; Rea, I.; De Stefano, L.; Fittipaldi, R.; Vecchione, A.; Velotta, R.; Ventura, B. Della Colorimetric Immunosensor by Aggregation of Photochemically Functionalized Gold Nanoparticles. ACS Omega 2018, 3, 3805–3812. [Google Scholar] [CrossRef]
- Della Ventura, B.; Banchelli, M.; Funari, R.; Illiano, A.; De Angelis, M.; Taroni, P.; Amoresano, A.; Matteini, P.; Velotta, R. Biosensor surface functionalization by a simple photochemical immobilization of antibodies: Experimental characterization by mass spectrometry and surface enhanced Raman spectroscopy. Analyst 2019, 144, 6871–6880. [Google Scholar] [CrossRef]
- Funari, R.; Della Ventura, B.; Altucci, C.; Offenhäusser, A.; Mayer, D.; Velotta, R. Single Molecule Characterization of UV-Activated Antibodies on Gold by Atomic Force Microscopy. Langmuir 2016, 32, 8084–8091. [Google Scholar] [CrossRef]
- Oliverio, M.; Perotto, S.; Messina, G.C.; Lovato, L.; De Angelis, F. Chemical Functionalization of Plasmonic Surface Biosensors: A Tutorial Review on Issues, Strategies, and Costs. ACS Appl. Mater. Interfaces 2017, 9, 29394–29411. [Google Scholar] [CrossRef] [Green Version]
- Minopoli, A.; Sakač, N.; Lenyk, B.; Campanile, R.; Mayer, D.; Offenhäusser, A.; Velotta, R.; Della Ventura, B. LSPR-based colorimetric immunosensor for rapid and sensitive 17β-estradiol detection in tap water. Sens. Actuators B Chem. 2020, 308, 127699. [Google Scholar] [CrossRef]
- Habib, P.; Dreymueller, D.; Rösing, B.; Botung, H.; Slowik, A.; Zendedel, A.; Habib, S.; Hoffmann, S.; Beyer, C. Estrogen serum concentration affects blood immune cell composition and polarization in human females under controlled ovarian stimulation. J. Steroid Biochem. Mol. Biol. 2018, 178, 340–347. [Google Scholar] [CrossRef]
- Tian, J.-M.; Ran, B.; Zhang, C.-L.; Yan, D.-M.; LI, X.-H. Estrogen and progesterone promote breast cancer cell proliferation by inducing cyclin G1 expression. Braz. J. Med. Biol. Res. 2018, 51, 1–7. [Google Scholar] [CrossRef] [PubMed] [Green Version]
- Kidd, K.A.; Blanchfield, P.J.; Mills, K.H.; Palace, V.P.; Evans, R.E.; Lazorchak, J.M.; Flick, R.W. Collapse of a fish population after exposure to a synthetic estrogen. Proc. Natl. Acad. Sci. USA 2007, 104, 8897–8901. [Google Scholar] [CrossRef] [PubMed] [Green Version]
- Ventura, B.D.; Cennamo, M.; Minopoli, A.; Campanile, R.; Censi, S.B.; Terracciano, D.; Portella, G.; Velotta, R. Colorimetric Test for Fast Detection of SARS-CoV-2 in Nasal and Throat Swabs. ACS Sens. 2020, 5, 3043–3048. [Google Scholar] [CrossRef]
- Minopoli, A.; Scardapane, E.; Acunzo, A.; Campanile, R.; Della Ventura, B.; Velotta, R. Analysis of the optical response of a SARS-CoV-2-directed colorimetric immunosensor. AIP Adv. 2021, 11, 065319. [Google Scholar] [CrossRef]
- Liu, Y.; Zhang, L.; Wei, W.; Zhao, H.; Zhou, Z.; Zhang, Y.; Liu, S. Colorimetric detection of influenza A virus using antibody-functionalized gold nanoparticles. Analyst 2015, 140, 3989–3995. [Google Scholar] [CrossRef]
- Bosak, A.; Saraf, N.; Willenberg, A.; Kwan, M.W.C.; Alto, B.W.; Jackson, G.W.; Batchelor, R.H.; Nguyen-Huu, T.D.; Sankarapani, V.; Parks, G.D.; et al. Aptamer-gold nanoparticle conjugates for the colorimetric detection of arboviruses and vector mosquito species. RSC Adv. 2019, 9, 23752–23763. [Google Scholar] [CrossRef] [Green Version]
- Wu, H.; Huo, D.; Jiang, H.; Dong, L.; Ma, Y.; Hou, C.; Fa, H.; Yang, M.; Luo, X.; Li, J.; et al. Highly Selective and Sensitive Colorimetric Sensor for Aminotriazole Residues in Vegetables and Fruits Using Glutathione Functionalized Gold Nanoparticles. J. Nanosci. Nanotechnol. 2017, 17, 4733–4739. [Google Scholar] [CrossRef]
- Yang, J.; Han, Y.; Zhang, R.; Zhang, R.; Li, J. Comparison of analytical sensitivity of SARS-CoV-2 molecular detection kits. Int. J. Infect. Dis. 2021, 111, 233–241. [Google Scholar] [CrossRef]
- Komiazyk, M.; Walory, J.; Kozinska, A.; Wasko, I.; Baraniak, A. Impact of the nucleic acid extraction method and the RT-qPCR assay on SARS-CoV-2 detection in low-viral samples. Diagnostics 2021, 11, 2247. [Google Scholar] [CrossRef] [PubMed]
- Pramanik, A.; Gao, Y.; Patibandla, S.; Mitra, D.; McCandless, M.G.; Fassero, L.A.; Gates, K.; Tandon, R.; Chandra Ray, P. The rapid diagnosis and effective inhibition of coronavirus using spike antibody attached gold nanoparticles. Nanoscale Adv. 2021, 3, 1588–1596. [Google Scholar] [CrossRef] [PubMed]
- Sato, K.; Hosokawa, K.; Maeda, M. Rapid aggregation of gold nanoparticles induced by non-cross-linking DNA hybridization. J. Am. Chem. Soc. 2003, 125, 8102–8103. [Google Scholar] [CrossRef]
- Wang, G.; Akiyama, Y.; Takarada, T.; Maeda, M. Rapid Non-Crosslinking Aggregation of DNA-Functionalized Gold Nanorods and Nanotriangles for Colorimetric Single-Nucleotide Discrimination. Chem. A Eur. J. 2016, 22, 258–263. [Google Scholar] [CrossRef] [PubMed]
- Deng, J.; Jiang, Q.; Wang, Y.; Yang, L.; Yu, P.; Mao, L. Real-time colorimetric assay of inorganic pyrophosphatase activity based on reversibly competitive coordination of Cu2+ between cysteine and pyrophosphate ion. Anal. Chem. 2013, 85, 9409–9415. [Google Scholar] [CrossRef] [PubMed]
- Lu, L.; Xia, Y. Enzymatic Reaction Modulated Gold Nanorod End-to-End Self-Assembly for Ultrahigh Sensitively Colorimetric Sensing of Cholinesterase and Organophosphate Pesticides in Human Blood. Anal. Chem. 2015, 87, 8584–8591. [Google Scholar] [CrossRef]
- Kim, N.W.; Piatyszek, M.A.; Prowse, K.R.; Harley, C.B.; West, M.D.; Ho, P.L.C.; Coviello, G.M.; Wright, W.E.; Weinrich, S.L.; Shay, J.W. Specific association of human telomerase activity with immortal cells and cancer. Science 1994, 266, 2011–2015. [Google Scholar] [CrossRef]
- Shay, J.W.; Wright, W.E. Telomerase: A target for cancer therapeutics. Cancer Cell 2002, 2, 257–265. [Google Scholar] [CrossRef] [Green Version]
- Wang, J.; Wu, L.; Ren, J.; Qu, X. Visualizing human telomerase activity with primer-modified Au nanoparticles. Small 2012, 8, 259–264. [Google Scholar] [CrossRef] [PubMed]
- Wang, J.; Wu, L.; Ren, J.; Qu, X. Visual detection of telomerase activity with a tunable dynamic range by using a gold nanoparticle probe-based hybridization protection strategy. Nanoscale 2014, 6, 1661–1666. [Google Scholar] [CrossRef] [PubMed]
- Zhang, L.; Zhang, S.; Pan, W.; Liang, Q.; Song, X. Exonuclease I manipulating primer-modified gold nanoparticles for colorimetric telomerase activity assay. Biosens. Bioelectron. 2016, 77, 144–148. [Google Scholar] [CrossRef] [PubMed]
- Aldewachi, H.S.; Woodroofe, N.; Turega, S.; Gardiner, P.H.E. Optimization of gold nanoparticle-based real-time colorimetric assay of dipeptidyl peptidase IV activity. Talanta 2017, 169, 13–19. [Google Scholar] [CrossRef] [PubMed]
- Kim, C.J.; Lee, D.I.; Kim, C.; Lee, K.; Lee, C.H.; Ahn, I.S. Gold nanoparticles-based colorimetric assay for cathepsin B activity and the efficiency of its inhibitors. Anal. Chem. 2014, 86, 3825–3833. [Google Scholar] [CrossRef] [PubMed]
- Moitra, P.; Alafeef, M.; Alafeef, M.; Alafeef, M.; Dighe, K.; Frieman, M.B.; Pan, D.; Pan, D.; Pan, D. Selective Naked-Eye Detection of SARS-CoV-2 Mediated by N Gene Targeted Antisense Oligonucleotide Capped Plasmonic Nanoparticles. ACS Nano 2020, 14, 7617–7627. [Google Scholar] [CrossRef]
- Cheraghi Shahi, S.; Dadmehr, M.; Korouzhdehi, B.; Tavassoli, A. A novel colorimetric biosensor for sensitive detection of aflatoxin mediated by bacterial enzymatic reaction in saffron samples. Nanotechnology 2021, 32, 505503. [Google Scholar] [CrossRef] [PubMed]
- Chen, P.; Selegård, R.; Aili, D.; Liedberg, B. Peptide functionalized gold nanoparticles for colorimetric detection of matrilysin (MMP-7) activity. Nanoscale 2013, 5, 8973–8976. [Google Scholar] [CrossRef]
- Nossier, A.I.; Mohammed, O.S.; Fakhr El-deen, R.R.; Zaghloul, A.S.; Eissa, S. Gelatin-modified gold nanoparticles for direct detection of urinary total gelatinase activity: Diagnostic value in bladder cancer. Talanta 2016, 161, 511–519. [Google Scholar] [CrossRef] [PubMed]
- Zeng, Z.; Mizukami, S.; Kikuchi, K. Simple and real-time colorimetric assay for glycosidases activity using functionalized gold nanoparticles and its application for inhibitor screening. Anal. Chem. 2012, 84, 9089–9095. [Google Scholar] [CrossRef] [PubMed]
- Zhang, W.; Tang, Y.; Liu, J.; Jiang, L.; Huang, W.; Huo, F.W.; Tian, D. Colorimetric assay for heterogeneous-catalyzed lipase activity: Enzyme-regulated gold nanoparticle aggregation. J. Agric. Food Chem. 2015, 63, 39–42. [Google Scholar] [CrossRef] [PubMed]
- Ma, X.; Kou, X.; Xu, Y.; Yang, D.; Miao, P. Colorimetric sensing strategy for heparin assay based on PDDA-induced aggregation of gold nanoparticles. Nanoscale Adv. 2019, 1, 486–489. [Google Scholar] [CrossRef] [Green Version]
- Liu, J.; Bai, W.; Niu, S.; Zhu, C.; Yang, S.; Chen, A. Highly sensitive colorimetric detection of 17β-estradiol using split DNA aptamers immobilized on unmodified gold nanoparticles. Sci. Rep. 2014, 4, 7571. [Google Scholar] [CrossRef] [PubMed]
- Chang, H.S.; Choo, K.H.; Lee, B.; Choi, S.J. The methods of identification, analysis, and removal of endocrine disrupting compounds (EDCs) in water. J. Hazard. Mater. 2009, 172, 1–12. [Google Scholar] [CrossRef] [PubMed]
- Kim, Y.S.; Jung, H.S.; Matsuura, T.; Lee, H.Y.; Kawai, T.; Gu, M.B. Electrochemical detection of 17β-estradiol using DNA aptamer immobilized gold electrode chip. Biosens. Bioelectron. 2007, 22, 2525–2531. [Google Scholar] [CrossRef]
- Alsager, O.A.; Kumar, S.; Zhu, B.; Travas-Sejdic, J.; McNatty, K.P.; Hodgkiss, J.M. Ultrasensitive colorimetric detection of 17-estradiol: The effect of shortening dna aptamer sequences. Anal. Chem. 2015, 87, 4201–4209. [Google Scholar] [CrossRef] [PubMed]
- Qiao, L.; Wang, H.; He, J.; Yang, S.; Chen, A. Truncated affinity-improved aptamers for 17β-estradiol determination by AuNPs-based colorimetric aptasensor. Food Chem. 2021, 340, 128181. [Google Scholar] [CrossRef] [PubMed]
- Li, C.M.; Zhen, S.J.; Wang, J.; Li, Y.F.; Huang, C.Z. A gold nanoparticles-based colorimetric assay for alkaline phosphatase detection with tunable dynamic range. Biosens. Bioelectron. 2013, 43, 366–371. [Google Scholar] [CrossRef]
- Pan, Y.; Guo, M.; Nie, Z.; Huang, Y.; Peng, Y.; Liu, A.; Qing, M.; Yao, S. Colorimetric detection of apoptosis based on caspase-3 activity assay using unmodified gold nanoparticles. Chem. Commun. 2012, 48, 997–999. [Google Scholar] [CrossRef]
- He, Y.; Cheng, F.; Pang, D.-W.; Tang, H.-W. Colorimetric and visual determination of DNase I activity using gold nanoparticles as an indicator. Microchim. Acta 2017, 184, 101–106. [Google Scholar] [CrossRef]
- Zhang, L.; Zhao, J.; Jiang, J.; Yu, R. Enzyme-regulated unmodified gold nanoparticle aggregation: A label free colorimetric assay for rapid and sensitive detection of adenosine deaminase activity and inhibition. Chem. Commun. 2012, 48, 10996–10998. [Google Scholar] [CrossRef] [PubMed]
- Cheng, F.; He, Y.; Xing, X.J.; Tan, D.D.; Lin, Y.; Pang, D.W.; Tang, H.W. A gold nanoparticle-based label free colorimetric aptasensor for adenosine deaminase detection and inhibition assay. Analyst 2015, 140, 1572–1577. [Google Scholar] [CrossRef] [PubMed]
- Zhang, Z.; Wang, H.; Chen, Z.; Wang, X.; Choo, J.; Chen, L. Plasmonic colorimetric sensors based on etching and growth of noble metal nanoparticles: Strategies and applications. Biosens. Bioelectron. 2018, 114, 52–65. [Google Scholar] [CrossRef] [PubMed]
- Liu, J.M.; Jiao, L.; Cui, M.L.; Lin, L.P.; Wang, X.X.; Zheng, Z.Y.; Zhang, L.H.; Jiang, S.L. A highly sensitive non-aggregation colorimetric sensor for the determination of I- based on its catalytic effect on Fe3+ etching gold nanorods. Sens. Actuators B Chem. 2013, 188, 644–650. [Google Scholar] [CrossRef]
- Liu, J.M.; Wang, X.X.; Cui, M.L.; Lin, L.P.; Jiang, S.L.; Jiao, L.; Zhang, L.H. A promising non-aggregation colorimetric sensor of AuNRs-Ag+ for determination of dopamine. Sens. Actuators B Chem. 2013, 176, 97–102. [Google Scholar] [CrossRef]
- Zhang, Z.; Chen, Z.; Qu, C.; Chen, L. Highly sensitive visual detection of copper ions based on the shape-dependent LSPR spectroscopy of gold nanorods. Langmuir 2014, 30, 3625–3630. [Google Scholar] [CrossRef] [PubMed] [Green Version]
- Wei, H.; Wang, E. Nanomaterials with enzyme-like characteristics (nanozymes): Next-generation artificial enzymes. Chem. Soc. Rev. 2013, 42, 6060–6093. [Google Scholar] [CrossRef] [PubMed]
- Jiang, D.; Ni, D.; Rosenkrans, Z.T.; Huang, P.; Yan, X.; Cai, W. Nanozyme: New horizons for responsive biomedical applications. Chem. Soc. Rev. 2019, 48, 3683–3704. [Google Scholar] [CrossRef] [PubMed]
- Liu, X.; Huang, D.; Lai, C.; Qin, L.; Zeng, G.; Xu, P.; Li, B.; Yi, H.; Zhang, M. Peroxidase-Like Activity of Smart Nanomaterials and Their Advanced Application in Colorimetric Glucose Biosensors. Small 2019, 15, 1900133. [Google Scholar] [CrossRef]
- Wu, J.; Wang, X.; Wang, Q.; Lou, Z.; Li, S.; Zhu, Y.; Qin, L.; Wei, H. Nanomaterials with enzyme-like characteristics (nanozymes): Next-generation artificial enzymes (II). Chem. Soc. Rev. 2019, 48, 1004–1076. [Google Scholar] [CrossRef] [PubMed]
- Gao, L.; Zhuang, J.; Nie, L.; Zhang, J.; Zhang, Y.; Gu, N.; Wang, T.; Feng, J.; Yang, D.; Perrett, S.; et al. Intrinsic peroxidase-like activity of ferromagnetic nanoparticles. Nat. Nanotechnol. 2007, 2, 577–583. [Google Scholar] [CrossRef]
- Lu, C.; Liu, X.; Li, Y.; Yu, F.; Tang, L.; Hu, Y.; Ying, Y. Multifunctional Janus Hematite-Silica Nanoparticles: Mimicking Peroxidase-Like Activity and Sensitive Colorimetric Detection of Glucose. ACS Appl. Mater. Interfaces 2015, 7, 15395–15402. [Google Scholar] [CrossRef] [PubMed]
- Ding, C.; Yan, Y.; Xiang, D.; Zhang, C.; Xian, Y. Magnetic Fe3S4 nanoparticles with peroxidase-like activity, and their use in a photometric enzymatic glucose assay. Microchim. Acta 2016, 183, 625–631. [Google Scholar] [CrossRef]
- Zhang, H.; Han, L.; Li, F. A universal one-pot assay strategy based on bio-inorganic cascade catalysts for different analytes by changing pH-dependent activity of enzymes on enzyme mimics. Sens. Actuators B Chem. 2019, 286, 460–467. [Google Scholar] [CrossRef]
- Han, L.; Liu, P.; Zhang, H.; Li, F.; Liu, A. Phage capsid protein-directed MnO 2 nanosheets with peroxidase-like activity for spectrometric biosensing and evaluation of antioxidant behaviour. Chem. Commun. 2017, 53, 5216–5219. [Google Scholar] [CrossRef]
- Liang, M.; Yan, X. Nanozymes: From New Concepts, Mechanisms, and Standards to Applications. Acc. Chem. Res. 2019, 52, 2190–2200. [Google Scholar] [CrossRef] [PubMed]
- Liu, Y.; Zhou, M.; Cao, W.; Wang, X.; Wang, Q.; Li, S.; Wei, H. Light-Responsive Metal-Organic Framework as an Oxidase Mimic for Cellular Glutathione Detection. Anal. Chem. 2019, 91, 8170–8175. [Google Scholar] [CrossRef] [PubMed]
- Zhao, L.; Wang, J.; Su, D.; Zhang, Y.; Lu, H.; Yan, X.; Bai, J.; Gao, Y.; Lu, G. The DNA controllable peroxidase mimetic activity of MoS2nanosheets for constructing a robust colorimetric biosensor. Nanoscale 2020, 12, 19420–19428. [Google Scholar] [CrossRef] [PubMed]
- Rashtbari, S.; Dehghan, G.; Amini, M. An ultrasensitive label-free colorimetric biosensor for the detection of glucose based on glucose oxidase-like activity of nanolayered manganese-calcium oxide. Anal. Chim. Acta 2020, 1110, 98–108. [Google Scholar] [CrossRef] [PubMed]
- Wu, T.; Ma, Z.; Li, P.; Lu, Q.; Liu, M.; Li, H.; Zhang, Y.; Yao, S. Bifunctional colorimetric biosensors via regulation of the dual nanoenzyme activity of carbonized FeCo-ZIF. Sens. Actuators B Chem. 2019, 290, 357–363. [Google Scholar] [CrossRef]
- Ren, H.; Liu, X.; Yan, L.; Cai, Y.; Liu, C.; Zeng, L.; Liu, A. Ocean green tide derived hierarchical porous carbon with bi-enzyme mimic activities and their application for sensitive colorimetric and fluorescent biosensing. Sens. Actuators B Chem. 2020, 312, 127979. [Google Scholar] [CrossRef]
- Wu, C.W.; Unnikrishnan, B.; Tseng, Y.T.; Wei, S.C.; Chang, H.T.; Huang, C.C. Mesoporous manganese oxide/manganese ferrite nanopopcorns with dual enzyme mimic activities: A cascade reaction for selective detection of ketoses. J. Colloid Interface Sci. 2019, 541, 75–85. [Google Scholar] [CrossRef] [PubMed]
- Singh, N.; Savanur, M.A.; Srivastava, S.; D’Silva, P.; Mugesh, G. A Redox Modulatory Mn 3 O 4 Nanozyme with Multi-Enzyme Activity Provides Efficient Cytoprotection to Human Cells in a Parkinson’s Disease Model. Angew. Chemie Int. Ed. 2017, 56, 14267–14271. [Google Scholar] [CrossRef] [PubMed]
- He, S.-B.; Chen, R.-T.; Wu, Y.-Y.; Wu, G.-W.; Peng, H.-P.; Liu, A.-L.; Deng, H.-H.; Xia, X.-H.; Chen, W. Improved enzymatic assay for hydrogen peroxide and glucose by exploiting the enzyme-mimicking properties of BSA-coated platinum nanoparticles. Microchim. Acta 2019, 186, 778. [Google Scholar] [CrossRef]
- Bhagat, S.; Srikanth Vallabani, N.V.; Shutthanandan, V.; Bowden, M.; Karakoti, A.S.; Singh, S. Gold core/ceria shell-based redox active nanozyme mimicking the biological multienzyme complex phenomenon. J. Colloid Interface Sci. 2018, 513, 831–842. [Google Scholar] [CrossRef]
- Zhao, L.; Wu, Z.; Liu, G.; Lu, H.; Gao, Y.; Liu, F.; Wang, C.; Cui, J.; Lu, G. High-Activity Mo, S co-doped carbon quantum dot nanozyme-based cascade colorimetric biosensor for sensitive detection of cholesterol. J. Mater. Chem. B 2019, 7, 7042–7051. [Google Scholar] [CrossRef] [PubMed]
- Liu, X.; Yan, L.; Ren, H.; Cai, Y.; Liu, C.; Zeng, L.; Gao, J.; Liu, A. Facile synthesis of magnetic hierarchical flower-like Co3O4 spheres: Mechanism, excellent tetra-enzyme mimics and their colorimetric biosensing applications. Biosens. Bioelectron. 2020, 165, 112342. [Google Scholar] [CrossRef]
- Ferhan, A.R.; Guo, L.; Zhou, X.; Chen, P.; Hong, S.; Kim, D.H. Solid-phase colorimetric sensor based on gold nanoparticle-loaded polymer brushes: Lead detection as a case study. Anal. Chem. 2013, 85, 4094–4099. [Google Scholar] [CrossRef]
- Chen, Y.Y.; Chang, H.T.; Shiang, Y.C.; Hung, Y.L.; Chiang, C.K.; Huang, C.C. Colorimetric assay for lead ions based on the leaching of gold nanoparticles. Anal. Chem. 2009, 81, 9433–9439. [Google Scholar] [CrossRef]
- Lee, Y.F.; Huang, C.C. Colorimetric assay of lead ions in biological samples using a nanogold-based membrane. ACS Appl. Mater. Interfaces 2011, 3, 2747–2754. [Google Scholar] [CrossRef]
- Xia, Y.; Ye, J.; Tan, K.; Wang, J.; Yang, G. Colorimetric visualization of glucose at the submicromole level in serum by a homogenous silver nanoprism-glucose oxidase system. Anal. Chem. 2013, 85, 6241–6247. [Google Scholar] [CrossRef] [PubMed]
- Zhang, Z.; Chen, Z.; Cheng, F.; Zhang, Y.; Chen, L. Highly sensitive on-site detection of glucose in human urine with naked eye based on enzymatic-like reaction mediated etching of gold nanorods. Biosens. Bioelectron. 2017, 89, 932–936. [Google Scholar] [CrossRef] [PubMed]
- Zhang, Z.; Chen, Z.; Chen, L. Ultrasensitive Visual Sensing of Molybdate Based on Enzymatic-like Etching of Gold Nanorods. Langmuir 2015, 31, 9253–9259. [Google Scholar] [CrossRef] [PubMed]
- Zhang, Y.; Jiao, J.; Wei, Y.; Wang, D.; Yang, C.; Xu, Z. Plasmonic Colorimetric Biosensor for Sensitive Exosome Detection via Enzyme-Induced Etching of Gold Nanobipyramid@MnO 2 Nanosheet Nanostructures. Anal. Chem. 2020, 92, 15244–15252. [Google Scholar] [CrossRef] [PubMed]
- Li, X.B.; Zhang, Z.R.; Schluesener, H.J.; Xu, S.Q. Role of exosomes in immune regulation. J. Cell. Mol. Med. 2006, 10, 364–375. [Google Scholar] [CrossRef]
- Park, J.E.; Tan, H.S.; Datta, A.; Lai, R.C.; Zhang, H.; Meng, W.; Lim, S.K.; Sze, S.K. Hypoxic tumor cell modulates its microenvironment to enhance angiogenic and metastatic potential by secretion of proteins and exosomes. Mol. Cell. Proteom. 2010, 9, 1085–1099. [Google Scholar] [CrossRef] [Green Version]
- Hough, K.P.; Chanda, D.; Duncan, S.R.; Thannickal, V.J.; Deshane, J.S. Exosomes in immunoregulation of chronic lung diseases. Allergy Eur. J. Allergy Clin. Immunol. 2017, 72, 534–544. [Google Scholar] [CrossRef]
- Tao, Z.; Gao, P.; Hoffman, D.W.; Liu, H.W. Domain C of human poly(ADP-ribose) polymerase-1 is important for enzyme activity and contains a novel zinc-ribbon motif. Biochemistry 2008, 47, 5804–5813. [Google Scholar] [CrossRef] [PubMed]
- Liu, Y.; Xu, E.; Xu, C.; Wei, W. Colorimetric method for PARP-1 detection based on preventing AuNRs from etching by molybdate. Sens. Actuators B Chem. 2020, 325, 128806. [Google Scholar] [CrossRef]
- Liang, J.; Yao, C.; Li, X.; Wu, Z.; Huang, C.; Fu, Q.; Lan, C.; Cao, D.; Tang, Y. Silver nanoprism etching-based plasmonic ELISA for the high sensitive detection of prostate-specific antigen. Biosens. Bioelectron. 2015, 69, 128–134. [Google Scholar] [CrossRef] [PubMed]
- Lee, H.C.; Chen, T.H.; Tseng, W.L.; Lin, C.H. Novel core etching technique of gold nanoparticles for colorimetric dopamine detection. Analyst 2012, 137, 5352–5357. [Google Scholar] [CrossRef] [PubMed]
- Ma, X.; Lin, Y.; Guo, L.; Qiu, B.; Chen, G.; Yang, H.H.; Lin, Z. A universal multicolor immunosensor for semiquantitative visual detection of biomarkers with the naked eyes. Biosens. Bioelectron. 2017, 87, 122–128. [Google Scholar] [CrossRef] [PubMed]
- Wang, Y.; Zhang, P.; Mao, X.; Fu, W.; Liu, C. Seed-mediated growth of bimetallic nanoparticles as an effective strategy for sensitive detection of Vitamin C. Sens. Actuators B Chem. 2016, 231, 95–101. [Google Scholar] [CrossRef]
- Lin, T.; Li, Z.; Song, Z.; Chen, H.; Guo, L.; Fu, F.; Wu, Z. Visual and colorimetric detection of p-aminophenol in environmental water and human urine samples based on anisotropic growth of Ag nanoshells on Au nanorods. Talanta 2016, 148, 62–68. [Google Scholar] [CrossRef] [PubMed]
- Shaban, S.M.; Moon, B.S.; Kim, D.H. Selective and sensitive colorimetric detection of p-aminophenol in human urine and paracetamol drugs based on seed-mediated growth of silver nanoparticles. Environ. Technol. Innov. 2021, 22, 101517. [Google Scholar] [CrossRef]
- Wang, Y.; Zeng, Y.; Fu, W.; Zhang, P.; Li, L.; Ye, C.; Yu, L.; Zhu, X.; Zhao, S. Seed-mediated growth of Au@Ag core-shell nanorods for the detection of ellagic acid in whitening cosmetics. Anal. Chim. Acta 2018, 1002, 97–104. [Google Scholar] [CrossRef] [PubMed]
- Chen, J.; Jackson, A.A.; Rotello, V.M.; Nugen, S.R. Colorimetric Detection of Escherichia coli Based on the Enzyme-Induced Metallization of Gold Nanorods. Small 2016, 12, 2469–2475. [Google Scholar] [CrossRef] [PubMed] [Green Version]
- Liu, D.; Yang, J.; Wang, H.F.; Wang, Z.; Huang, X.; Wang, Z.; Niu, G.; Hight Walker, A.R.; Chen, X. Glucose oxidase-catalyzed growth of gold nanoparticles enables quantitative detection of attomolar cancer biomarkers. Anal. Chem. 2014, 86, 5800–5806. [Google Scholar] [CrossRef] [PubMed]
- Xu, S.; Ouyang, W.; Xie, P.; Lin, Y.; Qiu, B.; Lin, Z.; Chen, G.; Guo, L. Highly Uniform Gold Nanobipyramids for Ultrasensitive Colorimetric Detection of Influenza Virus. Anal. Chem. 2017, 89, 1617–1623. [Google Scholar] [CrossRef] [PubMed]
- Wang, Z.; Zhang, J.; Ekman, J.M.; Kenis, P.J.A.; Lu, Y. DNA-mediated control of metal nanoparticle shape: One-pot synthesis and cellular uptake of highly stable and functional gold nanoflowers. Nano Lett. 2010, 10, 1886–1891. [Google Scholar] [CrossRef]
- Soh, J.H.; Lin, Y.; Rana, S.; Ying, J.Y.; Stevens, M.M. Colorimetric Detection of Small Molecules in Complex Matrixes via Target-Mediated Growth of Aptamer-Functionalized Gold Nanoparticles. Anal. Chem. 2015, 87, 7644–7652. [Google Scholar] [CrossRef] [PubMed]
Scheme 1.
Classification of on-platform-based and colloid-based (aggregation-based and non-aggregation-based) plasmonic colorimetric biosensors. The illustration for on-platform biosensors was adapted from Ref. [12]. Copyright (2021) The Authors. Advanced Materials Interfaces published by Wiley-VCH GmbH. This article is distributed under a Creative Commons Attribution (CC-BY) license. The illustration for nanozyme biosensors was adapted from [34] Copyright (2019), with permission from Elsevier B.V. The illustration for etching-based biosensors was adapted from Ref. [35] Copyright (2019), with permission from Elsevier B.V.

Figure 2.
(a) Schematic of membrane-integrated device used for the detection of NS1 dengue antigen in human whole blood; calibration curve. Adapted from Ref. [48] Copyright (2019), with permission from Elsevier B.V. (b) Perspective and cross-sectional views of the device architecture (scale bar: 40 nm); LSPR wavelength shifts and drain-source current of the MoS2 channel (when Vdrain-source = 1.0 V) as functions of the bulk RI; calibration curves for CitH3. Adapted from Ref. [49] Copyright (2019), with permission from Wiley-VCH. (c) SEM image of the Au nanocup array onto PDMS; scheme used for Anti-Human IgG detection; simulated relationship between reflectance minima and RI; experimental reflectance response after Human IgG functionalization and Anti-Human IgG detection. Adapted from Ref. [50] Copyright (2017), Springer Nature. This article is distributed under a Creative Commons Attribution (CC-BY) license.

Figure 4.
(a) Schematic representation of the plasmon hybridization model. (b) Sketch of the near-field coupling among two neighbouring nanoparticles in a two-dimensional hexagonal lattice. (c) Schematic illustration of the electric field enhancement in the case of LSPR mode and c-LSPR mode for a homodimer configuration. Adapted from Ref. [12]. Copyright (2021) The Authors. Advanced Materials Interfaces published by Wiley-VCH GmbH. This article is distributed under a Creative Commons Attribution (CC-BY) license.

Figure 7.
(a) Schematic representation of far-field coupling among two nanoparticles in a two-dimensional rectangular lattice. Adapted from Ref. [12]. Copyright (2021) The Authors. Advanced Materials Interfaces published by Wiley-VCH GmbH. This article is distributed under a Creative Commons Attribution (CC-BY) license. (b) Simulated transmission spectrum of a periodic linear chain of AuNPs whose lattice constant is comparable to the wavelength of the incident perturbation. Adapted from Ref. [29] Copyright (2018), with permission from American Chemical Society.

Figure 9.
Detection scheme of a colorimetric immunosensor based on a colloidal solution of antibody-functionalized nanoparticles. (a) No optical change is measured if the analytes are not recognized by functionalized nanoparticles. (b) Small analytes act as linkers due to multiple binding sites allowing the functionalized nanoparticles to aggregate. (c) Large analytes are surrounded by functionalized nanoparticles promoting their plasmon coupling.

Figure 11.
(a) Scheme of IAV detection by anti-hemagglutinin f-AuNPs; TEM images of AuNPs (in black) around IAV; absorption spectra of AuNPs colloidal solutions with IAV concentrations in the range of 0–400 HAU (see inset for solution colour changes); calibration curve with inset showing the LR. Adapted from Ref. [111] Copyright (2015), with permission from The Royal Society of Chemistry. (b) Detection scheme for ZIKV-E and salivary proteins of vector mosquitos Aedes aegypti and albopictus by aptamer-conjugated AuNPs; photograph showing visual colour changes of AuNPs conjugated with different concentrations of aptamers when ZIKV-E concentrations lied in the range of 0.4–100 nM; photograph showing the degree of precipitation induced by different amounts of ZIKV at three time points. Adapted from Ref. [112] Copyright (2019) The Royal Society of Chemistry. This article is distributed under a Creative Commons Attribution (CC-BY-NC) license.

Figure 12.
Example of colloidal behaviours exhibited by DNA-modified nanostructures in a medium of high ionic strength. While single-stranded, mismatched and overhang DNA increase electrostatic and steric repulsion and, hence, sustain a colloidal dispersion state, fully matched DNA entail the aggregation of ligand-modified nanostructures. Reproduced from Ref. [118] Copyright (2016), with permission from Wiley-VCH Verlag GmbH & Co. KGaA, Weinheim.

Figure 13.
(a) Schematic representation of the detection mechanisms for PPase activity and NaF inhibition efficiency; kinetic plots of A650/A522 values and initial rate of enzymatic reaction (v0) as a function of PPase activity (the inset shows the visual colour change of the suspension); absorption spectra and kinetic plots of A650/A522 as a function of the NaF concentration (the inset shows the visual colour change of the suspension). Adapted from Ref. [119] Copyright (2013), with permission from American Chemical Society. (b) Scheme of the end-to-end self-assembly mechanism (the insets show SEM micrographs of synthesised AuNRs and their branch patterning after analyte addition); absorption spectra and calibration curve as a function of cholinesterase (ChE) concentration; absorption spectra and calibration curve as a function of parathion concentration. Adapted from Ref. [120] Copyright (2015), with permission from American Chemical Society.

Figure 14.
(a) Schematic illustration of the detection mechanism for telomerase activity by using TS-modified AuNPs; visual colour change of the solution from blue to purple and corresponding absorption spectra; Calibration curve (A520/A650 vs. number of HeLa cells) for the telomerase activity (the inset shows the LR). Reproduced from Ref. [123] Copyright (2012), with permission from Wiley-VCH Verlag GmbH & Co. KGaA, Weinheim. (b) Schematic illustration of the detection mechanism for telomerase activity by using TC-modified AuNPs; ratiometric response A520/A680 as a function of the number of HeLa cells from which telomerase was extracted (the insets show the visual colour change from blue to purple and the LR range); inhibition of telomerase activity by using curcumin (the inset shows the visual colour change of the solution from red to blue). Adapted from Ref. [124] Copyright (2014), with permission from The Royal Society of Chemistry. (c) Schematic illustration of the detection mechanism for telomerase activity by using TP-modified AuNPs; ratiometric response A520/A680 as a function of the number of HL-60 cells from which telomerase was extracted (the inset shows the visual colour difference between a control sample and a positive sample); Calibration curve (A520/A680 vs. number of HL-60 cells). Adapted from Ref. [125] Copyright (2015), with permission from Elsevier B.V.

Figure 15.
Schematic representation of destabilization-induced aggregation method for measuring enzymatic activity. The aggregation of peptide-capped nanoparticles is induced by cleaving the capping peptides thereby reducing the electrosteric stabilization.
Figure 15.
Schematic representation of destabilization-induced aggregation method for measuring enzymatic activity. The aggregation of peptide-capped nanoparticles is induced by cleaving the capping peptides thereby reducing the electrosteric stabilization.

Figure 16.
(a) Detection mechanism of DPP-IV by using GPDC- or VPED-DC-capped AuNPs; absorption spectra and calibration curve as a function of DPP-IV activity (referred to GPDC-capped AuNPs) (the inset shows the visual change from red to purple). Adapted from Ref. [126] Copyright (2017), with permission from Elsevier B.V. (b) Scheme of the working principle for the detection of cathepsin B; absorption spectra at different cathepsin B concentrations acquired after 2 h reaction time (the inset depicts the visual colour change of the solution); evaluation of inhibition efficiencies of leupeptin, antipain, chymostatin. Adapted from Ref. [127] Copyright (2014), with permission from American Chemical Society. (c) Schematic illustration of naked-eye detection mechanism of SARS-CoV-2 RNA mediated by ASO-modified AuNPs; normalized absorption spectra before and after RNA addition (the insets show the visual colour change of the solution: purple with SARS-CoV-2 viral RNA, blue after the addition of RNaseH, colourless due to the precipitation of nanoparticle aggregates); A660 values measured at different conditions (control, RNA from non-infected Vero cells, Vero cells infected with MERS-CoV, and Vero cells infected with SARS-CoV-2 virus. Adapted from Ref. [128] Copyright (2020), with permission from American Chemical Society. (d) Schematic illustration of colorimetric detection strategy of AFB1 by using gelatine-modified AuNPs; absorption spectra as a function of AFB1 concentration (the inset shows the visual colour change); calibration curve (A525 vs. AFB1 concentration). Adapted from Ref. [129] Copyright (2021), with permission from IOP Publishing Ltd.

Figure 17.
Schematic representation of analyte detection through a label-free colorimetric aptasensors. The functionalization of nanoparticles with aptamers is realized in a medium of high ionic strength. (a) Aptamer capping prevents nanoparticle salt-induced aggregation if the analytes are not recognized by functionalized nanoparticles. (b) The presence of analytes of interest causes the detachment of aptamers from the nanoparticle surface leading to the salt-induced aggregation of bare nanoparticles.

Figure 18.
(a) Detection scheme of E2 by using AuNPs functionalized with split aptamers; absorption spectra as a function of the E2 concentration; calibration curve for E2; specificity assay. Reproduced from Ref. [135] Copyright (2014), Scientific Reports. This article is distributed under a Creative Commons Attribution (CC-BY-NC-SA) license. (b) Schematic illustration of the aptasensor working principle for detecting E2; Ratiometric response of the aptasensor for E2 in spiked rat urine by using 35 mer and 75-mer aptamers; specificity assay. Adapted from Ref. [138] Copyright (2015), with permission from American Chemical Society. (c) Detection mechanism for revealing E2 by means of aptamer-capped AuNPs; absorption spectra and calibration curve for E2 (the inset shows the colour change from pink to purple); specificity assay (the inset shows the visual response of the aptasensor). Adapted from Ref. [139] Copyright (2020), with permission from Elsevier Ltd. (d) Detection scheme of the aptasensor; calibration curves for ALP in different concentration regimes (the insets show the visual response of the biosensor). Adapted from Ref. [140] Copyright (2012), with permission from Elsevier B.V.

Figure 19.
(a) Schematic representation of the fabrication of FeS2NPs and detection mechanisms for and GSH; absorption spectra as a function of H2O2 concentration; calibration curve for H2O2 (the inset shows the visual colour change from colourless to deep-blue); absorption spectra as a function of GSH concentration; calibration curve for GSH (the inset shows the visual colour change from deep-blue to colourless). Adapted from Ref. [34] Copyright (2019), with permission from Elsevier B.V. (b) Working principle of aptamer-modified MoS2-NSs for carcinoembryonic antigen (CEA) protein detection; absorption spectra at different CEA concentrations; calibration curve for CEA; visual colour change from greenish to colourless as a function of CEA concentrations. Adapted from Ref. [160] Copyright (2020), with permission from The Royal Society of Chemistry. (c) Working principle of NL-MnCaO2 for detecting glucose; absorption spectra at different glucose concentrations; calibration curve for glucose. Adapted from Ref. [161] Copyright (2020), with permission from Elsevier B.V.

Figure 20.
(a) Schematic illustration of the detection mechanism for hydroquinone (HQ) and H2O2 by using FeCo@C; absorption spectra at different concentrations of H2O2 concentration; calibration curve for H2O2; absorption spectra at different HQ concentrations; calibration curve for HQ. Adapted from Ref. [162] Copyright (2019), with permission from Elsevier B.V. (b) Detection scheme for cholesterol by using cholesterol oxidase and Mo-CQDs; absorption spectra and calibration curve for H2O2 and cholesterol (the insets shows the visual colour change from colourless to greenish). Reproduced from Ref. [168] Copyright (2019), with permission from The Royal Society of Chemistry. (c) Schematic representation of the tetra-enzyme mimetic activities of Co3O4 nanoflowers and working principle for detecting ACP and H2O2; calibration curve for H2O2; calibration curve for ACP. Adapted from Ref. [169] Copyright (2020), with permission from Elsevier B.V.

Figure 21.
(a) Schematic illustration of the etching mechanism for the detection of telomerase activity; TEM images of the AuNBP etching process after incubation with telomerase extracted from different number of HeLa cells (0–2000 cells); visual colour change and absorption spectra of the solution after incubation with telomerase extracted from HeLa cells (0–2000 cells); calibration curve and LR for telomerase activity. Adapted from Ref. [35] Copyright (2019), with permission from Elsevier B.V. (b) Rationale behind the signal amplification achieved with aptamer-modified magnetic beads and AuNBP@MnO2NSs as etching substrate for detecting exosomes; absorption spectra at different exosome concentration obtained with high-AR AuNBPs (the insets show the visual colour change of the solution and two representative TEM images of AuNBP@MnO2NSs and etched AuNBPs); calibration curve and LR for exosome by using high-AR AuNBPs. Adapted from Ref. [176] Copyright (2020), with permission from American Chemical Society.

Figure 22.
(a) Schematic illustration of label-free detection of PARP-1 activity with AuNRs; visual colour change and corresponding absorption spectra measured at different PARP-1 activities (0–2 U); calibration curve and LR for PARP-1 activity. Adapted from Ref. [181] Copyright (2020), with permission from Elsevier B.V. (b) Rationale behind the double signal amplification achieved with Ab–GOx–MBs and AgNPRs as etching substrate for detecting PSA; visual colour change and corresponding absorption spectra measured at different PSA concentrations (0–106 fg/mL); calibration curve for PSA. Adapted from Ref. [182] Copyright (2015), with permission from Elsevier B.V.

Figure 23.
(a) Detection scheme for pAP by the seed-mediated growth of AgNPs; Spectra at different concentrations of pAP in human urine (left graph) and paracetamol (right graph), with insets showing the standard addition dose-response curves for addition of pAP; example of visual colour changes while increasing pAP concentration. Adapted from Ref. [187], Copyright (2021), with permission from Elsevier B.V. (b) Detection scheme for EA by the seed-mediated growth of Au@AgNRs, together with TEM images before (left) and after (right) the Ag growth; (b) normalized extinction spectra of AuNRs (black line) and Au@AgNRs at increasing EA concentrations; calibration curve for EA with inset showing the LR when AgNO3 concentration was 100 mM, pH 11.4 and the reaction time 20 min. Adapted from Ref. [188], Copyright (2017) with permission from Elsevier B.V.


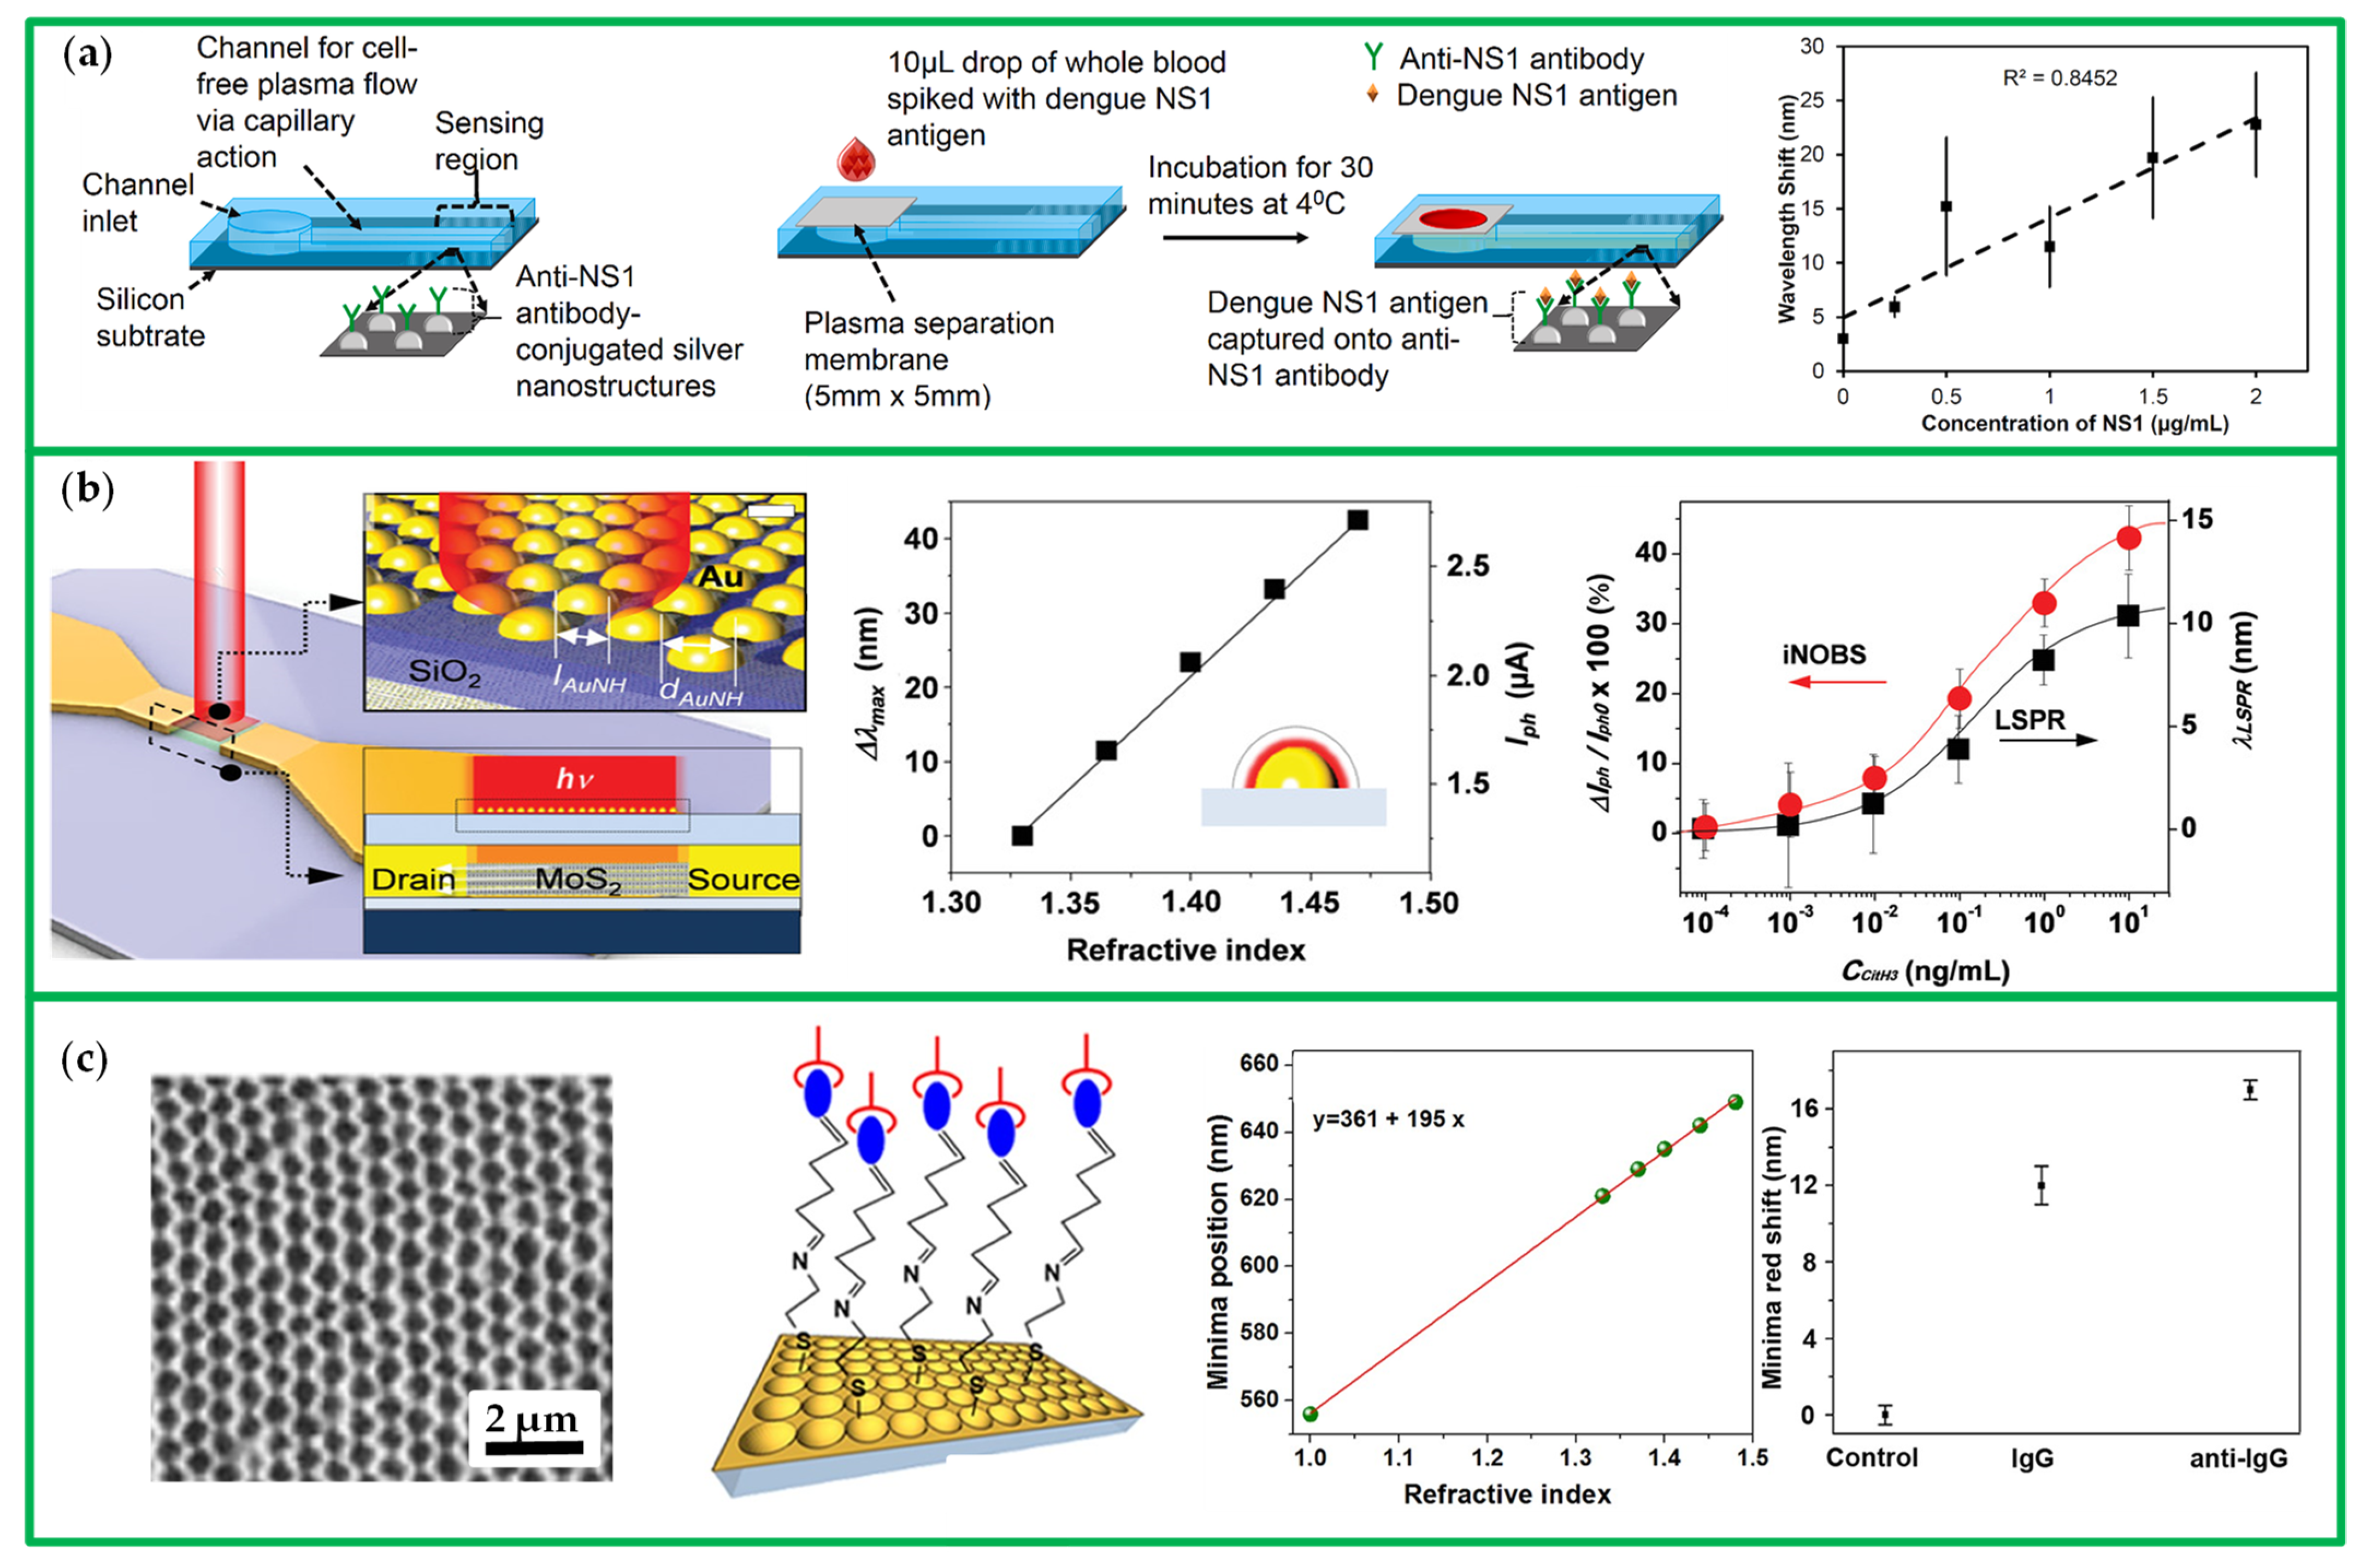
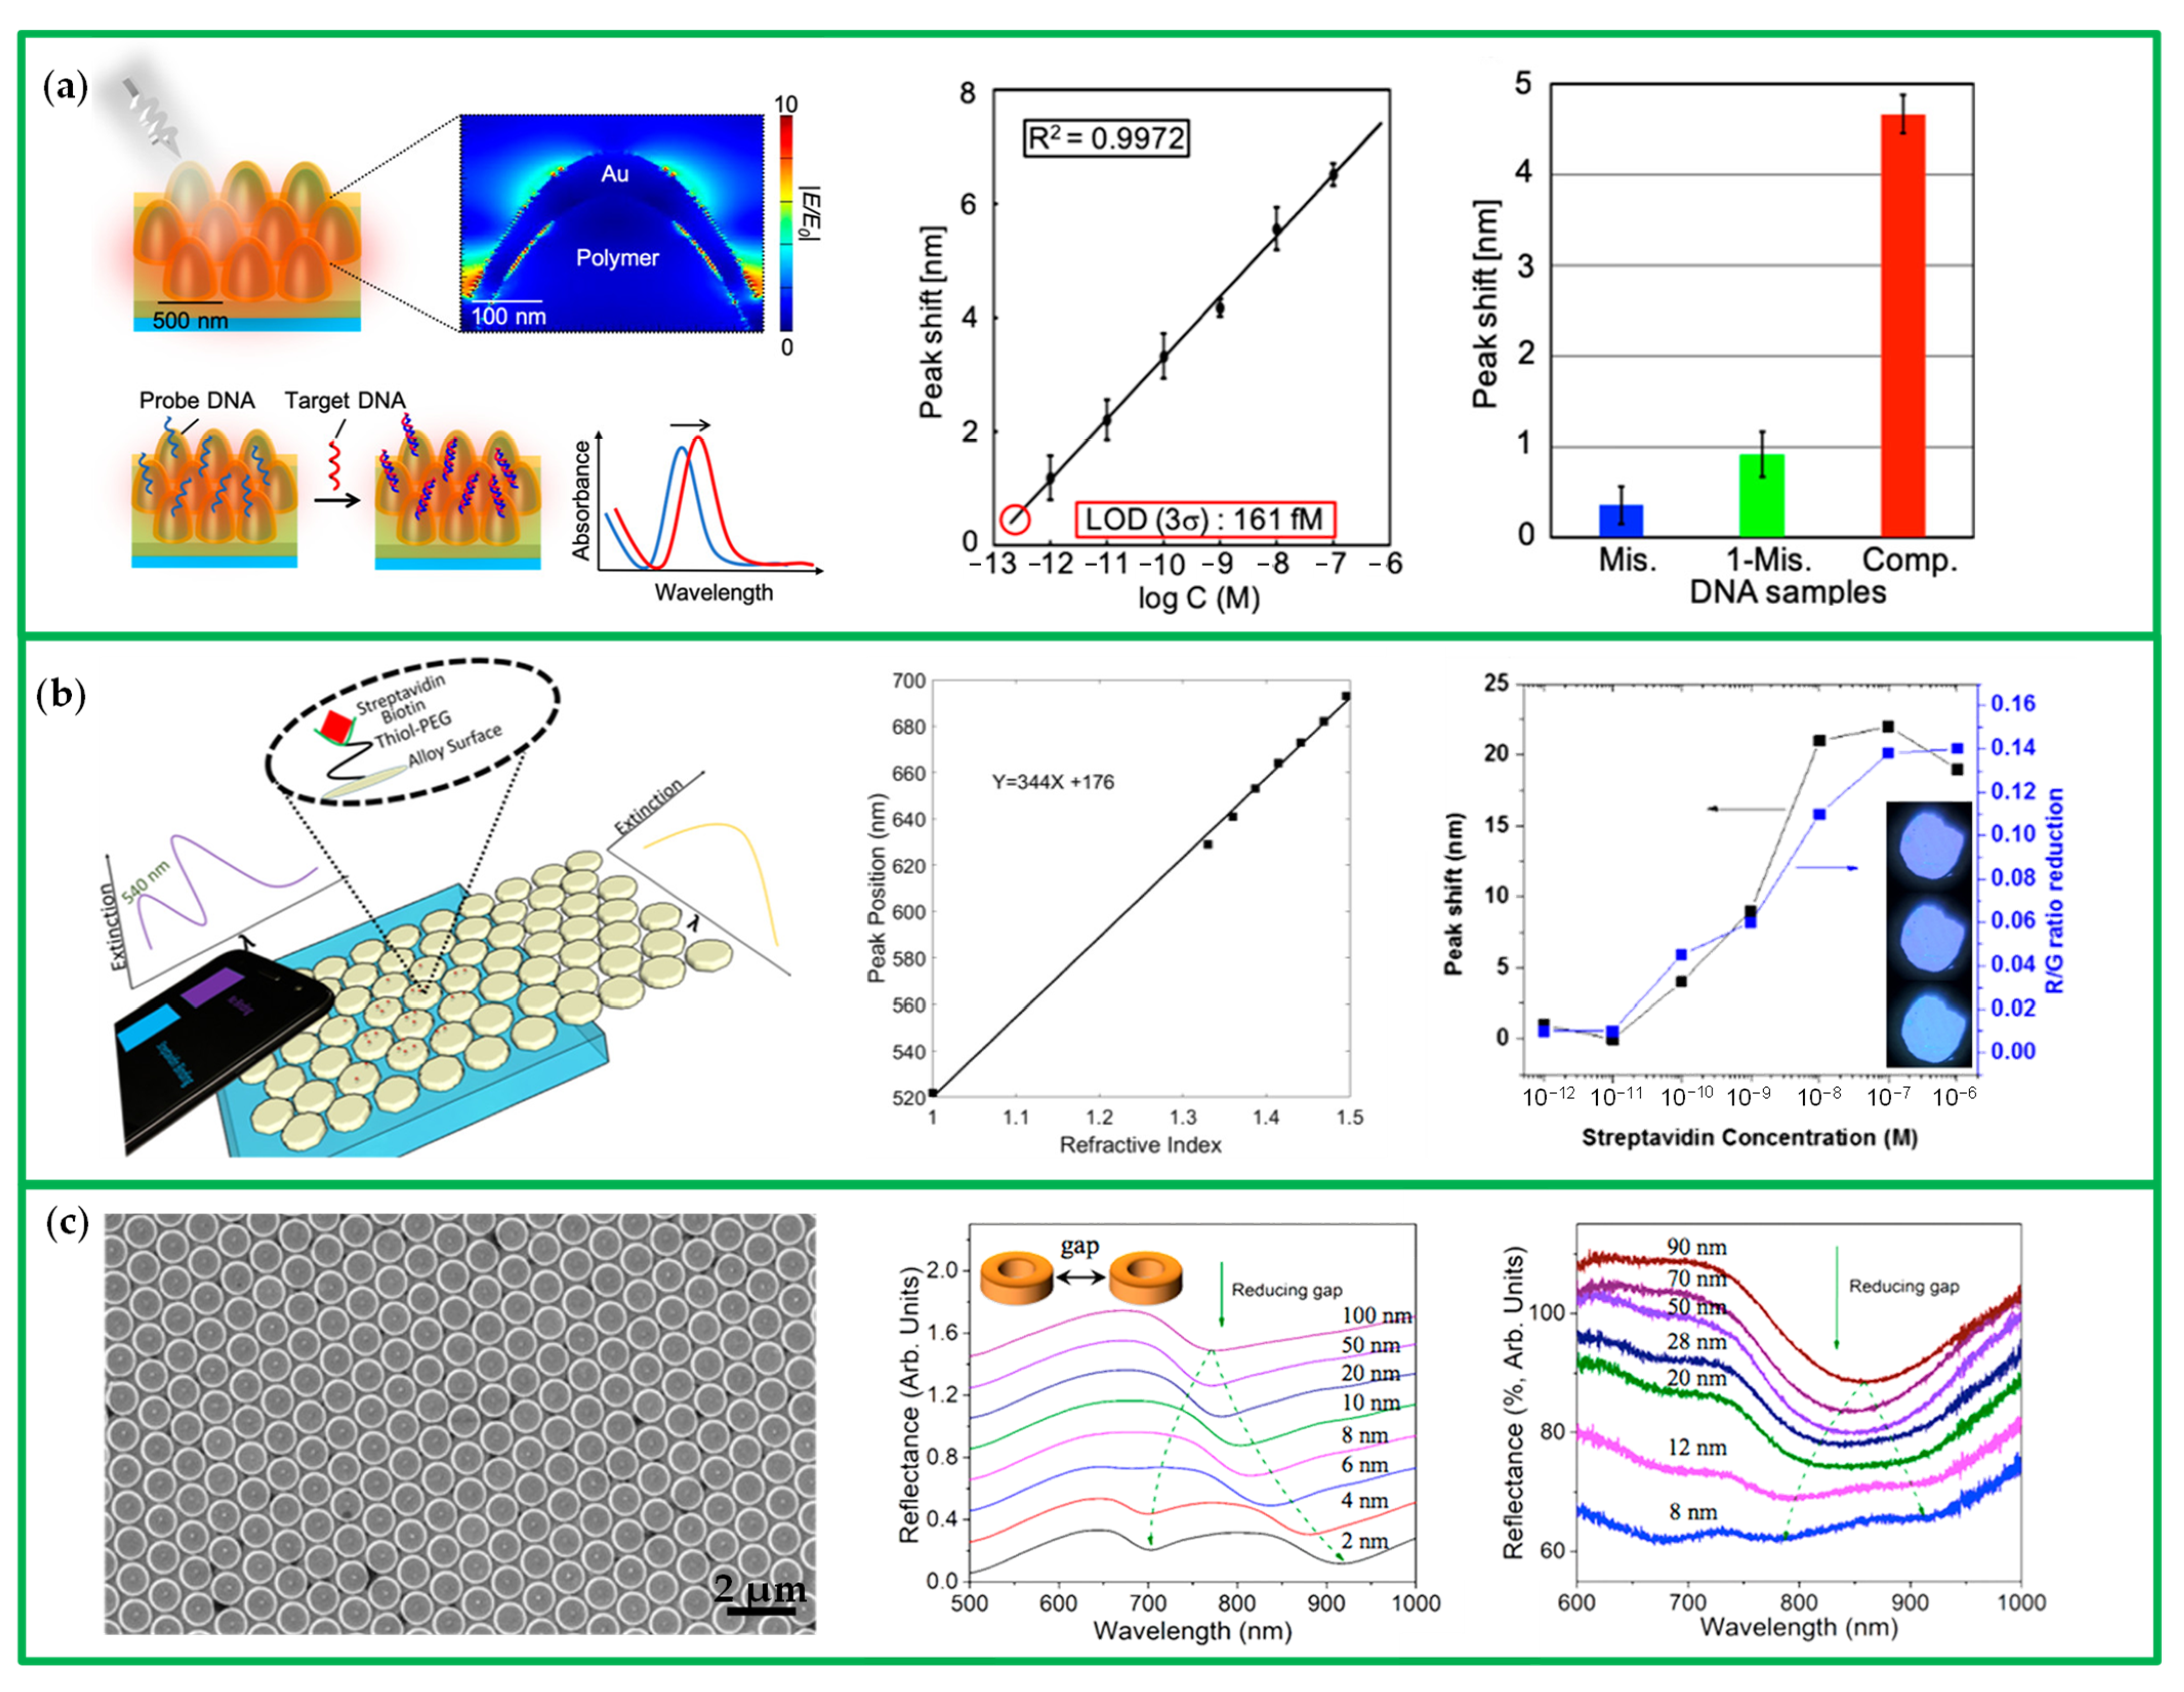
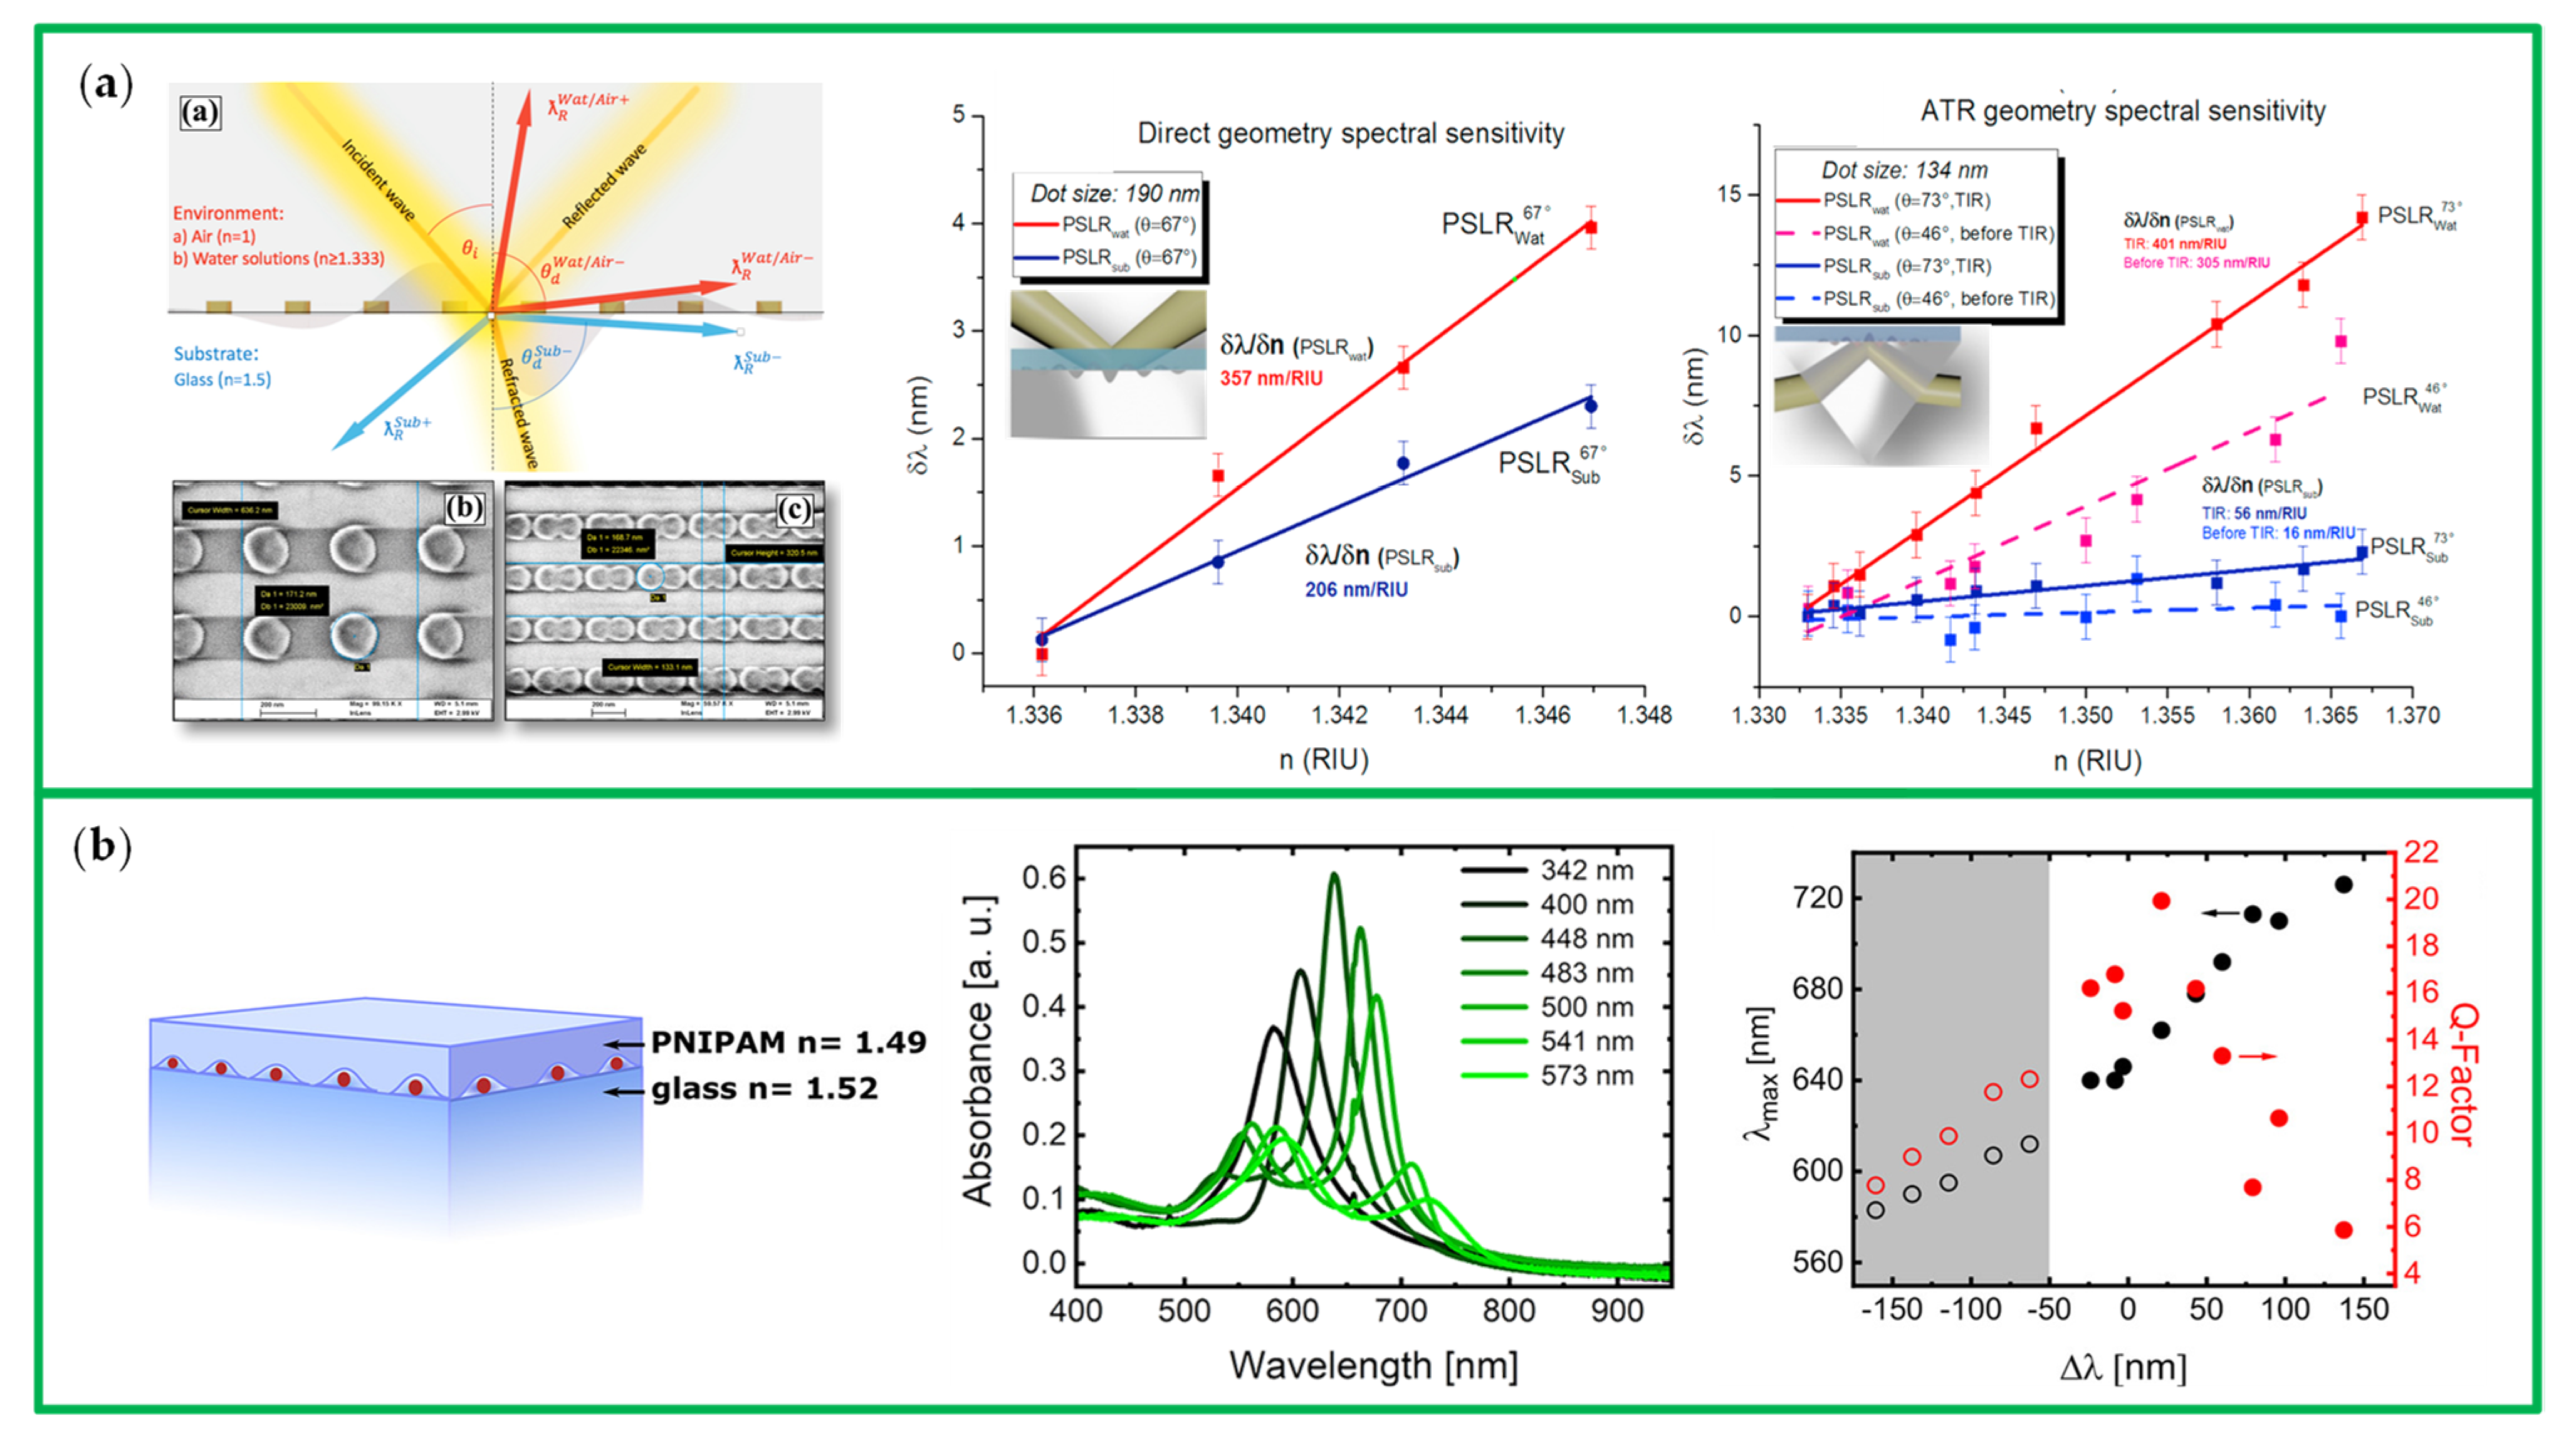
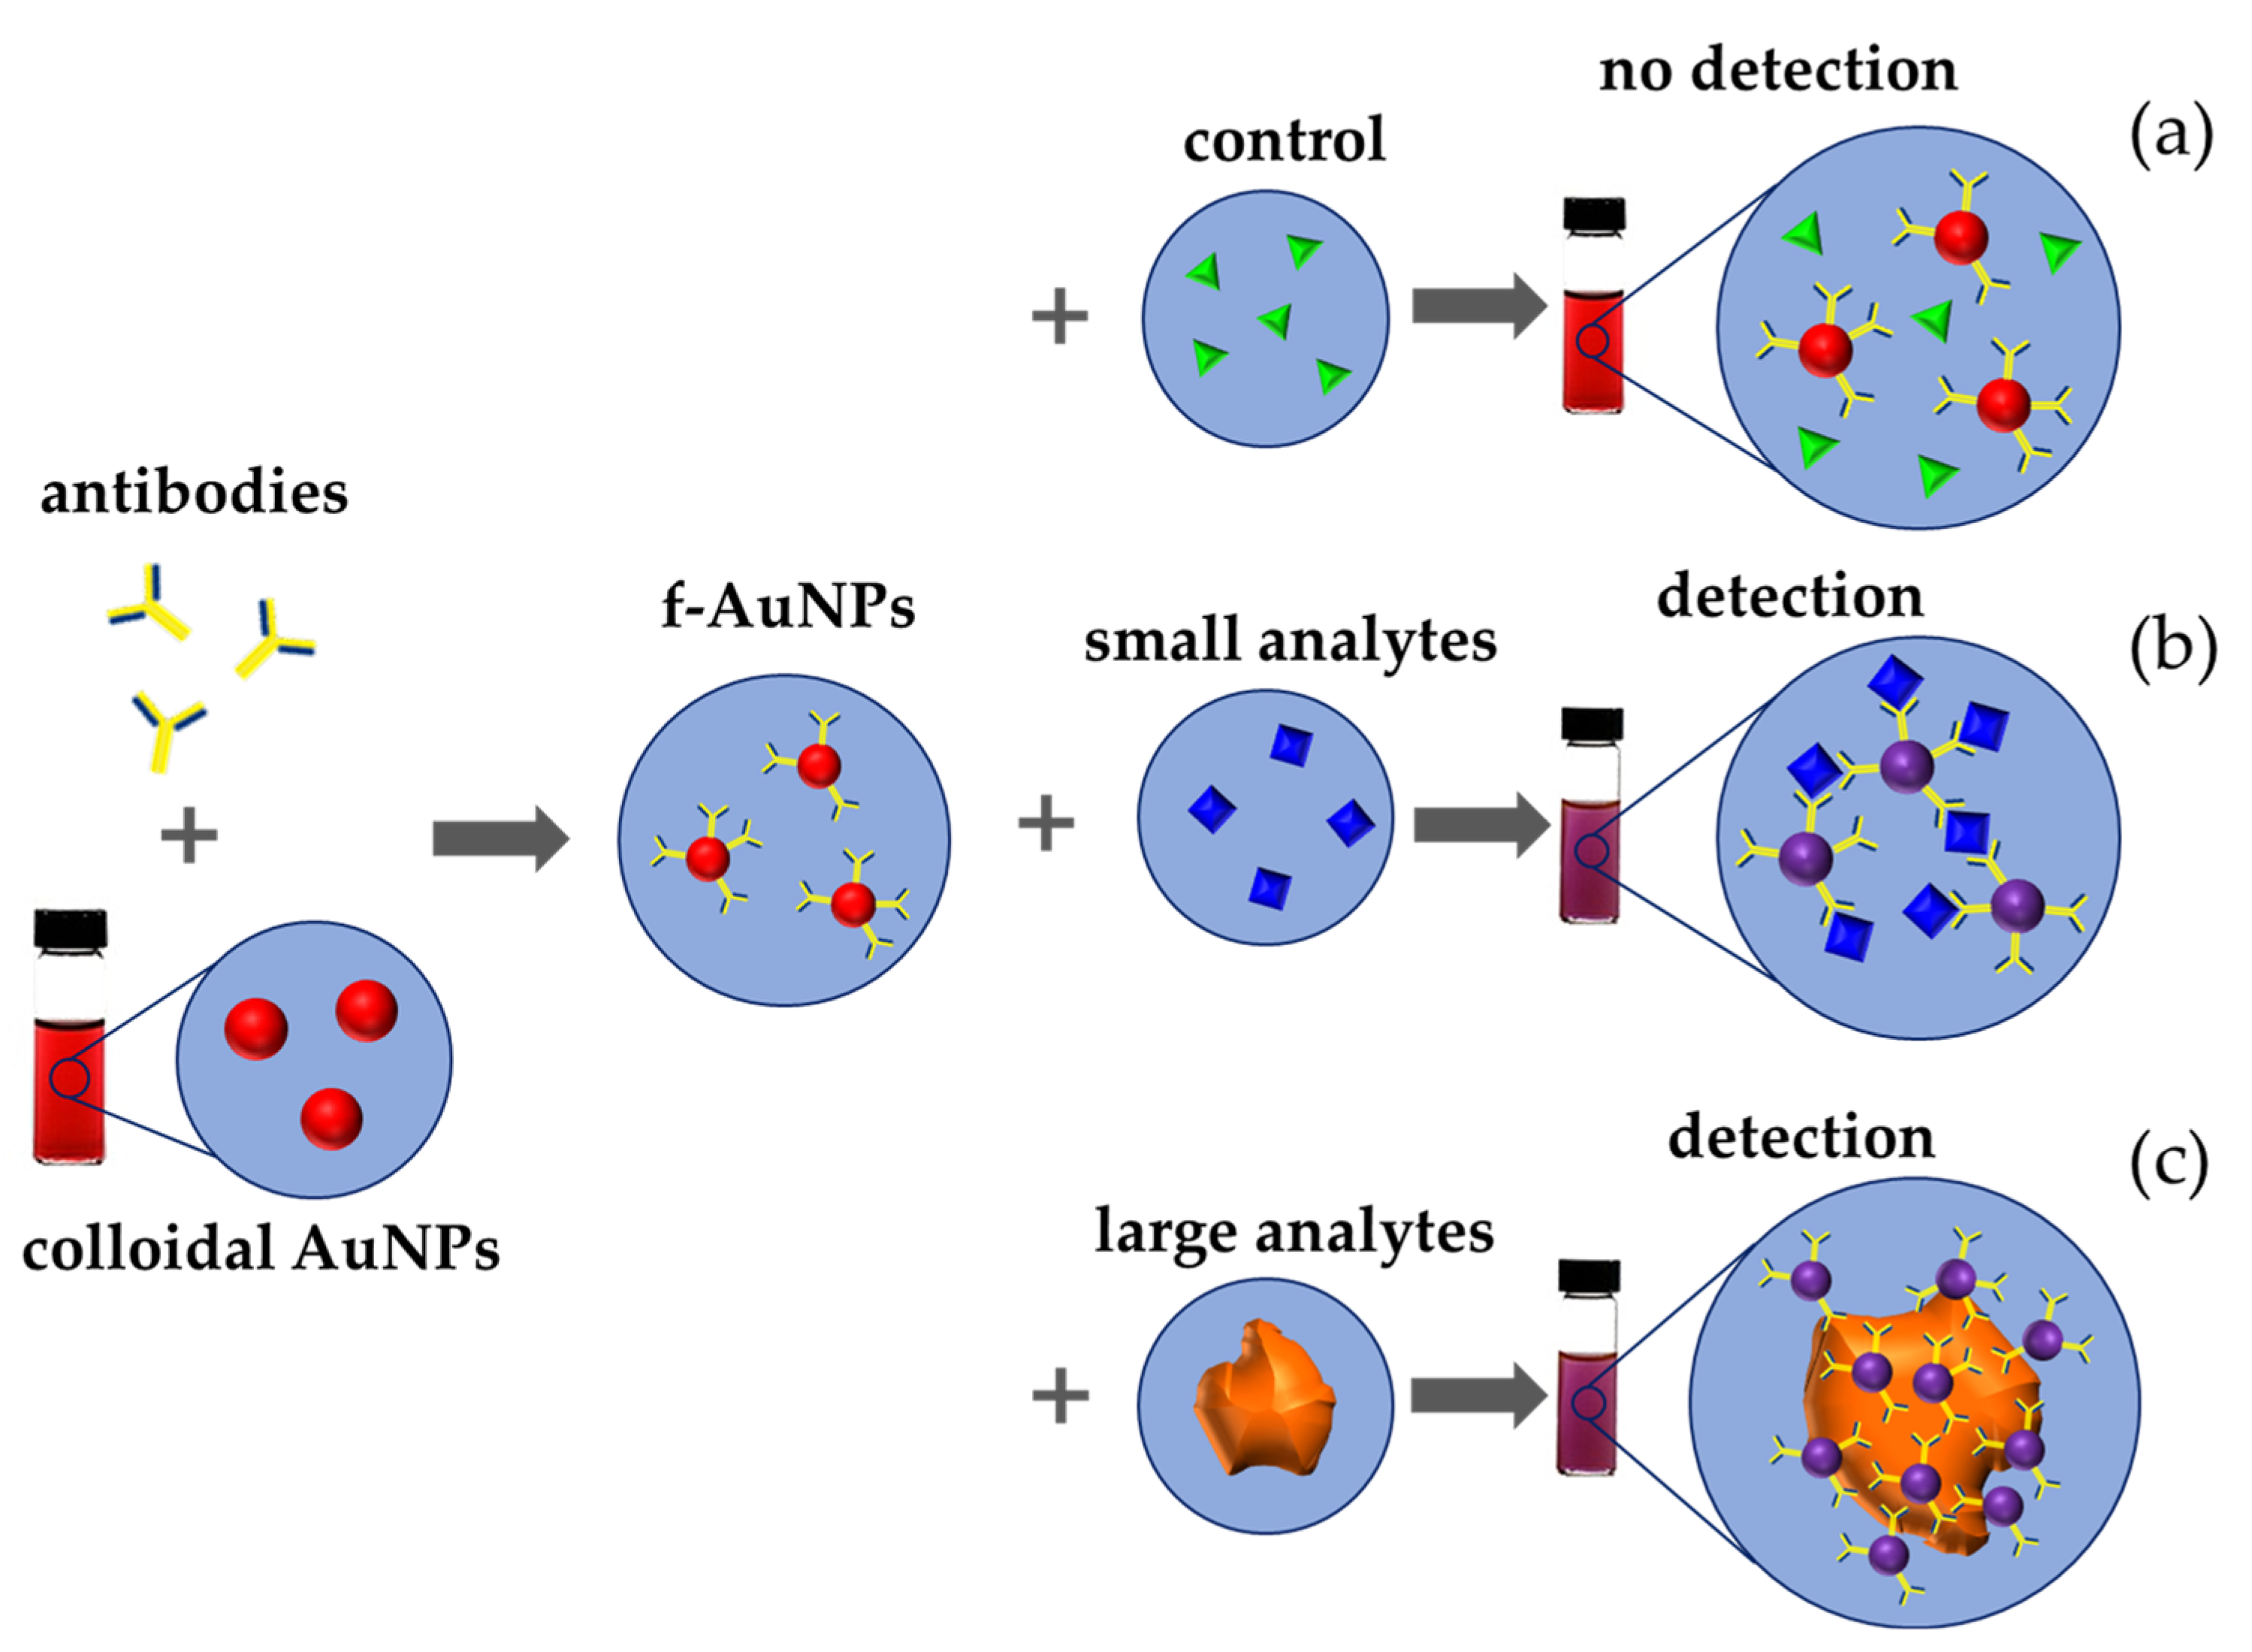
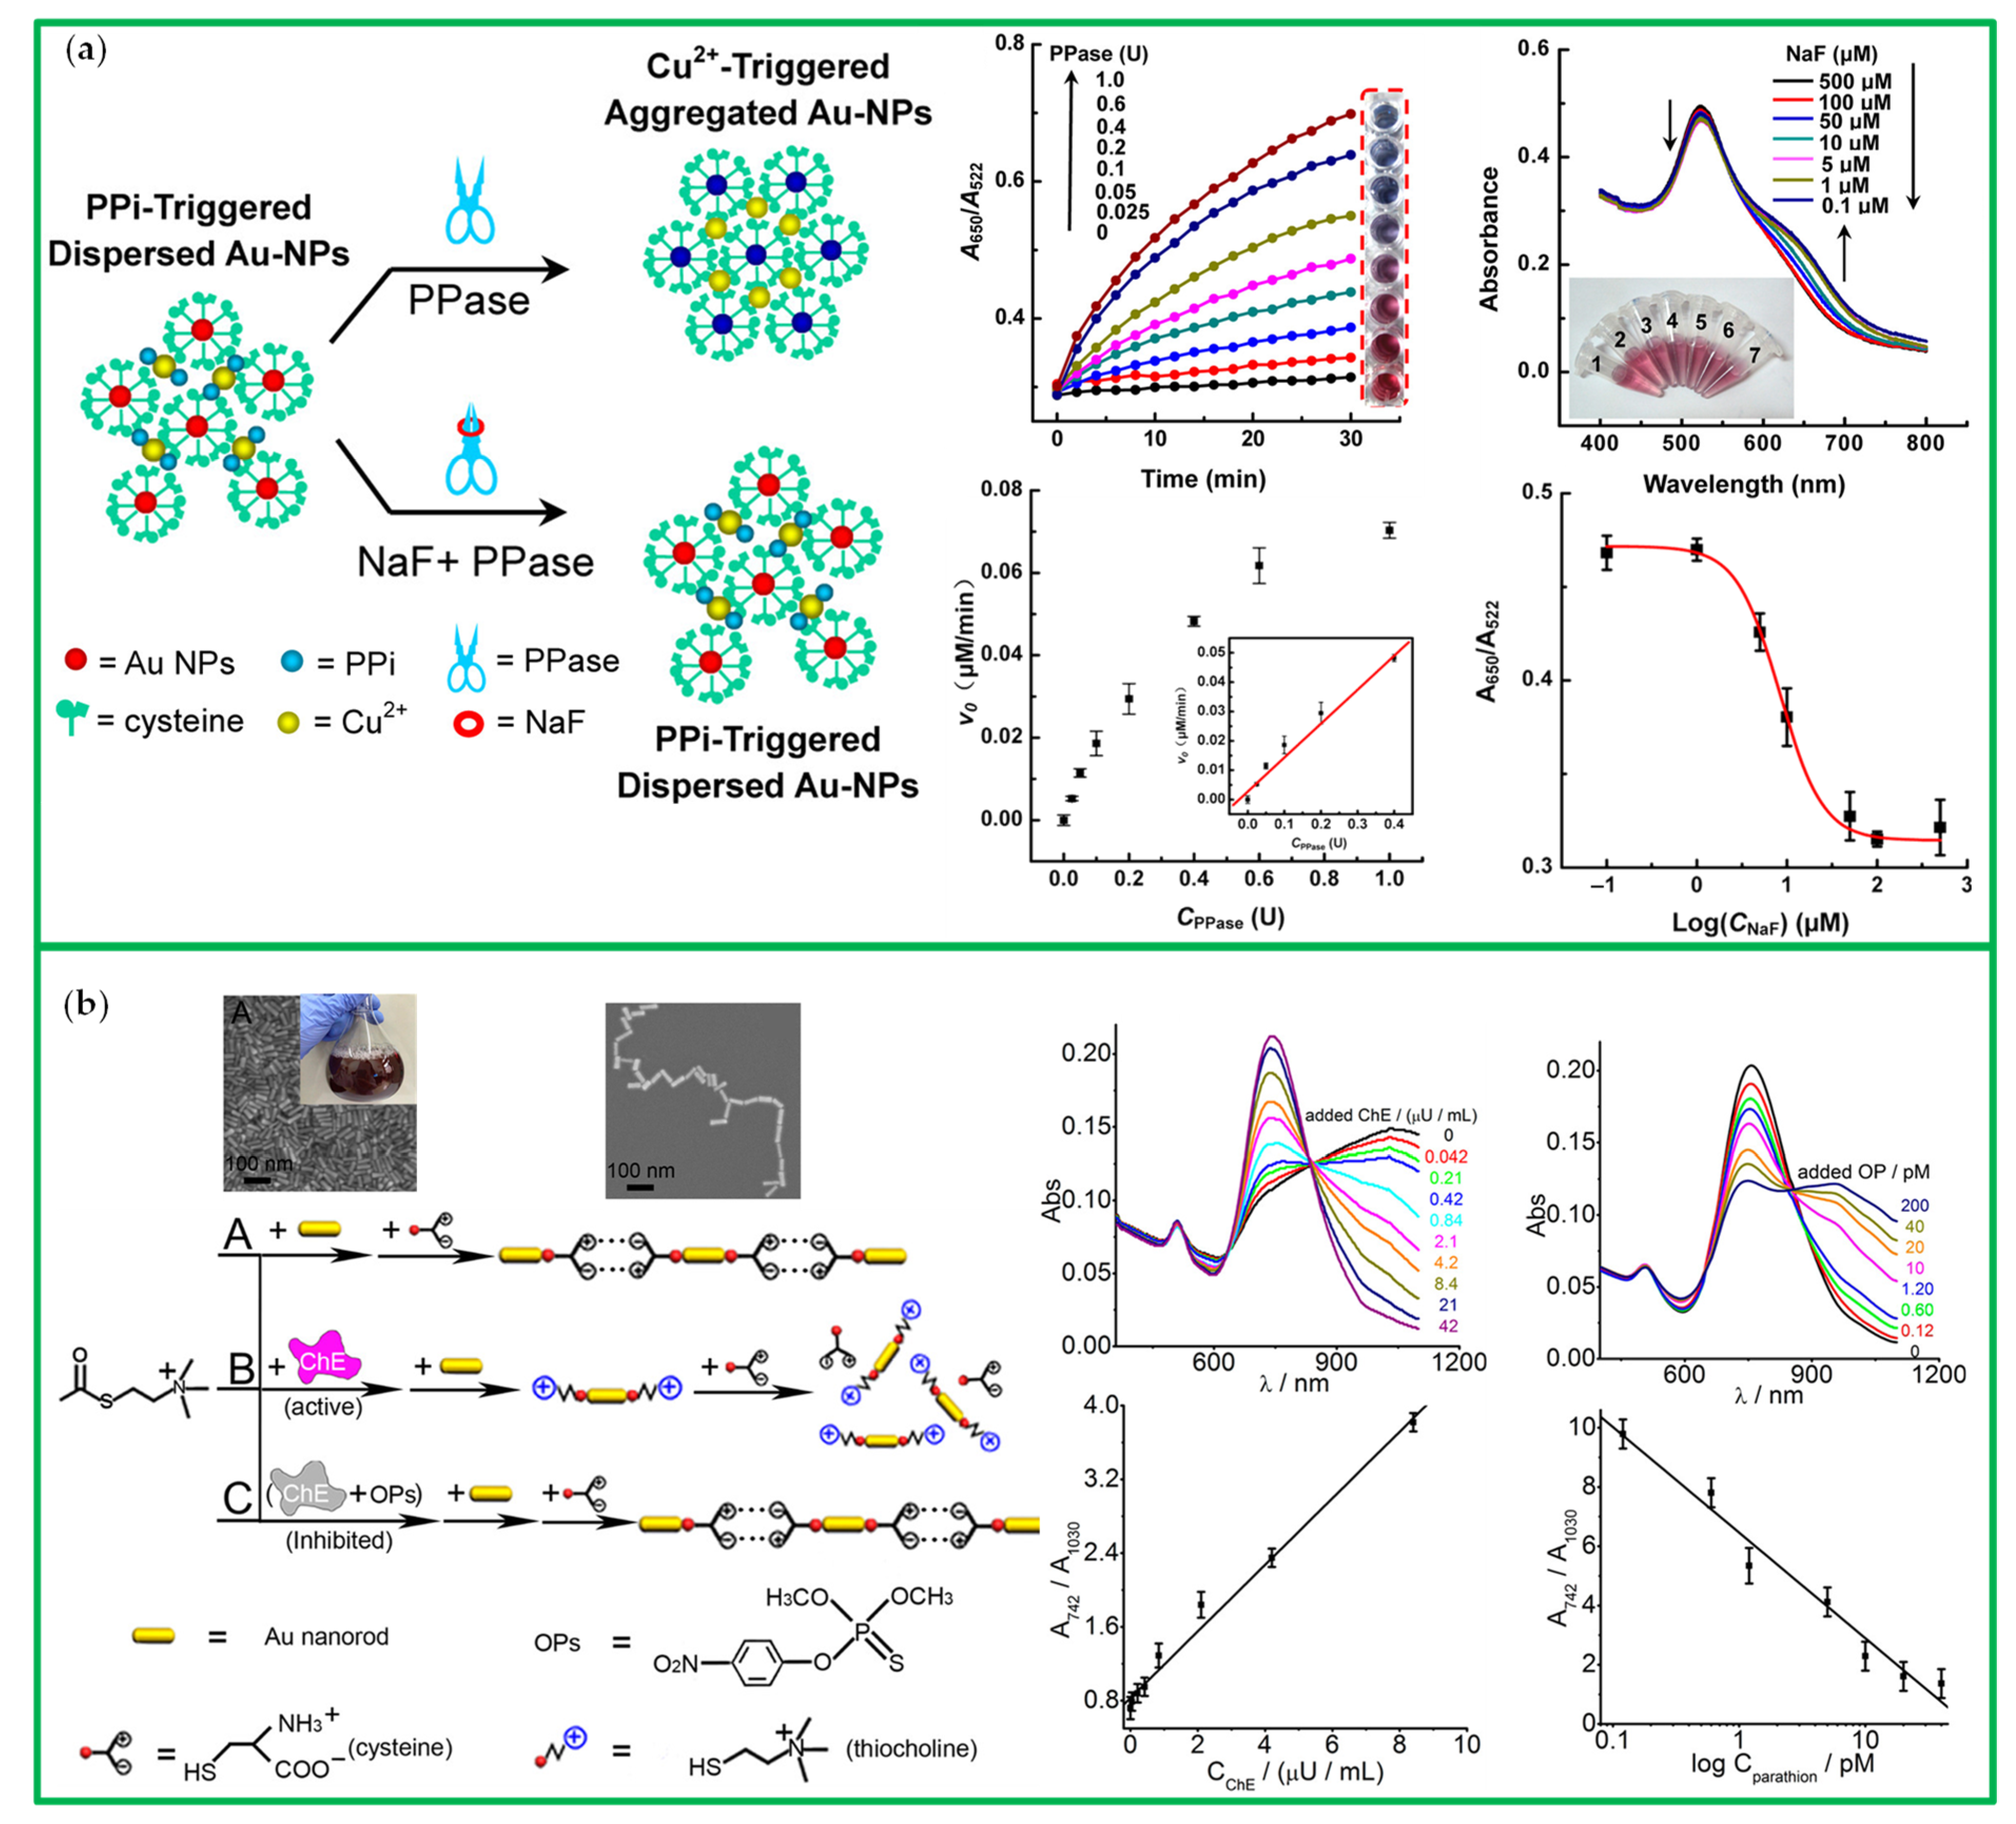
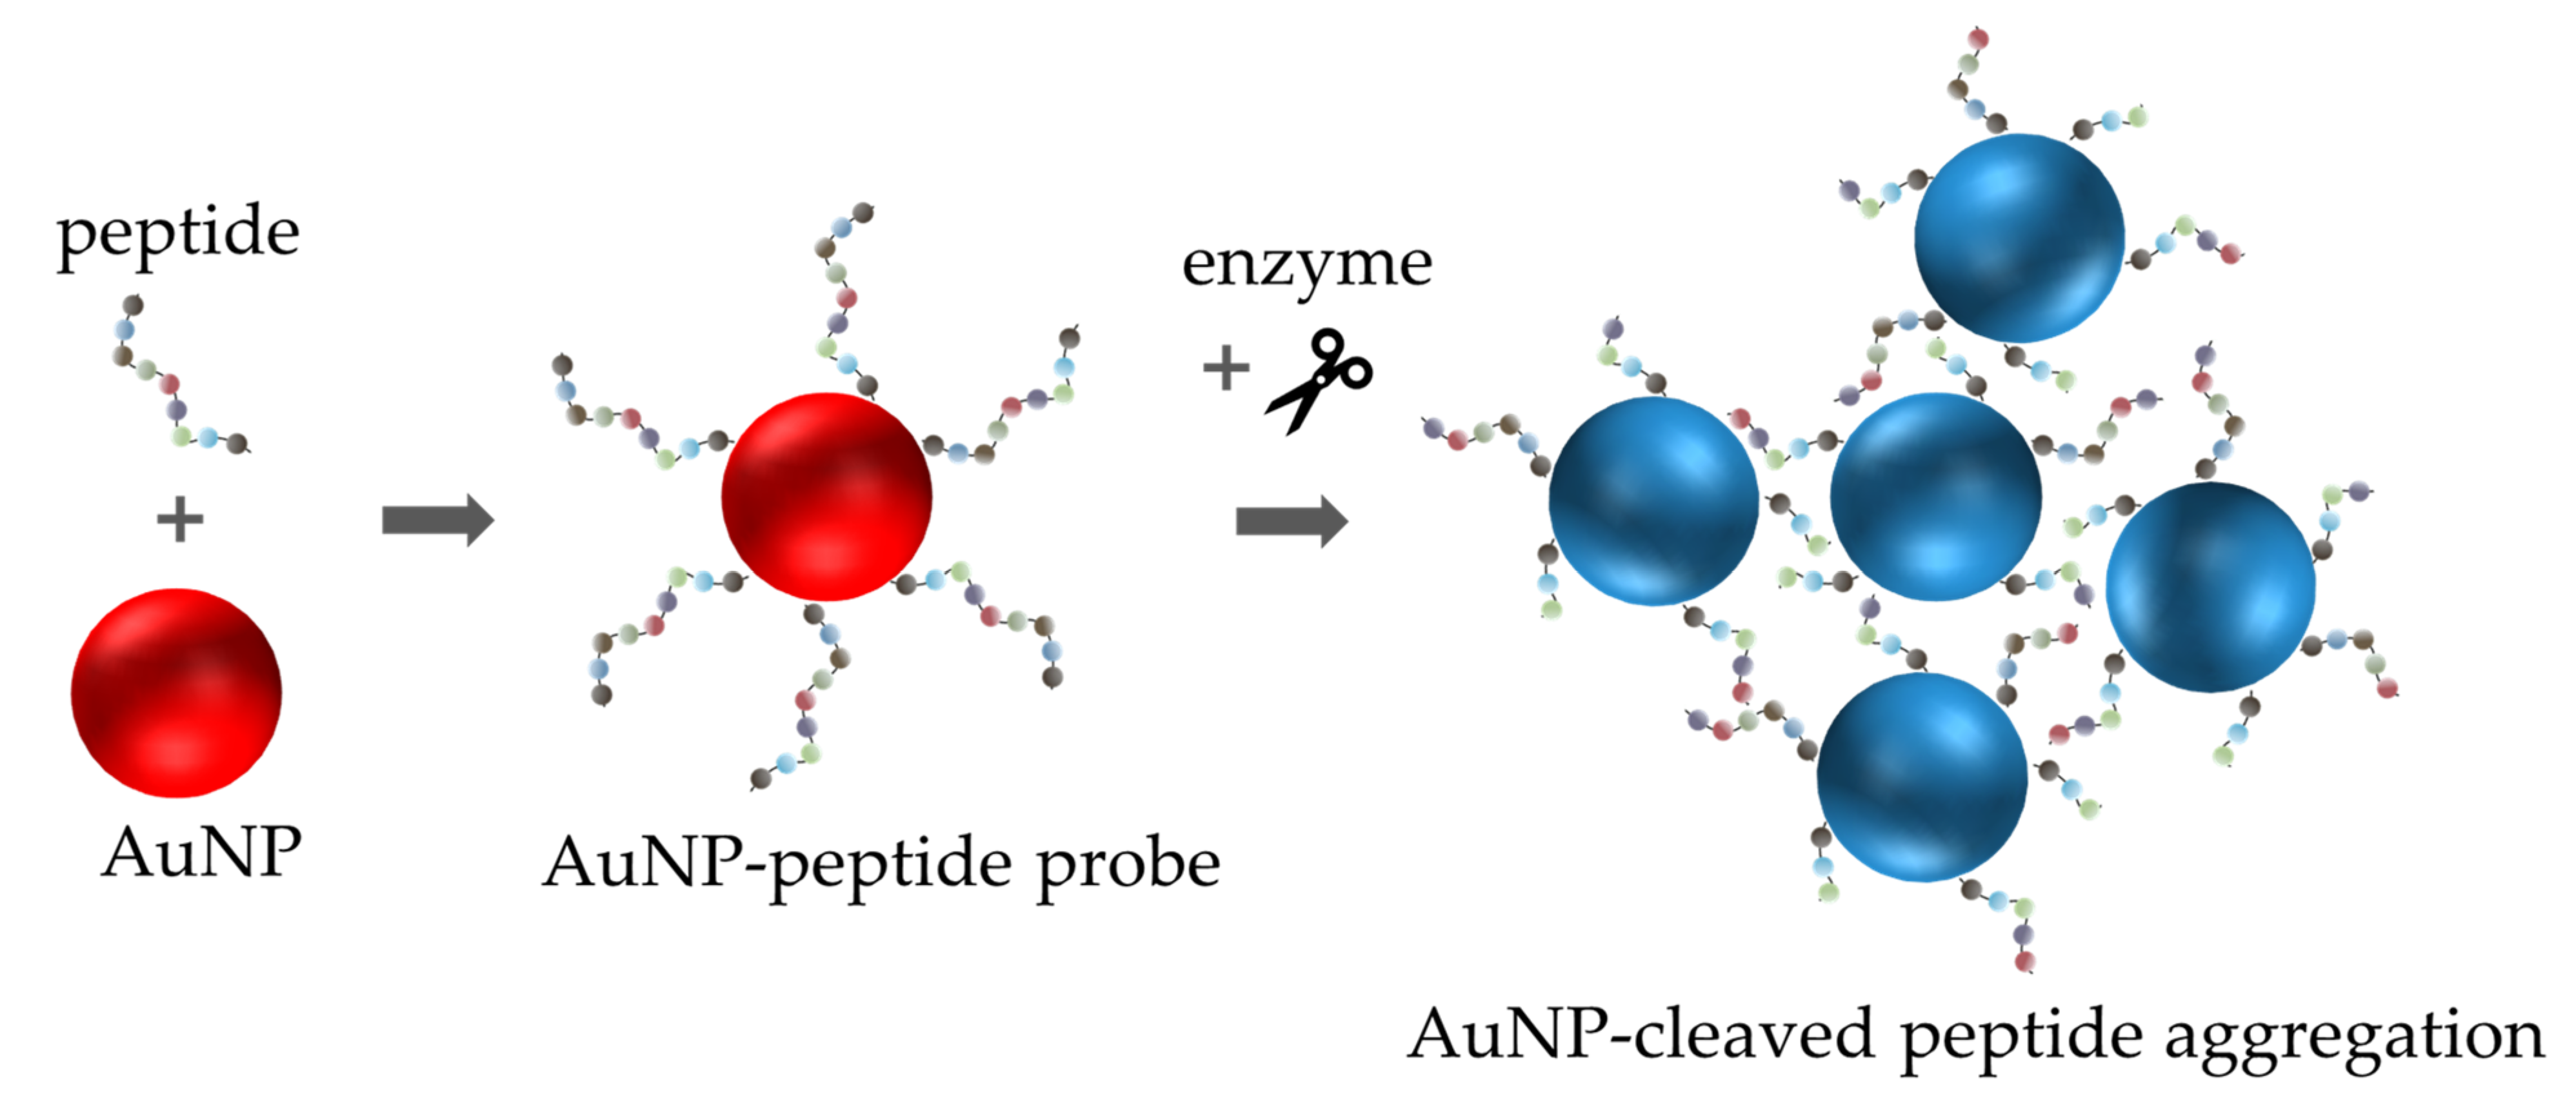
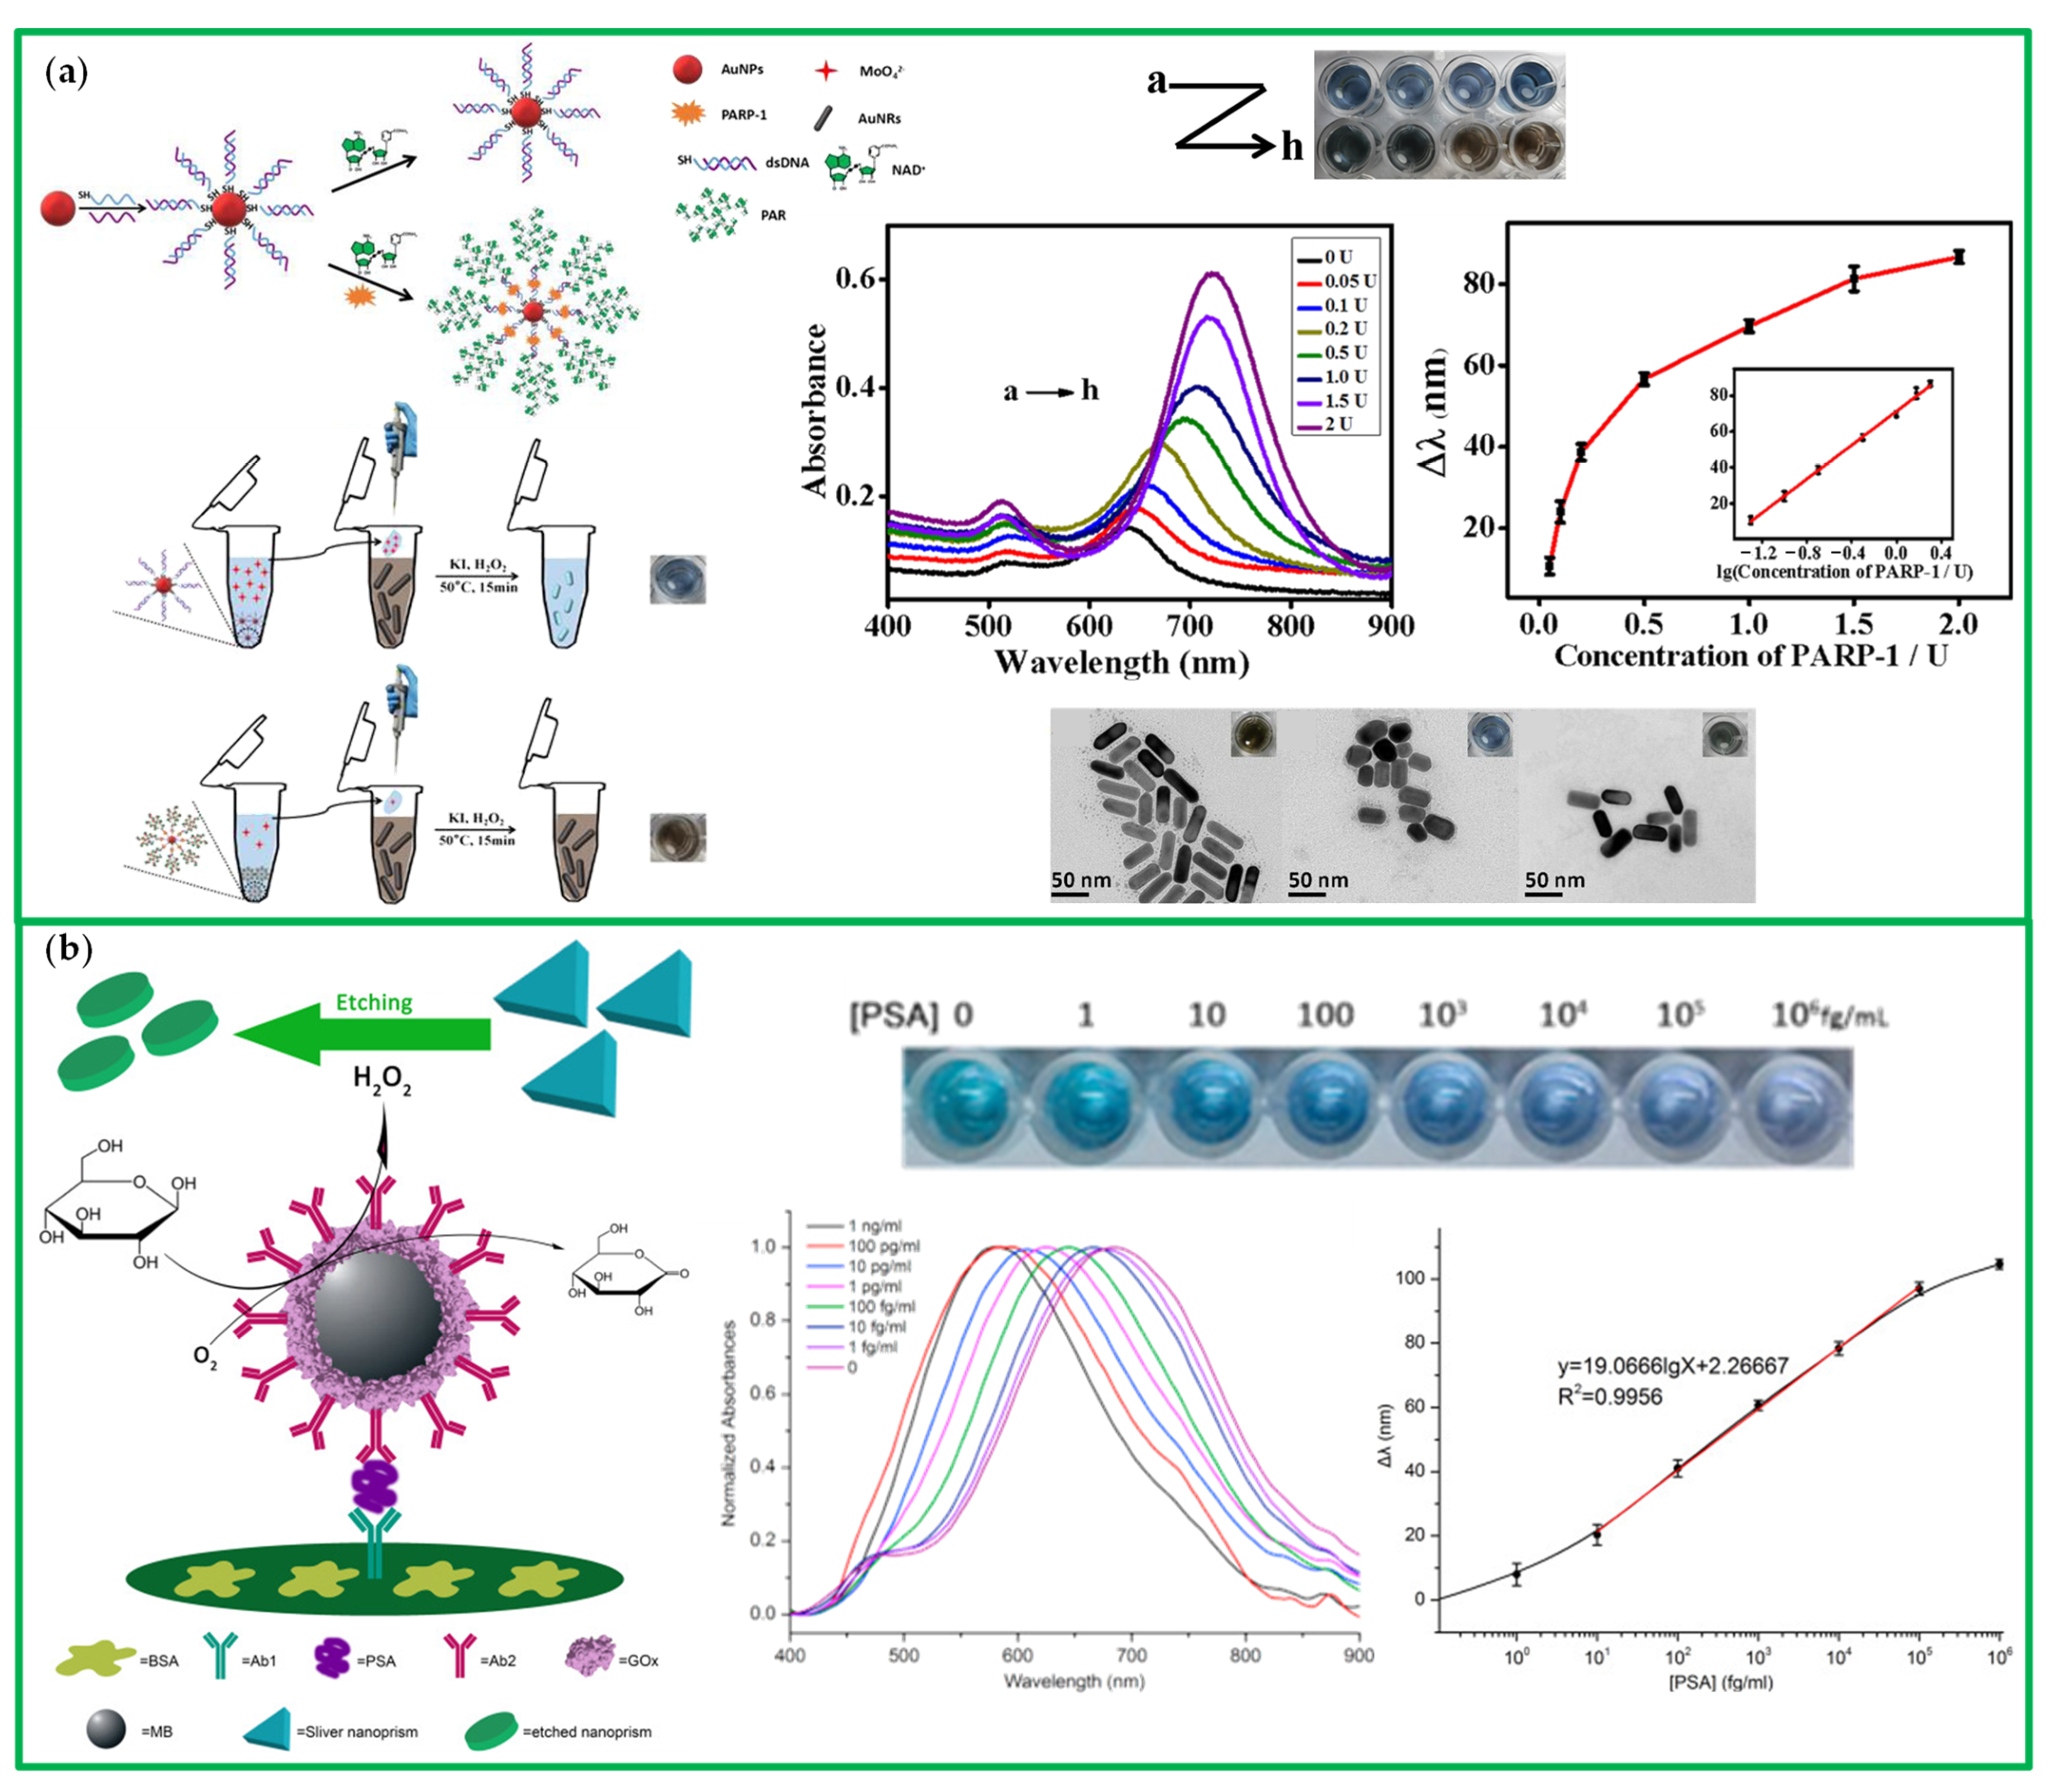
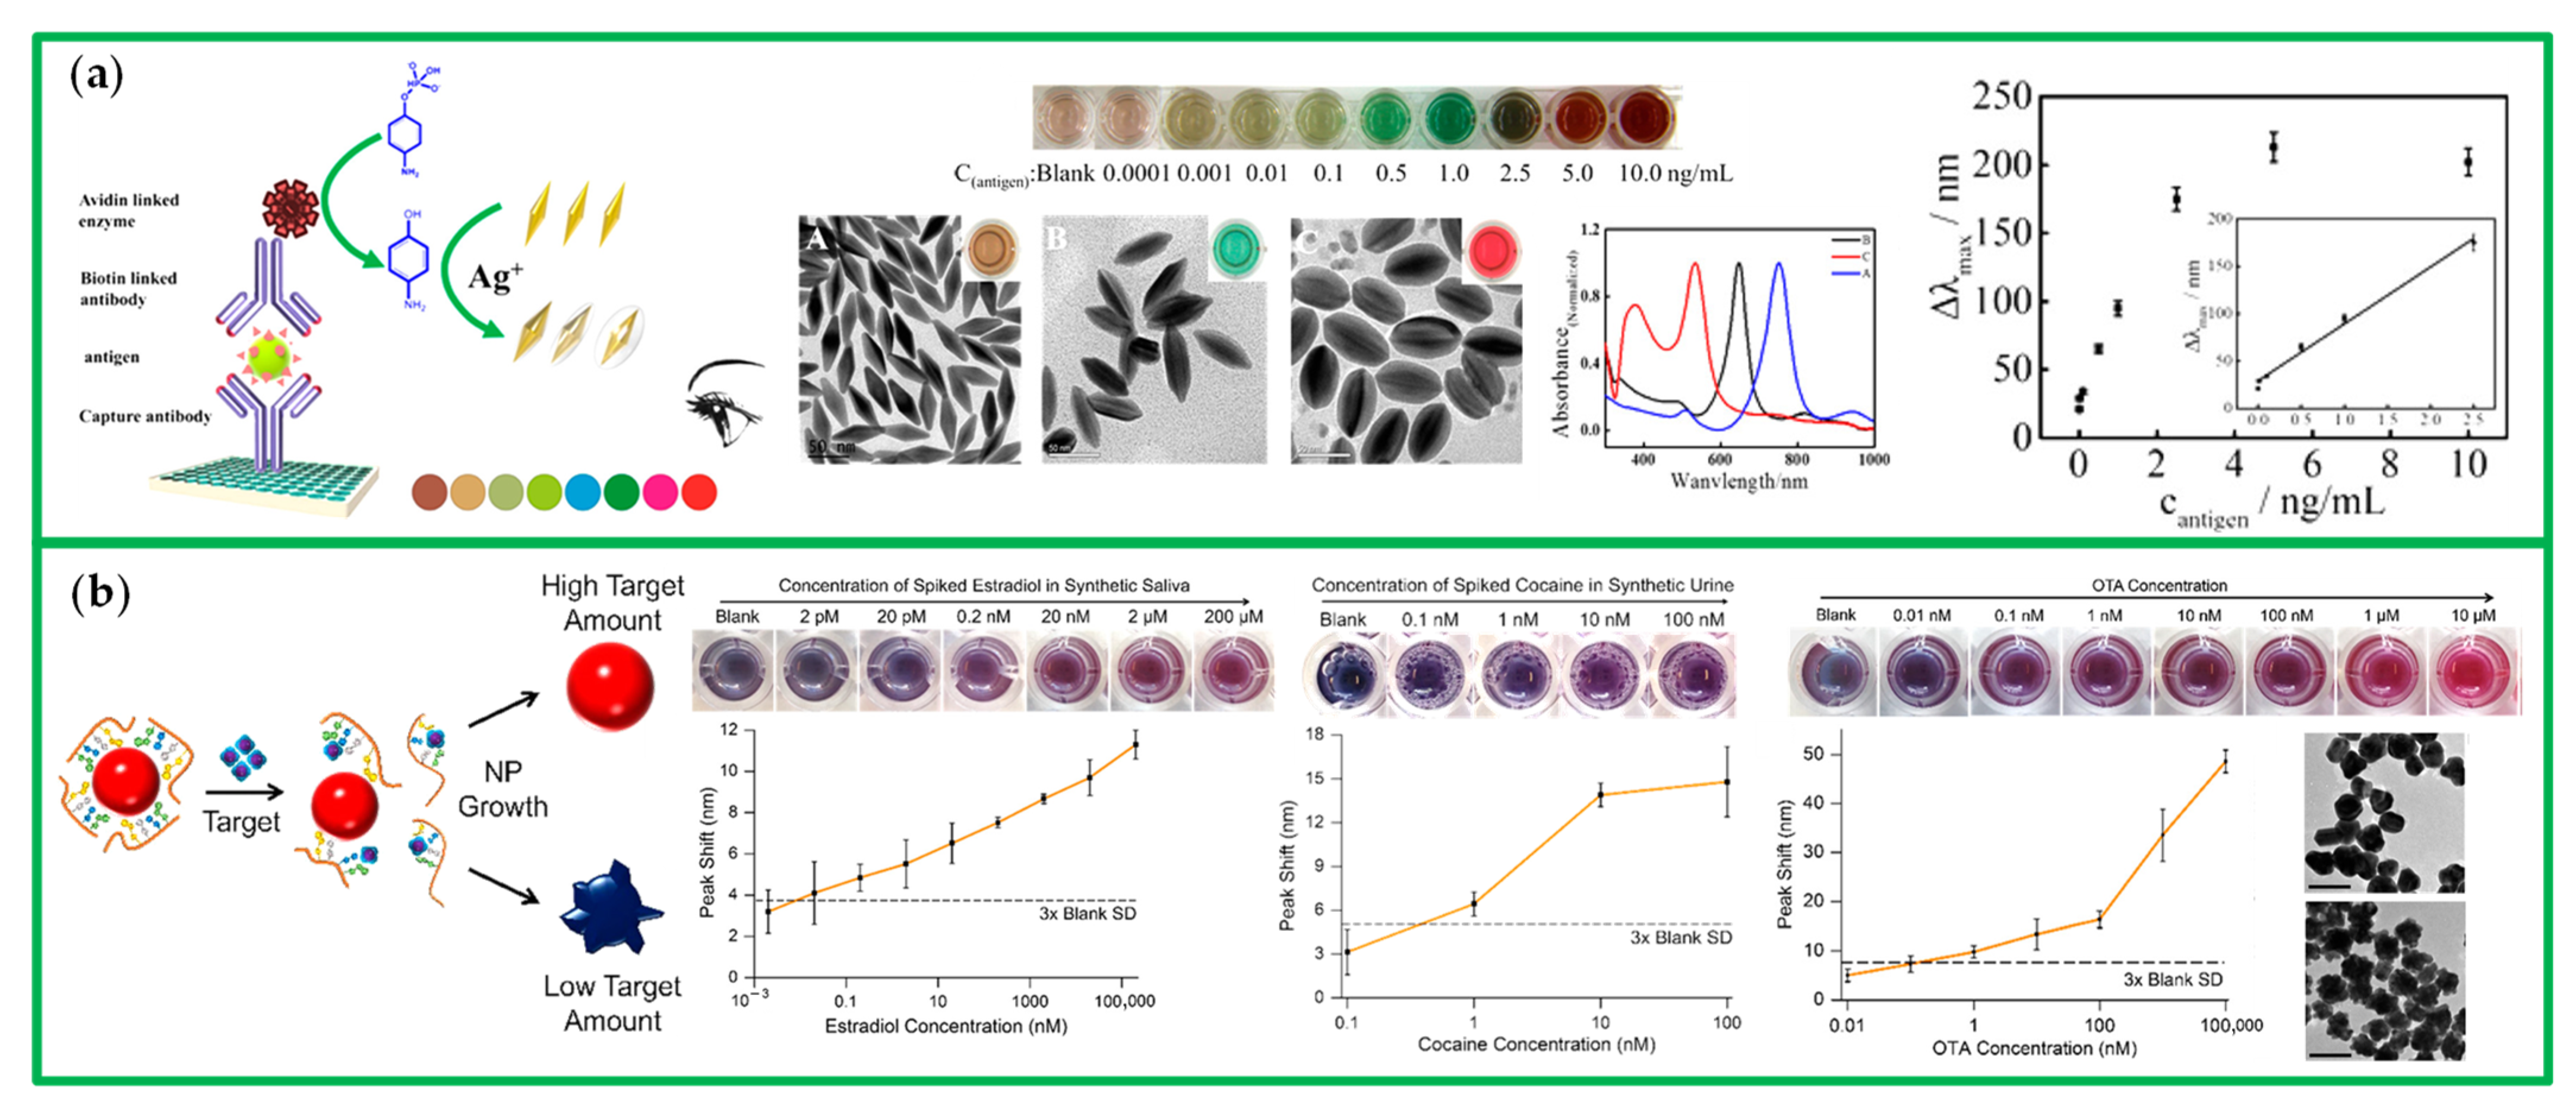
Table 1.
An overview on recently reported LSPR-based colorimetric biosensors and some commercial ELISA kits for comparison (when available).
Table 1.
An overview on recently reported LSPR-based colorimetric biosensors and some commercial ELISA kits for comparison (when available).
| Transducer | Matrix | Analytes | LR | S | LOD | Ref. |
|---|---|---|---|---|---|---|
| AgNPs | whole human blood | dengue NS1 | 0.5–50 μg/mL | 9 nm/(μg/mL) | 0.06 μg/mL | [48] |
| ELISA (Eagle Bioscience) | serum, plasma, cell culture supernatants | dengue NS1 | 1.56–100 ng/mL | 1.56 ng/mL | ||
| Au hemispheres | human serum | CitH3 | 10−4–10 ng/mL | 300 nm/RIU | 0.87 pg/mL | [49] |
| ELISA (Cayman Chemical) | serum, plasma, cell culture supernatants | CitH3 | 0.15–10 ng/mL | 0.1 ng/mL | ||
| Au hemispheres | buffer serum | anti-human IgG | n/a | 211 nm/RIU | 1 μM | [50] |
| L-shape Au stripes | buffer solution | miRNA-let-7a | 1 fM–100 pM | n/a | 13 fM | [54] |
| ELISA (BioVendor) | whole blood, cell culture lysates | hsa-miR-let-7a-5p | 1.25–40 pM | 0.42 pM | ||
| Au nanomushrooms | buffer solution | β-giardin gene | 10 nM–1μM | 83–108 nm/RIU | 5 nM | [55] |
| Al bowtie | n/a | n/a | n/a | 500 nm/RIU | n/a | [57] |
| Au nanoislands | aqueous solution | DNA | n/a | 120 nm/RIU | 10 nM | [58] |
| Au nanodisks | buffer solution | ssDNA | 10–170 nM * | 210 nm/RIU | 10 nM | [59] |
| Au nanodisks | water | ARC DNA | 10–1010 fM ** | 227 nm/RIU | 10 fM | [32] |
* Langmuir isotherm behaviour. ** Data not given in the reference; the values referred to the measured concentrations.
Table 2.
An overview on recently reported c-LSPR-based colorimetric biosensors.
| Transducer | Matrix | Analytes | LR | S | LOD | Ref. |
|---|---|---|---|---|---|---|
| Core–shell Au nanocones | buffer solution | DNA | 1–105 pM | 417.5 nm/RIU | 161 fM | [33] |
| Au crossed-bowties | n/a | n/a | n/a | 1753 nm/RIU | n/a | [69] |
| Au–Ag alloy nanodisks | buffer solution | streptavidin-biotin | 0.1–10 nM | 344 nm/RIU | 0.1 nM | [77] |
| Au film on nanopillars | ultrapure water | DNA | 0.1–104 pM | 382–442 nm/RIU | 70 fM | [81] |
| AuNP multilayer | buffer solution | T-DNA | 0.1–100 nM | 1251.44 nm/RIU | 0.1 nM | [82] |
Table 3.
An overview on recently reported SLR-based colorimetric biosensors.
| Transducer | Matrix | Analytes | LR | S | LOD | Ref. |
|---|---|---|---|---|---|---|
| rectangular lattice of AuNPs | PBS | streptavidin–biotin | n/a | 190–200 * | n/a | [86] |
| 400–420 ** | ||||||
| hexagonal lattice of AuNPs | human blood plasma | H2S | 0–12 μM *** | n/a | 0.79 μM | [91] |
| Rectangular lattice of Au cubes placed on quartz pillars | refractive index sensing | n/a | 596.7 nm/RIU | n/a | [96] | |
| hexagonal lattice dual-core photonic crystal fiber | refractive index sensing | 1.33–1.40 | 16,000 nm/RIU | n/a | [97] | |
| Au-coated side-polished hexagonal structure photonic crystal fiber | refractive index sensing | 1.36–1.44 | 21,700 nm/RIU | n/a | [98] | |
| Au nanoring/nanowire array | refractive index sensing | n/a | 900 nm/RIU | n/a | [99] | |
* Direct illumination geometry. ** ATR geometry. *** Data not given in the reference; the values referred to the measured concentrations.
Table 4.
An overview on recently reported cross-linking label-based colorimetric biosensors and some commercial ELISA kits and RT-PCR for comparison (when available).
Table 4.
An overview on recently reported cross-linking label-based colorimetric biosensors and some commercial ELISA kits and RT-PCR for comparison (when available).
| Transducer | Analyte | Matrix | LR | LOD | Ref. |
|---|---|---|---|---|---|
| anti-human IgG f-AuNPs | human IgG | ultrapure water | 50–500 ng/mL | <100 ng/mL | [101] |
| anti-E2 f-AuNPs | E2 | tap water | 4–10 pg/mL | 3 pg/mL | [105] |
| ELISA (Cayman Chemical) | E2 | cit plasma, EDTA plasma, hep plasma, serum, urine | 0.61–104 pg/mL | 6 pg/mL | |
| glutathione f-AuNPs | aminotriazole | buffer solution | 0.59–21.40 μM | 0.27 μM | [113] |
| SARS-CoV-2 anti-envelope-, anti-membrane-, and anti-spike-f-AuNPs | SARS-CoV-2 | Universal Transport Medium | 30–7 Ct | 36.5 Ct | [109] |
| RT-PCR | SARS-CoV-2 | nasopharyngeal swab | 16–106 copies/mL | 16 copies/mL | [114,115] |
| anti-hemagglutinin f-AuNPs | IAV | PBS | 40–320 HAU/mL | 31.2 HAU/mL | [111] |
| ELISA (Sino Biological) | influenza H1N1 hemagglutinin | supernatant | 31.25–2000 pg/mL | 31.25 pg/mL | |
| CFA0335 aptamer-conjugated AuNPs | salivary mosquito proteins | buffer solution | 10–250 ng * | 10 ng | [112] |
| CFA0335 aptamer-conjugated AuNPs | ZIKV-E | buffer solution | n/a | 0.4 nM | [112] |
| ELISA (Sino Biological) | ZIKV-E | serum, supernatant | 187.5–12,000 pg/mL | 99.72 pg/mL | |
| anti-spike-f-AuNPs | COVID-19 spike recombinant antigen | buffer solution | 1–10 ng/mL ** | 1 ng/mL | [116] |
| pseudo-SARS-CoV-2 | buffer solution | 1000–5000 virus particles/mL ** | 1000 virus particles/mL |
* Data not given in the reference; the value was inferred from dose-response curve. ** Data not given in the reference; the values referred to the measured concentrations.
Table 5.
An overview on recently reported non-cross-linking label-based colorimetric biosensors and some commercial ELISA kits for comparison (when available).
Table 5.
An overview on recently reported non-cross-linking label-based colorimetric biosensors and some commercial ELISA kits for comparison (when available).
| Transducer | Analyte | Matrix | LR | LOD | IC50 (*) | Ref. |
|---|---|---|---|---|---|---|
| cysteine-stabilized AuNPs | PPase | water | 0.025–0.4 U | 0.010 U | n/a | [119] |
| NaF | water | 1–50 μM ** | 1 μM ** | 7.1 μM (0.2 U) | ||
| AuNRs | cholinesterase | buffer solution | 0.042–8.4 μU/mL | 0.018 μU/mL | n/a | [120] |
| ELISA (Abbexa) | cholinesterase | serum, plasma | 0.625–40 ng/mL | 0.38 ng/mL | ||
| AuNRs | organophosphate pesticides | buffer solution | 0.12–40 pM | 0.039 pM | 1.2 pM (42 μU/mL) *** | [120] |
| TS-AuNPs | telomerase extracts from HeLa cells | buffer solution | 1–8 cells/μL | 1 cell/ μL | n/a | [123] |
| ELISA (MyBioSource) | telomerase | serum, plasma, tissue homogenates | 0.625–20 ng/mL | 0.625 ng/mL | ||
| TC-AuNPs | telomerase extracts from HeLa cells | buffer solution | 100–4000 cells (2 nM [AuNPs]) | 100 cells (2 nM AuNPs) | n/a | [124] |
| 500–10,000 cells (5 nM [AuNPs]) | 500 cells ** (5 nM AuNPs) | n/a | ||||
| ELISA (MyBioSource) | telomerase | serum, plasma, tissue homogenates | 0.625–20 ng/mL | 0.625 ng/mL | ||
| TC-AuNPs | Curcumin | buffer solution | 1–20 μM ** | 1 μM ** | 2.8 μM (4000 cells) | [124] |
| TP-AuNPs | telomerase extracted from HL-60 cancer cells | buffer solution | 0–200 cells/mL | 29 cells/mL | n/a | [125] |
| 100 cells/mL (naked-eye) | ||||||
| ELISA (MyBioSource) | telomerase | serum, plasma, tissue homogenates | 0.625–20 ng/mL | 0.625 ng/mL | ||
| TP-AuNPs | BIBR1532 | buffer solution | 20–500 nM ** | 20 nM ** | 50 nM (300 cells/mL) | [125] |
* Enzyme activity or concentration at which the IC50 value was evaluated. ** Data not given in the reference; the values referred to the measured concentrations. *** The value referred to IC30.
Table 6.
An overview on recently reported destabilization-induced aggregation label-based colorimetric biosensors and some commercial ELISA kits for comparison (when available).
Table 6.
An overview on recently reported destabilization-induced aggregation label-based colorimetric biosensors and some commercial ELISA kits for comparison (when available).
| Transducer | Analyte | Matrix | LR | LOD | IC50 (*) | Ref. |
|---|---|---|---|---|---|---|
| ASO-capped AuNPs | N-gene | nasopharyngeal swab | 0.2–3 ng/μL | 0.18 ng/μL | n/a | [128] |
| RT-PCR | SARS-CoV-2 | nasopharyngeal swab | 16–106 copies/mL | 16 copies/mL | [114,115] | |
| GPDC-modified AuNPs | DPP-IV | 50 mM Tris buffer (pH 8.3) | 0–30 U/L | 1.2 U/L | n/a | [126] |
| ELISA (Thermo Fisher Scientific) | DPP-IV | plasma, serum, supernatant | 0.41–100 ng/mL | 0.45 ng/mL | ||
| VPED-DC-modified AuNPs | DPP-IV | 50 mM Tris buffer (pH 8.3) | 0–12 U/L | 1.5 U/L | n/a | [126] |
| ELISA (Thermo Fisher Scientific) | DPP-IV | plasma, serum, supernatant | 0.41–100 ng/mL | 0.45 ng/mL | ||
| AuNPs@gelatin | AFB1 | bacterial supernatant containing gelatinase enzyme | 10–140 pg/mL | 4 pg/mL | n/a | [129] |
| ELISA (Elabscience) | AFB1 | cereals, corn skin, wheat bran, edible oil, peanut, biscuits, beer, wine, soy sauce, vinegar | 0.03–0.48 ng/mL | 0.03 ng/mL | ||
| DBDY-Gly-Phe-MTPA-AuNPs | cathepsin B | phosphate buffer | 10–50 nM ** | 10 nM (1 h reaction) | n/a | [127] |
| phosphate buffer | 5–50 nM ** | 5 nM (2 h reaction) | n/a | |||
| ELISA (Abcam) | cathepsin B | cell culture supernatant, cell lysate, plasma, serum, tissue extracts | 156–10,000 pg/mL | 156 pg/mL | ||
| DBDY-Gly-Phe-MTPA-AuNPs | leupeptin | phosphate buffer | 0–0.5 μM ** | n/a | 0.11 μM (50 nM) | [127] |
| DBDY-Gly-Phe-MTPA-AuNPs | antipain | phosphate buffer | 0–2 μM ** | n/a | 0.48 μM (50 nM) | [127] |
| DBDY-Gly-Phe-MTPA-AuNPs | chymostatin | phosphate buffer | 0–5 μM ** | n/a | 1.78 μM (50 nM) | [127] |
| JR2EC-functionalized AuNPs | MMP-7 | PBS (pH 7.4) | 0–2 μg/mL | 0.1 μg/mL | n/a | [130] |
| ELISA (Thermo Fisher Scientific) | MMP-7 | supernatant | 0.15–100 ng/mL | 0.15 ng/mL | ||
| JR2EC-functionalized AuNPs | MMP inhibitor II | PBS (pH 7.4) | n/a | n/a | 30 nM (2 μg/mL) | [130] |
| Gelatin-modified AuNPs | MMP2/MMP9 | 10 mM 6-MCH | 1.85–148 ng/mL | 1.85 ng/mL | n/a | [131] |
| ELISA (Thermo Fisher Scientific) | MMP2 | plasma, serum, supernatant | 0.78–50 ng/mL | <1 ng/mL | ||
| ELISA (Thermo Fisher Scientific) | MMP9 | plasma, serum, supernatant | 0.23–15.0 ng/mL | 0.05 ng/mL | ||
| Gal-Lip-AuNPs | β-galactosidase | 50 mM PBS (pH 7.4) | 0.02–2.5 μM ** | 9.2 nM (20 min reaction time) | n/a | [132] |
| 2.9 nM (90 min reaction time) | ||||||
| ELISA (MyBioSource) | human β-galactosidase | serum, plasma, tissue homogenates | 0.312–20 mIU/mL | 0.312 mIU/mL | ||
| Gal-Lip-AuNPs | D-galactal | 50 mM PBS (pH 7.4) | 50–1000 μM ** | 50 μM ** | 482 μM (1.0 μM) | [132] |
| Glc-Lip-AuNPs | β-glucosidase | 50 mM PBS (pH 7.4) | 0.02–2.5 μM ** | 22.3 nM (20 min reaction time) | n/a | [132] |
| 9.8 nM (90 min reaction time) | ||||||
| ELISA (Bioassay Technology Laboratory) | human β-glucosidase | serum, plasma, cell culture supernatants | 20–6000 ng/L | 20 ng/L | ||
| Glc-Lip-AuNPs | castanospermine | 50 mM PBS (pH 7.4) | 10–400 μM ** | 10 μM ** | 46.4 μM (1.0 μM) | [132] |
| Tween 20-AuNPs | lipase | 0.5 M PBS, 2 M NaCl (pH 6.5) | 0.15–1.80 mg/mL | 0.028 mg/mL | n/a | [133] |
| ELISA (Antibodies-online) | lipase | gallus plasma, serum, tissue homogenates | 0.15–10 ng/mL | 0.15 ng/mL |
* Enzyme activity or concentration at which the IC50 value was evaluated. ** Data not given in the reference; the values referred to the measured concentrations.
Table 7.
An overview on recently reported label-free colorimetric biosensors and some commercial ELISA kits for comparison (when available).
Table 7.
An overview on recently reported label-free colorimetric biosensors and some commercial ELISA kits for comparison (when available).
| Transducer | Analyte | Matrix | LR | LOD | Ref. |
|---|---|---|---|---|---|
| aptamer-capped AuNPs | E2 | ultrapure water | 0.1–105 ng/mL | 0.1 ng/mL | [135] |
| ELISA (Cayman Chemical) | E2 | cit plasma, EDTA plasma, hep plasma, serum, urine | 0.61–104 pg/mL | 6 pg/mL | |
| aptamer-capped AuNPs | E2 | filter river water | 200–800 pM | 200 pM | [138] |
| E2 | spiked rat urine | 50–800 nM | 5 nM | ||
| ELISA (Cayman Chemical) | E2 | cit plasma, EDTA plasma, hep plasma, serum, urine | 0.61–104 pg/mL | 6 pg/mL | |
| aptamer-capped AuNPs | E2 | ultrapure water | 0.02–10 μg/mL | 0.02 μg/mL * | [139] |
| ELISA (Cayman Chemical) | E2 | cit plasma, EDTA plasma, hep plasma, serum, urine | 0.61–104 pg/mL | 6 pg/mL | |
| AuNP@CTAB/ATP | ALP | Tris-HCl buffer | 100–600 unit/mL | 10 unit/mL | [140] |
| AuNP@CTAB/ATP/Ca2+ | ALP | Tris-HCl buffer | 5.0–100 unit/mL | 3.5 unit/mL | |
| AuNP@CTAB/ATP/Pb2+ | ALP | Tris-HCl buffer | 0.2–20 unit/mL | 0.1 unit/mL | |
| ELISA (MyBioSource) | ALP | human serum, plasma, tissue homogenates | 0.156–10 ng/mL | 0.156 ng/mL | |
| AuNPs@Asp-Glu-Val-Asp,DEVD | caspase-3 | GR-8 solution | 0.01–0.15 μg/mL | 0.005 μg/mL | [141] |
| ELISA (Thermo Fisher Scientific) | caspase-3 | human serum, plasma, supernatant | 0.16–10.0 ng/mL | 0.16 ng/mL | |
| AuNPs@dsDNA | DNase 1 | Tris-HCl buffer | 0–35 unit/L | 7.1 unit/L | [142] |
| citrate-capped AuNPs | adenosine deaminase | buffer solution | 0–15 U/L | 0.8227 U/L | [143] |
| ELISA (MyBioSource) | human adenosine deaminase | serum, urine, tissue homogenates | 1.56–100 mIU/mL | 1.56 mIU/mL | |
| citrate-capped AuNPs | adenosine deaminase | HEPES buffer | 0–21 U/L | 1.526 U/L | [144] |
| ELISA (MyBioSource) | human adenosine deaminase | serum, urine, tissue homogenates | 1.56–100 mIU/mL | 1.56 mIU/mL |
* Data not given in the reference; the values referred to the measured concentrations.
Table 8.
An overview on recently reported enzyme-mimic colorimetric biosensors and some commercial ELISA kits for comparison (when available).
Table 8.
An overview on recently reported enzyme-mimic colorimetric biosensors and some commercial ELISA kits for comparison (when available).
| Transducer | Enzyme-Mimic | Analyte | Matrix (pH) | LR | LOD | Ref. |
|---|---|---|---|---|---|---|
| FeS2NPs | peroxidase-like | H2O2 | acetate buffer (4.0) | 2–80 μM | 0.91 μM | [34] |
| GSH | acetate buffer (4.0) | 0.2–35 μM | 0.15 μM | |||
| ELISA (MyBioSource) | GSH | serum, plasma, cell culture supernatant | 1.56–100 μg/mL | 1.56 μg/mL | ||
| DNA/MoS2-NSs | peroxidase-like | carcinoembryonic antigen | acetate buffer (4.0) | 50–1000 ng/mL | 50 ng/mL | [160] |
| ELISA (Abcam) | carcinoembryonic antigen | serum, plasma, cell culture supernatant | 0.343–250 ng/mL | 0.343 ng/mL | ||
| NL-MnCaO2 | glucose oxidase-like | glucose | acetate buffer (5.0) | 18.3–421 μM | 23.86 μM | [161] |
| human serum | 0–82.3 μM | 6.12 μM | ||||
| ELISA (Abcam) | glucose | cell culture supernatant, urine, serum, plasma | 1–10,000 µM | 1 µM | ||
| FeCo@C | oxidase-like | hydroquinone | acetate buffer (3.6) | 1–30 μM | 0.8 μM | [162] |
| peroxidase-like | H2O2 | acetate buffer (4.4) | 1–240 μM | 1 μM | ||
| Mo-CQDs | peroxidase-like | H2O2 | acetate buffer (4.0) | 5–50 μM | - | [168] |
| cholesterol | acetate buffer (4.0) | 10–600 μM | 7 μM | |||
| ELISA (LifeSpan BioSciences) | human cholesterol | plasma, serum | 0.5–10 mM | 0.5 mM | ||
| magnetic hierarchical Co3O4 nanoflowers | oxidase-like | ACP | acetate buffer (4.5) | 0.1–25 U/L | 0.062 U/L | [169] |
| peroxidase-like | H2O2 | air | 4–400 μM | 2 μM | ||
| ELISA (Abcam) | ACP | cell culture media, cell lysate, plasma, serum, tissue extracts, urine | 0.001–1 mM | 0.001 mM |
Table 9.
An overview on recently reported etching-based colorimetric biosensors and some commercial ELISA kits for comparison (when available).
Table 9.
An overview on recently reported etching-based colorimetric biosensors and some commercial ELISA kits for comparison (when available).
| Transducer | Analyte | Matrix | LR | LOD | Ref. |
|---|---|---|---|---|---|
| AuNRs | molybdate | acetate buffer solution | 3–70 nM | 1 nM | [175] |
| AuNBPs | telomerase extracts from HeLa cells | buffer solution | 5–1000 cells | 1 cell 20 cells (naked-eye) | [35] |
| ELISA (MyBioSource) | telomerase | serum, plasma, tissue homogenates | 0.625–20 ng/mL | 0.625 ng/mL | |
| AuNBP@MnO2NSs | exosome | buffer solution | 6.8 × 10⁴–1.5 × 10⁵ particles/μL (low-AR) | 2.20 × 10³ particles/μL (low-AR) | [176] |
| 8.5 × 10²–8.5 × 10⁴ particles/μL (high-AR) | 1.35 × 10² particles/μL (high-AR) | ||||
| AuNRs | PARP-1 | buffer solution | 0.05–2 U | 0.02 U | [181] |
| ELISA (MyBioSource) | PARP-1 | serum, plasma, tissue homogenates, cell lysates | 15.6–1000 pg/mL | 15.6 pg/mL | |
| Ab-GOx-MBs/AgNPRs | PSA | foetal bovine serum | 10–105 fg/mL | 4.1 fg/mL | [182] |
| ELISA (Abcam) | human PSA | cell culture supernatant, cit plasma, EDTA plasma, hep plasma, serum, urine | 39–2500 pg/mL | 39 pg/mL | |
| DMAP-AuNPs | dopamine | deionized water | 10–100 nM | 5 nM | [183] |
| ELISA (Abcam) | dopamine | cell culture supernatant, plasma, serum, tissue homogenate | 1.56–100 ng/mL | 1.56 ng/mL | |
| AuNRs | carcinoembryonic antigen | human serum | 2.5–60 ng/mL * | 2.5 ng/mL | [184] |
| ELISA (Abcam) | carcinoembryonic antigen | serum, plasma, cell culture supernatant | 0.343–250 ng/mL | 0.343 ng/mL | |
| AuNRs | prostate specific antigen | human serum | 75–1275 pg/mL * | 75 pg/mL | [184] |
| ELISA (Abcam) | human PSA | cell culture supernatant, cit plasma, EDTA plasma, hep plasma, serum, urine | 39–2500 pg/mL | 39 pg/mL |
* Data not given in the reference; the values referred to the measured concentrations.
Table 10.
An overview on recently reported growth-based colorimetric biosensors and some commercial ELISA kits for comparison (when available).
Table 10.
An overview on recently reported growth-based colorimetric biosensors and some commercial ELISA kits for comparison (when available).
| Transducer | Analyte | Matrix | LR | LOD | Ref. |
|---|---|---|---|---|---|
| AgNPs | pAP | human urine | 0–85 μM | 0.32 μM | [187] |
| ELISA (Abcam) | human pAP | cell culture media, cell culture supernatant, cit plasma, EDTA plasma, hep plasma, serum, urine | 37.5–2400 pg/mL | 37.5 pg/mL | |
| AuNRs | EA | buffer solution | 0–20 μM | 0.040 μM | [188] |
| AuNRs | β-gal | buffer solution | 0–2 nM | 0.128 nM | [189] |
| ELISA (LifeSpan BioSciences) | β-gal | plasma, serum | 0.313–20 mU/mL | 0.313 mU/mL | |
| AuNRs | E. coli | buffer solution | 104–106 CFU/mL * | 1 × 10⁴ CFU/mL | [189] |
| ELISA (Immuno-Biological Laboratories) | E. coli O157:H7 | food, water | 6.25 × 10³–4 × 10⁵ CFU/mL | 6.25 × 10³ CFU/mL | |
| AuNBs | H5N1 | buffer solution | 1–2.5 × 10³ pg/mL | 1 pg/mL | [191] |
| AuNPs | ochratoxin | buffer solution | 12.5–125 nM * | 1 nM | [193] |
| ELISA (MyBioSource) | ochratoxin A | cereal, feed | 0.1–8.1 ppb | 0.1 ppb | |
| AuNPs | cocaine | synthetic urine sample | 0.1–100 nM * | 1 nM | [193] |
| ELISA (MyBioSource) | human cocaine-regulated transcript protein | serum, plasma, tissue homogenates | 15.6–1000 pg/mL | 15.6 pg/mL | |
| AuNPs | E2 | synthetic saliva sample | 0.01–104 nM * | 0.2 nM | [193] |
| ELISA (Cayman Chemical) | E2 | cit plasma, EDTA plasma, hep plasma, serum, urine | 0.61–104 pg/mL | 6 pg/mL |
* Data not given in the reference; the values referred to the measured concentrations.
Publisher’s Note: MDPI stays neutral with regard to jurisdictional claims in published maps and institutional affiliations. |
© 2022 by the authors. Licensee MDPI, Basel, Switzerland. This article is an open access article distributed under the terms and conditions of the Creative Commons Attribution (CC BY) license (https://creativecommons.org/licenses/by/4.0/).
Share and Cite
MDPI and ACS Style
Acunzo, A.; Scardapane, E.; De Luca, M.; Marra, D.; Velotta, R.; Minopoli, A. Plasmonic Nanomaterials for Colorimetric Biosensing: A Review. Chemosensors 2022, 10, 136. https://0-doi-org.brum.beds.ac.uk/10.3390/chemosensors10040136
AMA Style
Acunzo A, Scardapane E, De Luca M, Marra D, Velotta R, Minopoli A. Plasmonic Nanomaterials for Colorimetric Biosensing: A Review. Chemosensors. 2022; 10(4):136. https://0-doi-org.brum.beds.ac.uk/10.3390/chemosensors10040136
Chicago/Turabian StyleAcunzo, Adriano, Emanuela Scardapane, Maria De Luca, Daniele Marra, Raffaele Velotta, and Antonio Minopoli. 2022. "Plasmonic Nanomaterials for Colorimetric Biosensing: A Review" Chemosensors 10, no. 4: 136. https://0-doi-org.brum.beds.ac.uk/10.3390/chemosensors10040136
Note that from the first issue of 2016, this journal uses article numbers instead of page numbers. See further details here.