
Folic Acid-Modified Cerium-Doped Carbon Dots as Photoluminescence Sensors for Cancer Cells Identification and Fe(III) Detection

 ,
,
Abstract
:1. Introduction
2. Experimental
2.1. Materials and Reagents
2.2. Characterization
2.3. Preparation of Ce-CDs-FA Nanocomposites
2.4. Cytotoxicity Assay
2.5. Cellular Bioimaging
2.6. Detection of Fe3+ Ion
3. Results and Discussion
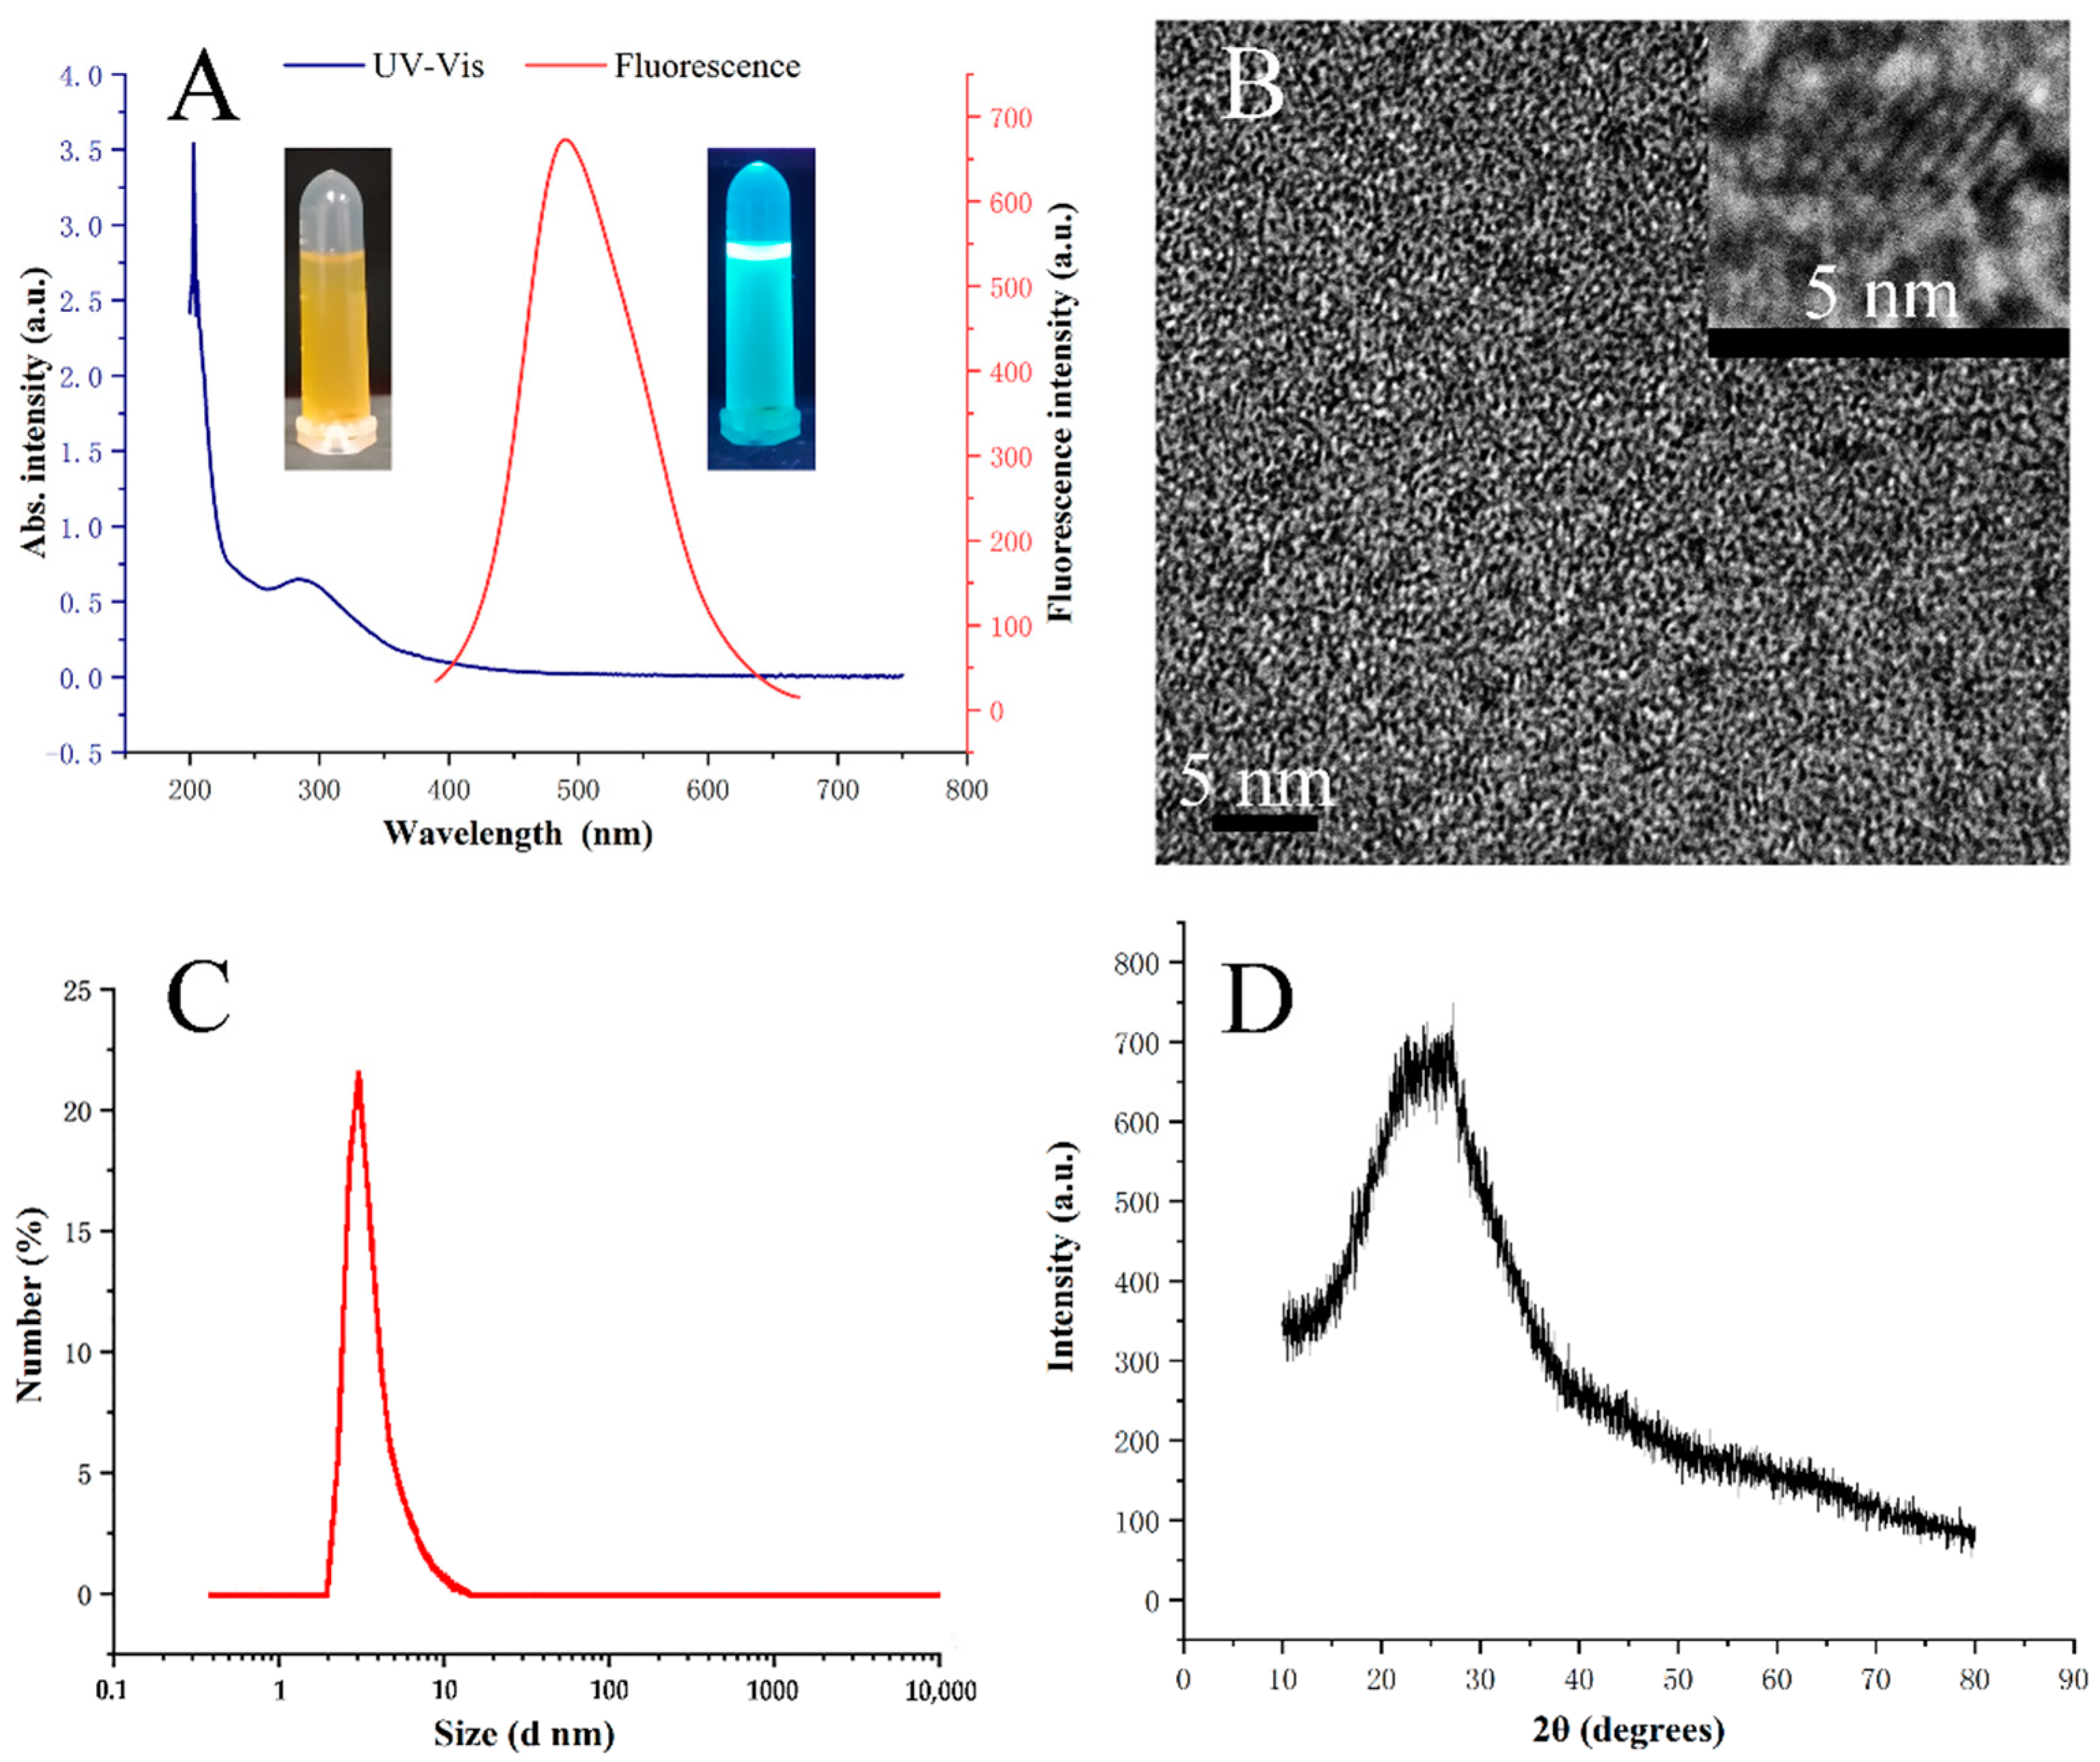
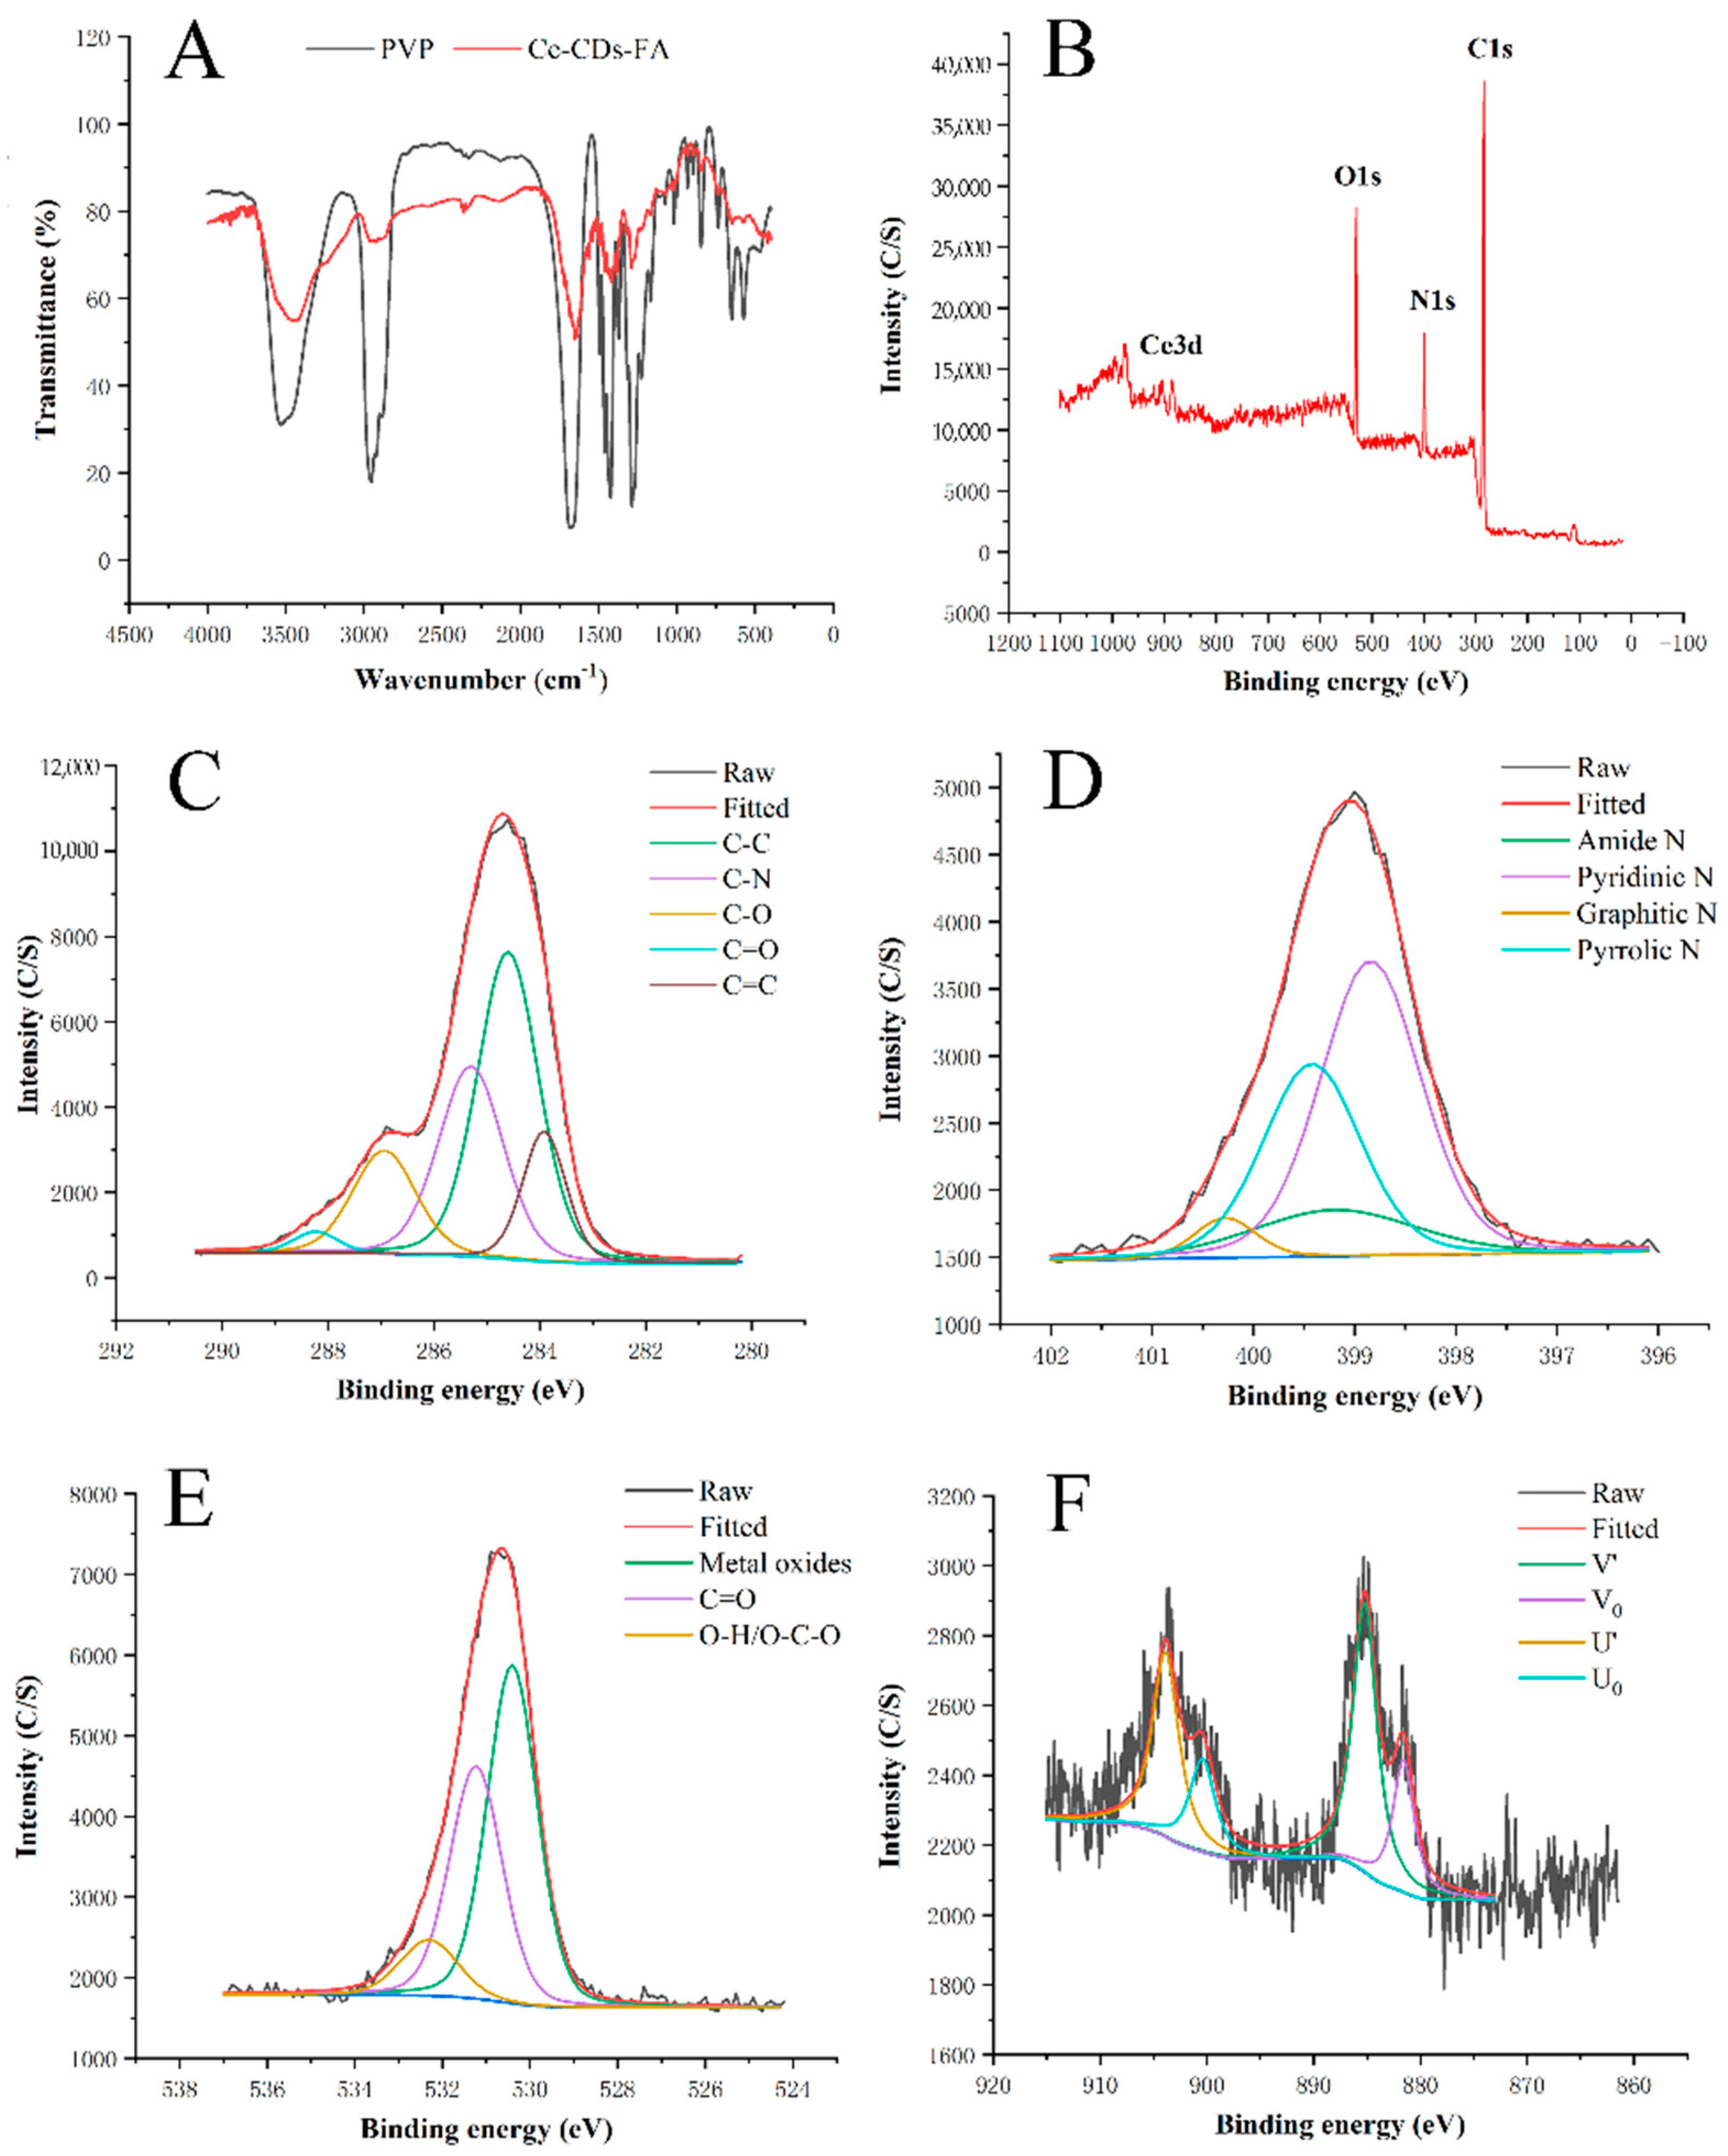
3.1. Characterization
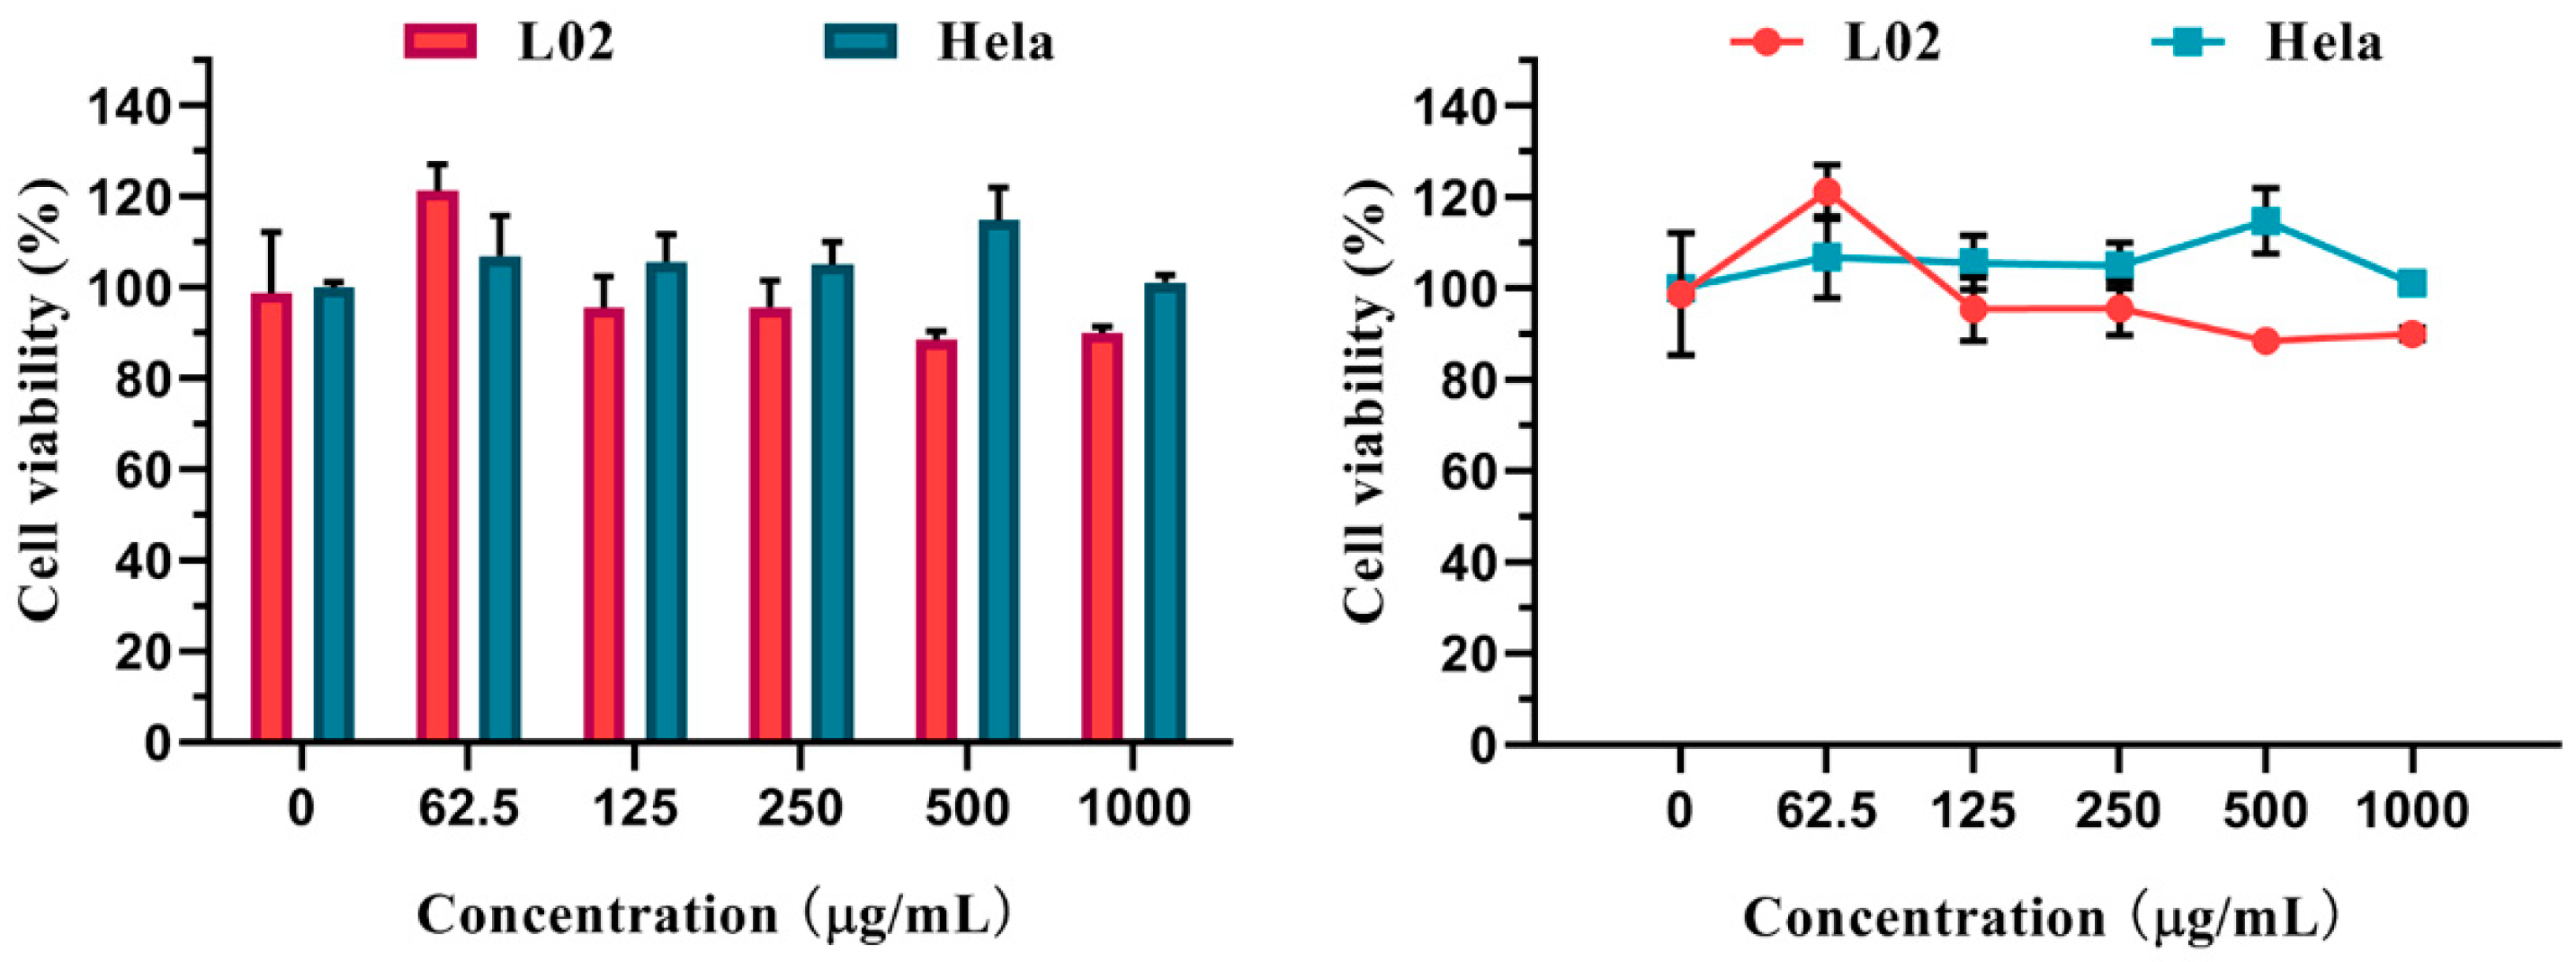
3.2. Cytotoxicity Assay
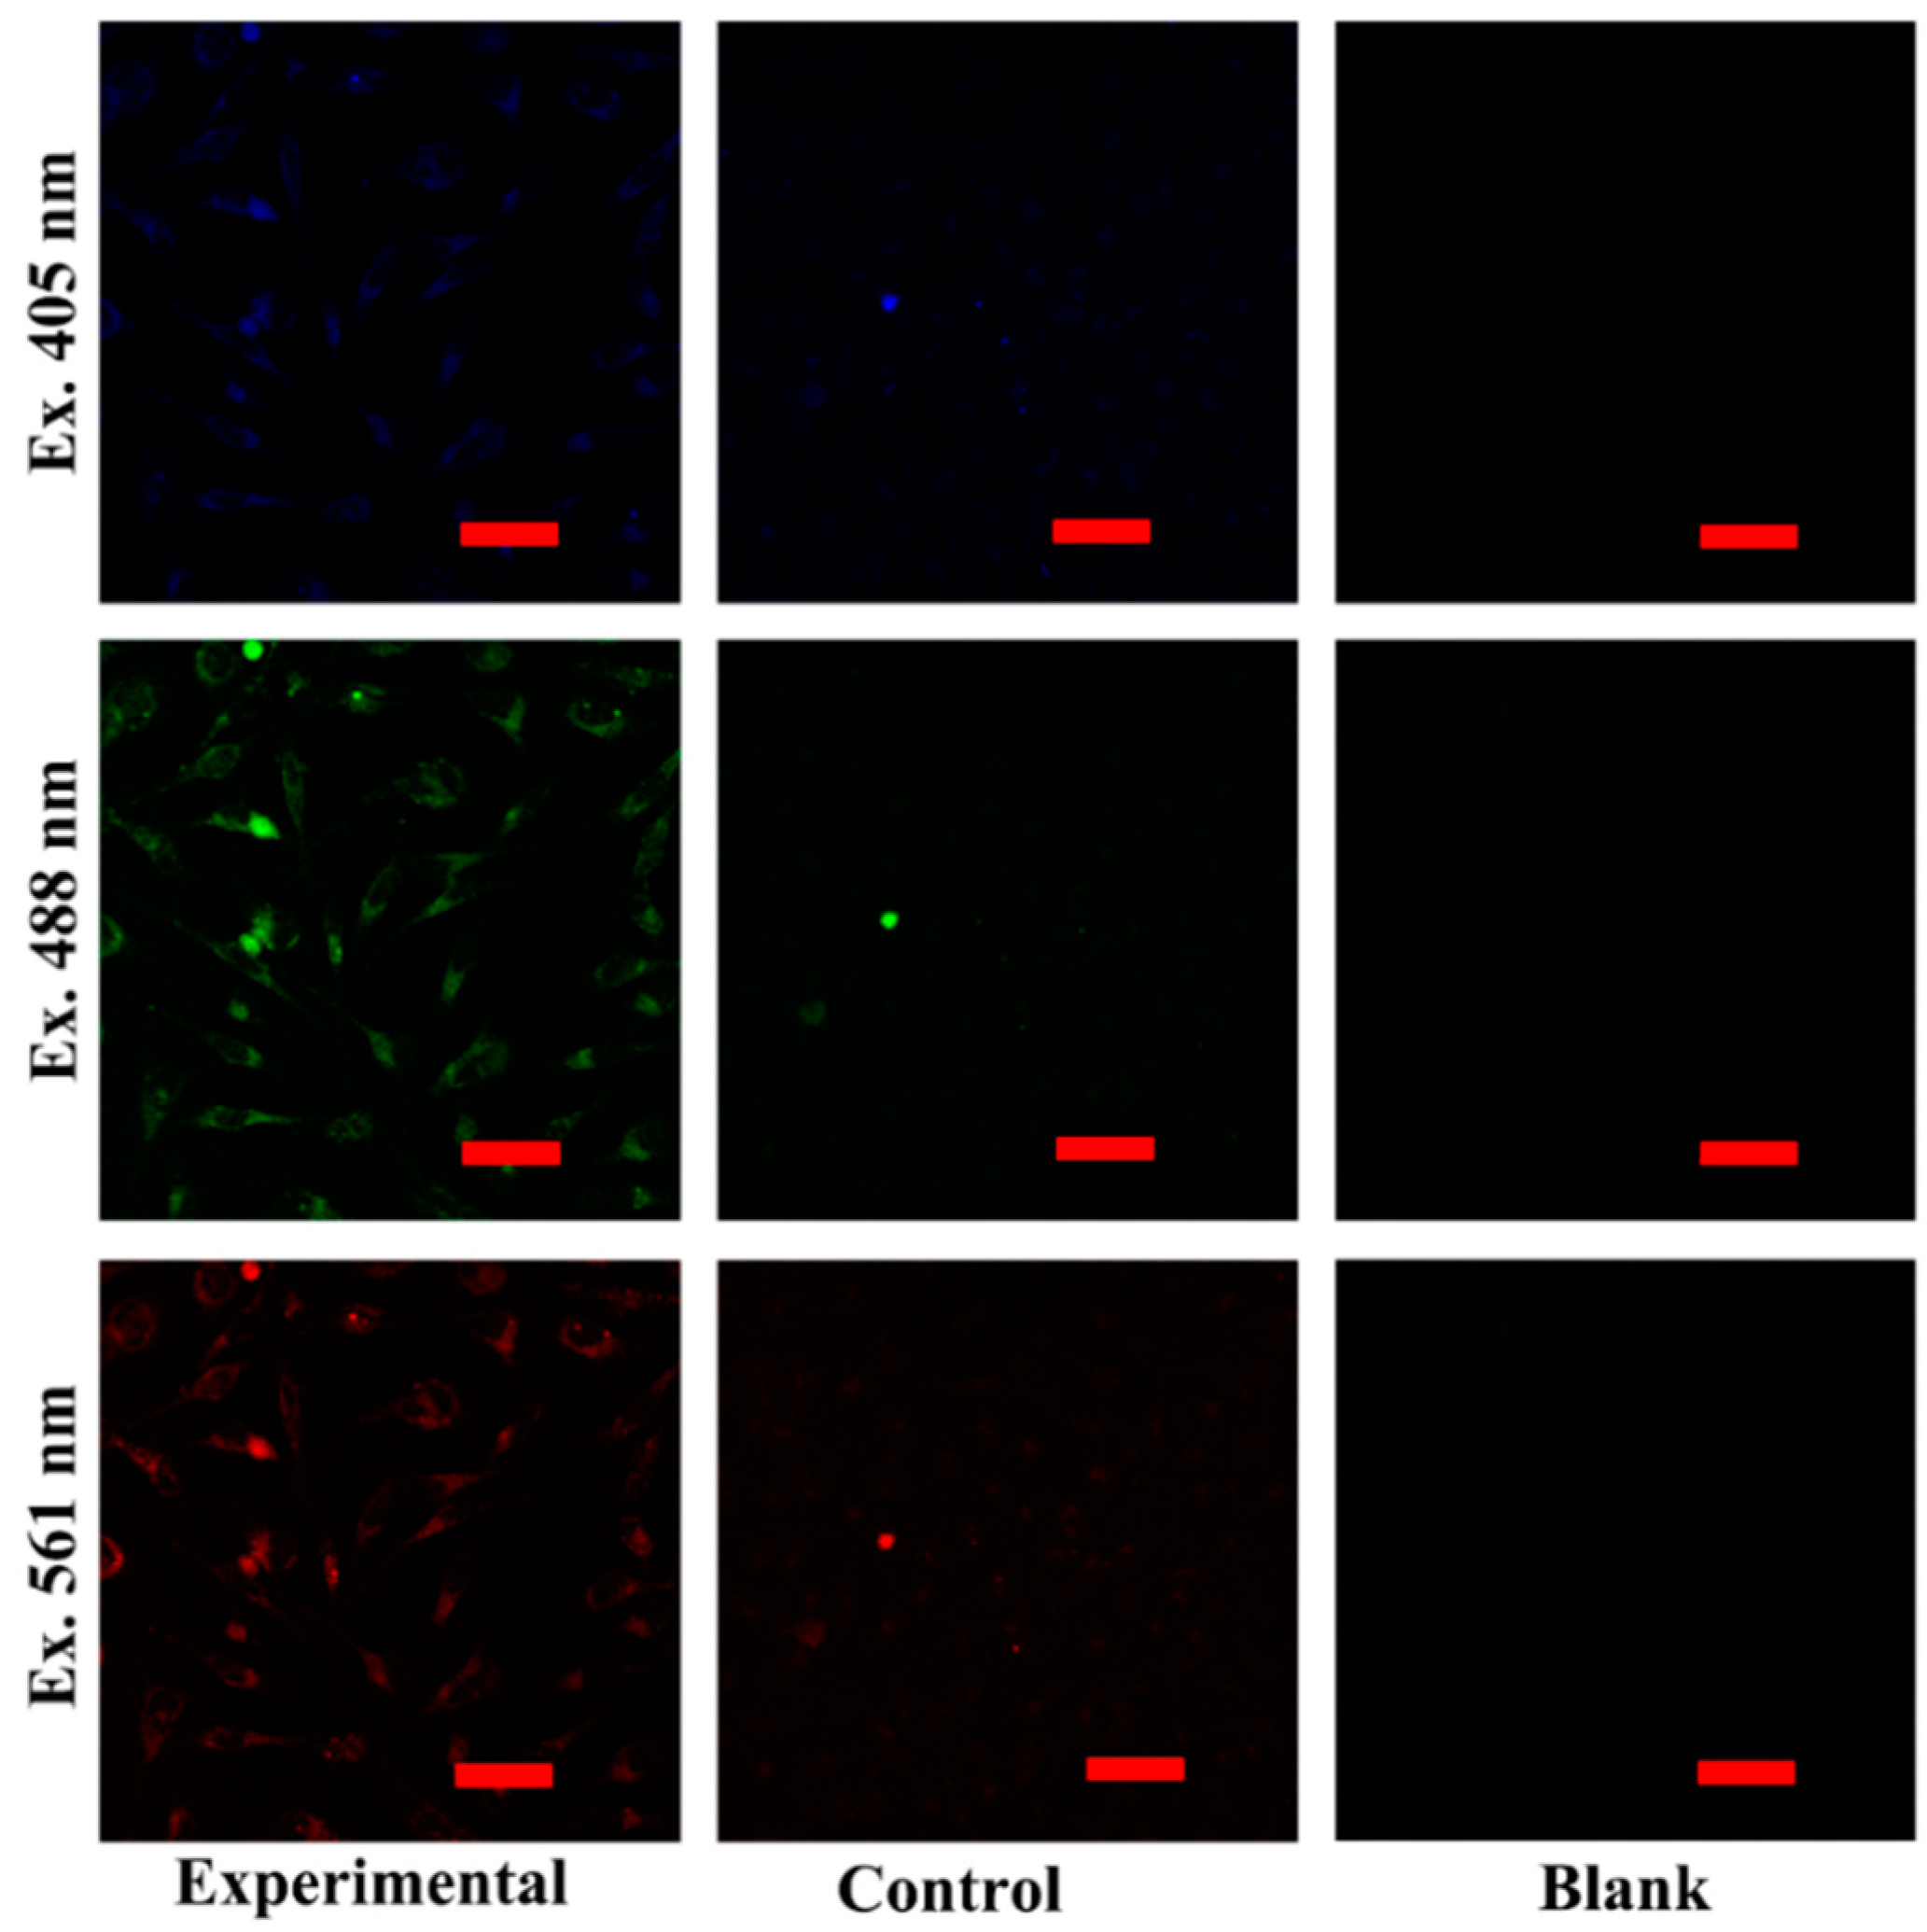
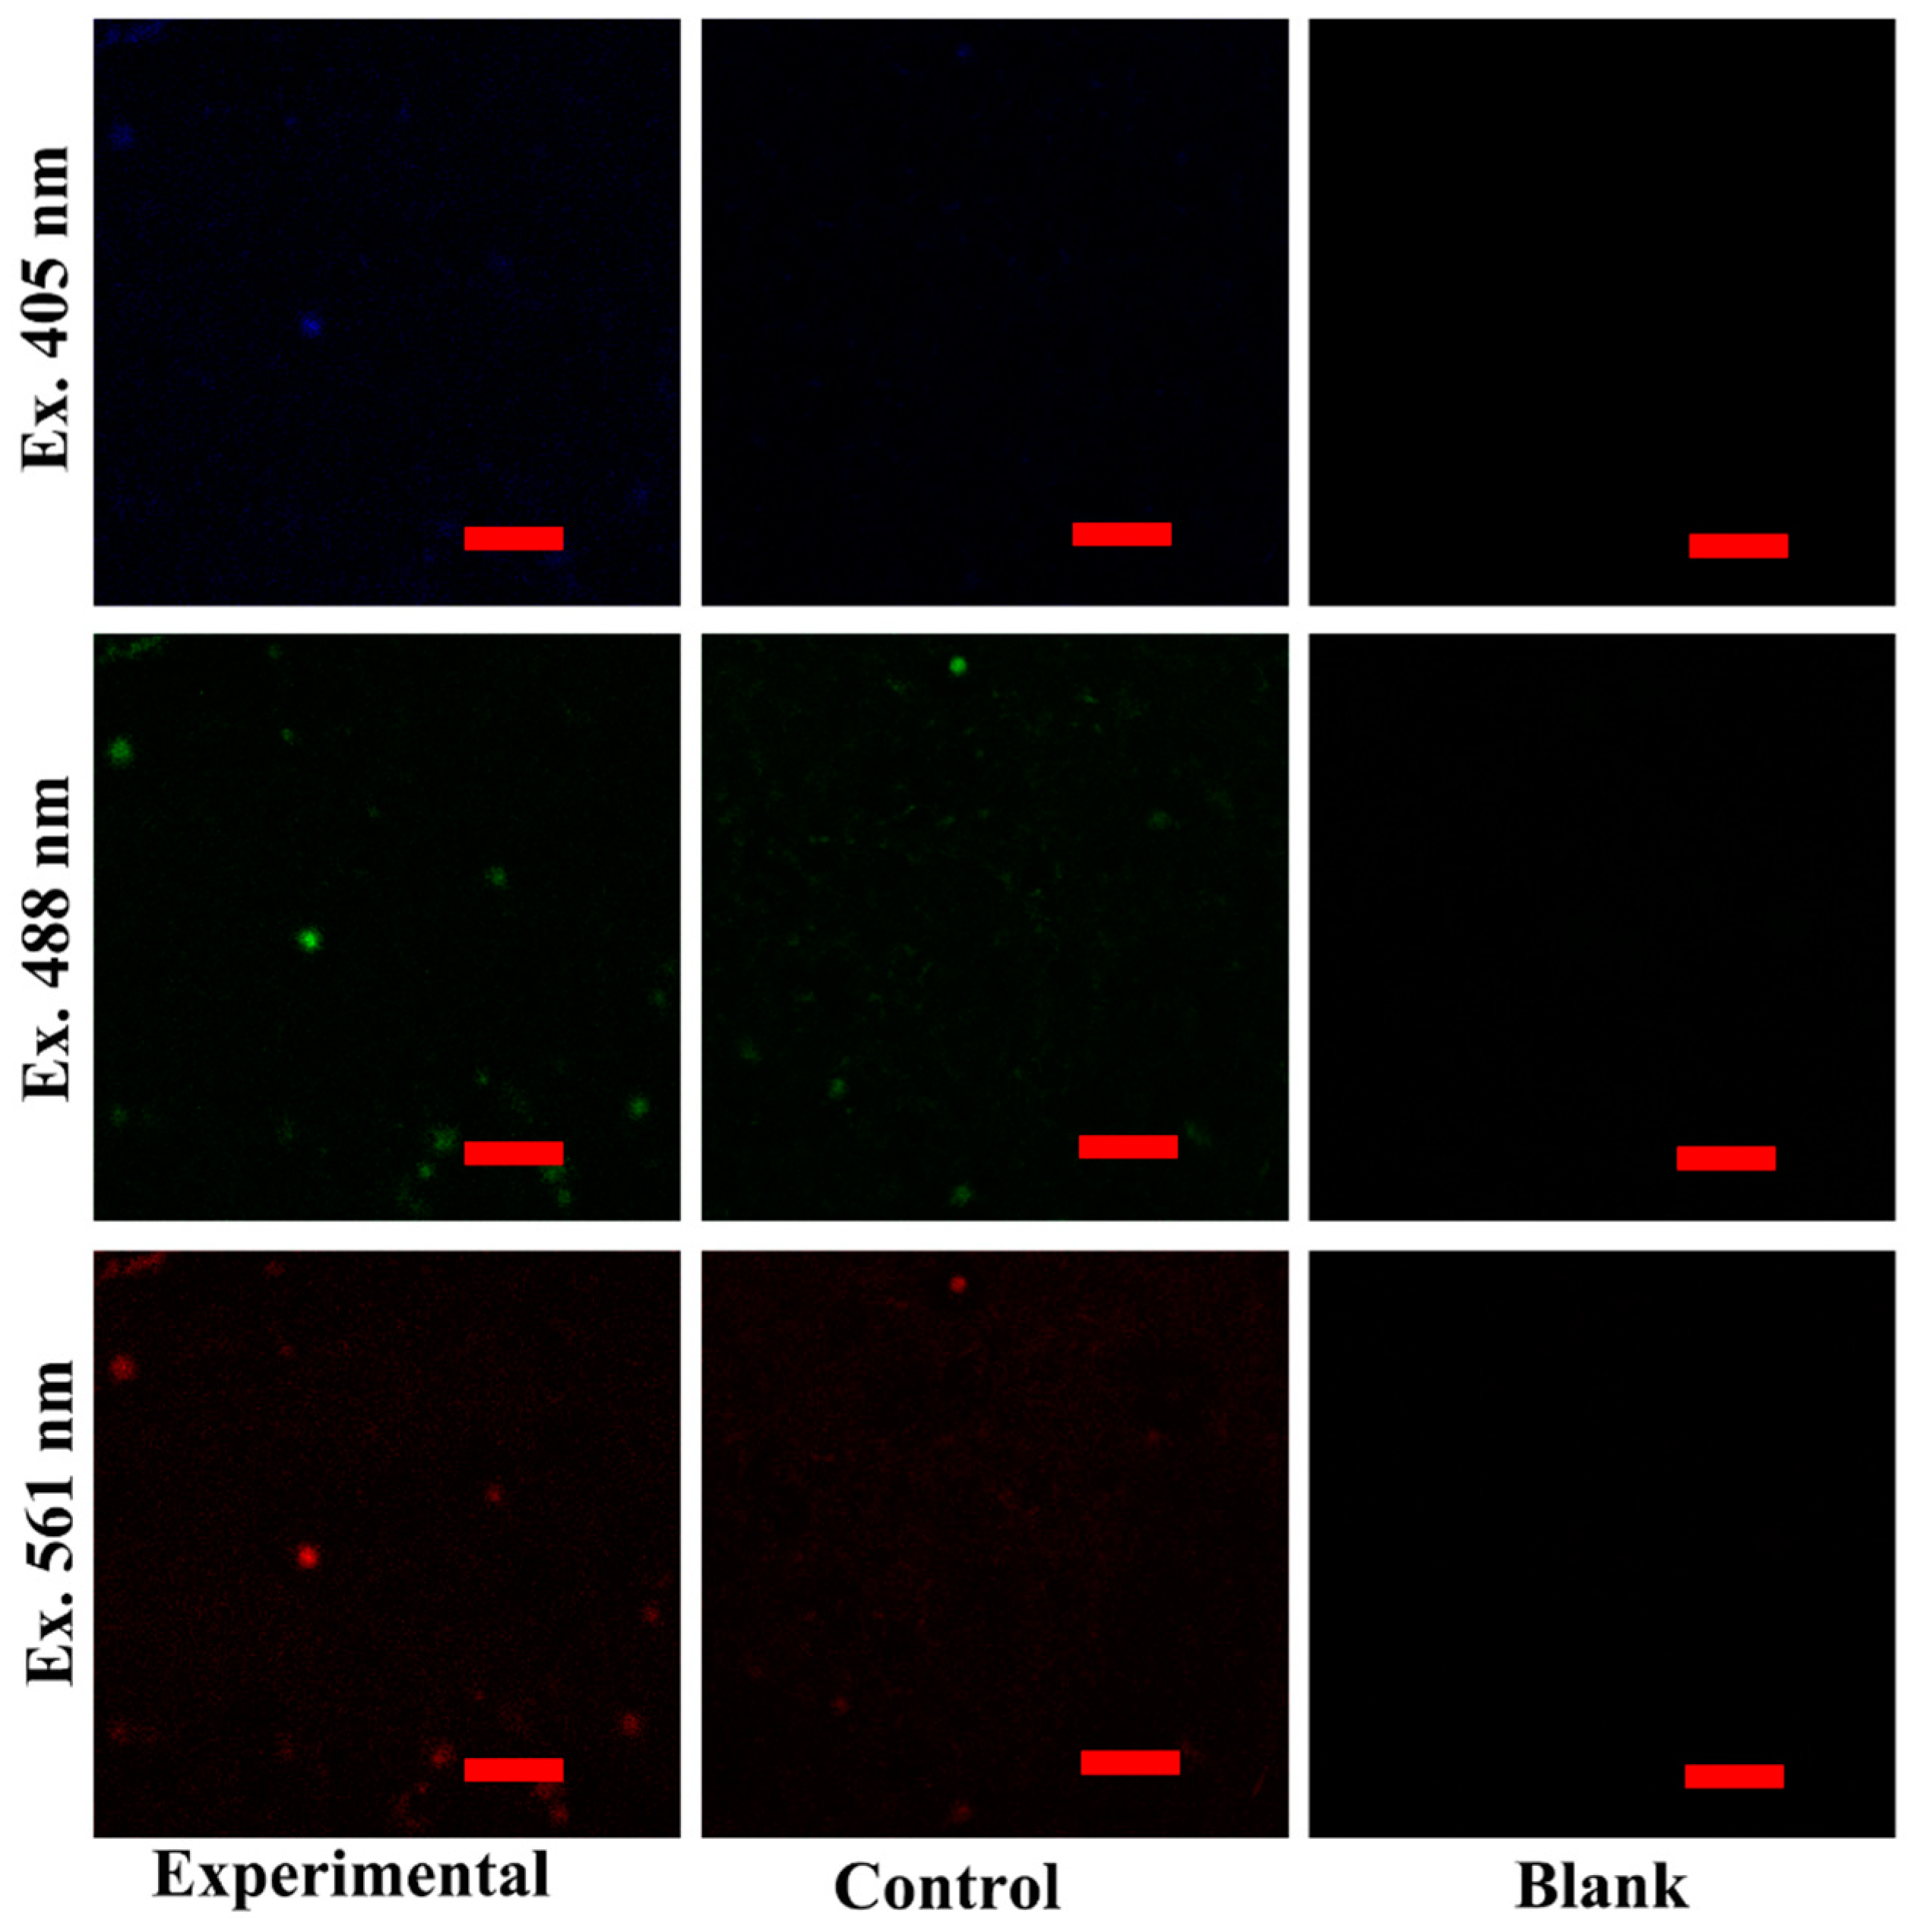
3.3. Targeted Multicolored Bioimaging
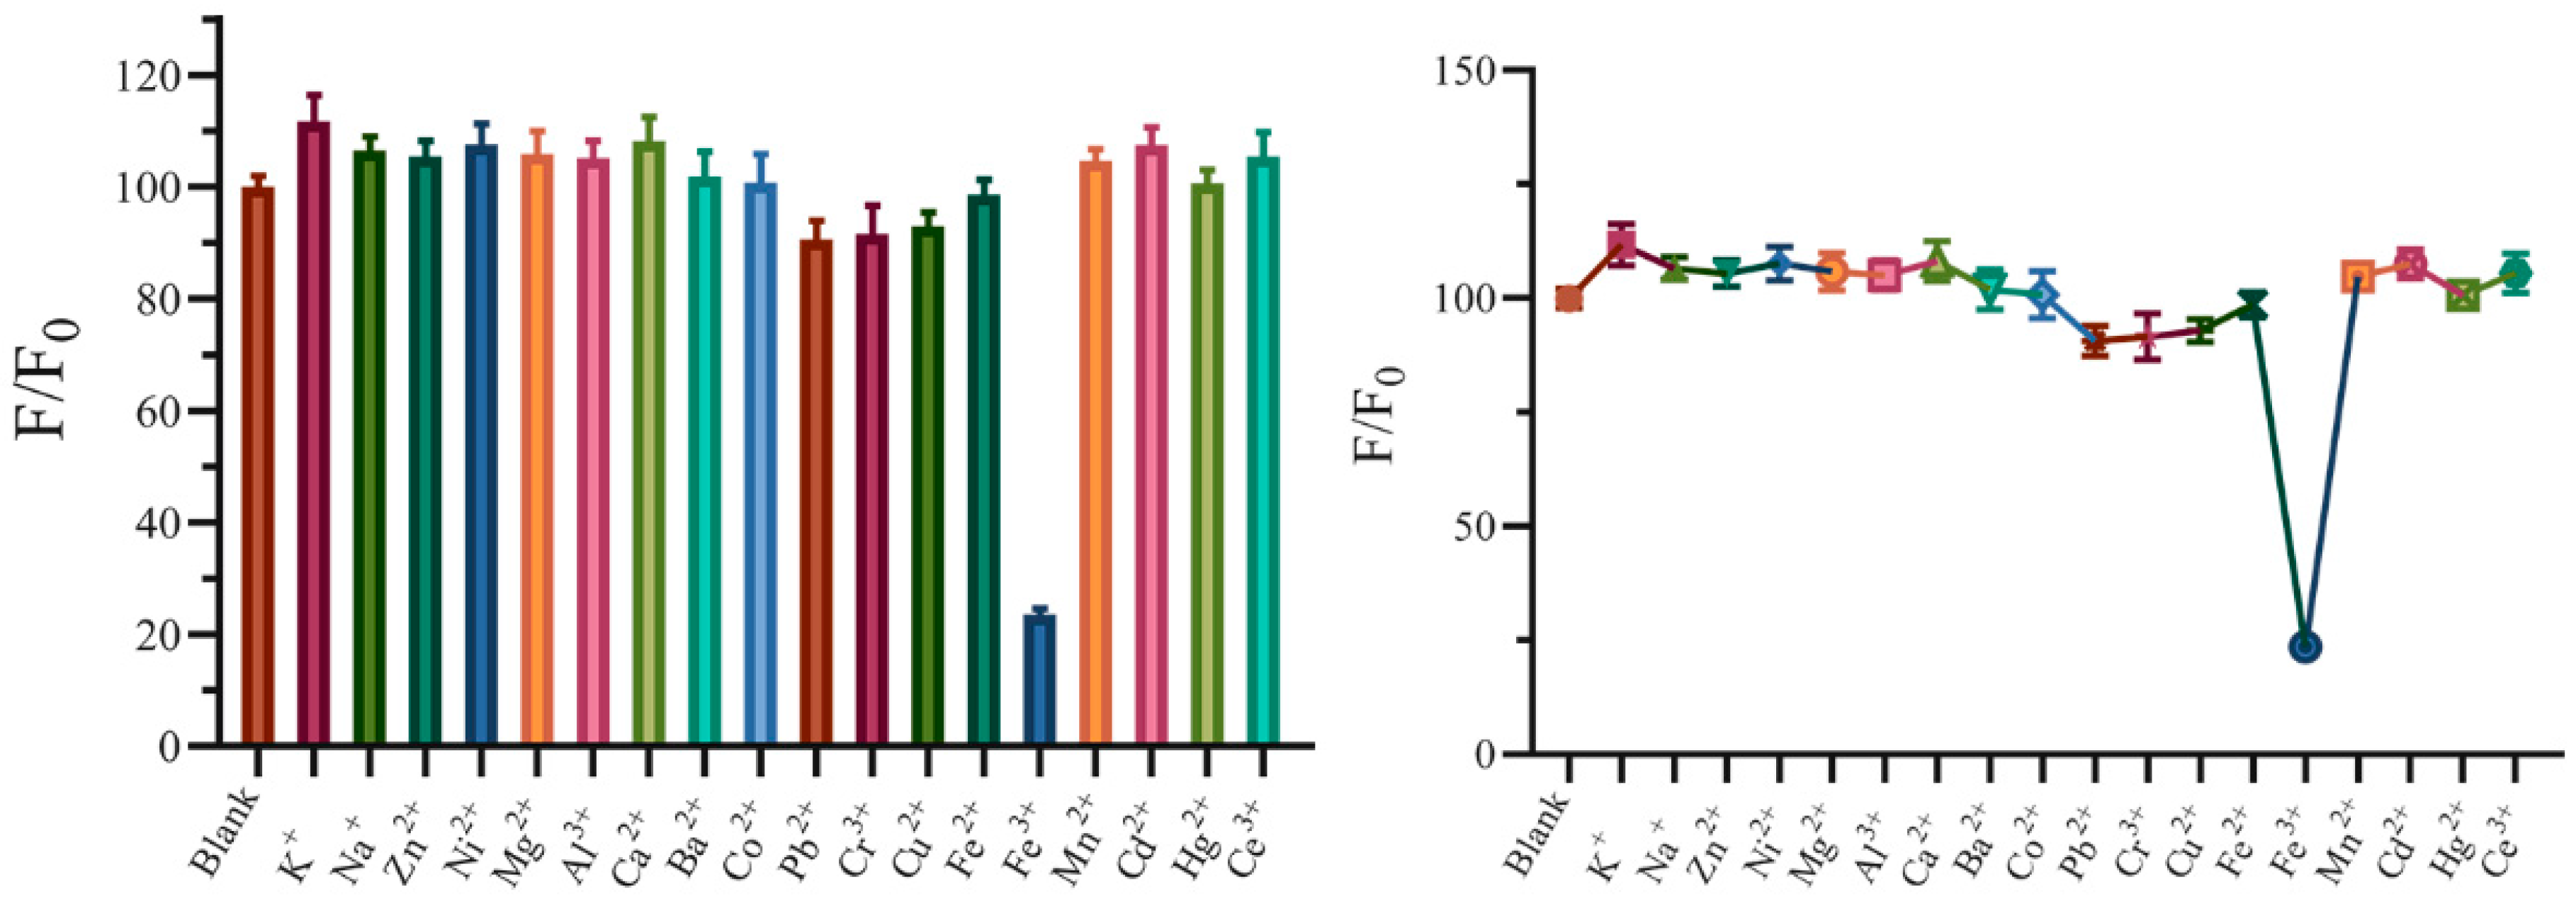
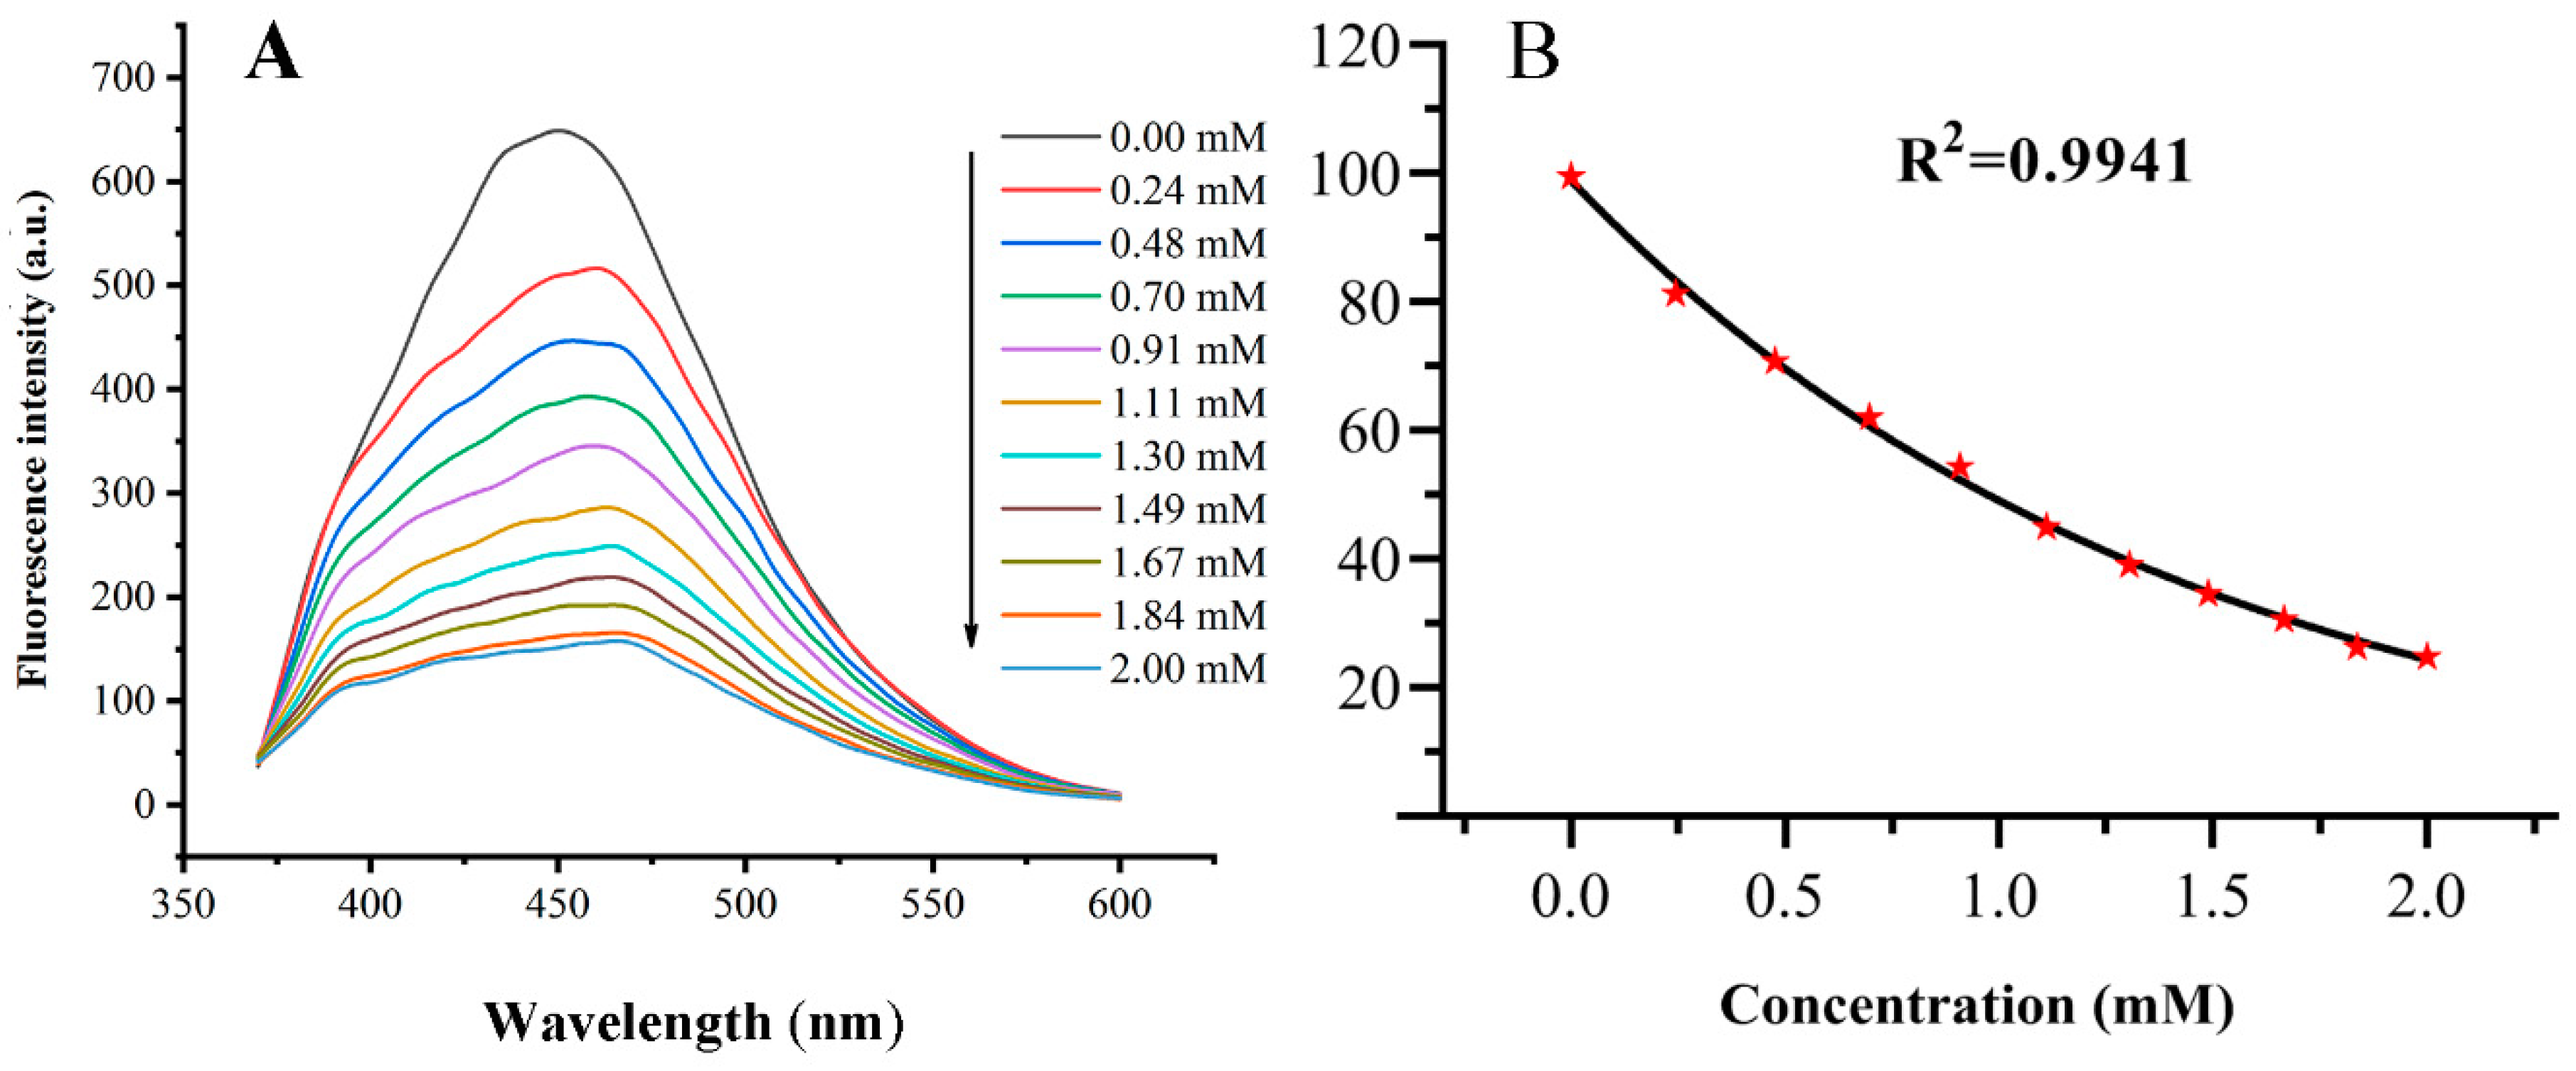
3.4. Detection of Fe(III)
4. Conclusions
Author Contributions
Funding
Institutional Review Board Statement
Informed Consent Statement
Data Availability Statement
Conflicts of Interest
References
- Liu, J.; Li, R.; Yang, B. Carbon Dots: A New Type of Carbon-Based Nanomaterial with Wide Applications. ACS Cent. Sci. 2020, 6, 2179–2195. [Google Scholar] [CrossRef] [PubMed]
- Mukhtar, M.; Bilal, M.; Rahdar, A.; Barani, M.; Arshad, R.; Behl, T.; Brisc, C.; Banica, F.; Bungau, S. Nanomaterials for Diagnosis and Treatment of Brain Cancer: Recent Updates. Chemosensors 2020, 8, 117. [Google Scholar] [CrossRef]
- Xu, D.; Lei, F.; Chen, H.; Yin, L.; Shi, Y.; Xie, J. One-step hydrothermal synthesis and optical properties of self-quenching-resistant carbon dots towards fluorescent ink and as nanosensors for Fe3+ detection. RSC Adv. 2019, 9, 8290–8299. [Google Scholar] [CrossRef] [PubMed] [Green Version]
- Zulfajri, M.; Liu, K.; Pu, Y.; Rasool, A.; Dayalan, S.; Huang, G.G. Utilization of Carbon Dots Derived from Volvariella volvacea Mushroom for a Highly Sensitive Detection of Fe3+ and Pb2+ Ions in Aqueous Solutions. Chemosensors 2020, 8, 47. [Google Scholar] [CrossRef]
- Li, L.; Dong, T. Photoluminescence tuning in carbon dots: Surface passivation or/and functionalization, heteroatom doping. J. Mater. Chem. C 2018, 6, 7797–7944. [Google Scholar] [CrossRef]
- Liu, J.; Li, D.; Zhang, K.; Yang, M.; Sun, H.; Yang, B. One-Step Hydrothermal Synthesis of Nitrogen-Doped Conjugated Carbonized Polymer Dots with 31% Efficient Red Emission for In Vivo Imaging. Small 2018, 14, 1703919. [Google Scholar] [CrossRef]
- Yuan, F.; Yuan, T.; Sui, L.; Wang, Z.; Xi, Z.; Li, Y.; Li, X.; Fan, L.; Tan, Z.; Chen, A.; et al. Engineering triangular carbon quantum dots with unprecedented narrow bandwidth emission for multicolored LEDs. Nat. Commun. 2018, 9, 1–11. [Google Scholar] [CrossRef]
- Yu, J.; Yong, X.; Tang, Z.; Yang, B.; Lu, S. Theoretical Understanding of Structure-Property Relationships in Luminescence of Carbon Dots. J. Phys. Chem. Lett. 2021, 12, 7671–7687. [Google Scholar] [CrossRef]
- Zhu, S.; Song, Y.; Zhao, X.; Shao, J.; Zhang, J.; Yang, B. The photoluminescence mechanism in carbon dots (graphene quantum dots, carbon nanodots, and polymer dots): Current state and future perspective. Nano Res. 2015, 8, 355–381. [Google Scholar] [CrossRef]
- Liyanage, P.Y.; Graham, R.M.; Pandey, R.R.; Chusuei, C.C.; Mintz, K.J.; Zhou, Y.; Harper, J.K.; Wu, W.; Wikramanayake, A.H.; Vanni, S.; et al. Carbon Nitride Dots: A Selective Bioimaging Nanomaterial. Bioconjugate Chem. 2019, 30, 111–123. [Google Scholar] [CrossRef]
- Karakocak, B.B.; Laradji, A.; Primeau, T.; Berezin, M.Y.; Li, S.; Ravi, N. Hyaluronan-Conjugated Carbon Quantum Dots for Bioimaging Use. ACS Appl. Mater. Inter. 2021, 13, 277–286. [Google Scholar] [CrossRef] [PubMed]
- Shen, P.; Gao, J.; Cong, J.; Liu, Z.; Li, C.; Yao, J. Synthesis of Cellulose-Based Carbon Dots for Bioimaging. ChemistrySelect 2016, 1, 1314–1317. [Google Scholar] [CrossRef]
- Su, R.; Yan, H.; Jiang, X.; Zhang, Y.; Li, P.; Su, W. Orange-red to NIR emissive carbon dots for antimicrobial, bioimaging and bacteria diagnosis. J. Mater. Chem. B 2022, 10, 1250–1264. [Google Scholar] [CrossRef] [PubMed]
- Loo, A.H.; Sofer, Z.; Bousa, D.; Ulbrich, P.; Bonanni, A.; Pumera, M. Carboxylic Carbon Quantum Dots as a Fluorescent Sensing Platform for DNA Detection. ACS Appl. Mater. Inter. 2016, 8, 1951–1957. [Google Scholar] [CrossRef] [PubMed]
- Guo, X.; Zhang, L.; Wang, Z.; Sun, Y.; Liu, Q.; Dong, W.; Hao, A. Fluorescent carbon dots based sensing system for detection of enrofloxacin in water solutions. Spectroc. Acta Pt. A-Molec. Biomolec. Spectr. 2019, 219, 15–22. [Google Scholar] [CrossRef]
- Yu, C.; Zhang, D.; Zhu, Q.; Chao, D.; Liu, H.; Zhou, L. Preparation and characterisation of dual sensing carbon dots for water and Cu2+ detection. Dye. Pigment. 2022, 198, 110008. [Google Scholar] [CrossRef]
- Gao, X.; Qin, J.; Liu, J.; Yang, Z.; Zhang, G.; Hou, J. Bioinspired Carbon Dots as an Effective Fluorescent Sensing Platform for Tetracycline Detection and Bioimaging. ChemistrySelect 2022, 7, e202104030. [Google Scholar] [CrossRef]
- Wei, W.; Huang, J.; Gao, W.; Lu, X.; Shi, X. Carbon Dots Fluorescence-Based Colorimetric Sensor for Sensitive Detection of Aluminum Ions with a Smartphone. Chemosensors 2021, 9, 25. [Google Scholar] [CrossRef]
- Atchudan, R.; Kishore, S.C.; Edison, T.N.J.I.; Perumal, S.; Vinodh, R.; Sundramoorthy, A.K.; Babu, R.S.; Alagan, M.; Lee, Y.R. Highly Fluorescent Carbon Dots as a Potential Fluorescence Probe for Selective Sensing of Ferric Ions in Aqueous Solution. Chemosensors 2021, 9, 301. [Google Scholar] [CrossRef]
- Afonso, A.C.P.; Correia, A.S.; Duarte, D.; Brandão, A.T.S.C.; de Yuso, M.D.V.M.; Jiménez-Jiménez, J.; Vale, N.; Pereira, C.M.; Algarra, M.; Pinto Da Silva, L. An Active Surface Preservation Strategy for the Rational Development of Carbon Dots as pH-Responsive Fluorescent Nanosensors. Chemosensors 2021, 9, 191. [Google Scholar] [CrossRef]
- Hu, S.; Yang, C.; Huang, Y.; Huang, C.; Chen, Y.; Chang, H. Ratiometric Fluorescence Probe of Vesicle-like Carbon Dots and Gold Clusters for Quantitation of Cholesterol. Chemosensors 2022, 10, 160. [Google Scholar] [CrossRef]
- Li, C.; Wang, Y.; Jiang, H.; Wang, X. Review-Intracellular Sensors Based on Carbonaceous Nanomaterials: A Review. J. Electrochem. Soc. 2020, 167, 37540. [Google Scholar] [CrossRef] [Green Version]
- Fowley, C.; McHale, A.P.; McCaughan, B.; Fraix, A.; Sortino, S.; Callan, J.F. Carbon quantum dot-NO photoreleaser nanohybrids for two-photon phototherapy of hypoxic tumors. Chem. Commun. 2015, 51, 81–84. [Google Scholar] [CrossRef] [PubMed]
- Meena, R.; Singh, R.; Marappan, G.; Kushwaha, G.; Gupta, N.; Meena, R.; Gupta, J.P.; Agarwal, R.R.; Fahmi, N.; Kushwaha, O.S. Fluorescent carbon dots driven from ayurvedic medicinal plants for cancer cell imaging and phototherapy. Heliyon 2019, 5, e2483. [Google Scholar] [CrossRef] [PubMed] [Green Version]
- Bai, Y.; Zhao, J.; Wang, S.; Lin, T.; Ye, F.; Zhao, S. Carbon Dots with Absorption Red-Shifting for Two-Photon Fluorescence Imaging of Tumor Tissue pH and Synergistic Phototherapy. ACS Appl. Mater. Interfaces 2021, 13, 35365–35375. [Google Scholar] [CrossRef] [PubMed]
- Wang, Q.; Huang, X.; Long, Y.; Wang, X.; Zhang, H.; Zhu, R.; Liang, L.; Teng, P.; Zheng, H. Hollow luminescent carbon dots for drug delivery. Carbon 2013, 59, 192–199. [Google Scholar] [CrossRef]
- Chung, H.K.; Wongso, V.; Sambudi, N.S.; Isnaeni. Biowaste-derived carbon dots/hydroxyapatite nanocomposite as drug delivery vehicle for acetaminophen. J. Sol-Gel Sci. Technol. 2020, 93, 214–223. [Google Scholar] [CrossRef]
- Su, W.; Guo, R.; Yuan, F.; Li, Y.; Li, X.; Zhang, Y.; Zhou, S.; Fan, L. Red-Emissive Carbon Quantum Dots for Nuclear Drug Delivery in Cancer Stem Cells. J. Phys. Chem. Lett. 2020, 11, 1357–1363. [Google Scholar] [CrossRef]
- Zhang, Y.; Zhang, J.; Zhang, J.; Lin, S.; Huang, Y.; Yuan, R.; Liang, X.; Xiang, W. Intense enhancement of yellow luminescent carbon dots coupled with gold nanoparticles toward white LED. Dye. Pigment. 2017, 140, 122–130. [Google Scholar] [CrossRef]
- Liu, X.; Zheng, J.; Yang, Y.; Chen, Y.; Liu, X. Preparation of N-doped carbon dots based on starch and their application in white LED. Opt. Mater. 2018, 86, 530–536. [Google Scholar] [CrossRef] [Green Version]
- Zhang, X.; Sun, Z.; Zhu, Z.; Luo, J.; Wu, Z.; Wang, Z. High-efficient, spherical and thermal-stable carbon dots@silica fluorescent composite as rare earth-free phosphors for white LED. Ceram. Int. 2020, 46, 14706–14712. [Google Scholar] [CrossRef]
- Cailotto, S.; Mazzaro, R.; Enrichi, F.; Vomiero, A.; Selva, M.; Cattaruzza, E.; Cristofori, D.; Amadio, E.; Perosa, A. Design of Carbon Dots for Metal-free Photoredox Catalysis. ACS Appl. Mater. Inter. 2018, 10, 40560–40567. [Google Scholar] [CrossRef] [PubMed]
- Hutton, G.A.M.; Reuillard, B.; Martindale, B.C.M.; Caputo, C.A.; Lockwood, C.W.J.; Butt, J.N.; Reisner, E. Carbon Dots as Versatile Photosensitizers for Solar-Driven Catalysis with Redox Enzymes. J. Am. Chem. Soc. 2016, 138, 16722–16730. [Google Scholar] [CrossRef] [PubMed] [Green Version]
- Mahato, D.; Kharwar, Y.P.; Ramanujam, K.; Haridoss, P.; Thomas, T. S, N co-doped graphene quantum dots decorated TiO2 and supported with carbon for oxygen reduction reaction catalysis. Int. J. Hydrogen Energy 2021, 46, 21549–21565. [Google Scholar] [CrossRef]
- Šafranko, S.; Goman, D.; Stanković, A.; Medvidović-Kosanović, M.; Moslavac, T.; Jerković, I.; Jokić, S. An Overview of the Recent Developments in Carbon Quantum Dots-Promising Nanomaterials for Metal Ion Detection and (Bio)Molecule Sensing. Chemosensors 2021, 9, 138. [Google Scholar] [CrossRef]
- Bello, G.L.; Bartoli, M.; Giorcelli, M.; Rovere, M.; Tagliaferro, A. A Review on the Use of Biochar Derived Carbon Quantum Dots Production for Sensing Applications. Chemosensors 2022, 10, 117. [Google Scholar] [CrossRef]
- Meng, W.; Bai, X.; Wang, B.; Liu, Z.; Lu, S.; Yang, B. Biomass-Derived Carbon Dots and Their Applications. Energy Environ. Mater. 2019, 2, 172–192. [Google Scholar] [CrossRef]
- Atchudan, R.; Edison, T.N.J.I.; Perumal, S.; Vinodh, R.; Sundramoorthy, A.K.; Babu, R.S.; Lee, Y.R. Leftover Kiwi Fruit Peel-Derived Carbon Dots as a Highly Selective Fluorescent Sensor for Detection of Ferric Ion. Chemosensors 2021, 9, 166. [Google Scholar] [CrossRef]
- Kou, X.; Jiang, S.; Park, S.; Meng, L. A review: Recent advances in preparations and applications of heteroatom-doped carbon quantum dots. Dalton Trans. 2020, 49, 6915–6938. [Google Scholar] [CrossRef]
- Wang, K.; Dong, J.; Sun, L.; Chen, H.; Wang, Y.; Wang, C.; Dong, L. Effects of elemental doping on the photoluminescence properties of graphene quantum dots. RSC Adv. 2016, 6, 91225–91232. [Google Scholar] [CrossRef]
- Xu, Q.; Kuang, T.; Liu, Y.; Cai, L.; Peng, X.; Sreenivasan Sreeprasad, T.; Zhao, P.; Yu, Z.; Li, N. Heteroatom-doped carbon dots: Synthesis, characterization, properties, photoluminescence mechanism and biological applications. J. Mat. Chem. B 2016, 4, 724–7219. [Google Scholar] [CrossRef] [PubMed]
- Li, F.; Yang, D.; Xu, H. Non-Metal-Heteroatom-Doped Carbon Dots: Synthesis and Properties. Chem.-Eur. J. 2019, 25, 1165–1176. [Google Scholar] [CrossRef] [PubMed]
- Ge, G.; Li, L.; Wang, D.; Chen, M.; Zeng, Z.; Xiong, W.; Wu, X.; Guo, C. Carbon dots: Synthesis, properties and biomedical applications. J. Mat. Chem. B 2021, 9, 6553–6575. [Google Scholar] [CrossRef] [PubMed]
- Li, F.; Li, T.; Sun, C.; Xia, J.; Jiao, Y.; Xu, H. Selenium-Doped Carbon Quantum Dots for Free-Radical Scavenging. Angew. Chem. Int. Edit. 2017, 56, 9910–9914. [Google Scholar] [CrossRef] [PubMed]
- Feng, Q.; Xiao, W.; Liu, Y.; Zheng, Y.; Lin, Y.; Li, J.; Ye, Q.; Huang, Z. Novel Synthesis of Slightly Fluorinated Graphene Quantum Dots with Luminescent and Paramagnetic Properties through Thermal Cutting of Fluorinated Graphene. Materials 2018, 11, 91. [Google Scholar] [CrossRef] [Green Version]
- Zhang, W.; Wang, R.; Liu, W.; Wang, X.; Li, P.; Zhang, W.; Wang, H.; Tang, B. Te-containing carbon dots for fluorescence imaging of superoxide anion in mice during acute strenuous exercise or emotional changes. Chem. Sci. 2018, 9, 721–727. [Google Scholar] [CrossRef] [PubMed] [Green Version]
- Zhang, M.; Ju, H.; Zhang, L.; Sun, M.; Zhou, Z.; Dai, Z.; Zhang, L.; Gong, A.; Wu, C.; Du, F. Engineering iodine-doped carbon dots as dual-modal probes for fluorescence and X-ray CT imaging. Int. J. Nanomed. 2015, 10, 6943–6953. [Google Scholar]
- John, V.L.; Nair, Y.; Vinod, T.P. Doping and Surface Modification of Carbon Quantum Dots for Enhanced Functionalities and Related Applications. Part. Part. Syst. Charact. 2021, 38, 2100170. [Google Scholar] [CrossRef]
- Zhao, Y.; Hao, X.; Lu, W.; Wang, R.; Shan, X.; Chen, Q.; Sun, G.; Liu, J. Facile Preparation of Double Rare Earth-Doped Carbon Dots for MRI/CT/FI Multimodal Imaging. ACS Appl. Nano Mater. 2018, 1, 2544–2551. [Google Scholar] [CrossRef]
- Chu, H.; Yao, D.; Chen, J.; Yu, M.; Su, L. Detection of Hg2+ by a Dual-Fluorescence Ratio Probe Constructed with Rare-Earth-Element-Doped Cadmium Telluride Quantum Dots and Fluorescent Carbon Dots. ACS Omega 2021, 6, 10735–10744. [Google Scholar] [CrossRef]
- Zhang, T.; Zhai, Y.; Wang, H.; Zhu, J.; Xu, L.; Dong, B.; Song, H. Facilely prepared carbon dots and rare earth ion doped hybrid composites for ratio-metric pH sensing and white-light emission. RSC Adv. 2016, 6, 61468–61472. [Google Scholar] [CrossRef]
- Dong, H.; Kuzmanoski, A.; Goessl, D.M.; Popescu, R.; Gerthsen, D.; Feldmann, C. Polyol-mediated C-dot formation showing efficient Tb3+/Eu3+ emission. Chem. Commun. 2014, 50, 7503–7506. [Google Scholar] [CrossRef] [PubMed]
- Du, J.; Qi, S.; Chen, J.; Yang, Y.; Fan, T.; Zhang, P.; Zhuo, S.; Zhu, C. Fabrication of highly active phosphatase-like fluorescent cerium-doped carbon dots for in situ monitoring the hydrolysis of phosphate diesters. RSC Adv. 2020, 10, 41551–41559. [Google Scholar] [CrossRef] [PubMed]
- Zhang, M.; Zhai, X.; Ma, T.; Huang, Y.; Yan, C.; Du, Y. Multifunctional cerium doped carbon dots nanoplatform and its applications for wound healing. Chem. Eng. J. 2021, 423, 130301. [Google Scholar] [CrossRef]
- Cai, R.; Xiao, L.; Qiu, J.; Zhao, L.; Li, Z.; Ju, H.; Sun, M.; Zhu, W.; Wang, Z.; Du, F. Fabrication of cerium doped carbon dots with highly radical scavenging activity alleviates ferroptosis-induced oxidative damage. Nanotechnology 2021, 32, 395605. [Google Scholar] [CrossRef]
- Gong, N.; Wang, H.; Li, S.; Deng, Y.; Chen, X.; Ye, L.; Gu, W. Microwave-assisted polyol synthesis of gadolinium-doped green luminescent carbon dots as a bimodal nanoprobe. Langmuir 2014, 30, 10933–10939. [Google Scholar] [CrossRef]
- Jia, Q.; Ge, J.; Liu, W.; Zheng, X.; Chen, S.; Wen, Y.; Zhang, H.; Wang, P. A Magnetofluorescent Carbon Dot Assembly as an Acidic H2O2-Driven Oxygenerator to Regulate Tumor Hypoxia for Simultaneous Bimodal Imaging and Enhanced Photodynamic Therapy. Adv. Mater. 2018, 30, 1706090. [Google Scholar] [CrossRef]
- Li, C.; Zheng, Y.; Ding, H.; Jiang, H.; Wang, X. Chromium(III)-doped carbon dots: Fluorometric detection of p-nitrophenol via inner filter effect quenching. Mikrochim. Acta 2019, 186, 384. [Google Scholar] [CrossRef]
- Li, C.; Qin, Z.; Wang, M.; Liu, W.; Jiang, H.; Wang, X. Manganese oxide doped carbon dots for temperature-responsive biosensing and target bioimaging. Anal. Chim. Acta 2020, 1104, 125–131. [Google Scholar] [CrossRef]
- Xu, H.; Yin, X.; Zhu, M.; Li, M.; Zhang, H.; Wei, H.; Zhang, L.; Cheng, L. Constructing hollow graphene nano-spheres confined in porous amorphous carbon particles for achieving full X band microwave absorption. Carbon 2019, 142, 346–353. [Google Scholar] [CrossRef]
- Zhu, S.; Meng, Q.; Wang, L.; Zhang, J.; Song, Y.; Jin, H.; Zhang, K.; Sun, H.; Wang, H.; Yang, B. Highly Photoluminescent Carbon Dots for Multicolor Patterning, Sensors, and Bioimaging. Angew. Chem. Int. Edit. 2013, 52, 3953–3957. [Google Scholar] [CrossRef] [PubMed]
- Le Minh, T.P.; Gul, A.R.; Thi, N.L.; Kim, M.W.; Kailasa, S.K.; Oh, K.T.; Park, T.J. One-pot synthesis of carbon dots with intrinsic folic acid for synergistic imaging-guided photothermal therapy of prostate cancer cells. Biomater. Sci. 2019, 7, 5187–5196. [Google Scholar]
- Fahmi, M.Z.; Sholihah, N.F.; Wibrianto, A.; Sakti, S.C.W.; Firdaus, F.; Chang, J. Simple and fast design of folic acid-based carbon dots as theranostic agent and its drug release aspect. Mater. Chem. Phys. 2021, 267, 124596. [Google Scholar] [CrossRef]
- Bakier, Y.M.; Ghali, M.; Zahra, W.K. Highly sensitive fluorescent detection of pyridine using small size carbon quantum dots derived from folic acid. J. Phys. D Appl. Phys. 2020, 53, 405103. [Google Scholar] [CrossRef]
- Huang, S.; Lin, Y.; Li, Y.; Hu, C.; Chiu, T. Synthesis of Fluorescent Carbon Dots as Selective and Sensitive Probes for Cupric Ions and Cell Imaging. Molecules 2019, 24, 1785. [Google Scholar] [CrossRef] [PubMed] [Green Version]
- Lin, Y.; Liu, Z.; Yu, L.; Zhang, G.; Tan, H.; Wu, K.; Song, F.; Mechler, A.K.; Schleker, P.P.M.; Lu, Q.; et al. Overall Oxygen Electrocatalysis on Nitrogen-Modified Carbon Catalysts: Identification of Active Sites and In Situ Observation of Reactive Intermediates. Angew. Chem. Int. Edit. 2021, 60, 3299–3306. [Google Scholar] [CrossRef]
- Mullins, D.R.; Overbury, S.H.; Huntley, D.R. Electron spectroscopy of single crystal and polycrystalline cerium oxide surfaces. Surf. Sci. 1998, 409, 307–319. [Google Scholar] [CrossRef]
- Bhunia, S.K.; Maity, A.R.; Nandi, S.; Stepensky, D.; Jelinek, R. Imaging Cancer Cells Expressing the Folate Receptor with Carbon Dots Produced from Folic Acid. ChemBioChem 2016, 17, 614–619. [Google Scholar] [CrossRef]


| Groups | Mode of Vibration | Wave Number | References |
|---|---|---|---|
| O-H | stretching vibration | 3500 cm−1 | [37,38] |
| N-H | stretching vibration | 3200 cm−1 | [37,38] |
| C-H | stretching vibration | 2900 cm−1 | [37,38] |
| C=O | stretching vibration | 1670 cm−1 | [39] |
| C-H | stretching vibration | 1220 cm−1 | [39] |
| O-H (carboxyl) | bending vibration | 1640 cm−1 | [39] |
| C-H | bending vibration | 1420 cm−1 | [39] |
| C-N | stretching vibration | 1283 cm−1 | [39] |
| C-O | stretching vibration | 1020 cm−1 | [39] |
| C=C (benzene in FA) | stretching vibration | 1562 cm−1 | [36] |
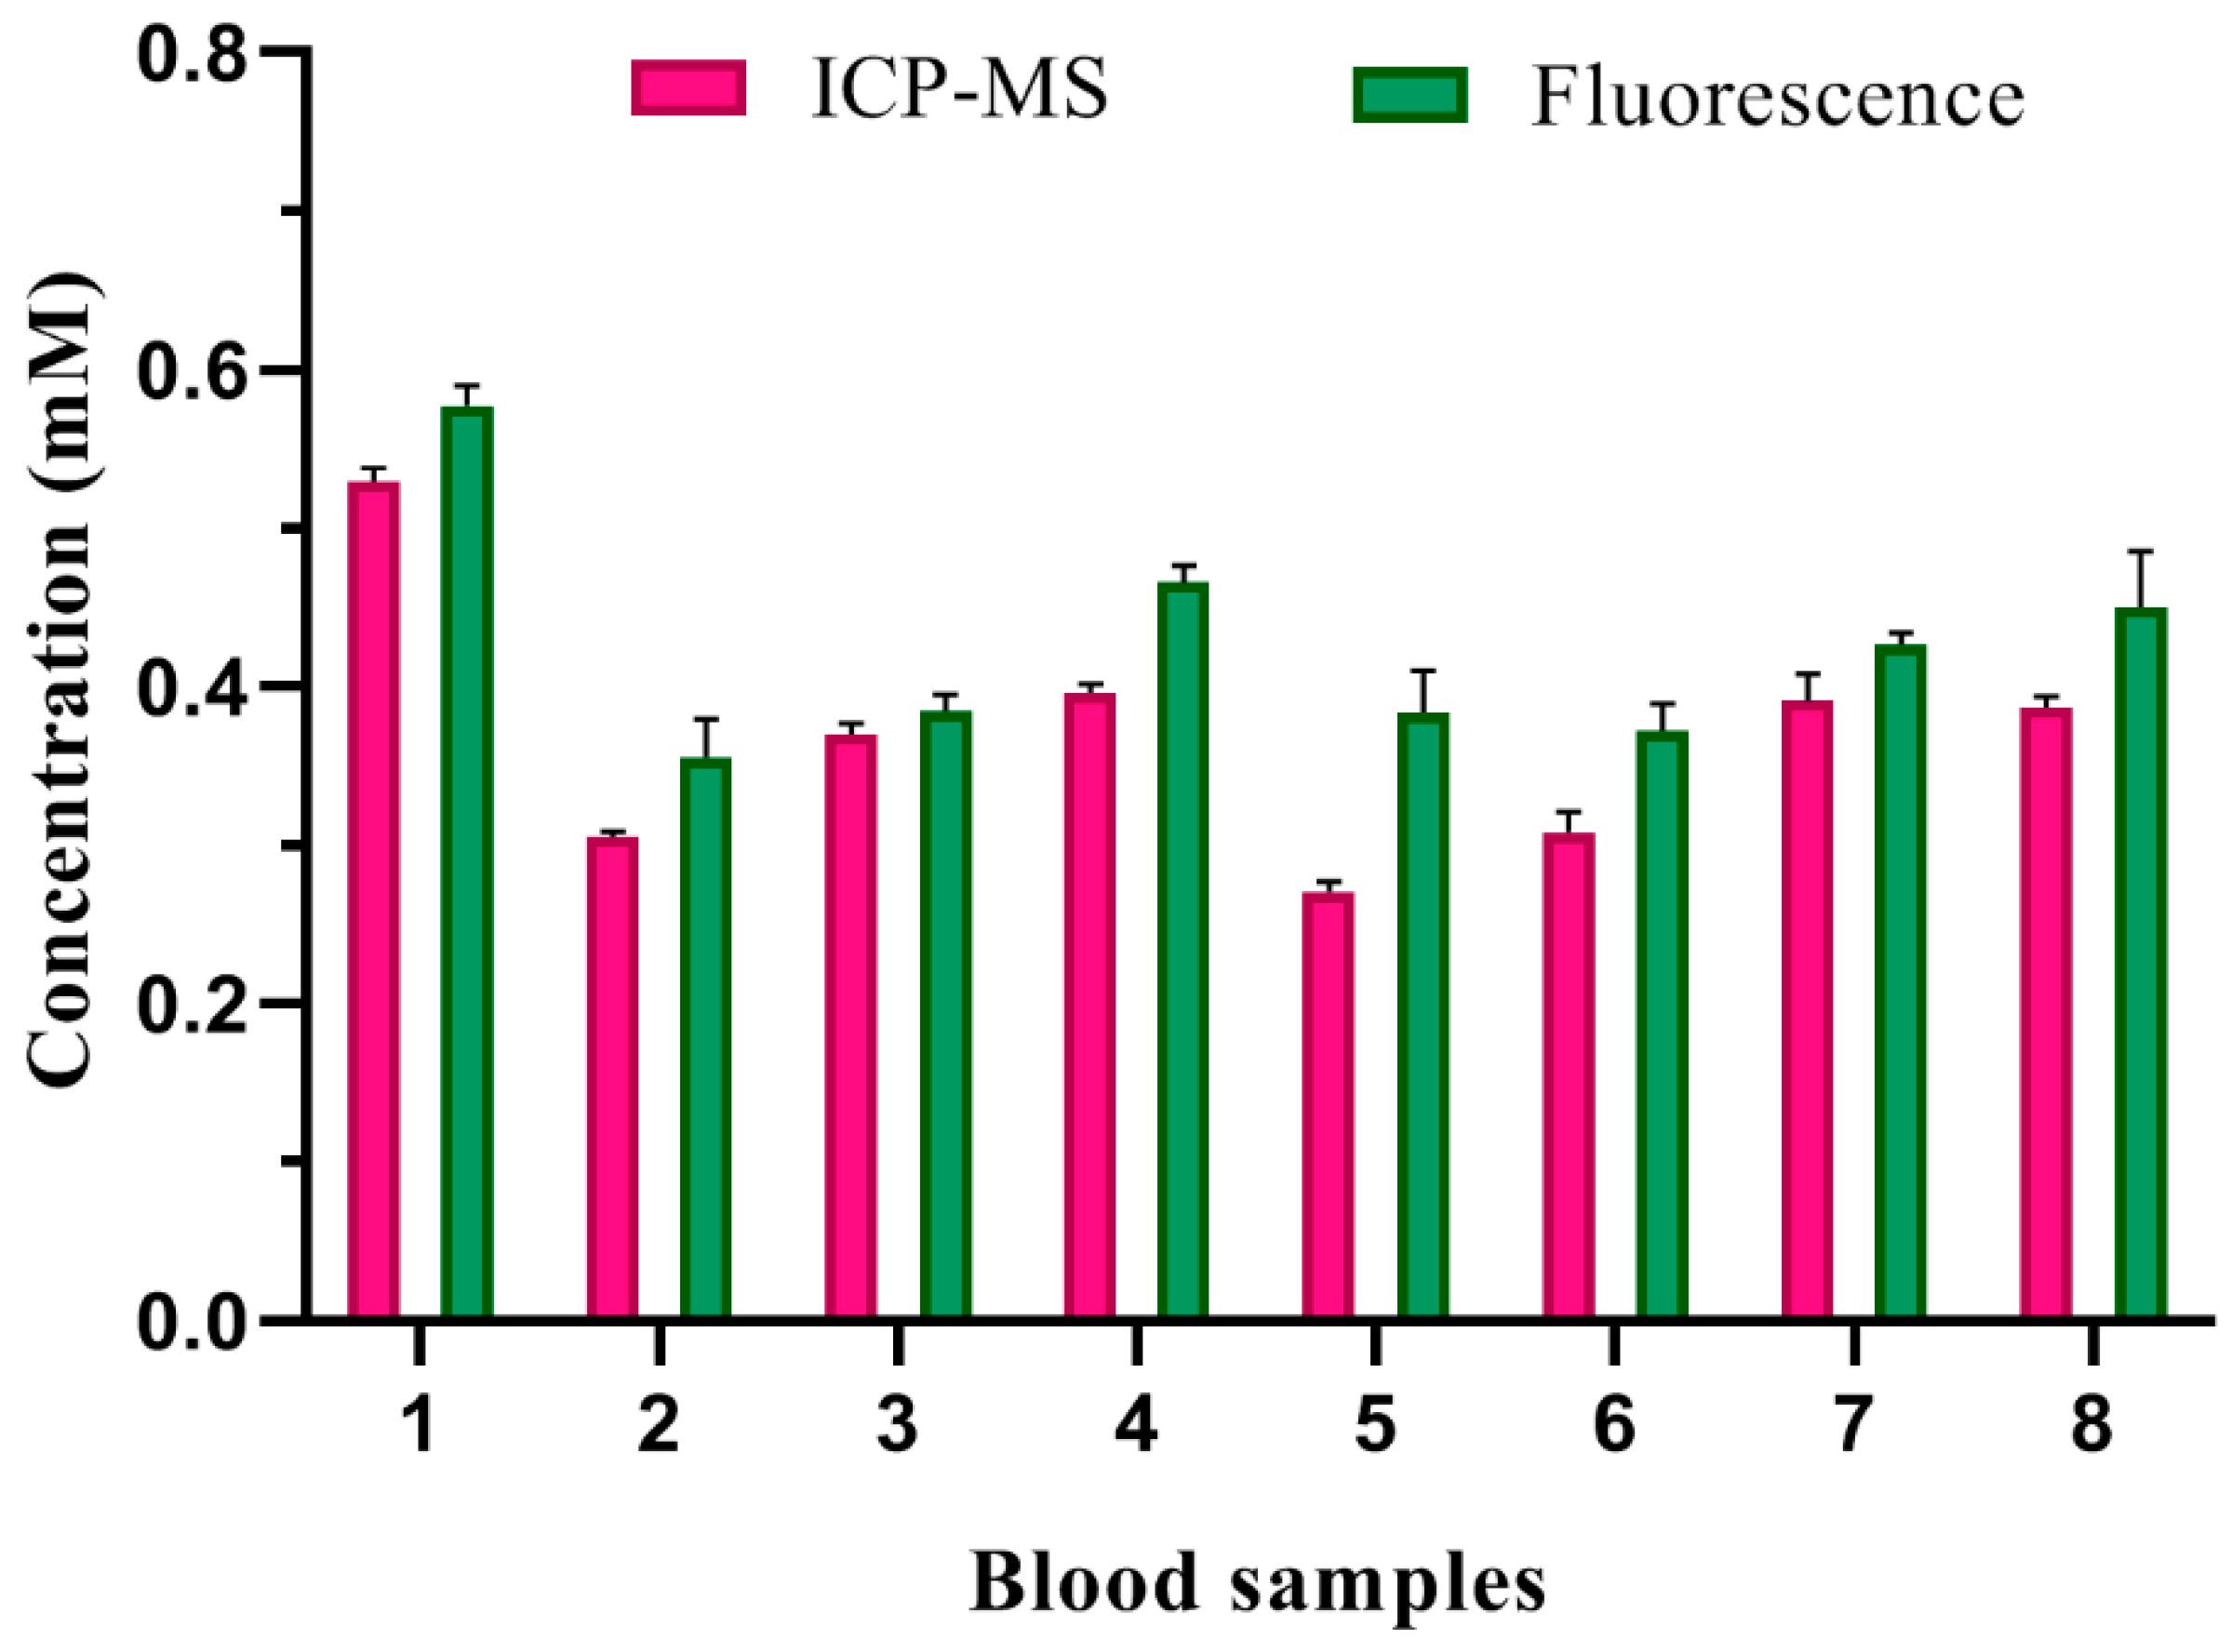
| Blood Samples | Method | Concentration (mm) | RSD (%) |
|---|---|---|---|
| NO. 1 | ICP-MS | 0.5292 | 1.6223 |
| Fluorescence | 0.5775 | 2.1363 | |
| NO. 2 | ICP-MS | 0.3050 | 1.1995 |
| Fluorescence | 0.3554 | 6.7506 | |
| NO. 3 | ICP-MS | 0.3701 | 1.8507 |
| Fluorescence | 0.3848 | 2.6780 | |
| NO. 4 | ICP-MS | 0.3960 | 1.3994 |
| Fluorescence | 0.4657 | 2.2312 | |
| NO. 5 | ICP-MS | 0.2707 | 2.2001 |
| Fluorescence | 0.3835 | 6.9046 | |
| NO. 6 | ICP-MS | 0.3081 | 4.2540 |
| Fluorescence | 0.3724 | 4.4534 | |
| NO. 7 | ICP-MS | 0.3912 | 4.2602 |
| Fluorescence | 0.4268 | 1.6551 | |
| NO. 8 | ICP-MS | 0.3871 | 1.7743 |
| Fluorescence | 0.4503 | 7.7068 |
Publisher’s Note: MDPI stays neutral with regard to jurisdictional claims in published maps and institutional affiliations. |
© 2022 by the authors. Licensee MDPI, Basel, Switzerland. This article is an open access article distributed under the terms and conditions of the Creative Commons Attribution (CC BY) license (https://creativecommons.org/licenses/by/4.0/).
Share and Cite
Li, J.; Guo, Z.; Liu, T.; Yu, F.; Zeng, J.; Zhang, Y.; Yin, L.; Liu, X.; Jiang, H.; Wang, X. Folic Acid-Modified Cerium-Doped Carbon Dots as Photoluminescence Sensors for Cancer Cells Identification and Fe(III) Detection. Chemosensors 2022, 10, 219. https://0-doi-org.brum.beds.ac.uk/10.3390/chemosensors10060219
Li J, Guo Z, Liu T, Yu F, Zeng J, Zhang Y, Yin L, Liu X, Jiang H, Wang X. Folic Acid-Modified Cerium-Doped Carbon Dots as Photoluminescence Sensors for Cancer Cells Identification and Fe(III) Detection. Chemosensors. 2022; 10(6):219. https://0-doi-org.brum.beds.ac.uk/10.3390/chemosensors10060219
Chicago/Turabian StyleLi, Jincheng, Zengchao Guo, Tengfei Liu, Fangfang Yu, Jiayu Zeng, Ying Zhang, Lihong Yin, Xiaohui Liu, Hui Jiang, and Xuemei Wang. 2022. "Folic Acid-Modified Cerium-Doped Carbon Dots as Photoluminescence Sensors for Cancer Cells Identification and Fe(III) Detection" Chemosensors 10, no. 6: 219. https://0-doi-org.brum.beds.ac.uk/10.3390/chemosensors10060219