
A Study on Regenerative Quartz Crystal Microbalance


Physics Department, Babes-Bolyai University, 400084 Cluj-Napoca, Romania
Chemosensors 2022, 10(7), 262; https://0-doi-org.brum.beds.ac.uk/10.3390/chemosensors10070262
Submission received: 15 June 2022
/
Revised: 4 July 2022
/
Accepted: 4 July 2022
/
Published: 5 July 2022
(This article belongs to the Special Issue Recent Advances in Quartz Crystal Microbalance-Based Sensor Applications)
Abstract
:The quartz crystal microbalance with dissipation (QCM-D) represented a substantial breakthrough in the use of the QCM sensor in diverse applications ranging from environmental monitoring to biomedical diagnostics. To obtain the required selectivity and sensitivity of a volatile organic compounds (VOC) sensor, it is necessary to coat the QCM sensor with a sensing film. As the QCM sensor is coated with the sensing film, an increase in the dissipation factor occurs, resulting in a shorter and shorter ring-down time. This decrease in ring-down time makes it difficult to implement the QCM-D method in an economical and portable configuration from the perspective of large-scale applications. To compensate for this effect, a regenerative method is proposed by which the damping effect produced by the sensing film is eliminated. In this sense, a regenerative circuit as an extension to a virtual instrument is proposed to validate the experimental method. The simulation of the ring-down time for the QCM sensor in the air considering the effect of the added sensing film, followed by the basic theoretical concepts of the regenerative method and the experimental results obtained, are analyzed in detail in this paper.
1. Introduction
Quartz crystal has a valuable tradition in the history of electronic devices [1]. From the first uses as a high stability signal generator [2] or in the realization of radio frequency filters [3], the quartz crystal has always been a key device. The quartz crystal, respectively the QCM sensor, is important from an applications perspective for its unique value of having a very high-quality factor (Q) or equivalent a very low dissipation factor. Its quality factor doubled by high stability justifies its use as a sensor or electronic device without having an equivalent for it. The use of quartz crystal as a QCM sensor has generated an extremely intense and interesting research effort with many applications.
Nowadays, QCM sensor applications extend into chemical and biological sensing in the vapor or liquid phase. The realization of these applications involves the coating of the QCM sensor with sensing films [4,5]. Unfortunately, many coating materials with selectivity and high sensitivity are viscous, inducing a damping that causes a significant reduction in the Q factor. For the QCM sensor, this unique quality of having a very high Q factor is lost by using it in a liquid medium [6]. Even in these conditions, the quartz crystal remains a very high-performance and versatile sensor [7]. Since the Q factor is diminished by the interaction with the surface coating materials, in this paper, the possibility of its recovery is demonstrated. Such a possibility would lead to the successful use of the quartz crystal as a volatile organic compounds (VOC) sensor in complex mixtures and pave the way for a wide range of new applications. Moreover, the quality of the measurements on the electrical parameters of the QCM sensor would be greatly improved.
The regenerative method [8] also has a history as old as that of quartz crystal. This method has been used with great success in radio communications due to the high sensitivity/complexity ratio. The regenerative receiver was invented in 1912 [9], and it was widely used between 1915 and World War II. Advantages of regenerative receivers include increased sensitivity and selectivity since the Q factor of the tuned circuit is increased through the negative resistance introduced by the amplifier. An amplification circuit in which part of the output signal is applied back to the input by summing up with the input signal is a regenerative circuit, that is, a circuit that uses positive feedback.
The quartz crystal microbalance with dissipation monitoring (QCM-D) [10,11] represented substantial progress in the use of the QCM sensor in diverse applications ranging from environmental monitoring to biomedical diagnostics. The key parameters of the QCM sensor measured using the QCM-D method are series resonant frequency and dissipation factor. In essence, the QCM-D method involves the active (quartz crystal in an oscillator) [10] or passive (connected to a signal generator) [11] excitation of the QCM senor, followed by its isolation from the excitation source and the computation of the natural oscillation frequency and dissipation factor (D) from the ring-down response. Not much time has passed since the first article about the QCM-D [10] and the appearance of commercial products [12]. This is partly due to the elegance and versatility of the method. The QCM-D method, also known as the ring-down method, is extremely useful in making biosensors [13], and it is difficult for traditional [14] active methods based on oscillators to equal it.
Finding easy-to-build circuits [15,16,17] and/or effective methods for calculating the series resonant frequency of QCM sensors and the dissipation factor is a constant concern in the literature [18,19]. It is difficult to measure the key parameters mentioned above using the ring-down method for high-frequency QCM sensors (Q factor decreases with increasing resonance frequency) or when its surface is coated with sensing material. This is due to the short ring-down time and, therefore, given the sub-sampling [10], too few samples are acquired for the rigorous calculation of the QCM sensor parameters.
This paper aims to improve the response of the QCM sensor when its surface is coated with sensing material and to adapt the regenerative method to today’s electronic technology to achieve an improved version of QCM based on the ring-down method. In this sense, the experimental setup is developed around a virtual instrument based on a field-programmable gates array (FPGA). The paper makes the following contributions: (i) it introduces the regenerative QCM method based on an active circuit, (ii) it implements the regenerative method in an experimental setup, and (iii) it experimentally validates the proposed method by analyzing its ability to compensate for the natural dissipation factor.
This paper is organized as follows: Section 2 describes the proposed method for the regeneration ring-down based on an active circuit, followed by the extensive presentation of the experimental setup, while Section 3 is devoted to the raw experimental results, followed by a discussion in Section 4 on the operation and the performance of the QCM with ring-down regeneration. The conclusions are set out in Section 5.
2. Materials and Methods
2.1. Ring-Down Method
The use of quartz crystal as a QCM sensor has generated an extremely intense and interesting research effort with many applications. The motional electrical parameters of the QCM sensor based on the Butterworth van Dyke (BVD) model [20,21] are, , , and of the series branch. The source of the dissipation factor for the QCM sensor is motional resistance () of the BVD model, and several parameters are defined relative to it. Based on the key parameters, the QCM sensor provides access to the physical characteristic of the sample. The dissipation factor or other electrical parameter relative to provides a detailed analysis of the surface and the interactions on the surface without being limited to the measurement of mass per unit area. Based on the dissipation factor, the viscoelastic and conformational properties of the sample [22] are monitored.
The QCM-D or equivalent ring-down method is very popular and probably the most used in the research field related to acoustic sensors. The main advantages of the method are the relatively short measurement time and the possibility of measuring key parameters for harmonics of the base frequency as well.
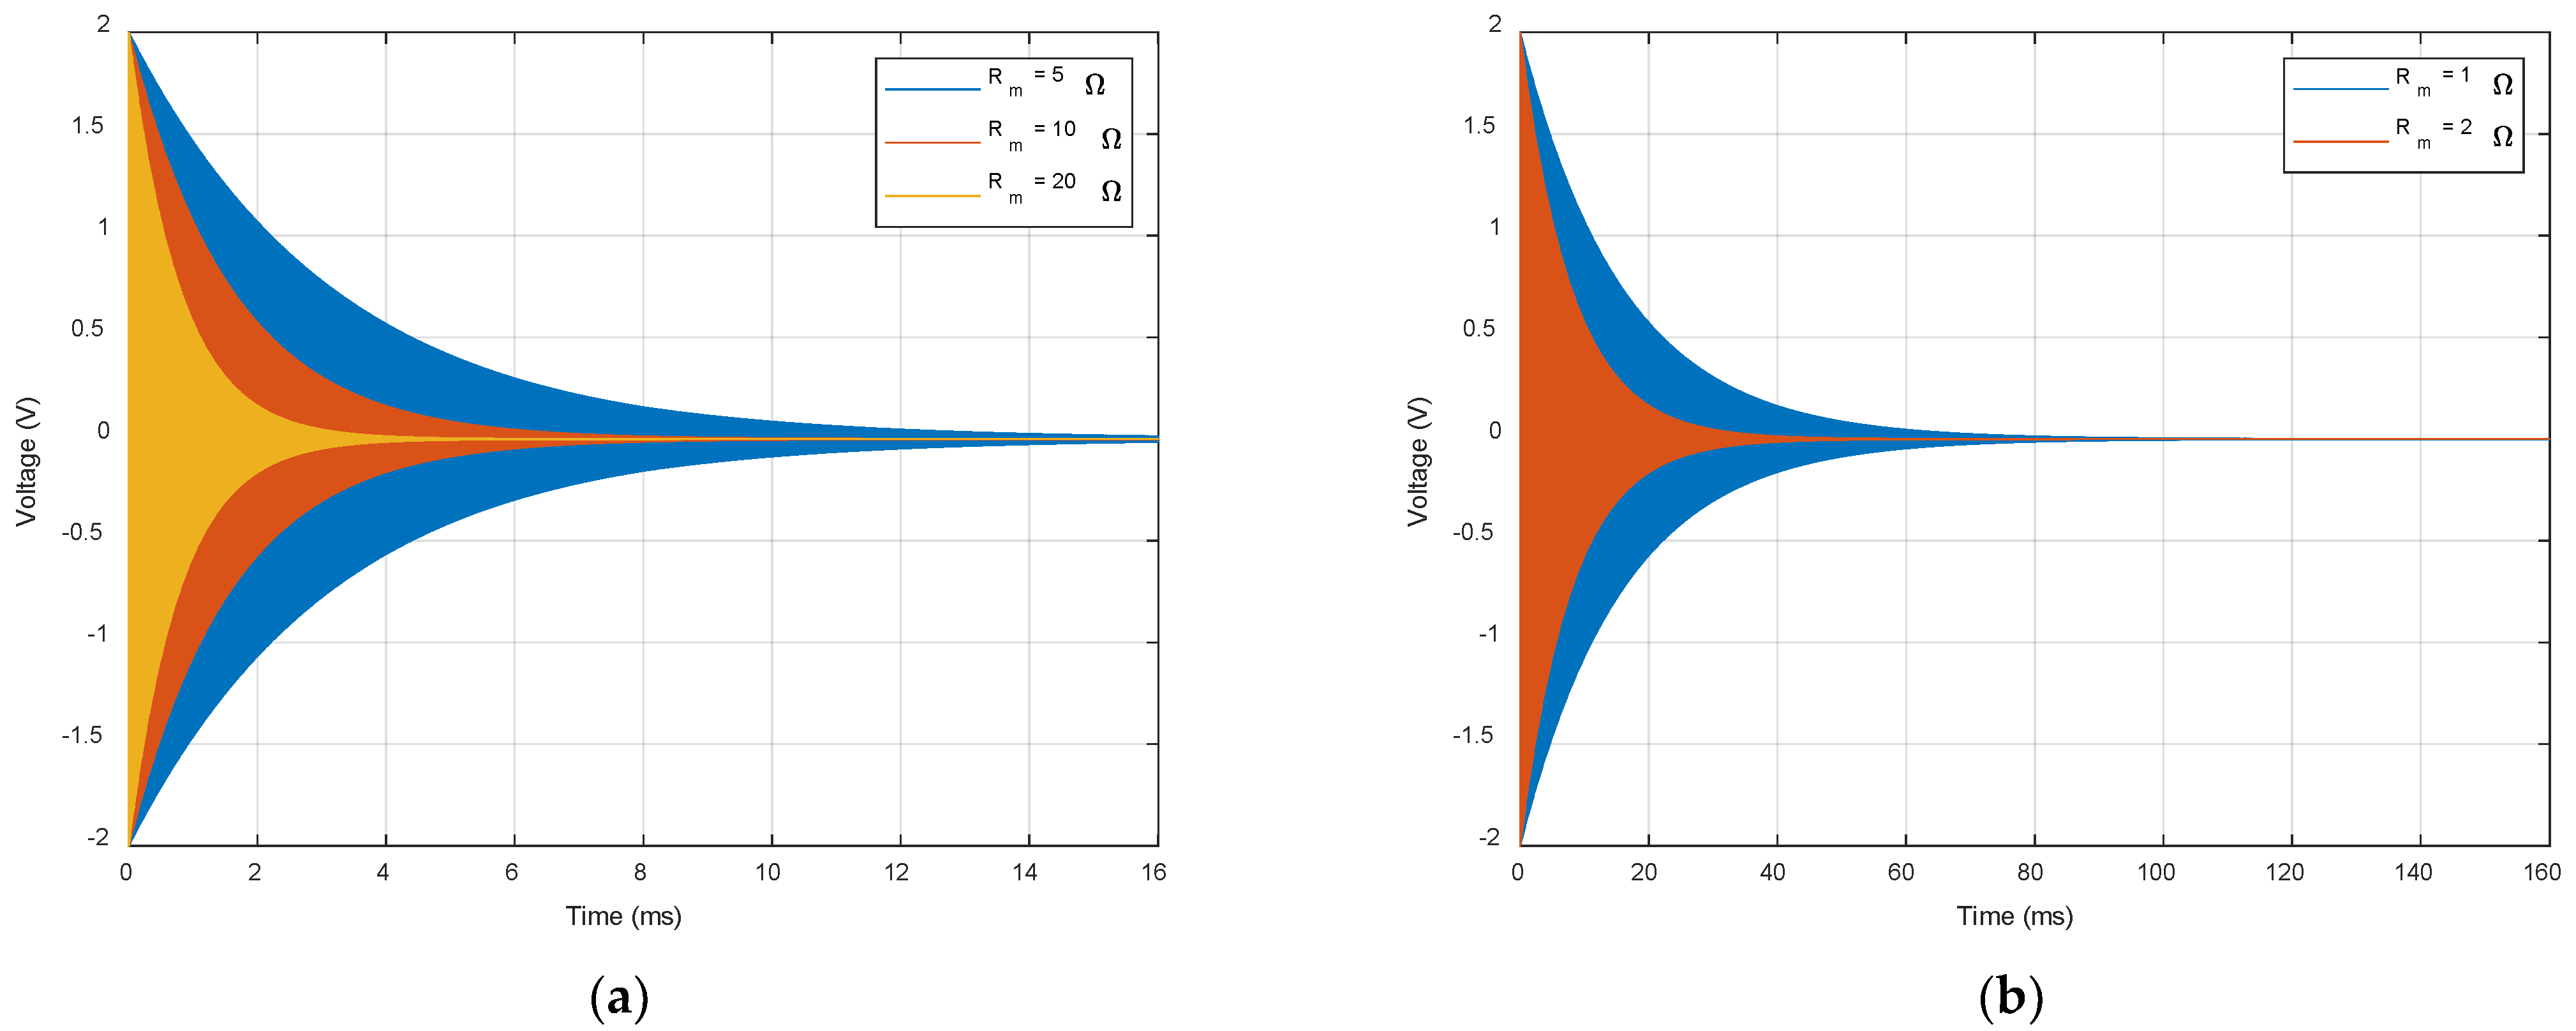
To illustrate the effects produced by coating materials with viscoelastic properties such as polymers [4] on the ring-down time for a QCM sensor with a series resonant frequency of 10 MHz, its ring-down response is simulated in the MATLAB® environment, taking into account only the motional branch of the BVD model.
The parametric simulated effect induced by motional resistance in the ring-down response of the QCM sensor is shown in Figure 1. In Figure 1a, the ring-down time becomes shorter and shorter as the motional resistance increases. The situations simulated in Figure 1a are realistic and frequently encountered in practice even if a motional resistance is at the limit of experimental reality. This decrease in ring-down time, from an experimental perspective, makes it difficult to determine with sufficient precision the key parameters in subsampling circumstances. To compensate for this effect, a regenerative method is proposed. The anticipated effect of the regenerative method is simulated in Figure 1b, where two theoretical situations () are presented. The simulated values for in Figure 1b, from an experimental perspective, are unrealistic, especially for a QCM sensor with a resonant frequency in a series of 10 MHz. As is shown in Figure 1b, the ring-down time increases significantly compared to the situation naturally encountered in applications based on the QCM sensor.
2.2. Regenerative Ring-Down Method
In the particular case of the QCM sensor, to obtain a regenerative QCM, the realized system must always be in a stable state. To meet this condition, the passive excitation of the QCM sensor is ensured by an external arbitrary wave generator (AWG). QCM sensor response to excitation with a sinusoidal wave with a frequency in the range of resonant frequencies [11] is processed to determine the natural resonance frequency and dissipation factor.
The artificial increase in the Q factor for the QCM sensor or the equivalent artificial decrease in the dissipation factor, shown in this paper, improves the standard ring-down method in the case of coatings with a sensing film or for very high-frequency QCM sensors. In essence, the artificial increase in the Q factor of the QCM sensor is equivalent to the existence of a smart material not yet discovered.
Conceptually the proposed method is not recent [8] and was widely used at a time when the parameters of electronic devices were modest. The QCM sensor (quartz crystal) is difficult to replace with another real material, so the only solution is to artificially improve its natural qualities. The regenerative method (positive feedback) is well known and has long been used successfully [9] in the past. It was abandoned due to the mode of operation at the stability limit. This mode of operation is specific to the regenerative method and cannot be avoided due to the energy restored to the system.
The operational amplifier (op-amp) is a brilliant contribution from the era of the electronic tube [23,24]. With the transition to semiconductor devices, the op-amp is extensively used in analog electronics and is today an electronic circuit frequently used in the front-end interface for any type of electrical sensor. For example, in an active method for QCM sensors based on an oscillator, the op-amps are also commonly used [25]. The op-amp conforms to the input-output relationship:
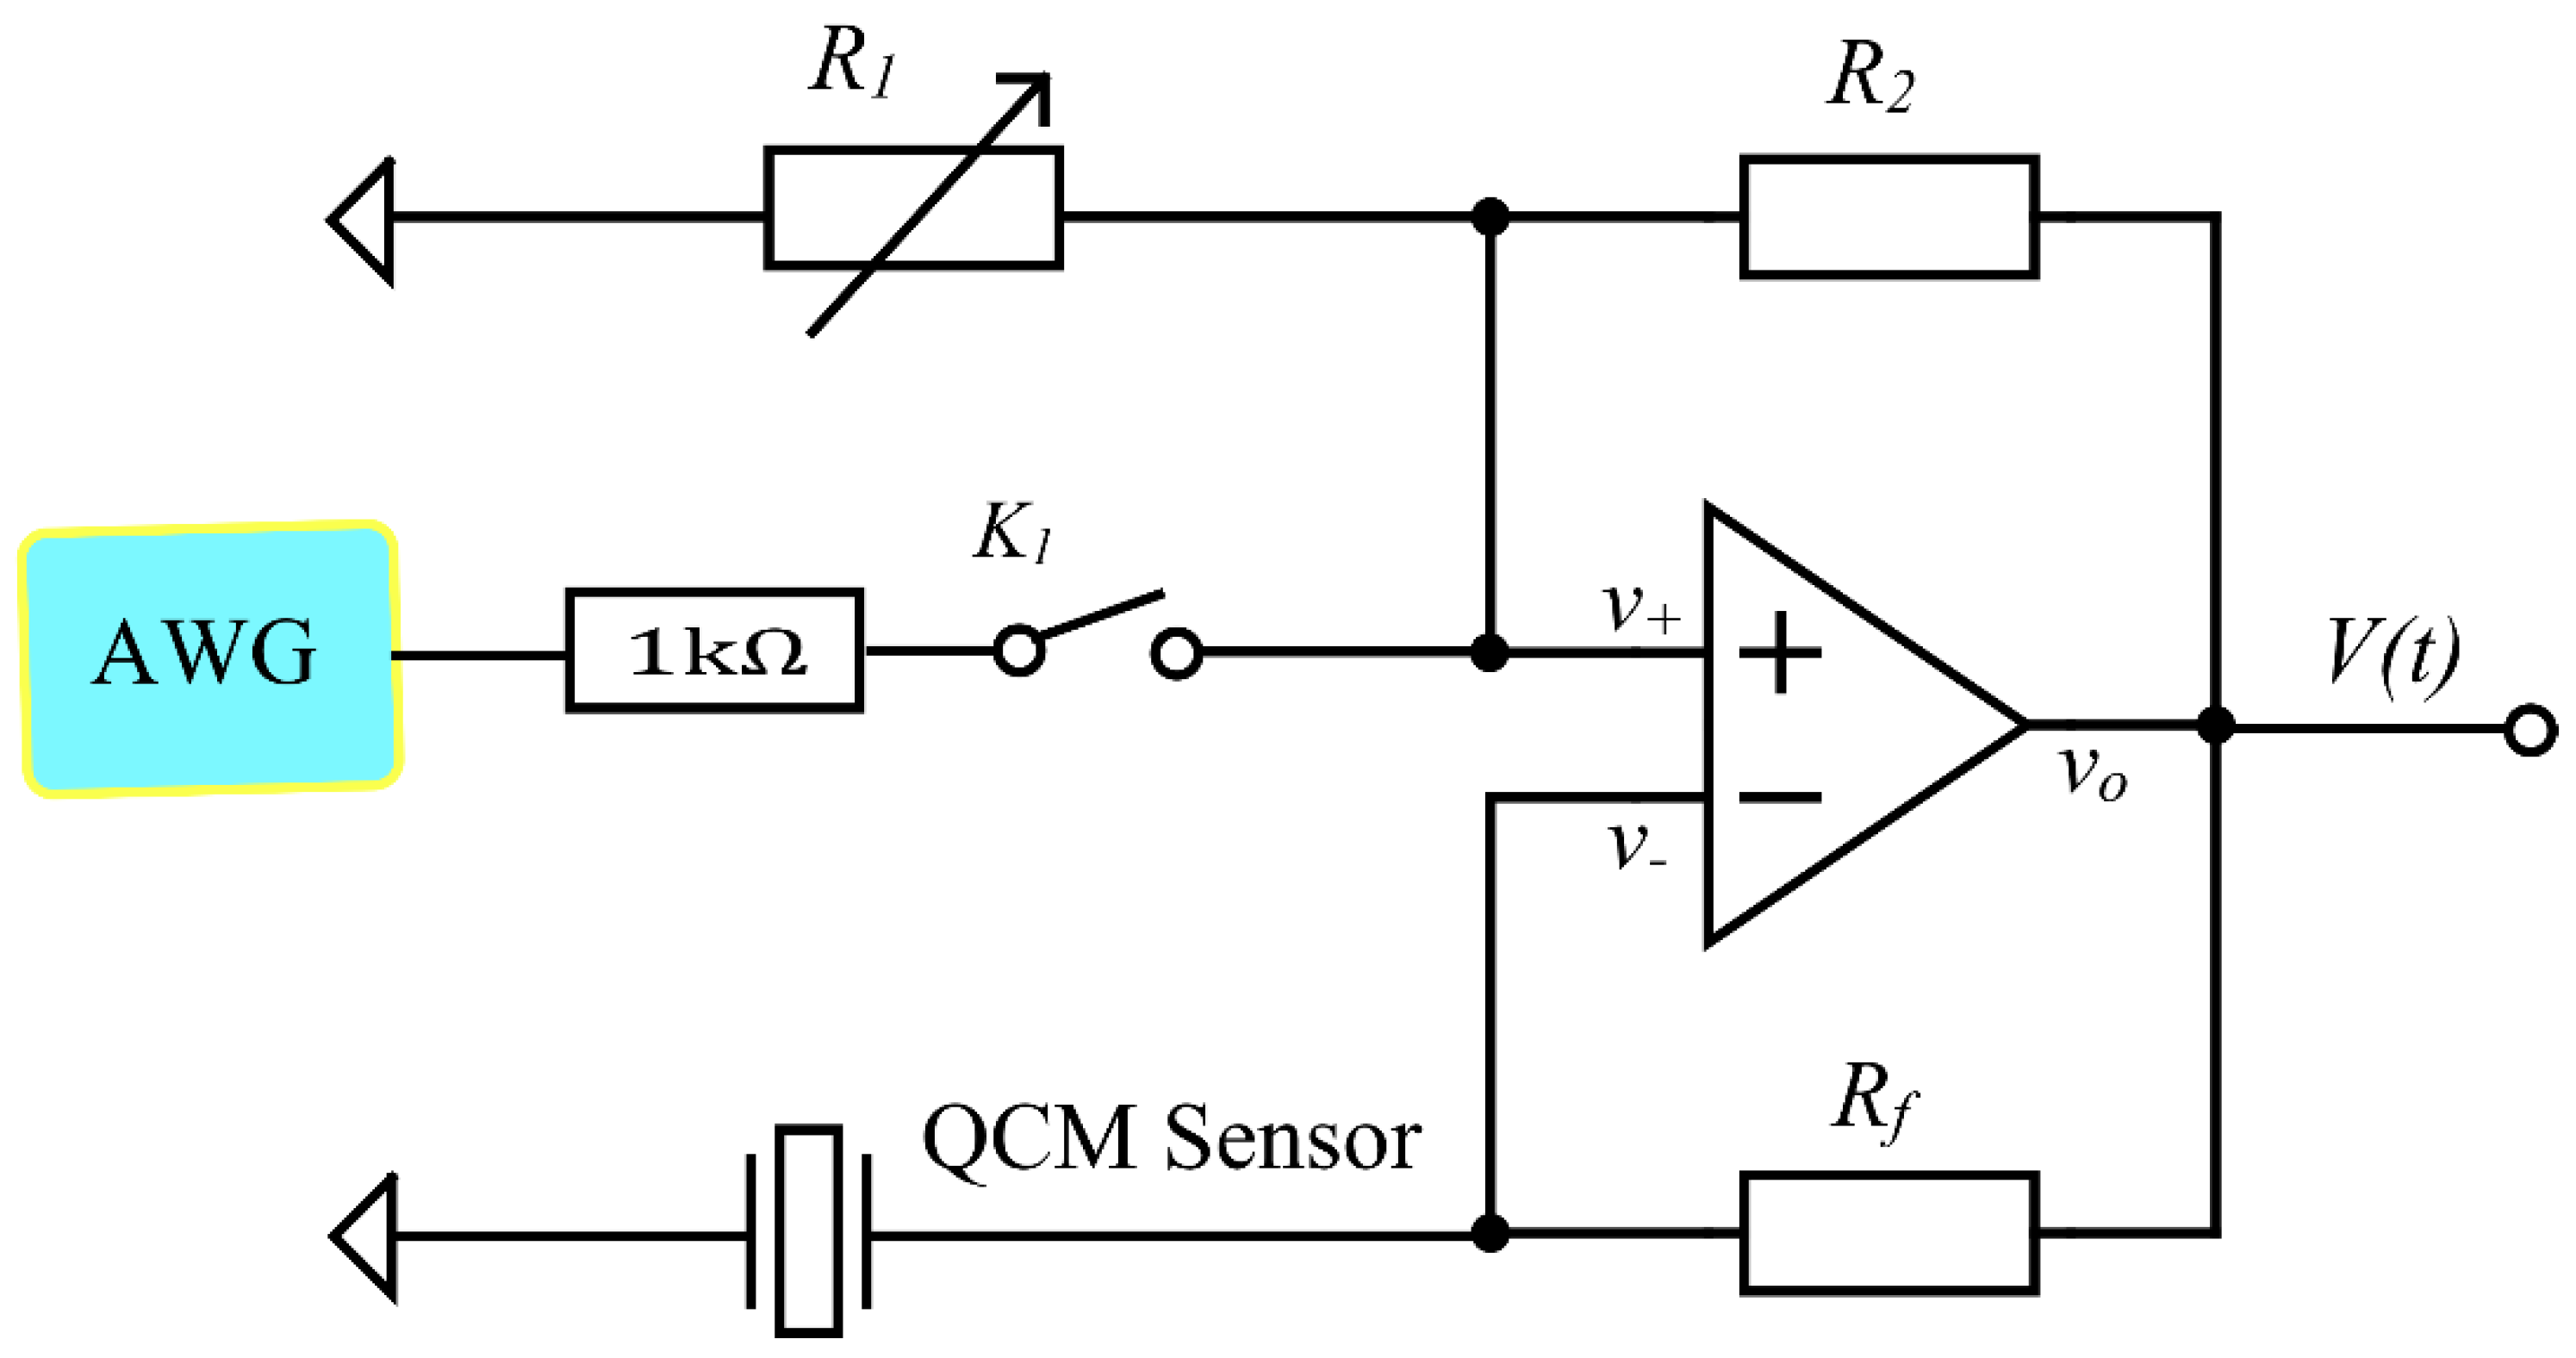
where is the output voltage, A is the gain of the amplifier, and , are the voltages at the non-inverting and inverting inputs, as is shown in Figure 2.
The negative impedance converter (NIC) is an active circuit that injects energy into a port, as opposed to a dissipative load that consumes energy from it. To perform the energy injection into a port, it reverses the polarity of the voltage or reverses the direction of the current or equivalent, introducing a phase shift of 180° (inversion) between voltage and current. For NIC, we have two versions: (i) a negative impedance converter with voltage inversion (VNIC) and (ii) a negative impedance converter with current inversion (INIC). Considering the VNIC circuit shown in Figure 2, the input voltages are:
where is the impedance of the QCM sensor. Only for negative feedback topology of the op-amp, we can assume the following:
whence it results
Finally, we get the following relationship:
which is characteristic of VNIC [26].
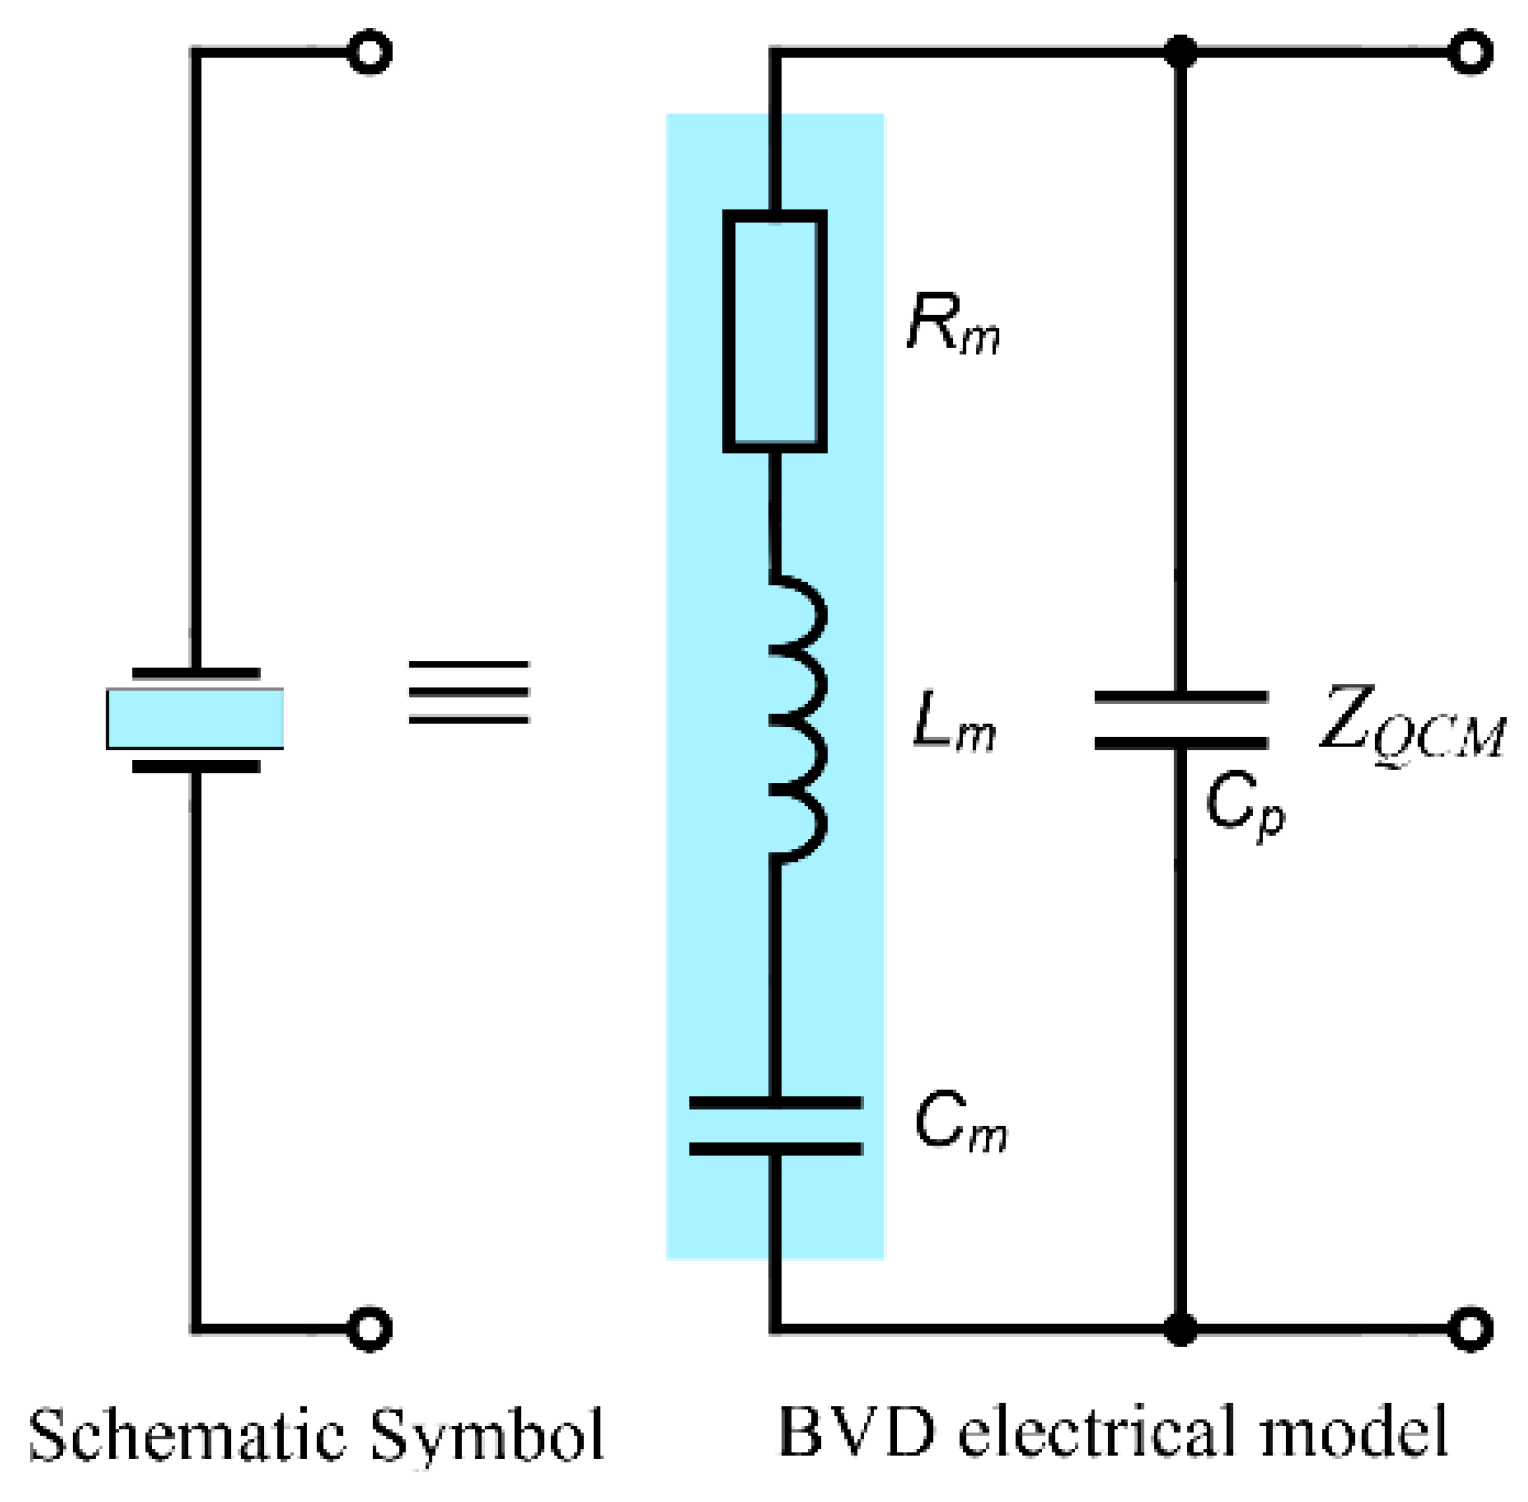
The BVD lumped electrical model of the QCM sensor using 4-parameters is shown in Figure 3. This model involves two branches in parallel with one another. The static branch consists of a single capacitance , also referred to as the shunt capacitance. The series branch refers to a combination of the motional elements , and .
The impedance of the QCM sensor, , is described by the BVD model, as shown in Figure 3. As it results from the figure mentioned above, the BVD model is a parallel combination between the impedance of a static branch and a motional branch. The reactance of the motional branch is zero at a certain denoted frequency, , called the series resonance frequency that is given by the relation:
at which the QCM sensor impedance is purely resistive. The shunt capacitance, , is responsible for the existence of an anti-resonance frequency. Between the series resonance frequencies and anti-resonance frequency, the crystal has an inductive reactance. With the exception of this narrow frequency range mentioned above, the reactance of the QCM sensor is capacitive. The anti-resonance frequency or the parallel-resonance frequency of the quartz crystal is the frequency at which its impedance is maximum. This denoted anti-resonance frequency, , is given by the following equation:
In each oscillation cycle, the quartz crystal loses of the stored energy due to the dissipation processes. Based on the parameters of the BVD model of the quartz crystal, the Q factor is given by the equation:
where the serial resonant frequency is specified by Equation (7). In the ring-down method, it is assumed that the quality factor is the same for both series and parallel mode [10], and it is given by:
At serial resonance frequency () of the QCM sensor, the impedance of its motional branch is pure real , and in this situation at the borderline (Barkhausen criteria), where VNIC becomes the standard bridge oscillator (SBO) [25], we can write:
The stability criterion for the regenerative QCM method is theoretically given by the artificial motional resistance of the QCM sensor, and it can be deduced from the Barkhausen criteria:
At this point, we can deduce for the QCM sensor the degree of increase in the quality factor for the analyzed VNIC circuit so that, based on Equation (9), the factor Q is of the form:
A typical disappointment of the QCM sensor is caused by a significant decrease in the Q factor when contact of its surfaces occurs with materials with high viscosity. Theoretically, the regenerative ring-down method can avoid this limitation, as expressed in Equation (13) in relation to Equation (9). The following section presents an experimental setup based on a virtual instrument to validate the QCM regenerative method.
2.3. Regenerative Ring-Down QCM
The analysis of the regenerative ring-down method in an automatized experimental setup based on a virtual instrument is the main contribution of this subsection. An experimental software-based setup was designed to control the circuit shown in Figure 2. The VNIC circuit, together with a virtual instrument, are the hardware elements of the experimental setup.
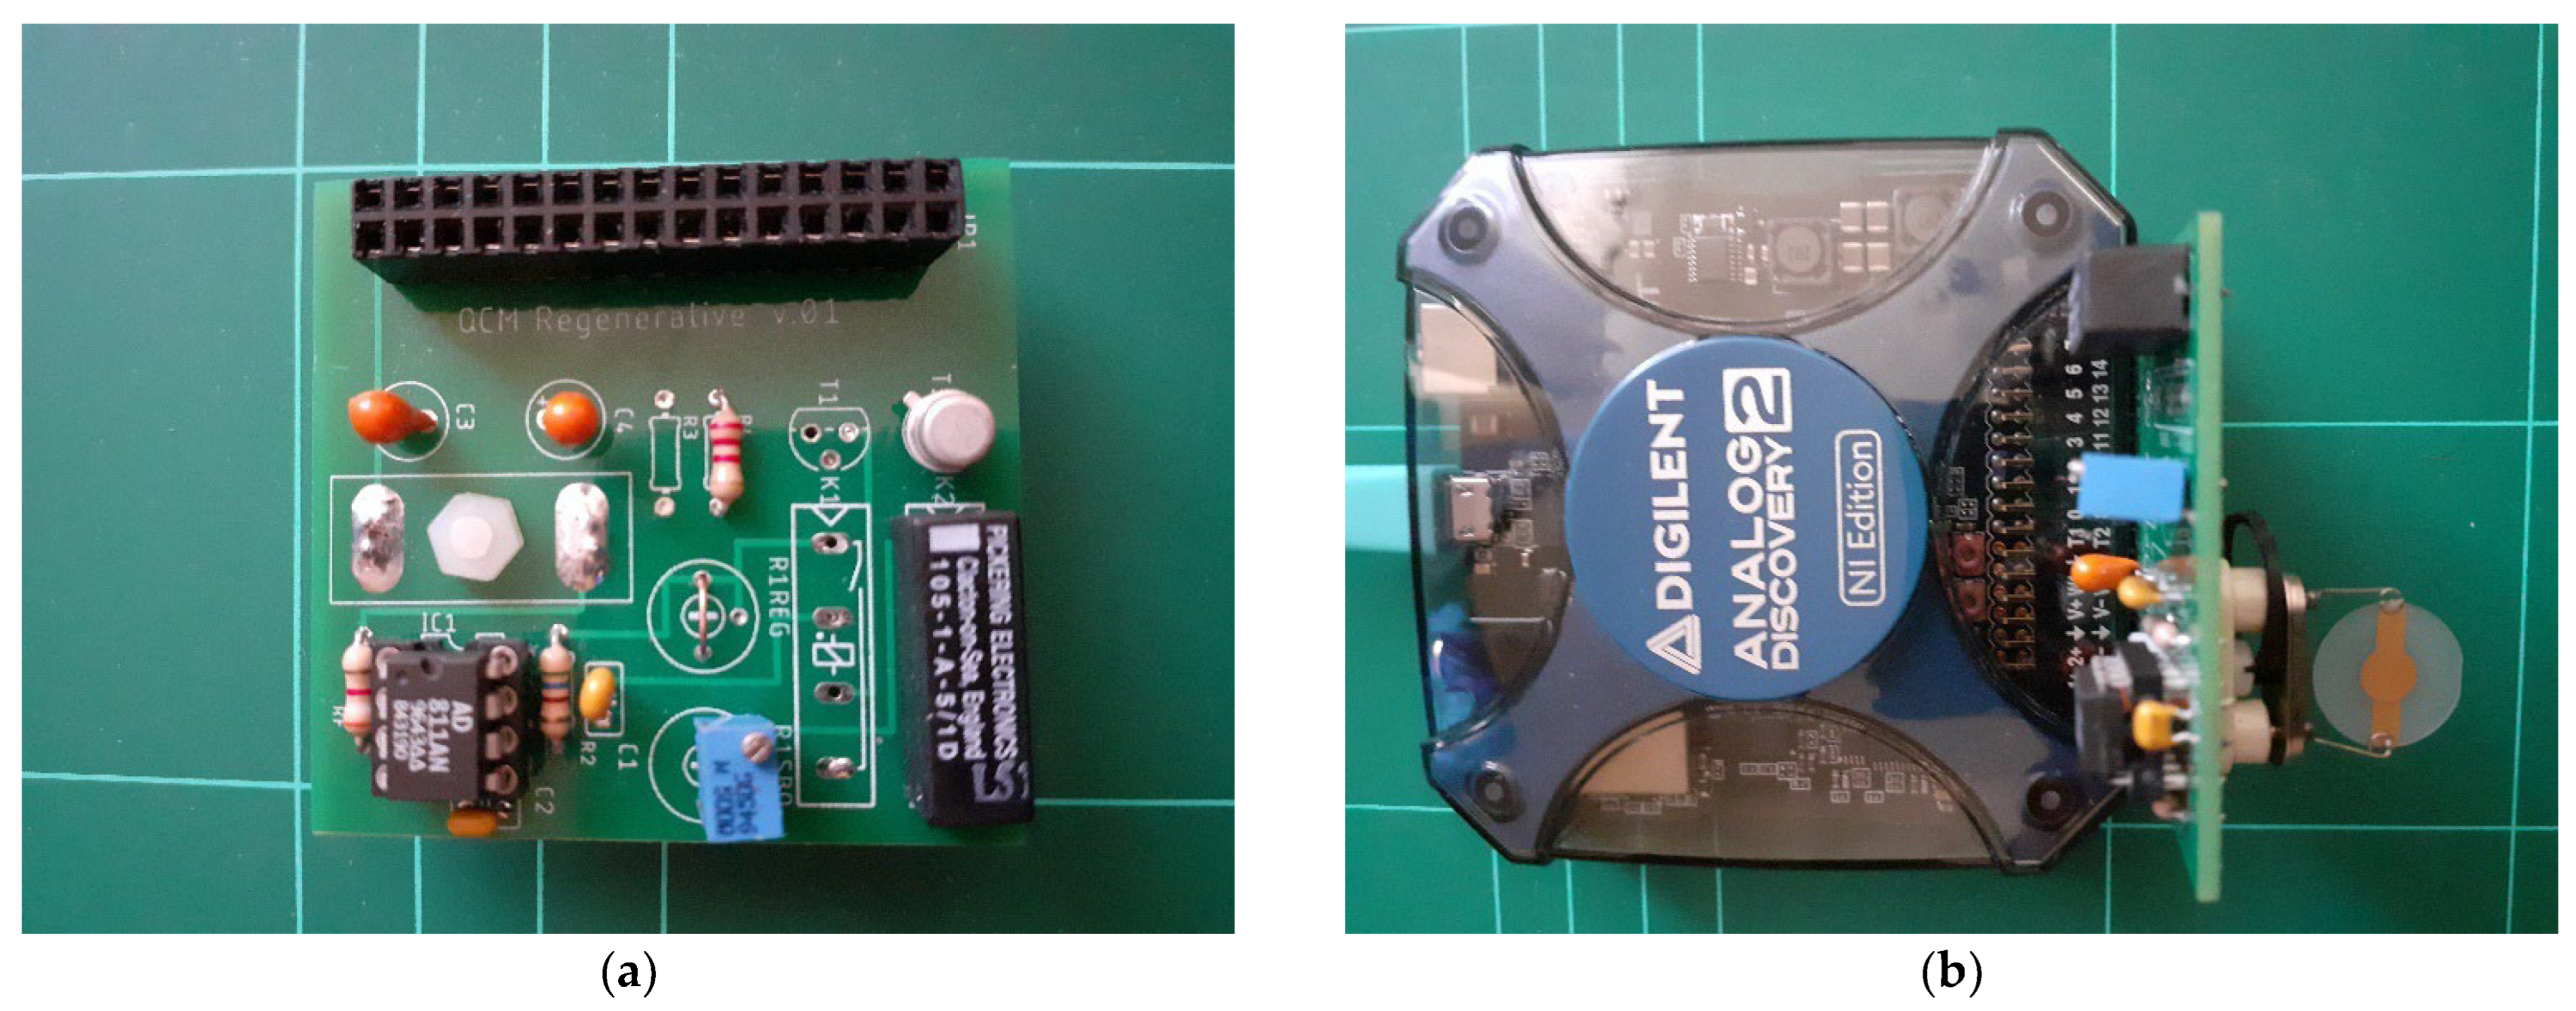
The Analog Discovery 2 (AD2) virtual instrument from Digilent Inc., Pullman, WA, USA [27] has been successfully used in various applications [28,29,30]. The WaveForms device manager provides alternate FPGA configuration files with different resource allocations. The virtual instrument AD2 has 2 14-bit ADC input channels at 100 MSPS, 2 14-bit DAC output channels at 100 MSPS, and 16 digital bidirectional I/O channels. For each analog input channel, the default buffer size is 8192 samples. The AWG output channels have allocated 4096 samples for each by default. The voltage ranges for the input channels are ±25 V with an absolute resolution of 0.32 mV (scale ≤ 5 V), and the voltage range of the AWG output channels is ±5 V. An input impedance of 1 MΩ in parallel with 24 pF is ensured for both analog input channels. These functions are implemented using a Spartan 6 FPGA circuit (XC6SLX16-1L) produced by Xilinx Inc., San Jose, CA, USA.
The main electronic devices used to implement the circuit shown in Figure 2 are the AD811 video op-amp and the Pickering Electronics 105-1-A-5/1D relays. The use of a no-bounce relay is mandatory. In general, a large input impedance is the best choice of op-amp for this application. This condition is not met by the video op-amp; this situation influences the natural response of the QCM sensor by modifying both its frequency response and the dissipation factor. This situation is remedied by the regenerative effect and is, moreover, specific to the simplified methods [16,17] of the ring-down method.
As is shown in Figure 2, the switching time of the relay does not disturb the QCM sensor since it is permanently connected to the non-inverting input of the op-amp. However, the relay used has a release time of 0.2 ms. Ratio is a circuit constant that theoretically, in the ideal approximation, determines the multiplication factor for . As shown by Equation (9), in this case, the multiplication factor is 6.96 ( and ). The is a multi-turn trimmer and has a resistance value equal to .
The circuit shown in Figure 4a was conceived as a shield of the AD2. In this way, the proposed regenerative circuit is integrated with the data acquisition and is under software control. The circuit’s power supply is provided by the hardware user interface of the virtual instrument. The experimental setup is completed by the AD2 virtual instrument and QCM sensor, as is shown in Figure 4b.
The PC host computer provides, through the USB2 interface, the software development kit (SDK) commands of the AD2, data transfer, and power supply for the VNIC circuit. The typical sequence for the ring-down method is conducted with the relay controlled by a digital output of AD2. Through a Python script, the measurement sequence is automated: (i) the AWG is activated to generate a sinusoidal wave with a frequency in the range of the resonance frequencies of the QCM sensor [11], (ii) the relay is closed to ensure the excitation of the QCM sensor until the oscillations are in steady-state, (iii) then the excitation is deactivated by opening the relay, (iv) from this moment on the VNIC circuit provides positive feedback and thus the quality factor of the QCM sensor is increased, (v) the data acquisition is started by subsampling followed by (vi) the calculation of the key parameters of the QCM sensor. Raw data from the op-amp output are obtained by subsampling [10] to adapt the ring-down time to the input buffer size of the AD2. In this case, the aliasing frequency is exploited to calculate the key parameters of the QCM sensor.
At the output of op-amp, we have the ring-down voltage expressed by the followed equation:
where λ is the decay constant. The dissipation factor is given by the next equation:
The software to produce a functional and accurate experimental setup is written in Python and exploits the SDK functions [27]. The raw data from the output of the VNIC circuit, designed to implement the regenerative ring-down method, are processed in real-time, and the tracking of the resonance frequency is provided by AWG based on the Fourier transform. The Python module also ensures real-time processing of experimental raw data and calculates the key parameters of the QCM sensor. The acquired raw experimental data are graphically represented together with the key parameters and fitting results based on Equation (14).
3. Results
In this section, a detailed analysis is performed for experimental validation of the regenerative QCM method. The experimental setup is shown in Figure 4 and also contains a QCM sensor made of a quartz crystal with a fundamental resonant frequency of 10 MHz (151225-10, International Crystal Manufacturing Co., Inc., Oklahoma City, OK, USA). During the measurements, the temperature in the laboratory was in the range of 21 ± 2 °C, with a relative humidity of 50 ± 10%.
3.1. Natural Ring-Down of the QCM Sensor
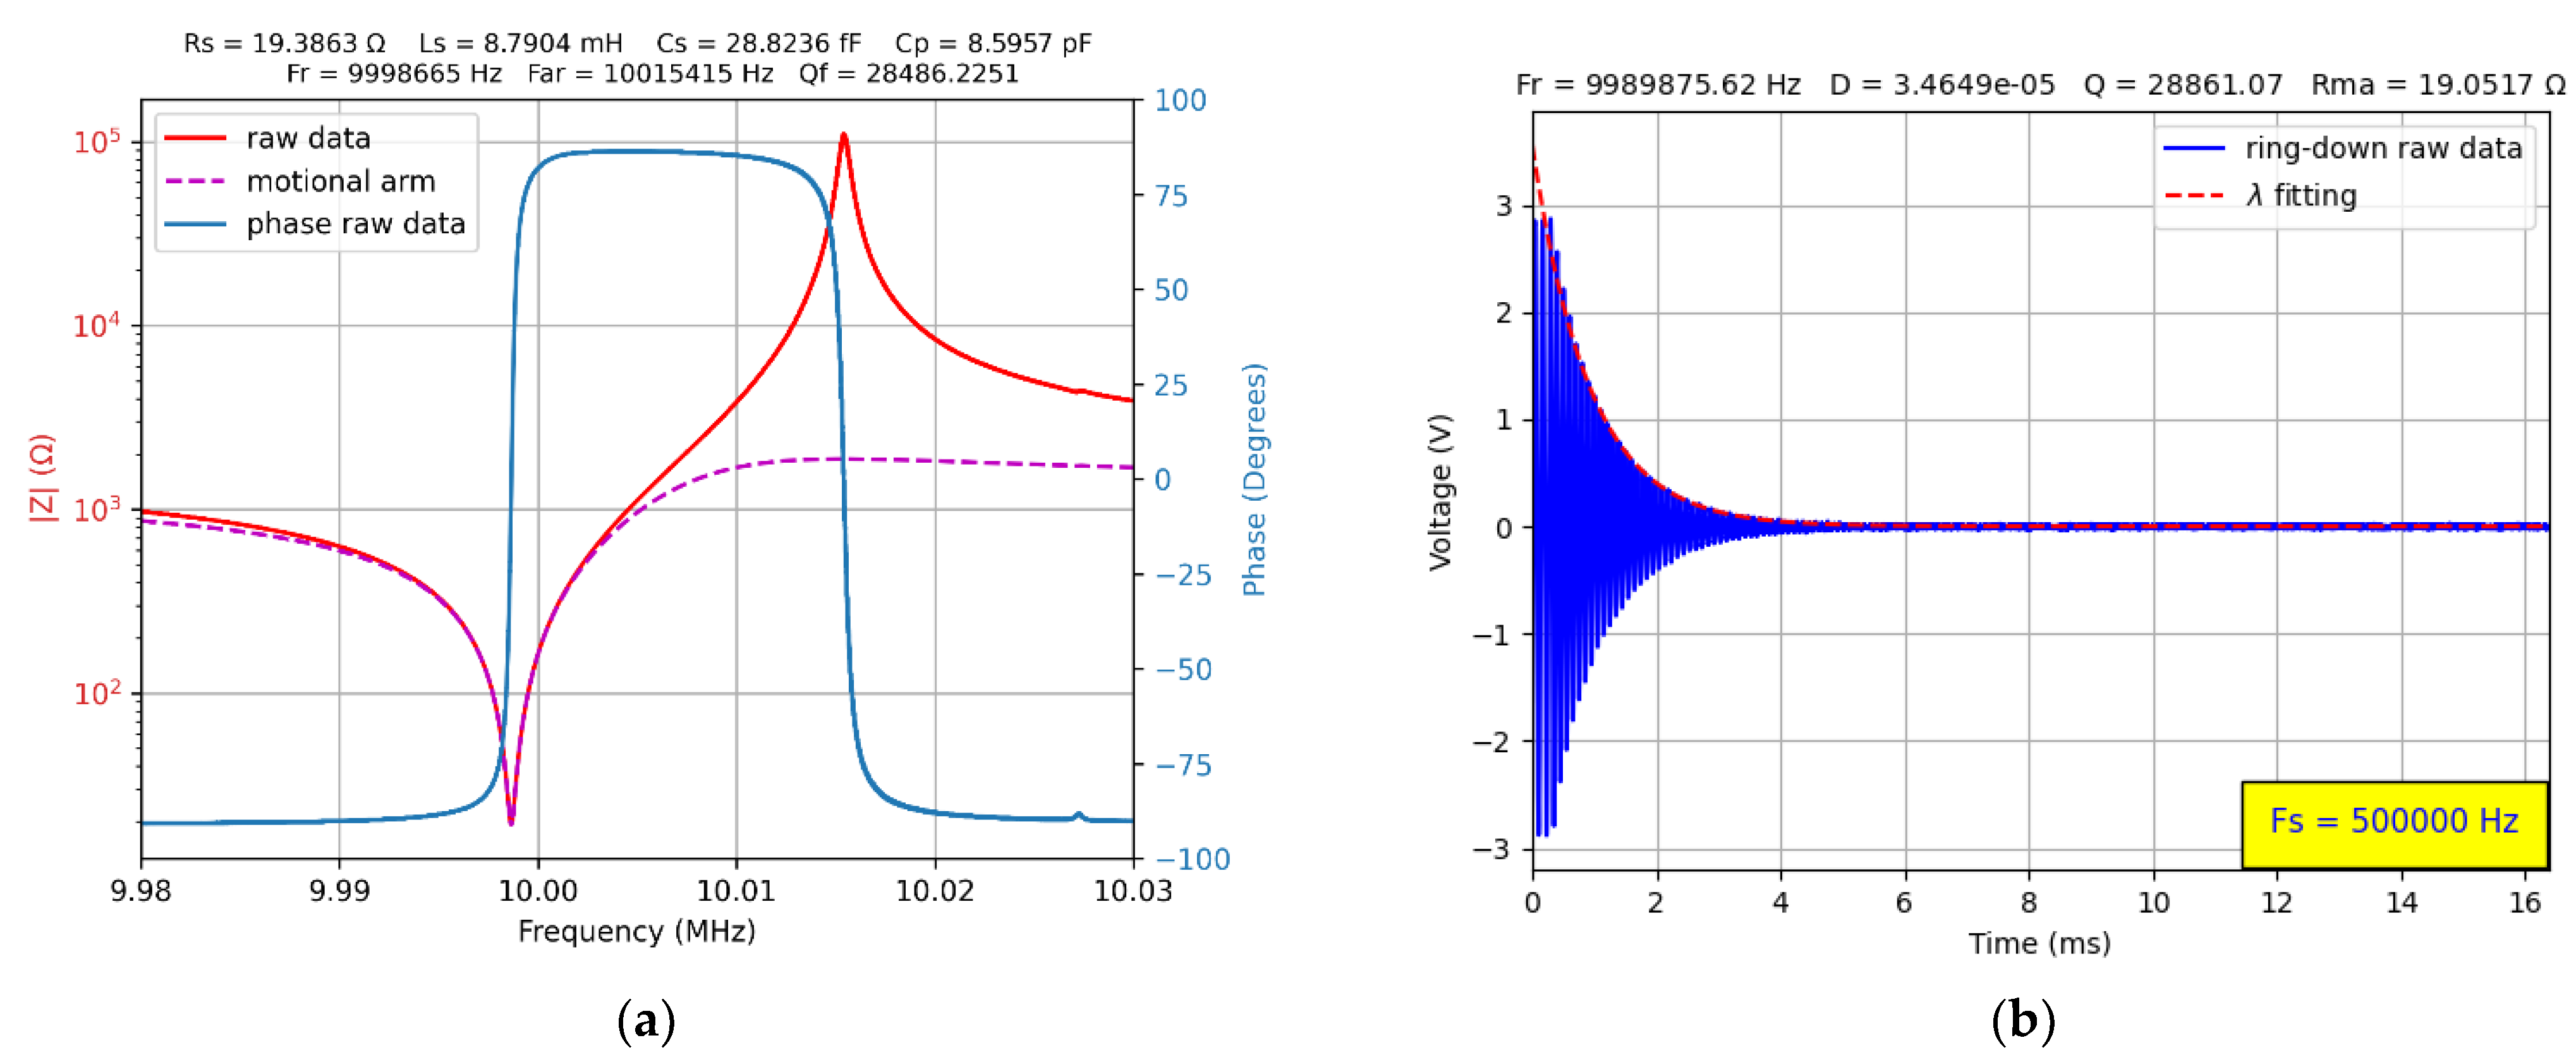
The BVD parameters for polyvinyl alcohol (PVA) coated QCM sensor was obtained using a virtual impedance analyzer (VIA) already presented in the literature [28,30]. In Figure 5a, the VIA results for the QCM sensor are shown.
The reference element to make a connection with the impedance analyzer method is the resistance from the serial branch of the BVD model denoted in this paper as motional resistance, . To have a connection between the parameters of the BVD model and the key parameters specific to the rind-down method, Equation (17) is used. By using the value of the motional capacitance measured by VIA, the motional resistance can be calculated from the dissipation factor.
The value of the motional resistance measured using the impedance analyzer is 19.3663 Ω, and the first validation of the proposed regenerative QCM method was to find a value for trimmer (Figure 2) to measure a value close to 19.3663 Ω, also known as a natural value. The results shown in Figure 5b confirm the ability of the proposed circuit in Figure 2 to compensate for the very low input impedance (≈0.5 MΩ) of the video op-amp. The Q factor also confirms the ability of the VNIC circuit to compensate for the associated losses of the experimental setup. The chosen subsampling frequency is 500 kHz and is marked on the graph in Figure 5b to allow easy comparison with the ring-down responses simulated in Figure 1. The experimental results are in good agreement with the results obtained by simulation for the series branch (motional) of the BVD model.
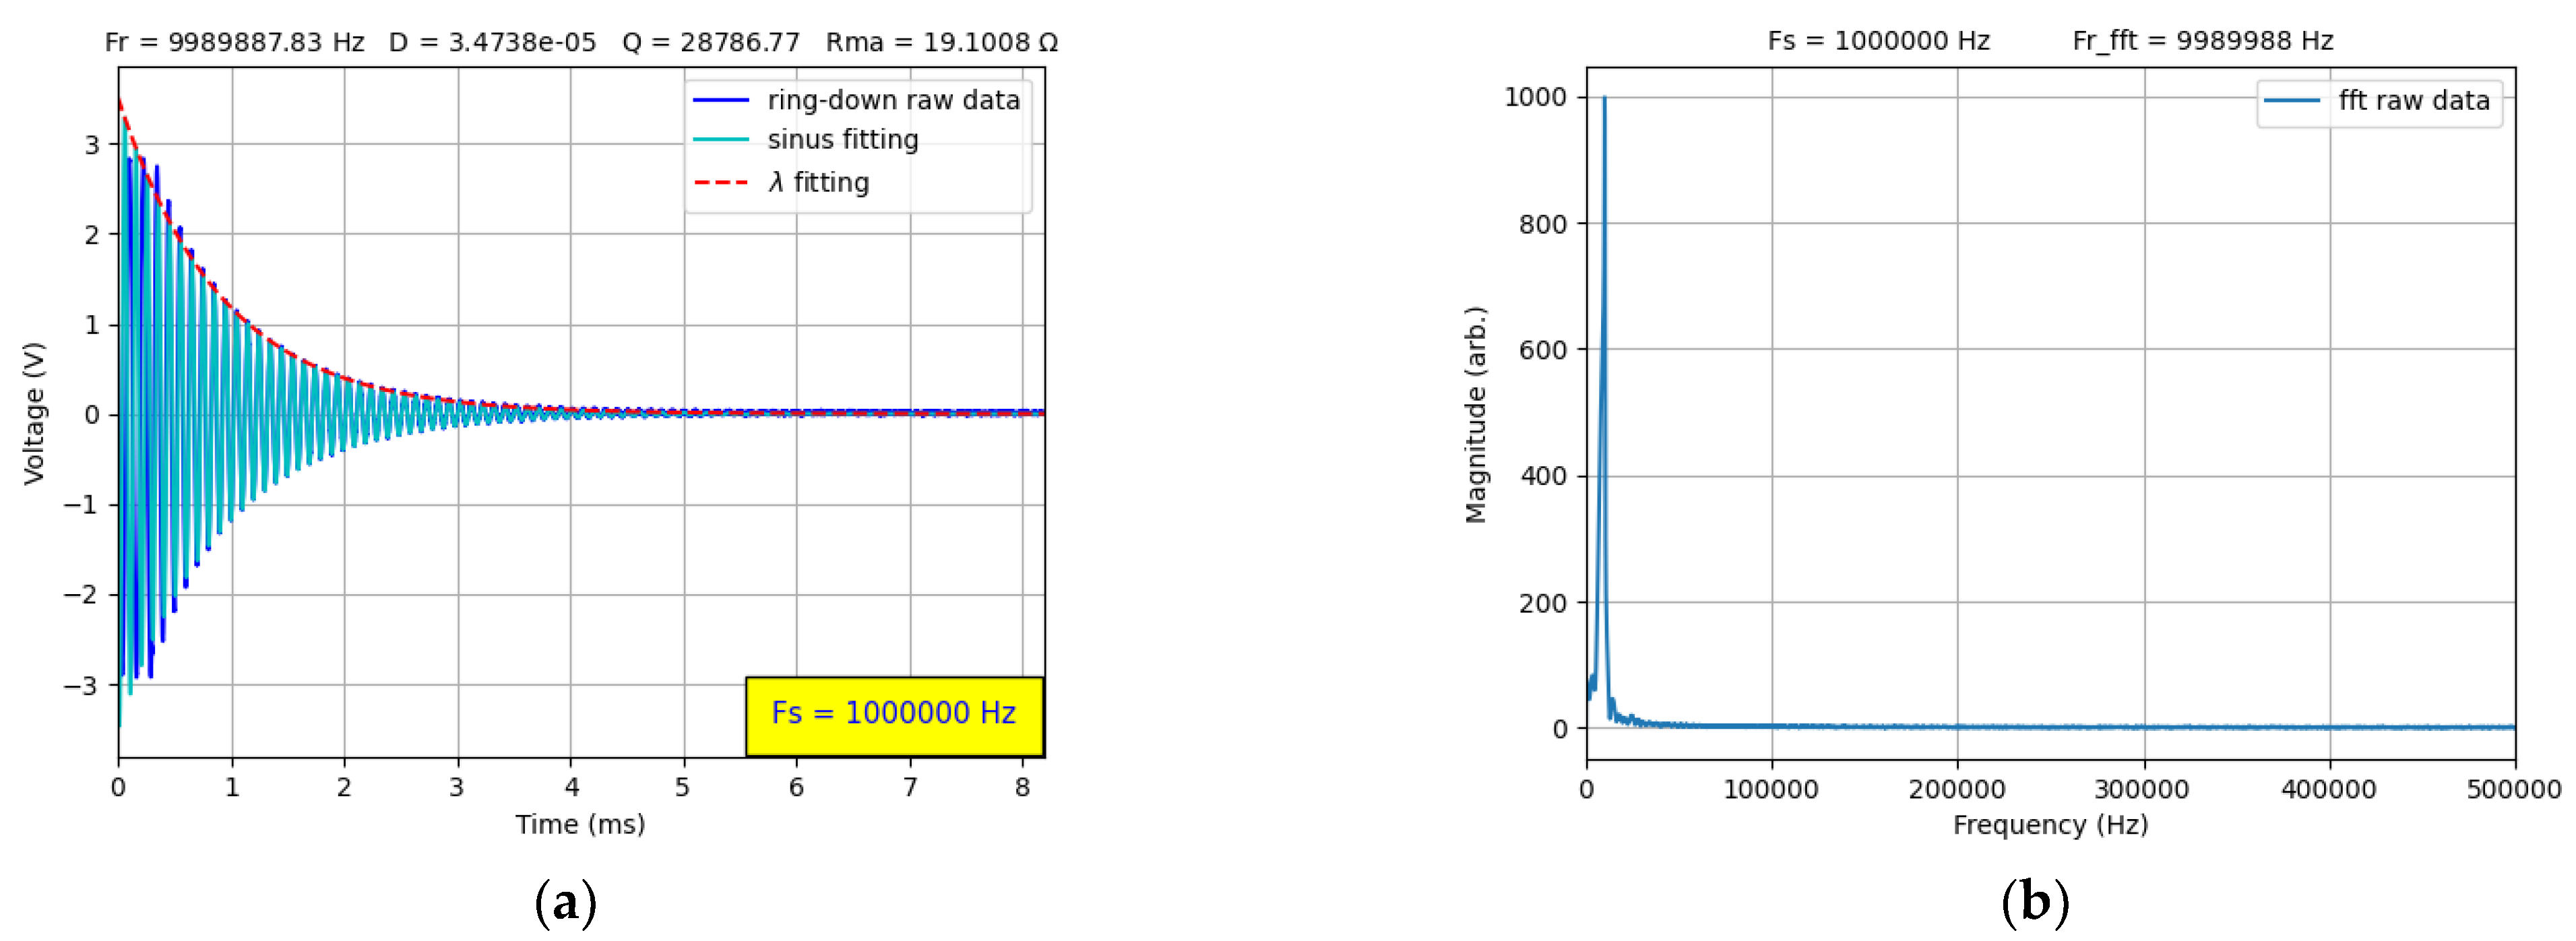
Figure 6a shows the fit of the raw data with Equation (14), represented by the exponentially damped sinusoid and the decay constant, λ. The first periods of the ring-down response are not taken into account by the fitting algorithm. The optimal number of periods to be eliminated from the fitting procedure is established using the “find_peaks” function from Python scipy.signal library. The fitting algorithm used is based on the “curve_fit” function from Python scipy.optimize library that implements the standard method of the non-linear least squares. In this case, the subsampling frequency has been increased to 1 MHz to have a resolution on the time axis that allows a visual evaluation of the fitting results. For the initial estimation of the fit parameters, the Fourier transform of the aliasing frequency shown in Figure 6b is used. The Fourier transform is implemented based on the “fft” function from Python scipy.fft library. The actual frequency of the QCM sensor is determined by the unfolding procedure, taking into account the subsampling frequency. Up to this point, results that are commonly found in the literature [10,11] have been reproduced using a VNIC circuit (Figure 2) that can compensate for the low input impedance of a video op-amp.
3.2. Regenerative Ring-Down of the QCM Sensor
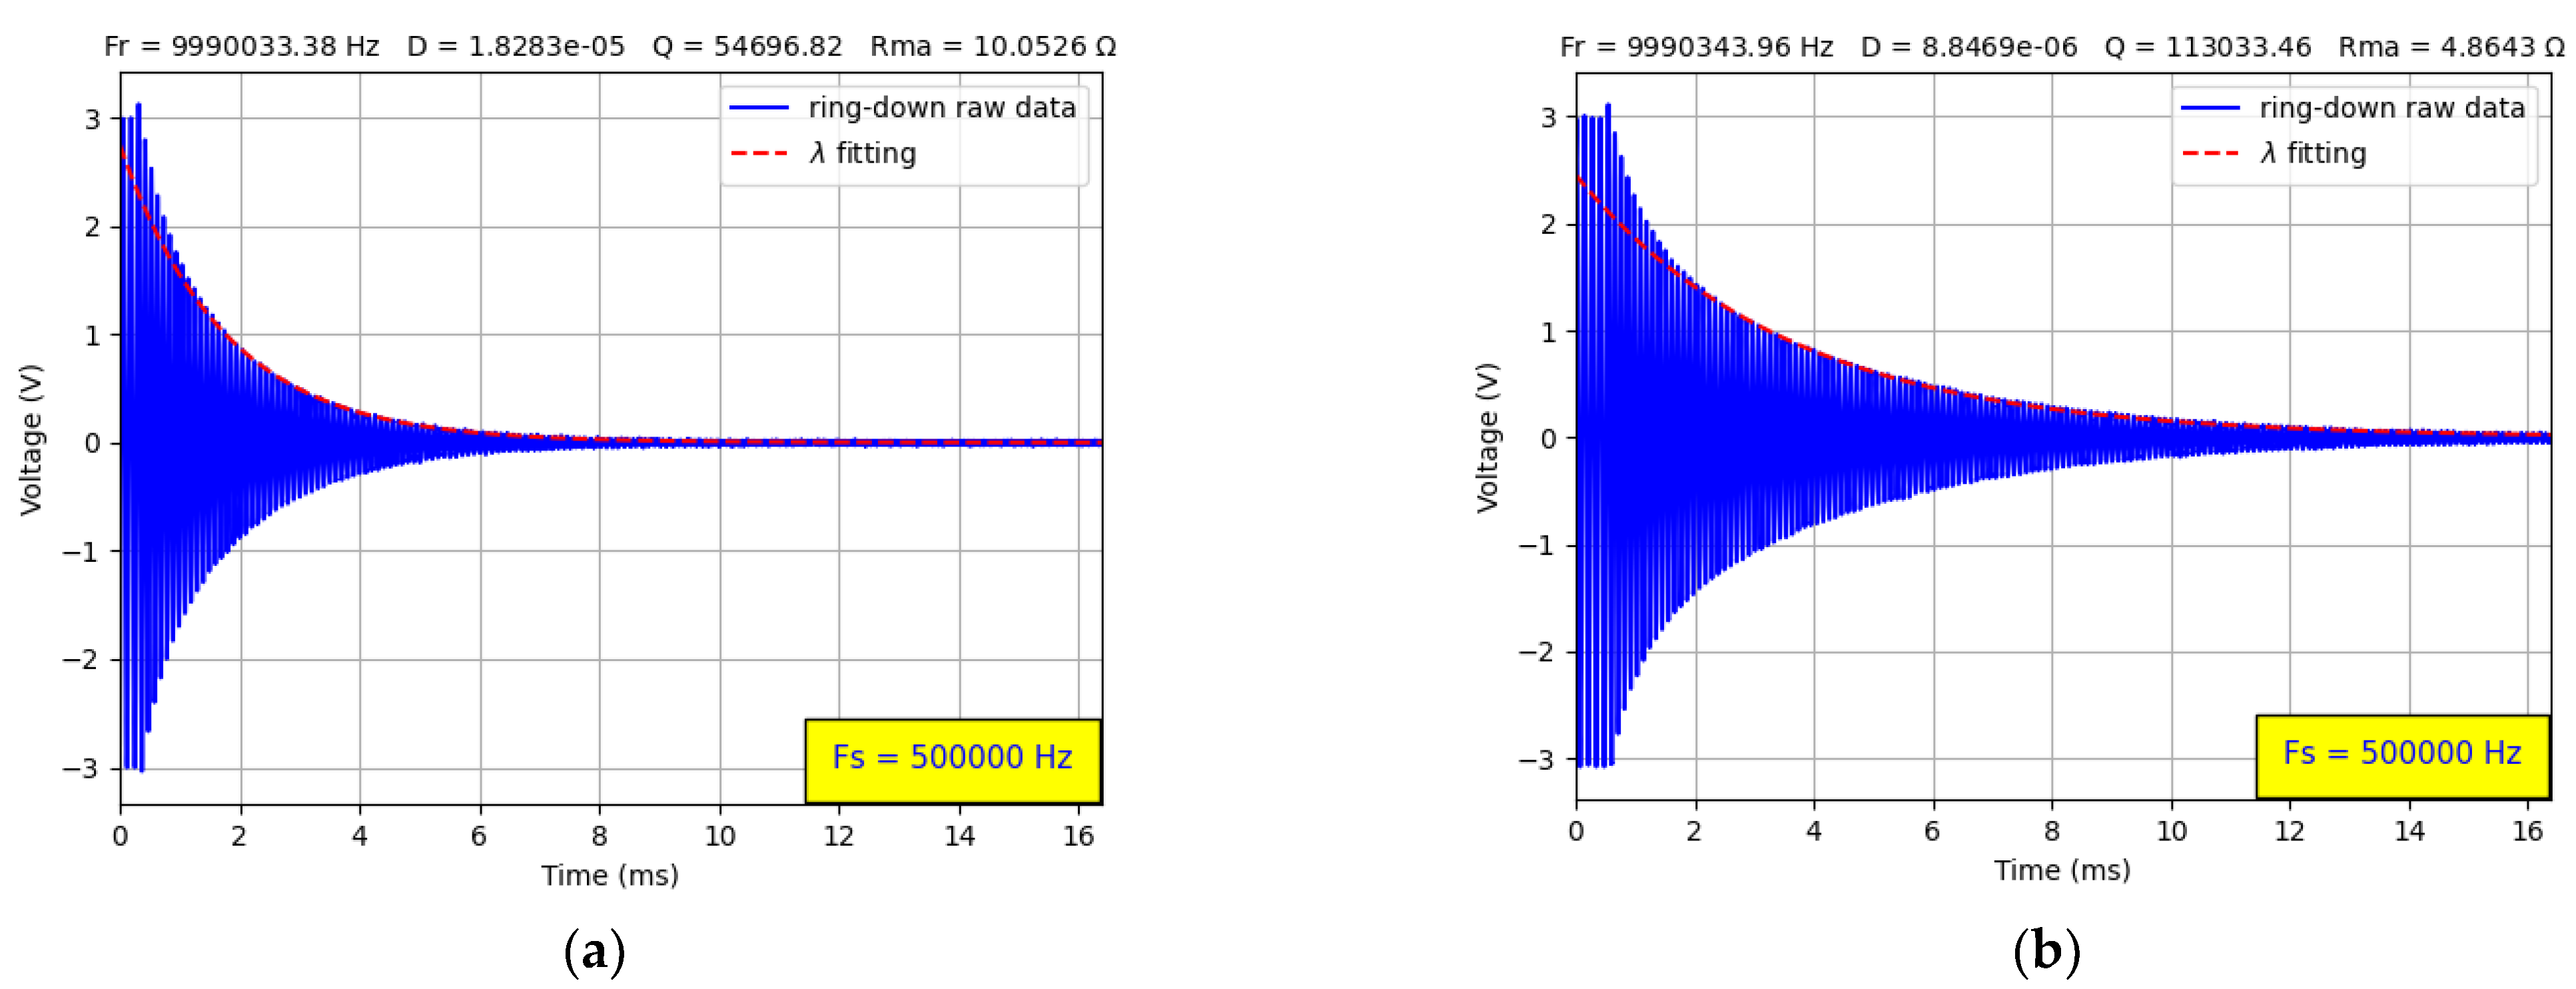
In this subsection are presented experimental results that validate the parametric simulation shown in Figure 1. For a comfortable adjustment of the resistance value (Figure 2), a multi-turn trimmer resistor is used (Figure 4a). However, for very fine control, it is recommended to use another multi-turn trimmer resistor with a value of about 50–100 Ω in series. Such an arrangement will allow the approach with sufficient precision to the condition expressed by Equation (12). In a first step, the capability of the ring-down regenerative method to compensate for the Q factor (motional resistance, dissipation factor) of the QCM sensor coated with a PVA layer is validated.
For a clean QCM sensor, the motional resistance is usually in the range of 5–10 Ω. In Figure 7, the extreme value of the typical range is shown, and the resource of the regenerative ring-down method is validated. Moreover, the experimental results are in good agreement with the simulated ring-down response shown in Figure 1a.
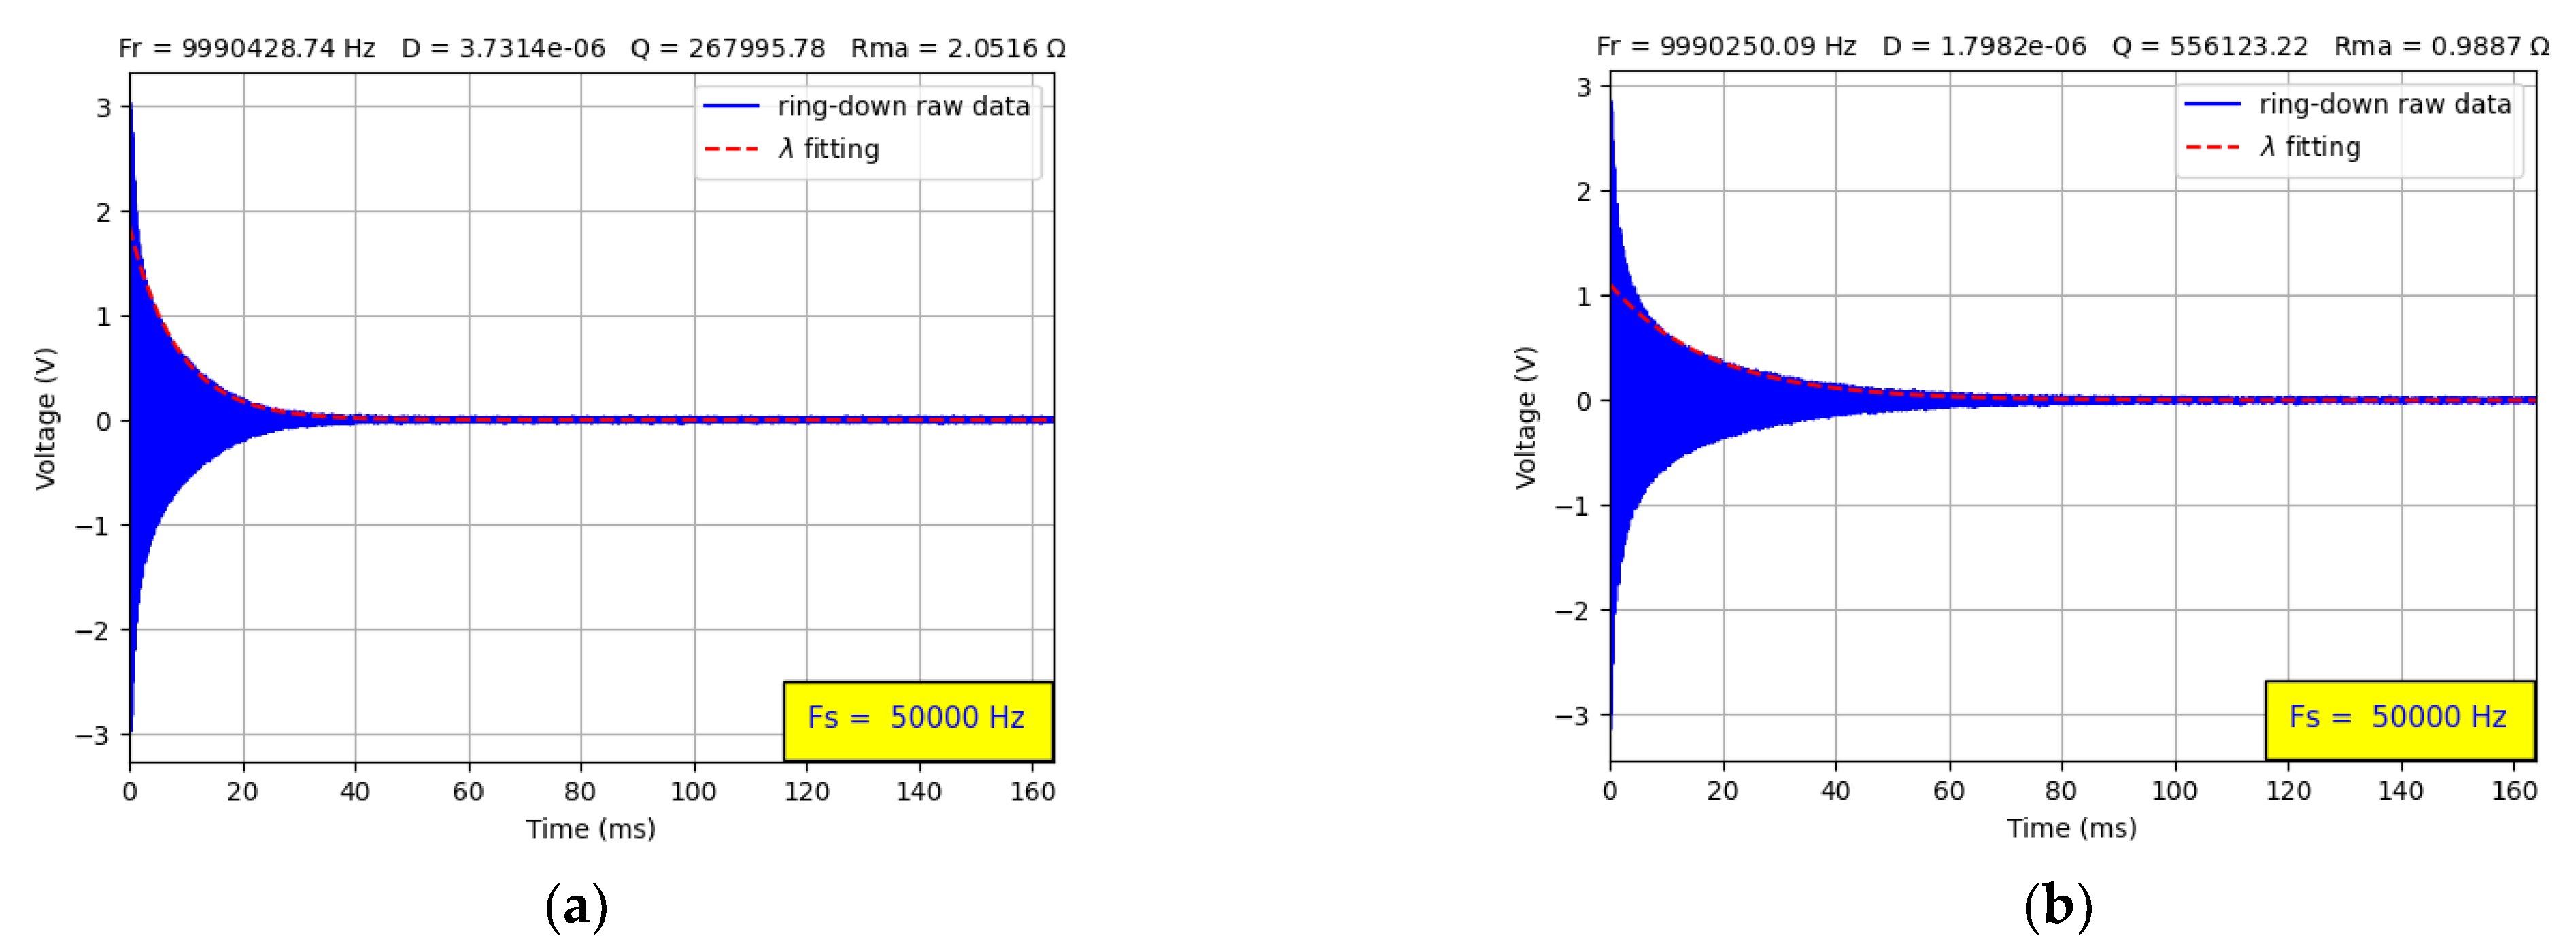
Figure 1b shows the simulation of two atypical situations for a QCM sensor; these two situations do not exist naturally. By adjusting the resistor value of the circuit in Figure 2, these situations can be validated experimentally, as illustrated in Figure 8. For stability reasons, a value for motional artificial resistance of the QCM sensor is more than satisfactory, being practically impossible to find a natural equivalent. To accommodate the increased ring-down time with the input buffer size of the virtual instrument, a subsampling frequency of 50 KHz was chosen. Dissipation factor (D), Q factor, and artificial motional resistance, , are substantially improved, paving the way for effective portable applications. Even if the experimental results are significant, in the next section, a realistic approach to the pluses and minuses of the regenerative QCM method is analyzed.
4. Discussion
Detection and discrimination of VOCs are of crucial importance due to the detrimental effects that they produce on human health and the general environment. The QCM-D, based on the principle of acoustic sensors, is an excellent device with real resources for designing portable and low-cost eNose systems [31]. A wide variety of materials have been investigated as coating materials applied to the surface of the QCM sensor to target a particular type of VOCs. Most commonly, polymeric materials were used as coating materials for the QCM sensor due to simplified synthesis methods and viscoelastic properties [32].
Another area of interest for the QCM sensor in recent years has been the development of new electronic measurement methods. The ring-down method is not very sophisticated from an experimental perspective, and simplified versions are presented in the literature [15,16,17]. These simplified versions cannot compete with professional equipment but can provide support for mass production in the case of a specific QCM sensor application. The ring-down regenerative QCM method is equally suitable for laboratory measurements or large-scale applications. Considering the hardware resources of Internet of Things (IoT) systems, the regenerative ring-down method is addressed mainly to them. Thus, the very long ring-down time benefits the systems with low sampling frequency, solving the aspect related to the price and portability of the applications.
The negative aspects of this first experimental version are specific to the methods of active measurement of the QCM sensor electrical parameters [7,33]. In Table 1, significant parameters a summarized for a discussion in this regard. In the first line of Table 1, the parameters of the QCM sensor measured with a passive method using a VIA are presented. The negative aspect is the resonant frequency () measured by the regenerative ring-down method that changes when the resistor value in the circuit in Figure 2 is modified. The topology of the VNIC circuit is identical to a standard bridge oscillator (SBO). The SBO based on op-amp is a VNIC that satisfies the Barkhausen criteria [7]. The SBO or one of its variants, lever oscillators [34,35,36] and active oscillators [37,38], also known as Meacham oscillators [25,39], are frequently presented in the literature. This situation illustrated in Table 1 is well known in the literature and practically does not induce experimental problems as long as the resistance value does not change during a set of experiments.
Another solution is the use of a digital potentiometer controlled via a serial peripheral interface (SPI) bus. The value of the resistance is known because it will be set by the software. Resonance frequency compensation is automatic each time the Q factor ( or damping factor) is changed during the experiment. In this way, without significantly complicating the circuit, this shortcoming can be transparently eliminated. The solution presented proves, once again, the significant progress generated by virtual instruments that can solve difficult situations encountered in analog circuits in a few lines of code.
5. Conclusions
This paper presented a regenerative QCM method based on the VNIC circuit, along with the most important results, in a comprehensive way. The parametric simulation of the ring-down regenerative method, together with its theoretical modeling, provides the necessary support for the design of the experimental setup. The experimental setup specific to this work was designed based on the VNIC circuit as a shield and AD2 virtual instrument. Extensive experimental measurements using complementary methods demonstrate the capabilities of the down-down regenerative ring-down method. VIA measurements were performed on a QCM sensor covered with a thin PVA layer to have as a reference in the process of validating the regenerative effect. The electrical performance of the regenerative ring-down method is notably in very good agreement with parametric simulation and paves the way for future portable applications on a large scale at a low cost. Finally, the experimentally validated results of the regenerative ring-down method for the QCM sensor are analyzed from the perspective of a deficiency of the method together with a possible modern solution specific to virtual instrumentation. The compensation of the QCM sensor by the proposed regenerative method eliminates the damping effect produced by the sensing film. In this regard, the proposed regenerative circuit designed based on a VNIC confirmed the most optimistic expectations.
Funding
This research received no external funding.
Institutional Review Board Statement
Not applicable.
Informed Consent Statement
Not applicable.
Conflicts of Interest
The authors declare no conflict of interest.
References
- Bottom, V.E. A History of the Quartz Crystal Industry in the USA. In Proceedings of the 35th Annual Frequency Control Symposium, Abilene, TX, USA, 27–29 May 1981; pp. 3–12. [Google Scholar]
- Marrison, W.A. The Evolution of the Quartz Crystal Clock. Bell Syst. Technol. J. 1948, 27, 510–588. [Google Scholar] [CrossRef]
- Kinsman, R.G. A History of Crystal Filters. In Proceedings of the 1998 IEEE International Frequency Control Symposium (Cat. No.98CH36165), Pasadena, CA, USA, 27 May 1998; pp. 563–570. [Google Scholar] [CrossRef]
- Pérez, R.L.; Ayala, C.E.; Park, J.-Y.; Choi, J.-W.; Warner, I.M. Coating-Based Quartz Crystal Microbalance Detection Methods of Environmentally Relevant Volatile Organic Compounds. Chemosensors 2021, 9, 153. [Google Scholar] [CrossRef]
- Na Songkhla, S.; Nakamoto, T. Overview of Quartz Crystal Microbalance Behavior Analysis and Measurement. Chemosensors 2021, 9, 350. [Google Scholar] [CrossRef]
- Kanazawa, K.K.; Gordon, J.G., II. The oscillation frequency of a quartz resonator in contact with a liquid. Anal. Chim. Acta 1985, 175, 99–105. [Google Scholar] [CrossRef]
- Arnau, A. A review of interface electronic systems for AT-cut quartz crystal microbalance applications in liquids. Sensors 2008, 8, 370–411. [Google Scholar] [CrossRef] [PubMed] [Green Version]
- Hong, S. Research on Patent Litigation between Lee de Forest and Edwin H. Armstrong over the Regenerating Audion. J. Hist. Korean Sci. 2006, 28, 255–550. [Google Scholar]
- Armstrong, E.H. Some Recent Developments in the Audion Receiver. Proc. Inst. Radio Eng. 1915, 3, 215–238. [Google Scholar] [CrossRef]
- Rodahl, M.; Höök, F.; Krozer, A.; Brzezinski, P.; Kasemo, B. Quartz crystal microbalance setup for frequency and Q-factor measurements in gaseous and liquid environments. Rev. Sci. Instrum. 1995, 66, 3924–3930. [Google Scholar] [CrossRef] [Green Version]
- Rodahl, M.; Kasemo, B. A simple setup to simultaneously measure the resonant frequency and the absolute dissipation factor of a quartz crystal microbalance. Rev. Sci. Instrum. 1996, 67, 3238–3241. [Google Scholar] [CrossRef] [Green Version]
- QSense Pro. Available online: https://www.biolinscientific.com/qsense/instruments/qsense-pro (accessed on 6 February 2022).
- Biotechnology and Madical Devices. Available online: https://www.biolinscientific.com/industries/biotechnology-medical-devices (accessed on 6 February 2022).
- Wessendorf, K.O. The Active-Bridge Oscillator for Use with Liquid Loaded QCM Sensors. In Proceedings of the IEEE International Frequency Control Symposium and PDA Exhibition, Seattle, WA, USA, 8 June 2001; pp. 400–407. [Google Scholar]
- Wu, K.; Wu, B.; Feng, C.-Q.; Du, X.; Huang, H.; Yin, Z. Simple dissipative quartz crystal microbalance and methods for determining dissipation decay constants. Rev. Sci. Instrum. 2006, 77, 036102. [Google Scholar] [CrossRef]
- Santiviparat, K.; Sriyudthsak, M. Simple QCM-D Measuring Circuit for Aqueous Applications. In Proceedings of the 14th International Conference on Electrical Engineering/Electronics, Computer, Telecommunications and Information Technology (ECTI-CON), Phuket, Thailand, 27–30 June 2017; pp. 278–281. [Google Scholar] [CrossRef]
- Tumurbaatar, B.; Kim, M.J.; Park, C.H.; Kim, C.S. A portable and computer-simulation analysis for the real-time measurement of the QCMD systems for the biomedical application. Sens. Bio-Sens. Res. 2018, 21, 75–81. [Google Scholar] [CrossRef]
- Dixon, M.C. Quartz crystal microbalance with dissipation monitoring: Enabling real-time characterization of biological materials and their interactions. J. Biomol. Technol. 2008, 19, 151–158. [Google Scholar]
- Tarnapolsky, A.; Freger, V. Modeling QCM-D Response to Deposition and Attachment of Microparticles and Living Cells. Anal. Chem. 2018, 90, 13960–13968. [Google Scholar] [CrossRef] [PubMed]
- Butterworth, S. On a Null Method of Testing Vibration Galvanometers. Proc. Phys. Soc. Lond. 1913, 26, 264. [Google Scholar] [CrossRef] [Green Version]
- Van Dyke, K.S. The Piezo-Electric Resonator and Its Equivalent Network. Proc. Inst. Radio Eng. 1928, 16, 742–764. [Google Scholar] [CrossRef]
- Johannsmann, D. Studies of Viscoelasticity with the QCM. In Piezoelectric Sensors; Springer: Berlin/Heidelberg, Germany, 2007; pp. 49–109. [Google Scholar]
- Swartzel, K.D., Jr. Summing Amplifier. U.S. Patent 2,401,779, 1 May 1941. Available online: https://patents.google.com/patent/US2401779A/en (accessed on 24 May 2022).
- Ragazzini, J.R.; Randall, R.H.; Russell, F.A. Analysis of Problems in Dynamics by Electronic Circuits. Proc. Inst. Radio Eng. 1947, 35, 444–452. [Google Scholar] [CrossRef]
- Fort, A.; Panzardi, E.; Vignoli, V.; Tani, M.; Landi, E.; Mugnaini, M.; Vaccarella, P. An Adaptive Measurement System for the Simultaneous Evaluation of Frequency Shift and Series Resistance of QCM in Liquid. Sensors 2021, 21, 678. [Google Scholar] [CrossRef]
- Antoniou, A. Improved Negative Impedance Converter and Related Synthesis Procedures. Ph.D. Thesis, University of Surrey, Guildford, UK, 1966. Available online: https://openresearch.surrey.ac.uk/esploro/outputs/doctoral/Improved-negative-impedance-converters-and-related/99513125402346#file-0 (accessed on 24 May 2022).
- Analod Discovery 2 Reference Manual. Available online: https://digilent.com/reference/test-and-measurement/analog-discovery-2/reference-manual (accessed on 11 January 2022).
- Burda, I. Quartz Crystal Microbalance with Impedance Analysis Based on Virtual Instruments: Experimental Study. Sensors 2022, 22, 1506. [Google Scholar] [CrossRef]
- Ojarand, J.; Min, M.; Koel, A. Multichannel Electrical Impedance Spectroscopy Analyzer with Microfluidic Sensors. Sensors 2019, 19, 1891. [Google Scholar] [CrossRef] [Green Version]
- Burda, I. Advanced Impedance Spectroscopy for QCM Sensor in Liquid Medium. Sensors 2022, 22, 2337. [Google Scholar] [CrossRef]
- Julian, T.; Hidayat, S.N.; Rianjanu, A.; Dharmawan, A.B.; Wasisto, H.S.; Triyana, K. Intelligent Mobile Electronic Nose System Comprising a Hybrid Polymer-Functionalized Quartz Crystal Microbalance Sensor Array. ACS Omega 2020, 5, 29492–29503. [Google Scholar] [CrossRef] [PubMed]
- Fukada, K.; Shiratori, S. Viscosity sensing by adjusting the interface of a small liquid droplet/silica composite layer on quartz crystal microbalance. RSC Adv. 2016, 6, 38475–38480. [Google Scholar] [CrossRef] [Green Version]
- Arnau, A.; Ferrari, V.; Soares, D.; Perrot, H. Piezoelectric Transducers and Applications, 2nd ed.; Arnau, A., Ed.; Springer: Berlin/Heidelberg, Germany, 2008. [Google Scholar]
- Wessendorf, K.O. The Lever Oscillator for Use in High Resistance Resonator Applications. In Proceedings of the 1993 IEEE International Frequency Control Symposium, Salt Lake City, UT, USA, 2–4 June 1993; pp. 711–717. [Google Scholar]
- Martin, S.J.; Spates, J.J.; Wessendorf, K.O.; Schneider, T.W.; Huber, R.J. Resonator/oscillator response to liquid loading. Anal. Chem. 1997, 69, 2050–2054. [Google Scholar] [CrossRef] [PubMed] [Green Version]
- Wessendorf, K.O. Oscillator Circuit for Use with High Loss Quartz Resonator Sensors. U.S. Patent No. 5,416,448, 16 May 1995. Available online: https://patents.google.com/patent/US5416448A/en (accessed on 24 May 2022).
- Wessendorf, K.O. The Active Bridge Oscillator. In Proceeding of IEEE International Frequency Control Symposium, Pasadena, CA, USA, 29 May 1998; pp. 361–369. [Google Scholar]
- Wessendorf, K.O. Active Bridge Oscillator. U.S. Patent No. 6,169,459, 19 May 1999. Available online: https://patents.google.com/patent/US6169459B1/en (accessed on 10 May 2022).
- Meacham, L.A. The bridge stabilized oscillator. Bell Syst. Technol. J. 1938, 17, 574–591. [Google Scholar] [CrossRef]
Figure 1.
Parametric simulation of the ring-down response depending on the motional resistance () for a QCM sensor with the series resonant frequency of 10 MHz: (a) , (b) .
Figure 1.
Parametric simulation of the ring-down response depending on the motional resistance () for a QCM sensor with the series resonant frequency of 10 MHz: (a) , (b) .

Figure 2.
The VNIC circuit proposed for the implementation of the regenerative ring-down method.

Figure 3.
Butterworth van Dyke (BVD) model for quartz crystal used as QCM sensor.

Figure 4.
The regenerative QCM ring-down method: (a) VNIC circuit as a shield for AD2, (b) the experimental setup.
Figure 4.
The regenerative QCM ring-down method: (a) VNIC circuit as a shield for AD2, (b) the experimental setup.

Figure 5.
The reference parameter of the QCM sensor coated with PVA: (a) The natural BVD parameter based on VIA; (b) The key parameter obtained with the regenerative ring-down method.
Figure 5.
The reference parameter of the QCM sensor coated with PVA: (a) The natural BVD parameter based on VIA; (b) The key parameter obtained with the regenerative ring-down method.

Figure 6.
The reference parameter of the QCM sensor coated with PVA: (a) The key parameters of the QCM sensor fitted with exponentially damped sinusoid; (b) The Fourier transform of raw data (aliasing frequency).
Figure 6.
The reference parameter of the QCM sensor coated with PVA: (a) The key parameters of the QCM sensor fitted with exponentially damped sinusoid; (b) The Fourier transform of raw data (aliasing frequency).

Figure 7.
The key parameter obtained with regenerative ring-down method: (a) Compensation of the dissipation factor, ; (b) Compensation of the dissipation factor, .
Figure 7.
The key parameter obtained with regenerative ring-down method: (a) Compensation of the dissipation factor, ; (b) Compensation of the dissipation factor, .

Figure 8.
The key parameter obtained with the regenerative ring-down method: (a) Compensation of the dissipation factor, ; (b) Compensation of the dissipation factor, .
Figure 8.
The key parameter obtained with the regenerative ring-down method: (a) Compensation of the dissipation factor, ; (b) Compensation of the dissipation factor, .


Table 1.
The natural and artificial key parameter of the QCM sensor.
| Q Factor | ||
|---|---|---|
| 9,998,665.00 | 19.3863 | 28,486.22 |
| 9,989,875.02 | 19.0517 | 28,861.07 |
| 9,990,033.38 | 10.0526 | 54,696.82 |
| 9,990,343.96 | 4.8643 | 113,033.46 |
| 9,990,428.74 | 2.0516 | 267,995.78 |
| 9,990,250.09 | 0.9887 | 556,123.22 |
Publisher’s Note: MDPI stays neutral with regard to jurisdictional claims in published maps and institutional affiliations. |
© 2022 by the author. Licensee MDPI, Basel, Switzerland. This article is an open access article distributed under the terms and conditions of the Creative Commons Attribution (CC BY) license (https://creativecommons.org/licenses/by/4.0/).
Share and Cite
MDPI and ACS Style
Burda, I. A Study on Regenerative Quartz Crystal Microbalance. Chemosensors 2022, 10, 262. https://0-doi-org.brum.beds.ac.uk/10.3390/chemosensors10070262
AMA Style
Burda I. A Study on Regenerative Quartz Crystal Microbalance. Chemosensors. 2022; 10(7):262. https://0-doi-org.brum.beds.ac.uk/10.3390/chemosensors10070262
Chicago/Turabian StyleBurda, Ioan. 2022. "A Study on Regenerative Quartz Crystal Microbalance" Chemosensors 10, no. 7: 262. https://0-doi-org.brum.beds.ac.uk/10.3390/chemosensors10070262
Note that from the first issue of 2016, this journal uses article numbers instead of page numbers. See further details here.