Article

Ultrasensitive Fluorescent “ON-OFF” Label-Free Immunosensor for Detection of Vitellogenin of Marine Medaka

1
College of Physics and Optoelectronic Engineering, Ocean University of China, Qingdao 266100, China
2
College of Marine Life Sciences, Ocean University of China, Qingdao 266003, China
*
Authors to whom correspondence should be addressed.
Submission received: 22 August 2022 / Revised: 20 September 2022 / Accepted: 26 September 2022 / Published: 1 December 2022
(This article belongs to the Special Issue Application of Luminescent Materials for Sensing)

Abstract

:
The negative effects of environmental estrogens on wildlife and human beings are gaining increasing attention. Research on the highly sensitive detection method for Vitellogenin (Vtg), one of the biomarkers of environmental estrogens (EEs), is expected to detect weak estrogens in complex environments. This study aimed to develop a label-free immunosensor with high specificity and sensitivity for testing Vtg. Carbon quantum dots (CQDs) with high fluorescence and excellent stability were synthesized, and antilipovitellin monoclonal antibody (Anti-Lv-mAb) was prepared. Based on the fluorescence resonance energy transfer (FRET) between CQDs-conjugated Anti-Lv-mAb and reduced graphene oxide (RGO), an ultrasensitive fluorescent “ON-OFF” label-free immunosensor for detection of Vtg of marine medaka was established. By modification of RGO with poly dimethyl diallyl ammonium chloride (PDDA), the Zeta potential of RGO was changed and the FRET efficiency was improved. The immunosensor displayed a wide linear response to Vtg of marine medaka from 0.1 to 3000 ng/mL, a low limit of detection (LOD) of 0.04 ng/mL, and excellent sensitivity (28,833.63 CPS/(ng/mL)), selectivity, and reproducibility. The results demonstrated that the fluorescent “ON-OFF” immunosensor is an easy-to-use, relatively fast, ultrasensitive, and accurate detection method for weak estrogenic activity.

1. Introduction

Environmental estrogens (EEs), including synthetic and natural estrogens, refers to a class of compounds that can interfere with the synthesis, release, transportation, combination, and metabolic process of the normal body endocrine, activate or inhibit the function of the endocrine system, and, finally, damage the maintenance of body stability and regulation [1]. Because EEs possess the characteristics of weak solubility, chemical stability, difficult degradation, easy enrichment through the food chain, long biological half-life, and so on, they can cause serious and lasting harm to the environment [2]. By disrupting the normal functions of endocrine, immune, nervous, and other systems, EEs indicate a cumulative effect in the body, resulting in a variety of diseases, such as endocrine disorder, metabolic imbalance, reproductive system damage, and inestimable harm to animals and humans [3]. The toxicological effects of EEs exposure to aquatic animals have become a global environmental problem and aroused widespread concern [4]. Therefore, it is urgent to establish an accurate, efficient, and convenient method for EEs detection.
So far, the detection techniques for EEs mainly rely on chemical analysis instruments, including high-performance liquid chromatography (HPLC), gas chromatography (HPGC), and gas chromatography-mass spectrometry (GC-MS) [5,6,7]. Although these techniques can accurately quantify the concentrations of estrogen pollutants, they have many problems, such as time-consuming pretreatment, complicated operation, high cost, and high LOD. In contrast, biomonitoring tools can remedy the shortcomings of traditional methods. There have been cases of using biological monitoring tools to detect multiple substances. Tuteja et al. [8] developed a label-free immunosensor based on electrochemical impedance spectroscopy for the detection of cardiac biomarker myoglobin (cMyo). Yang et al. [9] assumed a label-free electrochemical immunosensor for the quantitative detection of carcino-embryonic antigen (CEA) using nitrogen-doped graphene quantum dots (N-GQDs) supported by PtPd bimetallic nanoparticles (PtPd/N-GQDs). Wu et al. [10] constructed an ultrasensitive label-free electrochemiluminescence immunosensor based on GQDs using prostate-specific antigen (PSA) as a model. Ganganboina et al. [11] established a label-free impedance immunosensor based on N and S-graphene quantum dots@Au-polyaniline (N, S-GQDs@Au-PANI) nanowires for the quantitative detection of carcinoembryonic antigen (CEA).
Vitellogenin (Vtg) is a female-specific protein that was often used as a biomarker of EEs [12,13]. Among fish from which Vtg was derived, the Japanese medaka was recommended as a model organism [14]. Vtg is usually synthesized in the liver of mature female fish under the control of 17β-estradiol (E2), released by liver cells into the bloodstream, transported to the ovaries, and eventually deposited in egg cells and cleaved into lipovitellin (Lv), lecithin (Pv), and other components [15]. Since males and juveniles do not normally produce Vtg unless they are exposed to exogenous estrogens, induction of Vtg in males and juveniles can indicate exposure levels of EEs [16]. The reaction between antigen and antibody is highly specific, and antibodies can recognize antigens in many substances specifically [17,18]. Therefore, highly specific immunosensors can be well-used to detect Vtg content in complex environments.
In recent years, some immunoassay techniques, such as enzyme-linked immunosorbent assay (ELISA) [19,20,21], electrochemical sensors [22,23], and optical sensors [24,25,26], were used to test Vtg. Yi et al. [19] used an ELISA method for the determination of Vtg in Marine medlifish with a detection limit of 3.1 ng/mL and a working range of 15.6–500 ng/mL. This method has high specificity and sensitivity, but the whole process is complicated, and one cannot obtain results quickly. Darain et al. [22] investigated a disposable current immunosensor for rapid detection of Vtg in Carassius Auratus. The sensor has a low detection limit (0.09 ng/ mL) but a narrow detection range (0.25–7.8 ng/mL). Wang et al. [24] developed an optical immune sensor for detection of Vtg based on Octet System. The sensor has a wide linear range (78–5000 ng/mL) but is slightly less sensitive.
Recently, fluorescence resonance energy transfer (FRET) technology has emerged as one of the most sensitive and reliable biomolecular detection technologies available [27]. Immunosensors based on FRET between amine functionalized graphene quantum dots (afGQDs) and graphene have been developed to detect cardiac marker antigen Troponin I [28]. A similar strategy was used to establish an ultrasensitive fluorescent “ON-OFF” label-free immunosensor for the detection of Lv, a main cleavage product of Vtg [29]. The immunosensor has a wide linear test range (0.001–1500 ng/mL) and a lower limit of detection (LOD, 0.9 pg/mL) [29]. The FRET-based sensors require excellent donor–acceptor pairs to improve their efficiencies and performances. For realizing the conjugation between GQDs and antibodies, GQDs had to be amine-modified [29], which is time-consuming. Carbon quantum dots (CQDs) are quasi-zero nanomaterials with a size of less than 10 nm [30], high surface-to-volume ratio, and special physical, chemical, electronic, and biological properties [31]. CQDs have important applications in biological imaging, photo-electronics, sensing, photocatalysis, biomedicine, and other fields [32,33,34]. Compared with traditional organic dyes, metal nanoparticles, and semiconductor quantum dots, CQDs have better fluorescence stability, excellent biocompatibility, and extreme low toxicity. Importantly, CQDs containing amine groups can be synthesized in one step by simple methods, without the need for time-consuming amination [35]. As far as we know, CQDs have not been used in Vtg detection. Based on CQDs with the amino group and reduced graphene (RGO), we developed a simple, rapid, and sensitive FRET immunosensor for Vtg detection. Our strategy is shown in Scheme 1. Firstly, by amidation reaction, monoclonal antibody against Lv (Anti-Lv-mAb) of marine medaka that can specifically recognize Vtg was covalently coupled with CQDs to form Anti-Lv-mAb/CQDs conjugate nanoprobes. The fluorescence of the conjugate nanoprobes was quenched via FRET between the nanoprobes and RGO, and the FRET efficiency was greatly enhanced by modifying RGO with poly dimethyl diallyl ammonium chloride (PDDA). Finally, by adding Vtg into Anti-Lv-mAb/CQDs/RGO_PDDA solution, the stacked RGO_PDDA was forced away from the nanoprobes for the strong immune interaction between the Anti-Lv-mAb (antibody) and Vtg (antigen), the quenched fluorescence was partially recovered, and the recovered fluorescent intensity had a positive correlation to the concentrations of the Vtg; thus, Vtg could be quantitatively determined. In addition to the inherent high specificity, the strategy also has the advantages of a wide linear detection range (0.1–3000 ng/mL), lower LOD (0.04 ng/mL), excellent sensitivity (28,833.63 CPS/(ng/mL)), good selectivity and reproducibility, and being nontoxic, safe to operators and the environment, easy-to-use, and time-saving.

2. Materials and Methods

2.1. Materials

GO was purchased from Turing Evolution Technology Co., Ltd. (Shenzhen, China). Polyvinyl pyrrolidone (PVP), ascorbic acid (AA), and 2-(N-Morpholino) ethanesulfonic acid (MES) were bought from Aladdin Reagents Co., Ltd. (Shanghai, China). PDDA was purchased from HEOWNS Biochemical Technology Co., Ltd. (Tianjin, China). 1-(3-Dimethylaminopropyl)-3-ethylcarbodiimide hydro (EDC) was purchased from Solarbio Technology Co., Ltd. (Beijing, China). l-glutamic acid and N-hydroxy succinimide (NHS) was bought from Alfa Aesar Chemical Co., Ltd. (Shanghai, China). Ultrapure water of resistivity 18.2 MΩ prepared on a FLOM-FDY system was used throughout all experiments.

2.2. Production of Vtg and Anti-Lv-mAbs

Based on our previous studies [20,36,37], Vtg of marine medaka were isolated and purified by a two-step chromatographic procedure (Gel filtration chromatography and Anion exchange chromatography) and stored at −80 °C. According to the method of Li et al. [38], Anti-Lv-mAbs were prepared by the cell fusion technique and then purified by affinity chromatography.

2.3. Fabrication of RGO

RGO was obtained via reduction of GO, using AA as a reducer and PVP as a surfactant to prevent aggregation. At room temperature, 0.01 g GO was fully dispersed in 40 mL deionized water (stirred and subjected to ultrasound for 15 min, respectively). The aqueous solution of GO is dark brown in color with a pH value of 3.4. A total of 25% ammonia was added into the GO solution to adjust the pH of 9.5, then 40 mL 5 mg/mL PVP solution was mixed with the GO solution. After full stirring (about 1 h), 0.02 M AA solution was added into the mixed solution. Then, the reaction solution was heated up to 70 °C and maintained for a certain amount of time. During the reduction process, the reaction color gradually darkened to a dark black, and the oxidation peak in UV-Vis absorption spectra (Figure S1) decreased gradually, indicating that GO was gradually reduced to RGO. The samples were centrifuged three times at 14,000× g rpm, then dried at 45 °C for later use.

2.4. The Modification of RGO

An equal volume of 1 mg/mL PDDA was added into the 1 mg/mL RGO aqueous solution. Then, the mixed solution was subjected to thermostatic ultrasound for 4 h. After being centrifugated at 14,000× g rpm three times, the final RGO_PDDA was dried to a solid at 45 °C and stored at room temperature.

2.5. Preparation of CQDs

In our previous work, CQDs with amino groups were synthesized, which resulted in a quantum yield of 13.2% and was stable at neutral pH [35]. Briefly, 60 mL L-glutamic acid aqueous (0.45 M) was added into the reaction kettle connected to the ultrasonic transducer. After the ultrasonic hydrothermal reaction at 250 °C for 4 h, the yellow CQDs solution was obtained. The solution was purified by filtration (220 nm hole size) and dialysis (1 KD). Finally, solid CQDs were obtained after freeze-drying.

2.6. Characterization

A UV-Vis absorption spectrophotometer (UH5300, HITACHI, Tokyo, Japan) was employed to measure the absorption spectrum. The PL spectroscopy was performed by a type of FluoroMax-4 fluorescent spectrometer (Horiba, Kyoto, Japan. The size and morphology of RGO and CQDs were characterized by a field emission transmission electron microscope (Tecnai G2 F20, FEI, Hillsboro, OR, USA). Fourier transform infrared (FTIR) spectra were obtained with a Nicolet NI10 FTIR spectrometer (Thermo Fisher Scientific, Waltham, MA, USA). A Zetasizer Nano (Malvern, Malvern, UK) was used to analyze the Zeta potentials.

2.7. Conjugation of CQDs and Anti-Lv-mAbs

A total of 0.4 mg EDC and 1.1 mg NHS were added into 100 μL 0.1 M MES solution with a vigorous stirring. To active the Anti-Lv-mAbs, 0.99 mL 8 μg/mL of Anti-Lv mAbs was mixed with 0.01 mL of the above solution and stirred for 15 min at 27 °C. For the conjugation of Anti-Lv-mAbs and CQDs, the activated Anti-Lv-mAbs was mixed with equal volume of CQDs (8 μg/mL) and incubated at 37 °C for 1 h. Then, the unconjugated molecules were removed by five ultracentrifugation washes with PBS buffer solution. Finally, the conjugate of Anti-Lv-mAbs/CQDs was obtained as fluorescent nanoprobes.

2.8. The Optimized Amount of RGO_PDDA

For the electrostatic interaction, Van der Waals force, and π–π stacking interaction between RGO_PDDA and CQDs, the Anti-Lv-mAbs/CQDs will be attracted to the surfaces of RGO_PDDA. When the distance between the donor (Anti-Lv-mAbs/CQDs) and the acceptor (RGO_PDDA) is less than the Förster radius (<10 nm), effective FRET will occur, for RGO_PDDA is a broad-spectrum absorbing material. Because RGO_PDDA is also a nonfluorescent matter, the fluorescence of CQDs will be quenched via FRET. For a certain concentration of Anti-Lv-mAbs/CQDs, there is a best amount of RGO_PDDA for highest PL quenching. A total of 0.5 mL of Anti-Lv-mAbs/CQDs suspension was, respectively, mixed with 0.1 mL of RGO-PDDA PBS solutions with concentrations of 1.0, 2.0, 3.0, 4.0, 5.0, 6.0, 7.0, and 8.0 µg/mL, and the final volume was kept at 1 mL by addition of PBS; after slight shaking and incubation for 30 min at room temperature, the PL spectra were measured. The optimized amount of RGO-PDDA was determined by the highest PL quenching ratio.
The quenching efficiency was calculated using the following formula:
  Q R = I 0 I R I 0 ,
where QR is the PL quenching ratio, I0 the fluorescence intensity of Anti-Lv-mAbs/CQDs, and IR the fluorescence intensity after adding RGO_PDDA.

2.9. The Immunosensing for Vtg and Interferences

The optimized amount of RGO was added into the Anti-Lv-mAb/CQDs solution and fully dispersed. A total of 0.1 mL specific (Vtg) or nonspecific antigens (interferences) were added into the Anti-Lv-mAb/CQDs/RGO solution (0.6 mL), and the final volume was kept at 1 mL with PBS. After incubation for 15 min at room temperature, the PL spectra of the mixture was measured. To establish the standard testing curve, different concentrations of standard Vtg solutions (0–15,000 ng/mL) were tested separately, and each experiment was repeated three times.
The PL regaining ratio was calculated using the following formula:
  R R = I V I R 0 I 0 I R 0 ,
where RR is the PL regaining ratio, IR0 is the fluorescence intensity of Anti-Lv-mAb/CQDs/RGO (Anti-Lv-mAb/CQDs with the optimized amount of RGO_PDDA), and IV is the fluorescence intensity of Anti-Lv-mAb/CQDs/RGO after addition of Vtg.

3. Results and Discussion

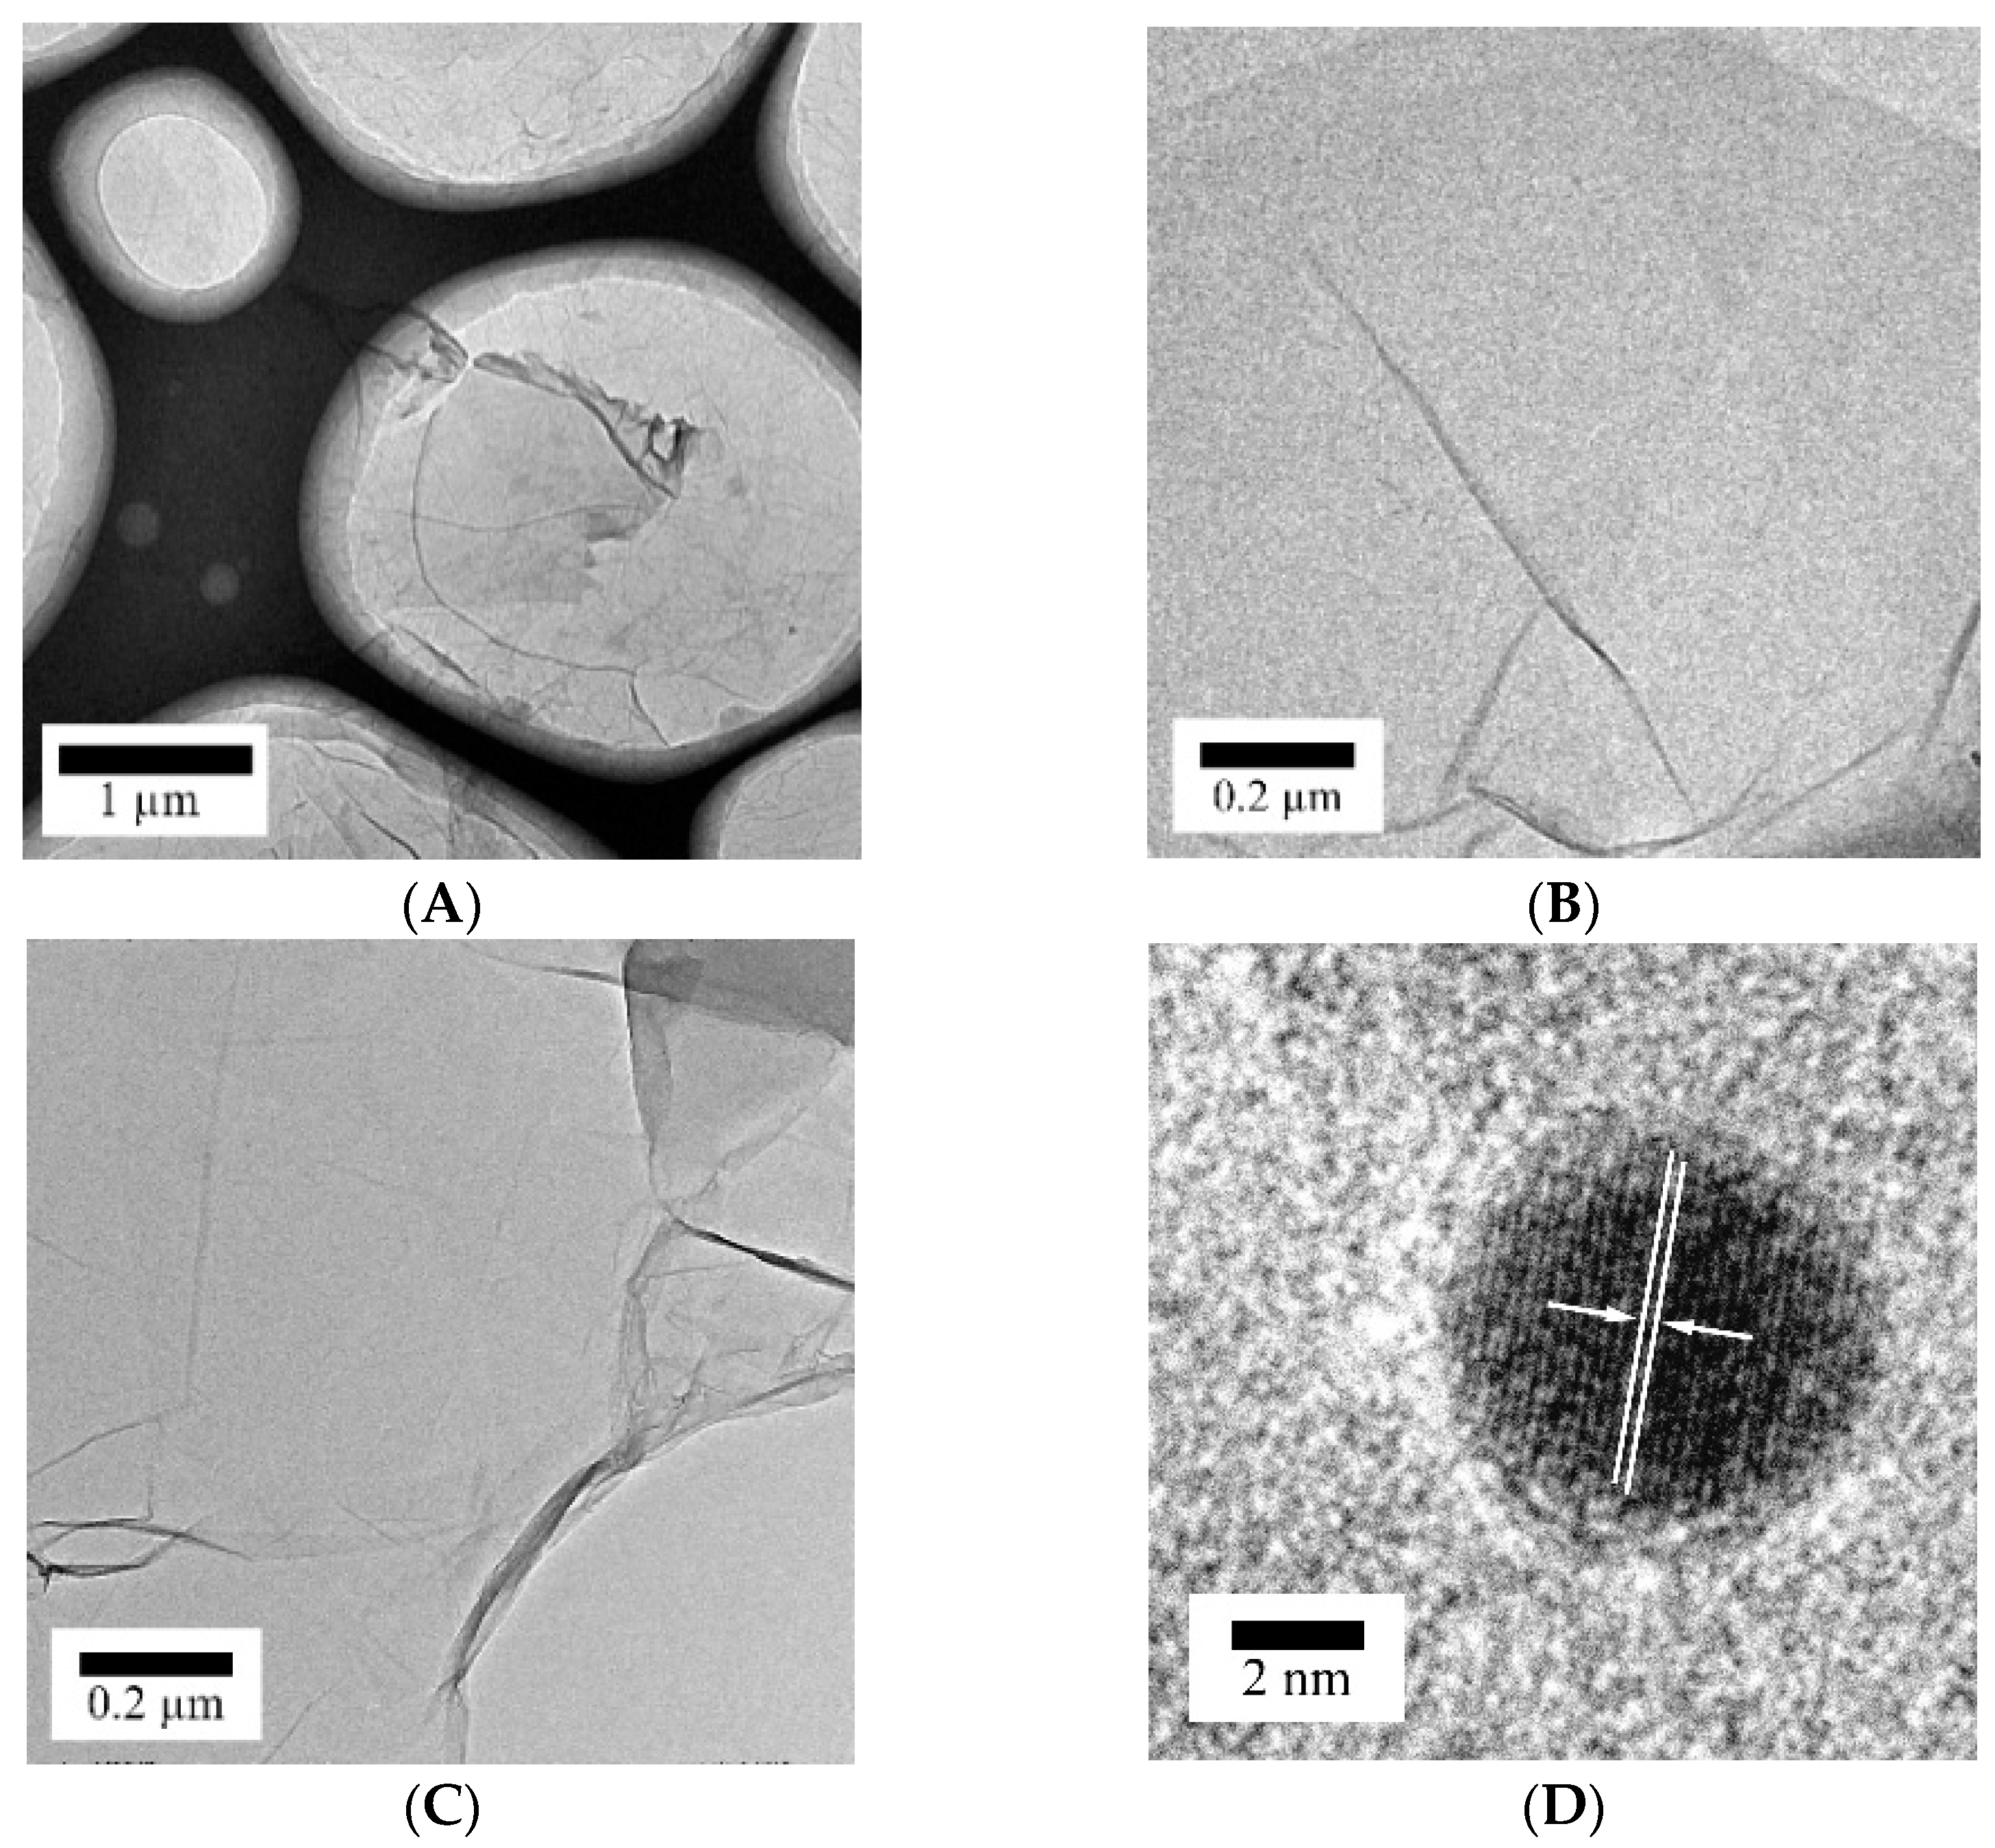
3.1. Morphology and Structure of the GO, RGO, RGO_PDDA, and CQDs

From Figure 1A, it can be clearly seen that GO nanosheets were dispersed in an aqueous solution in a lamellar structure after the reduction reaction of GO. RGO shows a transparent thin sheet in Figure 1B, indicating that its thickness is very small and electron beam could easily penetrate the RGO sheets. The size of RGO is within 0.5–8 μm and the RGO nanosheets disperse well in aqueous solution. The PDDA-modified RGO was also a thin sheet with the same size, indicating that modification of PDDA did not change its structure. The high-resolution transmission electron microscopy (HRTEM) result indicated that the CQDs (Figure 1D) are nanosheets, exhibiting clear lattice fringe with 0.21 nm lattice spacing, similar to the report prepared by different methods. This may reflect the (100) facet of graphite [35]. The size distribution of the CQDs is in the range of 1–7 nm; the average size is 3.5 nm [35].

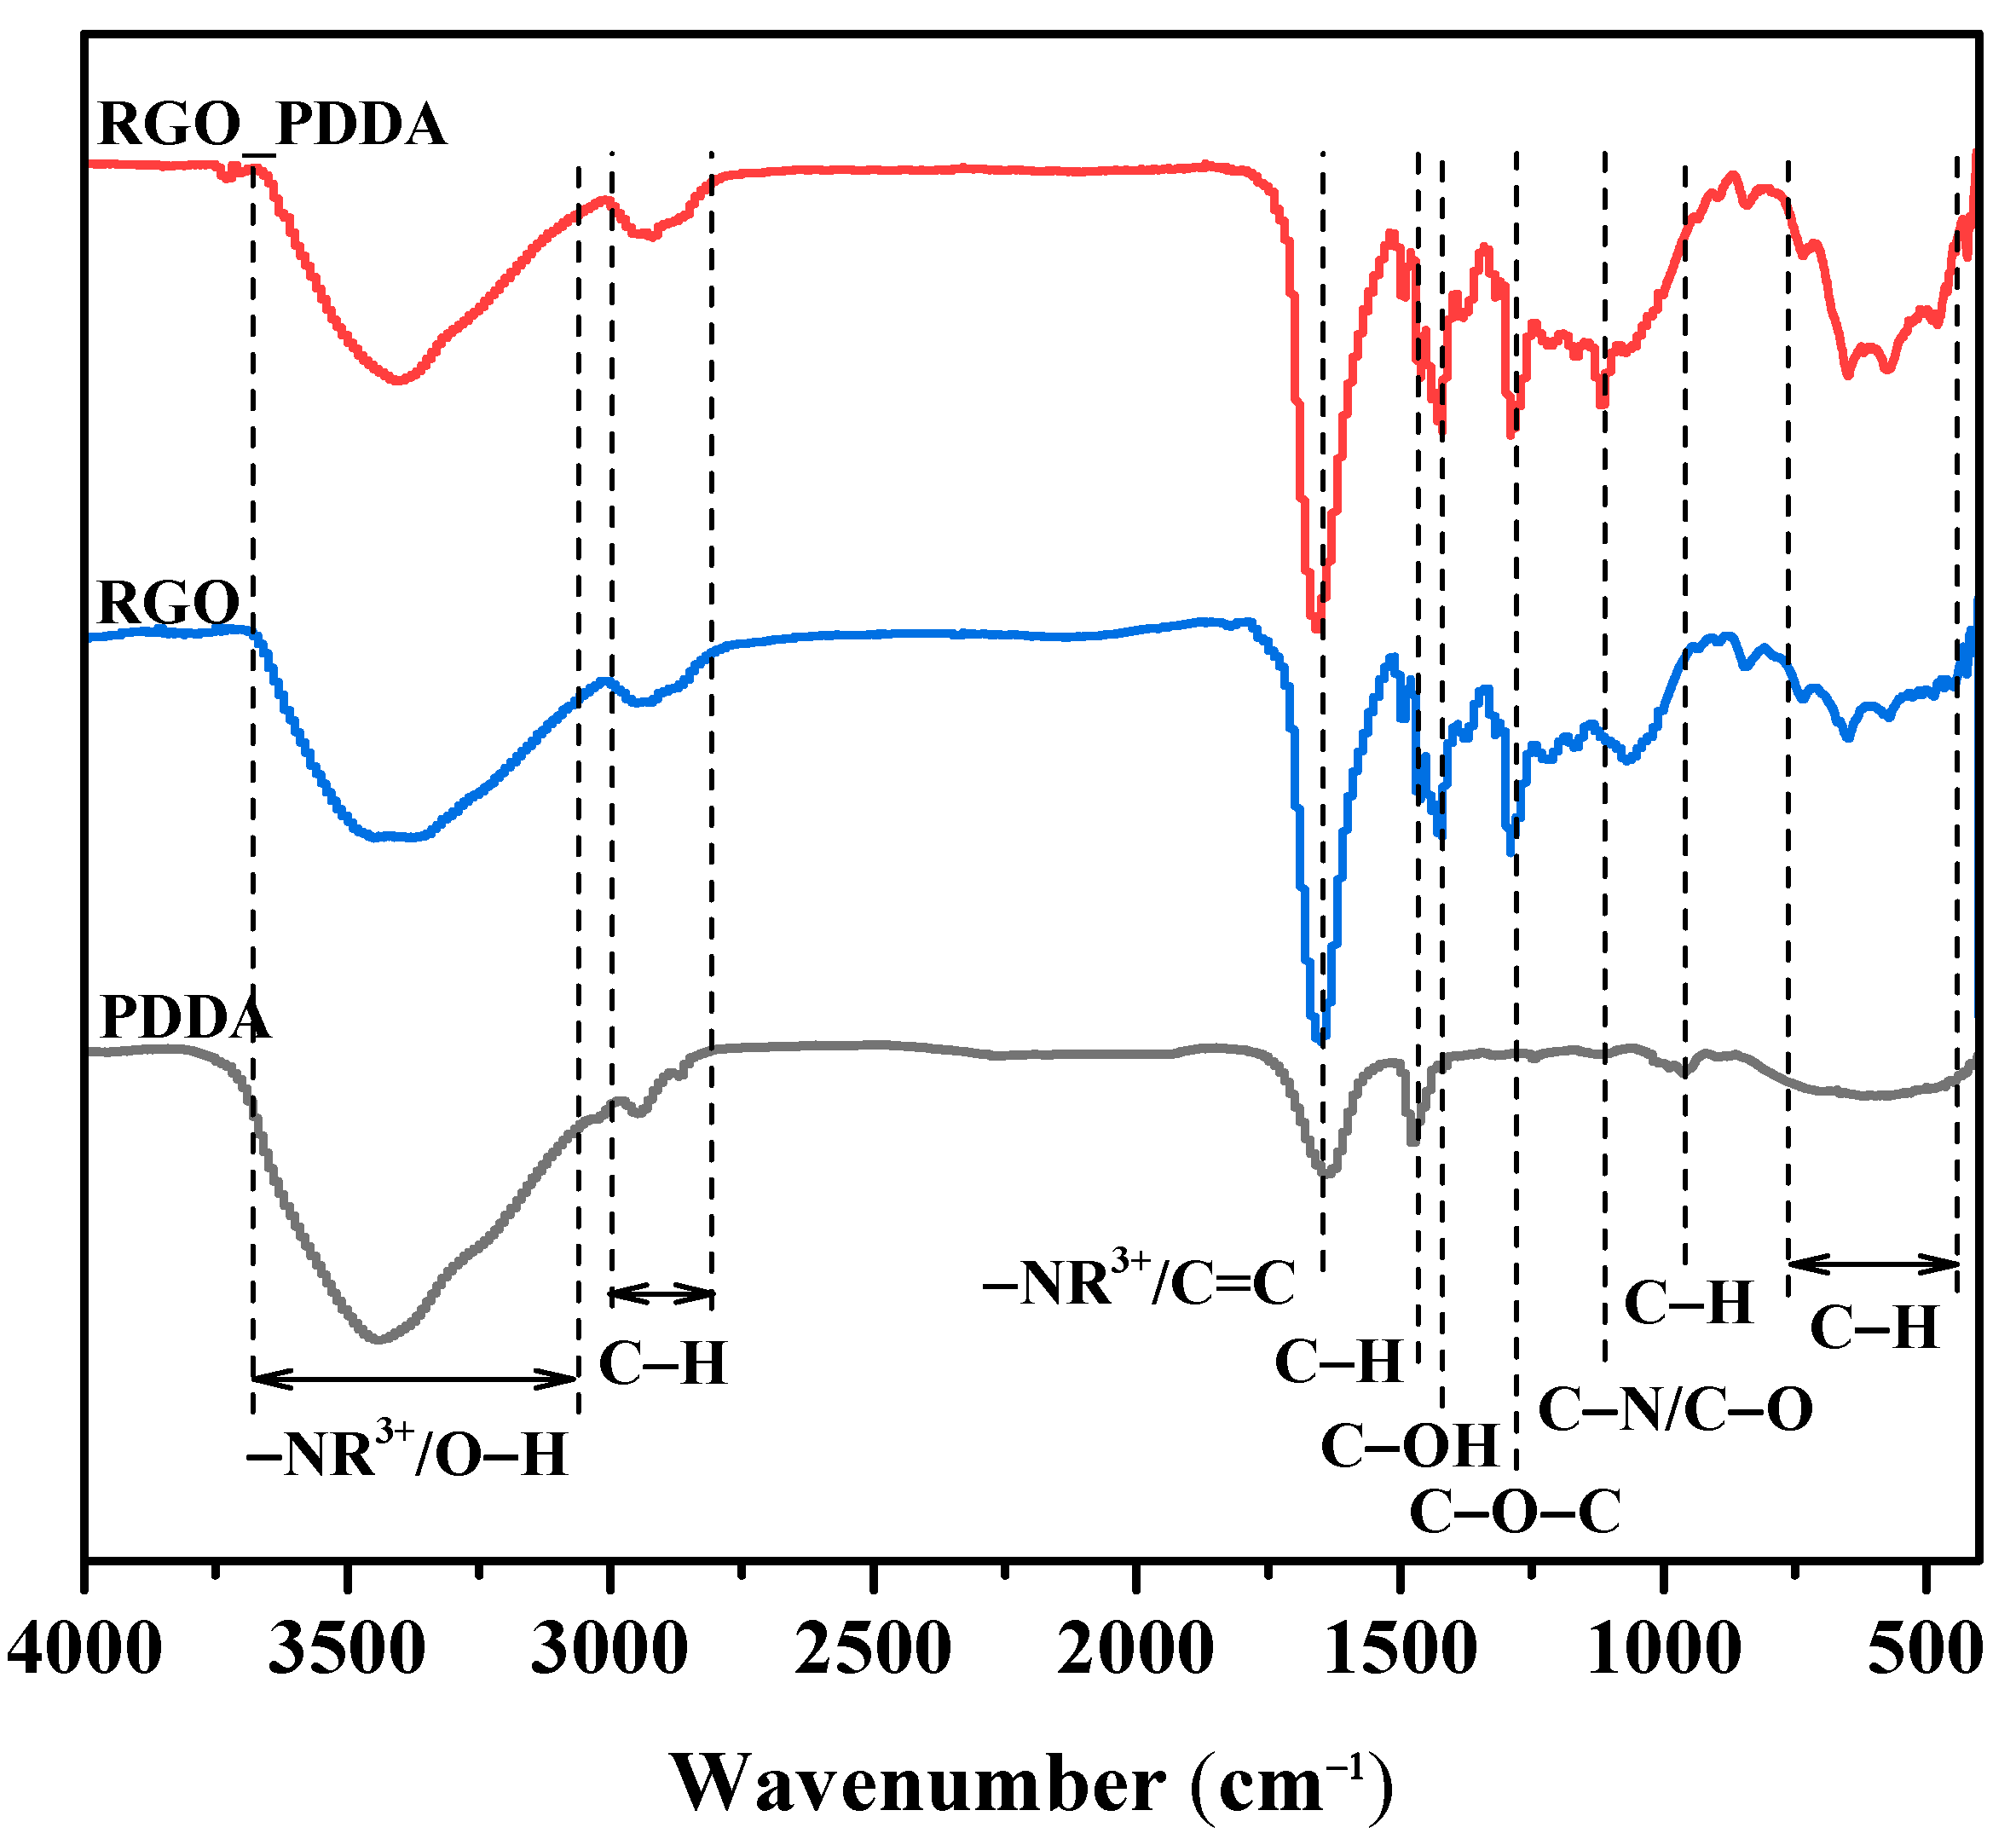
3.2. FTIR Spectra of the RGO and RGO_PDDA

FTIR spectroscopy was used to identify the functional groups before and after modification of RGO. Figure 2 presented the FTIR spectra for RGO, PDDA, and RGO_PDDA. The FTIR spectrum of PDDA exhibited typical bands at 3447, 2932, 2867, 1640, 1471, 1100, 965, and 610 cm−1. The band at 3447 cm−1 is due to –NR3+ stretching vibration or the hydroxyl group [39,40]. The bands at 2932, 2867, 1471, 965, and 610 cm−1 are attributed to the C–H group [40,41]. The bands at 1640 cm−1 and 1100 cm−1 correspond to the deformation vibration of –NR3+ and C–N stretching vibration, respectively [40,42,43]. The FTIR spectra of RGO and RGO_PDDA showed peaks at 3400, 1650, 1471, 1430, 1280, and 1120 cm−1, corresponding to the OH group, the stretching of C=C, C–H, C–OH, C–O–C, and C–O groups, respectively [44,45,46,47,48]. Compared to the FTIR spectrum of pristine RGO, the FTIR spectrum of RGO_PDDA displayed the intensification of bands at 1650, 1120, and 610 cm−1. These bands are related to the –NR3+, C–N, and C–H groups of the PDDA. Therefore, the PDDA has been successfully incorporated with RGO.

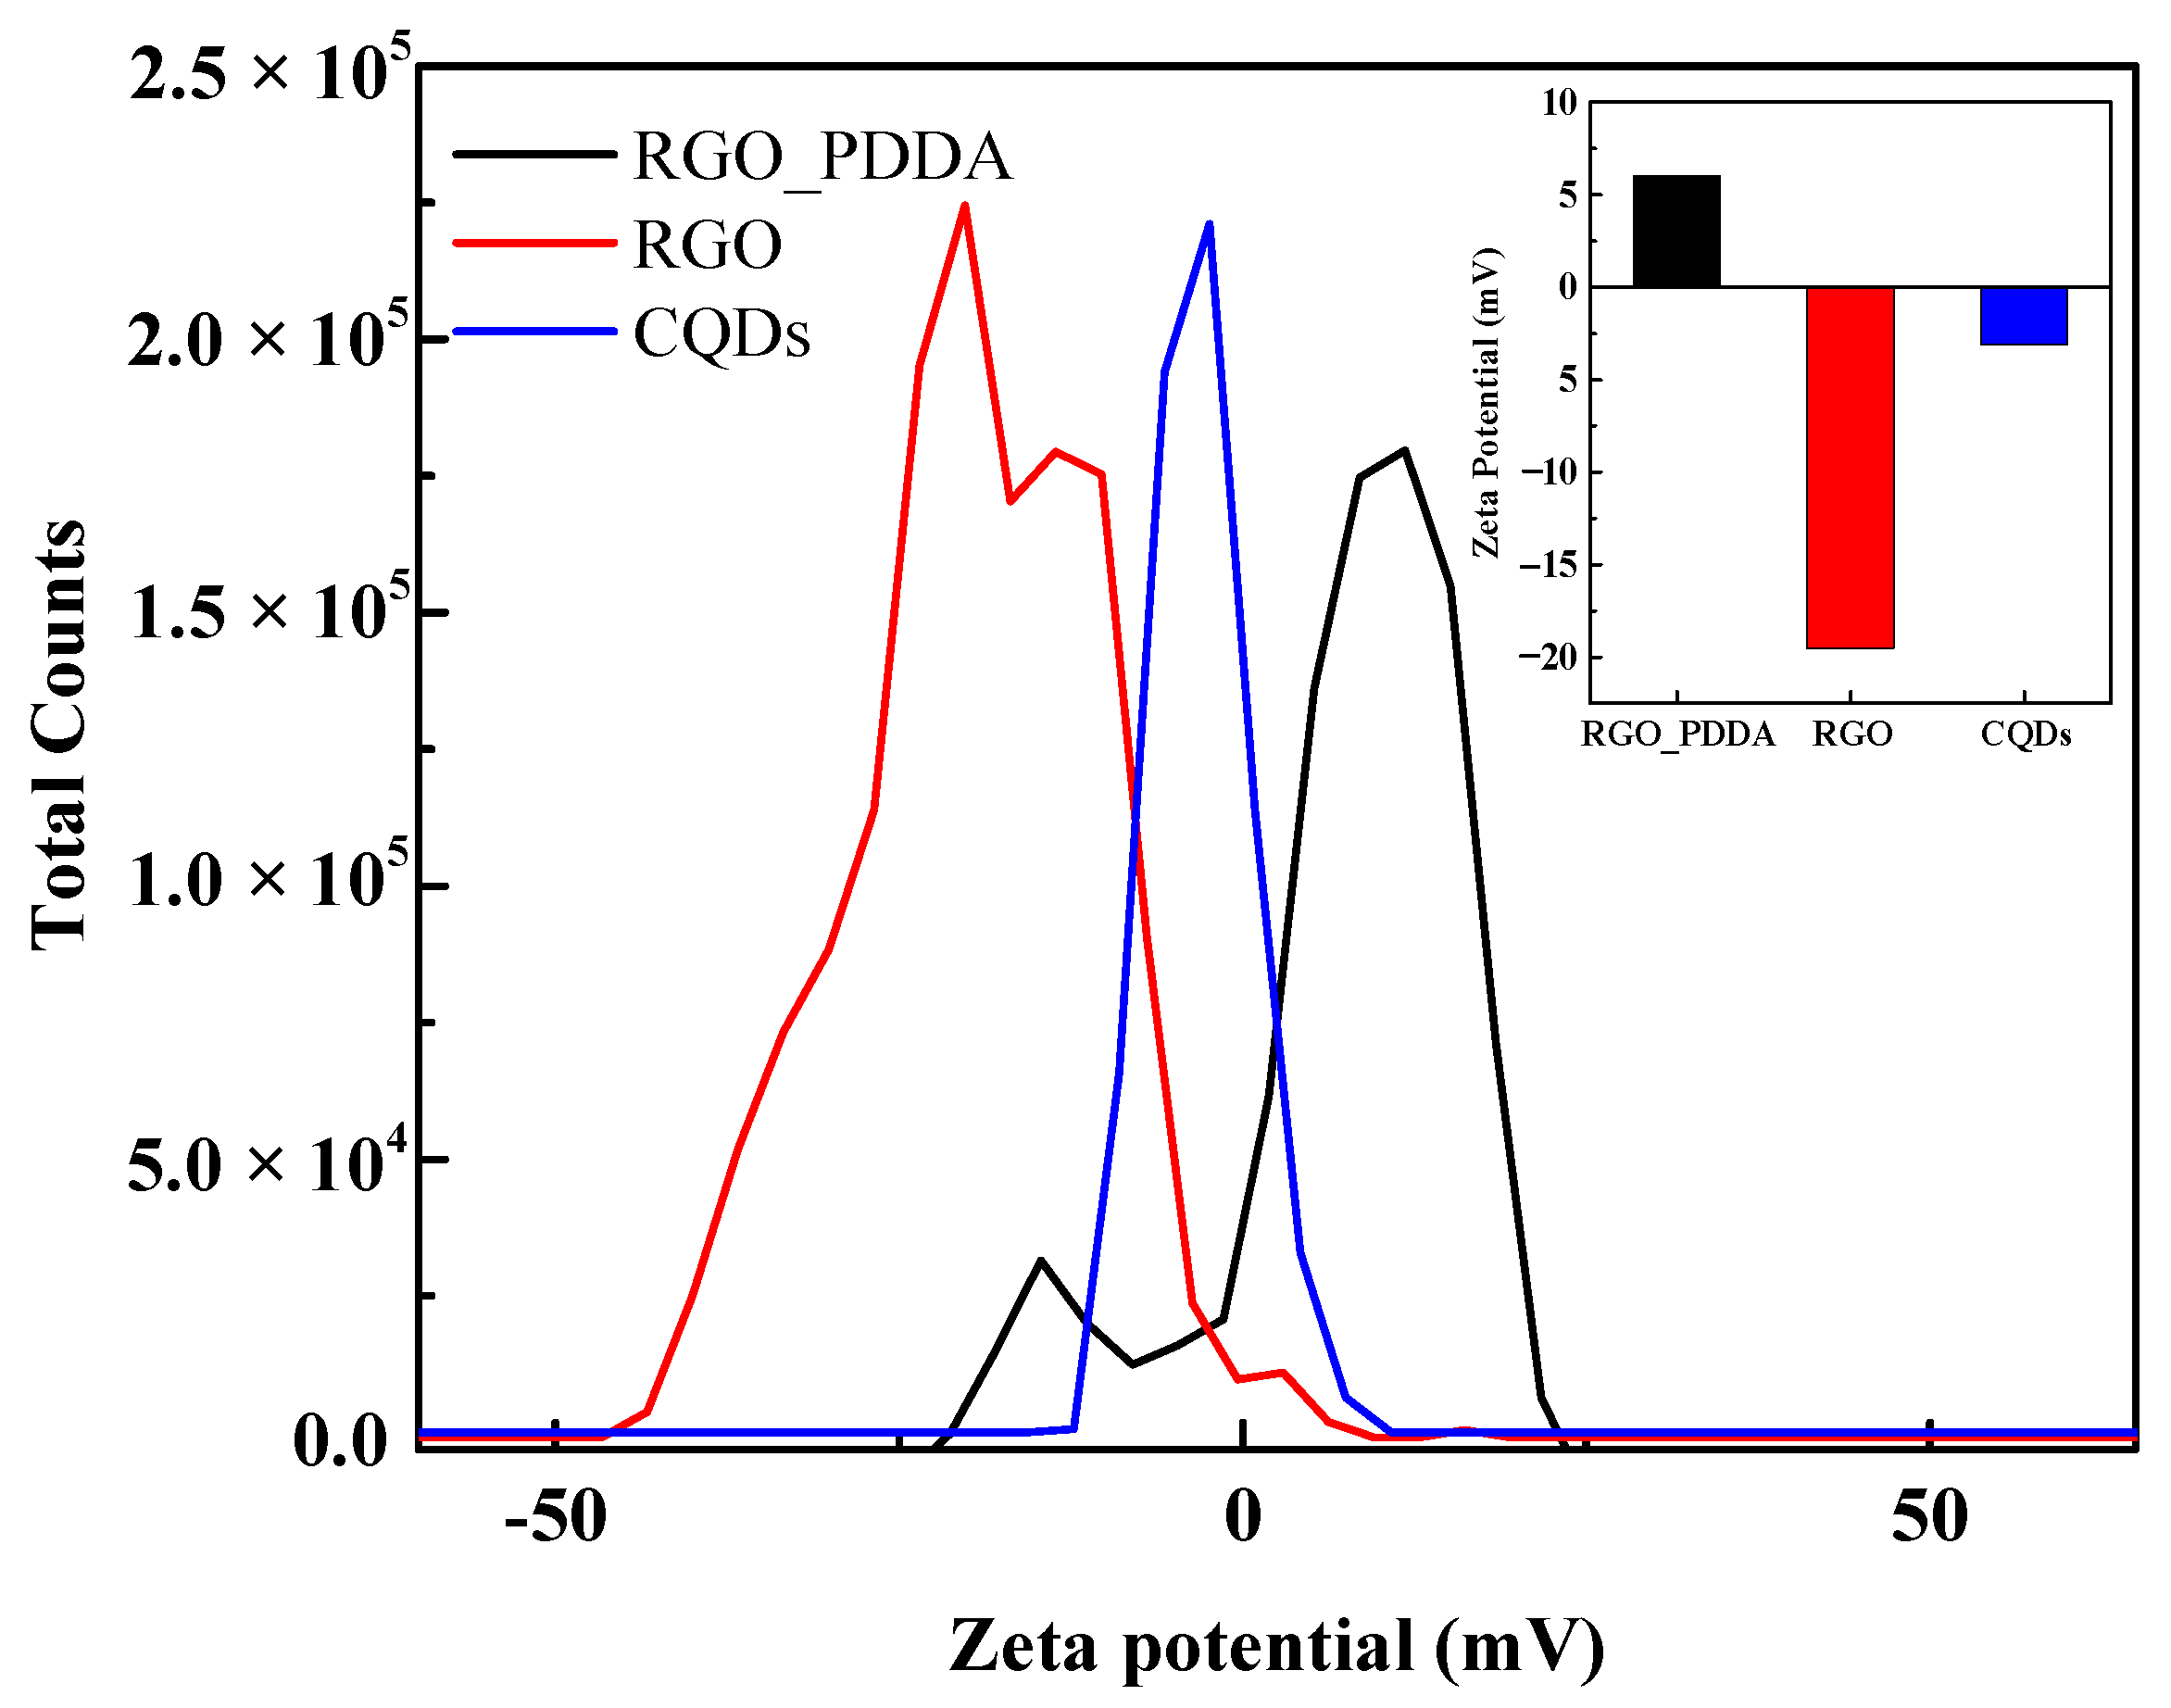
3.3. Zeta Potentials of RGO, RGO_PDDA, and CQDs

After being modified with PDDA, the surface charge of RGO changed from negative (−23 mV, Figure 3, red line) to positive (+13 mV, Figure 3, black line), indicating that the RGO and RGO_PDDA have negative and positive surface charges, respectively. The zeta potential of CQDs is −3.5 mV (Figure 3, blue line), implying the presence of negative charge in the surface CQDs. Therefore, the electrostatic interaction between RGO and CQDs is repulsion; however, that between RGO_PDDA and CQDs is attraction. The above results show that modification of RGO with PDDA is a benefit of the attachment of RGO_PDDA to CQDs, thus enhancing the efficiency of the fluorescence quenching.

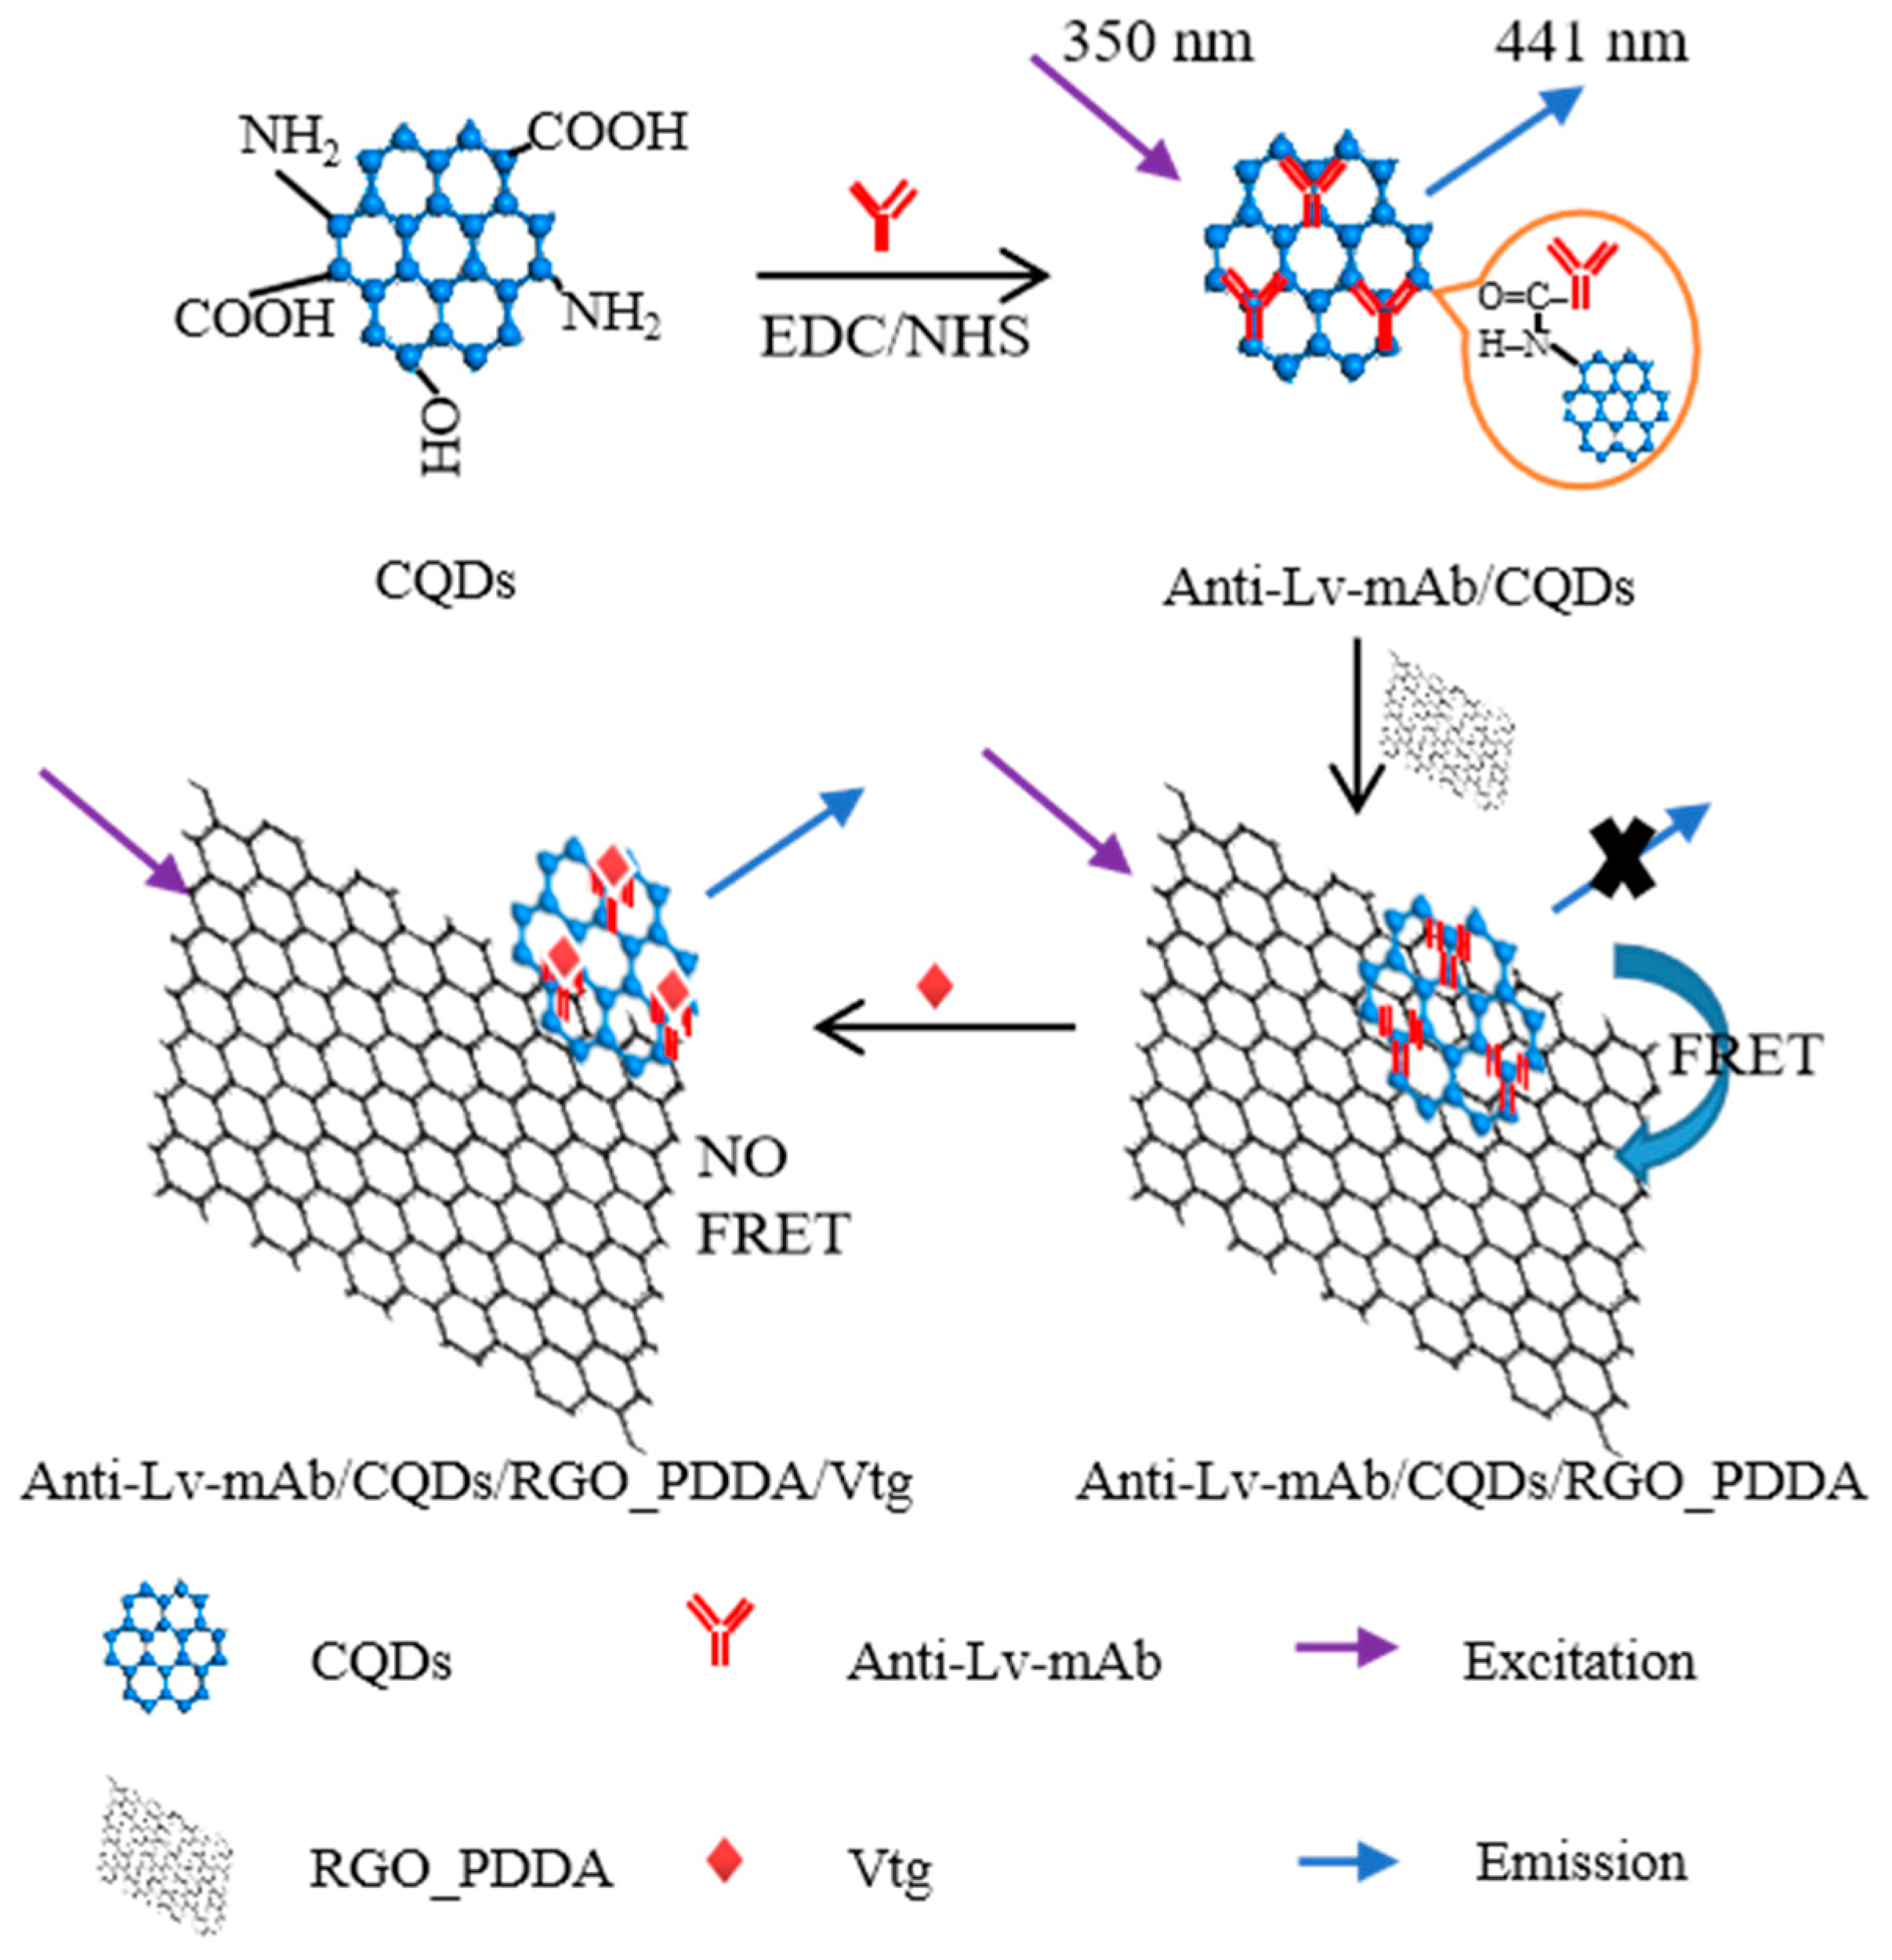
3.4. FRET between RGO, RGO_PDDA, and CQDs

Figure S2 shows the fluorescence quenching of CQDs aqueous solution caused by RGO and RGO_PDDA. The fluorescence of CQDs solution decreased with the increase in RGO and RGO_PDDA; at the same concentration, RGO_PDDA could reduce the fluorescence intensity of CQDs aqueous solution more than that of RGO; at the concentration of 40 µg/mL RGO, the fluorescence intensity of CQDs aqueous solution decreased only by 30%, while the same concentration of RGO_PDDA caused the fluorescent intensity of CQDs to decrease by 80%. The main reason is both that RGO and CQDs possess negative Zeta potentials (−23 mV and −3.5 mV, respectively), indicating negative surface charge; however, RGO_PDDA shows positive Zeta potential (+13 mV), having positive surface charge; thus, there is strong electrostatic attraction force between RGO_PDDA and CQDs, which is a benefit of decreasing the distance between CQDs and RGO_PDDA, thus effectively improved the FRET efficiency between RGO_PDDA and CQDs.

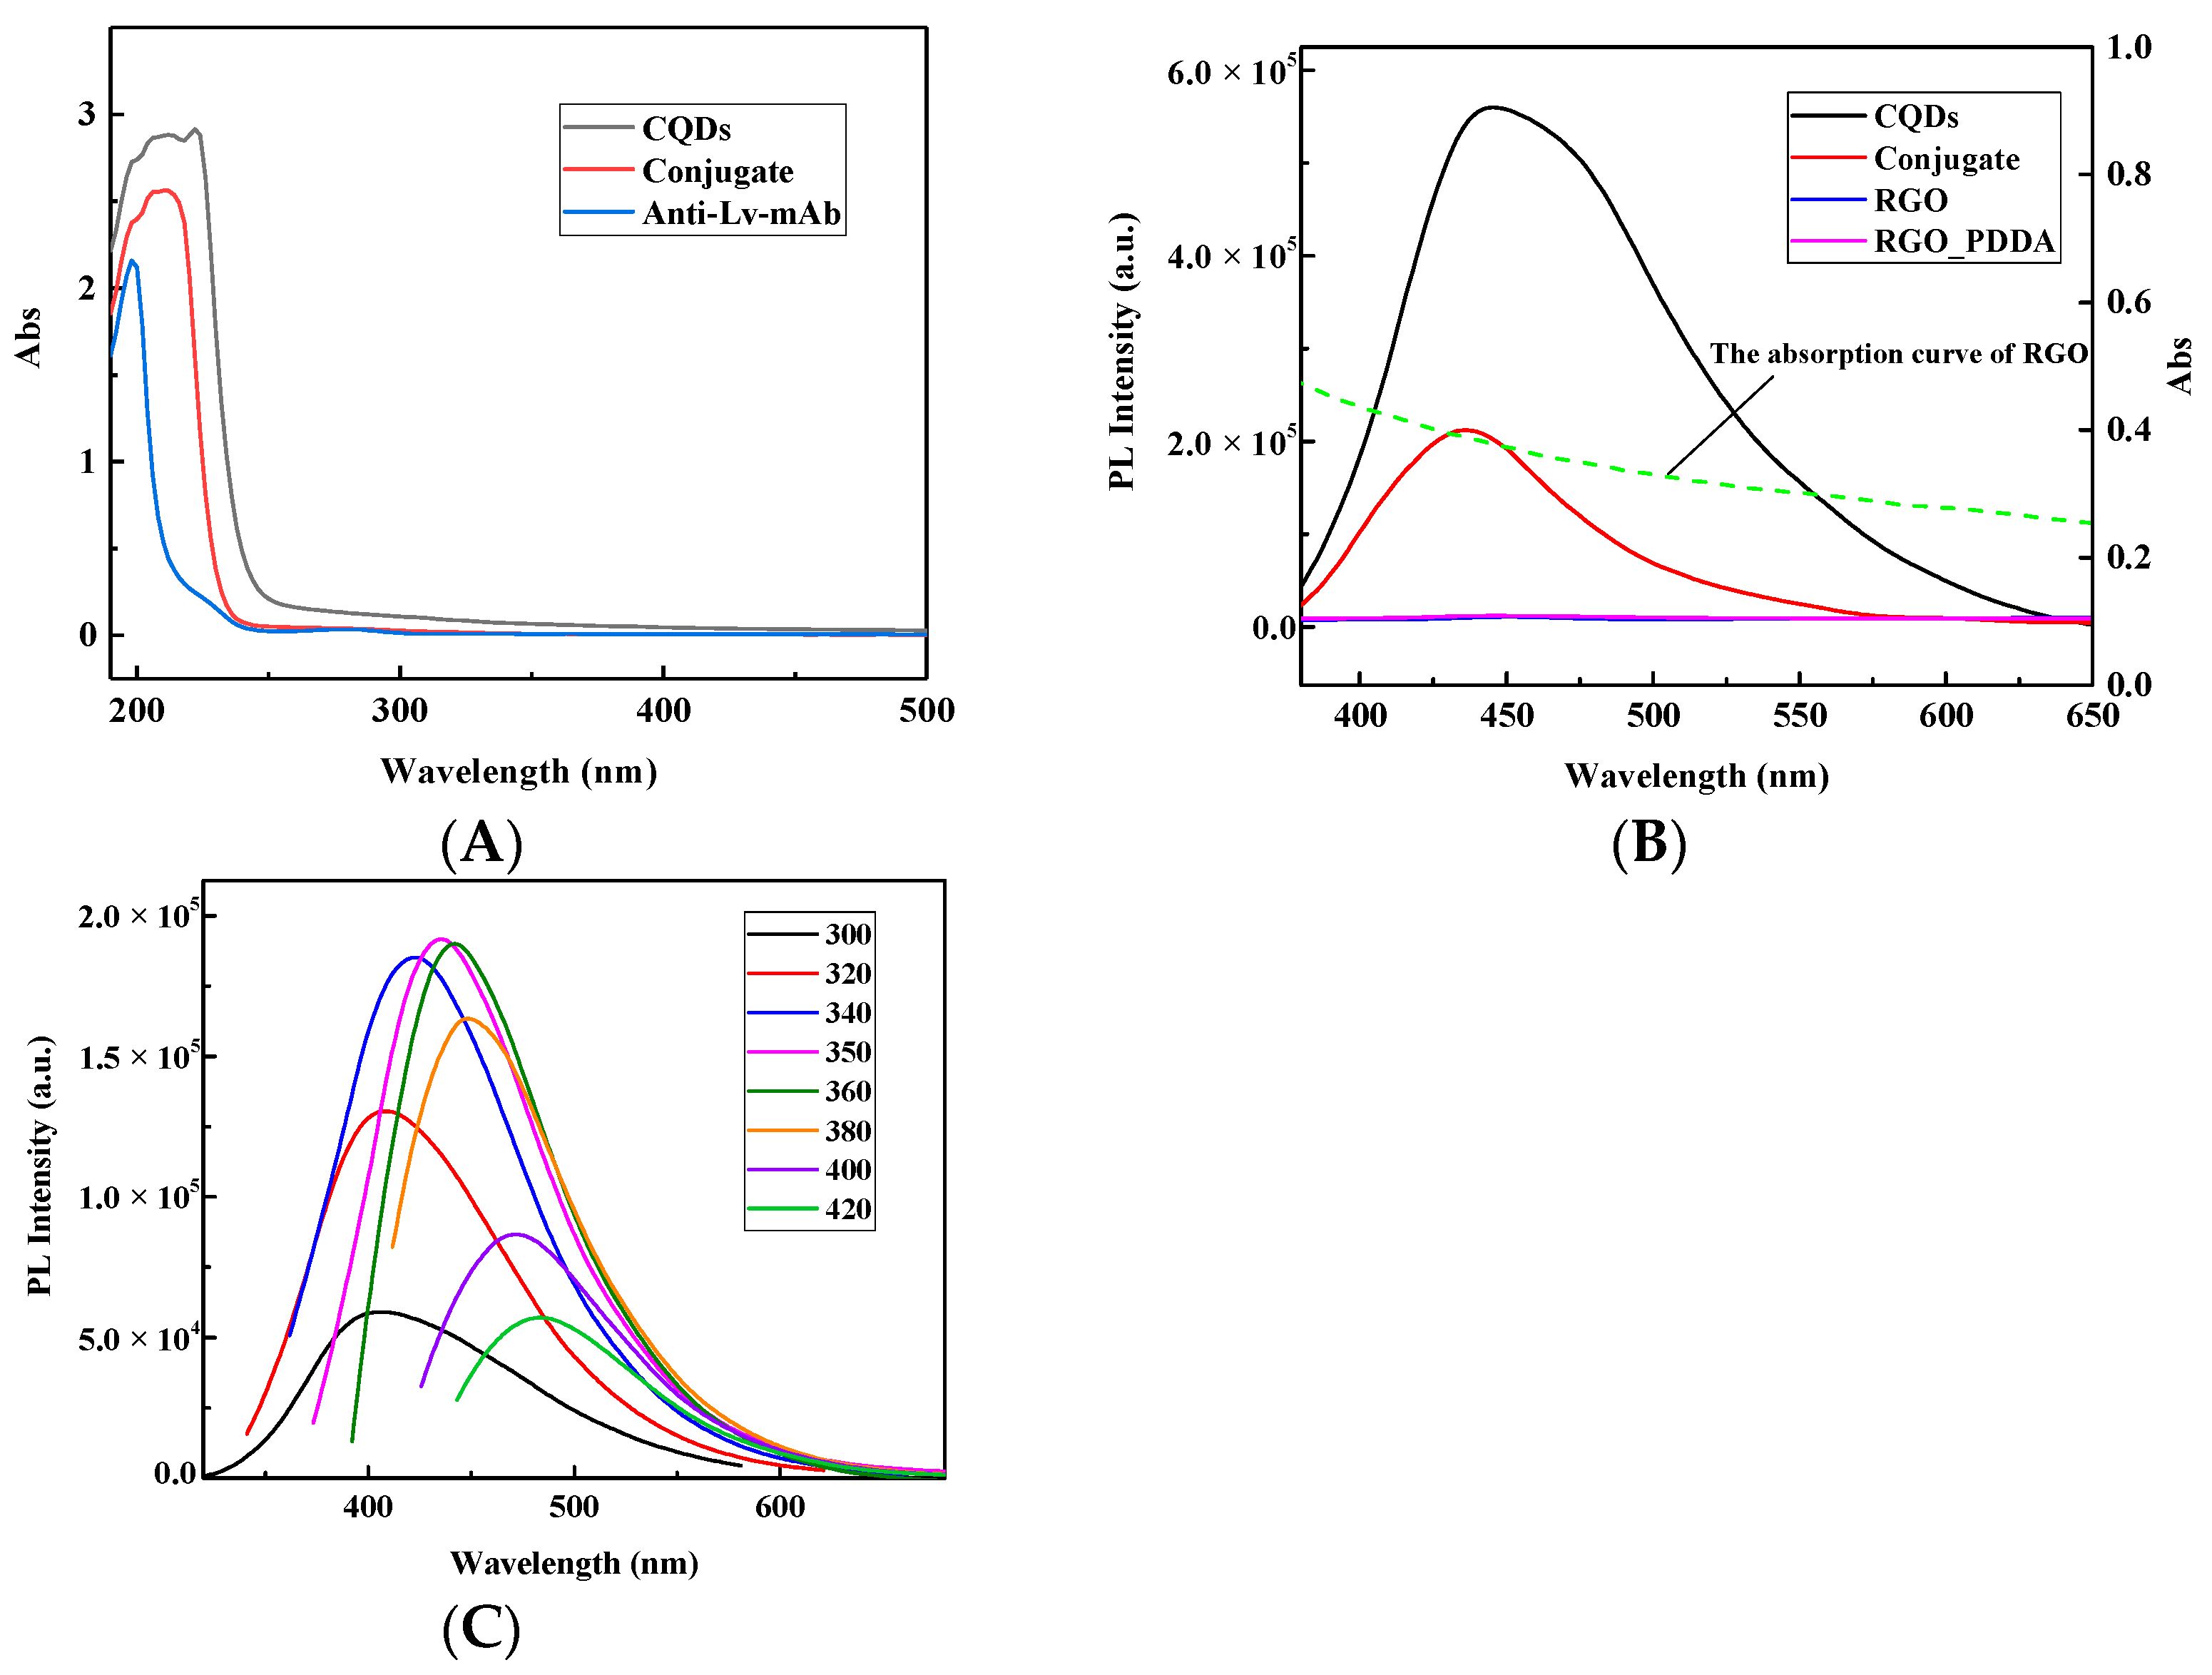
3.5. Optical Properties of CQDs and Anti-Lv-mAb/CQDs

The UV-Vis absorption spectra of Anti-Lv-mAb, CQDs, and conjugate (Anti-Lv-mAb/CQDs) were illustrated in Figure 4. CQDs indicates a strong absorption at 230 nm, corresponding to the π→π* transition of the aromatic group; the Anti-Lv-mAb presents an absorption peak at 200 nm; the absorption peak of the conjugate is at 210 nm, positioned between 230 nm and 200 nm, and the intensity of the conjugate is higher than that of Anti-Lv-mAb and lower than that of the CQDs. We guessed the Anti-Lv-mAb was conjugated with CQDs successfully. The PL spectra of CQDs, conjugate, RGO, and RGO_PDDA were shown in Figure 4B. Compared to CQDs, the PL intensity of the conjugate decreased greatly, and the peak position of the conjugate, which is blue, moved to 436 nm (see Figure 4B) after CQDs coupled with Anti-Lv-mAb, which attributes to –NH2 in CQDs reacted with –COOH in Anti-Lv-mAb to form –CONHR; partial defect state emission of CQDs changed into intrinsic state emission [49]. The above results indicated that Anti-Lv-mAb and CQDs were successfully conjugated. Under neutral conditions, the PL spectra of the conjugate are excitation-dependent within 320–420 nm (Figure 4C); the maximum PL was obtained under excitation at 350 nm, which was determined as the exciting wavelength for the below experiments.

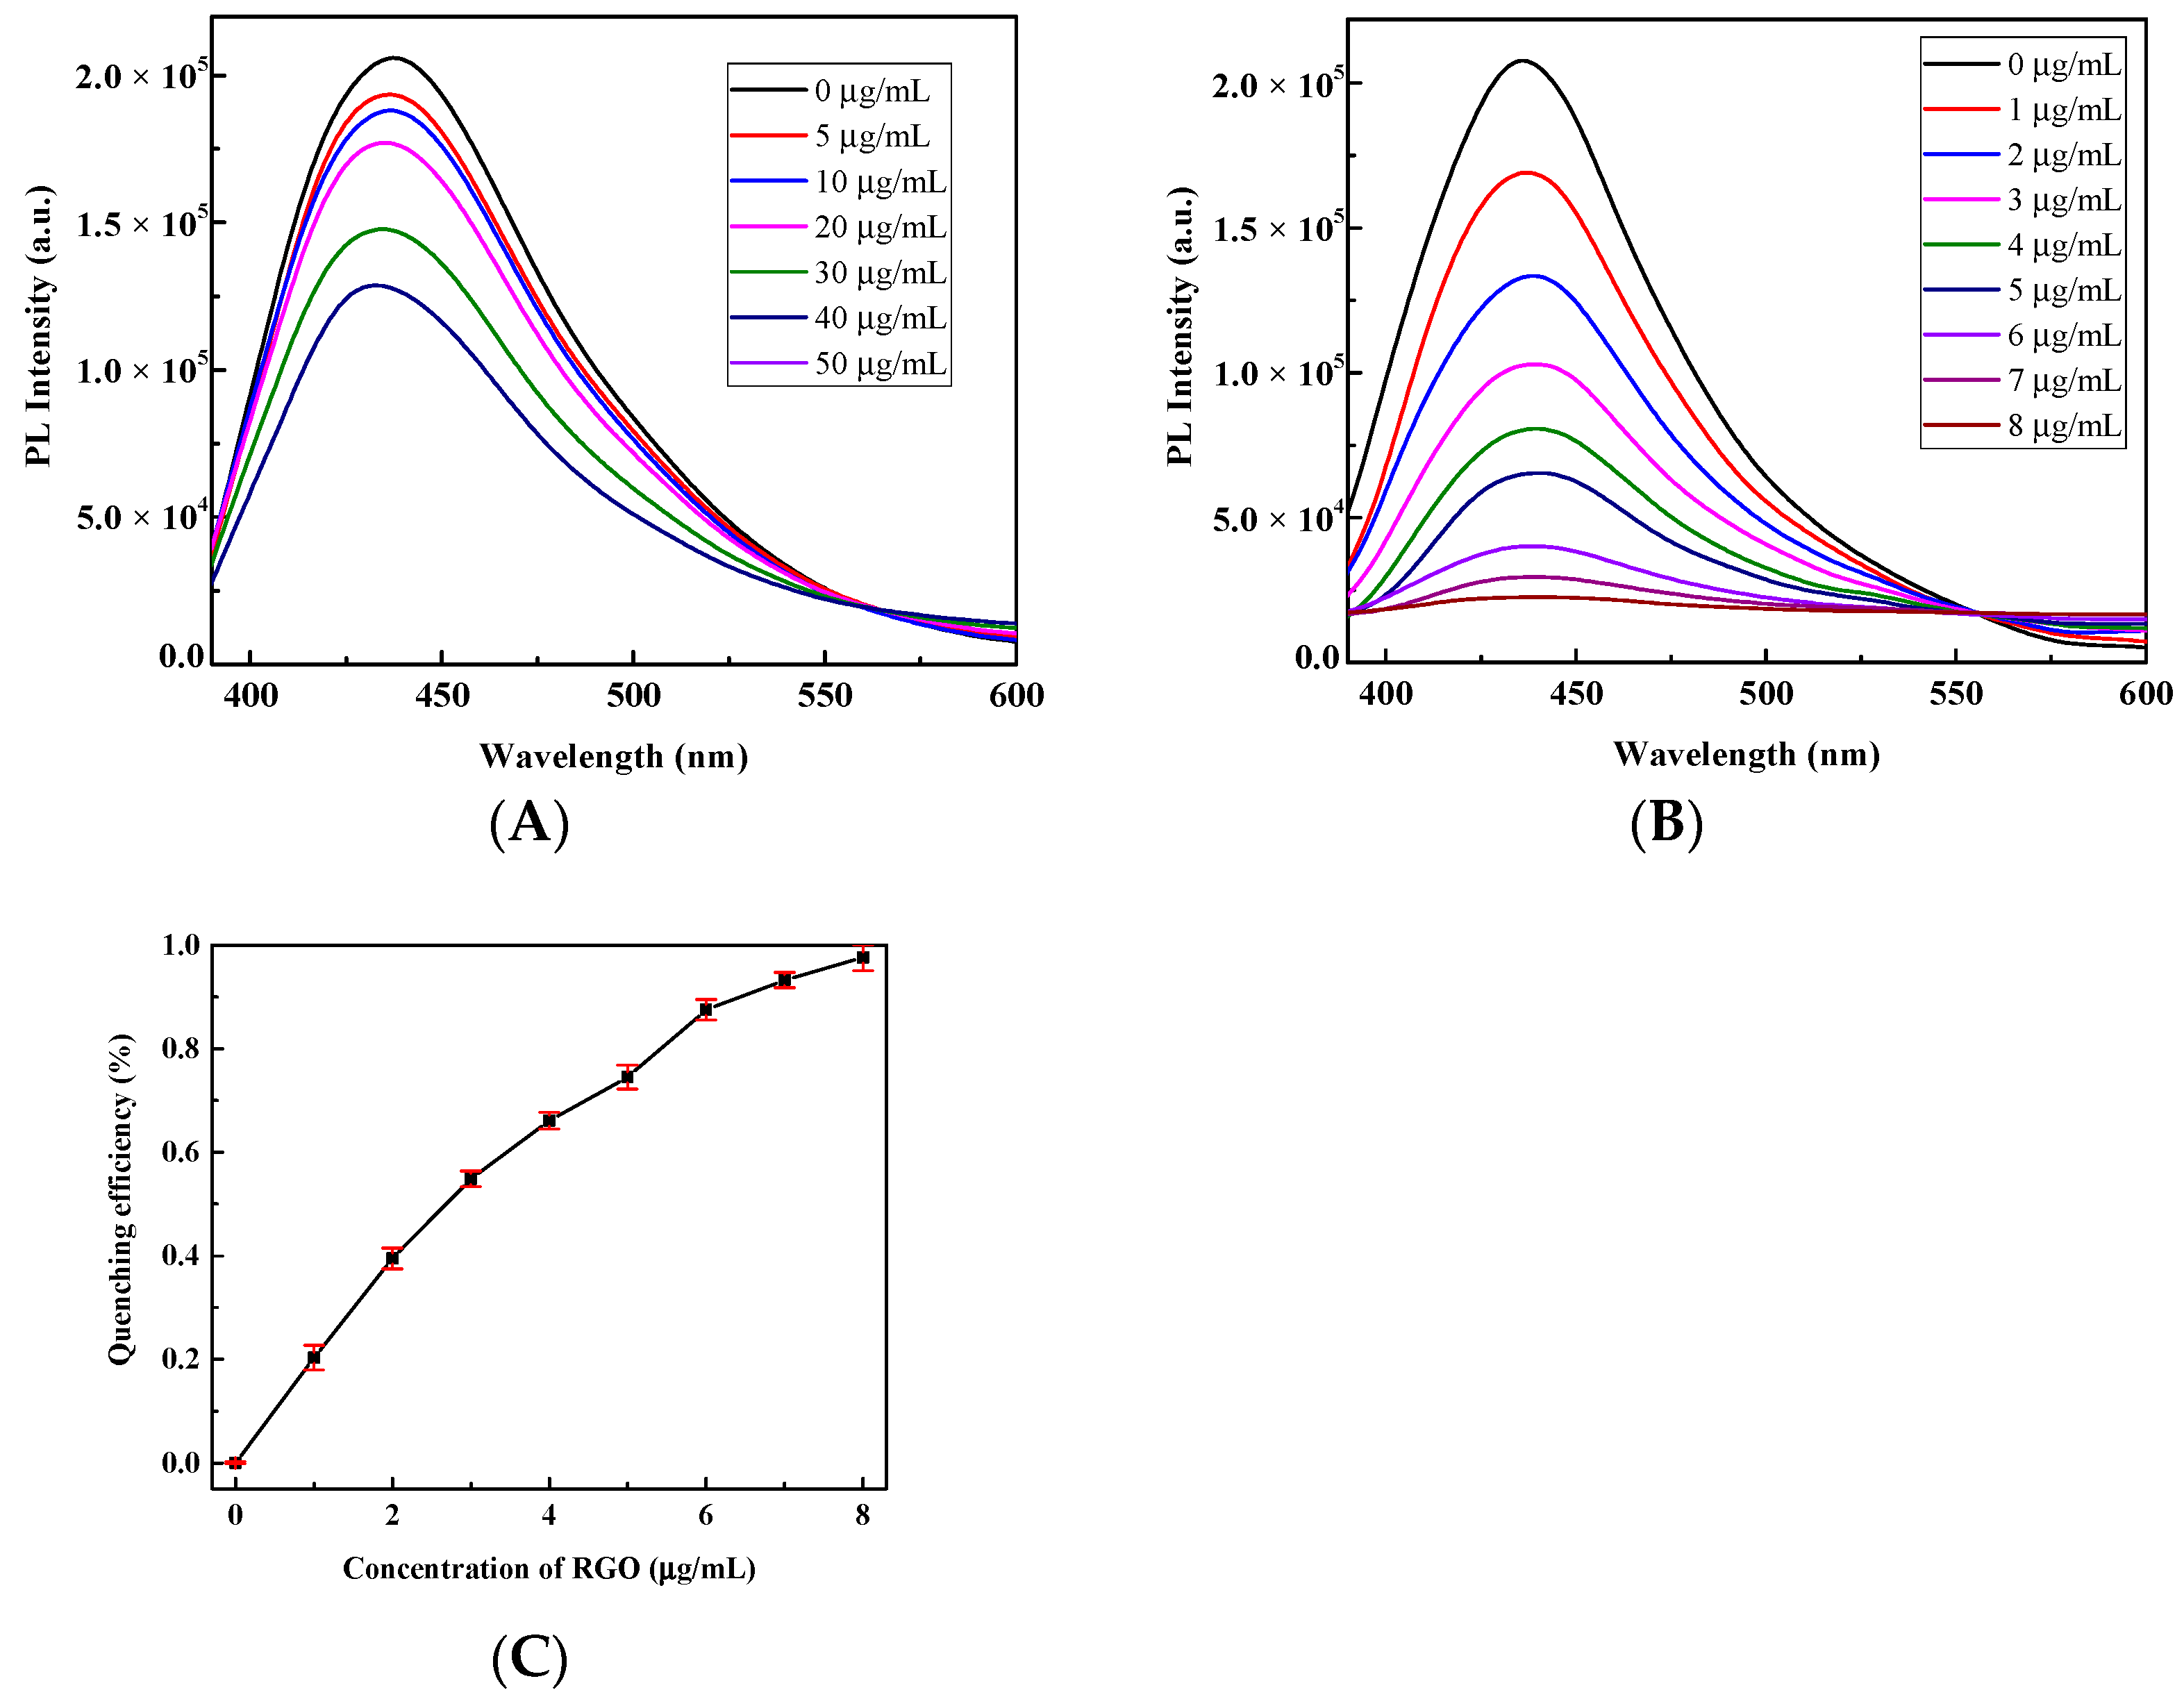
3.6. PL Quenching (“OFF”) between RGO, RGO_PDDA, and Anti-Lv-mAb/CQDs

Upon addition of RGO into the conjugate (Anti-Lv-mAb/CQDs), FRET could be observed for energy nonradioactively transferred from the conjugate to RGO. The PL quenching depends on the concentrations of RGO (Figure 5A). Our experimental results indicate that the FRET efficiency between conjugate and RGO is not good. Within 5–40 µg/mL concentrations of RGO, the fluorescent quenching ratios increase with the concentrations of the RGO; however, the highest quenching efficiency is only 40%; thus, the FRET efficiency between RGO and CQDs is very low. The main reason is that the electrostatic interaction between RGO and CQDs is very weak for both with negative surface charges; the static-electronic repulse force between the two hindered CQDs from attracting RGO. After PDDA modification, the Zeta potential of RGO_PDDA became positive, indicating positive surface charge, which is a benefit of the electrostatic attraction between RGO_PDDA and CQDs; thus, FRET efficiency can be significantly improved. The experimental result proved this analysis (Figure 5B). When the concentration of RGO_PDDA is 8.0 µg/mL, the quenching efficiency is almost 1 (Figure 5C), which means the entire PL from the conjugate was completely quenched by RGO_PDDA, and the modification of RGO with PDDA is a benefit of the FRET between CQDs and RGO; thus, 8.0 µg/mL RGO_PDDA was selected as the best amount for Vtg detection.

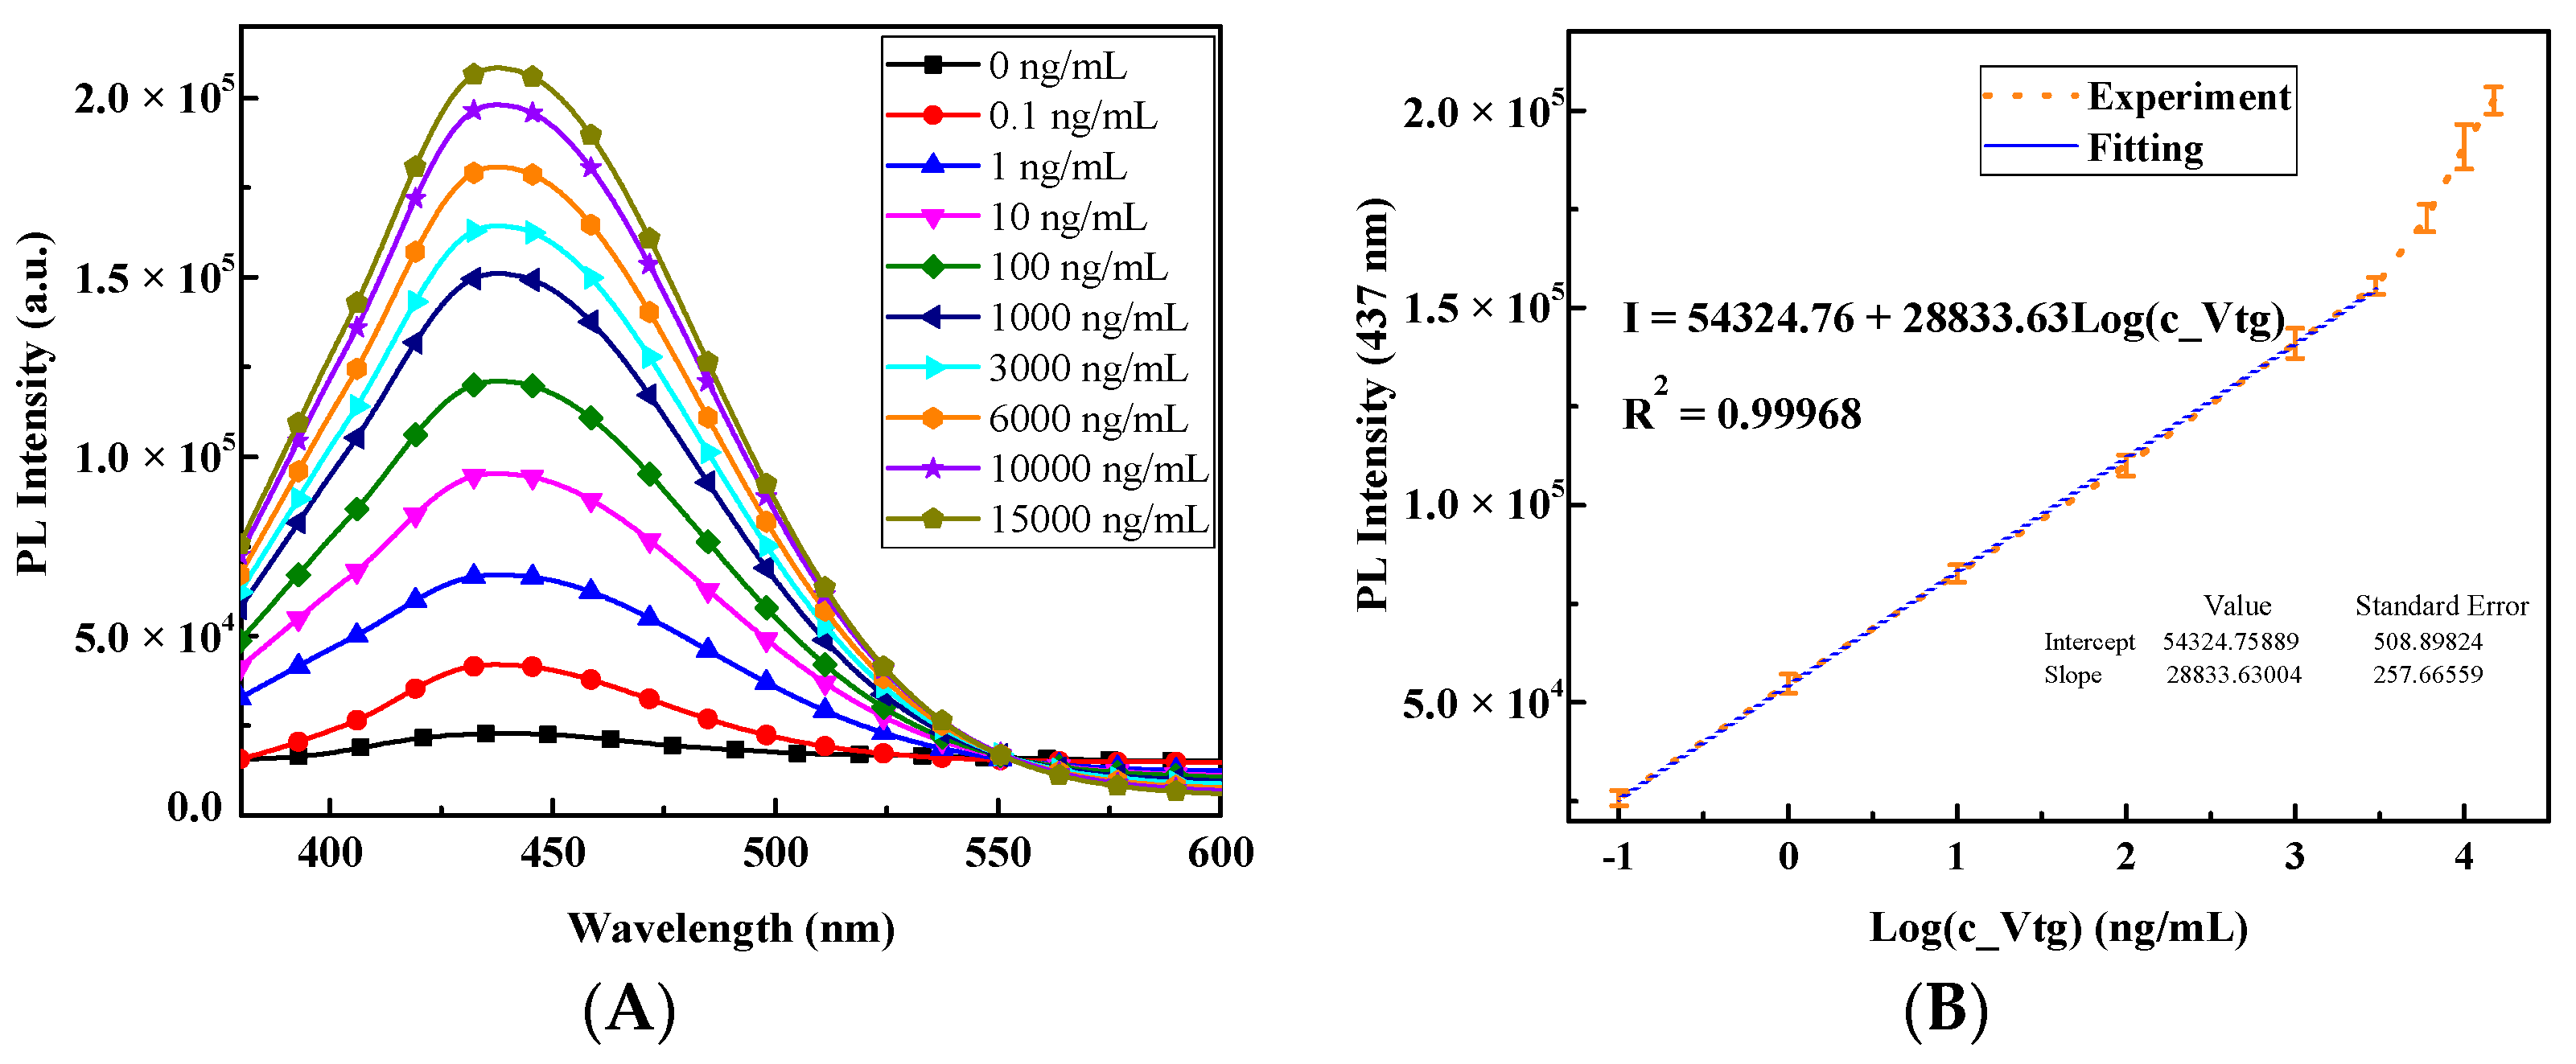
3.7. PL Regaining (“ON”) for Detection of Vtg

After Vtg was added into the Anti-Lv-mAb/CQDs/RGO_PDDA (conjugate/RGO_PDDA) solution, a strong specific binding effect between Vtg (antigen) and Anti-Lv-mAb (antibody) caused RGO_PDDA to detach from the complex of conjugate/RGO_PDDA, which resulted in PL recovery of the conjugate (Figure 6A). The PL recovery tends to be 100% with the increase in Vtg. The relationship between PL intensity (I) and logarithm of Vtg concentration (log c Vtg) is shown in Figure 6B. The results show that there is a good linear relationship in the range of 0.1–3000 ng/mL, which can be written as I = 54,324.76 + 28,833.63log(c_Vtg) with regression coefficient (R2) of 0.9997. The LOD for Vtg was found to be 0.04 ng/mL (S/N = 4), and the sensitivity is 28,833.63 CPS/(ng/mL). The linear detection range and sensitivity of the FRET immunosensor based on CQDs and RGO_PDDA for Vtg test in this work are all higher than the immunosensor based on the FRET between GQDs and RGO for Lv sensing [29]. Table 1 shows some recent immunosensing methods for Vtg/Lv detection, indicating that the PL “ON-OFF” technique in this work has a wide linear detection range, almost the lowest LOD, and high sensitivity. The PL “ON-OFF” immunosensor of our work has a very fast detection speed (15 min), which is lower than reported earlier.

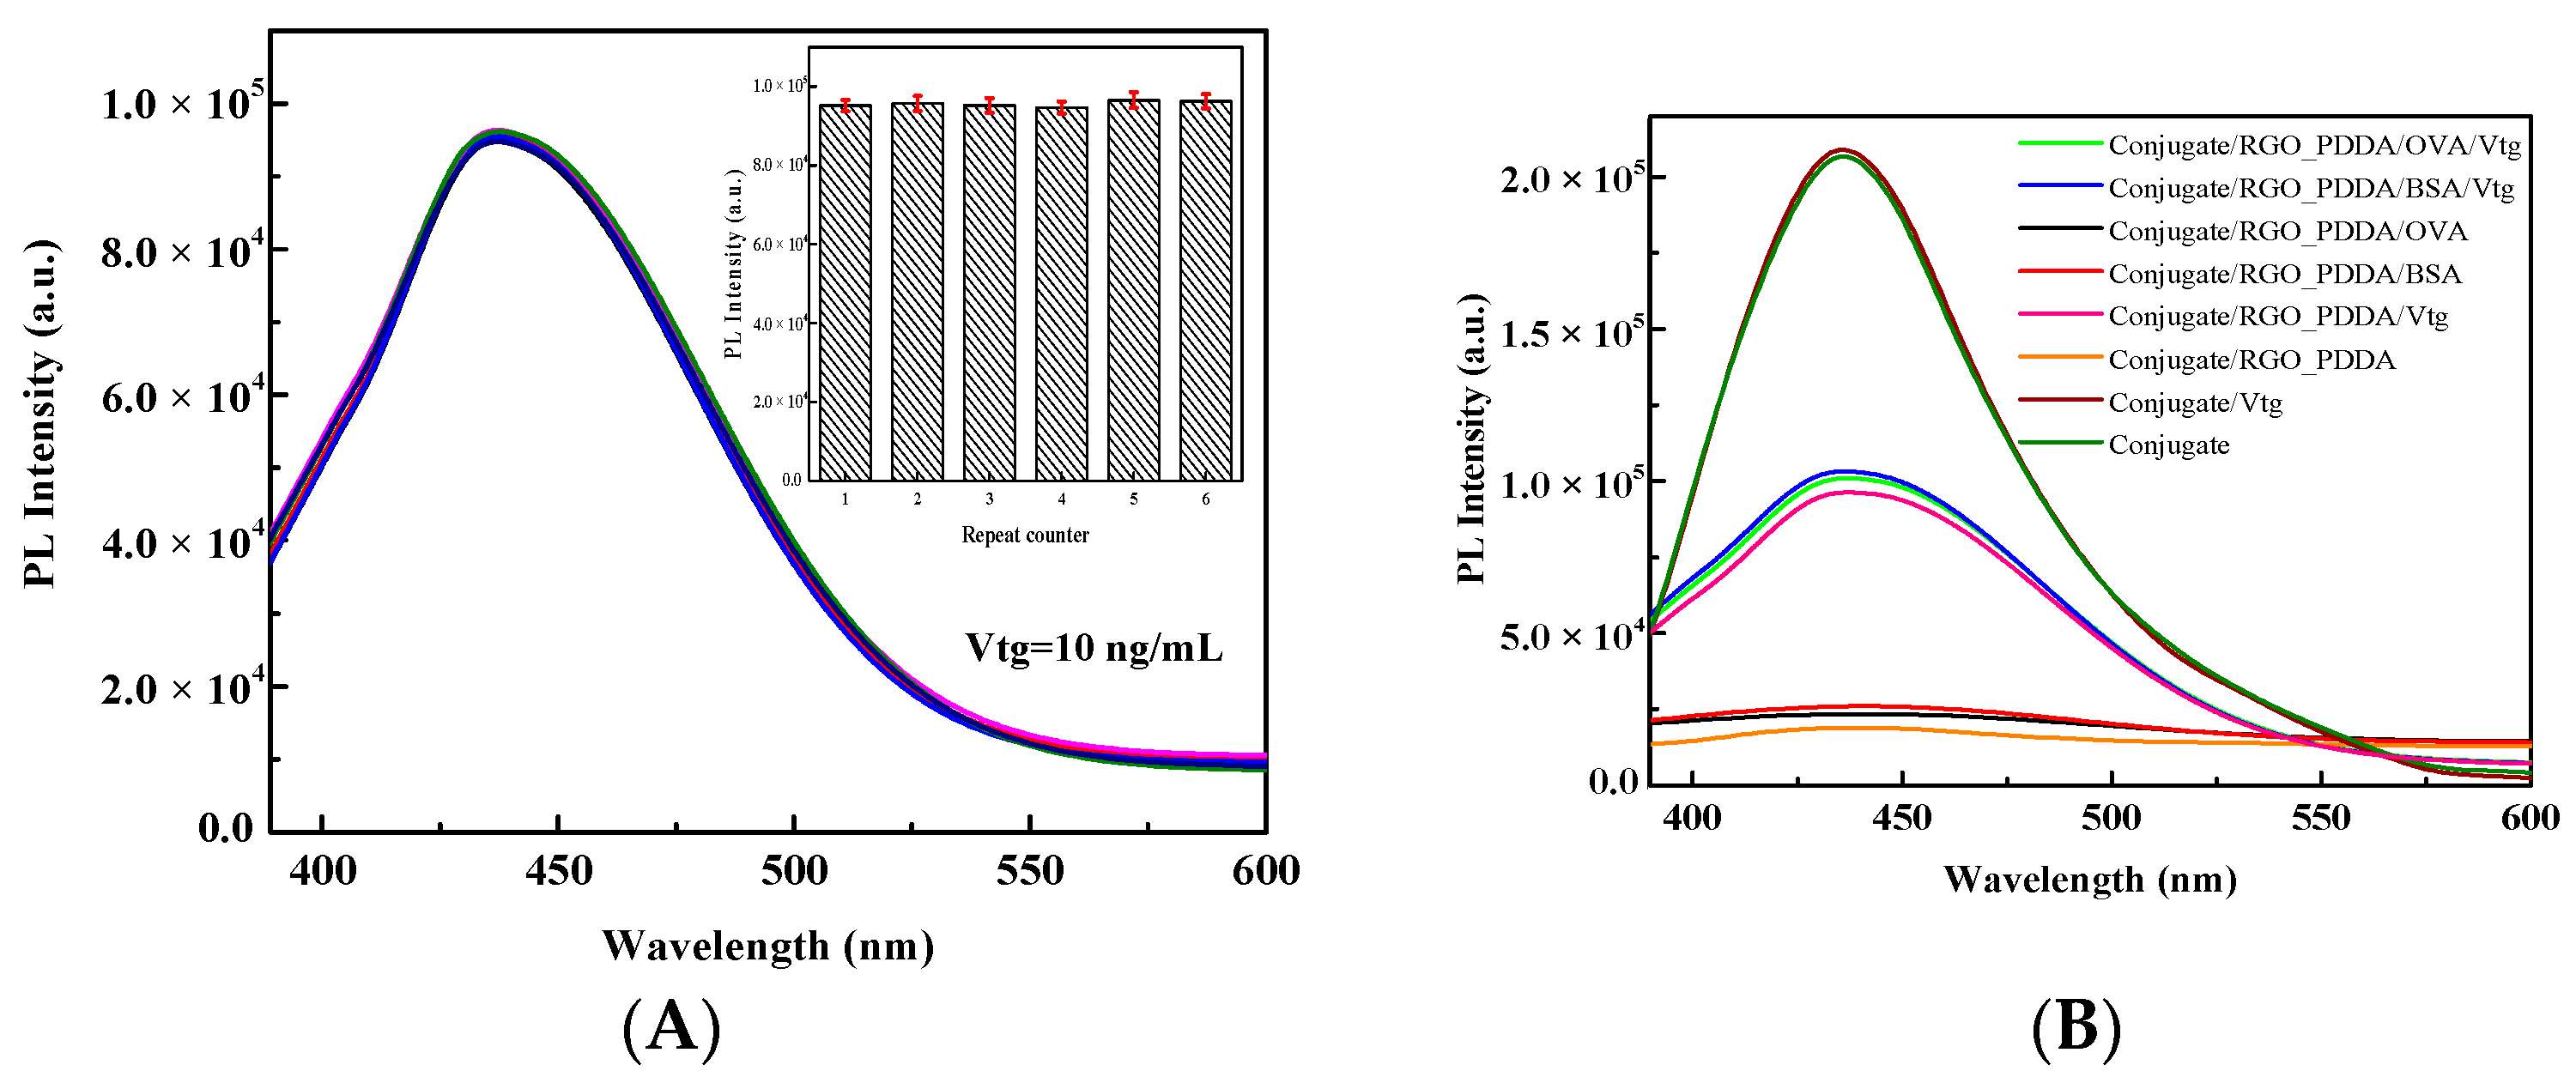
3.8. Reproducibility, Selectivity, and Stability of the Immunosensor

Reproducibility, selectivity, and stability of the immunosensor were shown in Figure 7. After adding the same amount of Vtg (10 ng/mL) into six parallel samples of conjugate/RGO and incubating for 15 min at room temperature, the PL spectra of the mixture were measured, and the results were presented in Figure 7A. Six duplicate groups showed the relative standard error of 1.63%, indicating the immunosensor has good repeatability. The selectivity of the immunosensor was tested by using bovine serum albumin (BSA) and ovalbumin (OVA, derived from egg white) as interferences. As shown in Figure 7B, for 10 ng/mL Vtg, 1000 ng/mL BSA, and 1000 ng/mL OVA, the PL regaining ratios are 41.75%, 4.23%, and 2.86%, respectively. The PL regaining ratio for Vtg is much higher than that for BSA and OVA, implying that the “ON-OFF” immunosensor has good selectivity for Vtg. Compared to the Ref. [29], the CQDs-based immunosensor has better selectivity. After one week of storage at 4 °C, the PL strength of the Anti-Lv-mAb/CQDs conjugate only lost 5%, indicating stable operation of the Anti-Lv-mAb/CQDs conjugate in a short period of time. CQDs is very stable even at room temperature for several months [35]. Anti-Lv-mAb/CQDs/RGO_PDDA/Vtg can be kept constant for 8 h at room temperature or 3 days at 4 °C. The Anti-Lv-mAb and CQDs can also be stored separately and mixed at the time of the experiment.

4. Conclusions

The fluorescent “ON-OFF” label-free immunosensing based on the FRET between CQDs conjugated Anti-Lv-mAb and modified RGO with PDDA has a wide linear test range (0.1–3000 ng/mL); lower LOD (0.04 ng/mL); excellent sensitivity (28,833.63 CPS/(ng/mL)), selectivity, and reproducibility; and quick speed for Vtg quantification. CQDs with amino group was prepared by one-step method, which saved time without amination. Compared with our previous work [29], this work has a wider linear detection range, implying the sensor is expected to be used for rapid and accurate detection of environmental weak estrogen. There is considerable scope for application of FRET immunosensors.

Supplementary Materials

The following supporting information can be downloaded at: https://0-www-mdpi-com.brum.beds.ac.uk/article/10.3390/chemosensors10120510/s1, Figure S1: UV-Vis absorption spectra changing with time during the reduction of GO; Figure S2: FRET between CQD and RGO before and after modifying with PDDA.

Author Contributions

Conceptualization, A.Y.; data curation, A.Y.; formal analysis, C.Q.; funding acquisition, A.Y. and J.W.; investigation, C.Q., H.W. and Z.Z.; methodology, A.Y.; resources, A.Y. and J.W.; supervision, A.Y.; validation, C.Q. and H.W.; visualization, C.Q.; writing—original draft, C.Q.; writing—review and editing, A.Y. All authors have read and agreed to the published version of the manuscript.

Funding

This research was funded by the National Natural Science Foundation of China, grant number 41877499 and 41976139.

Institutional Review Board Statement

Not applicable.

Informed Consent Statement

Not applicable.

Data Availability Statement

The data presented in this study are available on request from the corresponding author. The data are not publicly available as they are part of an ongoing study.

Conflicts of Interest

The authors declare no conflict of interest.

References

  1. Chen, B.; Huang, Y.; He, M.; Hu, B. Hollow fiber liquid-liquid-liquid microextraction combined with high performance liquid chromatography-ultraviolet detection for the determination of various environmental estrogens in environ-mental and biological samples. J. Chromatogr. A 2013, 1305, 17–26. [Google Scholar] [CrossRef] [PubMed]
  2. Qiu, W.; Zhan, H.; Hu, J.; Zhang, T.; Xu, H.; Wong, M.; Xu, B.; Zheng, C. The occurrence, potential toxicity, and toxicity mechanism of bisphenol S, a substitute of bisphenol A: A critical review of recent progress. Ecotoxicol. Environ. Saf. 2019, 173, 192–202. [Google Scholar] [CrossRef]
  3. Li, C.; Wei, Y.; Zhang, S.; Tan, W. Advanced methods to analyze steroid estrogens in environmental samples. Environ. Chem. Lett. 2020, 18, 543–559. [Google Scholar] [CrossRef]
  4. Ferreira, M.F.; Nostro, F.L.L.; Fernández, D.A.; Genovese, G. Endocrine disruption in the sub Antarctic fish Pata-gonotothen tessellata (Perciformes, Notothenidae) from Beagle Channel associated to anthropogenic impact. Mar. Environ. Res. 2021, 171, 105478. [Google Scholar] [CrossRef] [PubMed]
  5. Glineur, A.; Beccaria, M.; Purcaro, G. Exploring 20 eV electron impact ionization in gas chromatography-tandem mass spectrometry for the determination of estrogenic compounds. J. Chromatogr. A 2021, 1652, 462359. [Google Scholar] [CrossRef] [PubMed]
  6. Liu, Y.; Chen, Y.; Zhang, Y.; Kou, Q.; Zhang, Y.; Wang, Y.; Chen, L.; Sun, Y.; Zhang, H.; Jung, Y.M. Detection and Identification of Estrogen Based on Surface-Enhanced Resonance Raman Scattering (SERRS). Molecules 2018, 23, 1330. [Google Scholar] [CrossRef] [Green Version]
  7. Qian, C.; Quan, W.; Li, C.; Xiang, Z. Analysis of volatile terpenoid compounds in Rhododendron species by multi-dimensional gas chromatography with quadrupole time-of-flight mass spectrometry. Microchem. J. 2019, 149, 104064. [Google Scholar] [CrossRef]
  8. Tuteja, S.K.; Chen, R.; Kukkar, M.; Song, C.K.; Mutreja, R.; Singh, S.; Paul, A.K.; Lee, H.; Kim, K.H.; Deep, A. A label-free electrochemical immunosensor for the detection of cardiac marker using graphene quantum dots (GQDs). Biosens. Bioelectron. 2016, 86, 548–556. [Google Scholar] [CrossRef]
  9. Yang, Y.; Liu, Q.; Liu, Y.; Cui, J.; Liu, H.; Wang, P.; Li, Y.; Chen, L.; Zhao, Z.; Dong, Y. A novel label-free electrochemical immunosensor based on functionalized nitrogen-doped graphene quantum dots for carcinoembryonic antigen detection. Biosens. Bioelectron. 2017, 90, 31–38. [Google Scholar] [CrossRef]
  10. Wu, D.; Liu, Y.; Wang, Y.; Hu, L.; Ma, H.; Wang, G.; Wei, Q. Label-free electrochemiluminescent immunosensor for detection of prostate specific antigen based on aminated graphene quantum dots and carboxyl graphene quantum dots. Sci. Rep. 2016, 6, 20511. [Google Scholar] [CrossRef]
  11. Ganganboina, A.B.; Doong, R.A. Graphene quantum dots decorated gold-polyaniline nanowire for impedimetric detection of carcinoembryonic antigen. Sci. Rep. 2019, 9, 7214. [Google Scholar] [CrossRef] [Green Version]
  12. Tran, T.K.A.; Yu, R.M.K.; Islam, R.; Nguyen, T.H.T.; Bui, T.L.H.; Kong, R.Y.C.; O’Connor, W.A.; Leusch, F.D.; Priestley, M.A.; MacFarlane, G.R. The utility of vitellogenin as a biomarker of estrogenic endocrine disrupting chemicals in molluscs. Environ. Pollut. 2019, 248, 1067–1078. [Google Scholar] [CrossRef] [PubMed]
  13. Matozzo, V.; Gagne, F.; Marin, M.G.; Ricciardi, F.; Blaise, C. Vitellogenin as a biomarker of exposure to estrogenic compounds in aquatic invertebrates: A review. Environ. Int. 2008, 34, 531–545. [Google Scholar] [CrossRef] [PubMed]
  14. Pow, C.S.D.L.; Yost, E.E.; Aday, D.D.; Kullman, S.W. Sharing the roles: An assessment of Japanese medaka estrogen receptors in vitellogenin induction. Environ. Sci. Technol. 2016, 50, 8886–8895. [Google Scholar]
  15. Verderame, M.; Scudiero, R. Estrogen-dependent, extrahepatic synthesis of vitellogenin in male vertebrates: A mini-review. C. R. Biol. 2017, 340, 139–144. [Google Scholar] [CrossRef]
  16. De Alkimin, G.D.; Fracácio, R. Analysis of vitellogenin by histochemical method as an indicator of estrogenic effect in male Danio rerio exposed to metals. Environ. Sci. Pollut. Res. 2020, 27, 17789. [Google Scholar] [CrossRef]
  17. Felix, F.S.; Baccaro, A.L.B.; Angnes, L. Disposable voltammetric immunosensors integrated with microfluidic plat-forms for biomedical, agricultural and food analyses: A Review. Sensors 2018, 18, 4124. [Google Scholar] [CrossRef] [Green Version]
  18. Gupta, S.; Kaushal, A.; Kumar, A.; Kumar, D. Recent advances in biosensors for diagnosis of celiac disease: A review. Biotechnol. Bioeng. 2019, 116, 444–451. [Google Scholar] [CrossRef]
  19. Yi, X.; Li, C.; Zhong, X.; Gong, Y. Development of a lipovitellin-based sandwich ELISA for determination of vitellogenin in the marine medaka Oryzias melastigma. Chemosphere 2018, 197, 477–484. [Google Scholar] [CrossRef] [PubMed]
  20. Zhang, Z.; Wang, J.; Pan, Z.; Zhang, Y.; Zhang, X.; Tian, H.; Wang, W.; Ru, S. Distribution of vitellogenin in Japanese flounder (Paralichthys olivaceus) for biomarker analysis of marine environmental estrogens. Aquat. Toxicol. 2019, 216, 105321. [Google Scholar] [CrossRef]
  21. Oğuz, E.K.; Ergöz, B.; Oğuz, A.R. Histopathological alterations in Van fish (Alburnus tarichi Güldenstädt, 1814) exposed to tebuconazole. Chem. Ecol. 2022, 38, 17–26. [Google Scholar] [CrossRef]
  22. Darain, F.; Park, D.S.; Park, J.S.; Chang, S.C.; Shim, Y.B. A separation-free amperometric immunosensor for vitellogenin based on screen-printed carbon arrays modified with a conductive polymer. Biosens. Bioelectron. 2005, 20, 1780–1787. [Google Scholar] [CrossRef] [PubMed]
  23. Zhang, Z.; Ru, S.; Wang, J.; Wang, D.; Zhao, L.; Teng, H.; Dai, Z.; Zhang, W.; Yang, A. Ultrasensitive label-free electro-chemical immunosensors for detecting marine medaka (Oryzias melastigma) vitellogenin based on novel Cu2O–BSA nano-particles and anti-lipovitellin monoclonal antibody. Sens. Actuators B Chem. 2021, 345, 130358. [Google Scholar]
  24. Wang, J.; Wang, J.; Zhang, Z.; Zhang, X.; Ru, S.; Dong, Y. Development of an immunosensor for quantifying zebrafish vitellogenin based on the Octet system. Anal. Biochem. 2017, 533, 60–65. [Google Scholar] [CrossRef]
  25. Cocci, P.; Palermo, F.A.; Pucciarelli, S.; Miano, A.; Cuccioloni, M.; Angeletti, M.; Roncarati, A.; Mosconi, G. Identification, partial characterization, and use of grey mullet (Mugil cephalus) vitellogenins for the development of ELISA and biosensor immunoassays. Int. Aquat. Res. 2019, 11, 389–399. [Google Scholar] [CrossRef] [Green Version]
  26. Srivastava, S.K.; Shalabney, A.; Khalaila, I.; Grüner, C.; Rauschenbach, B.; Abdulhalim, I. In Highly sensitive SERS based nano-sculptured thin film biosensor for the detection of vitellogenin: An endocrine disruption biomarker. In Optical Sensors; Optica Publishing Group: Washington, DC, USA, 2014; p. SeM3C.3. [Google Scholar]
  27. Algar, W.R.; Hildebrandt, N.; Vogel, S.S.; Medintz, I.L. FRET as a biomolecular research tool—Understanding its potential while avoiding pitfalls. Nat. Methods 2019, 16, 815–829. [Google Scholar] [CrossRef] [PubMed]
  28. Bhatnagar, D.; Kumar, V.; Kumar, A.; Kaur, I. Graphene quantum dots FRET based sensor for early detection of heart attack in human. Biosens. Bioelectron. 2016, 79, 495–499. [Google Scholar] [CrossRef]
  29. Yang, A.L.; Su, Y.; Zhang, Z.Z.; Wang, H.D.; Qi, C.; Ru, S.; Wang, J. Preparation of graphene quantum dots by visible-fenton reaction and ultrasensitive label-free immunosensor for detecting lipovitellin of paralichthys olivaceus. Biosensors 2022, 12, 246. [Google Scholar] [CrossRef]
  30. Rani, U.A.; Ng, L.Y.; Ng, C.Y.; Mahmoudi, E. A review of carbon quantum dots and their applications in wastewater treatment. Adv. Colloid Interface Sci. 2020, 278, 102124. [Google Scholar] [CrossRef]
  31. Fernando, K.A.; Sahu, S.; Liu, Y.; Lewis, W.K.; Guliants, E.A.; Jafariyan, A.; Wang, P.; Bunker, C.E.; Sun, Y.P. Carbon quantum dots and applications in photocatalytic energy conversion. ACS Appl. Mater. Interfaces 2015, 7, 8363–8376. [Google Scholar] [CrossRef]
  32. Shaari, N.; Kamarudin, S.K.; Bahru, R. Carbon and graphene quantum dots in fuel cell application: An overview. Int. J. Energy Res. 2021, 45, 1396. [Google Scholar] [CrossRef]
  33. Janus, Ł.; Radwan-Pragłowska, J.; Piątkowski, M.; Bogdał, D. Coumarin-modified CQDs for biomedical applications-two-step synthesis and characterization. Int. J. Mol. Sci. 2020, 21, 8073. [Google Scholar] [CrossRef] [PubMed]
  34. Walther, B.K.; Dinu, C.Z.; Guldi, D.M.; Sergeyev, V.G.; Creager, S.E.; Cooke, J.P.; Guiseppi-Elie, A. Nanobiosensing with graphene and carbon quantum dots: Recent advances. Mater. Today 2020, 39, 23–46. [Google Scholar] [CrossRef]
  35. Qi, C.; Wang, H.D.; Yang, A.L.; Wang, X.X.; Xu, J. Facile fabrication of highly fluorescent N-doped carbon quantum dots using an ultrasonic-assisted hydrothermal method: Optical properties and cell imaging. ACS Omega 2021, 6, 32904. [Google Scholar] [CrossRef] [PubMed]
  36. Wang, J.; Bing, X.; Yu, K.; Tian, H.; Wang, W.; Ru, S. Preparation of a polyclonal antibody against goldfish (Carassius auratus) vitellogenin and its application to detect the estrogenic effects of monocrotophos pesticide. Ecotoxicol. Environ. Saf. 2015, 111, 109–116. [Google Scholar] [CrossRef] [PubMed]
  37. Wang, J.; Zhang, X.; Shan, R.; Ma, S.; Tian, H.; Wang, W.; Ru, S. Lipovitellin as an antigen to improve the precision of sandwich ELISA for quantifying zebrafish (Danio rerio) vitellogenin. Comp. Biochem. Physiol. C Toxicol. Pharmacol. 2016, 185–186, 87–93. [Google Scholar] [CrossRef] [PubMed]
  38. Li, C.R.; Kim, K.T.; Kang, Y.J.; Kim, A.; Kang, S.W.; Park, J.S. A novel enzyme-linked immunosorbent assay system for the quantitative analysis of Carassius auratus vitellogenin. Chemosphere 2005, 59, 997. [Google Scholar] [CrossRef]
  39. Zhang, W.; Wu, L.; Du, L.; Yue, L.; Guan, R.; Zhang, Q.; Hou, G.; Shao, R. Layer-by-layer assembly modification to prepare firmly bonded Si-graphene composites for high-performance anodes. RSC Adv. 2016, 6, 4835. [Google Scholar] [CrossRef]
  40. Celestino, G.G.; Henriques, R.R.; Shiguihara, A.L.; Constantino, V.R.L.; Melo, R.D.S.; Júnior, J.A. Adsorption of gallic acid on nanoclay modified with poly(diallyldimethylammonium chloride). Environ. Sci. Pollut. Res. 2019, 26, 28444. [Google Scholar] [CrossRef]
  41. Wang, X.; Wang, X.; Zhao, J.; Song, J.; Su, C.; Wang, Z. Surface modified TiO2 floating photocatalyst with PDDA for efficient adsorption and photocatalytic inactivation of Microcystis aeruginosa. Water Res. 2018, 131, 320–333. [Google Scholar] [CrossRef]
  42. Yuan, Y.; Shen, C.; Chen, J.; Ren, X. Synthesis and characterization of cross-linked quaternized chitosan/poly(diallyldimethylammonium chloride) blend anion-exchange membranes. Ionics 2018, 24, 1173–1180. [Google Scholar] [CrossRef]
  43. Liu, G.; Liu, S.; Ma, K.; Wang, H.; Wang, X.; Liu, G.; Jin, W. Polyelectrolyte functionalized Ti2CTx MXene membranes for pervaporation dehydration of isopropanol/water mixtures. Ind. Eng. Chem. Res. 2020, 59, 4732–4741. [Google Scholar] [CrossRef]
  44. Eluyemi, M.S.; Eleruja, M.A.; Adedeji, A.V.; Olofinjana, B.; Fasakin, O.; Akinwunmi, O.O.; Ilori, O.O.; Famojuro, A.T.; Ayinde, S.A.; Ajayi, E.O.B. Synthesis and characterization of graphene oxide and reduced graphene oxide thin films deposited by spray pyrolysis method. Graphene 2016, 5, 2169–3439. [Google Scholar] [CrossRef] [Green Version]
  45. Sharma, N.; Sharma, V.; Jain, Y.; Kumari, M.; Gupta, R.; Sharma, S.K.; Sachdev, K. Synthesis and characterization of graphene oxide (GO) and reduced graphene oxide (rGO) for gas sensing application. Macromol. Symp. 2017, 376, 1700006. [Google Scholar] [CrossRef]
  46. Gupta, B.; Kumar, N.; Panda, K.; Kanan, V.; Joshi, S.; Visoly-Fisher, I. Role of oxygen functional groups in reduced graphene oxide for lubrication. Sci. Rep. 2017, 7, 45030. [Google Scholar] [CrossRef] [PubMed] [Green Version]
  47. Roy, I.; Rana, D.; Sarkar, G.; Bhattacharyya, A.; Saha, N.R.; Mondal, S.; Pattanayak, S.; Chattopadhyay, S.; Chattopadhyay, D. Physical and electrochemical characterization of reduced graphene oxide/silver nanocomposites synthesized by adopting a green approach. RSC Adv. 2015, 5, 25357. [Google Scholar] [CrossRef]
  48. Johra, F.T.; Jung, W.G. Hydrothermally reduced graphene oxide as a supercapacitor. Appl. Surf. Sci. 2015, 357, 1911–1914. [Google Scholar] [CrossRef]
  49. Gao, T.; Wang, X.; Yang, L.Y.; He, H.; Ba, X.X.; Zhao, J.; Jiang, F.L.; Liu, Y. Red, yellow, and blue luminescence by graphene quantum dots: Syntheses, mechanism, and cellular imaging. ACS Appl. Mater. Interfaces 2017, 9, 24846. [Google Scholar] [CrossRef]
Scheme 1. Schematic diagram of the immunosensor for detection of Vtg.
Chemosensors 10 00510 sch001
Figure 1. The morphologies and structures of GO, RGO, RGO_PDDA, and CQDs. TEM images of (A) GO, (B) RGO, (C) RGO_PDDA, and (D) HRTEM image of CQDs.
Chemosensors 10 00510 g001
Figure 2. FTIR spectra of the RGO_PDDA, RGO, and PDDA.
Chemosensors 10 00510 g002
Figure 3. Zeta potentials of RGO, RGO_PDDA, and CQDs.
Chemosensors 10 00510 g003
Figure 4. (A) UV-Vis absorption spectra of CQDs, Anti-Lv-mAb and the conjugate of Anti-Lv-mAb/CQDs, the absorption spectrum of CQDs was used as reference; (B) PL spectra of CQDs, Anti-Lv-mAb/CQDs, and RGO and RGO_PDDA under excitation at 350 nm. The PL spectrum of CQDs is used as reference, and the dashed line is the absorption curve of RGO; (C) PL spectra of Anti-Lv-mAb/CQDs under various excitation wavelengths.
Chemosensors 10 00510 g004
Figure 5. PL quenching of Anti-Lv-mAb/CQDs at different concentrations of (A) RGO and (B) RGO_PDDA, and (C) quenching efficiencies vary with the concentrations of RGO_PDDA.
Chemosensors 10 00510 g005
Figure 6. (A) PL “ON” of Anti-Lv-mAb/CQDs/RGO_PDDA after addition of different concentrations of Vtg (0.1, 1.0, 10, 100, 1000, 3000, 6000, 10,000, and 15,000 ng/mL); (B) the PL regaining intensities with the logarithm concentrations of Vtg; the linear range is from 0.1 ng/mL to 3000 ng/mL.
Chemosensors 10 00510 g006
Figure 7. (A) Reproducibility and (B) immunosensing behavior against specific (Vtg) and nonspecific antigen (BSA and OVA). (A) shows the addition of the same amount of Vtg (10 ng/mL) into six parallel samples of Anti-Lv-mAb/CQDs/RGO_PDDA; and in (B), the concentration of Vtg is 10 ng/mL, and the concentrations of OVA and BSA is 100 times that of Vtg.
Chemosensors 10 00510 g007
Table 1. Comparison the LODs and test ranges for various immunosensing methods for Vtg/Lv detection.
NoSensor TypeAntibody TypeLOD
(ng/mL)
Linear Range
(ng/mL)
Reference
1Optical biosensorpolyAbData not shown78–5000[24]
2Optical biosensorpolyAb3170–739[25]
3Optical biosensorpolyAb0.005Data not shown[26]
5Electrochemical sensormAb0.090.25–7.8[22]
6Electrochemical sensormAb0.030.1–1000[23]
7ELISApolyAb3.115.6–500[19]
8ELISApolyAb4.67.8–2000[21]
9ELISAmAb0.751.95–250[20]
10FRET sensormAb0.00090.001–1500[29]
11FRET sensormAb0.040.1–3000This study
Publisher’s Note: MDPI stays neutral with regard to jurisdictional claims in published maps and institutional affiliations.

