Article

Quenching of the Photoluminescence of Gold Nanoclusters Synthesized by Pulsed Laser Ablation in Water upon Interaction with Toxic Metal Species in Aqueous Solution

by
Tahir
1,*,
Fernando Lazaro Freire Jr
1,
Ricardo Q. Aucelio
2,
Marco Cremona
1,
Juliana da S. Padilha
2,
Giancarlo Margheri
3,
Quaid Zaman
1,4,
Guilherme C. Concas
1,
Mariana Gisbert
1,
Sajjad Ali
5,
Carlos A. T. Toloza
2,6,
Yordy E. Licea
7,8,
Tatiana D. Saint’Pierre
2,
Rafael S. Carvalho
1,
Rajwali Khan
9,
Gino Mariotto
10,
Nicola Daldosso
10,
Geronimo Perez
11 and
Tommaso Del Rosso
1,*
1
Department of Physics, Pontifícia Universidade Católica do Rio de Janeiro, Rua Marques de São Vicente, Rio de Janeiro 22451-900, RJ, Brazil
2
Department of Chemistry, Pontifícia Universidade Católica do Rio de Janeiro, Rua Marques de São Vicente, Rio de Janeiro 22451-900, RJ, Brazil
3
CNR—National Research Council of Italy—Istituto dei Sistemi Complessi, Via Madonna del Piano 10, 50019 Sesto Fiorentino, Italy
4
Department of Physics, University of Buner, Buner 17290, Pakistan
5
Yangtze Delta Region Institute (Huzhou), University of Electronic Science and Technology of China, Huzhou 313001, China
6
Department of Natural and Exact Sciences, Universidad de la Costa, Barranquilla, Colombia
7
Centro Brasileiro de Pesquisas Físicas (CBPF), COMAN/CBPF, Rua Dr. Xavier Sigaud, 150, Urca, Rio de Janeiro 22290-180, RJ, Brazil
8
GSK Biopharma, 9910 Belward Campus Dr, Rockville, MD 20850, USA
9
Department of Physics, University of Lakki Marwat, Lakki Marwat 28420, Pakistan
10
Department of Informatics, Università di Verona, Strada le Grazie 15, I-37134 Verona, Italy
11
Department of Mechanical Engineering, Universidade Federal Fluminense, Rua Passo da Patrias, 156, Niteroi, Rio de Janeiro 24210-240, RJ, Brazil
*
Authors to whom correspondence should be addressed.
Submission received: 24 December 2022 / Revised: 25 January 2023 / Accepted: 2 February 2023 / Published: 5 February 2023
(This article belongs to the Special Issue Application of Luminescent Materials for Sensing)

Abstract

:
Sensors for the detection of heavy metal ions in water are in high demand due to the danger they pose to both the environment and human health. Among their possible detection approaches, modulation of the photoluminescence of gold nanoclusters (AuNCs) is gaining wide interest as an alternative to classical analytical methods based on complex and high-cost instrumentation. In the present work, luminescent oxidized AuNCs emitting in both ultraviolet (UV) and visible (blue) regions were synthesized by pulsed laser ablation of a gold target in NaOH aqueous solution, followed by different bleaching processes. High-resolution electron microscopy and energy-dispersive X-ray scattering confirmed the presence of oxygen and gold in the transparent photoluminescent clusters, with an average diameter of about 3 nm. The potentialities of the bleached AuNCs colloidal dispersions for the detection of heavy metal ions were studied by evaluating the variation in photoluminescence in the presence of Cd2+, Pb2+, Hg2+ and CH3Hg+ ions. Different responses were observed in the UV and visible (blue) spectral regions. The intensity of blue emission decreased (no more than 10%) and saturated at concentrations higher than 20 ppb for all the heavy metal ions tested. In contrast, the UV band emission was remarkably affected in the presence of Hg2+ ions, thus leading to signal variations for concentrations well beyond 20 ppb (the concentration at which saturation occurs for other ions). The limit of detection for Hg2+ is about 3 ppb (15 nmol/L), and the photoluminescence intensity diminishes linearly by about 75% up to 600 ppb. The results are interpreted based on the ligand-free interaction, i.e., the metallophilic bonding formation of Hg2+ and Au+ oxide present on the surface of the UV-emitting nanoclusters.

Graphical Abstract

1. Introduction

Metal nanoclusters (MNCs) are nanometer-sized particles composed by subunits of a single element’s atoms/molecules (monometallic) or atoms/molecules of many elements (alloy), containing 10 to 100 atoms/molecules per particle [1,2,3]. MNCs are considered an intermediate stage between bulk material and a single atom/molecule. These ultra-small MNCs have been intensively investigated in the past two decades because of their unique properties related to their molecular-like electronic structure, such as photoluminescence (PL) [1,2,3,4]. In terms of biocompatibility and photostability, photoluminescent gold nanoclusters (AuNCs) deserve particular attention, because they present several advantages over luminescent semiconductor quantum dots and organic dyes [5,6,7,8].
Among the methods reported in the literature for the synthesis of colloidal dispersions of AuNCs, those based on chemical synthetic routes are the most commonly employed. In such chemical synthesis, the attaching of ligands to the surface of the metal, acting as electron donor systems, is a pre-requisite to control the spectral position of the photoluminescence (PL) and to enhance the relative quantum yield (QY) [7,9].
The motivation for the study on the interaction between heavy metal ions (HMI) and noble metal photoluminescent (PL) or plasmonic nanoprobes is mainly the possibility of developing cheaper and portable optical sensors for routine monitoring of single analytes [8,10,11], in contraposition with analytical methods based on complex instruments such as inductively coupled plasma mass spectrometry (ICPMS) [12,13]. For eventual practical applications, it is a requirement to synthesize nanomaterials able to sense mercury at the lower ppb level, bearing in mind that 2.0 ppb is considered by the United States Environmental Protection Agency (EPA) as the maximum concentration allowed in drinking water [14].
Photoluminescent AuNCs synthesized by chemical routes were used in the literature for the selective and fast detection of heavy metal ions, especially Hg2+. The sensing approaches are generally based on the interaction between the mercury ions and the ligands on the surface of the AuNCs [8,15,16], or on the metallophilic bonding of Hg2+ (4f145d10) and Au+ (4f145d10), allowing a ligand-free recognition within the limit of detection (LOD) down to 0.1 ppb [14,17].
An alternative approach to the production of nanocolloids is pulsed laser ablation (PLA), a light–matter interaction performed with high-fluence laser pulses, used in various applications to modify the morphological, chemical or physical properties of surfaces [18,19,20,21,22]. During PLA of a metal target in water, the surface of the resulting metal nanoparticles is oxidized by water-splitting-produced radical hydroxides, or by other oxidizing agents present in the medium [23,24,25,26]. In the case of gold nanoparticles, the surface is partially oxidized, with a pH-dependent ratio of AuO/AuOH groups [22,27], and the possible presence of oxocarbons if NaOH is introduced [26,28].
Recently, R. Ziefuss et al. synthesized photoluminescent fully inorganic AuNCs by a two-step irradiation process consisting of PLA followed by photo-fragmentation with a 532 nm laser. They observed two distinct PL bands, one in the near-UV and the other in the visible blue region, with QY as high as 2% [29]. Au nanomaterial produced by PLA in water is known for its particular oxidation states that result in a surface with a higher metal concentration, where 5–10% is covered by Au+ and a small percentage (2–4%) by Au3+ ions [24,27,29]. In the case of the photoluminescent AuNCs synthesized by R. Ziefuss et al., X-ray absorption near edge structure (XANES) spectroscopy revealed a higher degree of surface oxidation, reaching 35% of the volume for clusters smaller than 1 nm [29]. Due to this peculiar oxidation state of the fully inorganic AuNCs, their surface represents an interesting and attractive platform to investigate the possibility of metallophilic interaction with mercury II ions.
In this work, a one-step process for the synthesis of photoluminescent AuNCs is presented, comparing different approaches for the bleaching of the pristine colloidal dispersion of gold colloids. The intended goal was also to separate the larger AuNPs characterized by a localized surface plasmon resonance (LSPR) band [30]. The obtained AuNCs were characterized by different spectroscopic techniques and by high-resolution electron microscopy (HRTEM). The effect on the remaining smaller AuNCs due to the presence of Hg2+, Cd2+, Pb2+ and CH3Hg+, in aqueous solutions, was evaluated by measuring the magnitude of PL quenching of the emissions in the near-UV and blue regions of the spectra. The experimental results were compared to data available in the literature, and metallophilic bonding was proposed as the possible mechanism to explain the label-free interaction with Hg2+ ions.

2. Materials and Methods

2.1. Materials

NaOH, mercury chloride, methylmercury chloride, cadmium chloride and lead nitrate were obtained from Sigma-Aldrich with purity greater than 98%. The gold target was purchased from Kurt J Lesser company (Jefferson Hills, PA, USA) with purity greater than 99%.
Dried dialysis cellulose membranes of 3.5 KD molecular weight cut-off, containing 10% glycerol and 0.1% sulfur, were purchased from Fisher Scientific Company (USA).

2.2. Synthesis of the Gold Nanomaterial by Pulsed Laser Ablation (PLA) in Water

A stock solution of NaOH at the concentration of 100 mmol L−1 was prepared by diluting proper amounts of the salt in ultrapure water. The stock solution was then diluted in ultrapure water to prepare the work solution at the concentration of 60 μmol L−1, which was stirred for 10 min. The gold colloids were synthesized by pulsed laser ablation (PLA) at 532 nm, using a gold target immersed in 12 mL of the diluted, and previously aerated (by vigorous agitation), NaOH solution [26,28]. The laser pulses, emitted by a Q-Smart 850 laser source from Quantel (USA), had a temporal length of 5 ns, a fluence of about 11 J/cm2 and an energy of 7 mJ. The gold target was ablated for 6 h.

2.3. Separation of the Plasmonic Gold Nanoparticles from the AuNCs

Three main approaches were investigated for the bleaching process of the fresh dispersion of gold colloids after PLA: (i) evaporation of water followed by centrifugation, (ii) electrochemical separation by grounding and (iii) precipitation by the addition of salt (NaCl) followed by dialysis.
In process (i), the fresh colloidal dispersion of Au-based nanomaterial was heated at about 40 °C in order to slowly evaporate the water, and hence concentrate the dispersed nanomaterials to about 10 times. The concentrated dispersion was then centrifuged for 3 h at 13,000 rpm at −5 °C.
The electrochemical precipitation by grounding (process (ii)) consists of the immersion of a grounded copper wire in the colloidal dispersion of nanomaterials, followed by stirring for 4 h. This approach was firstly used by Palazzo et al. [31] in order to induce instability of gold colloids produced by PLA in water.
In method (iii), NaCl was added to the fresh colloidal dispersion of nanomaterial to induce the precipitation at a final concentration of 0.7 mol L−1. The AuNPs with salt were stirred for 2 h, and then left in the dark for 24 h.
At the end of the different bleaching processes, the AuNPs with a localized surface plasmon resonance (LSPR) band were precipitated, leaving as supernatant a transparent aqueous dispersion of AuNCs, which was further subjected to a dialysis process.

2.4. Dialysis of the AuNCs Colloidal Dispersion

The dialysis process was applied to the bleached dispersions of AuNCs in order to decrease both NaCl and NaOH concentrations. In particular, we filled a 3.5 KD dialysis membrane with 10 mL of a concentrated colloidal dispersion of AuNCs. The process was carried out for 5 days, placed in 500 mL of deionized water under stirring (water was replaced every 12 h). After dialysis, the samples were ready to be characterized by PL spectroscopy and to be tested for the interaction with heavy metal ions.

2.5. Optical Spectroscopies

The colloidal dispersions of nanomaterial, both fresh and after the bleaching process, were analyzed by UV–Vis electronic spectroscopy using a spectrophotometer (model Lambda 950, Perkin Elmer, USA) to measure extinction, and a luminescence spectrophotometer (model LS-55, Perkin Elmer, USA) to obtain excitation and emission spectra of the nanomaterial.

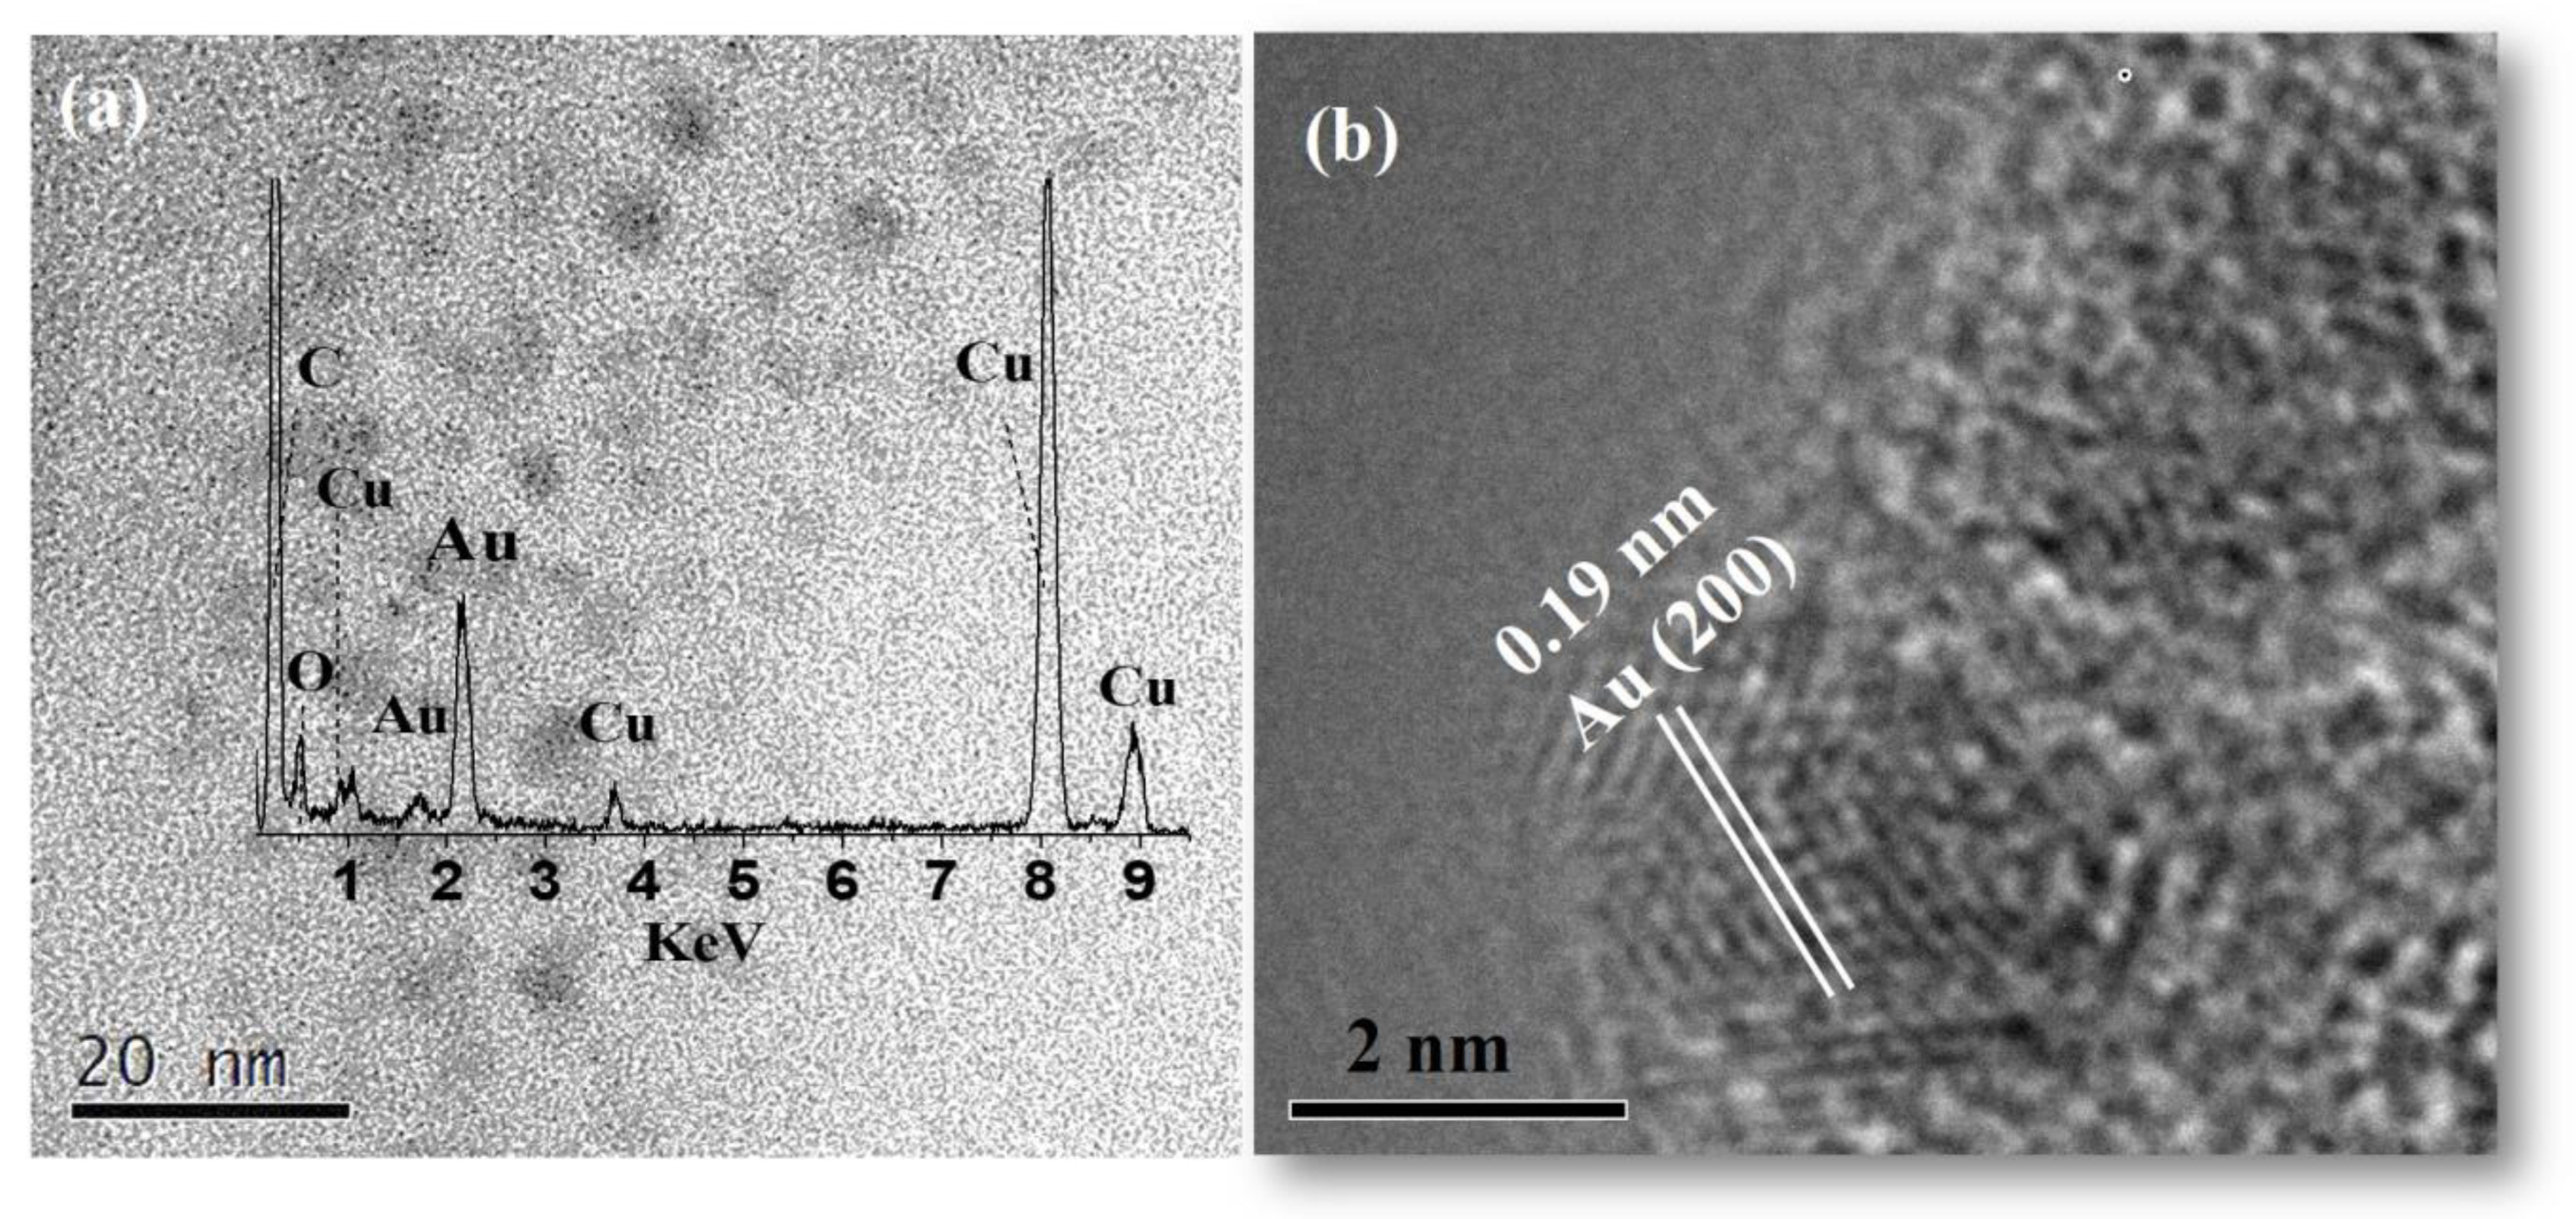
2.6. Analysis by TEM

The gold nanomaterial was analyzed using a JEOL JEM-2100F (LABNANO/CBPF) operated at 200 kV, used for high-resolution transmission electron microscopy (HRTEM) images; the same equipment was also utilized for energy-dispersive X-ray analysis (EDX) using a Thermo Fisher detector.
For the observation of the gold colloids before the separation process, a holey carbon 300-mesh copper grid was gently placed for three minutes over a 40 µL drop of fresh material with an optical extinction of 0.2, subsequently placed over a 40 µL drop of water for just 30 s and finally dried overnight at room temperature. For the observation of the AuNCs, a 20 µL drop of the nanomaterial with a typical gold concentration of about 20 ppb was deposited on the same kind of grid and left to dry overnight.

2.7. Quenching of the Photoluminescence upon Interaction with Heavy Metal Ions: Linear Range, Sensitivity and Limit of Detection

Mercury chloride (Hg2+), methylmercury chloride (CH3Hg+), cadmium chloride (Cd2+) and lead nitrate (Pb2+) standard stock solutions, at 4.0 mmol L−1, were prepared by dissolving proper amounts of these salts in deionized water acidified with HNO3 (final volume of 10.00 mL). These standard stock solutions were used to prepare solutions at 5 ppm by direct dilution with water, verifying the pH of the final medium. For example, the 5 ppm Hg2+ aqueous solution presented pH 2.2.
For the investigation of the PL quenching upon interaction with HMI, 1.00 mL of the dialyzed dispersion of AuNCs was placed in a quartz cuvette of 1 cm path length. After, aliquots of the 5 ppm HMI water solutions were introduced, with a total volume ranging from 2 to 120 μL. In this way, the final concentration of the HMI varied from 10 to 640 ppb. Since the HMI solutions are acidic, the pH of the samples under analysis varied from 6 (deionized water) to 3.1 during the injection of the analytes.
The interaction between the HMI and the AuNCs clusters was investigated through the quenching of the PL. Before the introduction of the HMI, the PL spectra have a maximum intensity denoted as Lo which, after interaction with the ions, decreases to a value defined as Lx. To quantitatively obtain the linear range, the sensitivity (S) and the limit of detection (LOD), an analytical curve considering Lo/Lx as a function of the concentration of the analytes (C), was used. The linear range is defined as the concentration range of the analytes for which Lo/Lx depends linearly on C. The sensitivity is defined as S = Δ(Lo/Lx)/ΔC, while the limit of detection LOD depends on the experimental conditions, particularly on the maximum intensity Lo and the standard deviation of the maximum intensity σ associated with the blank measurement (dispersion without the addition of analyte) [32]. Since two subsequent blank measurements may present a difference of σ in the intensity, this means that the fluctuations of Lo/Lx around the unity can be expressed as
L 0 L 0 ± σ 1 σ L 0 = 1 σ L o L ,
where we are supposing that σ L o L = σ L 0 < < 1 , and σ L o L is the standard deviation of Lo/Lx. If these conditions are satisfied, the limit of detection can be expressed as
L O D = 3 σ L o L / S
Finally, the limit of quantification (LOQ) was calculated as 3.3 × LOD, and this value was established as the initial concentration of the analytical curve, representing the lowest concentration that is determined with statistical certainty [33].

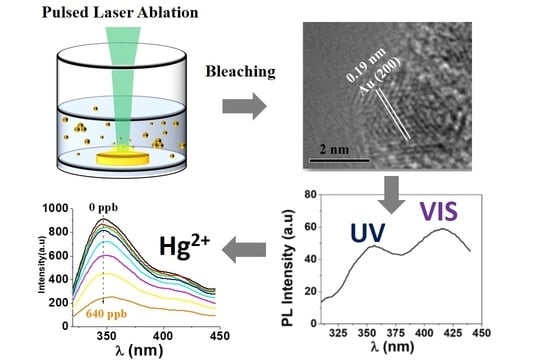
3. Results and Discussion

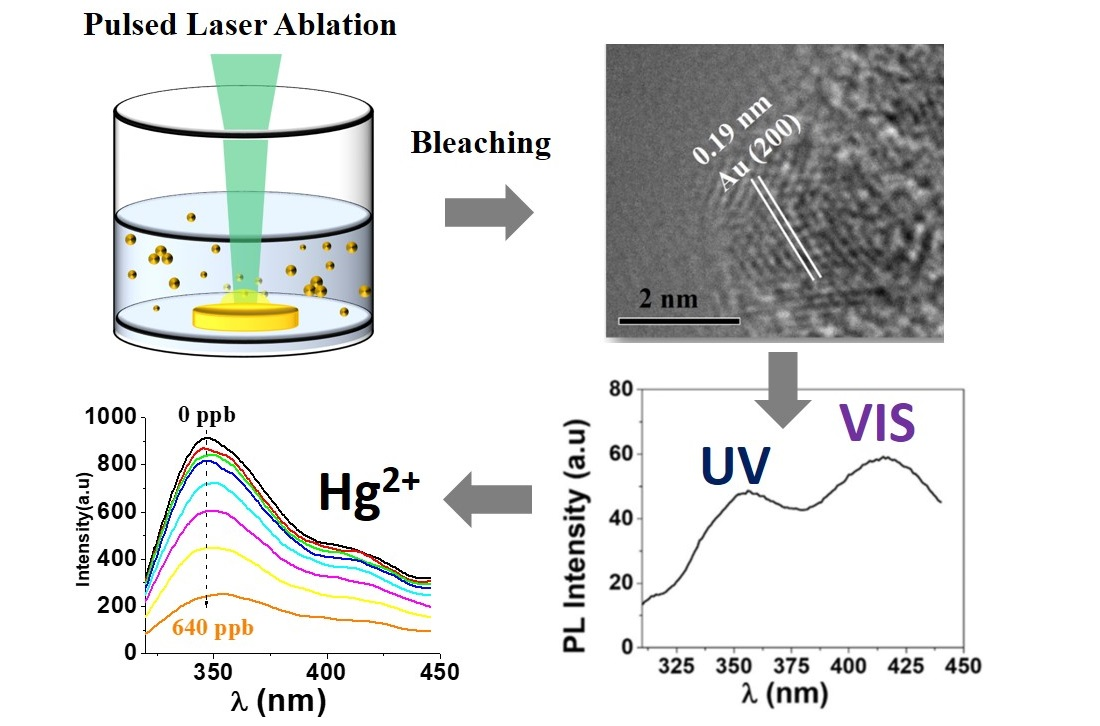
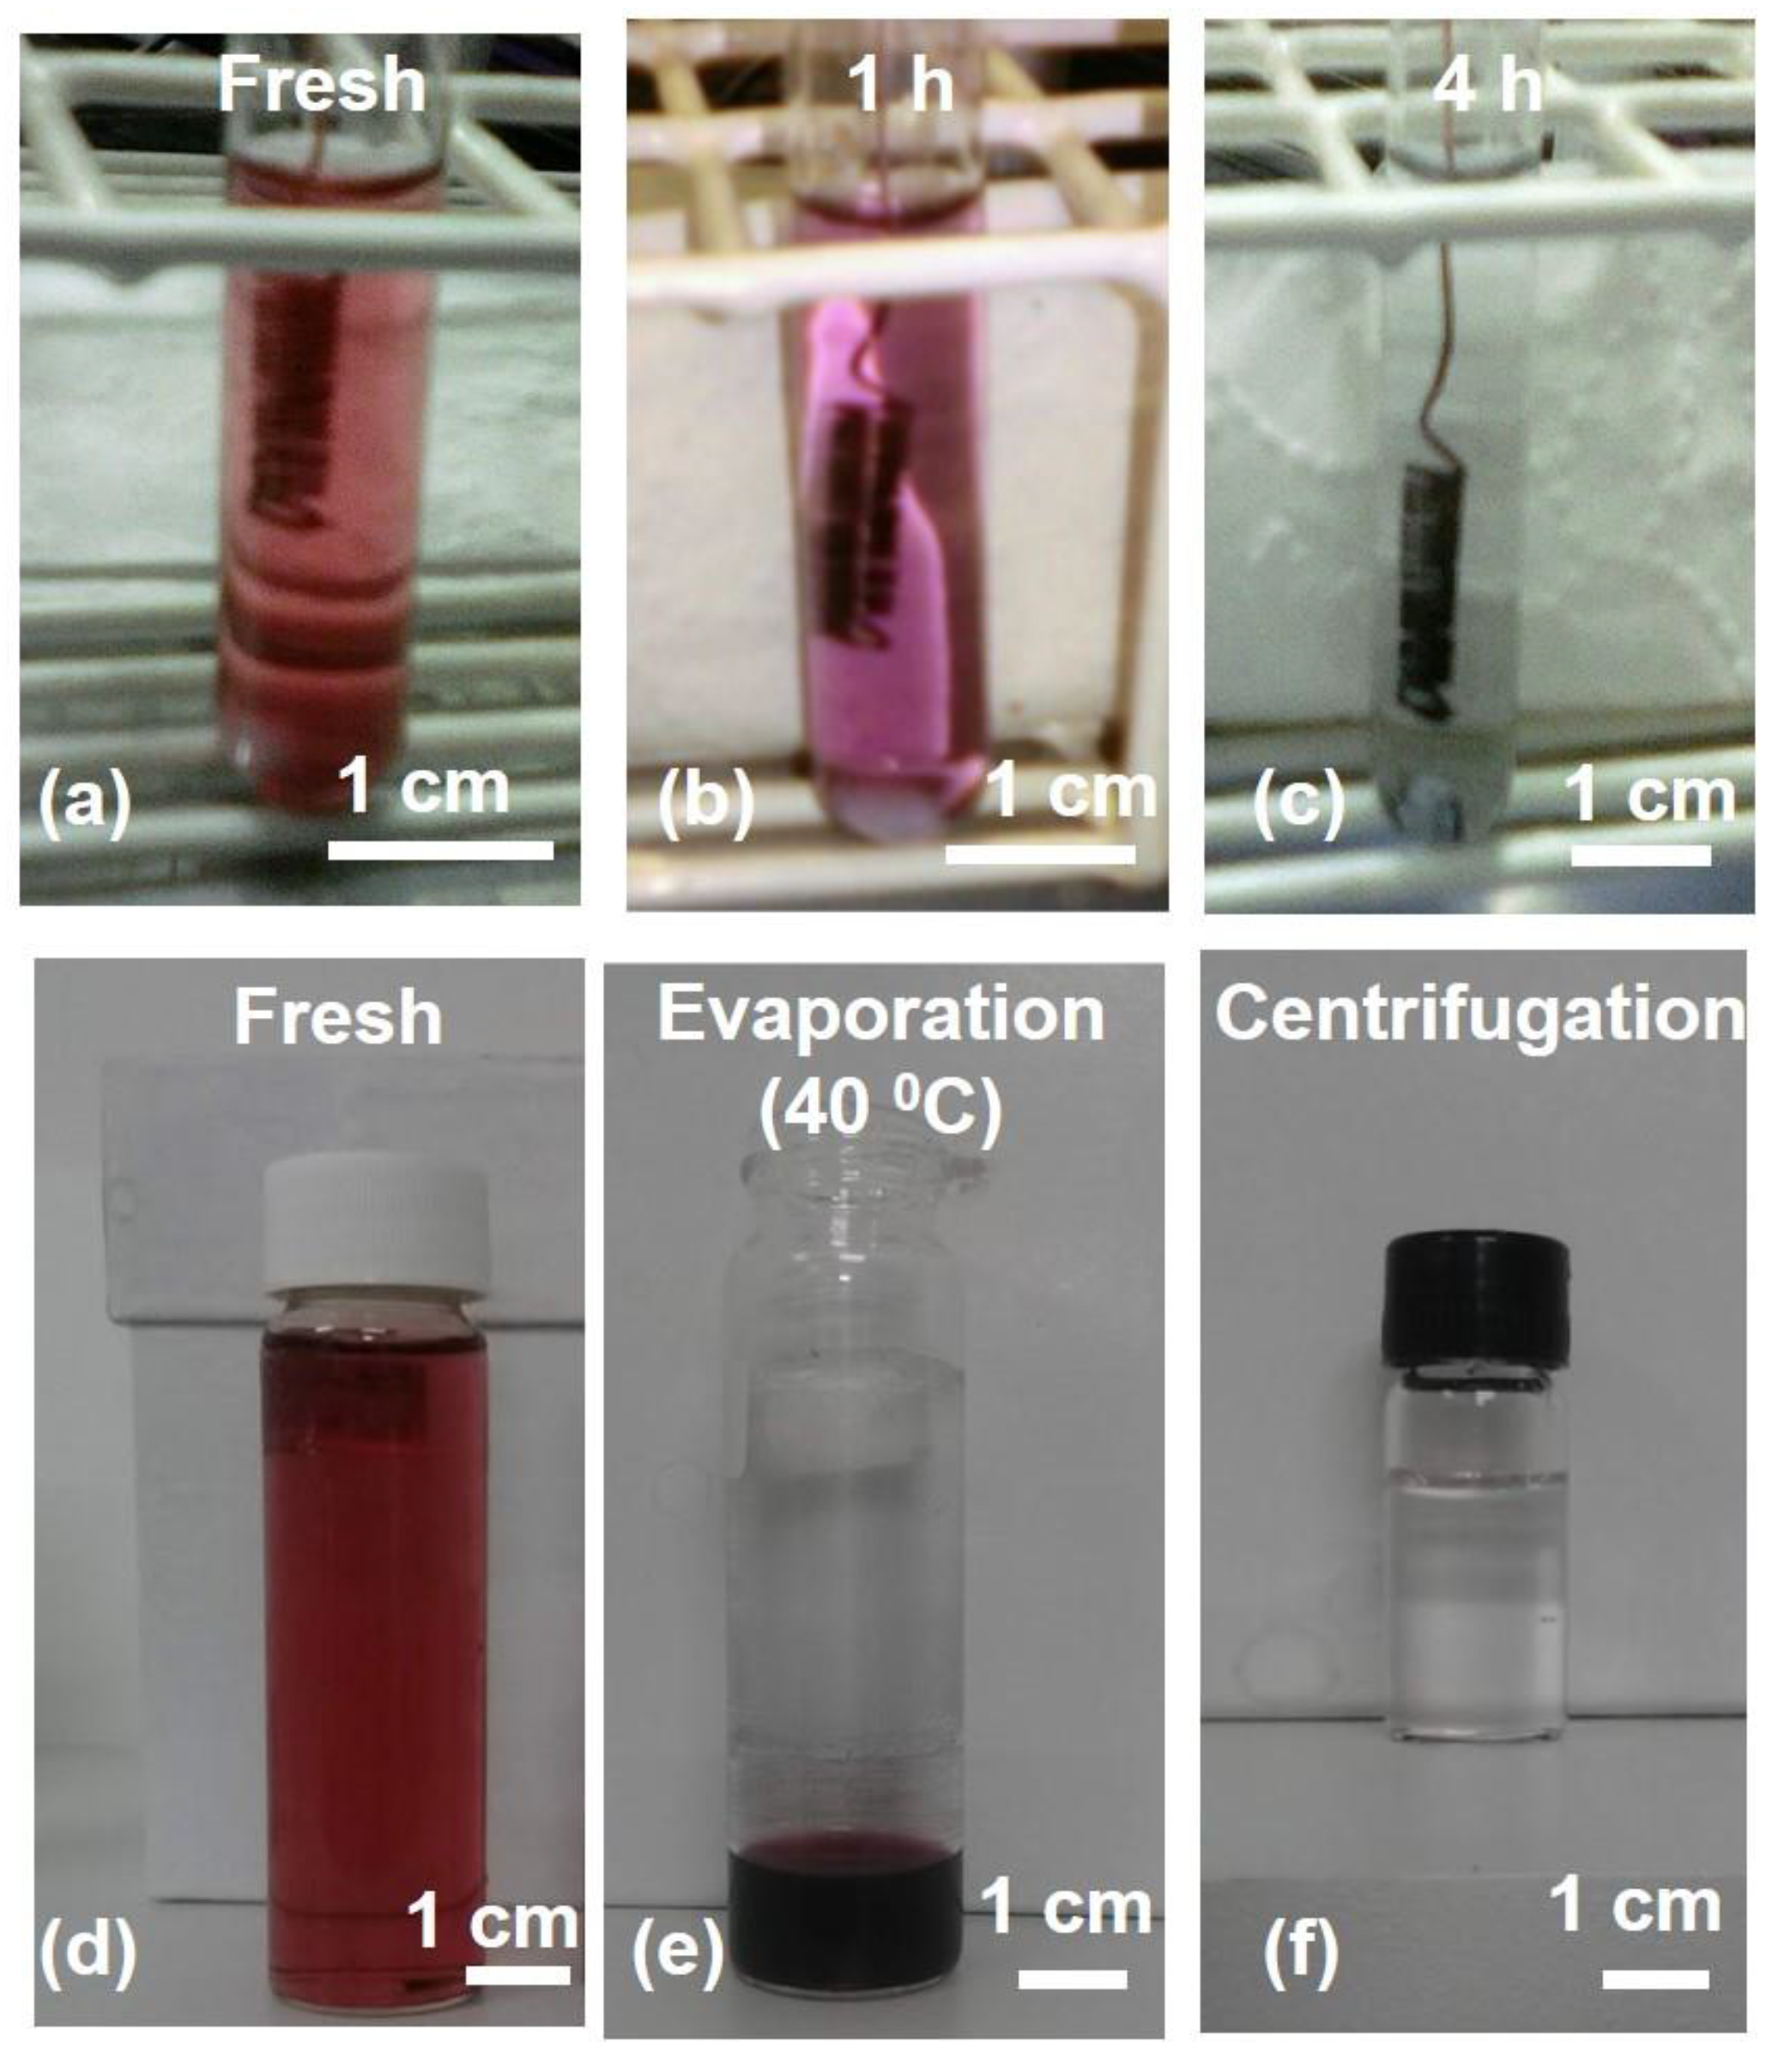
3.1. Bleaching of the Fresh Colloidal Dispersion of Gold Nanomaterial

In order to observe the PL of the AuNCs, it is necessary to separate them from the AuNPs with an LSPR band in the visible range, as previously reported in [29]. This step is fundamental because the PL may have a spectral overlap with both the LSPR band and the interband transition of metallic gold [26,28,29], which might shadow the emission of the gold transparent clusters.
In Figure 1, the change in color of the gold colloidal dispersion of nanomaterial is shown throughout the process of bleaching by grounding (a–c), and bleaching by evaporation followed by centrifugation (d–f). Figure S1 shows photos corresponding to the bleaching process of the dispersion by salt addition. In all three cases, it is clearly visible that the final sample is transparent, showing that the gold present in the solution does not have an LSPR band [29]. In the bleaching by evaporation and centrifugation process, the water content decreased by a factor of 10. To make comparative measurements (Au concentration and PL), the dispersions obtained using the other two separation processes were also concentrated by a factor of 10. Then, the Au concentration in the transparent concentrated dispersions was measured by inductively coupled plasma mass spectroscopy (ICPMS) and compared with the original fresh and ruby colloidal dispersion of gold nanomaterial. The results are listed in Table 1.
In terms of metal concentration, we can see that the worst results (higher value) are obtained by the precipitation with NaCl. In the other two cases, the final concentration of the samples is of the order of some tens of ppb, showing greater efficiency in the precipitation of gold. Although the precipitation by centrifugation or the addition of salt can be considered as classical methods, the grounding method is quite new, and can only be applied for AuNPs synthesized by PLA in water. The origin of this peculiar behavior has been elucidated by Palazzo et al. [31], who noticed that the charge of the AuNPs synthesized by PLA was decreasing after the interaction with a grounded electrode, showing that the core of the AuNPs is charged by an excess of free electrons, present together with different ions within the plasma phase during PLA.

3.2. Dimensions and Extinction Properties of the Gold Nanomaterial before after the Bleaching

In Figure 2a are the extinction spectra of gold nanomaterial before and after the bleaching. Before the separation, we can observe the classical LSPR band of the AuNPs, centered at 515 nm [28], which is responsible for the reddish color of the colloidal dispersion, as shown in Figure 1d.
After bleaching by evaporation and centrifugation, the samples are transparent and characterized by an extinction band at 270 nm, which may be ascribed to the quantization of energy of the AuNCs’ metallic core, in agreement with DFT calculations on the Au38(OH)24(O) clusters [29,34]. In Figure 2 are typical TEM images of the samples before (b) and after (c) being submitted to bleaching. Considering the fresh sample, although the average radius of the nano colloids was 3.4 nm, it can be inferred from the image that several particles are present with a radius smaller than 2 nm. These smaller gold colloids, which are actually the AuNCs, are well visible after the bleaching process in Figure 2c, with an average radius of about 1.7 nm.
These results show that employed method of synthesis and separation leads to the production of AuNCs with dimensions slightly bigger than those reported in [29]. Such a difference might be explained as the protocols used were not exactly the same. In [29], the AuNCs were synthesized by a two-step irradiation process. The first step was the ablation of the gold target in deionized water with pulses at 1064 nm, and the second step was stabilization by the addition of NaOH and fragmentation in a free liquid jet reactor set-up [29], using laser pulses at a wavelength of 532 nm. The free liquid jet reactor set-up is extremely useful, especially at high frequency rates of the pulses, in order to obtain a lower average dimension and polydispersitivity of the AuNPs in a short time, and perform photofragmentation homogeneously over the whole liquid sample [29,35]. In the present work, we simply ablated the target in a fixed position for a long time (6 h), directly with pulses at 532 nm, and in the presence of NaOH [26,28]. In this condition, probably only part of the colloidal solution is indeed subject to the fragmentation process, whose identification is difficult due to the absence of surfactants, generally used to stabilize the gold ions produced by the fragmentation [36]. Hence, although the long time of the ablation process should enhance the number of AuNPs that absorbed energy from more than one pulse [35], it is not surprising that the transparent AuNCs synthesized in the present research have slightly higher dimensions than the ones reported in [29].

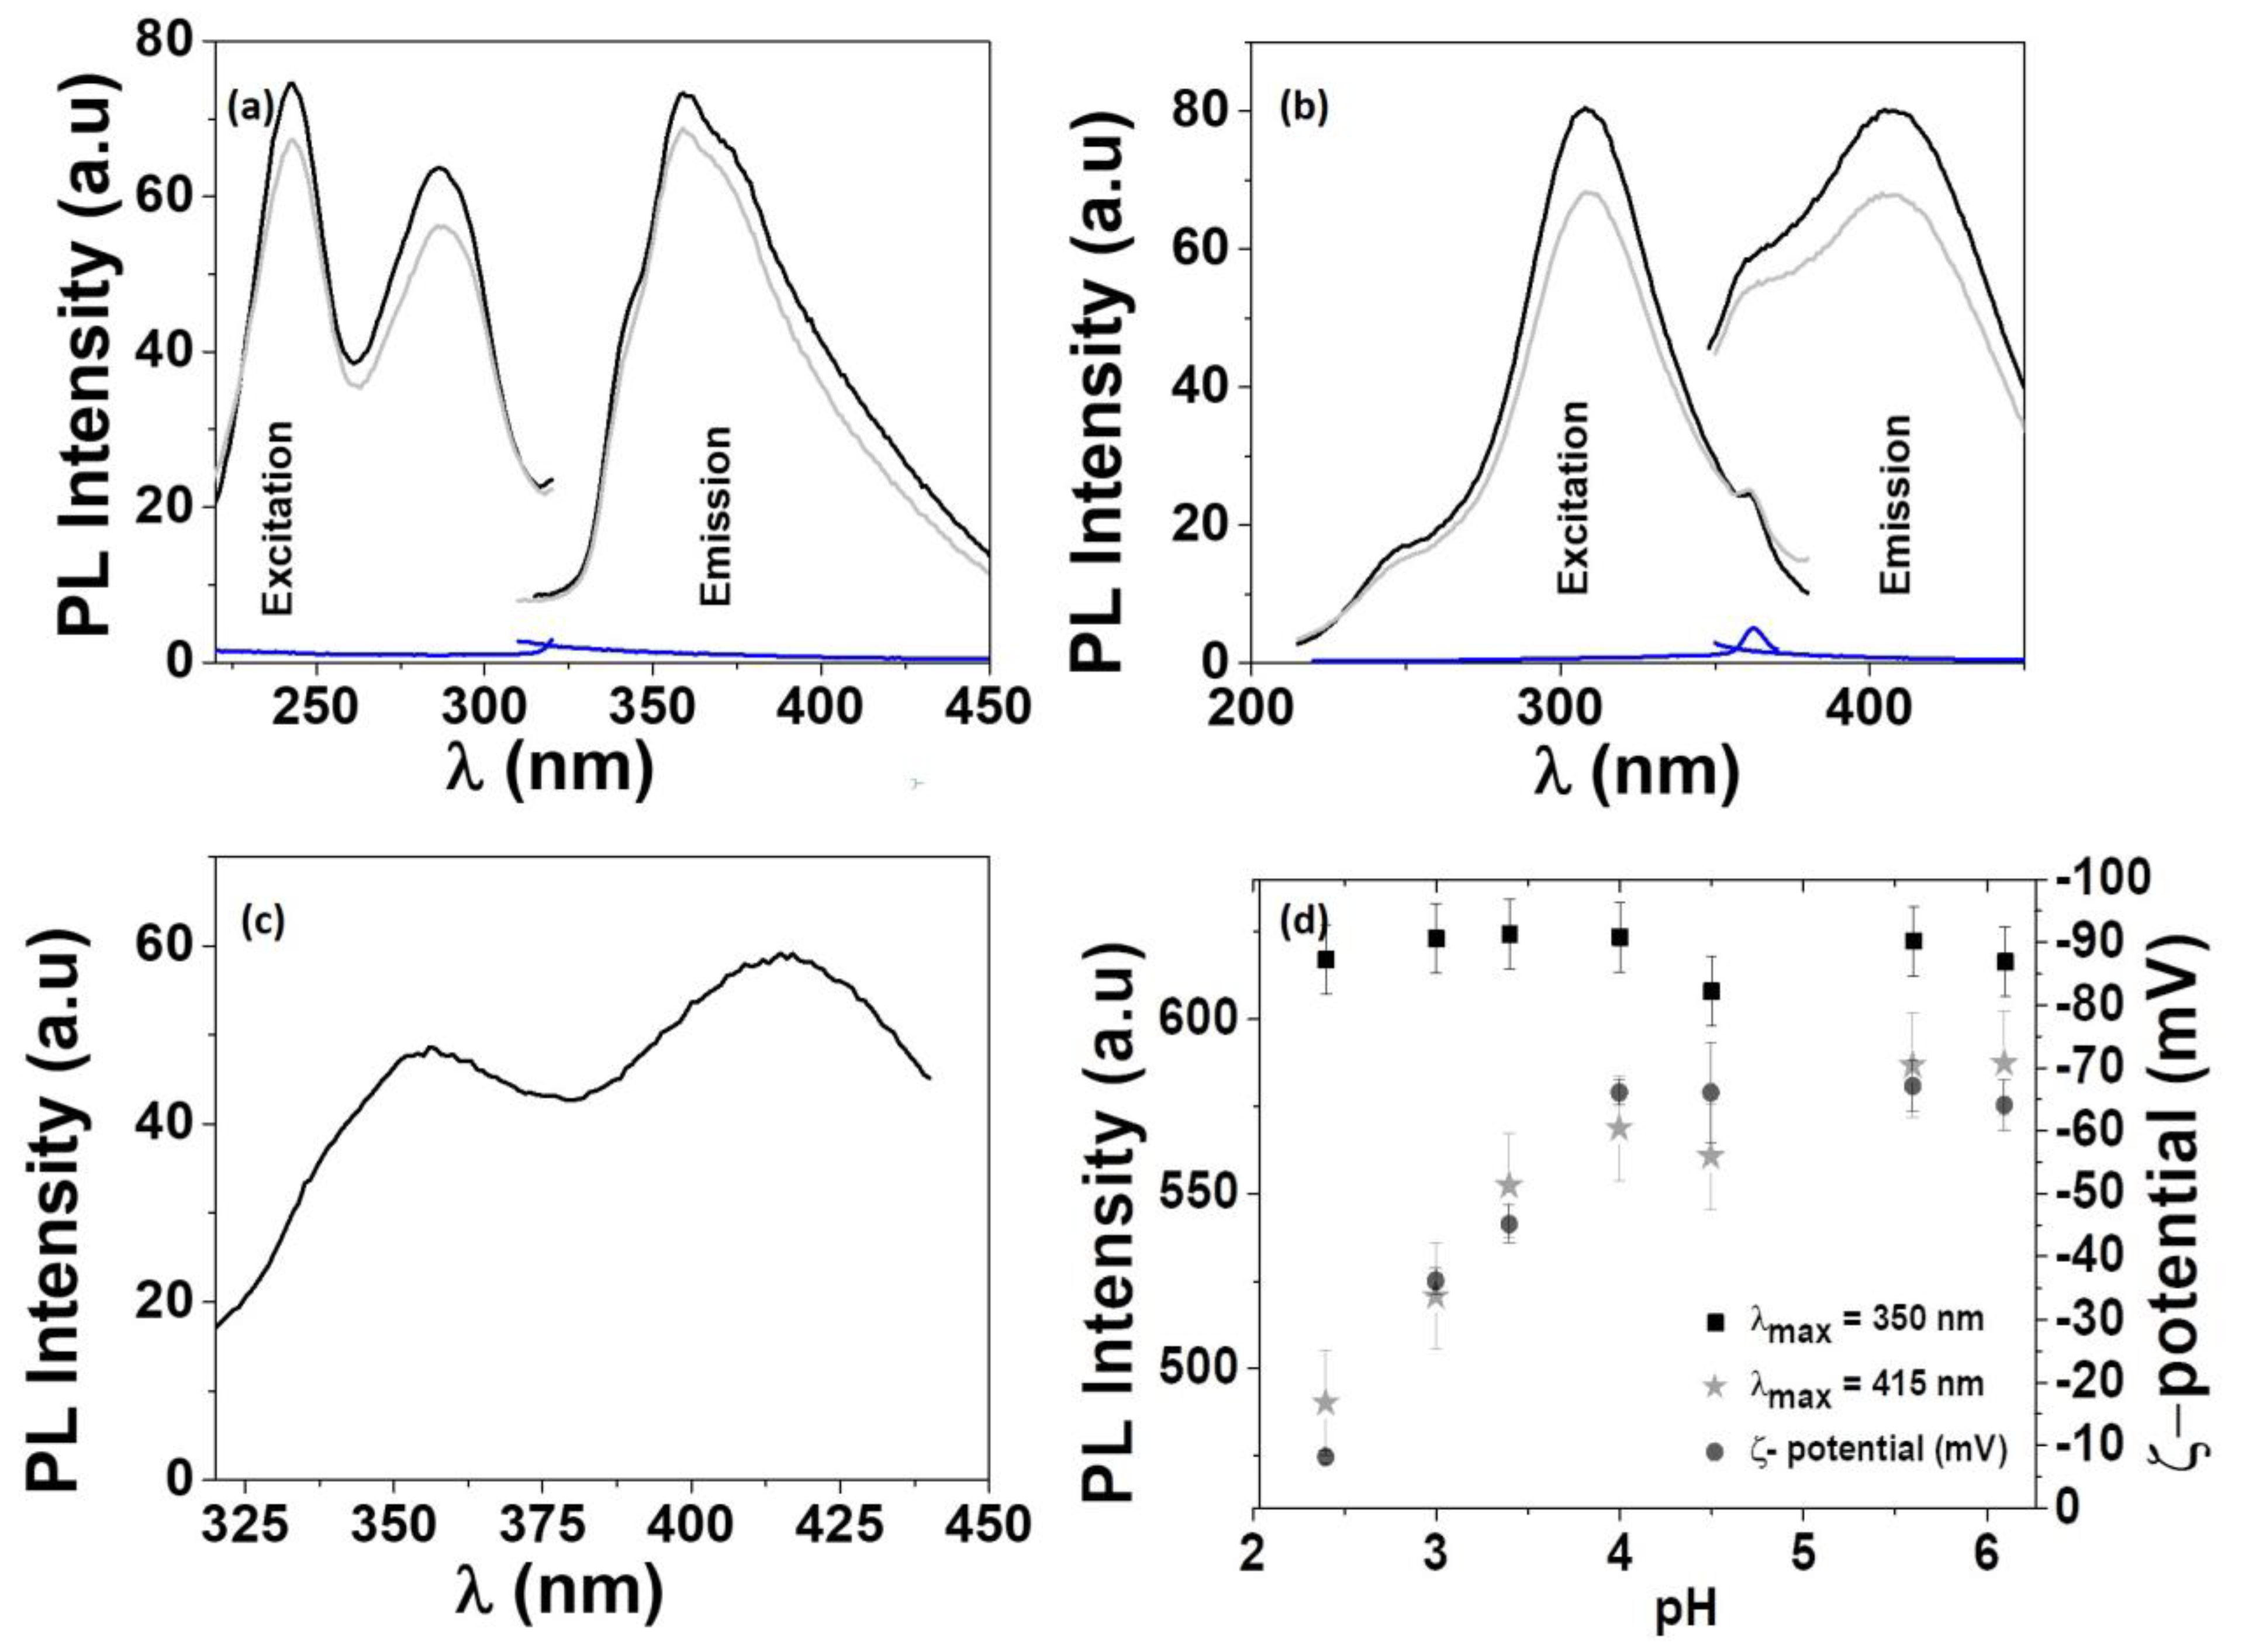
3.3. Characterization of the AuNCs by HRTEM and Photoluminescence Spectroscopy

Similarly, as reported in [29], the AuNCs are luminescent and present two distinct emission peaks at the wavelength of about 360 nm (near-UV region), when excited near 250 nm (Figure 3a), and of about 415 nm (visible region), when excited at 315 nm (Figure 3b). It is possible to observe both the UV and visible emissions together in a single spectrum if the excitation of AuNCs is performed at 285 nm, as shown in Figure 3c.
The PL in the near-UV region is characterized by two excitation peaks, one at 250 nm and the second at 285 nm, which is generally characteristic of excitation transfer [37] between a donor and an acceptor system. For the blue emission band, it can be seen in Figure 3b that there is a small overlap with the UV emission band, which is responsible for the shoulder observed at around 365 nm. Since it is reported in the literature that NaOH water solutions produce a concentration-dependent PL near 400 nm [38], we also measured the emission spectra of a reference NaOH water solution at the concentration of 20 mmol L−1. As reported in Figure 3a,b, we did not observe any significant luminescence.
Before studying the interaction of the HMI with the AuNCs, the colloidal dispersion was purified by a dialysis process for 5 days (see Section 2.4 for details), which minimized the NaOH content and kept the intensity in emission spectra practically unaltered in both UV and blue regions.
In Figure 3d is the modulation of the ζ-potential and PL intensity at the emission peaks of 360 nm and 415 nm, depending on the pH of the water environment approximatively between 2 and 6.
Both surface charge and the visible PL are reduced with acidification of the colloidal dispersion. In contrast, almost no change was observed in the UV emission intensity after pH reduction.
Following the ζ-potential measurements, the potential rises from (−130 ± 7) mV for the fresh gold colloids to (−69 ± 5) mV for the AuNCs after purification by dialysis. The pH drops even lower after the introduction of the aliquots of 5 ppm HMI acidic solution, and after the addition of about 600 ppb of Hg+, it reaches the value of 3.1. At this pH, the potential of the AuNCs is about −15 mV, and the PL in the visible region decreases by about 10%.
As anticipated, similar bands in UV and blue regions were observed by A. R. Ziefuss et al. [29], who attributed the UV emission to fully inorganic clusters of the order of 1 nm, and the blue emission to bigger AuNCs. In their study, the UV emission intensity was not dependent on the pH. In our case, clusters of the order of 1 nm were rarely observed by HRTEM, probably due to experimental limitations or the different experimental approach used for the synthesis, as explained in Section 3.2. Further HRTEM images of the AuNCs together with EDX elemental analysis are shown in Figure 4.
EDX measurements detected the presence of gold and oxygen, while in Figure 4b, the plane (200) of face-centered cubic gold in a small AuNC of about 2.5 nm is highlighted, with an interplanar distance of 0.19 nm [39]. These results, together with the ζ-potential dependence on pH shown in Figure 3d, are a direct consequence of the classical pH-dependent ratio of AuO/AuOH groups in AuNPs synthesized by PLA in water [27], confirming the presence of gold oxide nanoclusters, similar to what was reported in [29].

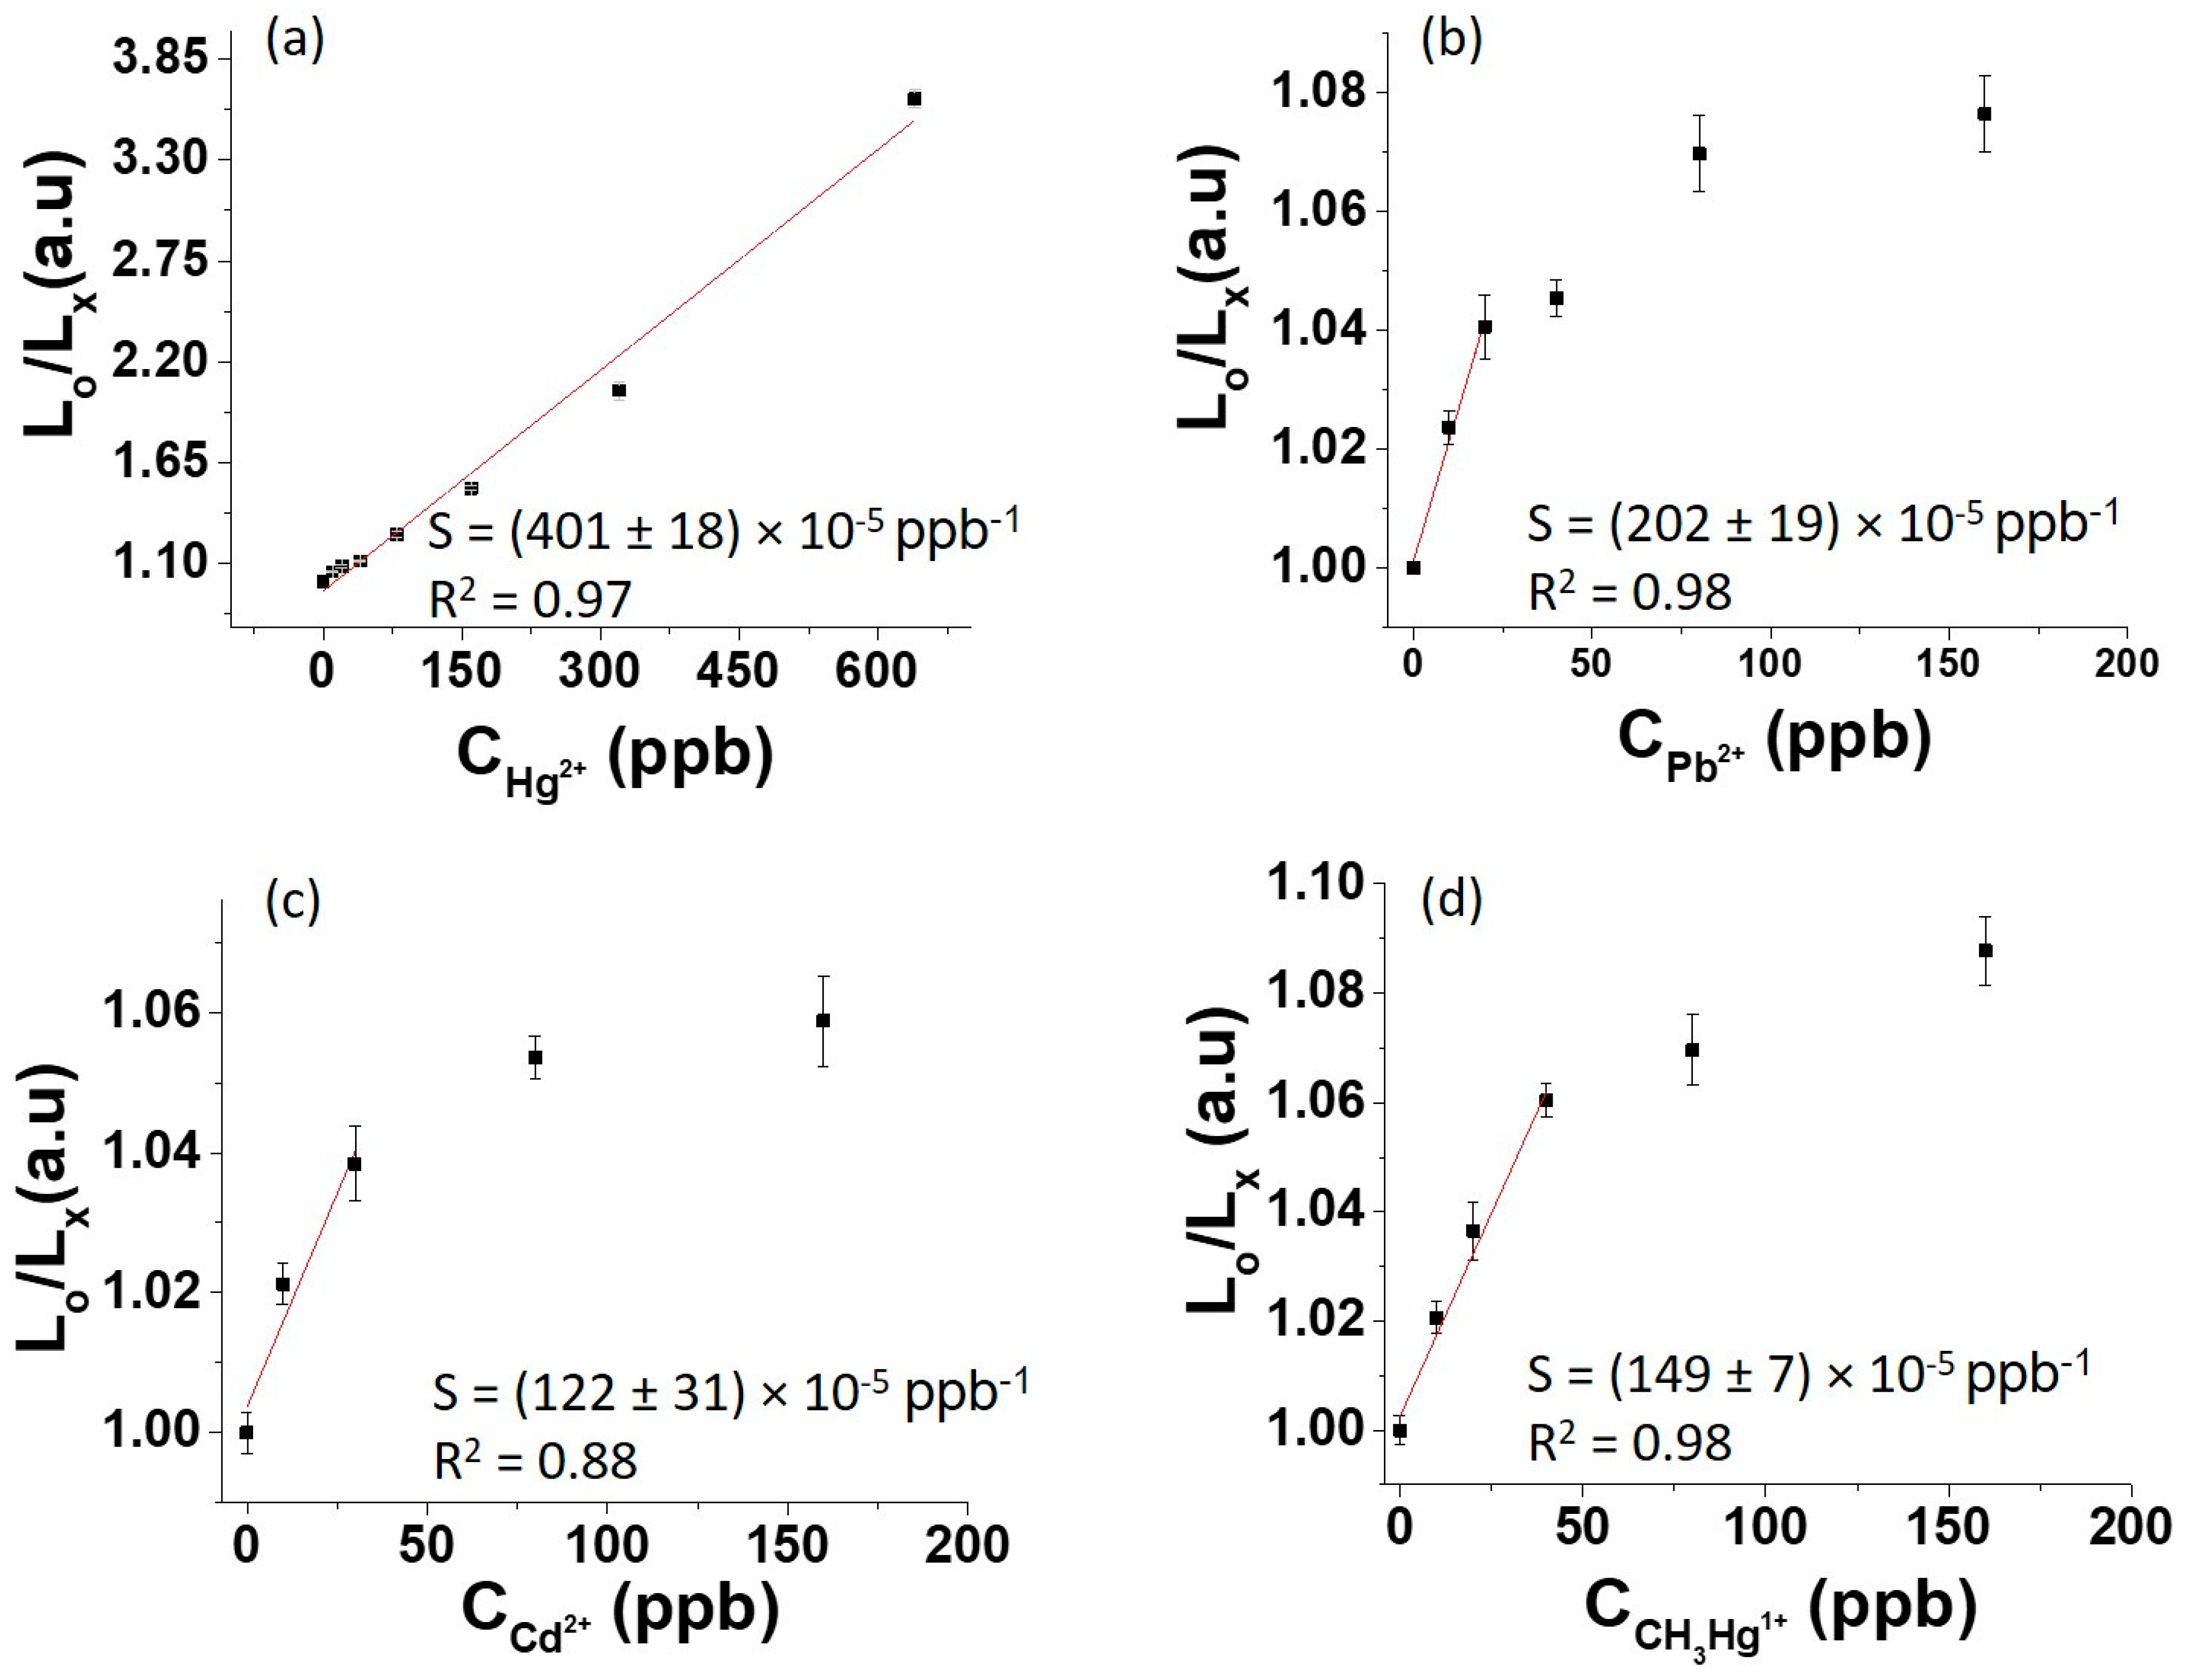
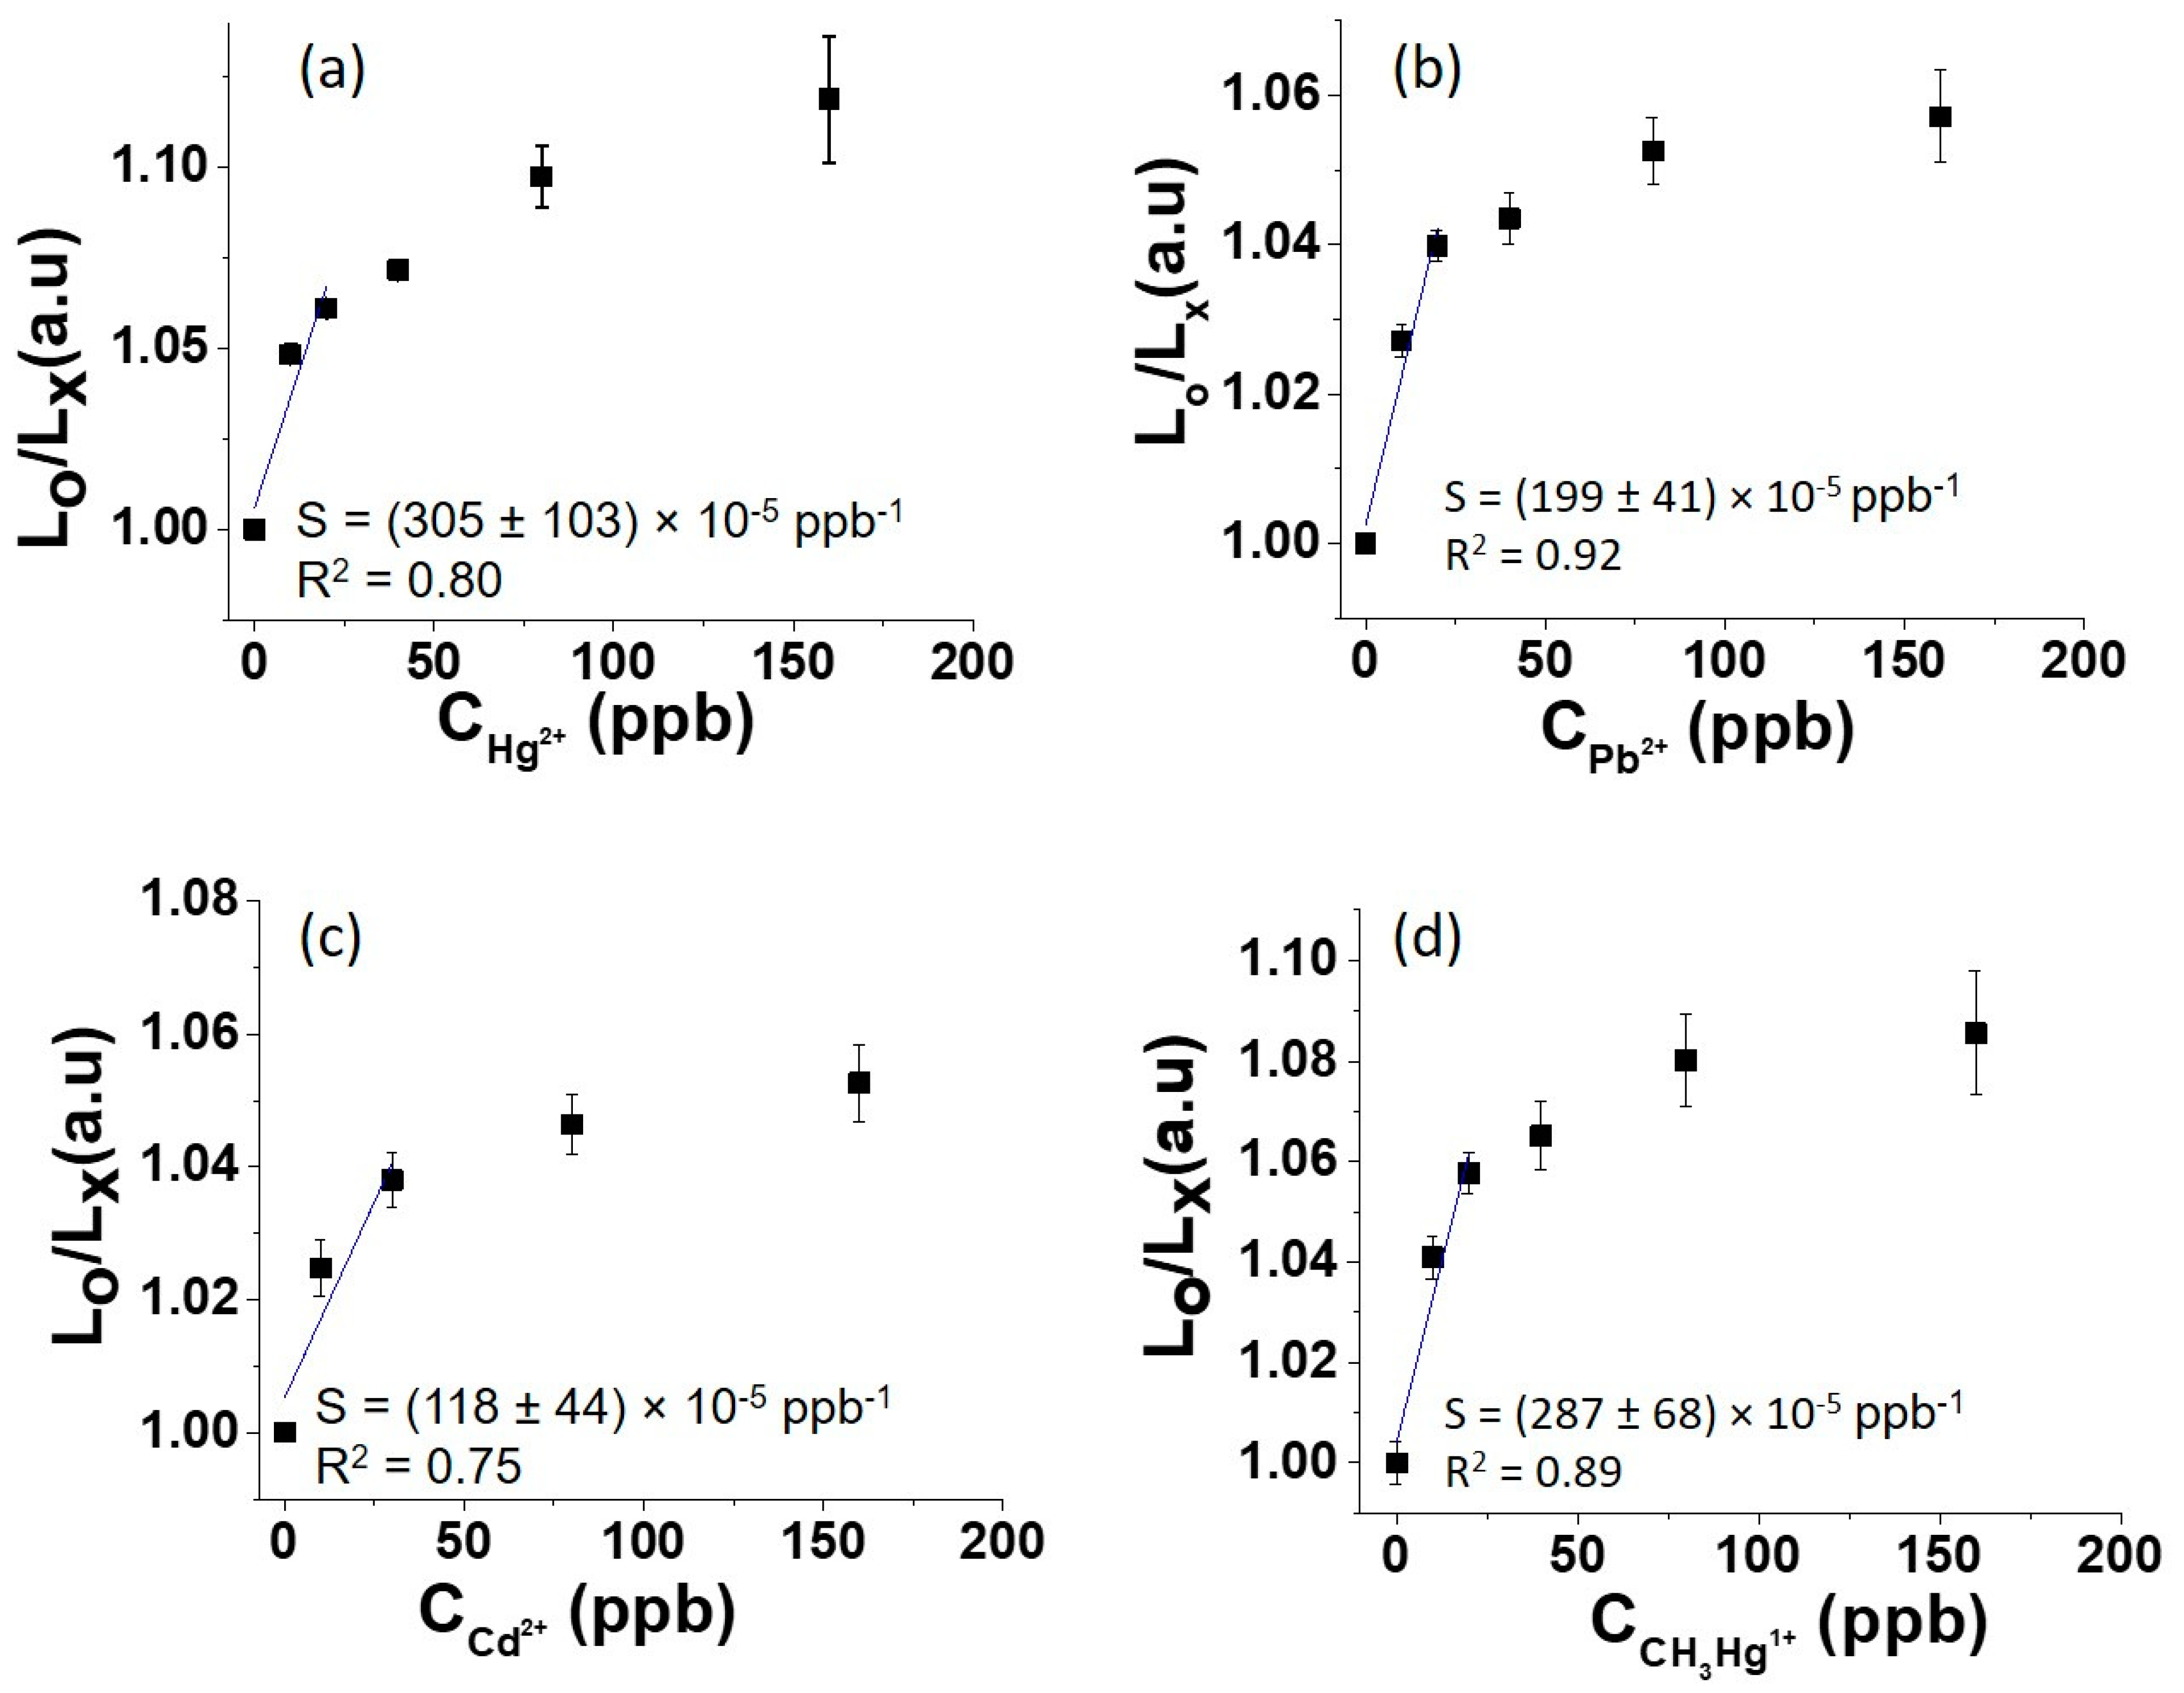
3.4. Quenching of the Photoluminescence of the AuNCs upon Interaction with the HMI

The purified AuNCs were tested as PL probes for different HMIs (Hg2+, Pb2+, Cd2+ and CH3Hg+), evaluating the effect arising from the interaction between the nanomaterial and the analytes. As explained in Section 2.6, the interaction with the HMI is observed through the quenching of the PL of the nanoclusters. The quenching was investigated independently for the UV and blue emissions. Figure 5 and Figure 6 show the variation of Lo/Lx as a function of the concentration of the HMI (C). The error bars were established as authentic replicates of the measurements made on different days on different samples. The full spectra obtained upon interaction with the HMI are reported in Figures S2 and S3 for UV and visible emissions, respectively. In Figure S4 are the PL spectra used for the evaluation of the standard deviation σ of the maximum PL intensity.
The results are shown in Table 2 for both the UV and visible (blue) emissions, reporting the sensitivity, limit of detection and linearity range for all the HMIs. The LOD was evaluated using Equation (1), since σ I o I = σ L 0 0.013 < < 1 for both UV and visible emissions, as reported in the Supplementary Material.
We started the measurements with a minimum metal analyte concentration of 10 ppb, which is five times the maximum level of Hg2+ ion allowed in drinkable water by the World Health Organization (WHO) [40] and the U.S. Environmental Protection Agency [41]. We successfully detected this minimum quantity of HMI by both UV and blue emission for all the HMIs. From Table 2, it can be seen that the AuNCs show a slightly better sensitivity and linearity range (Cmax) and LOD for emission in the UV region, considering all the ions.
One of the most interesting results is the linear range. All the HMIs but the Hg2+ ion show a limited linear range, showing saturation of the quenching around 20 ppb for both UV and blue emissions, with a quenching of less than 10%. It is clear from Table 2 that the best results are obtained for the Hg2+ ion using the UV band, with maximum sensitivity, maximum PL quenching of 75% in a linear range extending up to 640 ppb, and a limit of detection of 3 ppb. The latter represents the concentration of analyte that can be detected as a clearly measured signal (above instrumental background), leading to a limit of quantification of about 10 ppb, which was hence used as the first concentration of the analytical curve [33].
Moreover, only the Hg2+ ions induce PL quenching for concentrations higher than 20 ppb, at least among the HMIs considered in the present research. The latter result is particularly interesting, since it points to a different kind of interaction of the mercury II ion with the clusters emitting in the UV region.
The electrostatic interaction between the oppositely charged HMI and AuNCs should be low in our experimental conditions, since the measurements were performed in acidic conditions, with pH ranging from 6 to 3.1. In these conditions, the negative charge on the AuNCs is low (ζ-potential increases from −69 ± 5 mV in deionized water to −16 ± 2 in pH = 3.1), and may be rapidly shielded by the introduction of positive charges. We suppose that this weak electrostatic interaction might be responsible for the low PL quenching observed for the ions other than Hg2+, both for UV and blue emission bands. The quenching in this case would happen through electron transfer from the excited AuNCs and the HMI, which induces a non-radiative decay of the exciton.
Differently, we propose a mechanism of quenching of the PL in the UV by Hg2+, based on the formation of metallophilic interactions between the closed-shell 4f145d10 of Hg2+ and 4f145d10 of Au+, as reported in [14,17,42]. AuO+ is in fact the most abundant oxide on the surface of AuNPs synthesized by PLA [23,27]. Since the visible PL clusters are not sensitive to Hg2+ for concentrations higher than 20 ppb, we suppose that UV- and visible-emitting gold clusters have different contents of gold oxides, but we cannot exclude the possibility of the AuNCs emitting in the visible region being covered partially by inorganic or organic molecular groups produced during the PLA in NaOH water solution [26,28], preventing the interaction of the oxides with the mercury ion.
Of course, other works in the literature report about the quenching of the PL of AuNCs after interaction with mercury II ion. Therein, the interaction happens with a ligand functionalizing the surface of the cluster [8,16], or by ligand-free metallophilic bonding between Hg2+ and Au+ (4f145d10) [14,15,17]. Table 3 gives a comparison of the performance in the quenching of PL due to metallophilic bonding of mercury II ions with Au+ oxide in AuNCs, as reported in the literature. As shown, an LOD in the range of 1 nmol L−1 or smaller is reached. The AuNCs synthesized in the present research present an LOD and range of linearity similar to folic acid or trypsin-stabilized AuNCs synthesized by chemical routes [15,43]. In terms of sensitivity, linear range and LOD, the quenching performances of our nanoprobes are comparable with those of AuNCs synthesized by complex chemical protocols.
From a more fundamental point of view, the interaction between closed-shell orbitals ions or atoms (such as d10) is used to create heterometallic species based on metallophilic bonding, comparable in strength to typical hydrogen bonds [46], and both Au(I)/Hg(II) and Au(I)/Pb(II) complexes have been synthesized in the literature [47,48]. Ab initio calculations between d10-d10 systems do not reveal any attraction at the Hartree–Fock level [46,49], so the interaction is today interpreted at the quantum level as due to electron correlation effects [49,50,51]. In particular, electron d10-d10 correlation effects between Au(I) and Hg(II) species are so effective that they are recognized as an intermolecular glue [52], and other photoluminescent Au(I)-based nanoprobes report specificity of quenching upon interaction with Hg2+ ions rather than Pb2+ [14]. The reasons for this particular behavior are not well understood. A possible contribution could be from relativistic effects such as the expansion of the d orbitals, which strengthens the interaction of Au(I) with both Hg2+ and Pb2+ ions [46,53], and is particularly effective in Au(I)/Hg(II) heterometals [47]. A second possible reason, assuming to model the UV-emitting moieties as Au38(OH)24(O) clusters [29,34], might be a particular effect of the Au(I) and Hg(II) interaction in the quenching of photoluminescence, due to the changes in the overlap of the HOMO–LUMO associated with the exciton, resulting in lower transition dipole moments. Considering that the quantum mechanical approach is the basis of both metallophilic interaction and photoluminescence of fully inorganic nanoclusters, dedicated density functional theory calculations appear fundamental to paint a better picture of the particular quenching of the AuNCs upon interaction with mercury II ions.
Another point that deserves future investigation is the effect of the AuNCs’ dimensions on the photoluminescence quenching. According to R. Ziefuss et al. [29], the mechanisms associated with UV or visible (blue) emission are distinguished. In fact, while the core states of the AuNCs are responsible for the visible emission, the UV photoluminescence is associated with the smaller AuNCs (diameter ≤ 2 nm), characterized by a higher surface to volume ratio, and with the majority of the atoms located at the metal–liquid environment interface. For this reason, the UV emission has been associated with surface states extremely sensitive to the presence of defects [54] and to the possible metallophilic bonding with d10 closed-shell ions. In this case, it appears reasonable to suppose that the photoluminescence quenching might be higher for the smallest clusters of the order of 1 nm, which might be properly selected with a resolution of about 0.1 nm by the use of ultracentrifugation together with centrifugal filters [29]. This approach would eventually be the key for the future development of portable sensors based on the quenching of the photoluminescence of the clusters with an LOD lower than 3 ppb. Future research will also be dedicated to investigate the possibility of developing Hg2+ sensors based on the specific quenching of the PL of AuNCs (synthesized by PLA) that occurs after the probe is no longer responsive to other ions. In this sense, it is possible to load the sensor with known concentrations of other HMIs up to saturation (in a strategy called interference buffering), enabling the unique response to mercury II ions.

4. Conclusions

We synthesized colloidal dispersions of gold nanomaterial by PLA of a gold target in water with NaOH, with pulses at the wavelength of 532 nm. Using different green approaches for the bleaching of the nanomaterial, we were able to obtain AuNCs with intense photoluminescence in both UV and visible (blue) regions, and a metal concentration of the order of some tens of ppb. From HRTEM and EDX measurements, we observed that the AuNCs oxidized and had an average diameter of about 3 nm. The interaction between the AuNCs and different toxic metal ionic species (Hg2+, Pb2+, Cd+1, CH3Hg+1) was investigated, and we observed the quenching of the photoluminescence in the presence of the analytes in water. A range of linearity up to 20 ppb was observed for all the ions both in UV and visible emission, with the exception of the mercury II ion. In this specific case, the UV photoluminescence of the AuNCs was quenched, producing a linear response with concentrations up to 640 ppb (producing a maximum quenching of about 75%), indicating a wide dynamic linear response range for this analyte, and a limit of detection of about 3 ppb (limit of quantification of 10 ppb). The results are explained on the basis of a metallophilic interaction between Hg2+ and the Au+ ions on the surface of the UV-emitting AuNCs, and demonstrate that the AuNCs synthesized by PLA are an attractive nanomaterial to be tested for the development of a selective optical sensor for toxic metal ion species, but specially for Hg2+, as the analytical response, in terms of a wide concentration range, is differentiated from the responses found for the other toxic metal ions tested. Although the limit of detection reported in the present work is slightly above the maximum concentration set by the EPA, the proposed sensor is able to indicate the presence of toxic metal species at low levels. Therefore, the sensor is effective for simple and low-cost screening of samples, allowing the identification of those of concern, which must be further evaluated using more specific and sensitive methods. Future efforts will be directed towards Hg2+ specificity and lower LOD of the nanoprobes by the application of interference buffering strategies and by the selection of ultrasmall (<1 nm) AuNCs.

Supplementary Materials

The following supporting information can be downloaded at: https://www.mdpi.com/article/10.3390/chemosensors11020118/s1, Figure S1: Photos demonstrating the method of bleaching of the gold nanomaterial via agglomeration by NaCl and dialysis. (a) The nanomaterial just after adding NaCl. (b) Schematic diagram of dialysis of nanomaterial. (c) Transparent colloidal dispersion of the photoluminescent AuNCs after dialysis. Figure S2: Full emission spectra during the quenching of the photoluminescence of the AuNCs in the ultraviolet (UV) region upon interaction with (a) Hg2+, (b) Pb2+, (c) Cd2+ and (d) CH3Hg1+. Figure S3: Full emission spectra during the quenching of the photoluminescence of the AuNCs in the visible (blue) region upon interaction with (a) Hg2+, (b) Pb2+, (c) Cd2+ and (d) CH3Hg1+. Figure S4: Blank emission spectra (before the injection of the HMI) of the AuNCs used for the determination of the standard deviation σ I o I .

Author Contributions

Paper writing: T., T.D.R. and G.M. (Giancarlo Margheri). Paper revision: T., Q.Z., G.C.C., M.G., T.D.R., G.M. (Giancarlo Margheri), R.K., F.L.F.J., R.Q.A., N.D., G.M. (Gino Mariotto), T.D.S. and M.C. Financial support: T.D.R., G.M., F.L.F.J. and G.M. (Gino Mariotto). Grant support: F.L.F.J. Infrastructure support: T.D.R., F.L.F.J., R.Q.A. and M.C. Synthesis of gold nanoparticles by PLA: T., T.D.R. and G.M. (Giancarlo Margheri). Bleaching of the gold nanoparticles: T., Q.Z., G.C.C., M.G. and S.A. Electron microscopy: T., Y.E.L. and G.P. UV–Vis spectroscopy and ICPMS: T., T.D.S., Q.Z., G.C.C., M.G. and S.A. Ion sensing by PL spectroscopy of gold nanoclusters: T., J.d.S.P., C.A.T.T., R.Q.A., N.D., R.S.C. and M.C. Data analysis and elaboration: T., J.d.S.P., C.A.T.T., R.Q.A., N.D., G.M. (Giancarlo Margheri), G.M. (Gino Mariotto), T.D.R. and R.K. All authors have read and agreed to the published version of the manuscript.

Funding

This study was financed in part by the Coordenação de Aperfeiçoamento de Pessoal de Nível Superior—Brasil (CAPES)—Finance Code 001. Funding from FAPERJ for processes E-26/010.000980/2019, E-26/211.180/2019 and E-26/211.540/2021 is acknowledged. We also acknowledge CNPq and the Instituto Nacional de Engenharia de Superfícies (INCT-INES) (processes 423349/2018-0 and 465423/2014-0).

Data Availability Statement

The authors are available to send the research data upon request ([email protected]).

Acknowledgments

The authors thank LABNANO/CBPF for technical support during electron microscopy measurements.

Conflicts of Interest

The authors declare no conflict of interest.

References

  1. Jin, R.; Zeng, C.; Zhou, M.; Chen, Y. Atomically precise colloidal metal nanoclusters and nanoparticles: Fundamentals and opportunities. Chem. Rev. 2016, 116, 10346–10413. [Google Scholar] [CrossRef] [PubMed]
  2. Du, Y.; Sheng, H.; Astruc, D.; Zhu, M. Atomically Precise Noble Metal Nanoclusters as Efficient Catalysts: A Bridge between Structure and Properties. Chem. Rev. 2020, 120, 526–622. [Google Scholar] [CrossRef] [PubMed]
  3. Chakraborty, I.; Pradeep, T. Atomically Precise Clusters of Noble Metals: Emerging Link between Atoms and Nanoparticles. Chem. Rev. 2017, 117, 8208–8271. [Google Scholar] [CrossRef]
  4. Chang, H.; Karan, N.S.; Shin, K.; Bootharaju, M.S.; Nah, S.; Chae, S.I.; Baek, W.; Lee, S.; Kim, J.; Son, Y.J.; et al. Highly Fluorescent Gold Cluster Assembly. J. Am. Chem. Soc. 2021, 143, 326–334. [Google Scholar] [CrossRef] [PubMed]
  5. Tao, Y.; Li, M.; Ren, J.; Qu, X. Metal nanoclusters: Novel probes for diagnostic and therapeutic applications. Chem. Soc. Rev. 2015, 44, 8636–8663. [Google Scholar] [CrossRef]
  6. Chen, Y.; Montana, D.M.; Wei, H.; Cordero, J.M.; Schneider, M.; Le Guével, X.; Chen, O.; Bruns, O.T.; Bawendi, M.G. Shortwave Infrared in Vivo Imaging with Gold Nanoclusters. Nano Lett. 2017, 17, 6330–6334. [Google Scholar] [CrossRef]
  7. Qu, X.; Li, Y.; Li, L.; Wang, Y.; Liang, J.; Liang, J. Fluorescent Gold Nanoclusters: Synthesis and Recent Biological Application. J. Nanomater. 2015, 2015, 1–23. [Google Scholar] [CrossRef]
  8. Cui, M.; Zhao, Y.; Song, Q. Synthesis, optical properties and applications of ultra-small luminescent gold nanoclusters. TrAC Trends Anal. Chem. 2014, 57, 73–82. [Google Scholar] [CrossRef]
  9. Deng, H.-H.; Shi, X.-Q.; Wang, F.-F.; Peng, H.-P.; Liu, A.-L.; Xia, X.-H.; Chen, W. Fabrication of Water-Soluble, Green-Emitting Gold Nanoclusters with a 65% Photoluminescence Quantum Yield via Host–Guest Recognition. Chem. Mater. 2017, 29, 1362–1369. [Google Scholar] [CrossRef]
  10. Zhang, X.-P.; Huang, K.-Y.; He, S.-B.; Peng, H.-P.; Xia, X.-H.; Chen, W.; Deng, H.-H. Single gold nanocluster probe-based fluorescent sensor array for heavy metal ion discrimination. J. Hazard. Mater. 2021, 405, 124259. [Google Scholar] [CrossRef]
  11. Zhou, Y.; Ma, Z. Colorimetric detection of Hg2+ by Au nanoparticles formed by H2O2 reduction of HAuCl4 using Au nanoclusters as the catalyst. Sensors Actuators B Chem. 2017, 241, 1063–1068. [Google Scholar] [CrossRef]
  12. Chen, K.-J.; Hsu, I.-H.; Sun, Y.-C. Determination of methylmercury and inorganic mercury by coupling short-column ion chromatographic separation, on-line photocatalyst-assisted vapor generation, and inductively coupled plasma mass spectrometry. J. Chromatogr. A 2009, 1216, 8933–8938. [Google Scholar] [CrossRef] [PubMed]
  13. Suárez-Criado, L.; Queipo-Abad, S.; Rodríguez-Cea, A.; Rodríguez-González, P.; Alonso, J.I.G. Comparison of GC-ICP-MS, GC-EI-MS and GC-EI-MS/MS for the determination of methylmercury, ethylmercury and inorganic mercury in biological samples by triple spike species-specific isotope dilution mass spectrometry. J. Anal. At. Spectrom. 2022, 37, 1462–1470. [Google Scholar] [CrossRef]
  14. Xie, J.; Zheng, Y.; Ying, J.Y. Highly selective and ultrasensitive detection of Hg2+ based on fluorescence quenching of Au nanoclusters by Hg2+–Au+ interactions. Chem. Commun. 2010, 46, 961–963. [Google Scholar] [CrossRef]
  15. Kawasaki, H.; Yoshimura, K.; Hamaguchi, K.; Arakawa, R. Trypsin-Stabilized Fluorescent Gold Nanocluster for Sensitive and Selective Hg2+ Detection. Anal. Sci. 2011, 27, 591–596. [Google Scholar] [CrossRef]
  16. Hu, D.; Sheng, Z.; Gong, P.; Zhang, P.; Cai, L. Highly selective fluorescent sensors for Hg2+ based on bovine serum albumin-capped gold nanoclusters. Anal. 2010, 135, 1411–1416. [Google Scholar] [CrossRef]
  17. Lin, Y.-H.; Tseng, W.-L. Ultrasensitive Sensing of Hg2+ and CH3Hg+ Based on the Fluorescence Quenching of Lysozyme Type VI-Stabilized Gold Nanoclusters. Anal. Chem. 2010, 82, 9194–9200. [Google Scholar] [CrossRef]
  18. Liu, X.; Du, D.; Mourou, G. Laser ablation and micromachining with ultrashort laser pulses. IEEE J. Quantum Electron. 1997, 33, 1706–1716. [Google Scholar] [CrossRef]
  19. Wang, L.; Yin, K.; Deng, Q.; Huang, Q.; He, J.; Duan, J. Wetting Ridge-Guided Directional Water Self-Transport. Adv. Sci. 2022, 9, 2204891. [Google Scholar] [CrossRef]
  20. Tahir, T.; Pandoli, O.G.; Zaman, Q.; Concas, G.C.; Gisbert, M.J.d.S.; Cremona, M.; Freire, F.L.; Carvalho, I.C.S.; Bevilaqua, P.H.C.; de Sá, D.S.; et al. Thermoelastic pulsed laser ablation of silver thin films with organic metal–SiO2 adhesion layer in water: Application to the sustainable regeneration of glass microfluidic reactors for silver nanoparticles. J. Phys. Commun. 2022, 6, 055005. [Google Scholar] [CrossRef]
  21. Siano, S.; Agresti, J.; Cacciari, I.; Ciofini, D.; Mascalchi, M.; Osticioli, I.; Mencaglia, A.A. Laser cleaning in conservation of stone, metal, and painted artifacts: State of the art and new insights on the use of the Nd:YAG lasers. Appl. Phys. A 2012, 106, 419–446. [Google Scholar] [CrossRef]
  22. Cheung, J.; Horwitz, J. Pulsed Laser Deposition History and Laser-Target Interactions. MRS Bull. 1992, 17, 30–36. [Google Scholar] [CrossRef]
  23. Amendola, V.; Amans, D.; Ishikawa, Y.; Koshizaki, N.; Scirè, S.; Compagnini, G.; Reichenberger, S.; Barcikowski, S. Room-Temperature Laser Synthesis in Liquid of Oxide, Metal-Oxide Core-Shells, and Doped Oxide Nanoparticles. Chem.–A Eur. J. 2020, 26, 9206–9242. [Google Scholar] [CrossRef] [PubMed]
  24. Kalus, M.-R.; Lanyumba, R.; Lorenzo-Parodi, N.; Jochmann, M.A.; Kerpen, K.; Hagemann, U.; Schmidt, T.C.; Barcikowski, S.; Gökce, B. Determining the role of redox-active materials during laser-induced water decomposition. Phys. Chem. Chem. Phys. 2019, 21, 18636–18651. [Google Scholar] [CrossRef] [PubMed]
  25. Simakin, A.V.; Astashev, M.E.; Baimler, I.V.; Uvarov, O.V.; Voronov, V.; Vedunova, M.V.; Sevost’Yanov, M.A.; Belosludtsev, K.N.; Gudkov, S.V. The Effect of Gold Nanoparticle Concentration and Laser Fluence on the Laser-Induced Water Decomposition. J. Phys. Chem. B 2019, 123, 1869–1880. [Google Scholar] [CrossRef]
  26. Del Rosso, T.; A Rey, N.; Rosado, T.; Landi, S.; Larrude, D.G.; Romani, E.C.; Junior, F.L.F.; Quinteiro, S.M.; Cremona, M.; Aucelio, R.Q.; et al. Synthesis of oxocarbon-encapsulated gold nanoparticles with blue-shifted localized surface plasmon resonance by pulsed laser ablation in water with CO2 absorbers. Nanotechnology 2016, 27, 255602. [Google Scholar] [CrossRef]
  27. Sylvestre, J.-P.; Poulin, S.; Kabashin, A.V.; Sacher, E.; Meunier, A.M.; Luong, J.H.T. Surface Chemistry of Gold Nanoparticles Produced by Laser Ablation in Aqueous Media. J. Phys. Chem. B 2004, 108, 16864–16869. [Google Scholar] [CrossRef]
  28. Del Rosso, T.; Louro, S.; Deepak, F.; Romani, E.; Zaman, Q.; Tahir; Pandoli, O.; Cremona, M.; Junior, F.F.; De Beule, P.; et al. Biocompatible Au@Carbynoid/Pluronic-F127 nanocomposites synthesized by pulsed laser ablation assisted CO2 recycling. Appl. Surf. Sci. 2018, 441, 347–355. [Google Scholar] [CrossRef]
  29. Ziefuss, A.R.; Steenbock, T.; Benner, D.; Plech, A.; Göttlicher, J.; Teubner, M.; Grimm-Lebsanft, B.; Rehbock, C.; Comby-Zerbino, C.; Antoine, R.; et al. Photoluminescence of Fully Inorganic Colloidal Gold Nanocluster and Their Manipulation Using Surface Charge Effects. Adv. Mater. 2021, 33, e2101549. [Google Scholar] [CrossRef]
  30. Zaman, Q.; Souza, J.; Pandoli, O.; Costa, K.Q.; Dmitriev, V.; Fulvio, D.; Cremona, M.; Aucelio, R.Q.; Fontes, G.; Del Rosso, T. Two-color surface plasmon resonance nanosizer for gold nanoparticles. Opt. Express 2019, 27, 3200–3216. [Google Scholar] [CrossRef]
  31. Palazzo, G.; Valenza, G.; Dell’Aglio, M.; De Giacomo, A. On the stability of gold nanoparticles synthesized by laser ablation in liquids. J. Colloid Interface Sci. 2017, 489, 47–56. [Google Scholar] [CrossRef] [PubMed]
  32. Mei, Q.; Shi, Y.; Hua, Q.; Tong, B. Phosphorescent chemosensor for Hg2+ based on an iridium(iii) complex coordinated with 4-phenylquinazoline and carbazole dithiocarbamate. RSC Adv. 2015, 5, 74924–74931. [Google Scholar] [CrossRef]
  33. Mocak, J.; Bond, A.M.; Mitchell, S.; Scollary, G. A statistical overview of standard (IUPAC and ACS) and new procedures for determining the limits of detection and quantification: Application to voltammetric and stripping techniques (Technical Report). Pure Appl. Chem. 1997, 69, 297–328. [Google Scholar] [CrossRef]
  34. Jin, R. Quantum sized, thiolate-protected gold nanoclusters. Nanoscale 2010, 2, 343–362. [Google Scholar] [CrossRef] [PubMed]
  35. Ziefuß, A.R.; Reichenberger, S.; Rehbock, C.; Chakraborty, I.; Gharib, M.; Parak, W.J.; Barcikowski, S. Laser Fragmentation of Colloidal Gold Nanoparticles with High-Intensity Nanosecond Pulses is Driven by a Single-Step Fragmentation Mechanism with a Defined Educt Particle-Size Threshold. J. Phys. Chem. C 2018, 122, 22125–22136. [Google Scholar] [CrossRef]
  36. Giorgetti, E.; Giusti, A.; Giammanco, F.; Laza, S.; Del Rosso, T.; Dellepiane, G. Photodegradation of PAMAM G5-stabilized aqueous suspensions of gold nanoparticles. Appl. Surf. Sci. 2007, 254, 1140–1144. [Google Scholar] [CrossRef]
  37. Giorgetti, E.; Cicchi, S.; Muniz-Miranda, M.; Margheri, G.; Del Rosso, T.; Giusti, A.; Rindi, A.; Ghini, G.; Sottini, S.; Marcelli, A.; et al. Förster resonance energy transfer (FRET) with a donor–acceptor system adsorbed on silver or gold nanoisland films. Phys. Chem. Chem. Phys. 2009, 11, 9798–9803. [Google Scholar] [CrossRef]
  38. Villa, A.M.; Doglia, S.M.; De Gioia, L.; Bertini, L.; Natalello, A. Anomalous Intrinsic Fluorescence of HCl and NaOH Aqueous Solutions. J. Phys. Chem. Lett. 2019, 10, 7230–7236. [Google Scholar] [CrossRef]
  39. Reyes-Gasga, J.; Tehuacanero-Nuñez, S.; Montejano-Carrizales, J.M.; Gao, X.; Jose-Yacaman, M. Analysis of the contrast in icosahedral gold nanoparticles. Top. Catal. 2007, 46, 23–30. [Google Scholar] [CrossRef]
  40. Braga, M.S.; Jaimes, R.F.V.V.; Borysow, W.; Gomes, O.F.; Salcedo, W.J. Portable Multispectral Colorimeter for Metallic Ion Detection and Classification. Sensors 2017, 17, 1730. [Google Scholar] [CrossRef] [Green Version]
  41. Li, Y.-L.; Leng, Y.-M.; Zhang, Y.-J.; Li, T.-H.; Shen, Z.-Y.; Wu, A.-G. A new simple and reliable Hg2+ detection system based on anti-aggregation of unmodified gold nanoparticles in the presence of O-phenylenediamine. Sensors Actuators B Chem. 2014, 200, 140–146. [Google Scholar] [CrossRef]
  42. Kim, M.; Taylor, T.J.; Gabbaï, F.P. Hg(II)···Pd(II) Metallophilic Interactions. J. Am. Chem. Soc. 2008, 130, 6332–6333. [Google Scholar] [CrossRef]
  43. Yang, J.-Y.; Yang, T.; Wang, X.-Y.; Chen, M.-L.; Yu, Y.-L.; Wang, J.-H. Mercury Speciation with Fluorescent Gold Nanocluster as a Probe. Anal. Chem. 2018, 90, 6945–6951. [Google Scholar] [CrossRef]
  44. Qiao, Y.; Zhang, Y.; Zhang, C.; Shi, L.; Zhang, G.; Shuang, S.; Dong, C.; Ma, H. Water-soluble gold nanoclusters-based fluorescence probe for highly selective and sensitive detection of Hg2+. Sensors Actuators B Chem. 2016, 224, 458–464. [Google Scholar] [CrossRef]
  45. Wu, X.-J.; Kong, F.; Zhao, C.-Q.; Ding, S.-N. Ratiometric fluorescent nanosensors for ultra-sensitive detection of mercury ions based on AuNCs/MOFs. Analyst 2019, 144, 2523–2530. [Google Scholar] [CrossRef] [PubMed]
  46. Pyykkö, P. Strong Closed-Shell Interactions in Inorganic Chemistry. Chem. Rev. 1997, 97, 597–636. [Google Scholar] [CrossRef]
  47. Echeverría, R.; López-De-Luzuriaga, J.M.; Monge, M.; Olmos, M.E. The gold(i)⋯lead(ii) interaction: A relativistic connection. Chem. Sci. 2015, 6, 2022–2026. [Google Scholar] [CrossRef] [PubMed]
  48. López-De-Luzuriaga, J.M.; Monge, M.; Olmos, M.E.; Pascual, D.; Lasanta, T. Amalgamating at the molecular level. A study of the strong closed-shell Au(i)⋯Hg(ii) interaction. Chem. Commun. 2011, 47, 6795–6797. [Google Scholar] [CrossRef]
  49. Pyykkö, P.; Tamm, T. Theory of the d10−d10 Closed-Shell Attraction. 4. X(AuL)nm+ Centered Systems. Organometallics 1998, 17, 4842–4852. [Google Scholar] [CrossRef]
  50. Kloo, L. On closed-shell interactions between heavy main-group elements. J. Comput. Chem. 2022, 43, 1985–1996. [Google Scholar] [CrossRef]
  51. Szalay, S.; Barcza, G.; Szilvási, T.; Veis, L.; Legeza, Ö. The correlation theory of the chemical bond. Sci. Rep. 2017, 7, 2237. [Google Scholar] [CrossRef] [PubMed]
  52. Sharma, S.; Baligar, R.S.; Singh, H.B.; Butcher, R.J. Reaction of a Metallamacrocycle Leading to a Mercury(II)⋅Palladium(II)⋅Mercury(II) Interaction. Angew. Chem. 2009, 121, 2021–2024. [Google Scholar] [CrossRef]
  53. Echeverría, R.; López-De-Luzuriaga, J.M.; Monge, M.; Moreno, S.; Olmos, M.E. New Insights into the Au(I)·Pb(II) Closed-Shell Interaction: Tuning of the Emissive Properties with the Intermetallic Distance. Inorg. Chem. 2016, 55, 10523–10534. [Google Scholar] [CrossRef] [PubMed]
  54. Yu, P.; Wen, X.; Toh, Y.-R.; Ma, X.; Tang, J. Fluorescent Metallic Nanoclusters: Electron Dynamics, Structure, and Applications. Part. Part. Syst. Charact. 2015, 32, 142–163. [Google Scholar] [CrossRef]
Figure 1. Photos representing the visual and colorimetric evolution of the fresh dispersion of nanomaterial during bleaching processes by grounding (ac) and by evaporation followed by centrifugation (df).
Chemosensors 11 00118 g001
Figure 2. (a) Extinction spectra of gold nanomaterial before (black curve) and after (gray curve) the bleaching. (b) TEM image of the fresh synthesized nanomaterial, comprising both AuNPs and AuNCs. (c) TEM image of the AuNCs after the bleaching by evaporation and centrifugation. In both TEM images is the statistical distribution of the radius R of the colloids.
Chemosensors 11 00118 g002
Figure 3. Emission and excitation spectra of the AuNCs before (black curve) and after dialysis (gray curve) for (a) the UV emission (360 nm) excited at 250 nm, and (b) visible emission (415 nm) excited at 315 nm. In blue is the PL spectra of the NaOH water solution at the concentration of 20 mmol L−1. (c) Emission with excitation at 285 nm, where both the PL emission peaks are present at the wavelengths of 360 nm and 415 nm. (d) Modulation of the ζ-potential (circular points) and PL intensity at the wavelengths of 360 nm (square points) and 415 nm (star points) depending on the pH of the water environment. The error bars were evaluated by considering four samples produced in independent synthesis processes. The pH was controlled by the addition of HCl.
Chemosensors 11 00118 g003
Figure 4. (a) HRTEM image of different AuNCs after bleaching, together with EDX measurement. (b) HRTEM of a single AuNC after separation. The interplanar distance of 0.19 nm is highlighted, typical of the (200) plane of face-centered cubic (fcc) metallic gold [39].
Chemosensors 11 00118 g004
Figure 5. Behavior of Lo/Lx depending on the concentration of the analytes, for the emission in the UV region at 360 nm, excited at 250 nm. (a) Hg2+; (b) Pb2+; (c) Cd2+; (d) CH3Hg+. The lines are the linear fits, used for the determination of the linear range and sensitivity (S) of the response. The error bars were established as authentic replicates of the measurements made on different days on different samples.
Chemosensors 11 00118 g005
Figure 6. Behavior of Lo/Lx depending on the concentration of the analytes, for the emission in the blue region at 415 nm, excited at 315 nm. (a) Hg2+; (b) Pb2+; (c) Cd2+; (d) CH3Hg+. The lines are the linear fits, used for the determination of the linear range and sensitivity (S) of the responses. The error bars were established as authentic replicates of the measurements made on different days on different samples.
Chemosensors 11 00118 g006
Table 1. Concentration of gold in the colloidal dispersion of nanomaterial before and after the different bleaching processes. The measurement was repeated on five samples, produced through independent synthesis processes.
Bleaching MethodNoneGroundingEvaporation/CentrifugationSalt Precipitation
Au concentration81 ± 7 ppm50 ± 12 ppb23 ± 5 ppb100 ± 10 ppb
Table 2. Comparison of sensitivity (S), linearity constant (R2), limit of detection (LOD) and linearity range (Cmax) in the PL quenching of the AuNCs synthesized by PLA upon interaction with the different HMIs.
UV EmissionVisible Emission
HMISensitivity
10−3 (ppb−1)
R2LOD
ppb/nmol/L
Cmax
ppb/nM
Sensitivity
10−3 (ppb−1)
R2LOD
ppb/nmol/L
Cmax
ppb/nmol/L
Hg2+4.00.973/15640/32003.00.804/2320/115
Pb2+2.00.986/3020/961.90.927/3420/96
Cd2+1.20.8810/8820/1770.50.7511/9720/177
CH3Hg1+1.50.988/3840/1852.90.8923/10620/143
Table 3. Comparison of sensitivity, linearity constant (R2), limit of detection (LOD) and linearity range (Cmax) in the PL quenching of the AuNCs reported in the literature, after interaction with the Hg2+ ions.
Kind of
Gold Nanocluster
Linearity
Range
LOD Ref.
Lys VI-AuNCs15–600 nM3.0 pM[17]
Au+-stabilized AuNCs1–20 nM0.5 nM[14]
trypsin-AuNC50–600 nM50 nM[15]
l-amino acid-AuNCs0.5–8.4 μM59 nM[44]
folic acid-AuNCs0.1–1.0 μM28 nM[43]
AuNCs/MIL-68(In)-NH2/Cys20 pM–0.2 μM6.9 pM[45]
AuNCs by PLA50–3200 nM 15 nMThis work
Disclaimer/Publisher’s Note: The statements, opinions and data contained in all publications are solely those of the individual author(s) and contributor(s) and not of MDPI and/or the editor(s). MDPI and/or the editor(s) disclaim responsibility for any injury to people or property resulting from any ideas, methods, instructions or products referred to in the content.

