Article

Development of Chemiluminescent ELISA for Detection of Diisobutyl Phthalate in Water, Lettuce and Aquatic Organisms

1
A.N. Bach Institute of Biochemistry, Research Center of Biotechnology of the Russian Academy of Sciences, Leninsky Prospect 33, Moscow 119071, Russia
2
Higher Chemical College of the Russian Academy of Sciences, D.I. Mendeleev University of Chemical Technology of Russia, Miusskaya Square, 9, Moscow 125047, Russia
*
Author to whom correspondence should be addressed.
Submission received: 6 June 2023 / Revised: 8 July 2023 / Accepted: 12 July 2023 / Published: 14 July 2023
(This article belongs to the Special Issue Application of Luminescent Materials for Sensing)

Abstract

:
The use of plasticizers to improve the quality of plastics widely used for household purposes inevitably leads to an increase in their pollution of food and environmental objects. Diisobutyl phthalate (DiBP) is one of the ortho-substituted phthalic acid esters that negatively affect human health and ecosystems. This work is directed to the development of a chemiluminescent enzyme immunoassay (CL-ELISA) for the determination of diisobutyl phthalate in water and food. Luminol, which is oxidized with hydrogen peroxide in the presence of p-iodophenol as an enhancer, was chosen as the substrate for horseradish peroxidase used as a label in the analysis. For this development, rabbit anti-DiBP polyclonal antibodies were generated and tested with the synthesized hapten–protein conjugate. The developed chemiluminescent ELISA has a detection limit of 1.8 ng/mL; the operating range was 5.0–170.8 ng/mL at a content of 10% methanol in the assay medium. The assay was successfully applied to detect diisobutyl phthalate in lettuce leaves, seafood, and water. When using extraction with methanol and hexane, the recovery of DiBP in samples varies in the range of 76.9–134.2%; for assays in natural waters, the recovery rates are from 79.5 to 113.4%.

1. Introduction

Phthalic acid esters (PAEs) are widely used as plasticizers added to a variety of materials, including food packaging, containers, water bottles, and other everyday products. A feature of their introduction into plastic materials is the absence of covalent chemical bonds with the base material, and thus, they are washed out of the packaging into the environment, entering drinking water and food [1]. Some countries (for example, Italy) specify the use of regenerated rather than recycled cellulose in the production of food packaging at the legislative level and monitor non-compliance with the law [2]. The study of their biodegradation and toxicology has shown that many representatives of PAEs have toxic effects on the reproductive and immune systems of mammals; additionally, their estrogen-like effects have been proven [3,4,5]. Phthalates also negatively affect various biochemical pathways that lead to apoptosis at the cellular level [6]. Diisobutyl phthalate, as well as a number of ortho-substituted phthalates (di-n-butyl phthalate, butyl benzyl phthalate, bis (2-ethylhexyl) phthalate and dicyclohexyl phthalate) are among the compounds that cause the greatest concern and public health risks [7,8].
Review [9] summarizes data from 19 toxicological studies on rodents. It is shown that DiBP has a toxic effect on the reproductive system, leading to a decrease in the level of male sex hormones and miscarriage [9]. A study on the effect of phthalates on maternal hormone levels during pregnancy shows an association with birth outcome [10]. In connection with the detected effects, the maximum allowable concentrations were established, which for DiBP is 300 µg/L [11].
An analysis of food products in different countries showed that DiBP is found most of all in grain products, baked goods, fruits, meat, and drinks, including water and alcoholic beverages. Approximately 10% are found in other foods (not explained) [11]. Interesting data for other types of products are collected in the review by Guo and Kannan [12]. PAEs, including DiBP, are also found in seafood, as well as in water and other aquatic organisms [13].
They are extracted from food samples with various organic solvents during extraction due to their lipophilicity [12]. Usually, acetone, hexane, methanol, and acetonitrile are used as eluents [13,14]. The main methods for the determination of phthalates, including diisobutyl phthalate, are either gas chromatography [13] or liquid chromatography [15] with mass-spectrometry. To detect trace levels of PAEs, sample preconcentration is used, which is also achieved by using organic solvents and the application of liquid–liquid or solid-phase extraction. However, the use of chromatographic techniques does not allow for the screening analysis of samples due to the high cost of one analysis, significant duration, and the unavailability of equipment for such purposes.
In this way, immunochemical methods of analysis are proposed as an accessible and widely used alternative. They are based on antigen-specific antibody interactions and allow us to recognize and determine toxicants in the nanogram range relatively quickly and selectively. These methods, including enzyme immunoassay, make it possible to analyze prepared samples for the content of PAEs in various food products and environmental samples (water, soil, etc.) after pretreatment [16]. The previously described developments for the determination of DiBP by immunoassay techniques are limited by the study on polarization fluorescent immunoassays (FPIAs) [14,17,18].
Colorimetric and chemiluminescent ELISAs are usually used in laboratory practice. Moreover, the latter has advantages in sensitivity and a wider range of determined concentrations [19]. Most often, luminol is used as a substrate in combination with analytical signal amplifiers in chemiluminescence [20,21]. The product of luminol oxidation, a light-emitting derivative of aminophthalate, is detected by the luminescent reader with greater sensitivity compared to a colorimetric substrate [22,23]. Thus, the aim of this work was to develop a chemiluminescent ELISA (CL-ELISA) for the determination of DiBP in water and food samples—lettuce and seafood.

2. Materials and Methods

2.1. Materials

Di-iso-butyl phthalate (DiBP), Di-n-butyl phthalate (DBP), di-n-octyl phthalate (DnOP), diethyl phthalate (DEP), dimethyl phthalate (DMP), butyl benzyl phthalate (BBzP), diheptyl phthalate (DHP), diethylhexyl phthalate (DEHP), diphenyl phthalate (DPhP), monobutyl phthalate (MBP), mono-n-octyl phthalate (MnOP), mono-2-octyl phthalate (M2OP), mono benzyl phthalate (MBzP), mono cyclohexyl phthalate (McHP), mono methyl phthalate (MMP), and monobutyl phthalate (MBP) were from Sigma-Aldrich (St. Louis, MO, USA). Bovine serum albumin (BSA) and soybean trypsin inhibitor (STI) were from Sigma-Aldrich (St. Louis, MO, USA). Freund’s complete adjuvant and Freund’s incomplete adjuvant were from InvivoGen (Vista Sorrento Pkwy, San Diego, CA, USA).
Goat anti-rabbit IgG polyclonal antibodies labeled with horseradish peroxidase were from IMTEK (Moscow, Russia). Luminol and 4-iodophenol (pIp) were from Sigma, Sigma-Aldrich (St. Louis, MO, USA). Ready-to-use colorimetric substrate 3,3′,5,5′-tetramethylbenzidine (TMB) with H2O2 was obtained from Immunotech (Moscow, Russia). Tris and Tween-20 were from Sigma-Aldrich (St. Louis, MO, USA). All reagents not listed above were from Chimmed (Moscow, Russia). Purification of water was performed using the Simplicity Water Purification System (Millipore, Bedford, MA, USA) and filtered in 0.22 µm filters before solutions preparation.

2.2. Methods

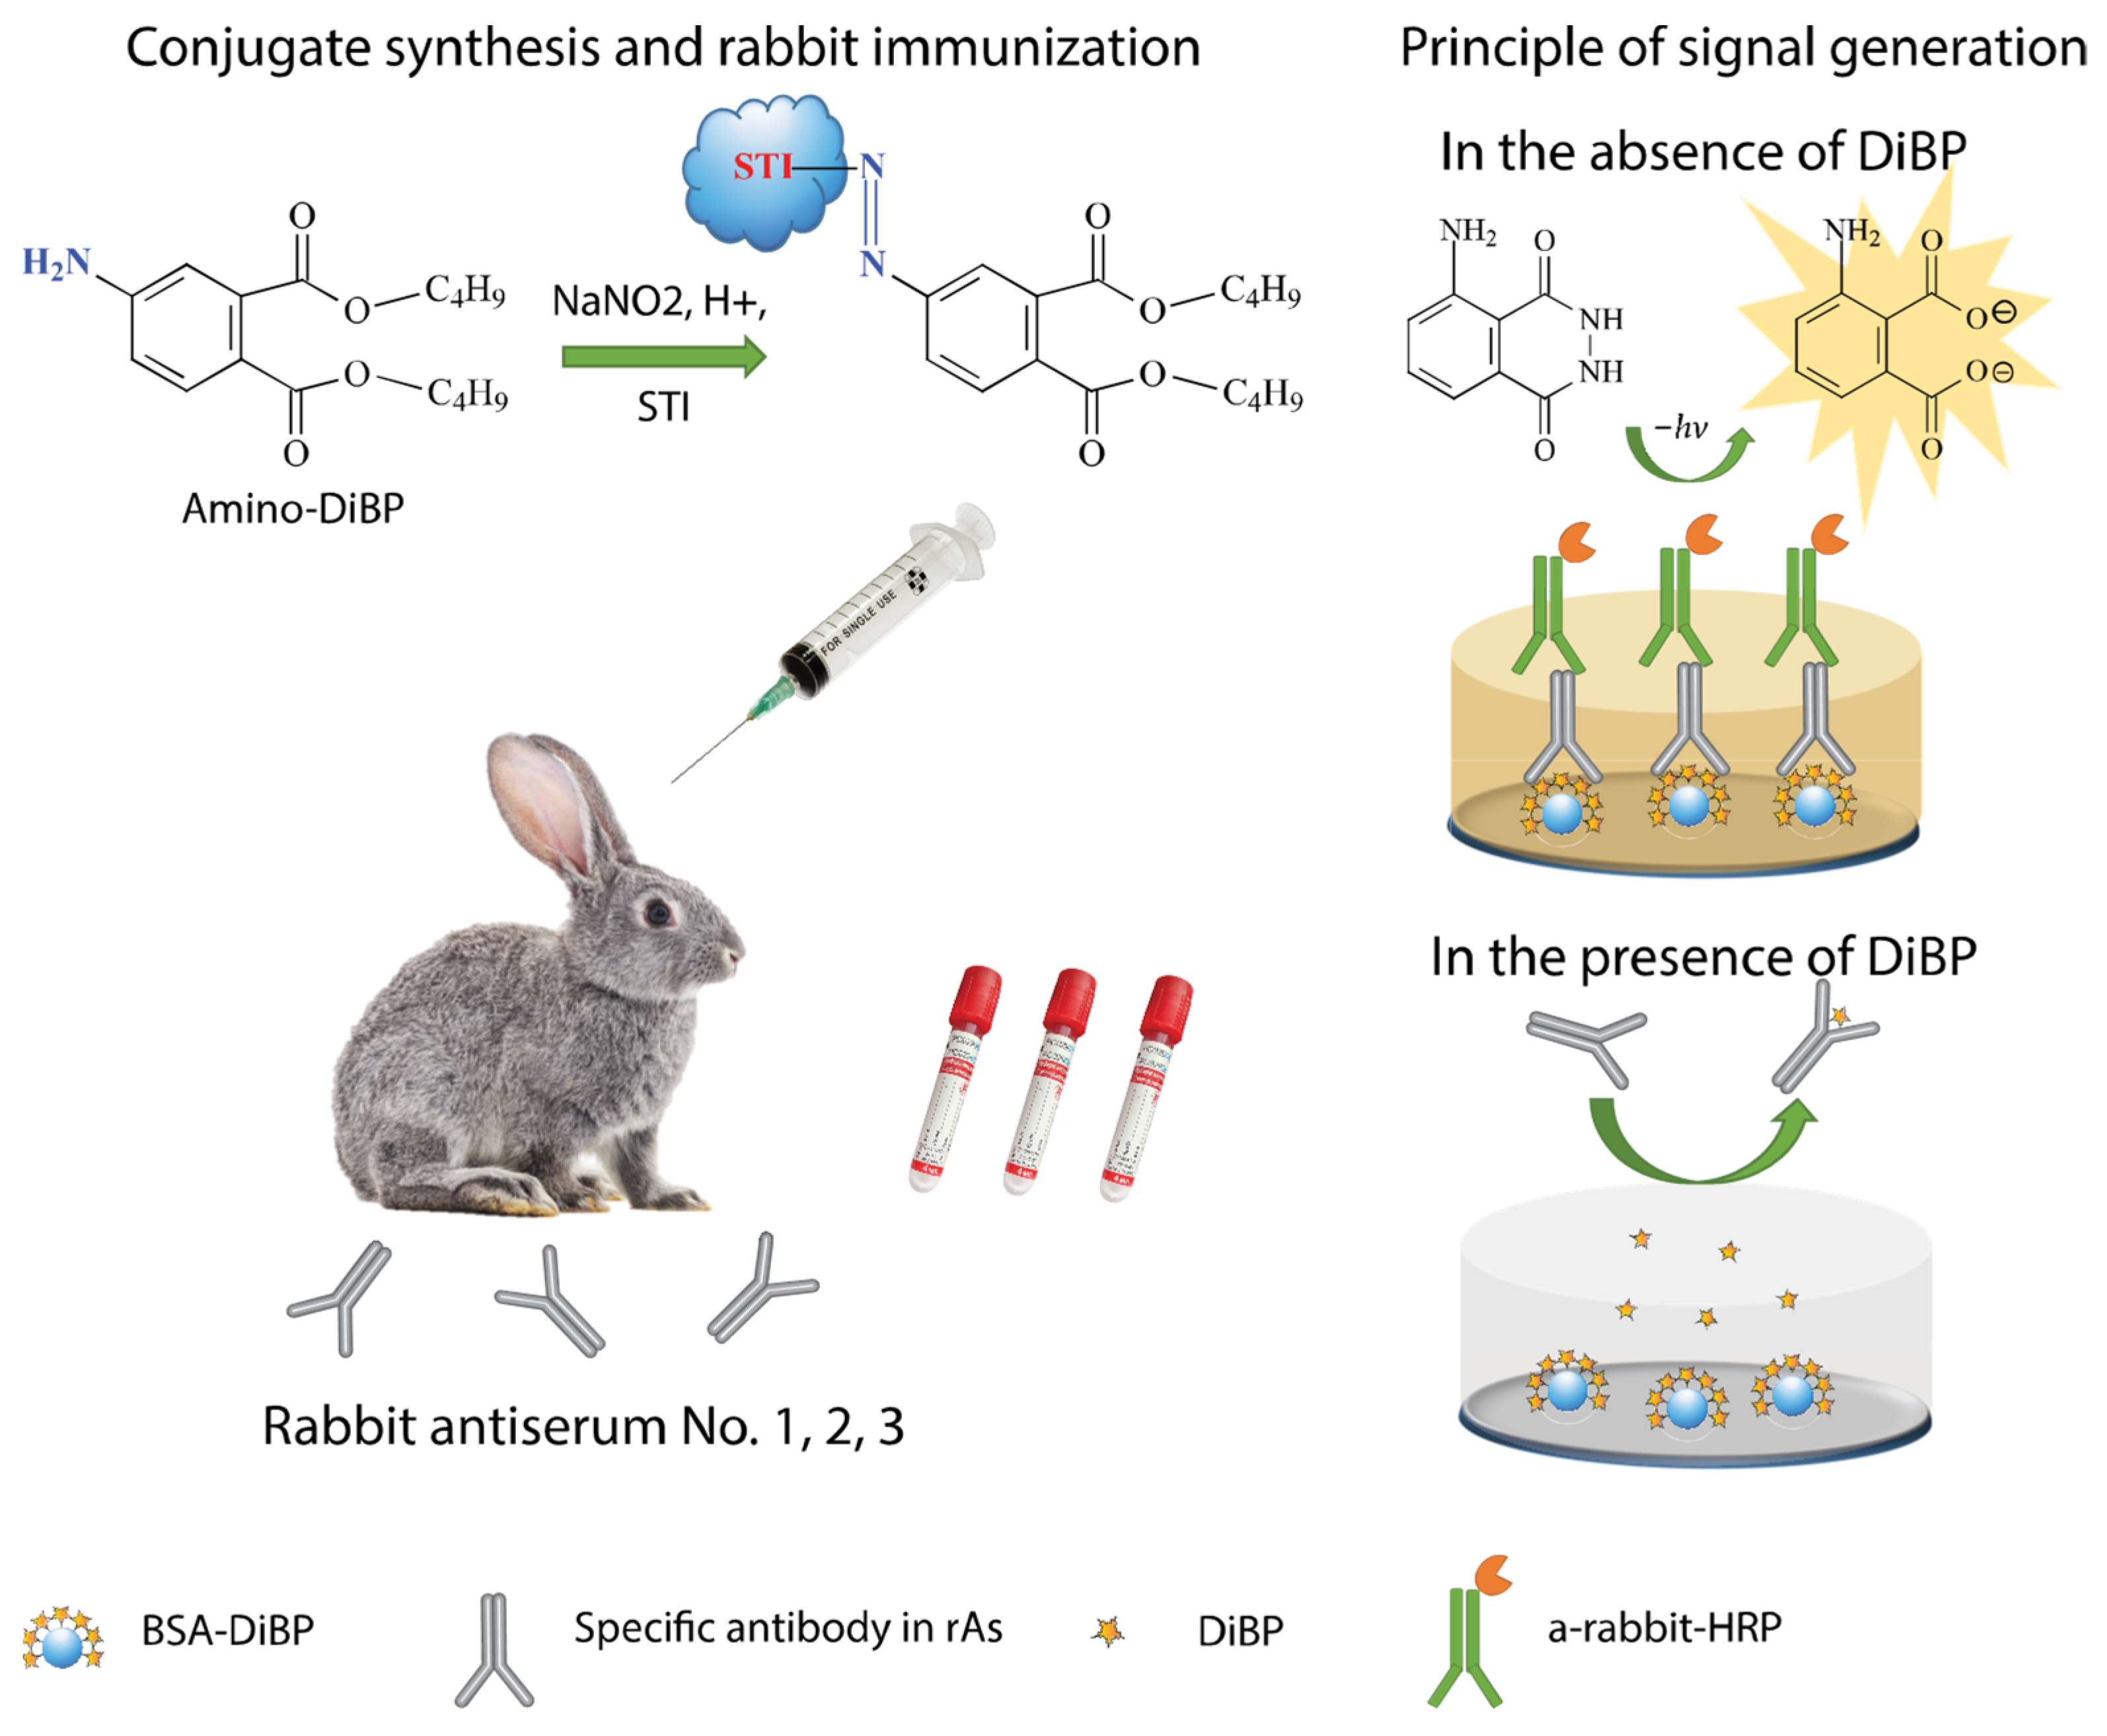
2.2.1. Synthesis of the Amino Derivative of DiBP

Synthesis of hapten was provided as described in [17]. First, a nitro derivative of DiBP was obtained, which was then reduced to an amino derivative. The purified product on each stage of synthesis was confirmed by 1H NMR. 1H NMR spectra were recorded on a Bruker Avance-400 instrument (operating frequency 400.1 MHz) in CDCl3. The chloroform signal (δH 7.25, δC 77.0 ppm) was used as an internal standard.
4-nitrodiisobutyl phthalate was obtained as follows. An amount of 100 mg (0.47 mmol) of 4-nitrophthalic acid was placed in a 5 mL round bottom flask and 2 mL of isobutyl alcohol was added. After dissolution, the reaction was brought to a boil and 0.15 mL of 98% H2SO4 was added dropwise, after which, the reaction mixture was refluxed for 7 h. At the end of the reaction time, the reaction mixture was cooled to room temperature, and 15 mL of 10% Na2CO3 solution was added, after which, the resulting mixture was extracted with CH2Cl2 3 times with 20 mL. The obtained organic fractions were evaporated under vacuum on a rotary evaporator and 150 mg (yield 98%) of 4-nitrodiisobutyl phthalate was obtained. NMR 1H (CDCl3, δ, m.d., JH–H, Hz): 0.97 m (12H, CH2CH(CH3)2); 1.98–2.10 m (2H, CH2CH(CH3)2); 4.11 d (2H, 3J = 6.7, CH2CH(CH3)2); 4.12 d (2H, 3J = 6.7, CH2CH(CH3)2); 7.83 d (1H, 3J = 8.4, H6(Ph)); 8.37 dd (1H, 3J = 8.4, 4J = 2.3, H5(Ph)); 8.58 d (1H, 4J = 2.3, H3(Ph)).
The compound suitable for conjugation with protein (4-aminodiisobutyl phthalate) was obtained as follows. An amount of 160 mg (0.46 mmol) of 4-nitrodiisobutyl phthalate was placed into a 100 mL round-bottom flask, after which, 30 mL of toluene was added to the flask. After dissolution, 325 mg (5 mmol) of zinc dust was added to the reaction mixture. Then, 1 mL of 35% HCl was added dropwise and the reaction mixture was stirred for 15 min, after which, another 325 mg (5 mmol) of zinc dust was added and the mixture was stirred for 12 h at room temperature. At the end of the reaction time, 30 mL of 1M aqueous KOH solution was added to the reaction mixture. The resulting suspension was filtered under vacuum on a Schott filter, and the filtrate was extracted with toluene 3 times with 20 mL. The resulting organic fraction was evaporated under a vacuum on a rotary evaporator and received 264 mg (90%) of 4-aminodiisobutyl phthalate. NMR 1H (CDCl3, δ, m.d., JH-H, Hz): 0.93 d (6H, 3J = 6.7, CH2CH(CH3)2); 0.94 d (6H, 3J = 6.7, CH2CH(CH3)2); 1.92–2.06 m (2H, CH2CH(CH3)2); 3.97 d (2H, 3J = 6.7, CH2CH(CH3)2); 4.03 d (2H, 3J = 6.7, CH2CH(CH3)2); 4.23 br.s (2H, NH2); 6.63 dd (1H, 3J = 8.5, 4J = 2.4, H6(Ph)); 6.67 d (1H, 4J = 2.4, H3(Ph)); 7.66 d (1H, 3J = 8.5, H6(Ph)).
UV-2450 spectrophotometer (Shimadzu, Japan) was used to obtain the spectra of adsorption. The freshly synthesized STI-DiBP and BSA-DiBP conjugates were freeze-dried preliminarily using a Martin Christ freeze dryer (Alpha 1–2 LD Plus, Osterode, Germany). The Fourier transform infrared (FT-IR) spectra of lyophilized conjugates were performed in the wave range between 4000 and 500 cm−1 using a FT/IR-6700 spectrophotometer (JASCO, Tokyo, Japan).

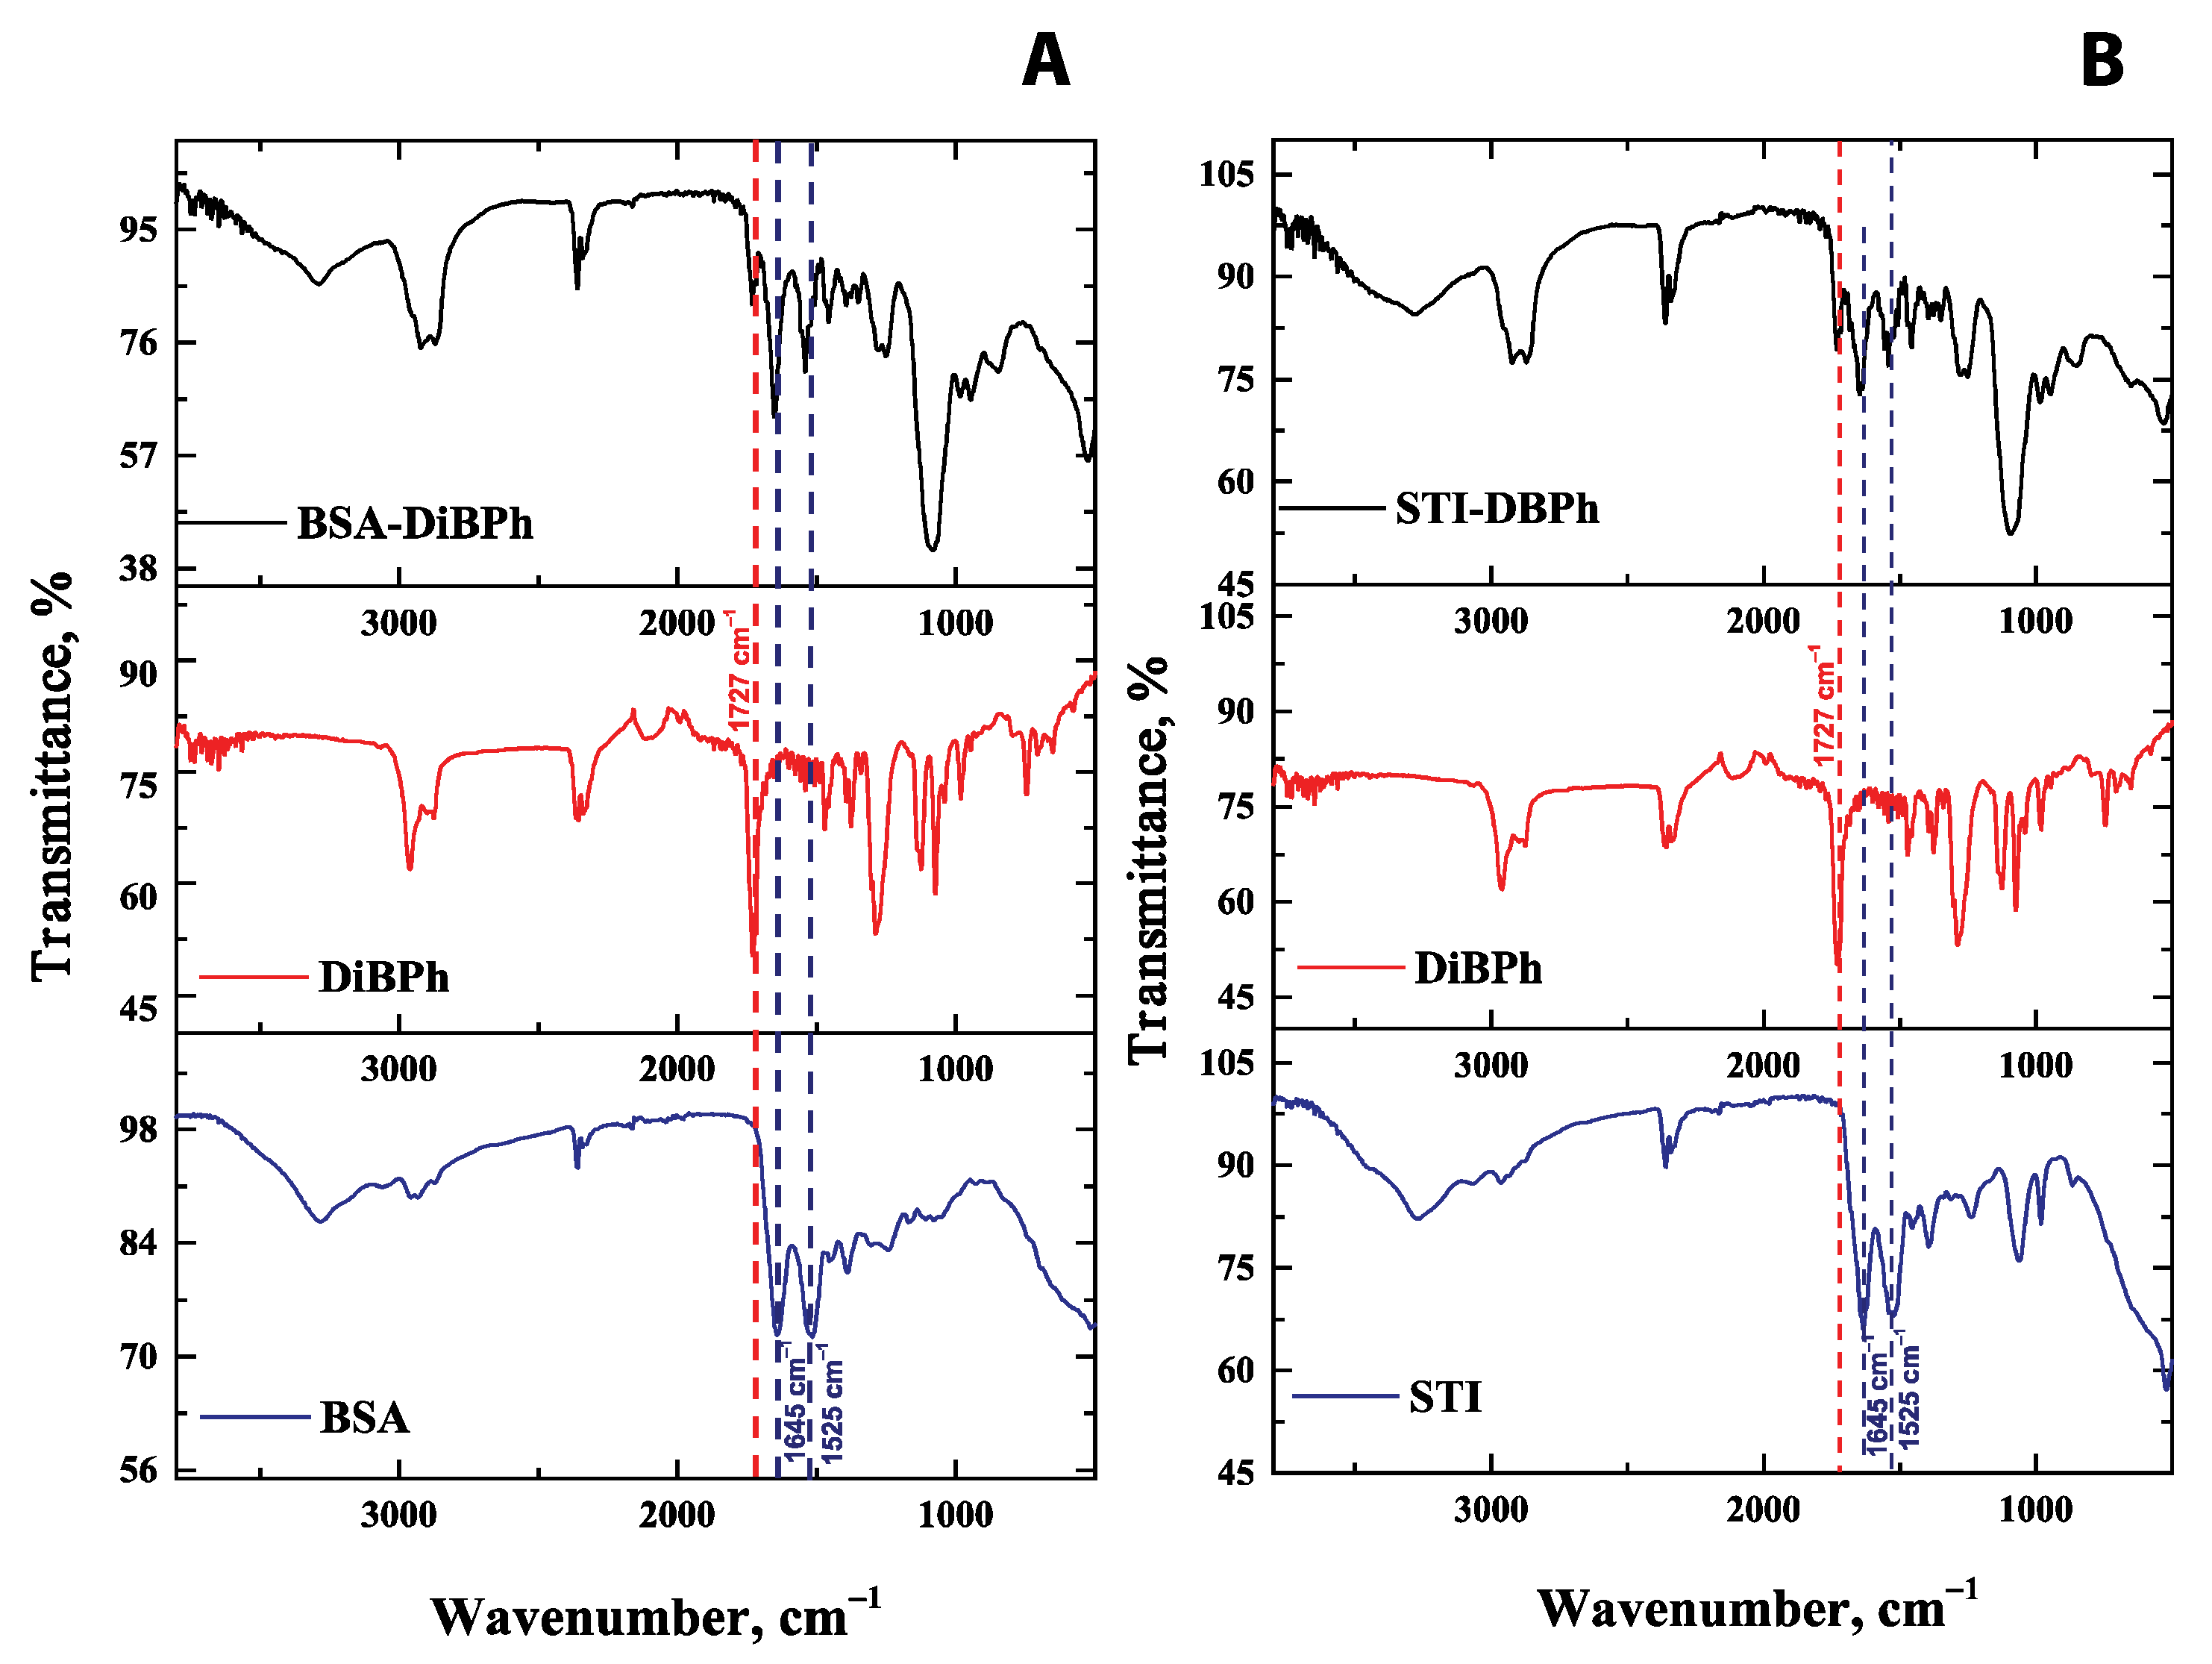
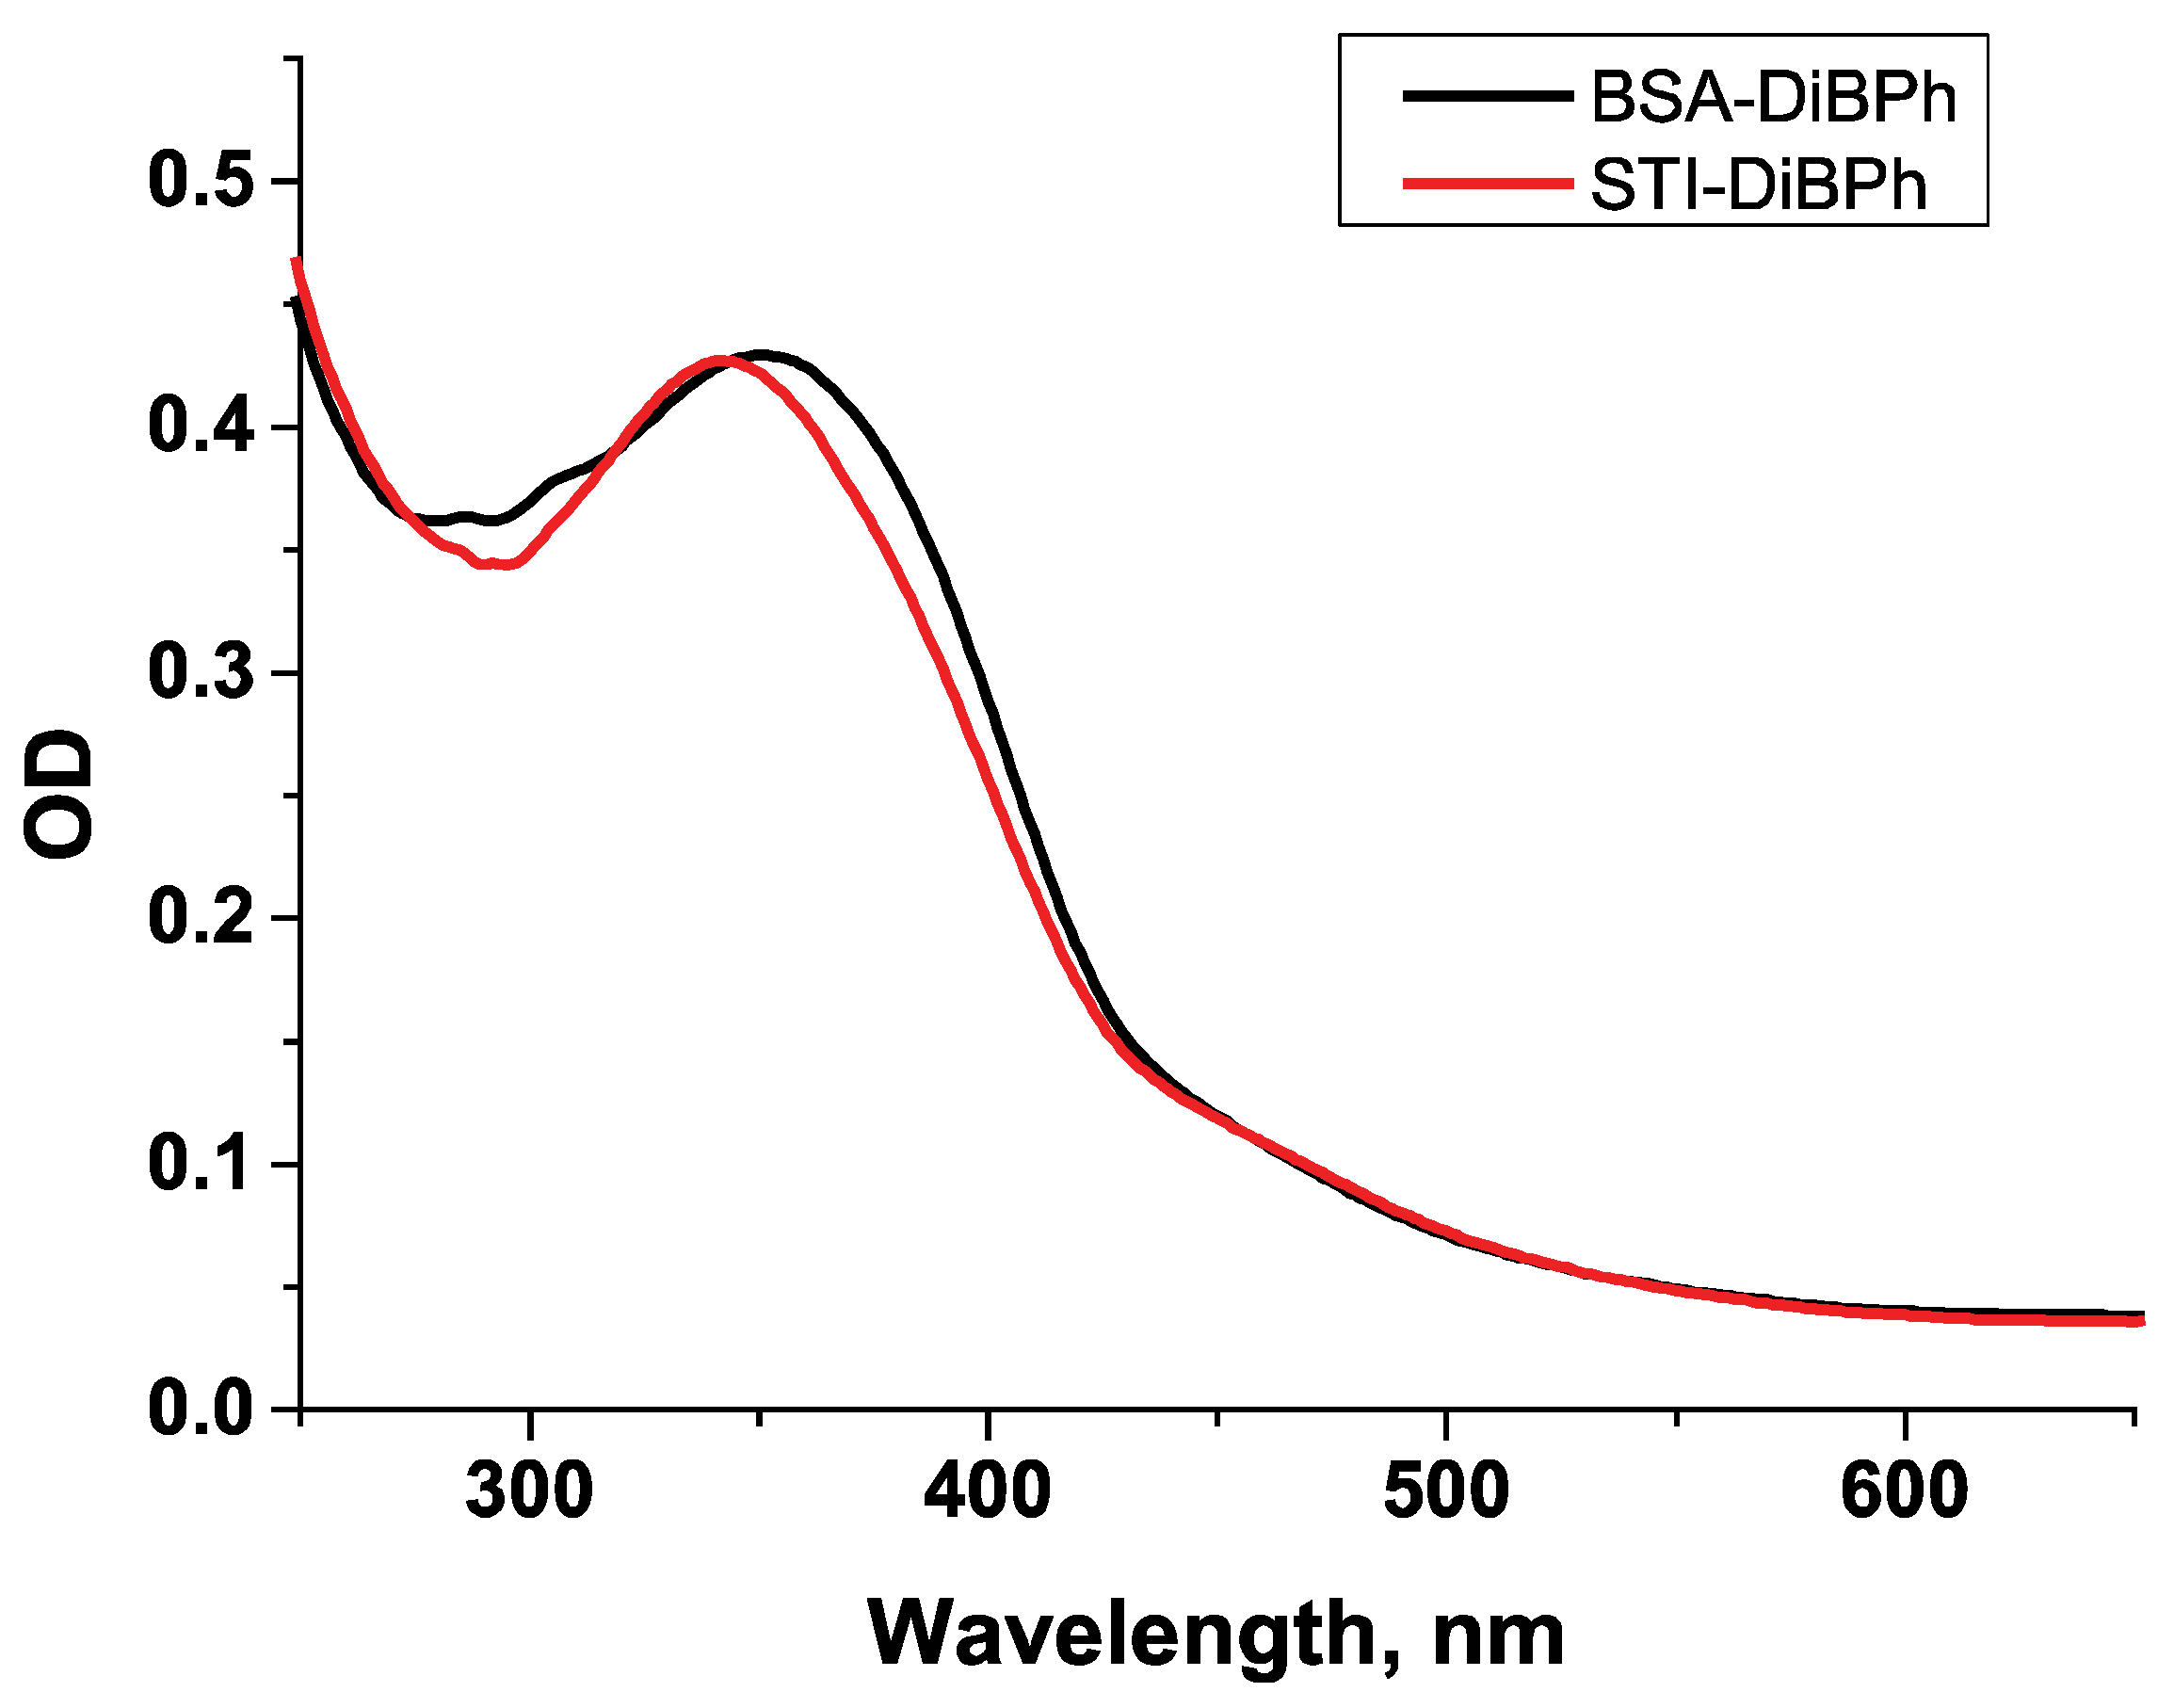
2.2.2. Synthesis of Conjugates of DiBP with Carrier Proteins

The synthesis of hapten and conjugates was provided by azo coupling reaction with the use of the primary amino group of the DiBP derivative as described in [24] with the use of STI and BSA, correspondingly.
For this purpose, 12.5 µL of 31% hydrochloric acid, 375 µL of H2O, and 15 µL of Tween-20 were added at 0 °C to 4.34 mg of amino-DiBP in 25 µL dimethylsulfoxide (DMSO), then 0.5 mL of water containing 1.375 mg of NaNO2 was added. An amount of 10 mg of a carrier protein (STI or BSA) was dissolved in 2 mL 0.1 M Na-borate buffer, pH 9.0, and added to the first mixture. The reaction mixture immediately changed its color from pale yellow to dark orange. After incubation for 2 h at RT, the resulting conjugates were dialyzed against 10 mM phosphate buffer, pH 7.4. The concentration of preparation was calculated from the carrier protein based on the material balance data. The resulting conjugates were aliquoted and stored at −20 °C until use. The molar ratio under the synthesis for STI/DiBP was 1:40, and for BSA/DiBP, 1:80.

2.2.3. Rabbit Immunization

Rabbit immunization was provided in accordance with Russian Federation law and approved by the local ethical committee. The use of animals was in accordance with Directive 2010/63/EU (from 22 September 2010). Chinchilla grey rabbit (female, 3 kg) was obtained from the laboratory animal breeders “Manikhino” (Moscow region, Russia), and used for immunization. For the first subcutaneous injection, the STI-DiBP conjugate was dissolved in 0.9% saline with equal volumes of Freund’s complete adjuvant. The obtained concentration was 1.0 mg/mL. Then, 0.5 mg dissolved in saline, and Freund’s incomplete adjuvant in equal volumes was injected intramuscularly, after which, again, subcutaneously and intramuscularly every two weeks. Blood was collected one week after administered dose (on the 35th, 49th, and 63rd day, antiserum preparations No. 1, No. 2, and No. 3, respectively) from the ear vein. Blood samples were settled for 1 h at +37 °C and then for 10 h at +4 °C. The serum layer was separated by centrifugation for 15 min at 4000× g at +4 °C, then aliquoted into 1.0 mL volumes and stored at −20 °C.

2.2.4. Determination of Antibodies by ELISA

The enzyme-linked immunosorbent assay (ELISA) was carried out in 96-well transparent Costar 9018 microplates provided by Corning Costar (Tewksbury, MA, USA). All serum samples from rabbit were tested in non-competitive and competitive formats. For this purpose, the BSA-DiBP conjugate was immobilized at the concentration of 3 µg/mL in 50 mM PBS into the wells of a transparent microplate and incubated overnight. After washing three times with PBST, microplates were incubated with rabbit antiserum (rAs) diluted from 1:100 to 1:102,400 at 37 °C for 1 h. The resulting immune complexes were developed with the goat anti-rabbit IgG labeled with horseradish peroxidase (GARI-HRP) diluted to 1:5000 in PBST at +37 °C. An amount of 100 µL of the substrate solution (TMB + H2O2, Immunotech, Russia) was added to develop the color in the wells for 15 min. After this, the reaction was stopped by the addition of 50 µL 0.1 M H2SO4.
To provide the competitive assay, BSA-DiBP was immobilized at 3 µg/mL in 50 mM PBS. After the washing step, different concentrations of DiBP (usually from 3000 to 0.01 ng/mL) were added in the volume of 50 µL to the wells. Then, the same volume of rAs under the chosen dilution was added and incubated for 1 h at +37 °C. Further actions were similar to those described above.

2.2.5. Chemiluminescent ELISA (CL-ELISA)

The CL-ELISA was carried out in 96-well black Maxisorp Nunc microplates (NUNC 437111, Thermo Fisher Scientific, Roskilde, Denmark).
First, as above, BSA-DiBP conjugate was immobilized at the concentration of 3 µg/mL in 50 mM PBS into the wells of a black microplate and incubated overnight. Then, after the washing step, 50 µL of DiBP solution in PBST (or PBST with 10% of methanol, or sample extract) was added to the wells, followed by the addition of rAs solution in PBST, and then the plate was incubated at 37 °C for 60 min. Next, the plate was washed with the washing buffer (PBST) and 100 µL of GARI-HRP solution (1:5000 diluted) was added per well. After incubation at 37 °C for 45 min, the plate was again washed, followed by the addition of substrate mixture for chemiluminescence. The composition of the substrate mixture included 11,670 µL of 100 mM Tris-HCl buffer, pH 8.6–8.9, 110 µL of 100 mM luminol solution in 2 M NaOH, 220 µL of 100 mM 4-iodophenol solution in DMSO, and 22 µL of 3% H2O2. An amount of 100 µL of substrate solution was added directly next to the reader with the carriage extended to avoid any loss of time and incorrect presentation of results. The measurements were carried out on a Zenyth 3100 multifunctional reader (Anthos Instrument, Wals, Austria). In the device settings, the kinetic mode was set, indicating 5 measurement cycles.

2.2.6. ELISA Data Processing

Origin 9.0 software (OriginLab Corporation, Northampton, MA, USA) was used in this work for the preparation of calibration curves and statistical analysis.
For the competitive ELISA, the obtained dependences of OD450 from the DiBP concentration were approximated by a four-parametric sigmoidal equation (calibration curve).
For CL-ELISA, the obtained values of the chemiluminescent signal (relative luminescent units, RLU) were used to construct a calibration curve as a dependence of the signal on the concentration of DiBP. The obtained data on chemiluminescence for the samples were extrapolated to the curve and the values of the analyte concentration in the samples were obtained. All measurements were carried out in duplicate.
The cross-reactivity was studied as described above by replacing the target analyte with its structural analogs. Cross-reactivity was evaluated using the formula:
CR(%) = IC50(DiBP)/IC50(analogue) × 100%

2.2.7. Collection and Preparation of the Probes

The waterfall and spring water samples were collected from natural sources in ecologically clean regions of Russia and stored at +4 °C. Aquatic organisms used in this work (shrimps, squid, octopus, mussels) from the Barents Sea (Murmansk, Russia) and the Sea of Okhotsk (Yuzhno-Sakhalinsk, Russia) were purchased from local food stores. Oysters were from Primorsky Krai, Pacific Ocean (urban-type settlement Zarubino, Russia). All aquatic organisms were stored at −20 °C prior to the analysis. Lettuce was purchased in the organic foods local market.
Preparation of water samples and seafood.
Aquatic organisms were blended and weighed at 1 g. Then, 2 mL of hexane was added as an extracting solvent to the weighed portion, and the mixture was extracted for 60 min. Afterward, the samples were centrifuged for 15 min at 12,230× g to remove the upper organic layer. The hexane layer was evaporated and then extracted more with the same procedure. After the evaporation, 1 mL of PBST with 20% of methanol was added to dissolve the residue. An amount of 2 mL of hexane was added to 1 mL of water sample and the latter procedure was as described above.
Preparation of Lettuce.
Lettuce leaves were washed with pure water, dried in air, and ground in a mortar and pestle. An amount of 2 mL of methanol was added to 1 g of lettuce squash and extraction was carried out for 60 min at RT, and after centrifugation for 15 min, 12,230× g methanol supernatant was taken. The finished extract was diluted 5 times with a working buffer solution for analysis.
To prepare fortified samples of food, known concentrations of DiBP in methanol were added to the probe and then extraction was provided as described above.

3. Results and Discussion

3.1. Rabbit Immunization and Antisera Obtaining

The development of an immunoanalytical test system requires the presence of the main immunoreagents, which are hapten–protein conjugates and antibodies specific to the target analyte, for competitive immunoassay. Since there are no commercial antibodies to diisobutyl phthalate, it was necessary to obtain them independently by rabbit immunization. The general scheme and principle of the formation of an analytical signal are shown in Figure 1.
To obtain a specific antibody, the DiBP molecule should be enlarged to obtain full antigen because DiBP is a low-molecular-weight compound. The native DiBP used in industry does not contain groups available for conjugation with proteins; therefore, its amino derivative was synthesized as described in [17]. For the development of ELISA, hapten–protein conjugates were obtained. As described in our previous work [25], a protein conjugate with diisobutyl phthalate was obtained using its amino derivative by an azo coupling reaction. Soybean trypsin inhibitor (STI) and bovine serum albumin (BSA) were used as carrier proteins. The initial ratio in the preparations was 1:40 for the STI-DiBP and 1:80 for the BSA-DiBP conjugates.
Both STI-DiBP and BSA-DiBP conjugates have been characterized by FT-IR.
Figure 2 shows the FT-IR spectra of STI and BSA proteins, hapten (DiBP), and synthesized STI-DiBP and BSA-DiBP conjugates. In the spectra of proteins, the vibrations of the amide group of polypeptides can be distinguished, the characteristic frequencies of which are in the spectral regions of 1700–1600 cm−1, 1575–1480 cm−1, and 1230–1300 cm−1 in accordance with earlier studies [26]. Three transmission bands at 1727, 1645, and 1525 cm–1 in the FT-IR spectra of the conjugates are characteristic of the stretching vibrations of the carbonyl group of the ester of free DiBP, the stretching vibrations of the C=O and C–N groups of peptide chains in proteins, respectively.
The resulting conjugates were characterized by spectrophotometry and had characteristic peaks at 343 nm and 352 nm for STI-DiBP and BSA-DiBP, respectively. (Figure 3). The conjugates purified by dialysis against 10 mM PBS were used to immunize rabbit based on protein concentrations. The rabbit was immunized and three antisera preparations were obtained from the rabbit, which were analyzed by ELISA.

3.2. Characterization of Antisera by Colorimetric ELISA

Commercial ELISA kits typically use polyclonal antibodies as their affinity purified preparations which are isolated from antisera. However, additional processing can lead to denaturation and a decrease in the activity of specific antibodies [27]. Therefore, native rabbit antiserum was used in this work.
Rabbit antisera were characterized by colorimetric ELISA. For this purpose, non-competitive and competitive immunoassays were provided.
To select the dilution of antiserum required in the work, the latter was added to the microplate wells with adsorbed BSA-DiBP conjugate. Antiserum dilution was varied from 1:100 to 1:200,000. In the absence of DiBP as the competitor, specific antibodies from the antiserum were bound to the hapten in the adsorbed conjugate, and the resulting immune complexes were detected with peroxidase-labeled anti-species antibodies. Substrate oxidation by the peroxidase made it possible to evaluate the optical density at 450 nm, depending on the antiserum dilution. Maximum optical density values of 3.5 were observed for the least diluted serum (1:100), and the lowest values of 0.05 were observed for serum with a dilution of 1:10,000. With values above this level, there were no differences in optical density. The criterion of antiserum dilution selection was an optical density value of 1.0. Results on non-competitive ELISA confirmed the specific binding of the obtained antibodies to the BSA-DiBP conjugate and made it possible to select antibody titers for further reliable measurements in competitive assay. Thus, the obtained titers for competitive analysis were 1:1400, 1:700, and 1:375 for rabbit sera 1–3, respectively. These dilutions of antisera have been chosen for competitive ELISA.
A further characterization of antisera by competitive ELISA showed that their use in the analysis allows for obtaining satisfied analytical characteristics, shown in Table 1. Thus, the lowest detection limit (3.3 ng/mL) was observed for serum No. 3, while the widest range of detectable concentrations (14.3–593.7 ng/mL) was estimated for serum No. 1. The chemiluminescent detection often provides a wider range of determined concentrations, as well as an increased sensitivity. Thus, serum No. 3 was chosen for further works comparing colorimetric and chemiluminescent techniques. In this case, our approach differs from the generally accepted one, since a serum with a higher titer is usually chosen. The minimum IC50 value was observed precisely in the case of using serum No. 3.
Additionally, the selectivity of the determination of the target analyte DiBP was evaluated using fifteen PAE derivatives. In this case, the representatives of the class of phthalic acid esters as well as pure phthalic acid were added during competitive ELISA instead of DiBP, and the IC50 values for DiBP and other compounds were evaluated. DEP, DMP, MBP, MnOP, M2OP, DnOP, MBP, McHP, MMP, BBzP, DHP, DEHP, DPhP, and phthalic acid were tested as possible cross-reactants to characterize the specificity of the developed assay. For all these substances, the inhibition of the analytical signal was not observed even at a concentration of 5000 ng/mL. Therefore, the cross-reactivity was less than 0.1%. Interestingly, only dibutyl phthalate (DnBP) showed a small cross-reactivity with antibodies to DiBP, which was 12.15% among all the compounds used to evaluate selectivity (both mono- and disubstituted phthalic acid esters). The structural similarity with the target analyte in dibutyl phthalate is obvious since the difference is observed only in the structure of the radical. In one case it is branched, in the other, it is linear with an equal number of carbon atoms. A comparison with the works of predecessors [14,17,18], which obtained antibodies to DiBP for fluorescent polarization immunoassay, showed the following results when compared with six phthalic acid esters. Chen et al. [18] observed the cross-reactivities of 7.37, 1.62, 1.53, and 1.07% for DCHP, BBP, DMP, DBP, DEP, and DnOP, respectively. Authors suggested that increasing cross-reactivity is related to a decrease in antibody recognition ability when the side radical takes a cyclic form and creates steric hindrance. Cui et al. [14] showed the cross-reactivities of 12.07, 1.5, and 0.95% for amino derivatives of DiBP, DCHP, DBP, respectively. Chen et al. [17] observed a minor cross-reactivity with DBP for their monoclonal antibody to DiBP. Therefore, despite the relatively good selectivity of all these described systems, the advantage of our method is that it did not show reliable bindings for any of the tested compounds, confirming very high selectivity with respect to derivatives with linear and branched radicals. For example, the cross-reactivity of DnOP antibody in the work [28] was 22.6%, 17.6%, and 21.2% for di-iso-octyl phthalate (DiOP), DBP, and di-hexyl phthalate (DHP), respectively.

3.3. The Use of Methanol in the Working Buffer during Competitive Interaction in Chemiluminescent ELISA

Under initial conditions, a DiBP detection curve in PBST buffer solution was obtained (Figure 4). The transition to the chemiluminescent detection of interactions has shown some advantages. The detection limit slightly decreased from 3.3 ng/mL to 1.9 ng/mL, and the operating range also became wider—from 7.9 to 161.6 ng/mL (for colorimetric detection) to 6.1 to 318.8 ng/mL (for chemiluminescent detection).
PAEs, in particular DiBP, are highly lipophilic compounds and therefore require extraction with organic solvents. Since the concentration of the solvent is critical for the purposes of immunochemical analysis, the development of a chemiluminescent ELISA requires a careful choice of extraction technique and assay conditions. This happens because immunoglobulins are able to be inactivated by denaturation at certain concentrations of solvents as described in [29,30,31] when studying the influence of methanol concentration in immunoassay. In addition, chemiluminescent ELISA is a much more sensitive technique, as many factors affect the intensity of the analytical signal. It can lead both to an increase in signal amplitude and, unfortunately, to an increase in the background signal and thus a decrease in sensitivity [23]. For the purposes of ELISA, polar solvents such as methanol or ethanol are preferable since they are mixed with an aqueous medium during the antigen–antibody interaction. Kuang et al. [32] used methanol in the development of the colorimetric ELISA of DnBP in liquor drinks. They showed that the optimal concentration of methanol in the competitive stage was 20%, resulting in the minimal IC50 level observed. Thus, for works with diluted methanol extracts, the concentration of 20% in the working buffer has been chosen. Also, our preliminary work on extract dilution showed that this parameter is optimal because pure methanol extracts were diluted five times before addition into the wells at a competitive stage. The calibration curve for DiBP determination in the abovementioned buffer is shown in Figure 5. The final methanol concentration in the wells was estimated at 10%. Compared to PBST, the addition of methanol slightly increased sensitivity, and the detection limit decreased from 1.9 ng/mL to 0.9 ng/mL. However, the range of detectable concentrations became somewhat narrower—3.0–164.2 ng/mL compared to 6.1–318.8 ng/mL for PBST.
The introduction of methanol into the reaction medium was also considered from the point of view of the preparation of the extracts. One part of the extracts was planned to be evaporated and re-dissolved, and the other part to be diluted. Therefore, this buffer was chosen to re-dissolve the dry residue and transfer DiBP to the analyzed solution, since phthalates are hydrophobic compounds.

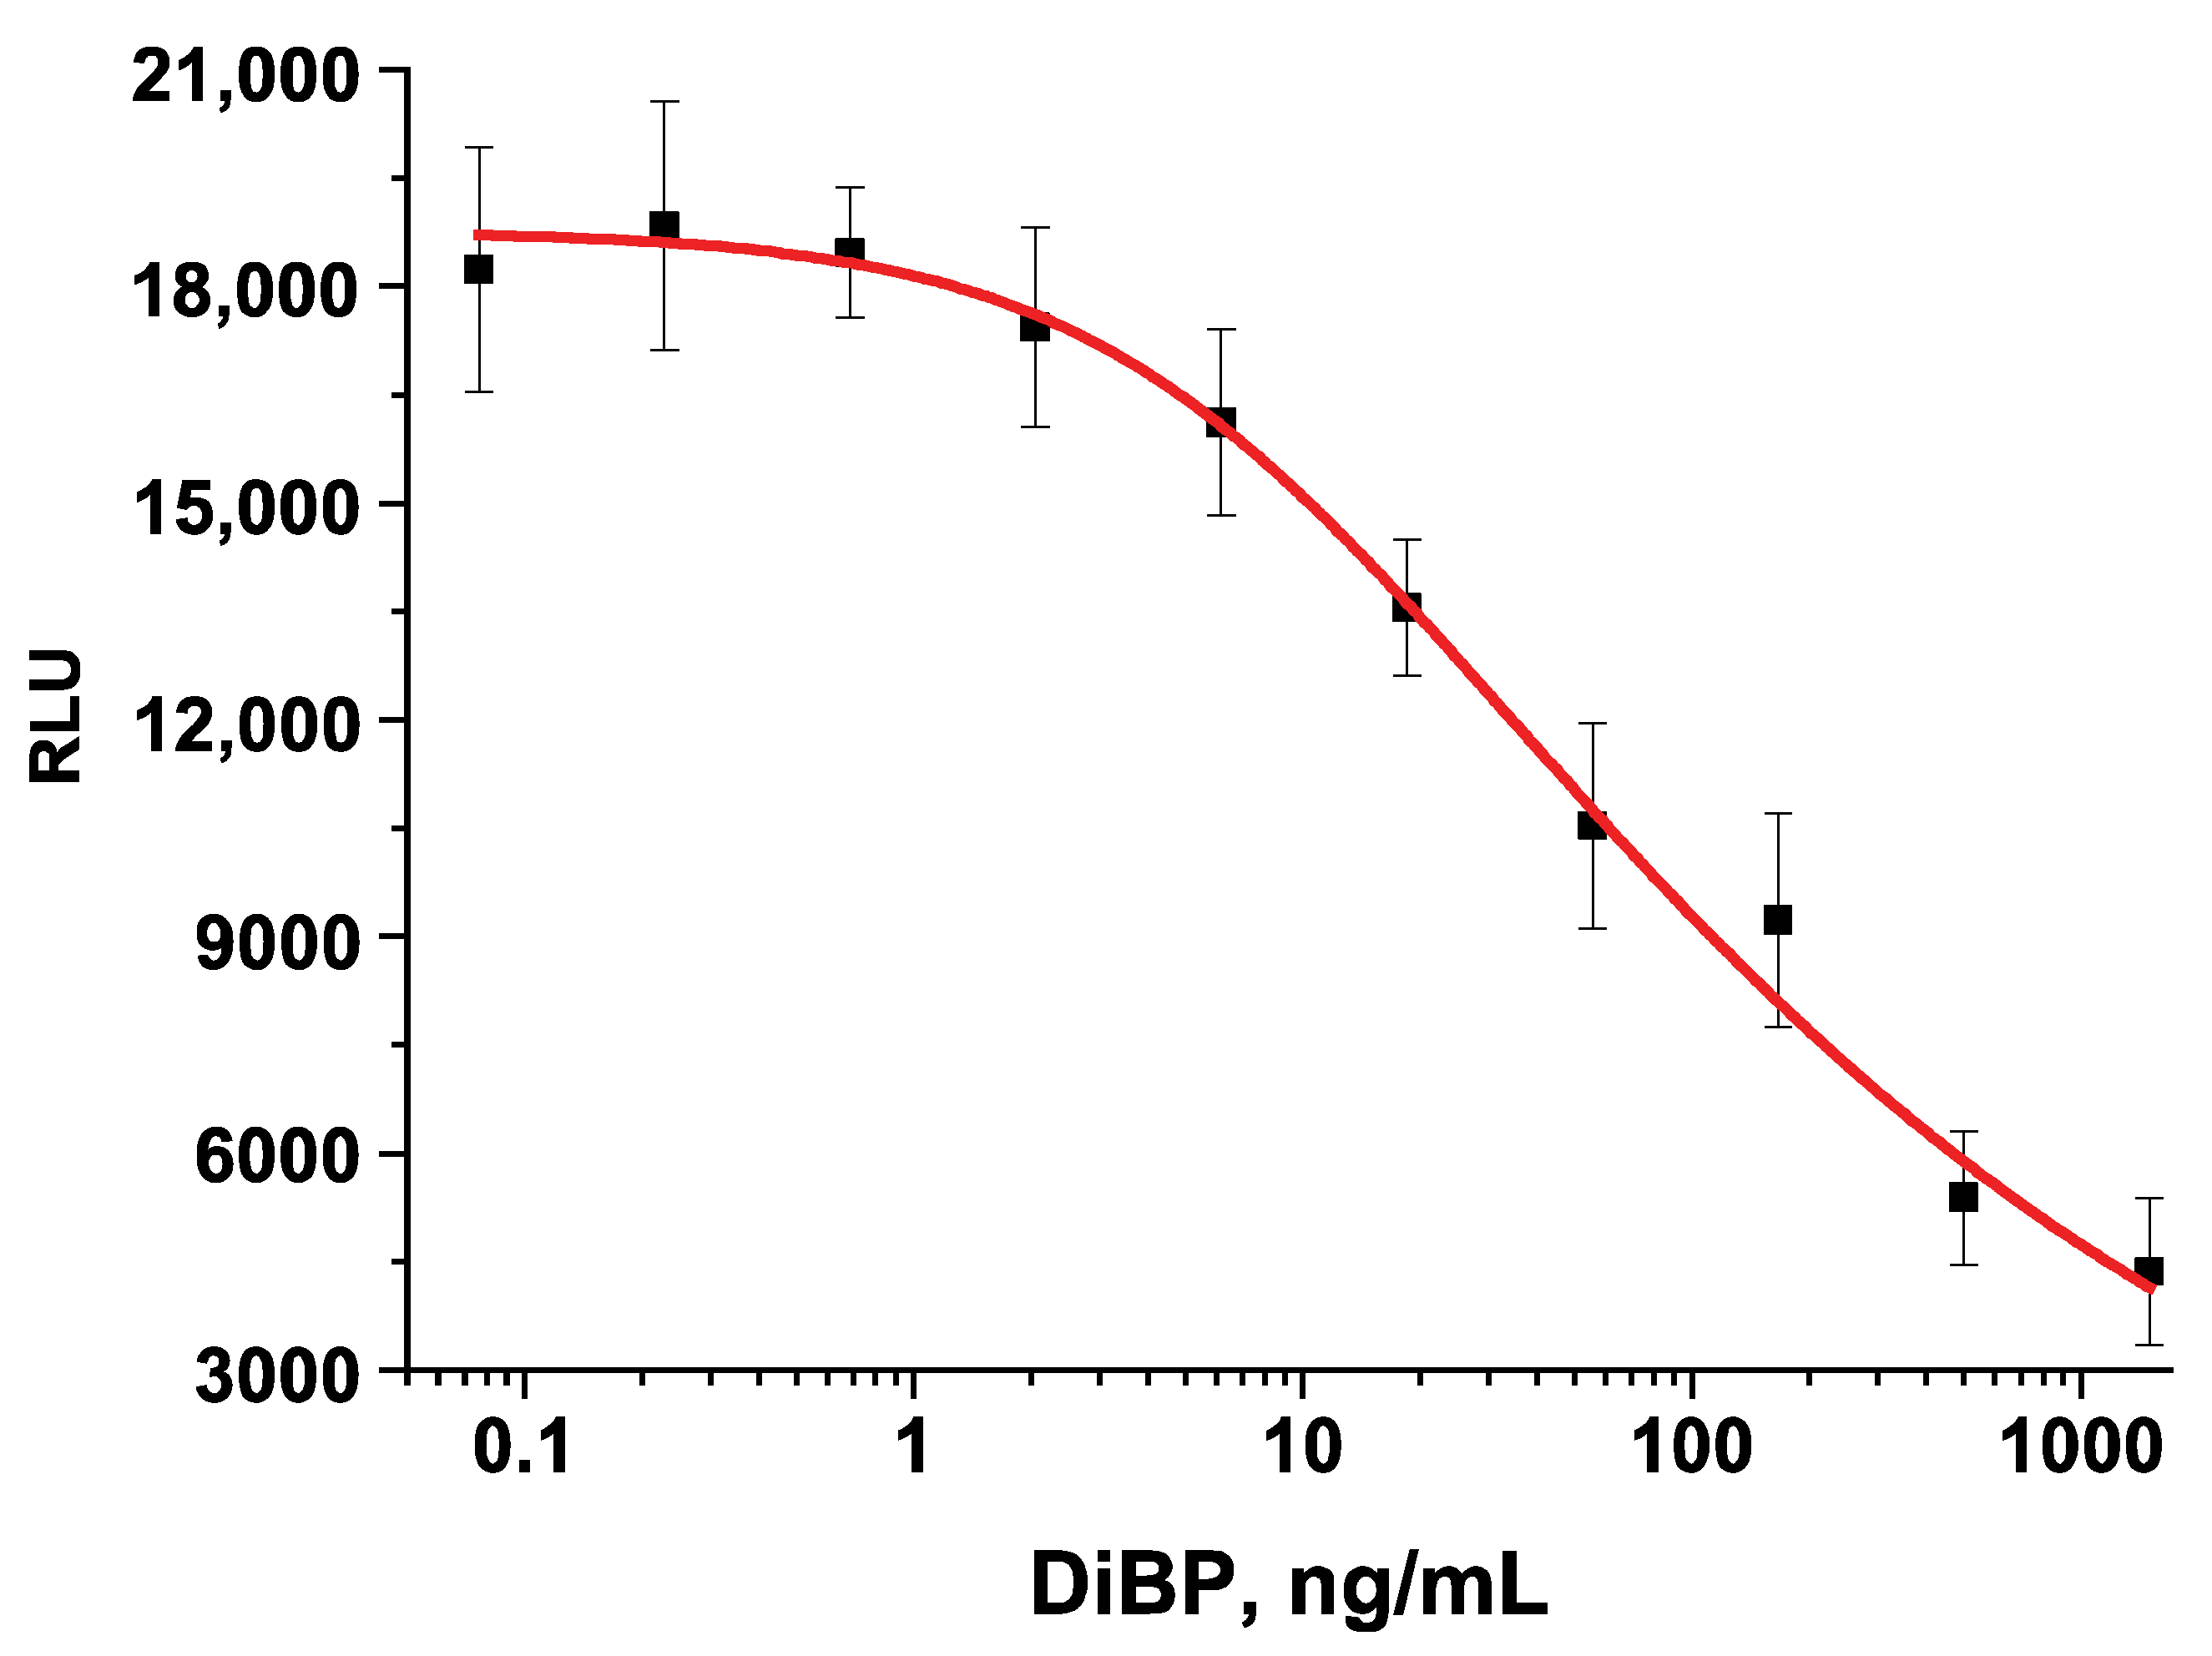
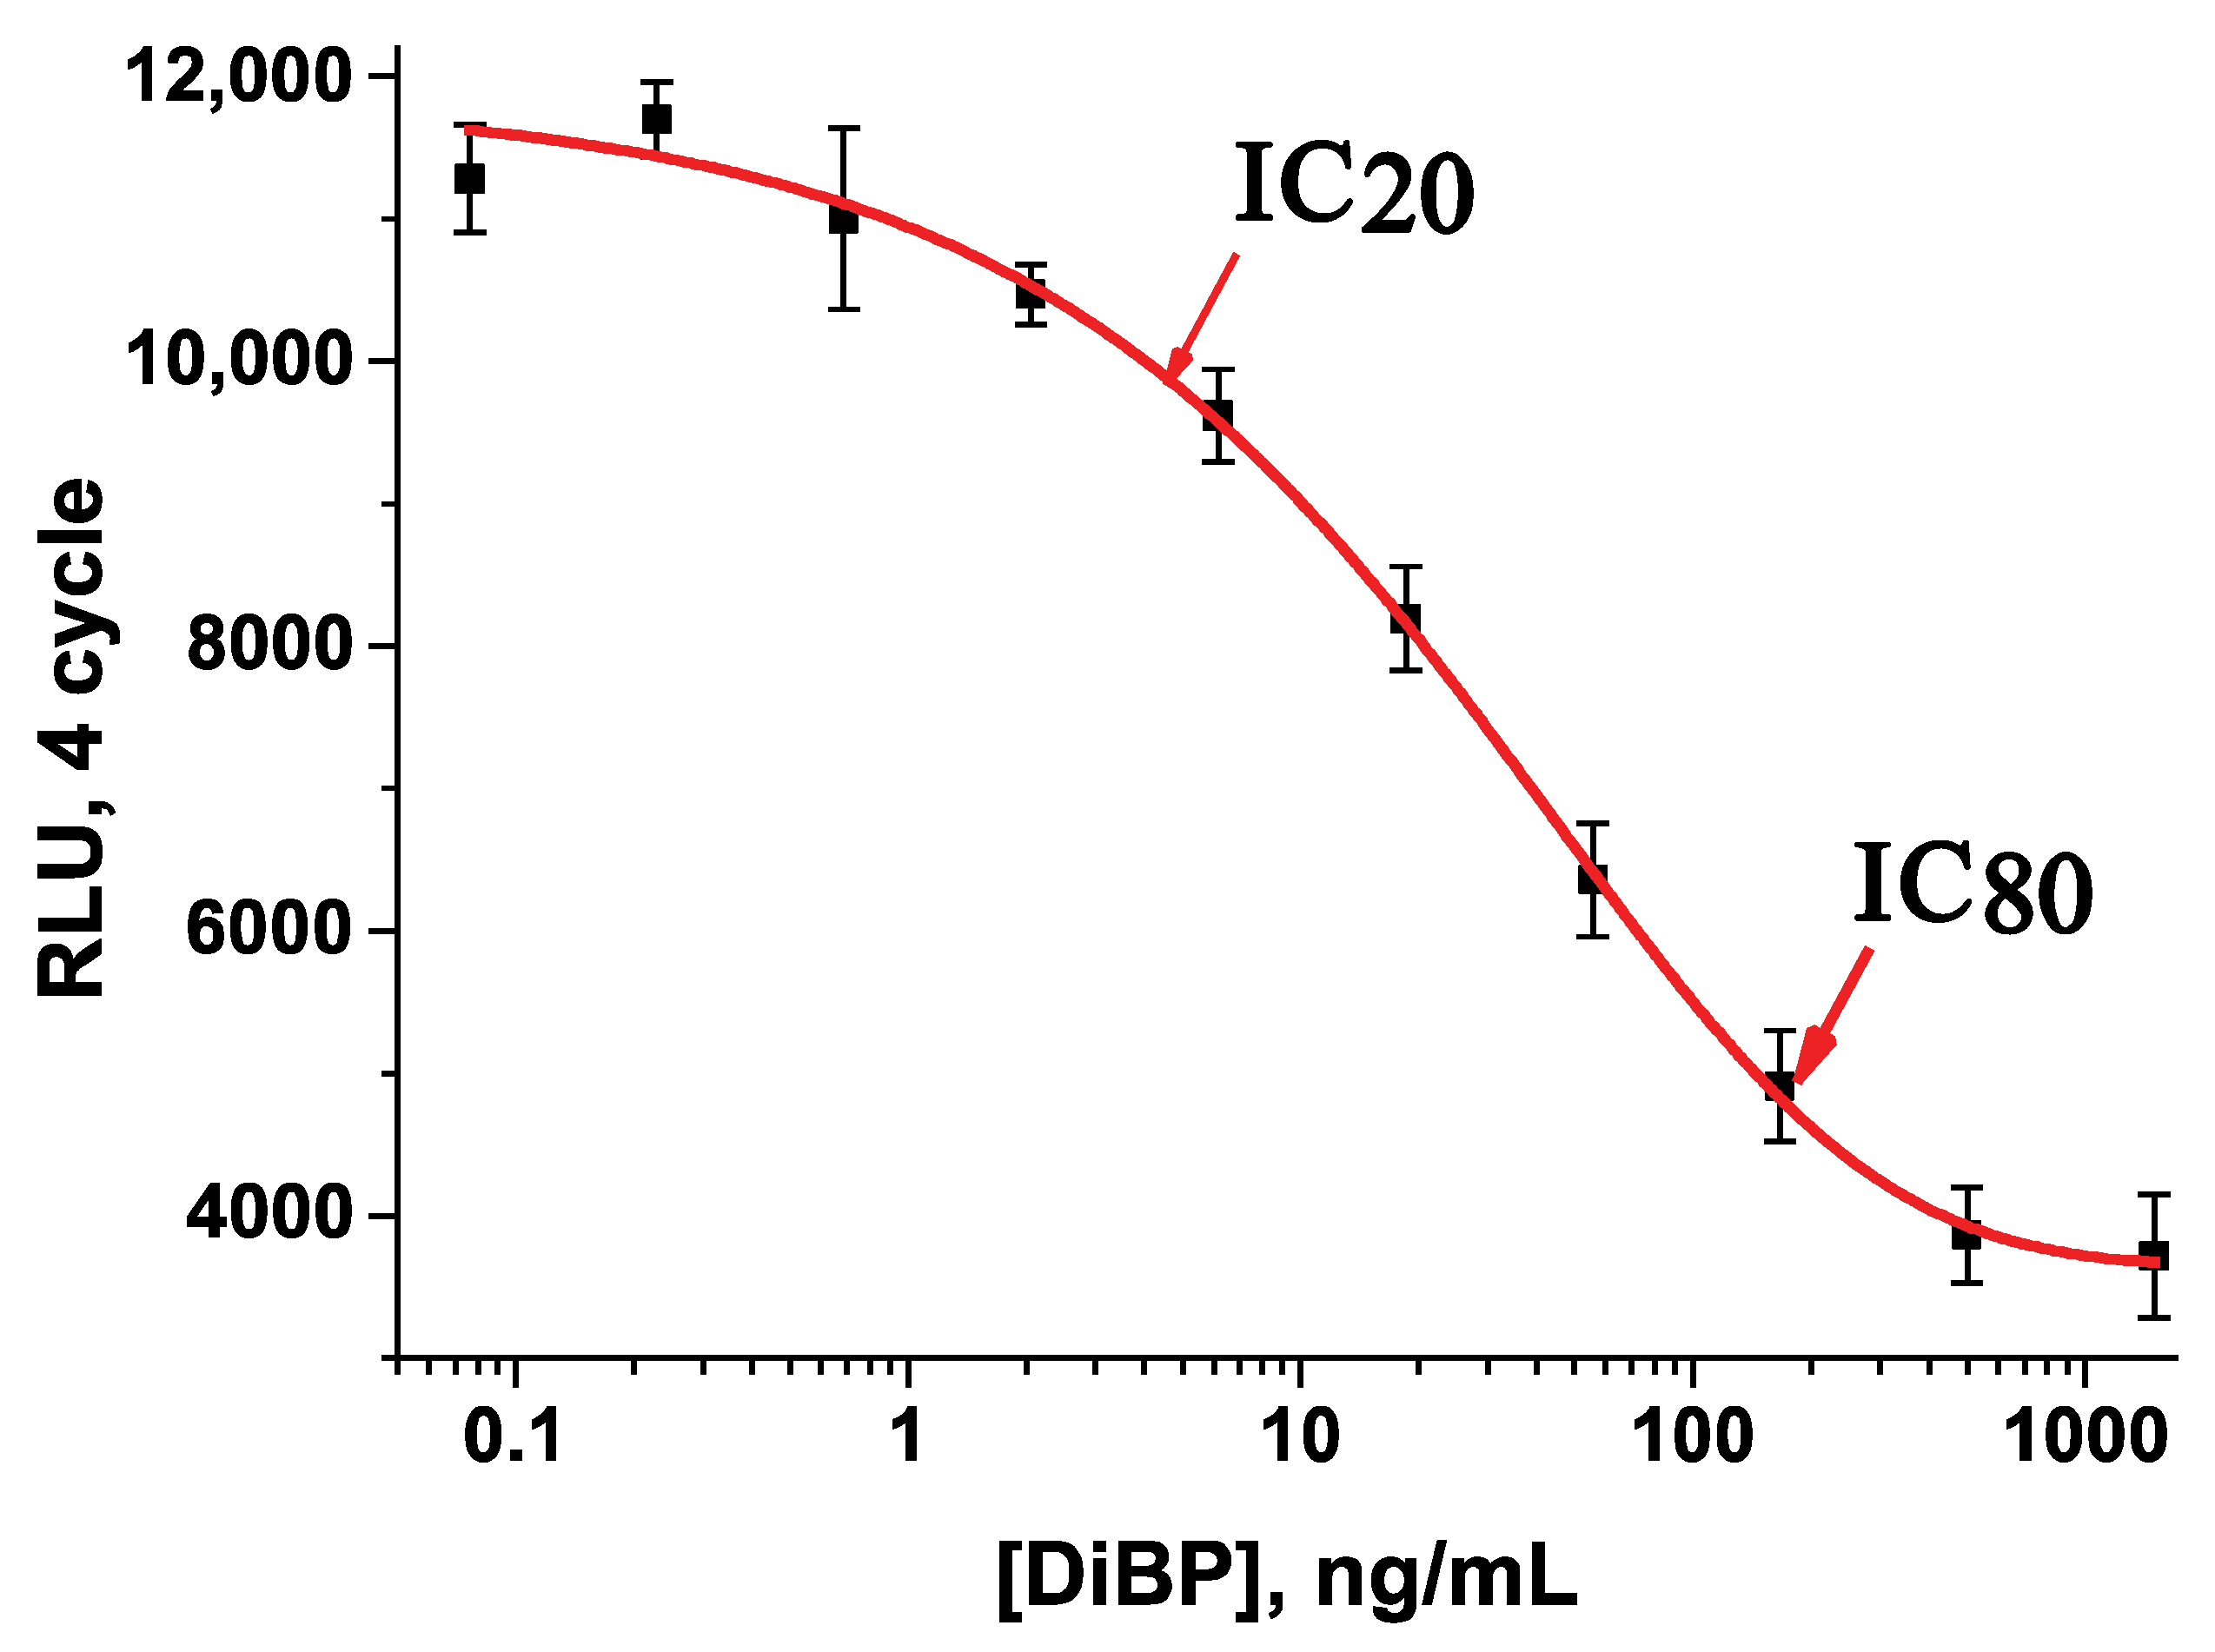
3.4. Analytical Parameters of CL-ELISA

The kinetics of luminol oxidation during peroxidase catalysis depends on the type of peroxidase—cationic (traditionally used in various types of ELISA) or anionic (for example, soybean peroxidase). This system uses horseradish peroxidase as a traditional label. The kinetics of luminol oxidation in this case is descending and it is characterized by a gradual fading of the analytical signal. This means that the RLU values increase (on the measurement cycle 1 or 2) immediately after the addition of the substrate mixture to the wells, after which, we can observe a gradual decrease, and by the fifth measurement cycle (730 s from the start of the reaction), only the background luminescence value remains. Therefore, in order to correctly assess the reproducibility of the results, it is necessary to understand how long the equilibrium is established. Moreover, it is more important when the extracted samples are analyzed to identify the added amounts of DiBP. To understand these changes, the characteristics of the method and their variations over time were analyzed. For this purpose, all chemiluminescent measurements were carried out within 12 min (five cycles) after the addition of the substrate mixture. Each measurement cycle takes 2.4 min, which corresponds to 140–144 s.
There was a gradual increase in chemiluminescence during the first cycle (the signal amplitude was low). Therefore, Table 2 contains data on 2–4 measurement cycles (280–570 s from the moment when the substrate mixture was added) with the corresponding analytical characteristics. Hence, it can be seen that the main parameters changed slightly at different time intervals, but the difference between PBST and PBST with 10% CH3OH is visible. Thus, the detection limit for PBST increased from 2 to 2.7 ng/mL; for PBST with methanol the changes were similar—the detection limit grew from 0.9 to 1.8 ng/mL. As seen from Table 2, all analytical characteristics increased by cycle 4, which is associated with a general drop in the analytical signal in the wells. These data will be useful for a further analysis of sample extracts.

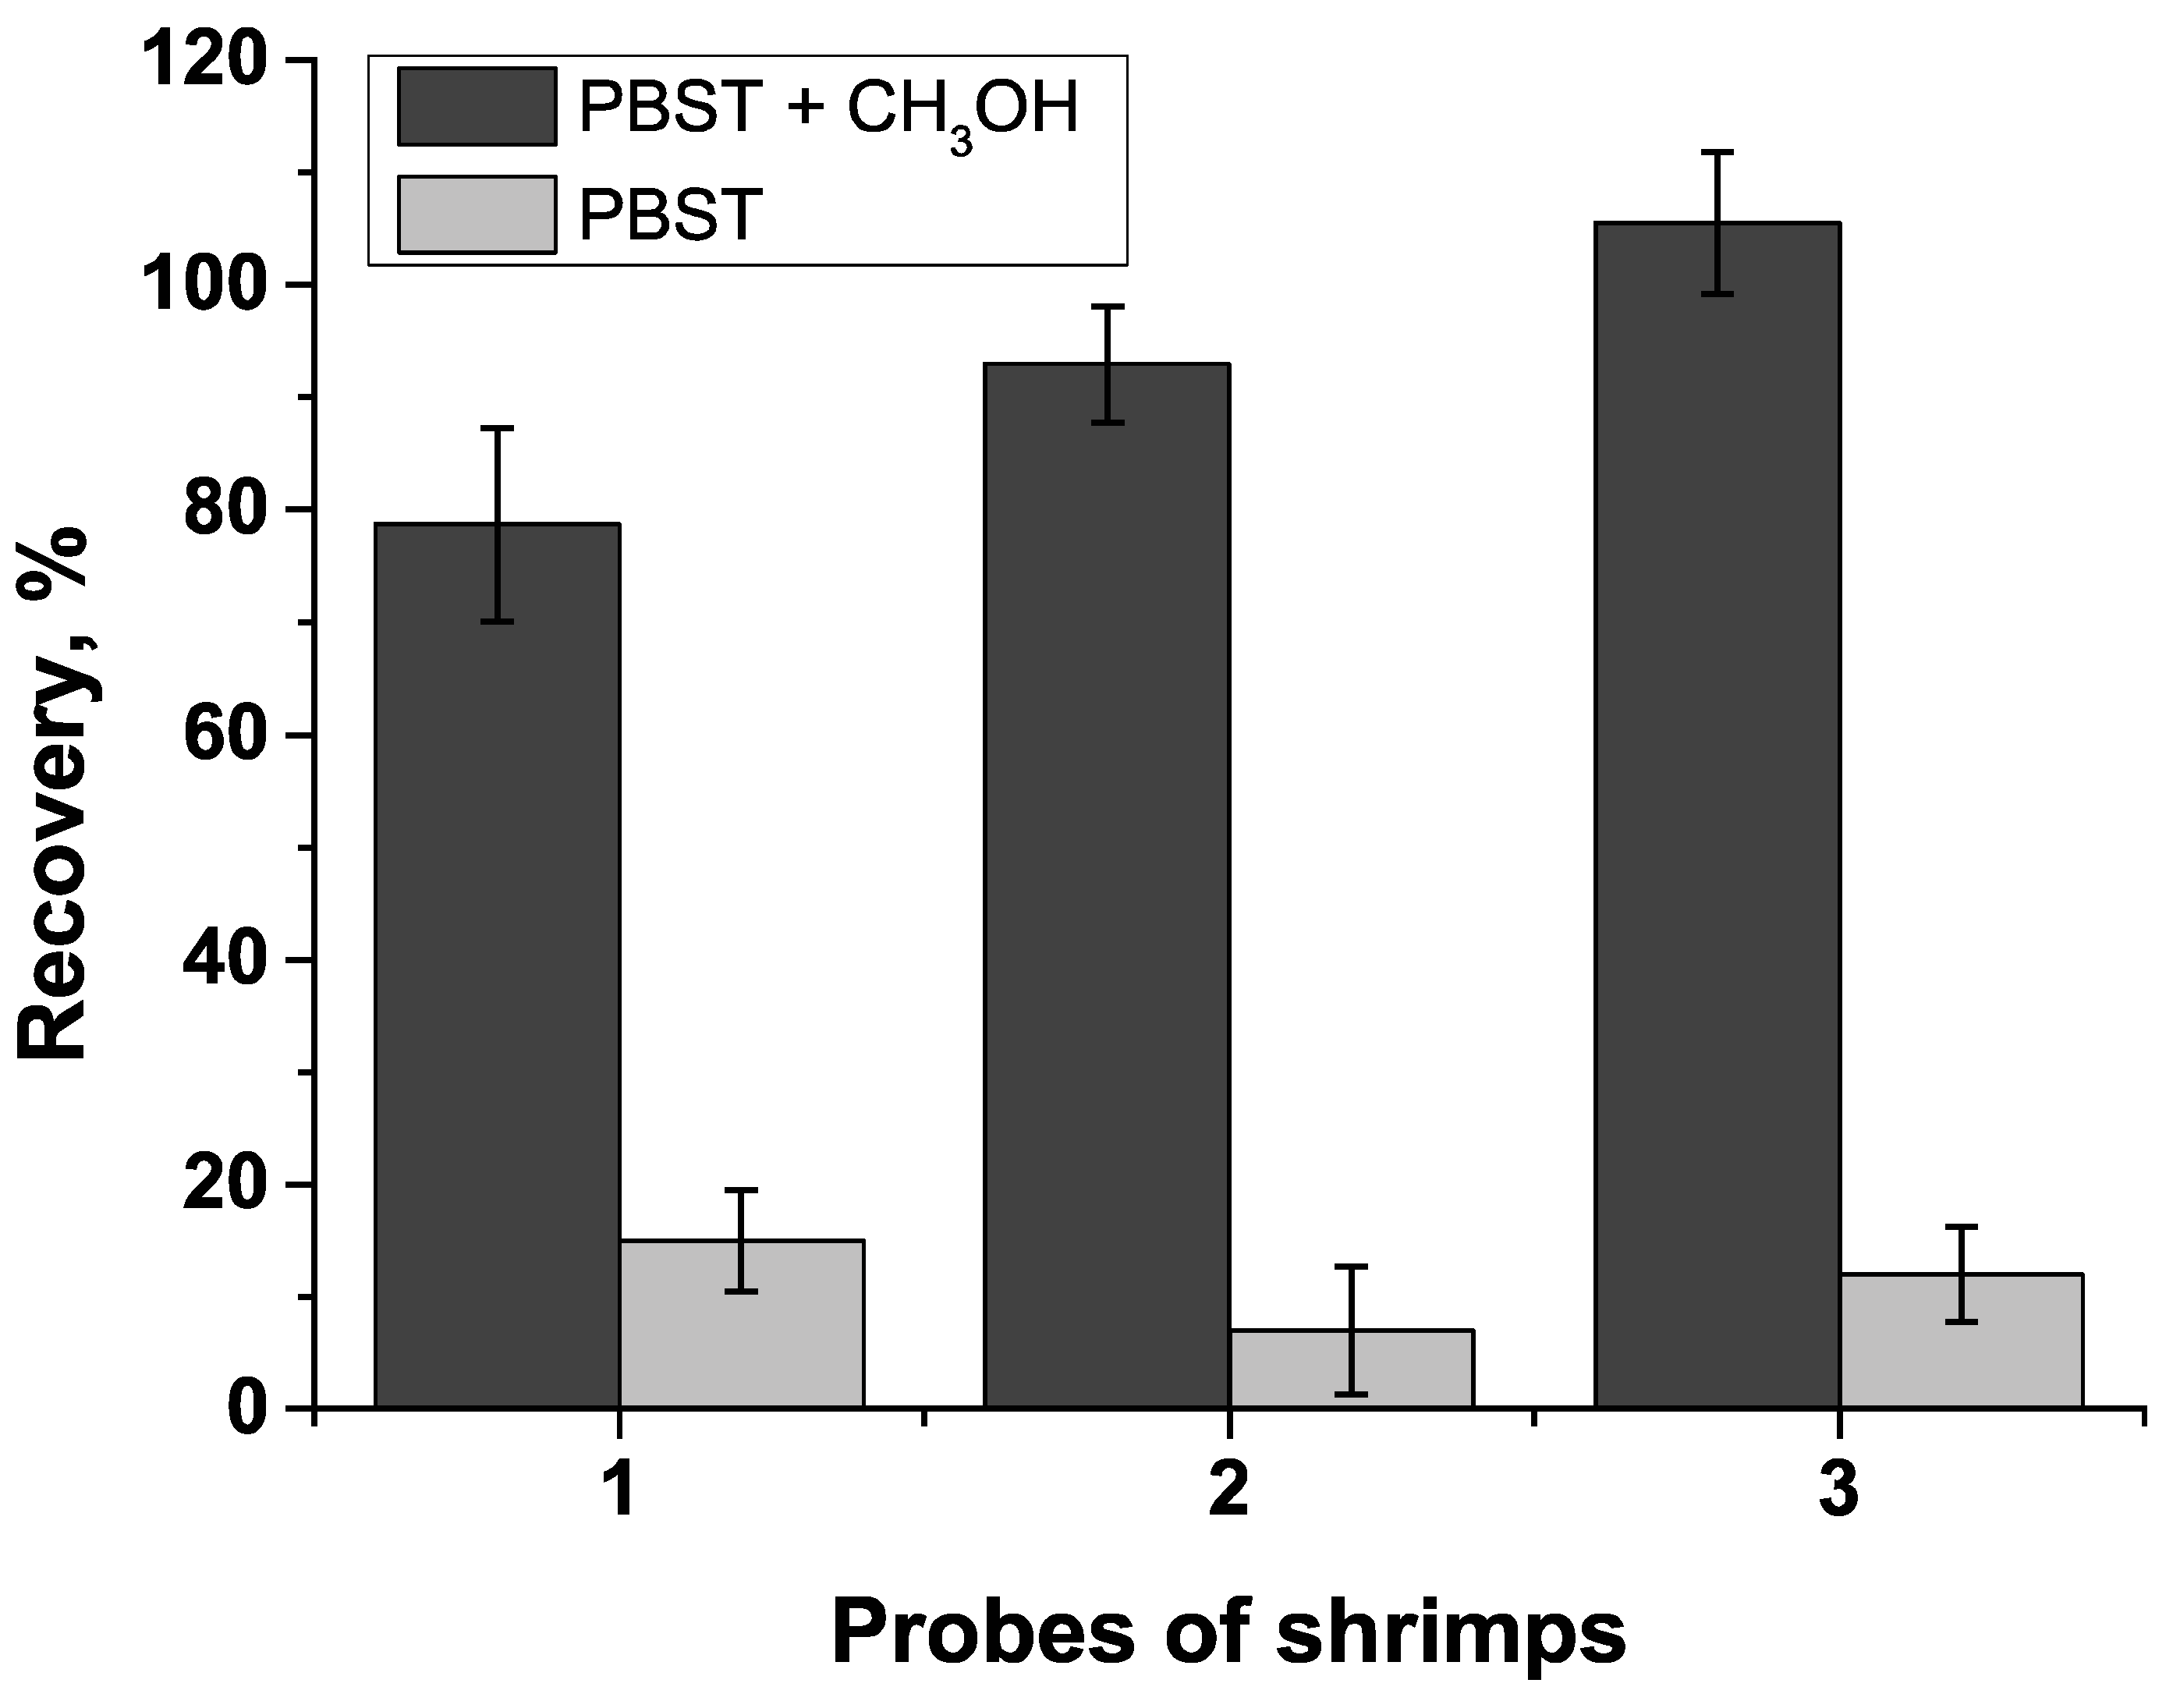
3.5. Analysis of Samples Obtained by Various Extraction Methods

To show the performance and applicability of this method, it was decided to limit ourselves to a set of three groups of samples that differ in chemical composition. Thus, spring water and water from a waterfall were chosen as pure natural objects that were previously used in our research [25,33] and were categorized into the first group. Except for water, PAEs, including DiBP, are also found in seafood as well as in other aquatic life [13]. Thus, when analyzing samples by GC-MS, 22–777 ng/g DiBP were found in fish, 33–5313 ng/g in crustaceans, and 46–78 ng/g in mollusks [14]. According to other published data, 4.8–22.8 ng/g were found in mollusks [34,35]. To expand the list of objects, the effects of the seafood matrix were studied. Aquatic organisms such as shrimp, squid, octopus, mussels, and oysters were included in the second group of samples. The third group of samples included plant objects such as lettuce leaves. The testing of samples before the introduction of phthalates was carried out by GC-MS through the same way as described in [36]. All the samples used were confirmed as pure from phthalates. Then, diisobutyl phthalate was added in various amounts to the phthalate-free samples and extraction was performed. The completeness of extraction with hexane was confirmed by GC-MS using spring water samples.
For different types of samples, two extraction options were used. Since different extraction methods are described in the literature [12,37,38], it was decided to apply two solvents for extraction—methanol and hexane. An analyte can only be extracted from water using liquid–liquid extraction using immiscible liquids, and seafood contains a large number of lipids, so extraction with hexane or acetone is preferable [13,37]. Positive examples of extractions with hexane from different matrices were described [39,40]. Methanol was chosen for lettuce samples for comparison as previously described in the works of the laboratory for hydrophobic analytes [41,42]. The advantages of this type of extraction are simplicity, precision, low LODs, high recovery, and cost-effectiveness [37]. The results were evaluated to understand which extraction method is most suitable for a particular object. The results obtained were extrapolated to the curve in (a) PBST and (b) PBST with 10% CH3OH in wells.
The experimental results showed that PBST as a reaction medium is not suitable for an adequate assessment of DiBP content in the sample, and the percentage of recovery did not exceed 20% (Figure 6, light grey columns). Contrary to these conditions, the addition of methanol to the working buffer allowed for achieving adequate results on the recoveries of DiBP in fortified samples.
In addition, the analytical characteristics of CL-ELISA have been studied at different measurement cycles. The obtained data on chemiluminescence using extracts were correlated with the curve parameters at the same time intervals. Thus, it was found that the maximum approximation of chemiluminescence values using prepared extracts occurs on the fourth measurement cycle. Thus, it became possible to evaluate the data by the added-detected method at 570 s or 9.5 min from the initiation of the chemiluminescent reaction in microplate wells.
The only exception to the rule was the oyster samples. Due to the high content of the lipid fraction, the curve plotted in their matrix had increased values of the background luminescence. Therefore, the analytical characteristics were shifted. Thus, the detection limit was 3.2 ng/mL, and the working range of the studied concentrations was 9.4–367.6 ng/mL (the IC50 value was 58.6 ng/mL). It was clear that the influence of the matrix could not be corrected or eliminated fully and the results in the added-detected method are underestimated by half. Therefore, a correction coefficient of 2 was introduced to demonstrate the results for oysters. The results for all samples are presented in Table 3. Nevertheless, we decided to note this feature in order to demonstrate the samples that require more careful attention and study.
Despite its relevance, diisobutyl phthalate has not often become the object of immunoassay development. Essentially, the described immune methods refer to its isomer, dibutyl phthalate. A comparison with previous works on the determination of diisobutyl phthalate is shown in Table 4. It can be seen that so far, there are only three publications on the determination of DiBP by immunoanalytical methods (fluorescence immunoassay). Chemiluminescent ELISA was not previously considered for analyzing the content of diisobutyl phthalate. At the same time, the developments of CL-ELISA related to dipropyl phthalate and dimethyl phthalate are described [16,43,44]. The novelty of the actual work is also connected with the extraction and determination of DiBP in various matrices—with a high moisture content (water, lettuce leaves), as well as very lipophilic samples (seafood).

4. Conclusions

The aim of this work was to develop a CL-ELISA for the analysis of samples for the content of diisobutyl phthalate in samples. The rabbit anti-DiBP polyclonal antibodies were obtained. The study of the analytical parameters of the curve in chemiluminescence showed that there are differences in time that affect the values of the limits of detection of DiBP and operating ranges, as well as the detection of the added amounts of analyte in the samples. This problem was solved by choosing extraction methods and studying the kinetics of the analytical signal. Therefore, for the samples of water (spring, waterfall) and seafood (squid, octopus, mussels), extraction with hexane was used. Extracts from lettuce leaves were prepared using methanol. It has been shown that the analysis of sample extracts is best conducted at 9.5 min (570 s) after adding the substrate mixture to the plate. Thus, the developed system is characterized by a low detection limit (1.8 ng/mL) and makes it possible to detect samples containing DiBP significantly below the maximum allowable concentration (300 ng/mL). This development is promising from the point of view of practical analysis since it allows the detection of DiBP in samples of various nature and chemical compositions. In addition, this work showed that matrices with a high fat content (oysters) negatively affect the results of the determination of the target analyte, which should be considered when working with such samples.

Author Contributions

All authors contributed equally to this manuscript. Conceptualization, A.N.B. and A.V.Z.; methodology, A.N.B., D.I.G. and M.Y.R.; software, M.Y.R. and A.N.B.; validation, A.N.B., D.I.G. and M.Y.R.; formal analysis, A.N.B.; investigation, A.N.B., M.Y.R. and A.V.Z.; resources, A.V.Z. and B.B.D.; data curation, A.N.B., D.I.G. and M.Y.R.; writing—original draft preparation, A.N.B. and M.Y.R.; writing—review and editing, A.N.B., A.V.Z. and B.B.D.; visualization, A.N.B. and A.V.Z.; supervision, B.B.D.; project administration, A.N.B. and A.V.Z.; funding acquisition, A.N.B. All authors have read and agreed to the published version of the manuscript.

Funding

This work was financially supported by the Russian Science Foundation (grant 21-14-00306).

Institutional Review Board Statement

The animal study protocol was approved by the Institutional Ethics Committee of the Research Center of Biotechnology (protocol code N22-D dated 12 February 2020).

Informed Consent Statement

Not applicable.

Data Availability Statement

Data are contained within the article. Initial data of instrumental measurements are available on request from the corresponding author.

Acknowledgments

The authors are grateful to Yu. A. Varitsev, P.A. Galushko (A.G. Lorch Russian Potato Research Center, Kraskovo, Moscow region, Russia), and N. I. Smirnova (Research Center of Biotechnology of the Russian Academy of Sciences) for the support with rabbit immunization. The authors are grateful to K. V. Serebrennikova and N. S. Komova (Research Center of Biotechnology of the Russian Academy of Sciences) for the support with FT-IR measurements.

Conflicts of Interest

The authors declare no conflict of interest.

References

  1. Rubio, L.; Valverde-Som, L.; Sarabia, L.; Ortiz, M. The behaviour of Tenax as food simulant in the migration of polymer additives from food contact materials by means of gas chromatography/mass spectrometry and PARAFAC. J. Chromatogr. A 2019, 1589, 18–29. [Google Scholar] [CrossRef] [PubMed]
  2. Bononi, M.; Tateo, F. Identification of diisobutyl phthalate (DIBP) suspected as possible contaminant in recycled cellulose for take-away pizza boxes. Packag. Technol. Sci. Int. J. 2009, 22, 53–58. [Google Scholar] [CrossRef]
  3. Benson, R. Hazard to the developing male reproductive system from cumulative exposure to phthalate esters—Dibutyl phthalate, diisobutyl phthalate, butylbenzyl phthalate, diethylhexyl phthalate, dipentyl phthalate, and diisononyl phthalate. Regul. Toxicol. Pharmacol. 2009, 53, 90–101. [Google Scholar] [CrossRef]
  4. Latini, G.; Del Vecchio, A.; Massaro, M.; Verrotti, A.; De Felice, C. Phthalate exposure and male infertility. Toxicology 2006, 226, 90–98. [Google Scholar] [CrossRef]
  5. Giribabu, N.; Reddy, P.S. Protection of male reproductive toxicity in rats exposed to di-n-butyl phthalate during embryonic development by testosterone. Biomed. Pharmacother. 2017, 87, 355–365. [Google Scholar] [CrossRef]
  6. Wang, S.; Wang, S.S.; Wu, D.; Lin, Y.; Ku, C.; Wu, C.; Chai, C.; Lee, J.; Tsai, E.; Lin, C.-L. Androgen receptor-mediated apoptosis in bovine testicular induced pluripotent stem cells in response to phthalate esters. Cell Death Dis. 2013, 4, e907. [Google Scholar] [CrossRef] [Green Version]
  7. Geueke, B.; Inostroza, P.A.; Maffini, M.; Backhaus, T.; Carney-Almroth, B.; Groh, K.J.; Muncke, J. Prioritization Approaches for Hazardous Chemicals Associated with Plastic Packaging; Food Packaging Forum: Zurich, Switzerland, 2018. [Google Scholar]
  8. Maffini, M.V.; Geueke, B.; Groh, K.; Carney Almroth, B.; Muncke, J. Role of epidemiology in risk assessment: A case study of five ortho-phthalates. Environ. Health 2021, 20, 114. [Google Scholar] [CrossRef]
  9. Yost, E.E.; Euling, S.Y.; Weaver, J.A.; Beverly, B.E.J.; Keshava, N.; Mudipalli, A.; Arzuaga, X.; Blessinger, T.; Dishaw, L.; Hotchkiss, A.; et al. Hazards of diisobutyl phthalate (DIBP) exposure: A systematic review of animal toxicology studies. Environ. Int. 2019, 125, 579–594. [Google Scholar] [CrossRef]
  10. Hlisníková, H.; Kolena, B.; Šidlovská, M.; Mlynček, M.; Petrovičová, I. Urinary Phthalate Biomarkers during Pregnancy, and Maternal Endocrine Parameters in Association with Anthropometric Parameters of Newborns. Children 2022, 9, 413. [Google Scholar] [CrossRef] [PubMed]
  11. Wang, W.; Leung, A.O.W.; Chu, L.H.; Wong, M.H. Phthalates contamination in China: Status, trends and human exposure-with an emphasis on oral intake. Environ. Pollut. 2018, 238, 771–782. [Google Scholar] [CrossRef]
  12. Guo, Y.; Kannan, K. Challenges encountered in the analysis of phthalate esters in foodstuffs and other biological matrices. Anal. Bioanal. Chem. 2012, 404, 2539–2554. [Google Scholar] [CrossRef] [PubMed]
  13. Hidalgo-Serrano, M.; Borrull, F.; Marcé, R.M.; Pocurull, E. Phthalate esters in marine ecosystems: Analytical methods, occurrence and distribution. TrAC Trends Anal. Chem. 2022, 151, 116598. [Google Scholar] [CrossRef]
  14. Cui, X.; Wu, P.; Lai, D.; Zheng, S.; Chen, Y.; Eremin, S.A.; Peng, W.; Zhao, S. Development of a highly specific fluorescence immunoassay for detection of diisobutyl phthalate in edible oil samples. J. Agric. Food Chem. 2015, 63, 9372–9378. [Google Scholar] [CrossRef] [PubMed]
  15. Vavrouš, A.; Ševčík, V.C.; Dvořáková, M.T.; Čabala, R.R.; Moulisová, A.; Vrbík, K. Easy and Inexpensive Method for Multiclass Analysis of 41 Food Contact Related Contaminants in Fatty Food by Liquid Chromatography–Tandem Mass Spectrometry. J. Agric. Food Chem. 2019, 67, 10968–10976. [Google Scholar] [CrossRef]
  16. Li, L.; Zhang, M. Development of immunoassays for the determination of phthalates. Food Agric. Immunol. 2020, 31, 303–316. [Google Scholar] [CrossRef]
  17. Chen, Y.; He, Q.; Shen, D.; Jiang, Z.; Eremin, S.A.; Zhao, S. Fluorescence polarization immunoassay based on a new monoclonal antibody for the detection of the Diisobutyl phthalate in Yoghurt. Food Control 2019, 105, 38–44. [Google Scholar] [CrossRef]
  18. Chen, Y.; Cui, X.; Wu, P.; Jiang, Z.; Jiao, L.; Hu, Q.; Eremin, S.A.; Zhao, S. Development of a homologous fluorescence polarization immunoassay for diisobutyl phthalate in romaine lettuce. Food Anal. Methods 2017, 10, 449–458. [Google Scholar] [CrossRef]
  19. Zhai, R.; Chen, G.; Liu, G.; Huang, X.; Xu, X.; Li, L.; Zhang, Y.; Xu, D.; El-Aty, A.M.A. Comparison of Chemiluminescence Enzyme Immunoassay (Cl-ELISA) with Colorimetric Enzyme Immunoassay (Co-ELISA) for Imidacloprid Detection in Vegetables. Foods 2023, 12, 196. [Google Scholar] [CrossRef]
  20. Darwish, I.A.; Alzoman, N.Z.; Khalil, N.N. A Novel Highly Sensitive Chemiluminescence Enzyme Immunoassay with Signal Enhancement Using Horseradish Peroxidase-Luminol-Hydrogen Peroxide Reaction for the Quantitation of Monoclonal Antibodies Used for Cancer Immunotherapy. Chemosensors 2023, 11, 245. [Google Scholar] [CrossRef]
  21. Yu, F.-Y.; Gribas, A.V.; Vdovenko, M.M.; Sakharov, I.Y. Development of ultrasensitive direct chemiluminescent enzyme immunoassay for determination of aflatoxin B1 in food products. Talanta 2013, 107, 25–29. [Google Scholar] [CrossRef]
  22. Kurseev, S.A.; Solovjev, A.M.; Neumann, M.M.; Medvedko, A.V.; Sakharov, I.Y. Chemiluminescent and colorimetric aptamer-based assays of human α-thrombin. Anal. Lett. 2020, 53, 140–151. [Google Scholar] [CrossRef]
  23. Sakharov, I.Y.; Berlina, A.N.; Zherdev, A.V.; Dzantiev, B.B. Advantages of soybean peroxidase over horseradish peroxidase as the enzyme label in chemiluminescent enzyme-linked immunosorbent assay of sulfamethoxypyridazine. J. Agric. Food Chem. 2010, 58, 3284–3289. [Google Scholar] [CrossRef] [PubMed]
  24. Tian, X.; Dong, Y.; Wang, Y.; Song, Z.; Meng, M.; Eremin, S.A.; Deng, C.; Yin, Y.; Xi, R. Quantification of Diethyl Phthalate by a Rapid and Homogenous Fluorescence Polarization Immunoassay. Anal. Lett. 2015, 48, 2843–2855. [Google Scholar] [CrossRef]
  25. Berlina, A.N.; Ragozina, M.Y.; Komova, N.S.; Serebrennikova, K.V.; Zherdev, A.V.; Dzantiev, B.B. Development of Lateral Flow Test-System for the Immunoassay of Dibutyl Phthalate in Natural Waters. Biosensors 2022, 12, 1002. [Google Scholar] [CrossRef] [PubMed]
  26. Wang, Y.; He, C.-H.; Zheng, H.; Zhang, H.-B. Characterization and comparison of fumonisin B1-protein conjugates by six methods. Int. J. Mol. Sci. 2011, 13, 84–96. [Google Scholar] [CrossRef] [Green Version]
  27. Mi, J.; Dong, X.; Zhang, X.; Li, C.; Wang, J.; Mujtaba, M.G.; Zhang, S.; Wen, K.; Yu, X.; Wang, Z. Novel hapten design, antibody recognition mechanism study, and a highly sensitive immunoassay for diethylstilbestrol in shrimp. Anal. Bioanal. Chem. 2019, 411, 5255–5265. [Google Scholar] [CrossRef]
  28. Kuang, H.; Xu, L.; Cui, G.; Ma, W.; Xu, C. Development of determination of di-n-octyl phthalate (DOP) residue by an indirect enzyme-linked immunosorbent assay. Food Agric. Immunol. 2010, 21, 265–277. [Google Scholar] [CrossRef]
  29. Nevanen, T.K.; Söderholm, L.; Kukkonen, K.; Suortti, T.; Teerinen, T.; Linder, M.; Söderlund, H.; Teeri, T.T. Efficient enantioselective separation of drug enantiomers by immobilised antibody fragments. J. Chromatogr. A 2001, 925, 89–97. [Google Scholar] [CrossRef]
  30. Ren, X.; Zhang, F.; Chen, F.; Yang, T. Development of a sensitive monoclonal antibody-based ELISA for the detection of clenbuterol in animal tissues. Food Agric. Immunol. 2009, 20, 333–344. [Google Scholar] [CrossRef] [Green Version]
  31. Berlina, A.N.; Zherdev, A.V.; Xu, C.; Eremin, S.A.; Dzantiev, B.B. Development of lateral flow immunoassay for rapid control and quantification of the presence of the colorant Sudan I in spices and seafood. Food Control 2017, 73, 247–253. [Google Scholar] [CrossRef]
  32. Kuang, H.; Liu, L.; Xu, L.; Ma, W.; Guo, L.; Wang, L.; Xu, C. Development of an enzyme-linked immunosorbent assay for dibutyl phthalate in liquor. Sensors 2013, 13, 8331–8339. [Google Scholar] [CrossRef] [Green Version]
  33. Komova, N.S.; Serebrennikova, K.V.; Berlina, A.N.; Zherdev, A.V.; Dzantiev, B.B. Low-Tech Test for Mercury Detection: A New Option for Water Quality Assessment. Chemosensors 2022, 10, 413. [Google Scholar] [CrossRef]
  34. Castro-Jiménez, J.; Ratola, N. An innovative approach for the simultaneous quantitative screening of organic plastic additives in complex matrices in marine coastal areas. Environ. Sci. Pollut. Res. 2020, 27, 11450–11457. [Google Scholar] [CrossRef] [PubMed]
  35. Lo Brutto, S.; Iaciofano, D.; Lo Turco, V.; Potortì, A.G.; Rando, R.; Arizza, V.; Di Stefano, V. First assessment of plasticizers in marine coastal litter-feeder fauna in the Mediterranean Sea. Toxics 2021, 9, 31. [Google Scholar] [CrossRef] [PubMed]
  36. Savinova, O.; Shabaev, A.; Glazunova, O.; Eremin, S.; Fedorova, T. Biodestruction of phthalic acid esters by white rot fungi. Appl. Biochem. Microbiol. 2022, 58, 598–612. [Google Scholar] [CrossRef]
  37. Russo, M.V.; Avino, P.; Perugini, L.; Notardonato, I. Extraction and GC-MS analysis of phthalate esters in food matrices: A review. Rsc. Adv. 2015, 5, 37023–37043. [Google Scholar] [CrossRef]
  38. Vinod, V.; Harathi, P. A critical review on extraction and analytical methods of phthalates in water and beverages. J. Chromatogr. A 2022, 1675, 463175. [Google Scholar]
  39. Das, M.T.; Ghosh, P.; Thakur, I.S. Intake estimates of phthalate esters for South Delhi population based on exposure media assessment. Environ. Pollut. 2014, 189, 118–125. [Google Scholar] [CrossRef] [PubMed]
  40. Xu, F.; Wang, W.; Jiang, H.; Wang, Z.; Wang, Z.; Guo, P.; Sun, S.; Ding, S. Indirect competitive enzyme-linked immunosorbent assay for the detection of dibutyl phthalate in white wine, compared with GC-MS. Food Anal. Methods 2014, 7, 1619–1626. [Google Scholar] [CrossRef]
  41. Hendrickson, O.D.; Zvereva, E.A.; Zherdev, A.V.; Dzantiev, B.B. Cascade-enhanced lateral flow immunoassay for sensitive detection of okadaic acid in seawater, fish, and seafood. Foods 2022, 11, 1691. [Google Scholar] [CrossRef]
  42. Hendrickson, O.D.; Zvereva, E.A.; Solopova, O.N.; Zherdev, A.V.; Sveshnikov, P.G.; Eremin, S.A.; Dzantiev, B.B. Double immunochromatographic test system for sensitive detection of phycotoxins domoic acid and okadaic acid in seawater and seafood. Micromachines 2022, 13, 1506. [Google Scholar] [CrossRef] [PubMed]
  43. Zhu, B.; Zhu, F.; Xu, F.; Yang, J.; Liu, C.; Sun, Y.; Wang, H.; Lei, H.; Shen, Y. Indirect competitive chemiluminescent enzyme immunoassay method for determination of dimethyl phthalate in soy sauce and liquor. Chin. J. Anal. Chem. 2015, 43, 1027–1032. [Google Scholar] [CrossRef]
  44. Zhang, M.; Hu, Y.; Liu, S.; Cong, Y.; Liu, B.; Wang, L. Rapid monitoring of dipropyl phthalate in food samples using a chemiluminescent enzyme immunoassay. Food Anal. Methods 2012, 5, 1105–1113. [Google Scholar] [CrossRef]
Figure 1. Principle of the proposed development, including two parts—immunization and the use of obtained antibodies. The left part demonstrates conjugate’s synthesis by azo coupling method, rabbit immunization, and the obtaining of specific antibodies to DiBP. The right part shows the principle of the immune complexes formation and the generation of a chemiluminescent signal during the oxidation of luminol by horseradish peroxidase in microplate wells.
Chemosensors 11 00393 g001
Figure 2. Characterization of BSA-DiBP (A) and STI-DiBP (B) by FT-IR technique, including spectra of corresponding conjugates (black lines), native DiBP (red lines), and native carrier proteins (purple lines).
Chemosensors 11 00393 g002
Figure 3. Absorption spectra of the obtained conjugates.
Chemosensors 11 00393 g003
Figure 4. Dependence of the chemiluminescent signal on the DiBP concentration in PBST (n = 2), cycle 1 (R2 = 0.991).
Chemosensors 11 00393 g004
Figure 5. Calibration curve of CL-ELISA for the determination of DiBP using PBST buffer with 20% CH3OH, cycle 4 (R2 = 0.995).
Chemosensors 11 00393 g005
Figure 6. A histogram showing the average values of the detected DiBP in shrimp samples when extrapolating the data of relative luminescence units to the corresponding curve in PBST and PBST with methanol at the fourth measurement cycle. The values of DiBP in the case of methanol extraction were statistically significantly higher for all samples (n = 3, p < 0.001).
Chemosensors 11 00393 g006
Table 1. Analytical parameters of colorimetric competitive ELISA with the use of rabbit antisera.
rAs Number IC10, ng/mL IC20, ng/mLIC80, ng/mL
No. 14.814.3593.7
No. 25.212.6271.6
No. 33.37.9161.6
Table 2. Analytical parameters of chemilinescent competitive ELISA with the use of rabbit antisera.
MeasurementIC10, ng/mLIC20, ng/mLIC80, ng/mLIC50, ng/mL
PBST + 10% CH3OH
Cycle 2 (280 sec. є)0.93.0164.222.3
Cycle 3 (430 sec. є)1.23.7174.825.3
Cycle 4 (570 sec. є)1.85.0170.829.2
PBST
Cycle 2 (280 sec. є)2.16.1248.938.9
Cycle 3 (430 sec. є)2.26.4235.338.7
Cycle 4 (570 sec. є)2.77.3220.140.1
Table 3. Analysis of samples fortified with DiBP (conversion to organic extract) using this method (n = 2, cycle 4 of measurements).
SampleAdded DiBP, ng/mLFound DiBP, ng/mLRecovery, %CV, %
Spring water1011.3113.43.4
3023.979.54.5
9089.098.81.8
Waterfall water1010.3103.06.8
3032.9109.55.9
9092.6102.93.8
Romaine lettuce107.878.43.2
3029.999.76.9
9094.7105.24.3
Iceberg lettuce109.897.75.4
3036.7122.38.2
90105.0116.72.9
Shrimps107.978.75.4
3027.992.978.0
9095.0105.56.1
Oysters *106.7134.2 *7.4
3013.088.0 *6.5
9040.990.89 *5.0
Squid109.695.52.6
18.520.9112.76.5
55.543.478.25.5
Octopus6.26.6106.83.2
18.511.160.28.5
55.547.786.04.6
Mussels6.27.9126.92.3
18.514.779.24.5
55.542.776.98.9
* With coefficient ×2.0. CV—The intra-assay coefficient of variation obtained from two measurements.
Table 4. Developed immunotechniques for DiBP detection.
SampleAssay TypeLODWorking RangeType of AbSelectivity (% of Cross-Reaction)Ref.
Yoghurt FPIA0.82 ng/mL1.16–74.97 ng/mLmAbDiBP (100%)[17]
Romaine lettuceFPIA1.77 ng/mL8.82–2152.84 ng/mLpAbDiBP (100%)
DCHP (7.37%)
[18]
Edible oil Fluorescent immunoassay5.82 ng/mL pAbDiBP (100%)
DiBAP (12.6%)
DBP (0.95%)
[14]
Romaine lettuce
aquatic organisms
natural water
CL-ELISA1.8 ng/mL5.0–170.8 ng/mLpAbDiBP (100%)
DBP (12.4%)
This work
Disclaimer/Publisher’s Note: The statements, opinions and data contained in all publications are solely those of the individual author(s) and contributor(s) and not of MDPI and/or the editor(s). MDPI and/or the editor(s) disclaim responsibility for any injury to people or property resulting from any ideas, methods, instructions or products referred to in the content.

