
Theoretical and Experimental Research on Ammonia Sensing Properties of Sulfur-Doped Graphene Oxide


1
The College of Information Science and Engineering, Northeastern University, Shenyang 110819, China
2
Hebei Key Laboratory of Micro-Nano Precision Optical Sensing and Measurement Technology, Qinhuangdao 066004, China
3
Key Laboratory of Data Analytics and Optimization for Smart Industry, Northeastern University, Ministry of Education, Shenyang 110819, China
4
School of Electronic Information Engineering, Ningxia Institute of Science and Technology, Shizuishan 753000, China
*
Author to whom correspondence should be addressed.
Chemosensors 2021, 9(8), 220; https://0-doi-org.brum.beds.ac.uk/10.3390/chemosensors9080220
Submission received: 2 July 2021
/
Revised: 7 August 2021
/
Accepted: 10 August 2021
/
Published: 11 August 2021
(This article belongs to the Special Issue 2D Materials for Gas Sensing)
Abstract
:In this paper, gas sensing characteristics of sulfur-doped graphene oxide (S-GO) are firstly presented. The results of the sensing test revealed that, at room temperature (20 °C), S-GO has the optimal sensitivity to NH3. The S-GO gas sensor has a relatively short response and recovery time for the NH3 detection. Further, the sensing limit of ammonia at room temperature is 0.5 ppm. Theoretical models of graphene and S-doped graphene are established, and electrical properties of the graphene and S-doped graphene are calculated. The enhanced sensing performance was ascribed to the electrical properties’ improvement after the graphene was S-doped.
1. Introduction
Ammonia, as a harmful gas, not only damages the environment and endangers human health, but is also one of the contributors to PM2.5. At present, the increase in ammonia content in the environment is mainly due to direct or indirect human activities. According to the report of the European Union, the quality of ammonia emitted to the environment is about 20 to 30 million tons every year. In recent years, with the further development of the chemical industry and agriculture, people’s awareness of environmental protection has also been increasing, thus the demand for monitoring ammonia concentration is also increasing [1,2,3]. On the other hand, ammonia will do harm to human health. Research shows that the concentration of ammonia must be lower than 20 ppm in the environment wherein humans work, so that it will not affect human health. Therefore, it is necessary to detect low concentrations of ammonia [4,5,6]. Currently, the common ammonia detection methods are optical [7], calorimetric [8], gasphase chromatography, and acoustic methods. These methods require special instruments and equipment, and problems exist such as high cost, large size, inconvenience in use, inability to monitor in real time, and difficulty in widespread. These methods require special instruments and equipment, which are costly, bulky, inconvenient, cannot be monitored in real time, and difficult to apply widely. The gas sensitive sensor can effectively overcome the problems of these traditional methods and is a promising method for ammonia detection [9].
Graphene is a two-dimensional planar material formed by the close arrangement of carbon atoms [10,11,12]. Since its discovery in 2004, graphene has attracted a lot of attention owing to its excellent physical and chemical properties, and has been further applied to many industries and research fields. Graphene has good electrical conductivity, high electron mobility at room temperature (RT), high mechanical strength, and high strength and toughness in the discovered materials [13,14,15]. In terms of thermal properties, graphene has high thermal conductivity, which is the highest among known carbon materials. Graphene is composed of carbon atoms, so its chemical properties are relatively stable. At the same time, it can adsorb and desorb many atoms and molecules [16,17,18]. On the one hand, its characteristics can be changed by modification and doping [19,20,21]. On the other hand, it can be used as a sensitive material for gas sensor to adsorb and detect gas molecules. Because of the above excellent properties, graphene has been widely used in basic research [22], various sensors [23], micro transistors, new energy batteries [24], aerospace materials, and other fields [25]. Few studies exist on sulfur-doped graphene oxide nanosheets. For example, Yang et al. reported S-doped GNs, derived from annealing of graphene-oxide (GO) and benzyl disulfide, as a highly efficient metal-free catalyst for alkaline medium [26]. Choi et al. prepared N- and S-doped carbons via the pyrolysis of cysteine [27]; however, the applicability of these approaches is significantly limited by the issues of high cost and inability to scale up.
In this work, sulfur-doped graphene oxide (S-GO) was synthesized. The detection limit of ammonia was down to 0.5 ppm and the working temperature was room temperature. The synthesized materials were characterized by scanning electron microscopy (SEM) and Fourier transform infrared absorption spectroscopy (FTIR), which proved the successful doping of sulfur. Then, the gas sensing performance test is carried out, including the sensitivity test of ammonia, concentration gradient test, and selectivity and stability test. The experimental results show that the material has a better response to ammonia and can detect ammonia at room temperature. At the same time, it has a lower response to other gases and can detect ammonia in a complex gas environment, which has a certain practical value.
2. Materials and Methods
2.1. Materials
Graphite powder (99%), concentrated sulfuric acid (H2SO4, 98%), potassium permanganate (KMnO4, 99%), concentrated hydrochloric acid (HCl, 35–36%), hydrogen peroxide (H2O2, 30%), thiourea (CH4N2S, 99%), and ethanol (99%). All chemicals were purchased from Shandong Xiya reagent, and were of analytical grade and could be used without further purification.
2.2. Synthesis of S-GO
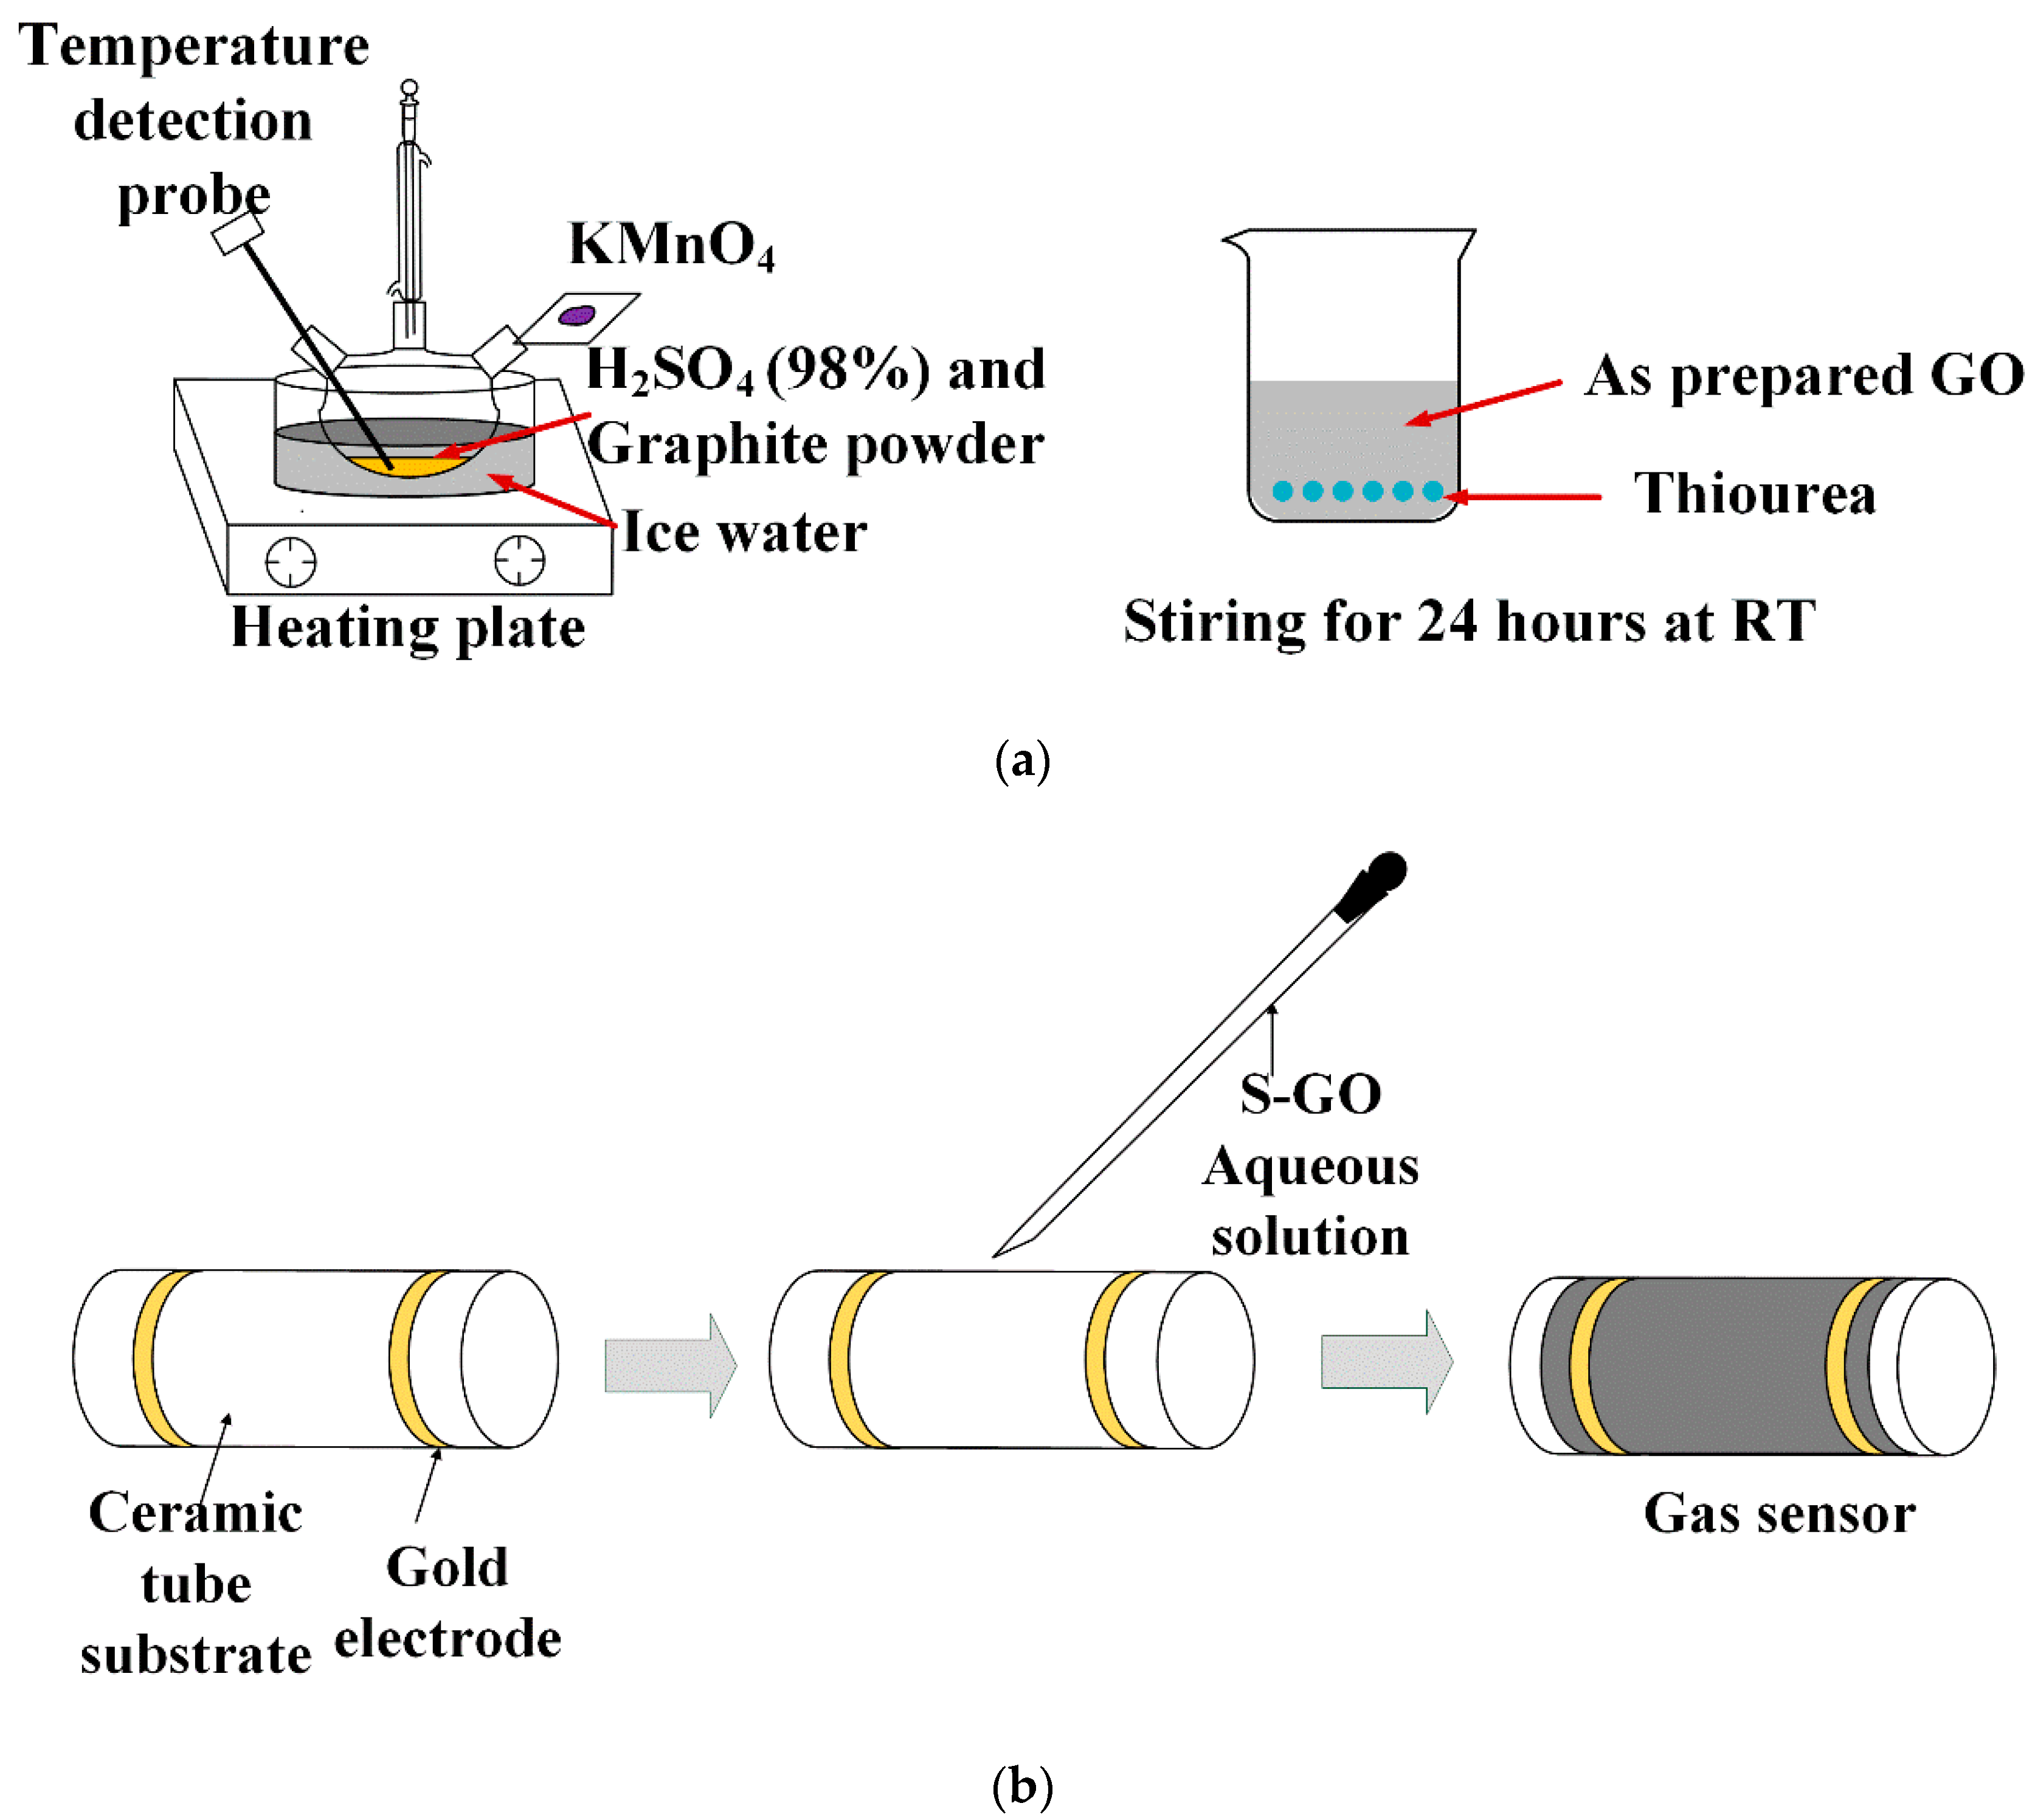
Graphene oxide was synthesized by the improved Hummer method [28,29]. As shown in Figure 1a, with continuous stirring in an ice water bath, 3 g of graphite powder was added into 150 mL of 98% concentrated sulfuric acid, then 9 g of potassium permanganate was slowly added to the solution while the temperature of the solution was lower than 5 °C. In the next step, the mixed solution was transferred to the water bath system and stirred at 40 °C for 30 min. Then, 300 mL distilled water was gradually added to the solution and kept at 95 °C for 15 min under continuous stirring. Then, 500 mL distilled water and 50 mL hydrogen peroxide were added to stop the chemical reaction. The obtained substance was washed several times with diluted HCl solution and pure water until the PH was close to 7. The obtained graphene oxide was dispersed in water to obtain graphene oxide aqueous solution. Finally, the obtained aqueous solution was centrifuged to remove the unreacted graphite.
After oxidation treatment, graphite oxide was intercalated by strong oxidant to form graphene oxide flakes, and hydroxyl and epoxy groups were randomly distributed on graphene oxide flakes. A stable, light brown yellow single-layer graphene oxide suspension was formed in water.
Owing to the reducibility of the sulfur source, the hydrothermal method at high temperature and high pressure will lead to the reduction reaction of graphene oxide and the number of oxygen-containing groups on the surface will be greatly reduced, resulting in the decrease in gas adsorption capacity. At the same time, the conditions at high temperature and high pressure will lead to the agglomeration of graphene, which will reduce its specific surface area. Thus, we choose to add the sulfur source into graphene oxide solution at room temperature and stir it for a long time to make the sulfur element adhere to the surface of graphene oxide to obtain S-GO as S-1. The specific synthesis method is as follows: take 30 mL graphene oxide solution of 1 mg/mL, disperse it evenly by ultrasound, add excessive thiourea, stir it vigorously for 12 h at room temperature, then wash and centrifuge the mixed solution, finally get the muddy substance, and carry out the next gas sensitivity test.
2.3. Sensor Fabrication and Gas Sensor Measurement System
The schematic illustration of sensor fabrication can be depicted in Figure 1b. The as-prepared GO and S-GO were dispersed in ethanol and dropped on ceramic tube substrate with gold electrodes by rubber tipped dropper separately. When the materials were dried at room temperature, the ceramic tube was connected to the test system for testing.
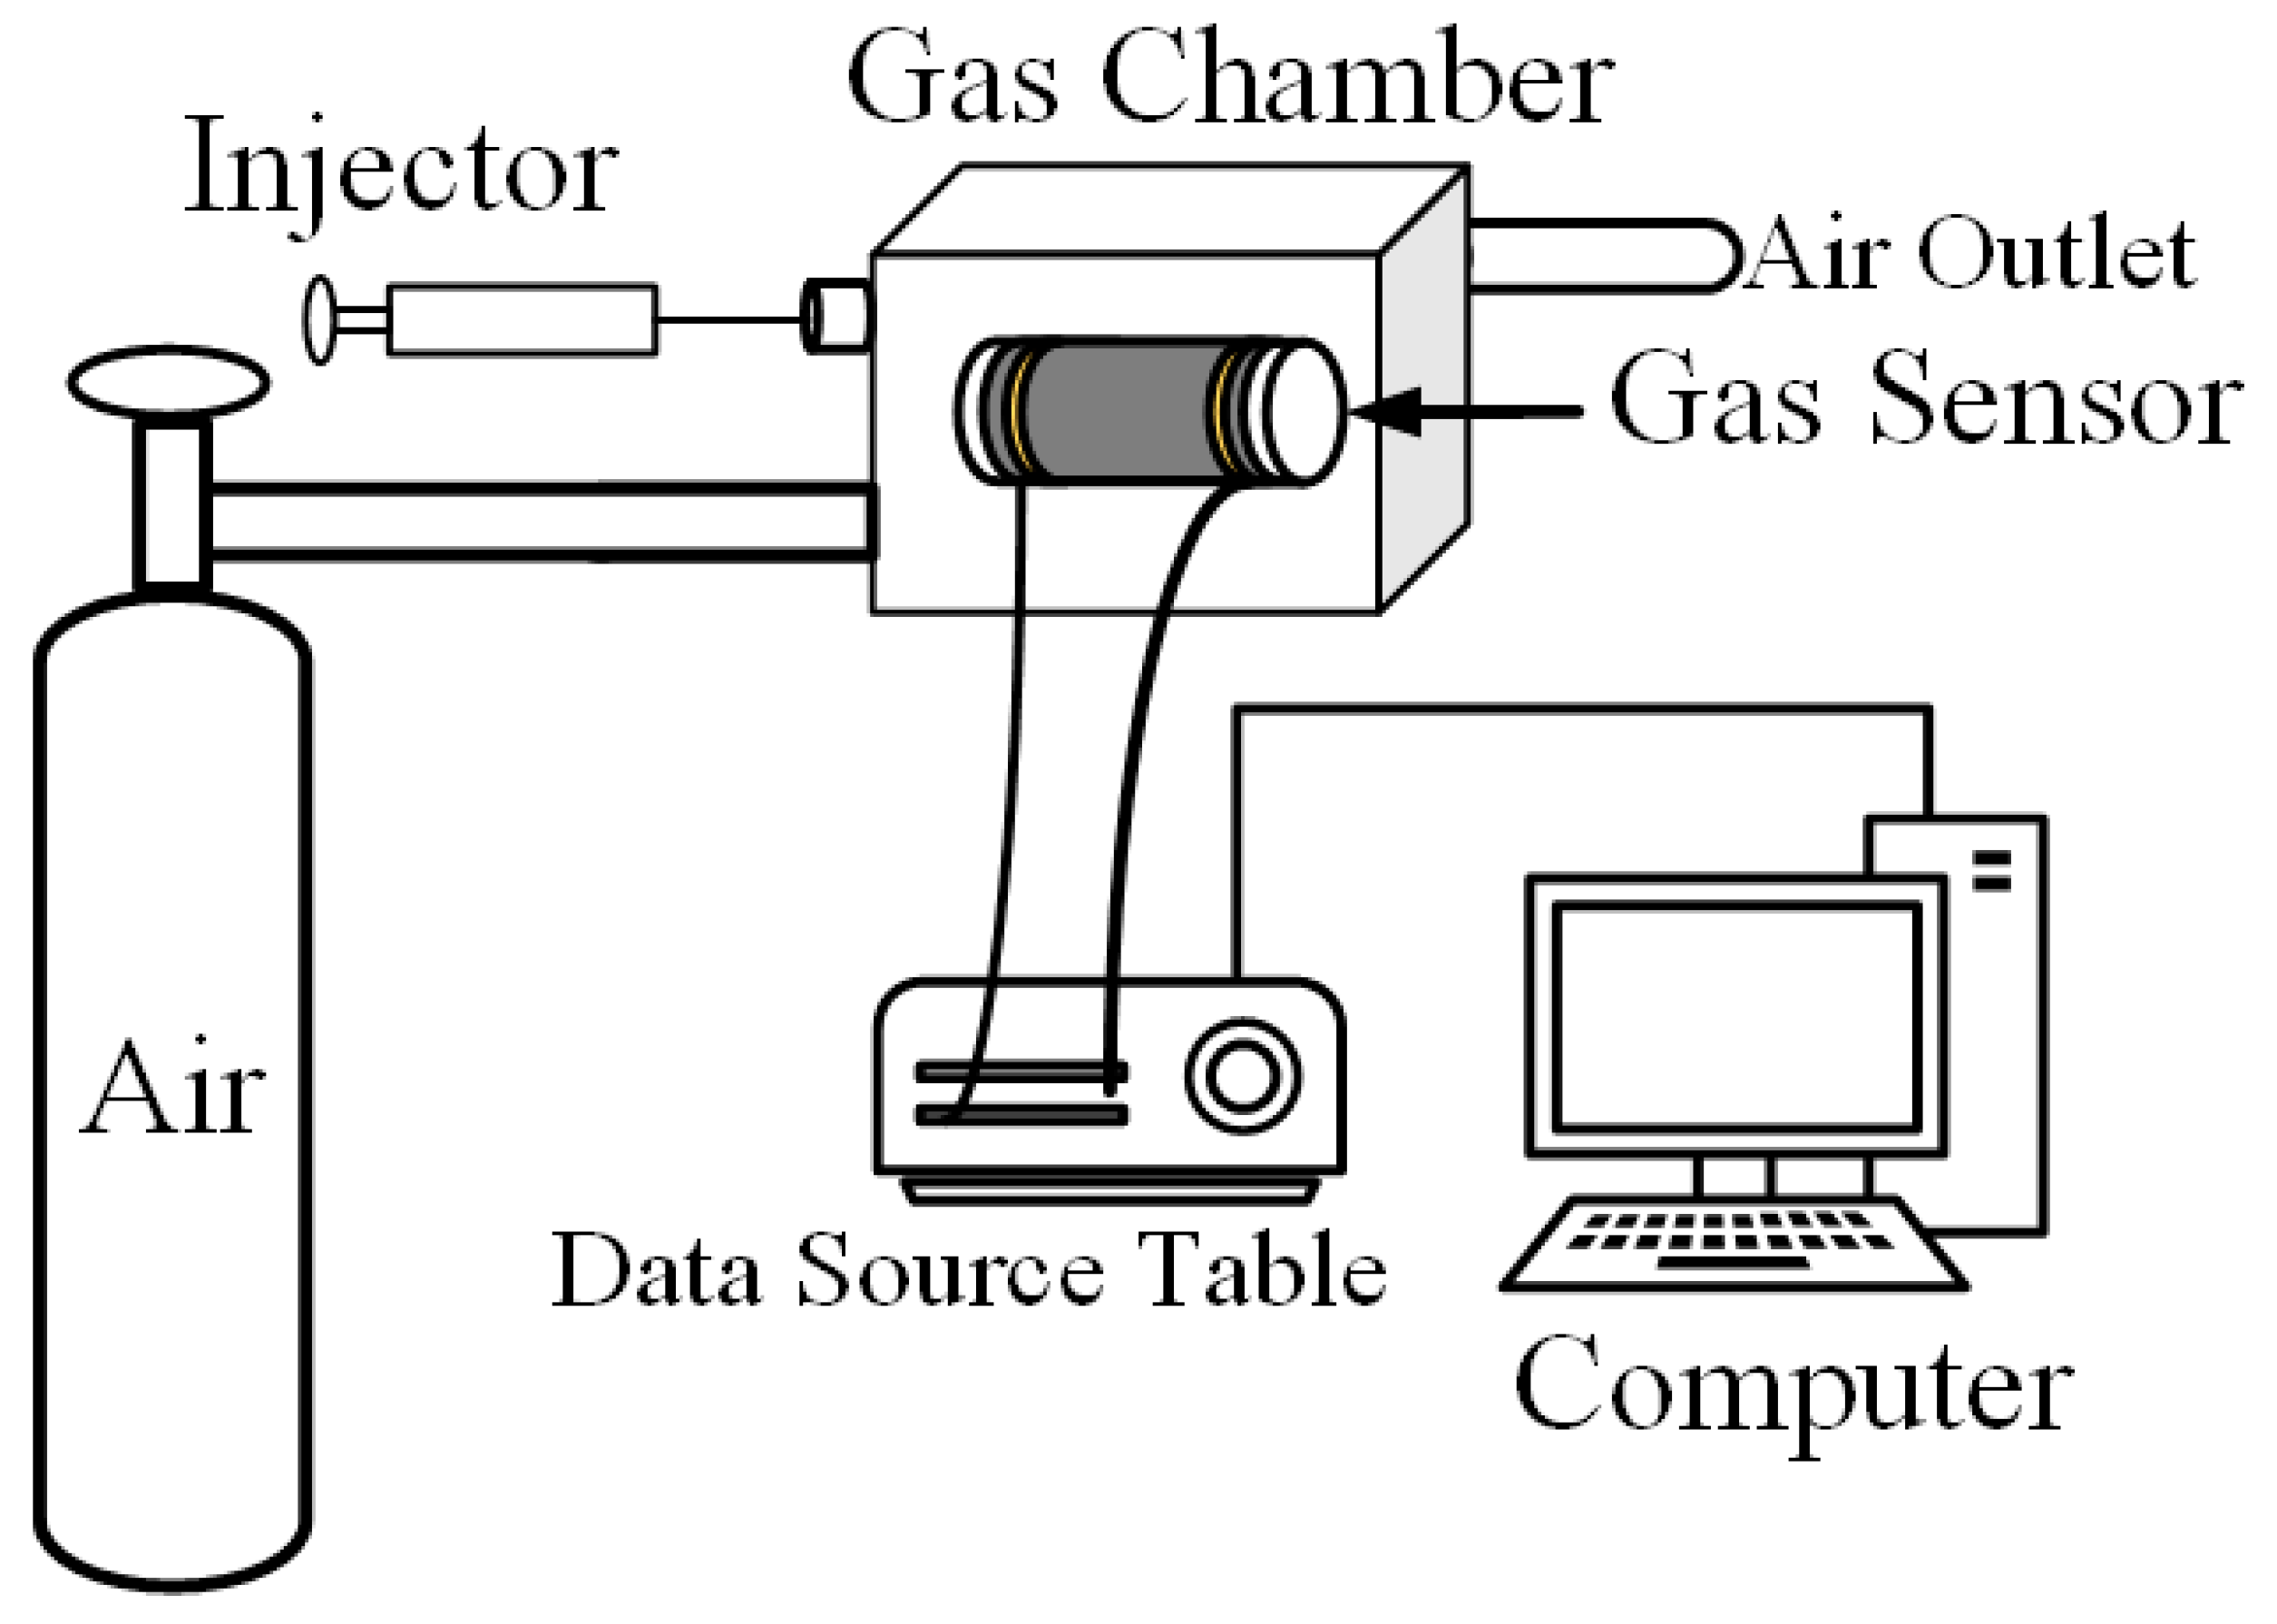
The test system used in this paper is shown in Figure 2. The main components include synthetic air cylinder, gas chamber, micro injector, data source table, and computer. The function of synthetic air is to clean the gas chamber at the beginning of the experiment, remove the impurity gas in the gas chamber, and then blow in after the test to eliminate the test gas. The gas chamber is a closed space with a volume of 1 L. By blowing synthetic air and a certain volume of measured gas, the gas environment with different concentrations is simulated. The data source table and computer provide test power and record the experimental results.
Firstly, the sensor was connected to the system and stable resistance in the air was obtained, then the syringe sucked a certain concentration of gas to be measured and injected it into the gas chamber, the resistance of the sensor changed, and finally the computer recorded the response curve to the gas. All gas sensitivity tests were carried out at room temperature (20 °C) and 30% relative humidity.
The measured gas concentration is calculated by Equation (1). C is the target gas concentration, Vi is the gas volume in the syringe, VC is the gas chamber volume, P0 is the vapor pressure of the target gas at room temperature (20 °C), and Pa is the standard atmospheric pressure. Put the saturated solution of organic gas into the reagent bottle and wait for a long enough time, the saturated vapor will form inside the reagent bottle. According to the formula, the gas volume required for different gas concentrations in the gas chamber can be calculated. A certain volume of gas can be extracted using a micro syringe and injected into the gas chamber, that is, it is convenient to test the organic gas of different concentrations.
The response of the gas sensor is defined as Equation (2). S is the response to the gas sensor. Ra is the stable resistance of the sensor exposed to air. Rg is the resistance of the sensor in target gas. The response time is the time between the gas in and the resistance reaching 90% of the stable resistance. The time between the air in and the resistance recovering to 90% of the original resistance in air is defined as the recovery time.
3. Results and Discussion
3.1. Characterization
The scanning electron microscope (SEM) model is SSX-550, which is manufactured by Shimadzu company of Japan. Main specifications and technical indicators: (1) accelerating voltage: 0.5–30 kV, 10 V/step; (2) magnification: 20–300,000 times. It is mainly used for the surface microscopic observation and composition analysis of inorganic solid materials such as ceramics, metals, and fiber composites, and the surface morphology is observed by secondary electron image. The surface micro region was analyzed qualitatively and quantitatively by backscattered electron image and X-ray energy spectrum.
The model of Fourier transform infrared spectrometer (FTIR) is VERTEX 70, which is developed and manufactured by Bruker company in Germany. Main technical indicators: (1) spectral measurement range: 7800~230 cm−1 (1.5~50 µm); (2) spectrometer resolution: better than 0.16 cm−1; (3) low temperature measurement temperature: 10 K to room temperature, ±0.2 K controllable. It is mainly used for structural identification and quantitative analysis of optical thin film materials and semiconductor materials.
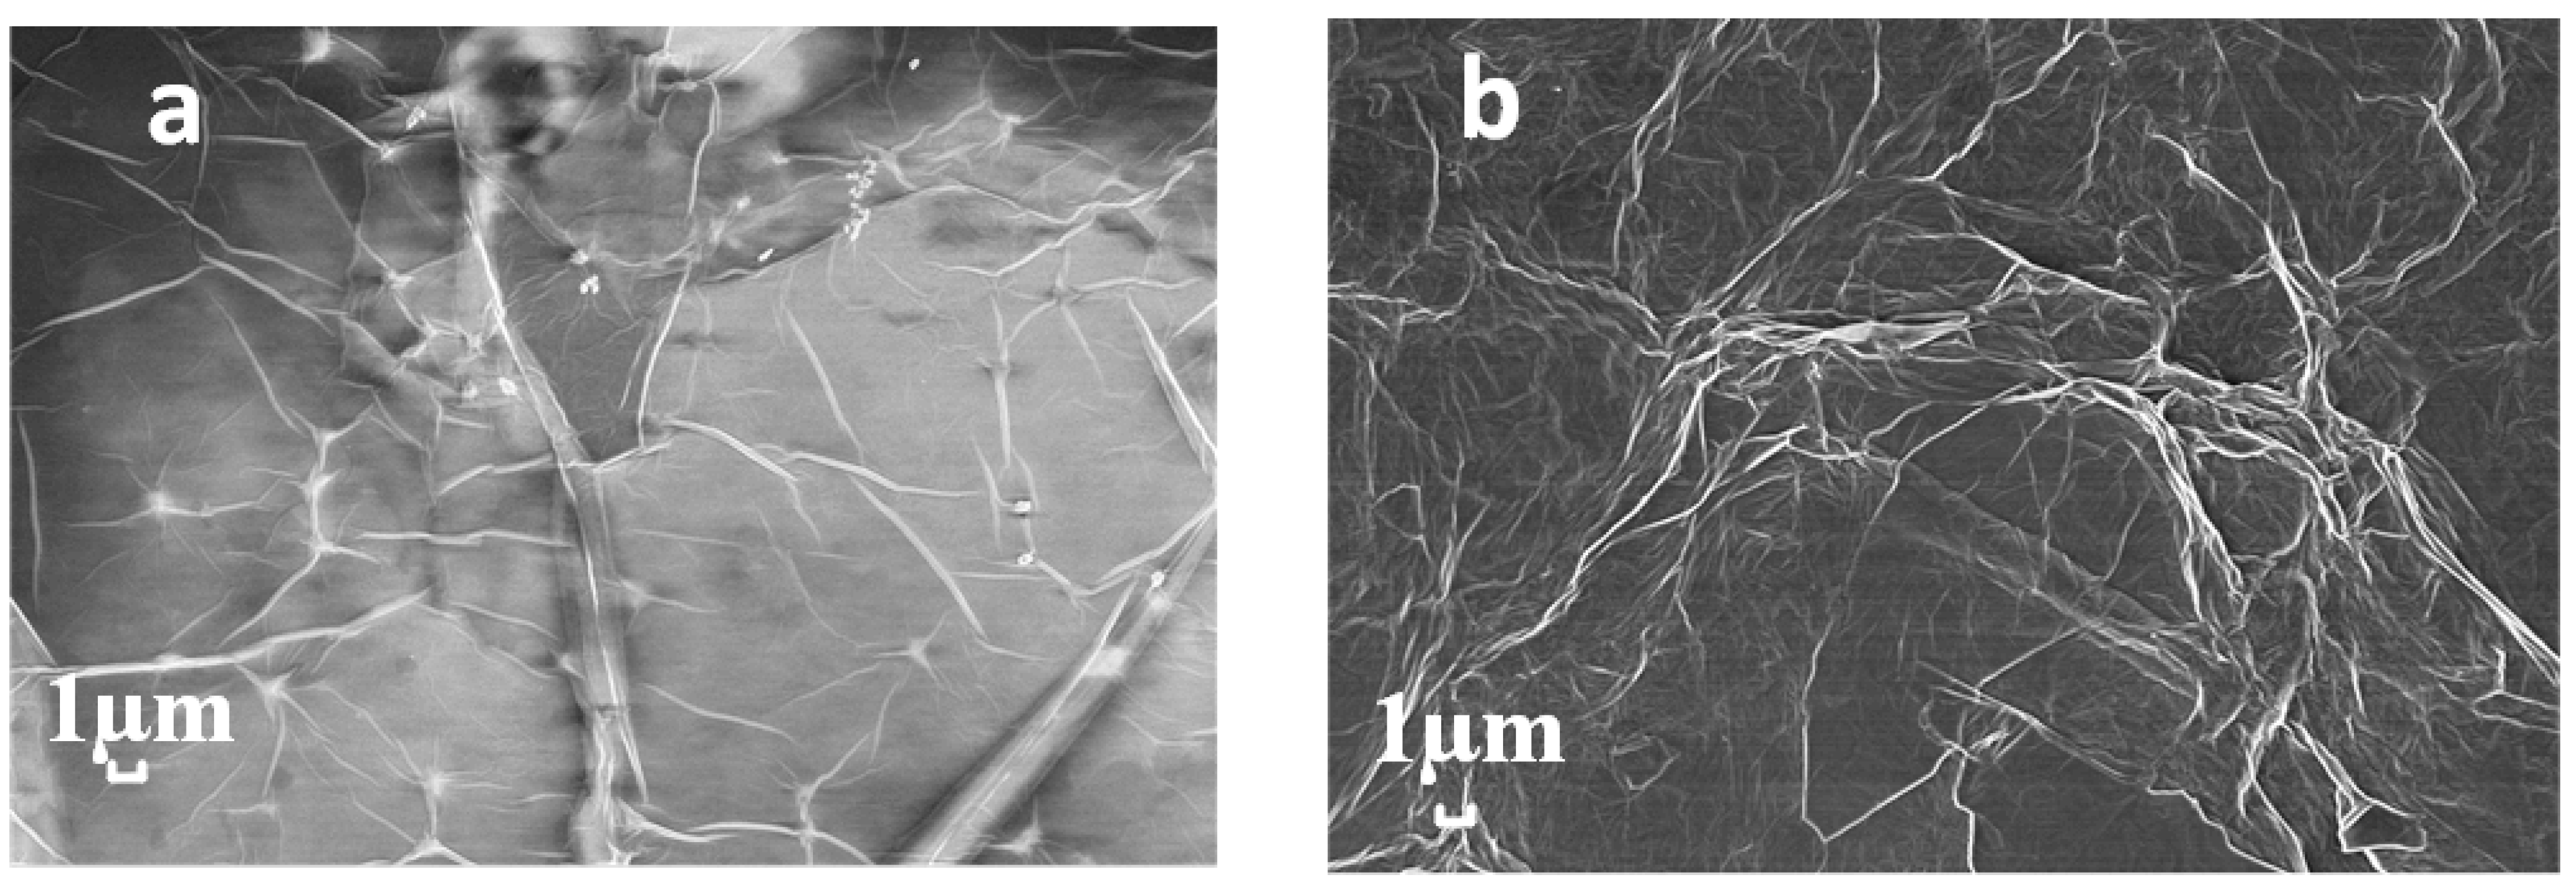
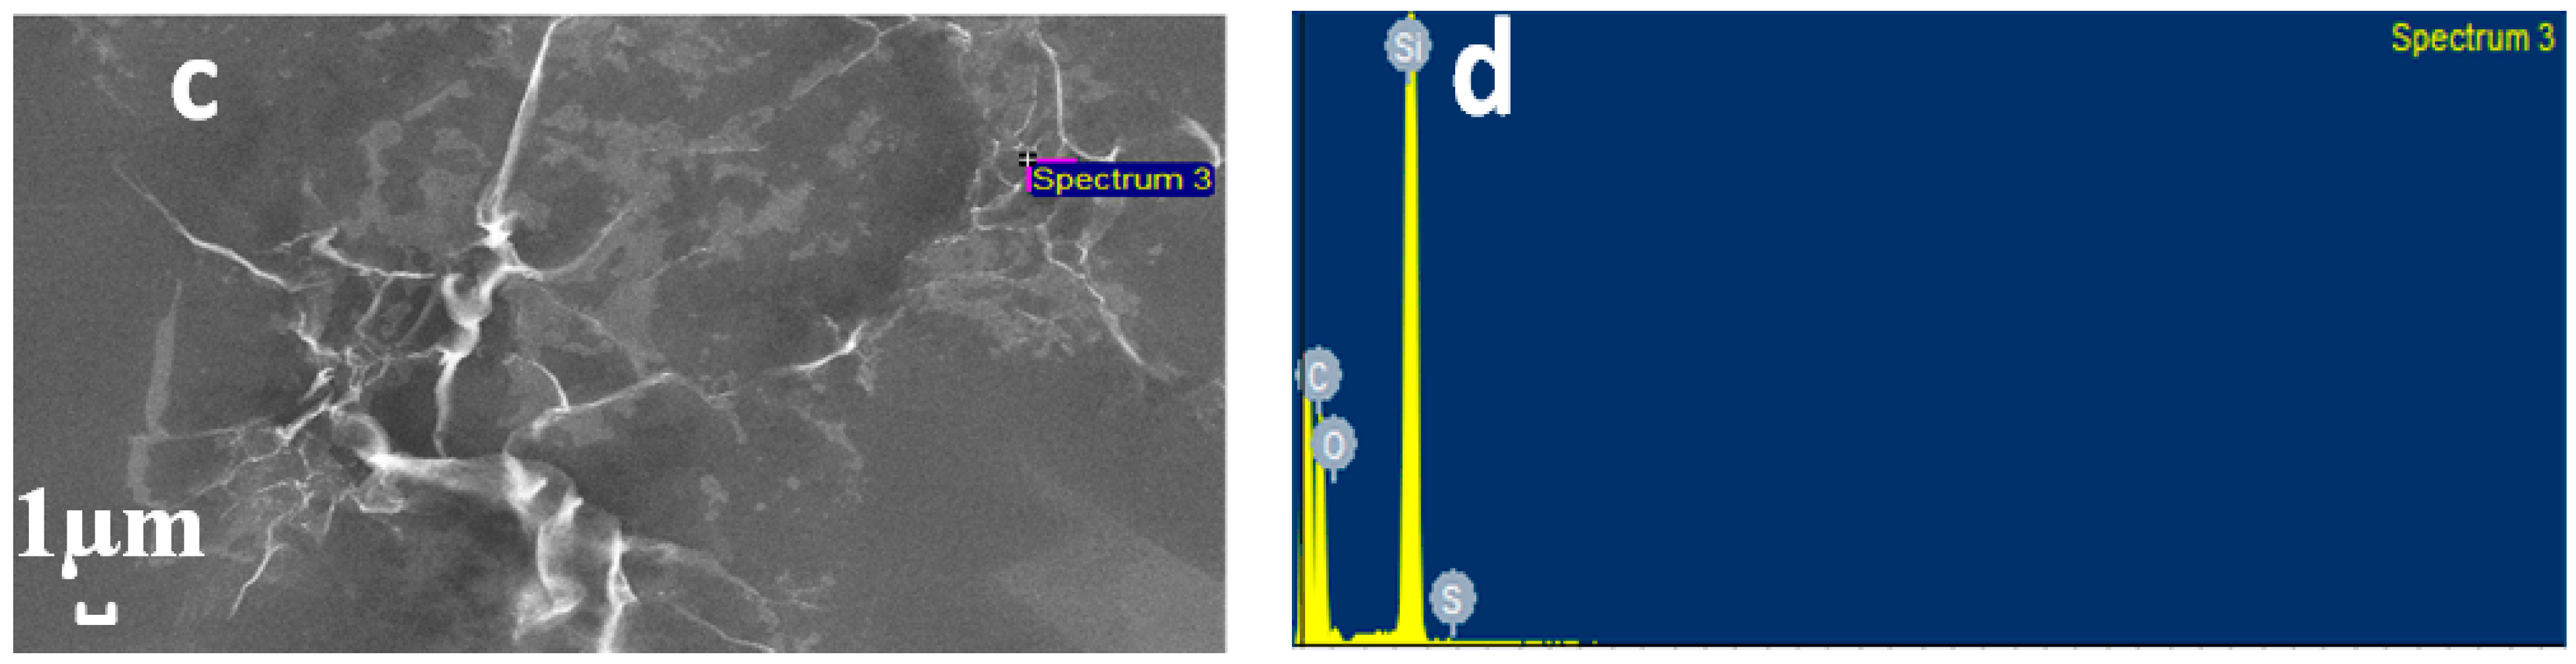
As shown in Figure 3, the synthesized sulfur-doped graphene was characterized by SEM and EDS. Figure 3a is the SEM of graphene oxide. It can be seen that graphene has a planar structure [30,31]. At the same time, under the action of surface tension, the surface of graphene oxide forms wrinkles. Because graphene is very thin, the SEM image was translucent. Figure 3b shows the graphene oxide after doping sulfur. Compared with the original graphene oxide, the wrinkles in S-1 increased. However, compared with the hydrothermal method, the synthesis method under normal temperature and pressure does not lead to agglomerated and broken materials, so it may be helpful for the detection of ammonia. Figure 3c,d show the EDS sampling points and the corresponding element contents, respectively. Carbon and oxygen are the components of graphene oxide, and element sulfur was detected, which indicated the successful synthesis of sulfur-doped graphene oxide. In addition, the reason for the detection of silicon was that the dispersed samples need to be coated on the silicon wafer for characterization, so element silicon was detected. Table 1 lists the content percentage of different elements.
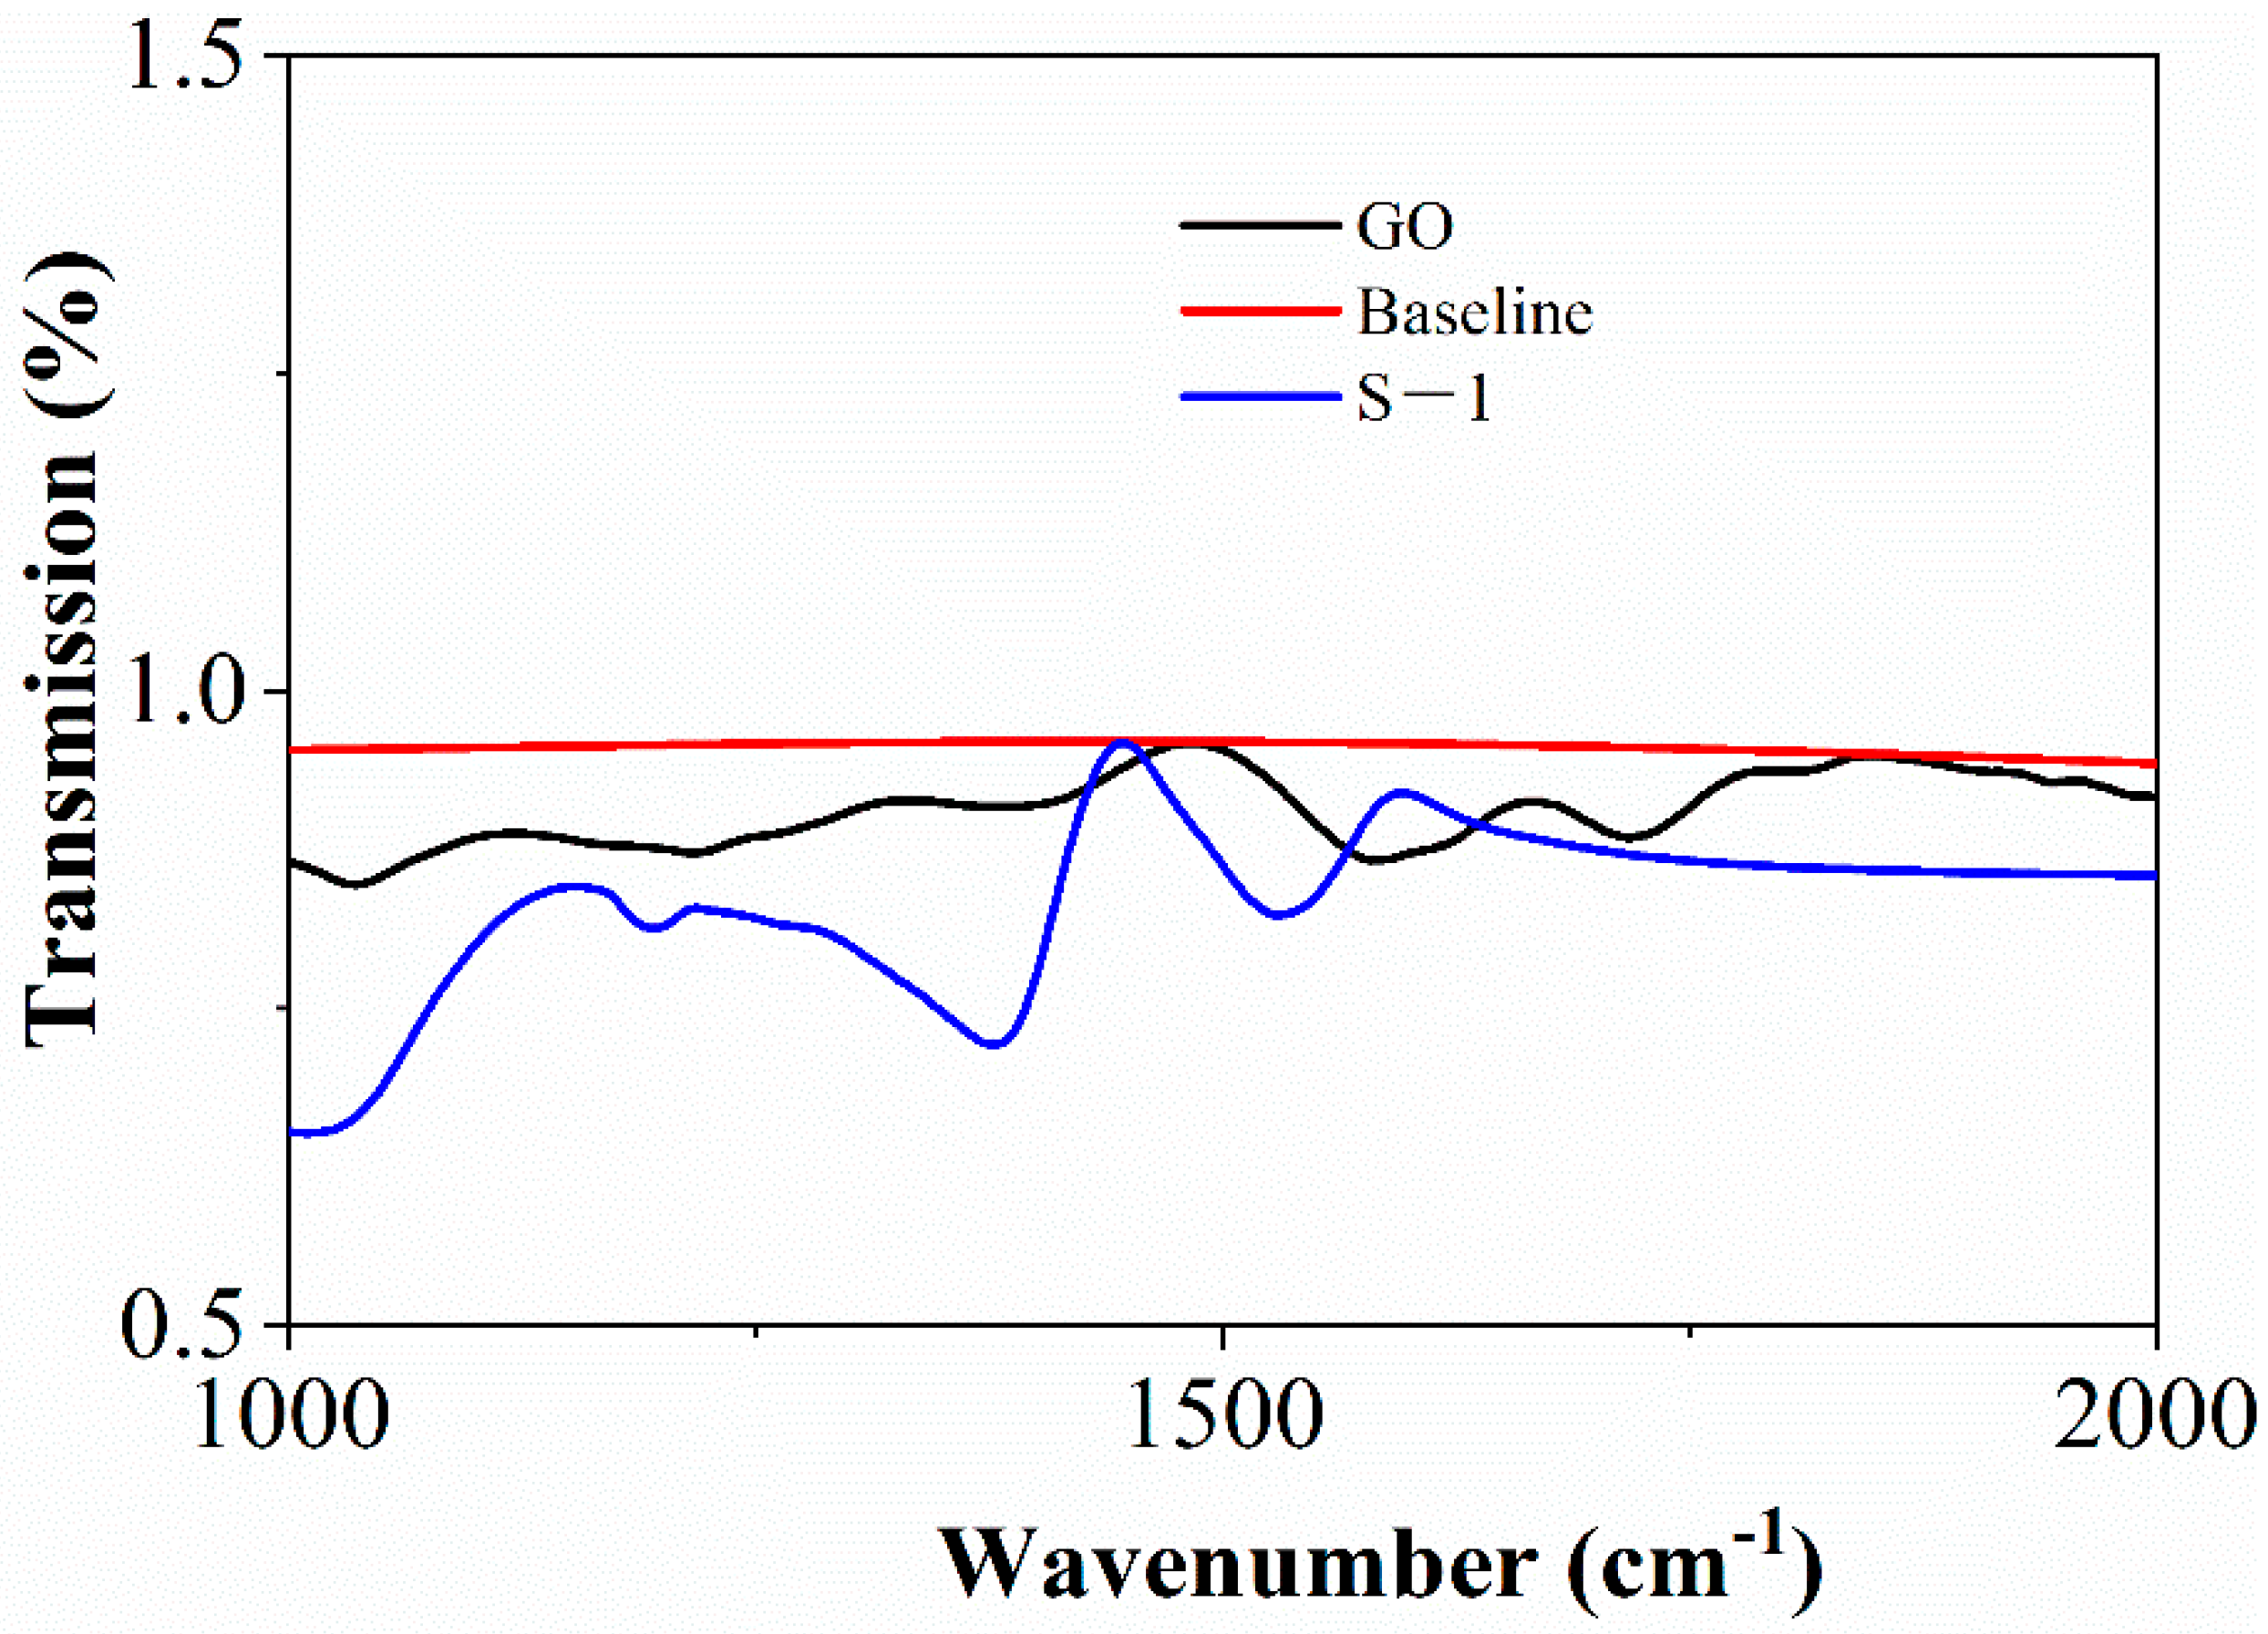
The FTIR image of GO and S-1 is shown in Figure 4. The black curve represents the spectrum of GO and the blue curve represents the spectrum of S-1. It can be seen from the figure that strong characteristic peaks can be observed at 1600 cm−1, which is the characteristic of C=C vibration [32]. At the same time, strong characteristic peaks can also be seen around 1300 cm−1, which is the result of C-OH vibration [33]. Combined with the electron microscope, it can be shown that the main component of the synthesized material is graphene oxide. However, at 1250 cm−1, there is a characteristic peak in S-1 that is not found in GO, which is the result of S-O vibration [34], indicating that the combination of sulfur atoms and materials is successful. On the one hand, the intensity of the characteristic peak is small, which indicates that the sulfur content is low; on the other hand, the incorporation of sulfur does not affect the characteristics of materials significantly. The characteristic peaks in FTIR are summarized in Table 2.
3.2. Gas Sensing Properties
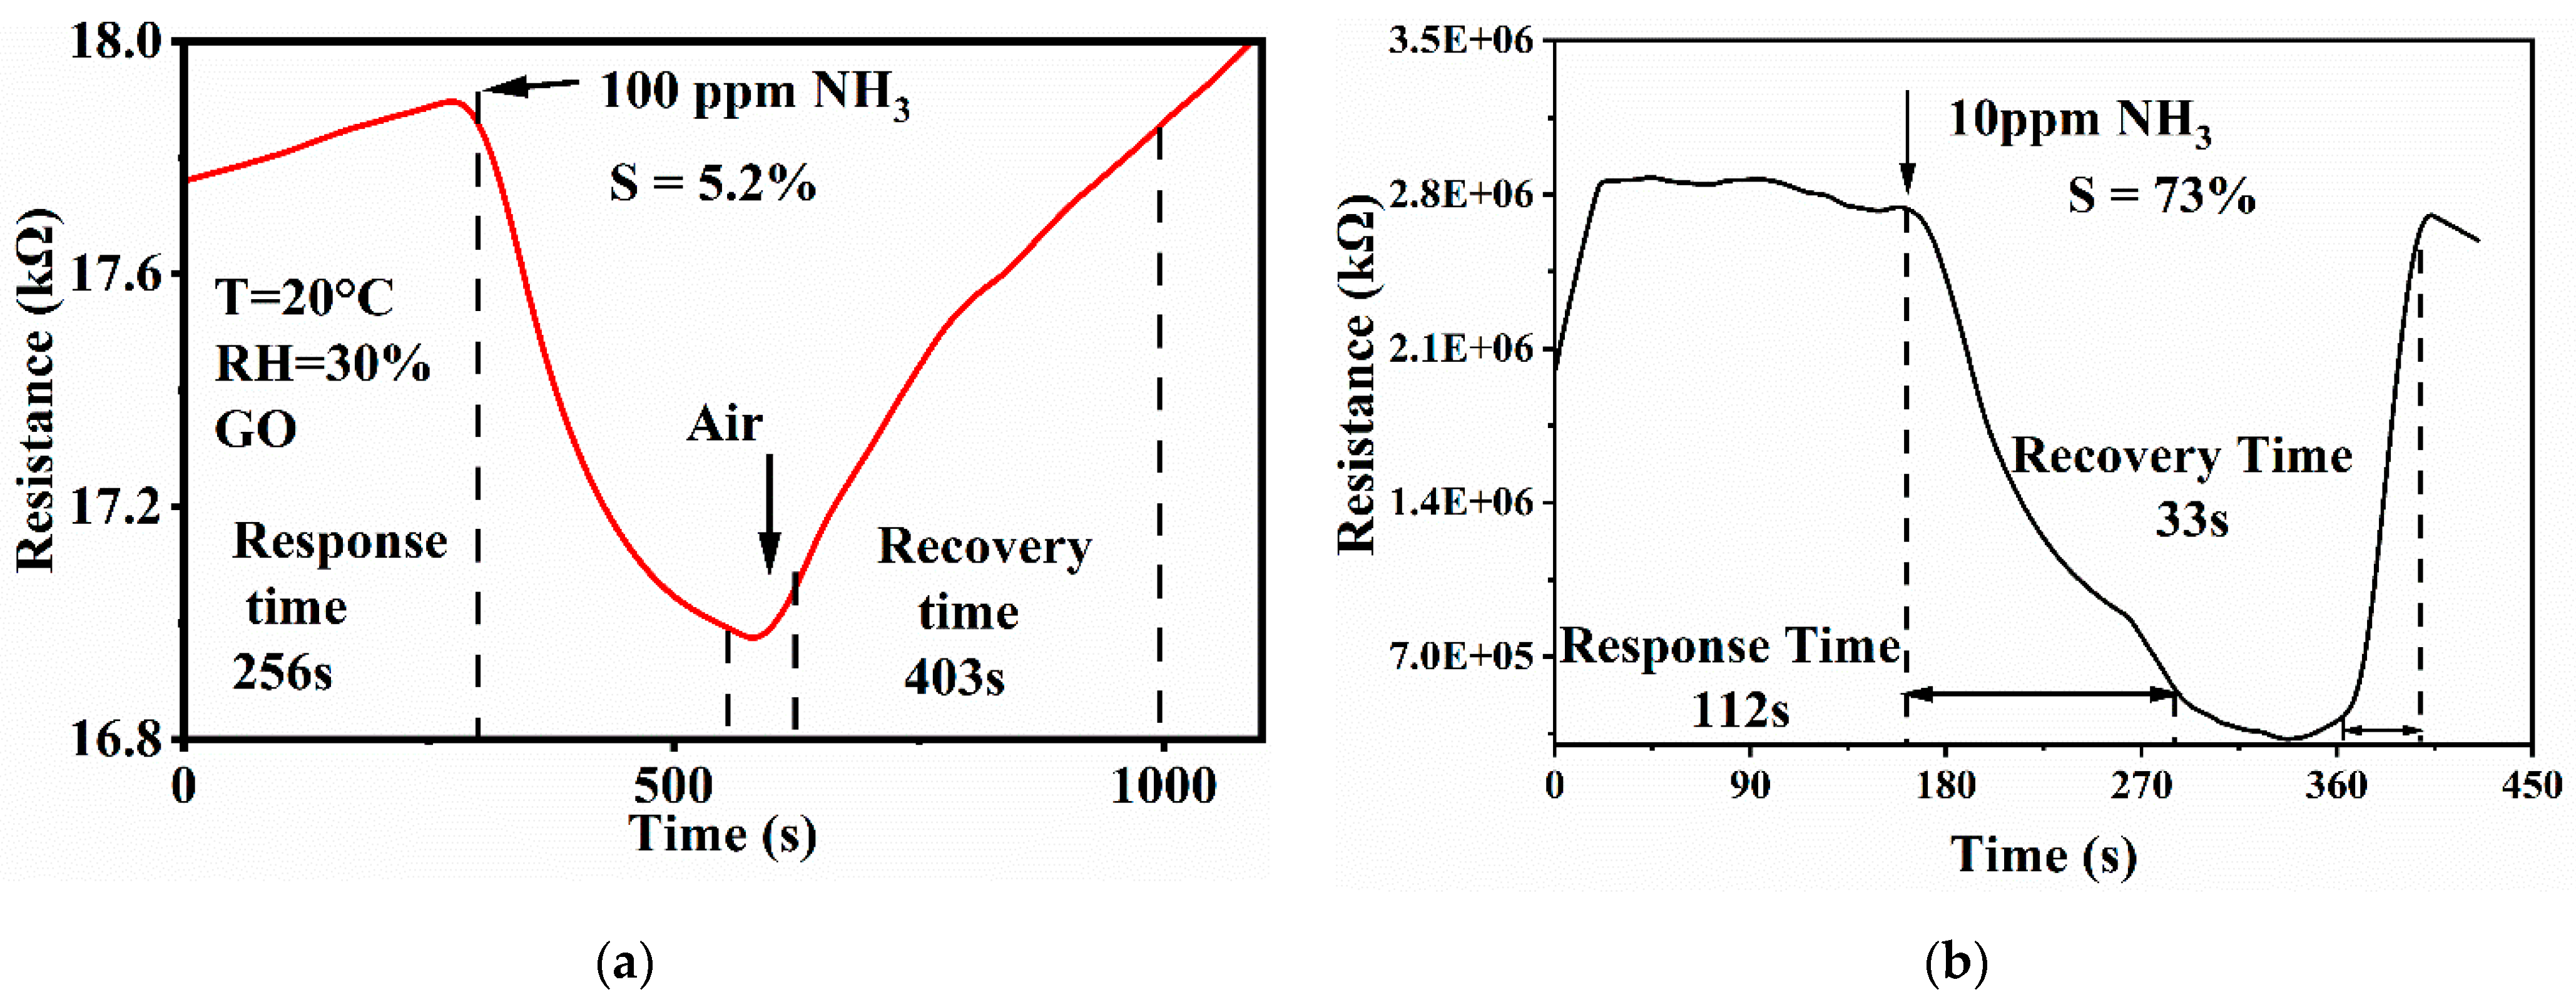
As shown in Figure 5, the gas sensing properties of GO and S-GO were tested. Firstly, it can be seen that the resistance of the S-GO is high. This is because the surface of graphene oxide is rich in oxygen-containing groups, which will greatly increase the resistance of S-GO. The room temperature synthesis method used can avoid the agglomeration phenomenon on the surface of graphene, but graphene oxide is not reduced, so the resistance of the material is high. Figure 5b shows the response curve of material S-GO to 10 ppm ammonia at room temperature. It can be seen that the corresponding value is 73%. The response time represents the time required for the resistance to reach a stable state after the gas is injected, and the recovery time represents the time required for the resistance to recover after the synthetic air is injected. As shown in Figure 5b, the response time is 112 s and the recovery time is 33 s, which are improved compared with the characteristics of GO. Figure 5a shows the response curve of GO to 100 ppm ammonia. It can be seen that the S-GO has better sensitivity, response time, and recovery time than GO, so S-doped improve the sensitivity to ammonia.
Figure 6 shows the gradient test of S-1 for different concentrations of ammonia and the detection limit of S-1 for ammonia. As shown in Figure 6a, at room temperature, first inject 0.5 ppm ammonia, the material resistance decreases slightly, and then continuously increase the ammonia concentration until the ammonia concentration in the gas chamber reaches 10 ppm. It can be seen that the sensor responds to different concentrations of ammonia. Figure 6b shows the lower detection limit of S-1 material. The lowest ammonia concentration of 0.5 ppm can change the material resistance, and the corresponding sensitivity is 5%. The lowest ammonia concentration detected by GO is 1 ppm, which indicates that sulfur doping can reduce the detection limit of the sensor.
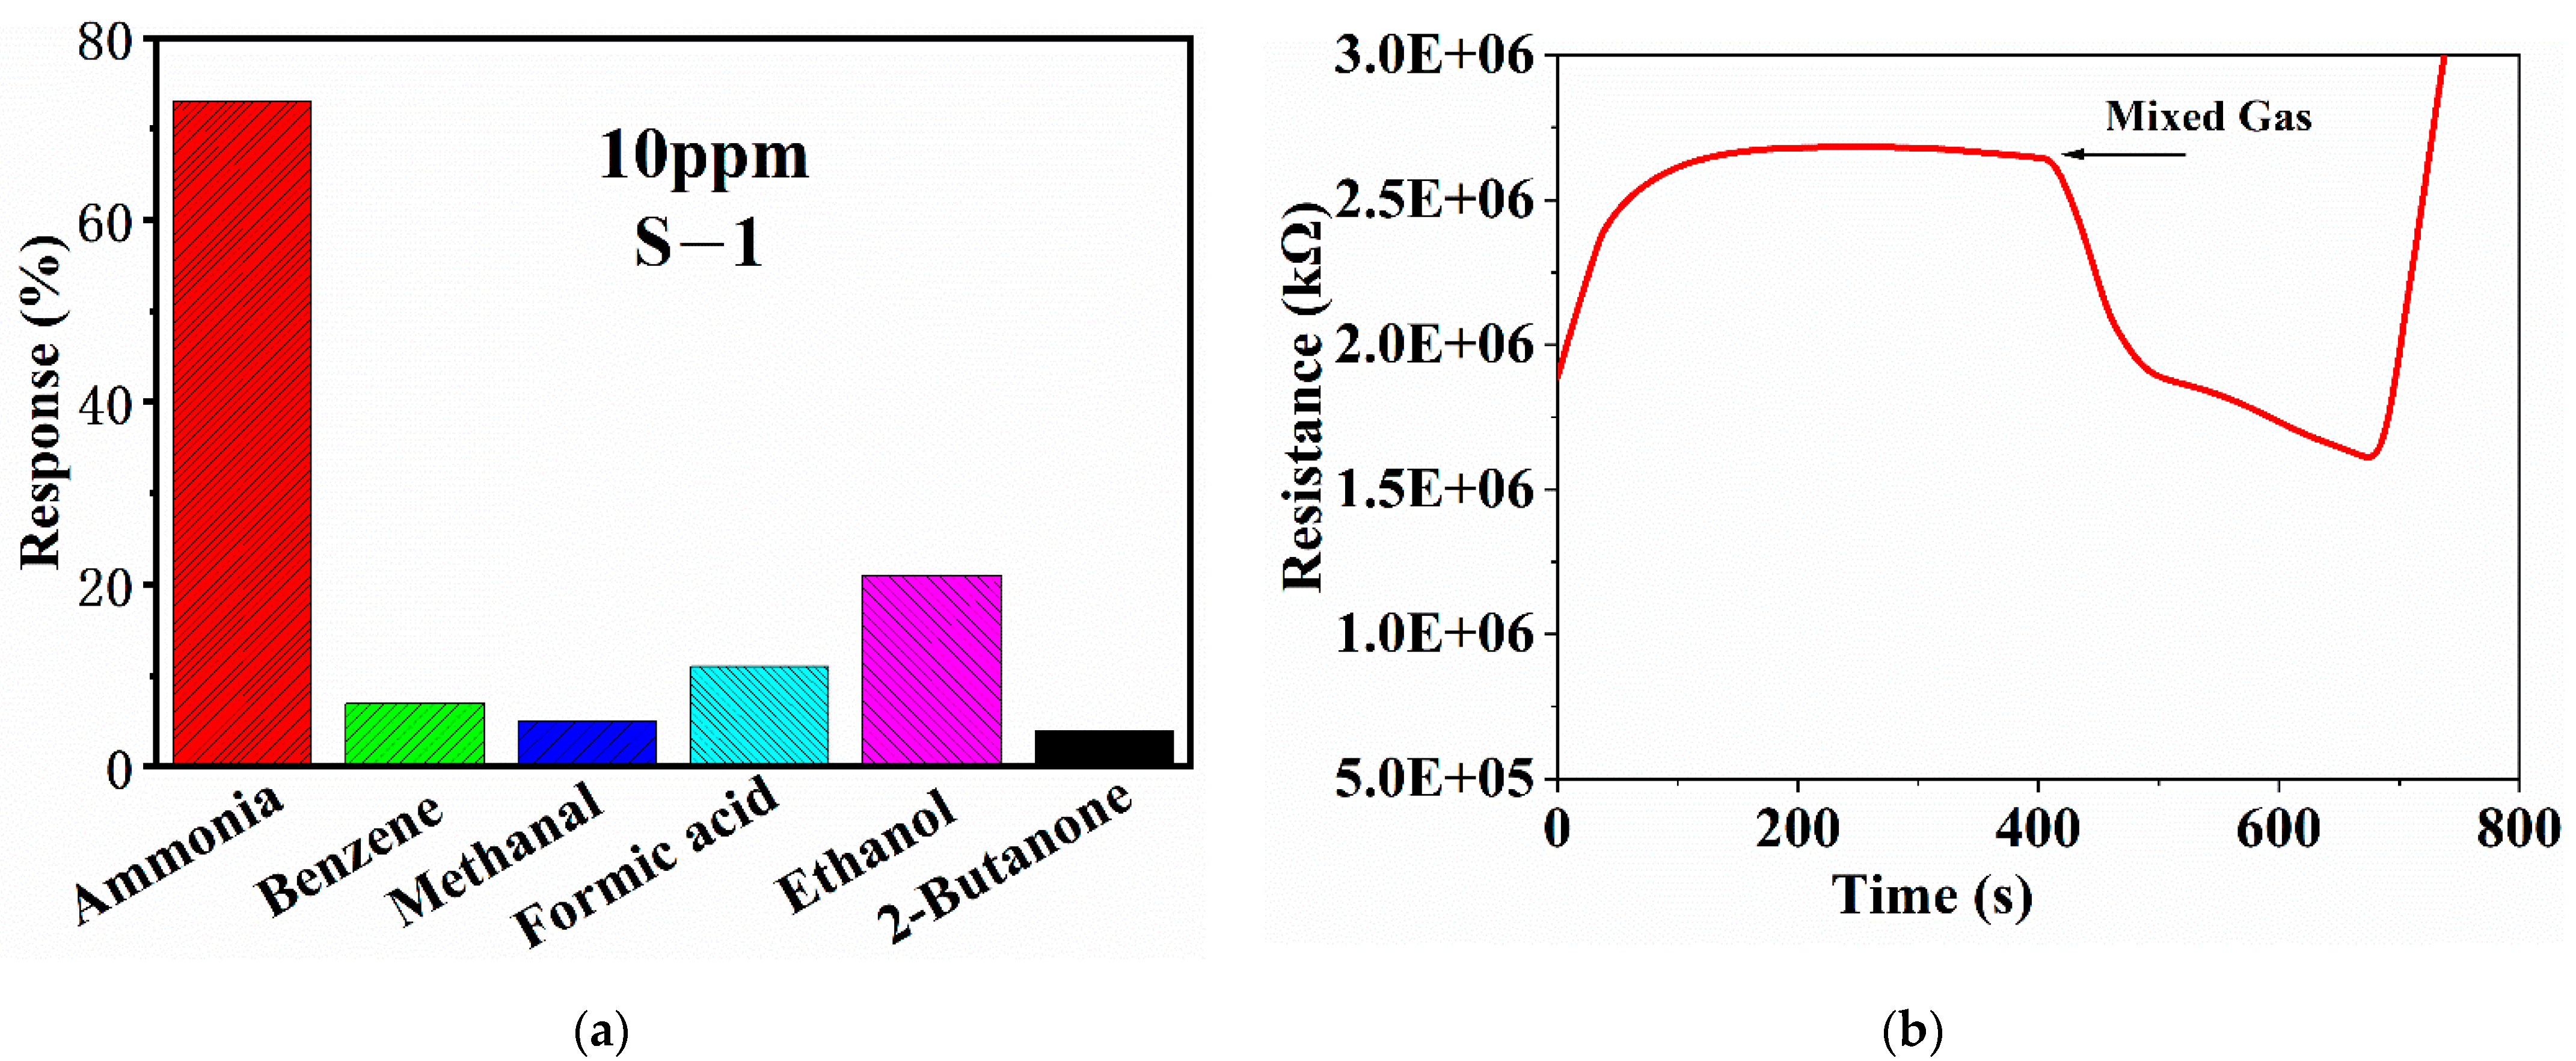
Selectivity is also important for gas sensors. In practical application, the gas environment of the sensor is more complex, and there may be a variety of gases. For the ammonia sensor, it should be able to detect ammonia from a variety of volatile gases, which requires the sensor to have excellent selectivity. Therefore, the selectivity of sulfur-doped graphene is tested in this chapter, and the test results are shown in Figure 7a. Considering the types of gases, they can be divided into alcohols, ketones, aldehydes, acids, benzenes, and so on, so the control gases for testing are formic acid, ethanol, methanal, benzene, and 2-butanone. The sensitivity of S-1 to the same concentration of ammonia is 73%, and the other gases are less than 20%, so it has good selectivity for ammonia. The six gases (formic acid, ammonia, ethanol, methanal, benzene, and 2-butanone) are mixed and injected into the gas chamber, and the response curve is shown in Figure 7b. It can be seen that the sensor has a certain response to the mixed gas, but other interfering gases have a certain impact on the ability of S-1 to detect ammonia, and the sensitivity to ammonia is reduced. Figure 7b shows that S-1 can distinguish the existence of ammonia in different interfering gases.
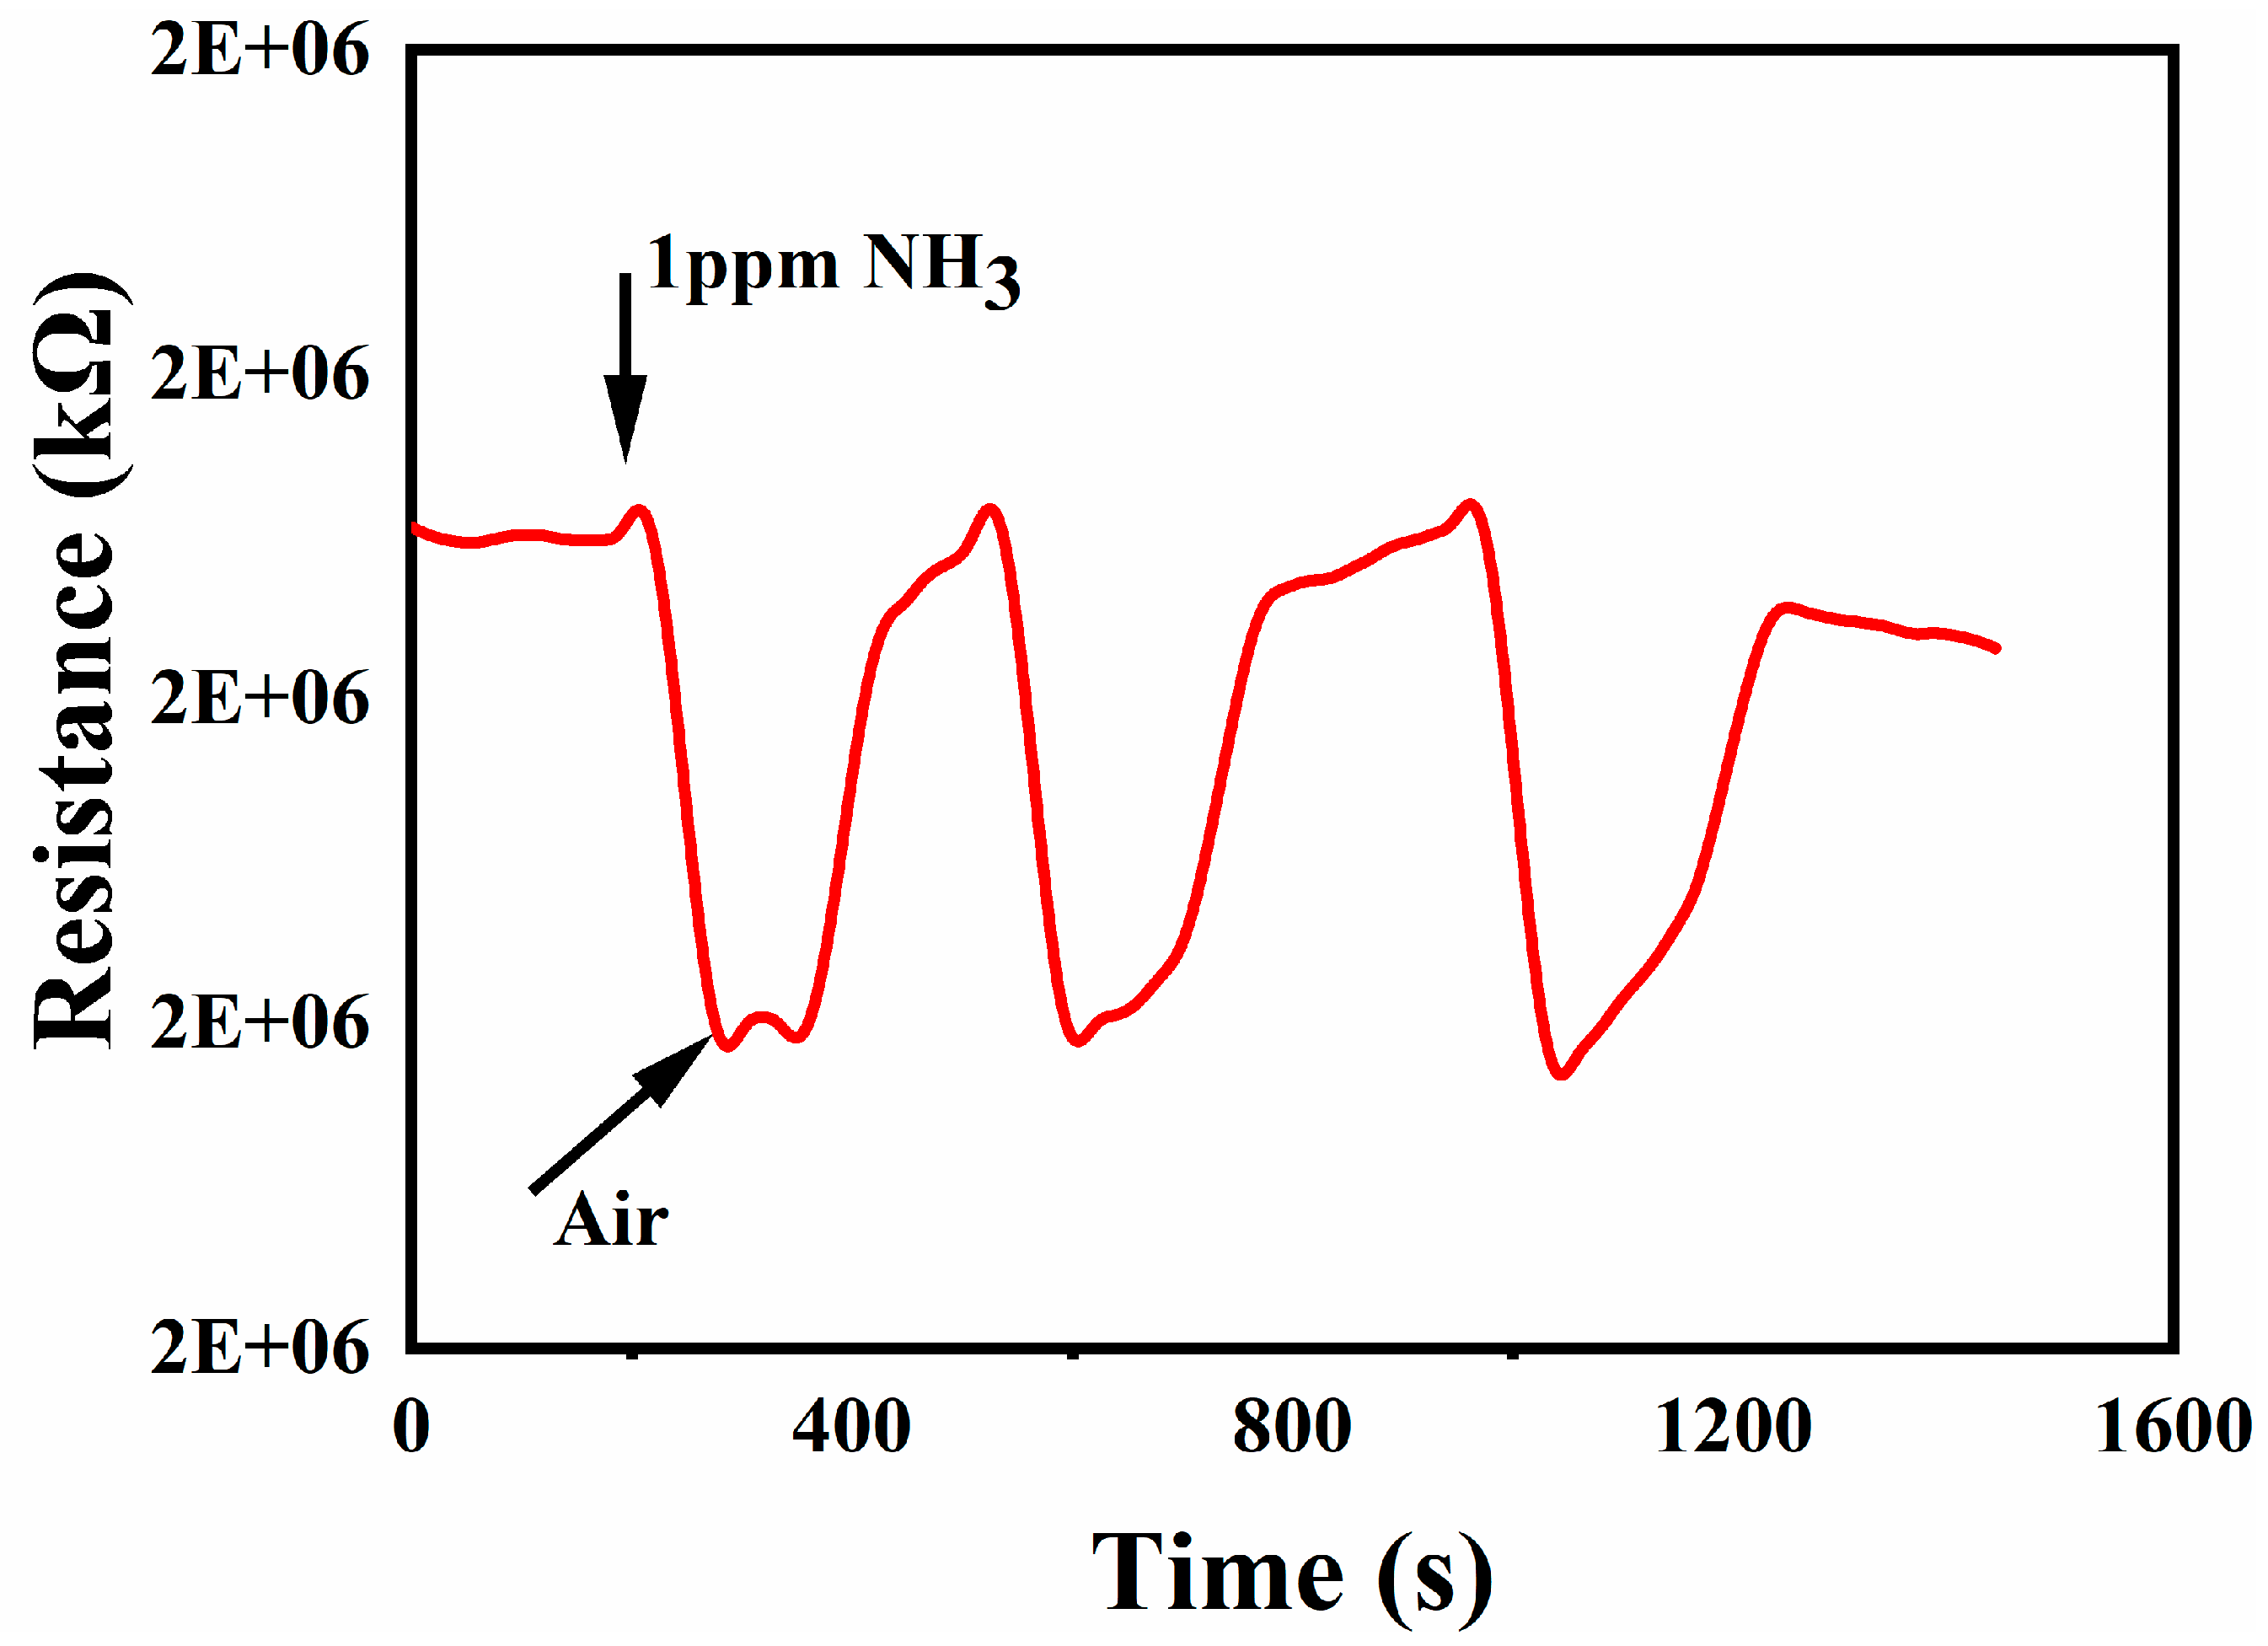
As shown in Figure 8, the repeatability of S-1 was tested in RT and 30% RH. First, 1 ppm ammonia was injected. After the reaction was stable, air was blown in, and the resistance of the sensor was restored. Then, 1 ppm ammonia was injected and the process was repeated three times. The test result showed that this kind of gas sensor has excellent repeatability.
3.3. Theoretical Basis and Computational Method
The energy band diagram and density of states diagram of the two materials were obtained by simulation and theoretical calculation. From the perspective of theoretical calculation, the gas sensing mechanism of the two materials is analyzed. On the one hand, the calculation results can be verified by the experimental results; on the other hand, the experimental direction can be guided by the calculation results.
The traditional gas sensing mechanism is interpreted as oxygen anion theory, which can only qualitatively describe and explain the interaction between the sensitive material and the measured gas. The first principle uses quantum mechanics to analyze the properties of atoms and molecules by calculating the interaction between nuclei and electrons, and finally obtains the properties of macroscopic materials. From the micro point of view of the material analysis and calculation, without the help of empirical parameters, we can objectively reflect the characteristics of the material after doping. By comparing the calculation results of the material before and after doping, we can obtain the influence of doping on the material characteristics. In addition, the electrical properties of the material after gas adsorption can be calculated, so as to analyze the adsorption process and sensitive mechanism of the material to the target gas.
In this work, the CASTEP module of Materials Studio 8.0 is used to model and calculate the sulfur-doped graphene [35,36], and the corresponding energy band diagram, density of state (DOS), and partial wave density of state diagram (PDOS) are obtained. The results of the calculation and experiment show that doping can improve the semiconductor properties of graphene. At the same time, the adsorption relationship between ammonia and the two materials, as well as the corresponding energy band diagram, density of state, and partial wave density of state diagram of the two materials after adsorption, were calculated. Compared with the original graphene, the doped graphene has a stronger adsorption capacity for ammonia, which indicates that the doped elements enhance the ability of graphene to detect ammonia.
3.4. Calculations and Analyses
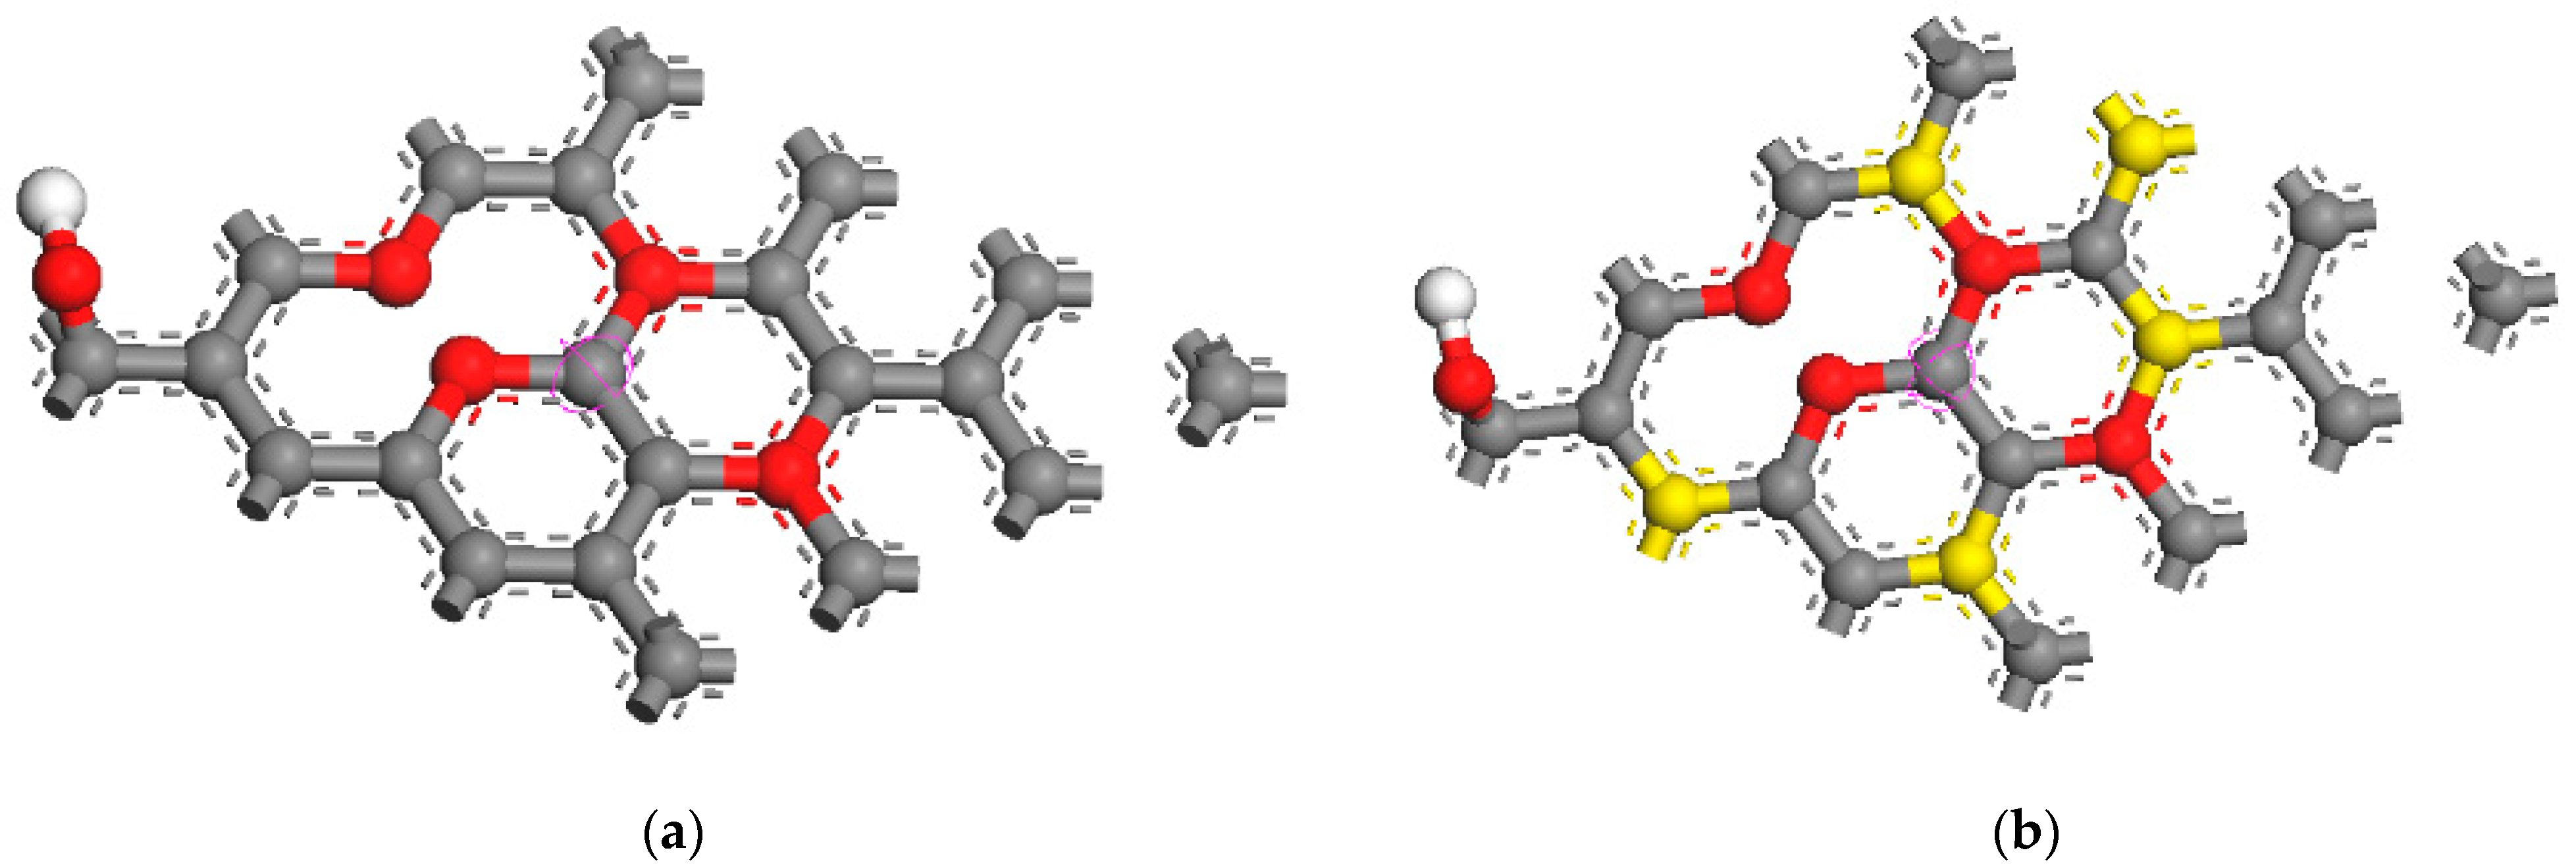
As shown in Figure 9, the models of GO and sulfur-doped graphene oxide( S-GO) were established for optimization [37,38,39]. The carbon atom is gray, the oxygon atom is red, the hydrogen atom is white, and the sulfur atom is yellow. First of all, the bond length between sulfur atoms and carbon atoms changes after the optimization. From the side view, it can be seen that the original plane structure of graphene has changed. Sulfur atoms protrude slightly from the plane. This is because sulfur atoms are larger than carbon atoms, so the force between atoms protrudes from the plane, resulting in the S-C bond length (1.739 Å) being longer than the C-C bond (1.420 Å). It is slightly larger, but it does not affect the stability of the structure.
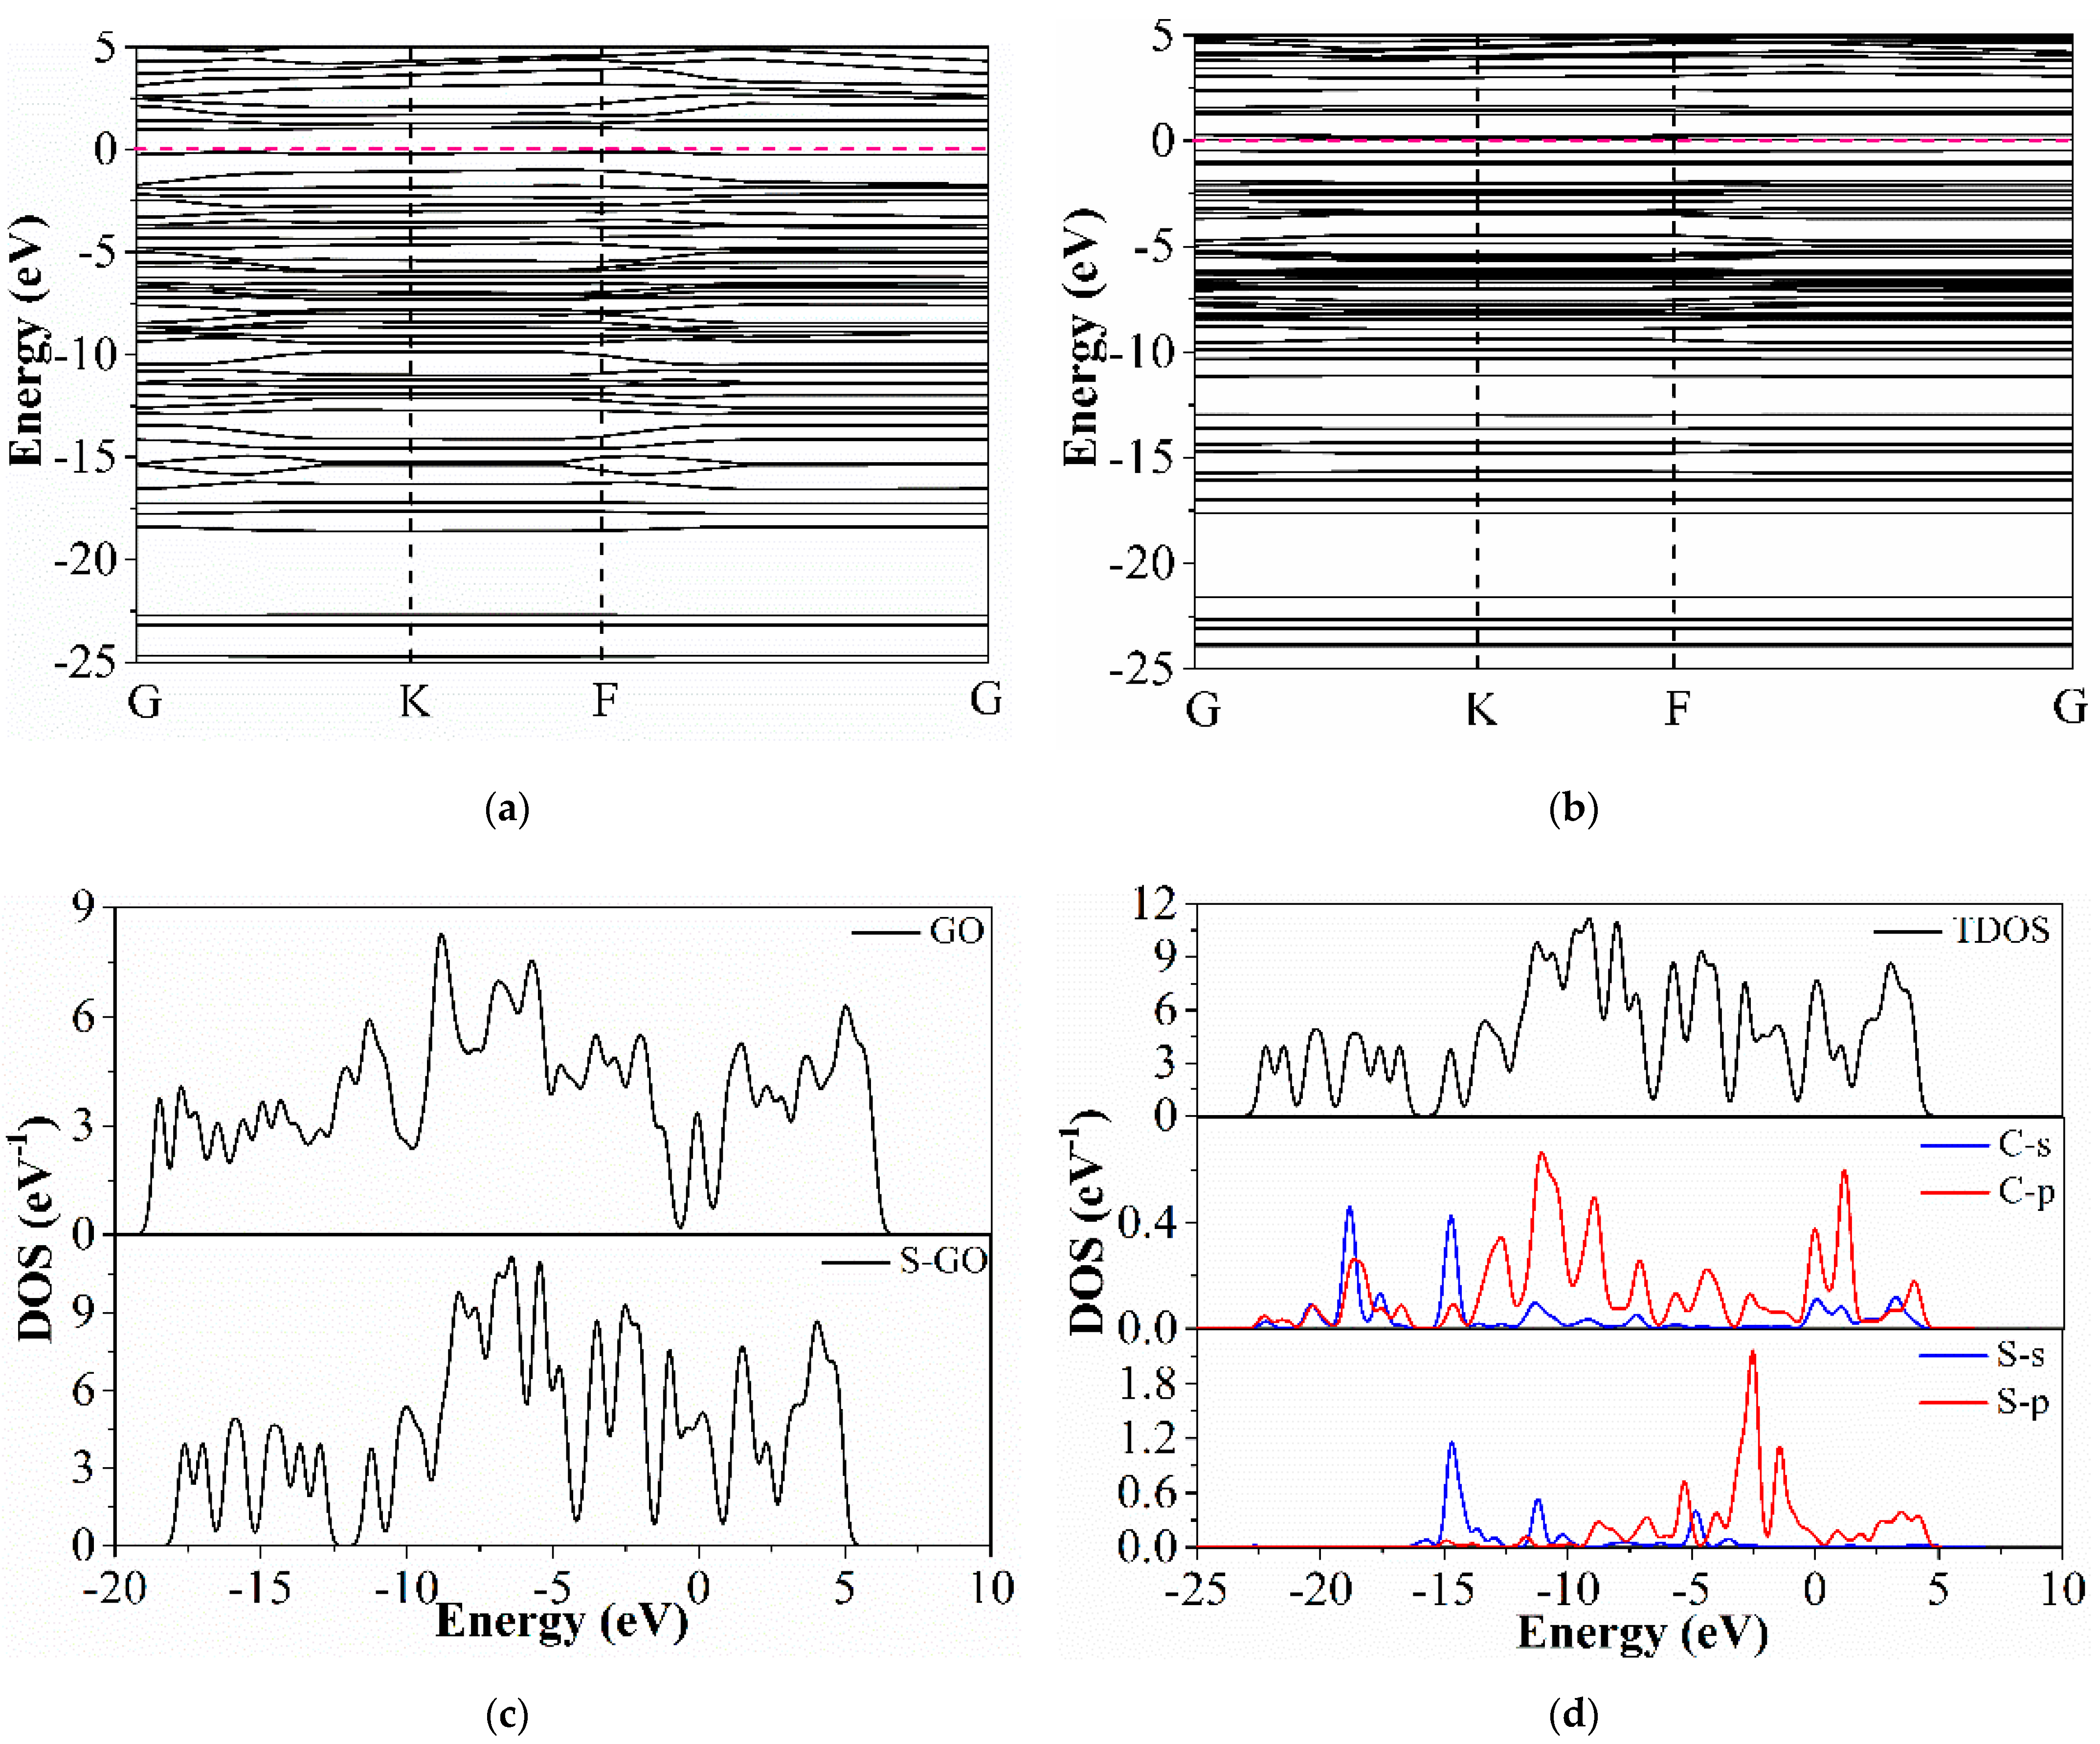
Figure 10a,b show the band structure diagram of GO and S-GO. The conduction band and valence band of intrinsic graphene intersect near the Fermi level, which indicates that intrinsic graphene is a zero band gap material and is not suitable as a sensitive material for gas detection. When sulfur atoms are added, the energy levels increase obviously, which indicates that a large number of impurity energy levels are added and more electronic states are provided, which is conducive to the electron transfer between the material and gas molecules; secondly, a band gap of about 0.557 eV appears at the intersection of conduction band and valence band, which indicates that sulfur-doped graphene is a semiconductor and can be used as a sensitive material for gas detection; finally, the Fermi level drops to the valence band, which shows N-type doping. Ammonia as a kind of reducing gas will lead to the decrease of the resistance of N-type materials, which is consistent with the actual experimental results.
The density of states (DOS) analysis is an important method to analyze the electronic properties of materials before and after doping. The density of states represents the density of energy level distribution. As a semiconductor material, it mainly depends on the intensity of the density of states near the Fermi level. As shown in Figure 10c, the density of states of intrinsic graphene and sulfur-doped graphene is calculated. Overall, the density of states of S-GO is higher than that of GO, which indicates that many electronic states are produced by doping, which is consistent with the appearance of many impurity energy levels in the energy band diagram. At the Fermi level, the density of states of S-GO is larger, which indicates that the band gap is generated. In the valence band, the valence band of S-GO is widened, which can cause more electrons in the state to be excited, which is helpful for the conductivity of the material.
The partial wave density of states (PDOS) shown in Figure 10d also shows that the partial wave density of states of C-2p and S-2p orbitals is strong, and the combined action makes the total density of states produce a strong peak. It also shows that the covalent bond between carbon and sulfur atoms is strong, which is consistent with the results of energy band diagram and charge transfer analysis. In general, the doping of sulfur atoms enhances the semiconductor properties and conductivity of graphene, which has a significant effect on its ability as a sensitive material.
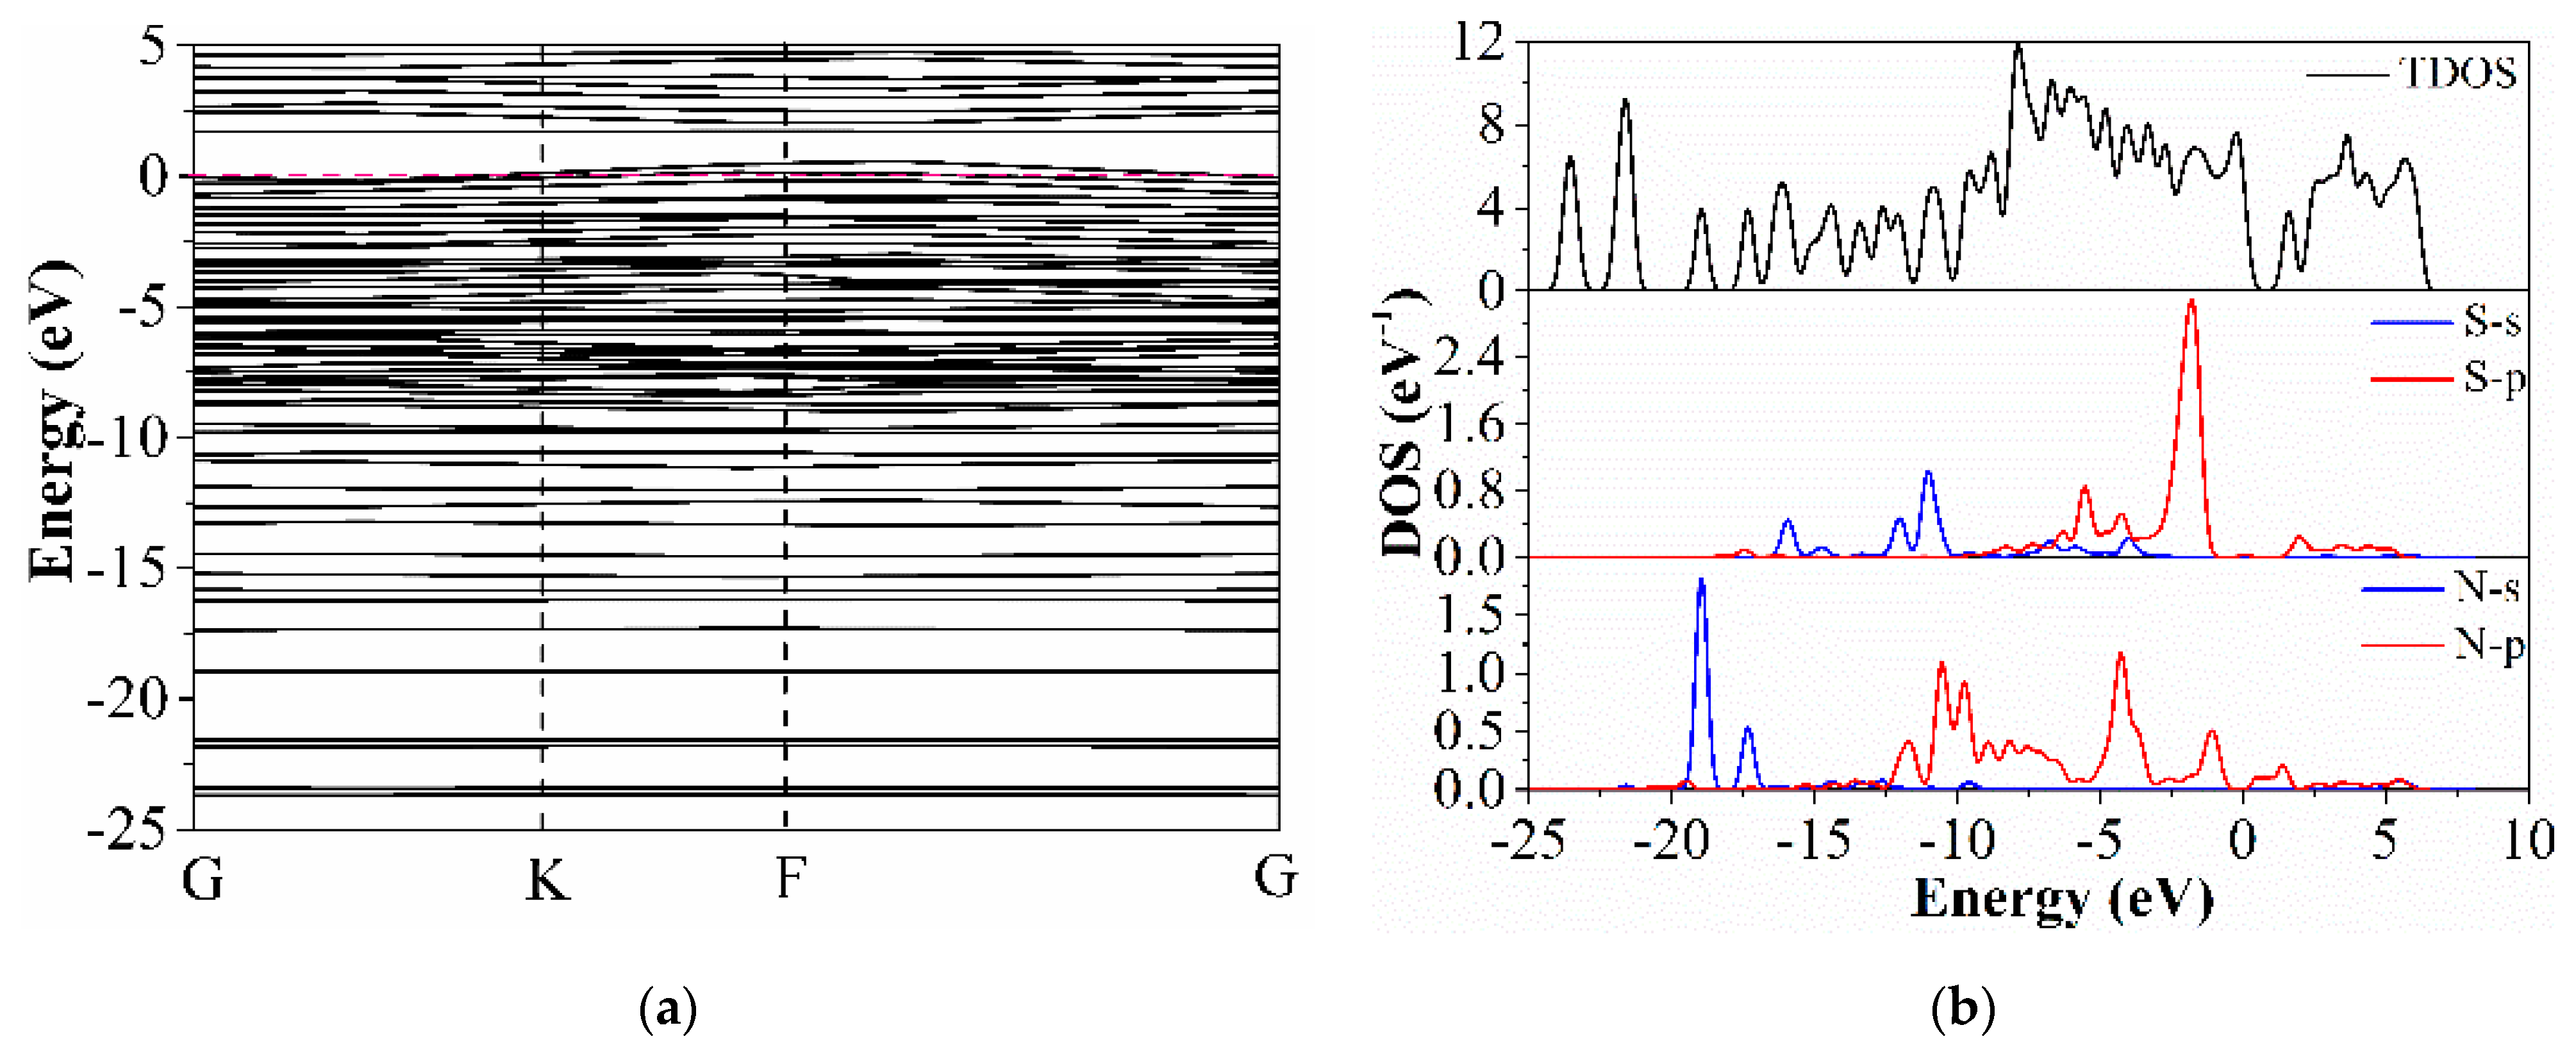
As shown in Figure 11a, the band diagram of S-GO changed after ammonia adsorption. Firstly, the band gap decreased from 0.502 eV to 0.403 eV, the band gap became smaller, and the conduct band and valence band were closer. The electrons in the valence band were more easily excited to the conduct band, which showed that the conductivity of the material increased and the resistance decreased, which was consistent with the decrease in the sensor resistance in the actual experiment. It is also proven that the graphene doped with sulfur is n-type semiconductor. At the same time, more impurity levels are observed, which can enhance the interaction between materials and gases, which proves that the sensitivity to ammonia is higher.
Figure 11b shows the DOS and the PDOS of the adsorbed ammonia by S-GO. In the total state density diagram, the density of the state near the Fermi level increases, which indicates that the band gap of the doped material increases and the ability to absorb ammonia gas is enhanced. In the PDOS of S-G, the top of the valence band is close to the Fermi energy level. In the range of −5 eV to 0 eV, we can see that the density of N-2p and S-2p has a strong and wide peak. It shows that the covalent bond strength and composite strength formed between sulfur atom and nitrogen atom are higher at the top of valence band, so it is shown that it has high sensitivity to ammonia gas in the actual experiment. This shows that sulfur doping increases a large amount of impurity energy levels, provides more electronic states for the material, and enhances its conductivity, which is in line with the calculation results of the band structure.
3.5. Performance Comparison to Other Graphene-Based NH3 Gas Sensors
4. Conclusions
The S-GO nanocomposites were successfully synthesized and used to fabricate ammonia sensors to sense NH3 at RT (20 °C). According to the experimental results, the S-GO sensor has better sensing properties. Compared with the original graphene, the S-GO sensor exhibited an excellent response value of 73% to 10 ppm ammonia and the test limit is 0.5 ppm at RT. In addition, the response and recovery speed revealed an immense improvement as compared with pristine graphene. The S-GO sensor responded to 10 ppm NH3 in 112 s and recovered in 33 s. Moreover, the S-GO sensor also showed excellent selectivity to different kinds of gases. Theoretical calculation based on first-principles was executed and completed. These improvements in sensing properties can be ascribed to the improvement of band structure and DOS after sulfur doping.
Author Contributions
Conceptualization, F.M. and Y.Y.; methodology, Y.Y. and Z.Y.; software, Y.Y.; validation, Z.Y., F.M. and Z.L.; formal analysis, Y.Y. and Z.L.; investigation, Y.Y.; resources, F.M.; data curation, Z.L.; writing—original draft preparation, Y.Y.; writing—review and editing, Y.Y.; visualization, Z.L.; supervision, F.M.; project administration, F.M.; funding acquisition, F.M. All authors have read and agreed to the published version of the manuscript.
Funding
This work was supported by the National Natural Science Foundation of China (62033002, 61833006, 62071112, and 61973058), the 111 Project (B16009), the Fundamental Research Funds for the Central Universities in China (N180408018, N2004019, and N2004028), the Liao Ning Revitalization Talents Program (XLYC1807198), the Liaoning Province Natural Science Foundation (2020-KF-11-04), and the Hebei Natural Science Foundation (No. F2020501040).
Institutional Review Board Statement
Not applicable.
Informed Consent Statement
Informed consent was obtained from all subjects involved in the study.
Data Availability Statement
Data of our study are available upon request.
Acknowledgments
Thanks to Shen Yanbai, Department of Minerals processing engineering, School of Resources and Civil Engineering, Northeastern University, China, for the support in the technical analysis of software applications.
Conflicts of Interest
The authors declare no conflict of interest.
References
- Yuan, Z.; Han, E.; Meng, F.; Zuo, K. Detection and identification of volatile organic compounds based on temperature-modulated ZnO sensors. IEEE Trans. Instrum. Meas. 2020, 69, 4533–4544. [Google Scholar] [CrossRef]
- Meng, F.; Qi, T.; Zhang, J.; Zhu, H.; Yuan, Z.; Liu, C.; Qin, W.; Ding, M. MoS2-templated porous hollow MoO3 microspheres for highly selective ammonia sensing via a Lewis acid-base interaction. IEEE Trans. Ind. Electron. 2021, 1, 1. [Google Scholar]
- Li, J.; Yan, H.; Dang, H.; Meng, F. Structure design and application of hollow core microstructured optical fiber gas sensor: A review. Opt. Laser Technol. 2021, 135, 106658. [Google Scholar] [CrossRef]
- Yuan, Z.; Yang, C.; Gao, H.; Qin, W.; Meng, F. High response formic acid gas sensor based on MoS2 nanosheets. IEEE Trans. Nanotechnol. 2021, 1, 177–184. [Google Scholar] [CrossRef]
- Qin, W.; Yuan, Z.; Gao, H.; Zhang, R.; Meng, F. Perovskite-structured LaCoO3 modified ZnO gas sensor and investigation on its gas sensing mechanism by first principle. Sens. Actuators B Chem. 2021, 341, 130015. [Google Scholar] [CrossRef]
- Zhao, H.; Liu, L.; Lin, X. Proton-conductive gas sensor: A new way to realize highly selective ammonia detection for analysis of exhaled human breath. ACS Sens. 2020, 5, 346–352. [Google Scholar] [CrossRef] [PubMed]
- Choi, Y.; Hwang, I.; Park, J.; Choi, K.; Park, J.; Lee, J. Novel fabrication of an SnO2 nanowire gas sensor with high sensitivity. Nannotechnology 2008, 19, 095508. [Google Scholar] [CrossRef]
- Rao, B. Zinc oxide ceramic semi-conductor gas sensor for ethanol vapour. Mater. Chem. Phys. 2000, 64, 62–65. [Google Scholar] [CrossRef]
- Kwak, D.; Wang, M.; Koski, K.; Zhang, L.; Sokol, H.; Maric, R.; Lei, Y. Molybdenum trioxide (α-MoO3) nanoribbons for ultrasensitive Ammonia (NH3) gas detection: Integrated experimental and density functional theory simulation studies. ACS Appl. Mater. Interfaces 2019, 11, 10697–10706. [Google Scholar] [CrossRef]
- Farjadian, F.; Abbaspour, S.; Sadatlu, M. Recent developments in graphene and graphene oxide: Properties, synthesis, and modifications: A review. ChemistrySelect 2020, 5, 10200–10219. [Google Scholar] [CrossRef]
- Bai, L.; Zhang, Y.; Tong, W. Graphene for energy storage and conversion: Synthesis and interdisciplinary applications. Electrochem. Energy Rev. 2020, 3, 395–430. [Google Scholar] [CrossRef]
- Hussain, A.; Mehdi, S.; Abbas, N. Synthesis of graphene from solid carbon sources: A focused review. Mater. Chem. Phys. 2020, 248, 294–301. [Google Scholar] [CrossRef]
- Chernozatonskii, L.; Artyukh, A.; Kvashnin, A. Mechanical engineering effect in electronic and optical properties of graphene nanomeshes. ACS Appl. Mater. Interfaces 2020, 12, 55189–55194. [Google Scholar] [CrossRef]
- Vozniakovskii, A.A.; Voznyakovskii, A.P.; Kidalov, S.V. Structure and paramagnetic properties of graphene nanoplatelets prepared from biopolymers using self-propagating high-temperature synthesis. J. Struct. Chem. 2020, 61, 826–834. [Google Scholar] [CrossRef]
- Madurani, K.; Suprapto, S.; Machrita, N. Progress in graphene synthesis and its application: History, challenge and the future outlook for research and industry. ECS J. Solid State Sci. Technol. 2020, 9, 093230. [Google Scholar] [CrossRef]
- Sun, Z.; Hu, Y. Ultrafast, low-cost, and mass production of high-quality graphene. Angew. Chem. Int. Ed. 2020, 59, 9232–9234. [Google Scholar] [CrossRef]
- Yuan, Z.; Liu, Y.; Zhang, J.; Meng, F.; Zhang, H. Rose-like MoO3/MoS2/rGO low temperature ammonia sensors based on multi-gas detection methods. IEEE Trans. Instrum. Meas. 2021, 70, 9506109. [Google Scholar] [CrossRef]
- Yuan, Z.; Zhao, J.; Meng, F.; Qin, W. Sandwich-like composites of double-layer Co3O4 and reduced graphene oxide and their sensing properties to volatile organic compounds. J. Alloy. Compd. 2019, 793, 24–30. [Google Scholar] [CrossRef]
- Meng, F.; Chang, Y.; Qin, W.; Yuan, Z.; Zhao, J.; Zhang, J. ZnO-reduced graphene oxide composites sensitized with graphitic carbon nitride nanosheets for ethanol sensing. ACS Appl. Nano Mater. 2019, 2, 2734–2742. [Google Scholar] [CrossRef]
- Wei, D.; Liu, Y.; Wang, Y. Synthesis of N-doped graphene by chemical vapor deposition and its electrical properties. Nano Lett. 2009, 9, 1752–1758. [Google Scholar] [CrossRef]
- Panchakarla, L.; Subrahmanyam, K.; Saha, S. Synthesis, structure, and properties of boron- and nitrogen-doped graphene. Adv. Mater. 2009, 21, 4726–4730. [Google Scholar] [CrossRef]
- Nundy, S.; Ghosh, A.; Nath, R.; Paul, A.; Tahir, A.A.; Mallick, T.K. Reduced Graphene Oxide (rGO) Aerogel: Efficient adsorbent for the elimination of An-timony (III) and (V) from wastewater. J. Hazard. Mater. 2021, 420, 126554. [Google Scholar] [CrossRef] [PubMed]
- Ye, Z.; Tai, H.; Xie, T.; Su, Y.; Yuan, Z.; Liu, C.; Jiang, Y. A facile method to develop novel TiO2/rGO layered film sensor for detecting ammonia at room temperature. Mater. Lett. 2016, 165, 127–130. [Google Scholar] [CrossRef]
- Guo, Y.; Sun, X.; Liu, Y.; Wang, W.; Qiu, H.; Gao, J. One pot preparation of reduced graphene oxide (RGO) or Au (Ag) nanoparticle-RGO hybrids using chitosan as a reducing and stabilizing agent and their use in methanol electrooxidation. Carbon 2012, 50, 2513–2523. [Google Scholar] [CrossRef]
- Zhang, X.; Wang, G.; Cao, W.; Wei, Y.; Liang, J.; Guo, L.; Cao, M. Enhanced microwave absorption property of reduced graphene oxide (RGO)-MnFe2O4 nanocomposites and polyvinylidene fluoride. ACS Appl. Mater. Interfaces 2014, 6, 7471–7478. [Google Scholar] [CrossRef]
- Yang, Z.; Yao, Z.; Li, G.; Fang, G.; Nie, H.; Liu, Z.; Zhou, X.; Chen, X.; Huang, S. Sulfur-doped graphene as an efficient metal-free cathode catalyst for oxygen reduction. ACS Nano 2012, 6, 205–211. [Google Scholar] [CrossRef]
- Wohlgemuth, S.; White, R.; Willinger, M.; Titirici, M.; Antonietti, M. A one-pot hydrothermal synthesis of sulfur and nitrogen doped car-bon aerogels with enhanced electrocatalytic activity in the oxygen reduction reaction. Green Chem. 2012, 14, 1515. [Google Scholar] [CrossRef] [Green Version]
- Chen, J.; Yao, B.; Li, C. An improved Hummers method for eco-friendly synthesis of graphene oxide. Carbon 2013, 64, 225. [Google Scholar] [CrossRef]
- Sharma, N.; Sharma, V.; Jain, Y. Synthesis and characterization of graphene oxide (GO) and reduced graphene oxide (rGO) for gas sensing application. Macromol. Symp. 2017, 376, 1700006. [Google Scholar] [CrossRef]
- Aslam, M.; Kalyar, M.; Raza, Z. Synthesis and structural characterization of separate graphene oxide and reduced graphene oxide nanosheets. Mater. Res. Express 2016, 3, 105036–105046. [Google Scholar] [CrossRef]
- Choi, Y.; Kim, E.; Han, J. A novel biomolecule-mediated reduction of graphene oxide: A multifunctional anti-cancer agent. Molecules 2016, 21, 375. [Google Scholar] [CrossRef]
- Si, Y.; Samulski, E.T. Synthesis of water soluble graphene. Nano Lett. 2008, 8, 1679–1682. [Google Scholar] [CrossRef] [PubMed]
- Stankovich, S.; Piner, R.; Nguyen, S.T. Synthesis and exfoliation of isocyanate-treated graphene oxide nanoplatelets. Carbon 2006, 44, 3342–3347. [Google Scholar] [CrossRef]
- Gómez, R.; López, T.; Ortiz-Islas, E. Effect of sulfation on the photoactivity of TiO2 sol–gel derived catalysts. J. Mol. Catal. A Chem. 2003, 193, 217–226. [Google Scholar] [CrossRef]
- Clark, S.; Segall, M.; Pickard, C. First principles methods using CASTEP. Z. Kristallogr. 2005, 220, 567–570. [Google Scholar] [CrossRef] [Green Version]
- Segall, M.; Lindan, P.; Probert, M. First-principles simulation: Ideas, illustrations and the CASTEP code. J. Phys. Condens. Matter 2002, 14, 2717–2744. [Google Scholar] [CrossRef]
- Qin, H.; Feng, C.; Luan, X.; Yang, D. First-principles investigation of adsorption behaviors of small molecules on pentagraphene. Nanoscale Res. Lett. 2018, 13, 264–271. [Google Scholar] [CrossRef] [PubMed]
- Dai, J.; Yuan, J.; Giannozzi, P. Gas adsorption on graphene doped with B, N, Al, and S: A theoretical study. Appl. Phys. Lett. 2009, 95, 232105. [Google Scholar] [CrossRef]
- Li, S.; Zhao, J.; Li, L. Sodium adsorption and intercalation in bilayer graphene doped with B, N, Si and P: A first-principles study. J. Electron. Mater. 2020, 49, 6336–6347. [Google Scholar] [CrossRef]
- Kumar, R.; Kumar, A.; Singh, R.; Kashyap, R.; Kumar, D. Room temperature ammonia gas sensor using ester functionalization of graphene oxide. Mater. Res. Express 2019, 6, 095618. [Google Scholar] [CrossRef]
- Tai, H.; Yuan, Z.; Zheng, W.; Ye, Z.; Liu, C.; Du, X. ZnO nanoparticles/reduced graphene oxide bilayer thin films for improved NH3-sensing performances at room temperature. Nanoscale Res. Lett. 2016, 11, 130. [Google Scholar] [CrossRef] [PubMed] [Green Version]
- Feng, Q.; Li, X.; Wang, J. Percolation effect of reduced graphene oxide (rGO) On ammonia sensing of rGO-SnO2 composite based sensor. Sens. Actuators B 2017, 243, 1115–1126. [Google Scholar] [CrossRef]
- Li, X.; Zhao, Y.; Wang, X.; Wang, J.; Gaskov, A.M.; Akbar, S.A. Reduced graphene oxide (rGO) decorated TiO2 microspheres for selective room-temperature gas sensors. Sens. Actuators B 2016, 230, 330–336. [Google Scholar] [CrossRef]
- Ye, Z.; Jiang, Y.; Tai, H.; Yuan, Z. The investigation of reduced graphene oxide/P3HT composite films for ammonia detection. Integr. Ferroelectr. 2014, 154, 73–81. [Google Scholar] [CrossRef]
- Wang, Y.; Zhang, L.; Hu, N.; Wang, Y.; Zhang, Y.; Zhou, Z. Ammonia gas sensors based on chemically reduced graphene oxide sheets self-assembled on Au electrodes. Nanoscale Res. Lett. 2014, 9, 251. [Google Scholar] [CrossRef] [PubMed] [Green Version]
Figure 1.
Schematic illustration of (a) the synthesis of graphene oxide and S-doped graphene and (b) fabricated gas sensor based on S-doped graphene.
Figure 1.
Schematic illustration of (a) the synthesis of graphene oxide and S-doped graphene and (b) fabricated gas sensor based on S-doped graphene.

Figure 2.
Gas sensing test system.

Figure 3.
SEM images of (a) GO and (b) S-GO. (c) EDS spectrum and (d) element content of S-GO.


Figure 4.
FTIR spectra of sGO and S-1.

Figure 5.
Response curves comparison of (a) GO and (b) S-1.

Figure 6.
(a) Response curve of S-1 to gradient concentrations of ammonia, (b) detection limit test of S-1 to ammonia, and (c) sensitivity curve of S-1 to different concentrations of ammonia.
Figure 6.
(a) Response curve of S-1 to gradient concentrations of ammonia, (b) detection limit test of S-1 to ammonia, and (c) sensitivity curve of S-1 to different concentrations of ammonia.

Figure 7.
(a) Selectivity test of S-1, (b) response curve of S-1 to mixed gas.

Figure 8.
Repeatability test of S-1.

Figure 9.
(a) Planform of GO module after geometry optimization and (b) planform of S-GO module after geometry optimization.
Figure 9.
(a) Planform of GO module after geometry optimization and (b) planform of S-GO module after geometry optimization.

Figure 10.
Band structure diagram of (a) GO and (b) S-GO; (c) DOS diagrams of GO and S-GO; (d) TDOS diagram of S-GO.
Figure 10.
Band structure diagram of (a) GO and (b) S-GO; (c) DOS diagrams of GO and S-GO; (d) TDOS diagram of S-GO.

Figure 11.
(a) Band structure diagram of S-G after ammonia adsorption; (b) TDOS diagram of S-G after ammonia adsorption.
Figure 11.
(a) Band structure diagram of S-G after ammonia adsorption; (b) TDOS diagram of S-G after ammonia adsorption.


Table 1.
Element content of S-GO.
| Element | Weight% | Atom% |
|---|---|---|
| C | 69.42 | 83.05 |
| O | 3.39 | 3.05 |
| Si | 27.10 | 13.86 |
| S | 0.09 | 0.04 |
| Total | 100.00 | 100.00 |
Table 2.
Detected signals in the FTIR spectra.
| Wavenumber (cm−1) | 1250 | 1300 | 1600 |
| Chemical bond | S-O | C-OH | C=C |
Table 3.
NH3-sensing performance of graphene-based sensors at room temperature.
| Materials | Concentration of Ammonia (ppm) | Sensitivity (%) | Response/Recovery Time (s) | Reference |
|---|---|---|---|---|
| GO/ester | 100 | 12 | 55/80 | [40] |
| rGO/SnO2 | 50 | 30 | 60/120 | [42] |
| Py/rGO | 100 | 22 | 134/310 | [45] |
| rGO/P3HT | 50 | 13 | 92/415 | [44] |
| TiO2/rGO | 50 | 5.5 | Slow/slow | [43] |
| ZnO/rGO | 50 | 3.05 | 84/216 | [41] |
| Sulfer/GO | 10 | 73 | 112/33 | This work |
Publisher’s Note: MDPI stays neutral with regard to jurisdictional claims in published maps and institutional affiliations. |
© 2021 by the authors. Licensee MDPI, Basel, Switzerland. This article is an open access article distributed under the terms and conditions of the Creative Commons Attribution (CC BY) license (https://creativecommons.org/licenses/by/4.0/).
Share and Cite
MDPI and ACS Style
Yu, Y.; Liao, Z.; Meng, F.; Yuan, Z. Theoretical and Experimental Research on Ammonia Sensing Properties of Sulfur-Doped Graphene Oxide. Chemosensors 2021, 9, 220. https://0-doi-org.brum.beds.ac.uk/10.3390/chemosensors9080220
AMA Style
Yu Y, Liao Z, Meng F, Yuan Z. Theoretical and Experimental Research on Ammonia Sensing Properties of Sulfur-Doped Graphene Oxide. Chemosensors. 2021; 9(8):220. https://0-doi-org.brum.beds.ac.uk/10.3390/chemosensors9080220
Chicago/Turabian StyleYu, Yao, Zhijia Liao, Fanli Meng, and Zhenyu Yuan. 2021. "Theoretical and Experimental Research on Ammonia Sensing Properties of Sulfur-Doped Graphene Oxide" Chemosensors 9, no. 8: 220. https://0-doi-org.brum.beds.ac.uk/10.3390/chemosensors9080220
Note that from the first issue of 2016, this journal uses article numbers instead of page numbers. See further details here.