
Label Free, Lateral Flow Prostaglandin E2 Electrochemical Immunosensor for Urinary Tract Infection Diagnosis

 , and
, and 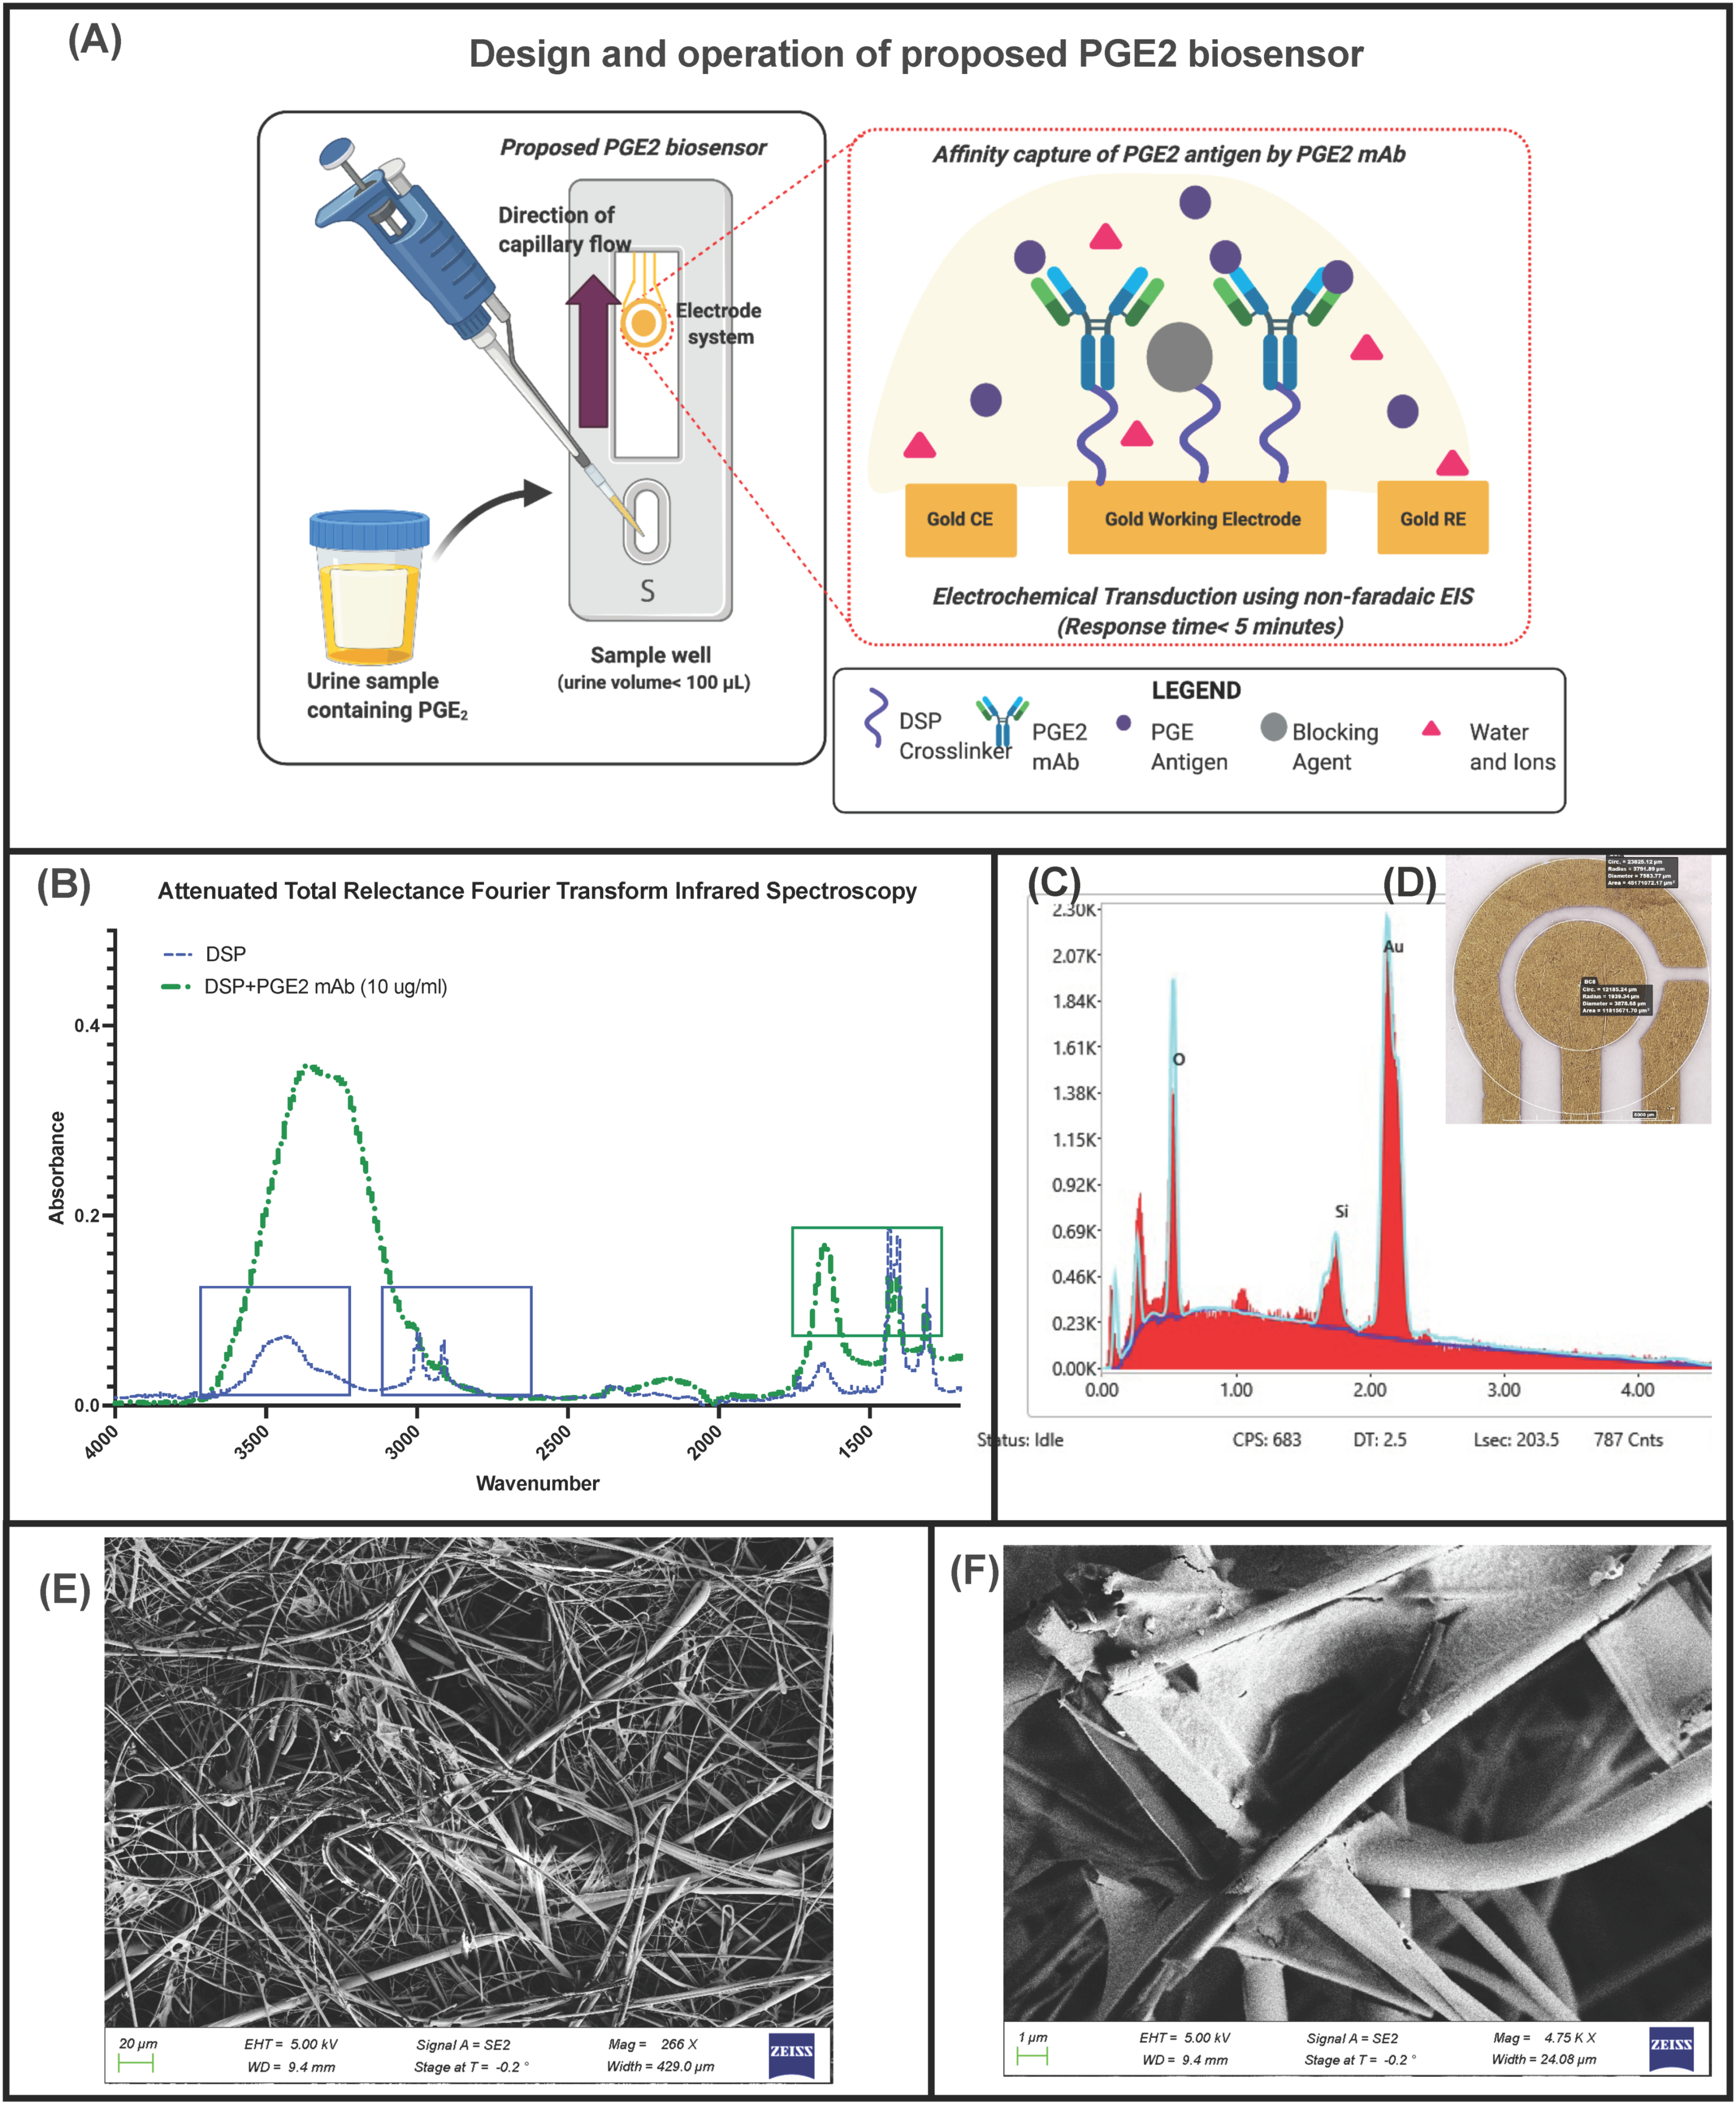
Abstract
:1. Introduction
2. Materials and Methods
2.1. Materials and Reagents
2.2. Sensor Fabrication and SEM-EDAX Analysis
2.3. Electrode Modification and Sensor Stack Development
2.4. ATR-FTIR Studies
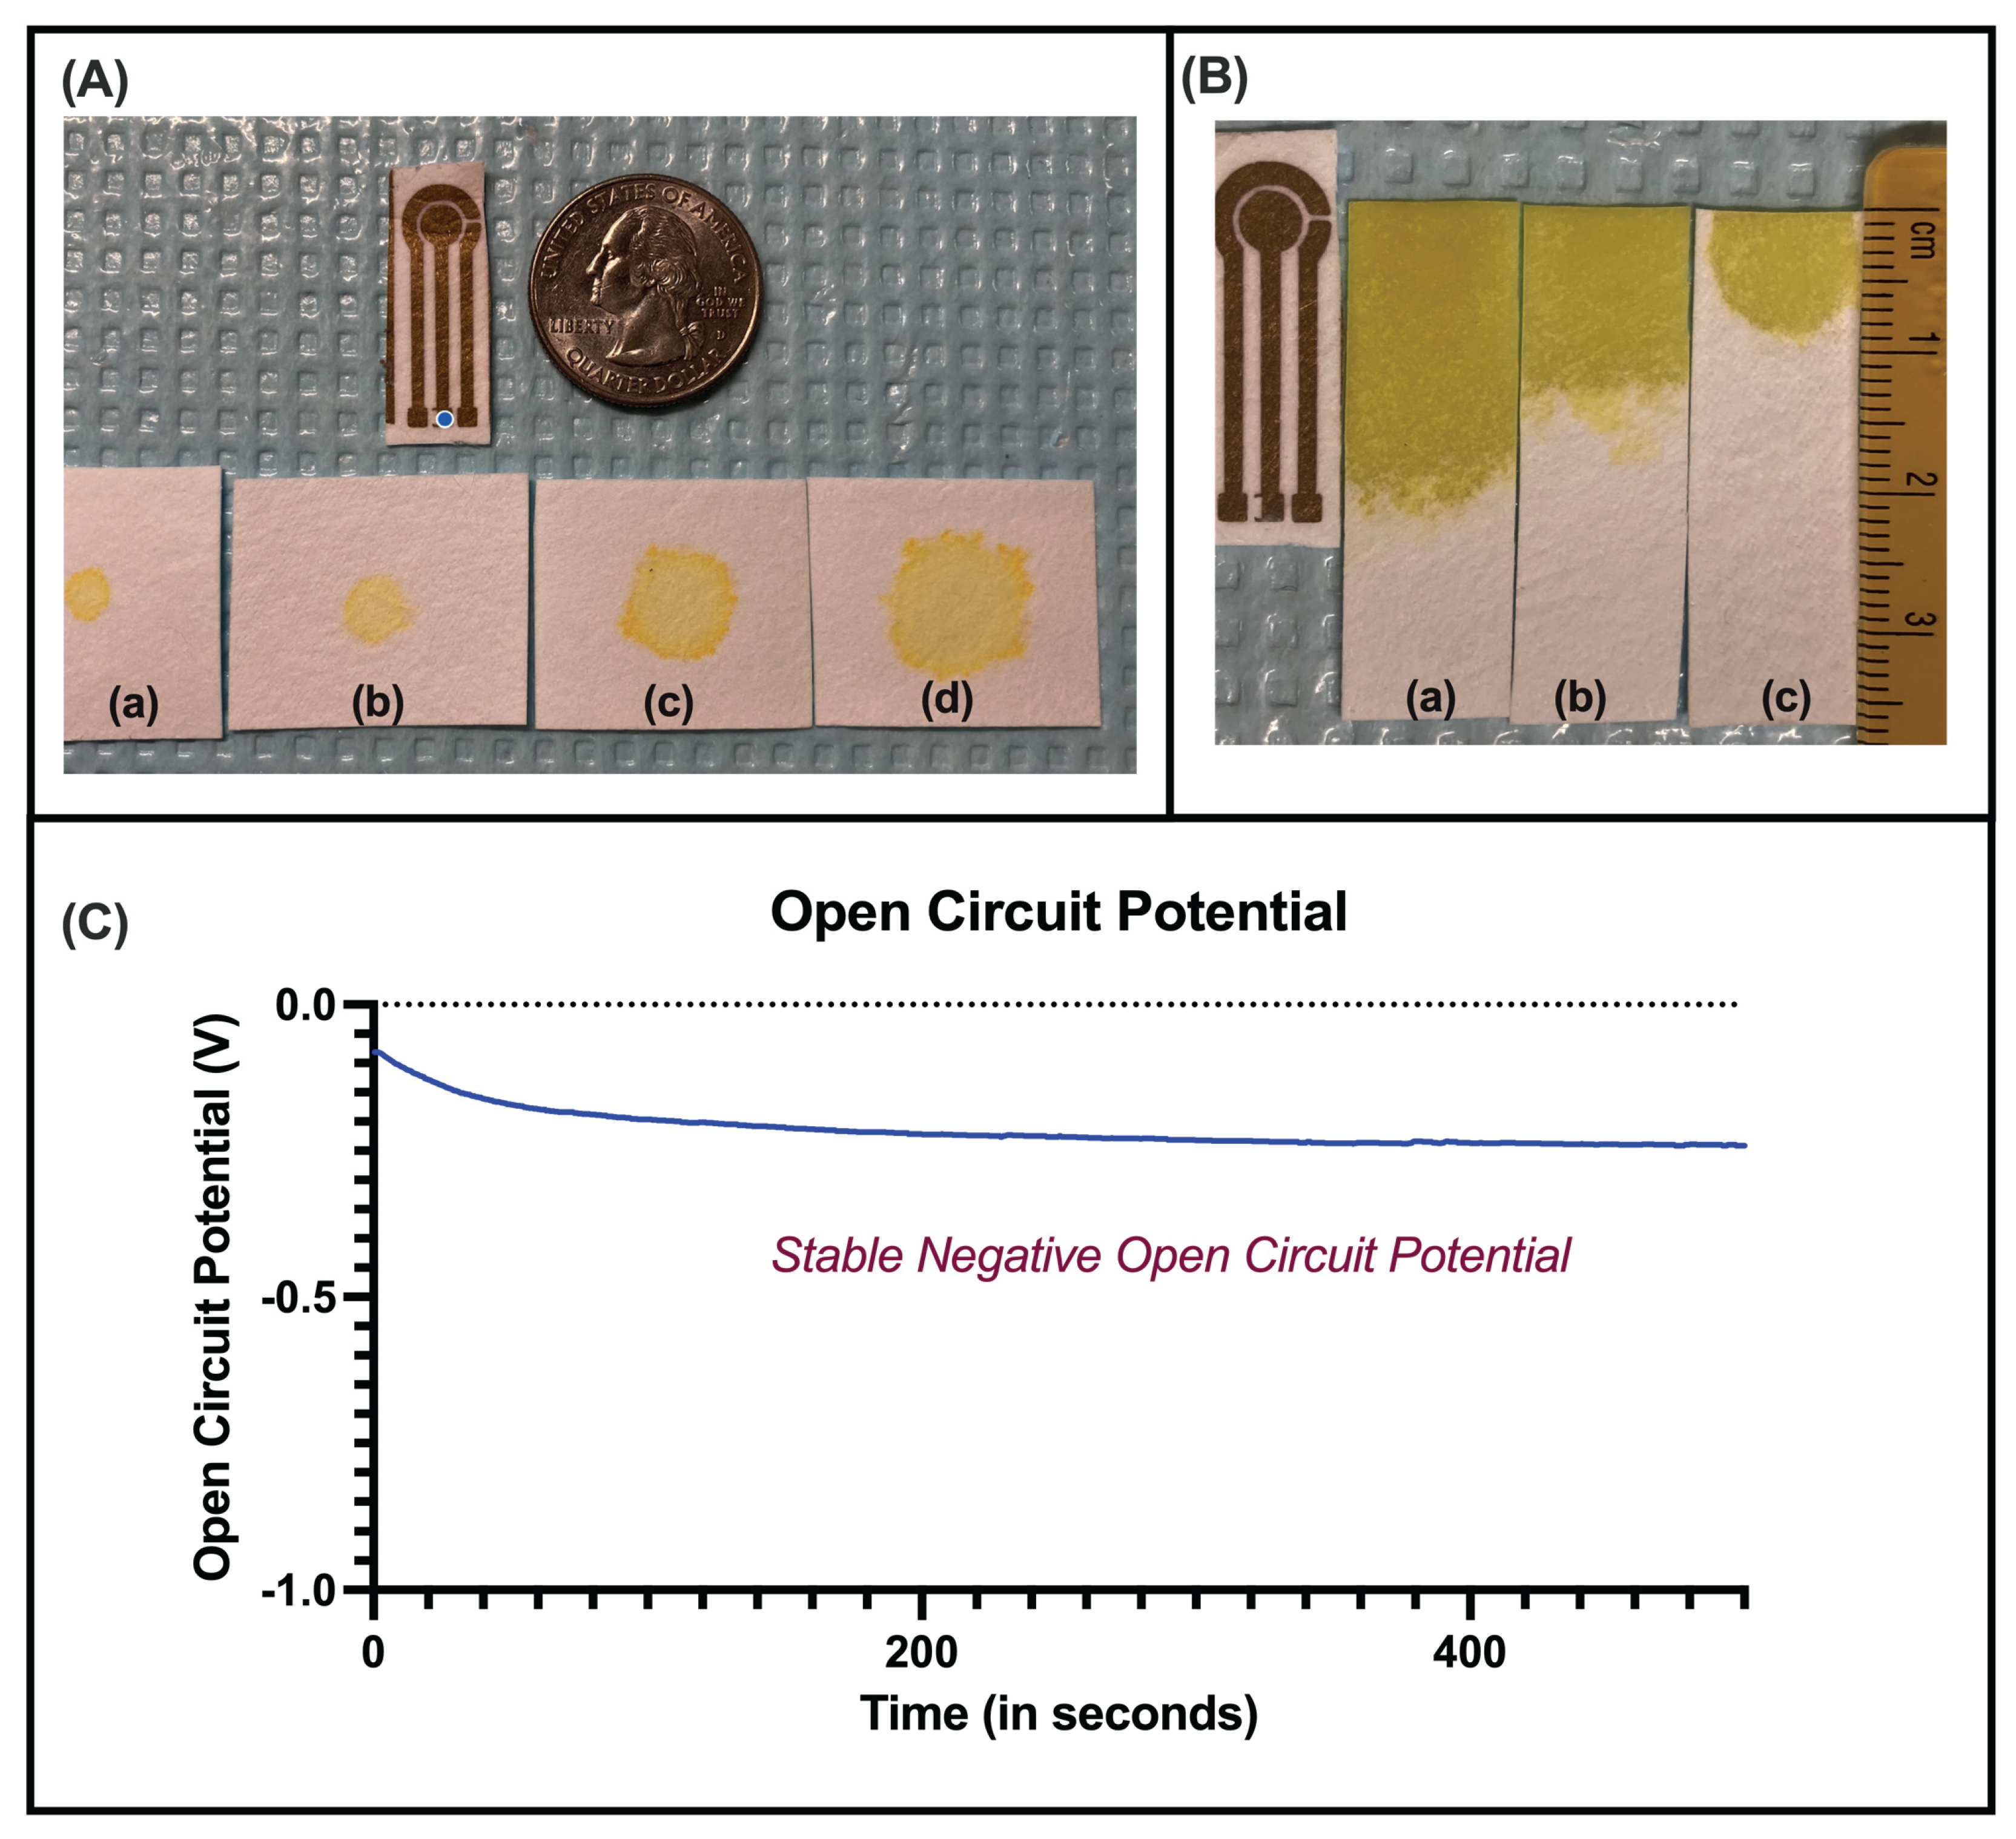
2.5. Lateral Flow Optimization and Contact-Angle Studies
2.6. Open Circuit Potential Studies
2.7. Design of Electrochemical Impedance Spectroscopy (EIS) Experiments and Sensor Calibration in Human Urine
2.8. Zeta Potential Studies
2.9. Sensor Performance in Varying Urine pH
2.10. Statistical Analysis
3. Results and Discussion
3.1. Immunoassay Analysis and Binding Chemistry Validation
3.2. Lateral Flow Optimization
3.3. Electrochemical Optimization
3.3.1. Electrochemical Stability Analysis
3.3.2. Signal Enhancement Due to Nanoconfinement
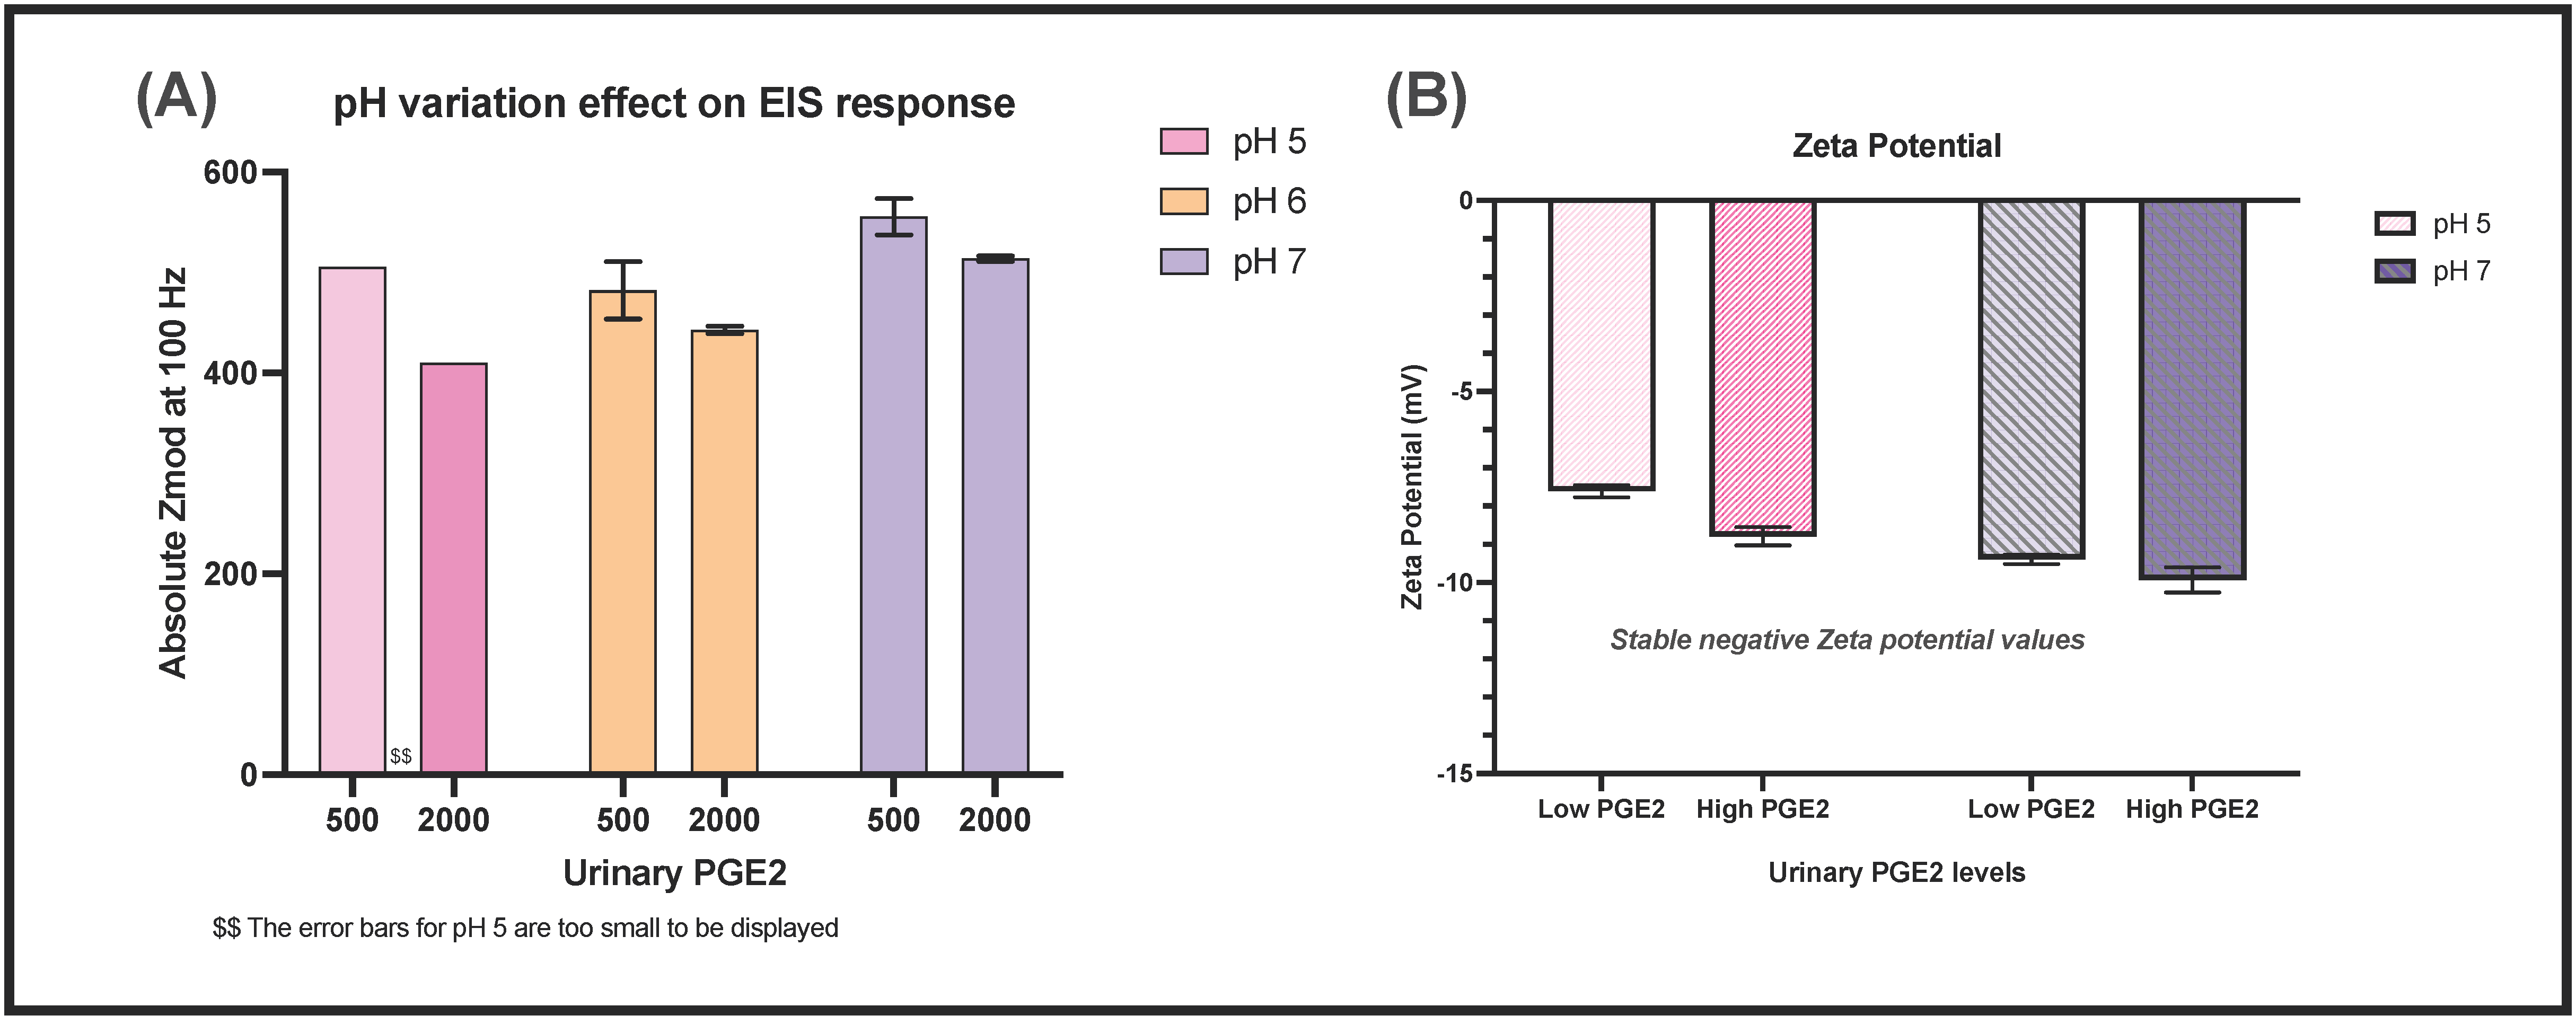
3.3.3. Surface Charge Behavior of Assay Stack
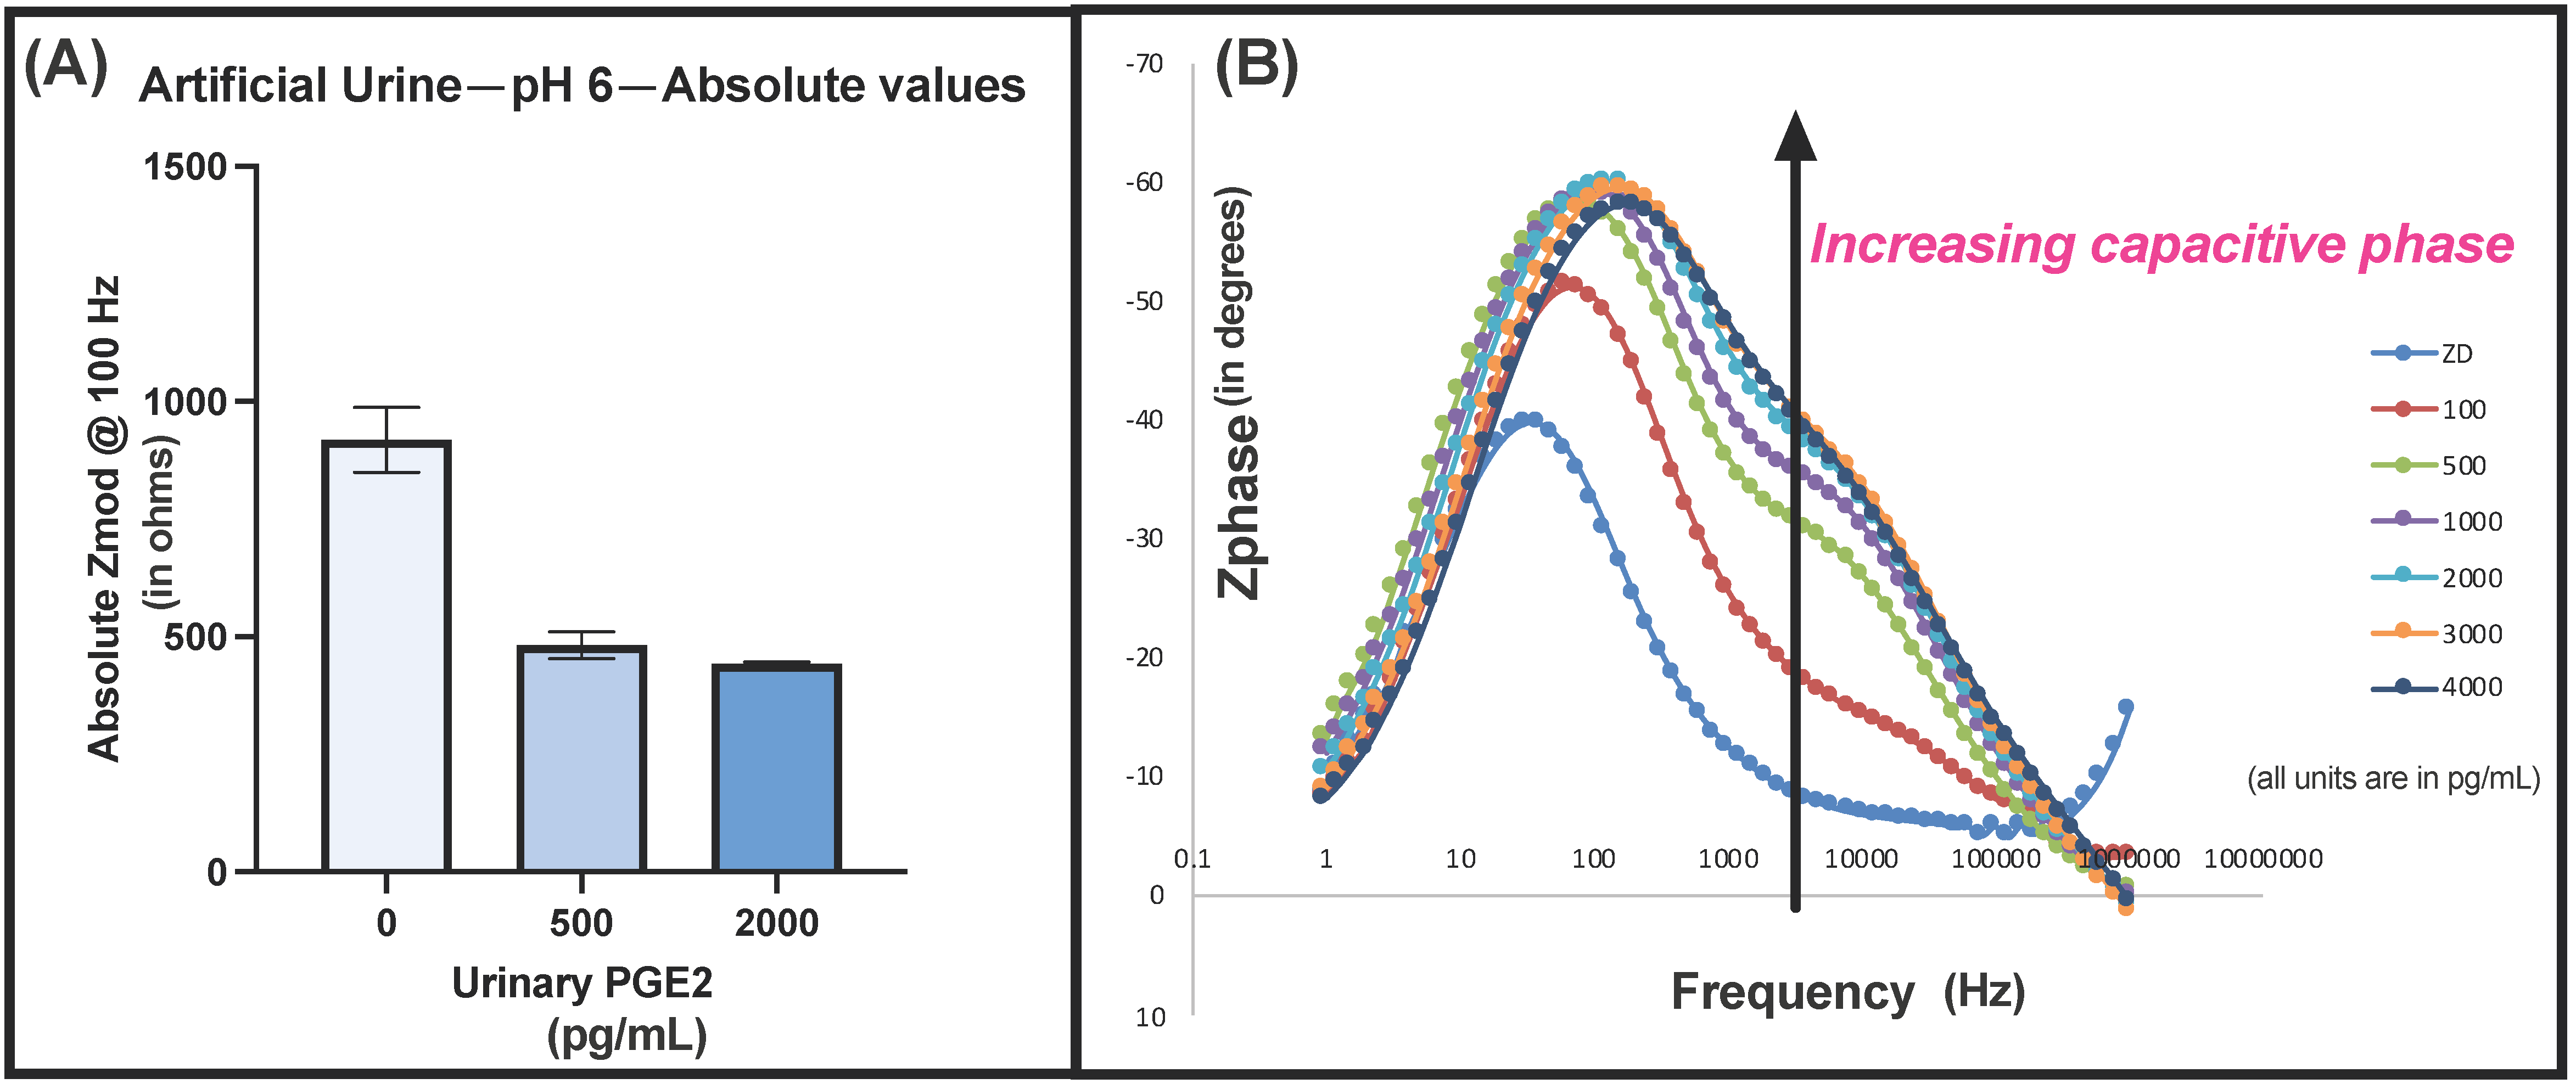
3.3.4. Electrochemical Characterization of Sensor Response in Urine Buffer
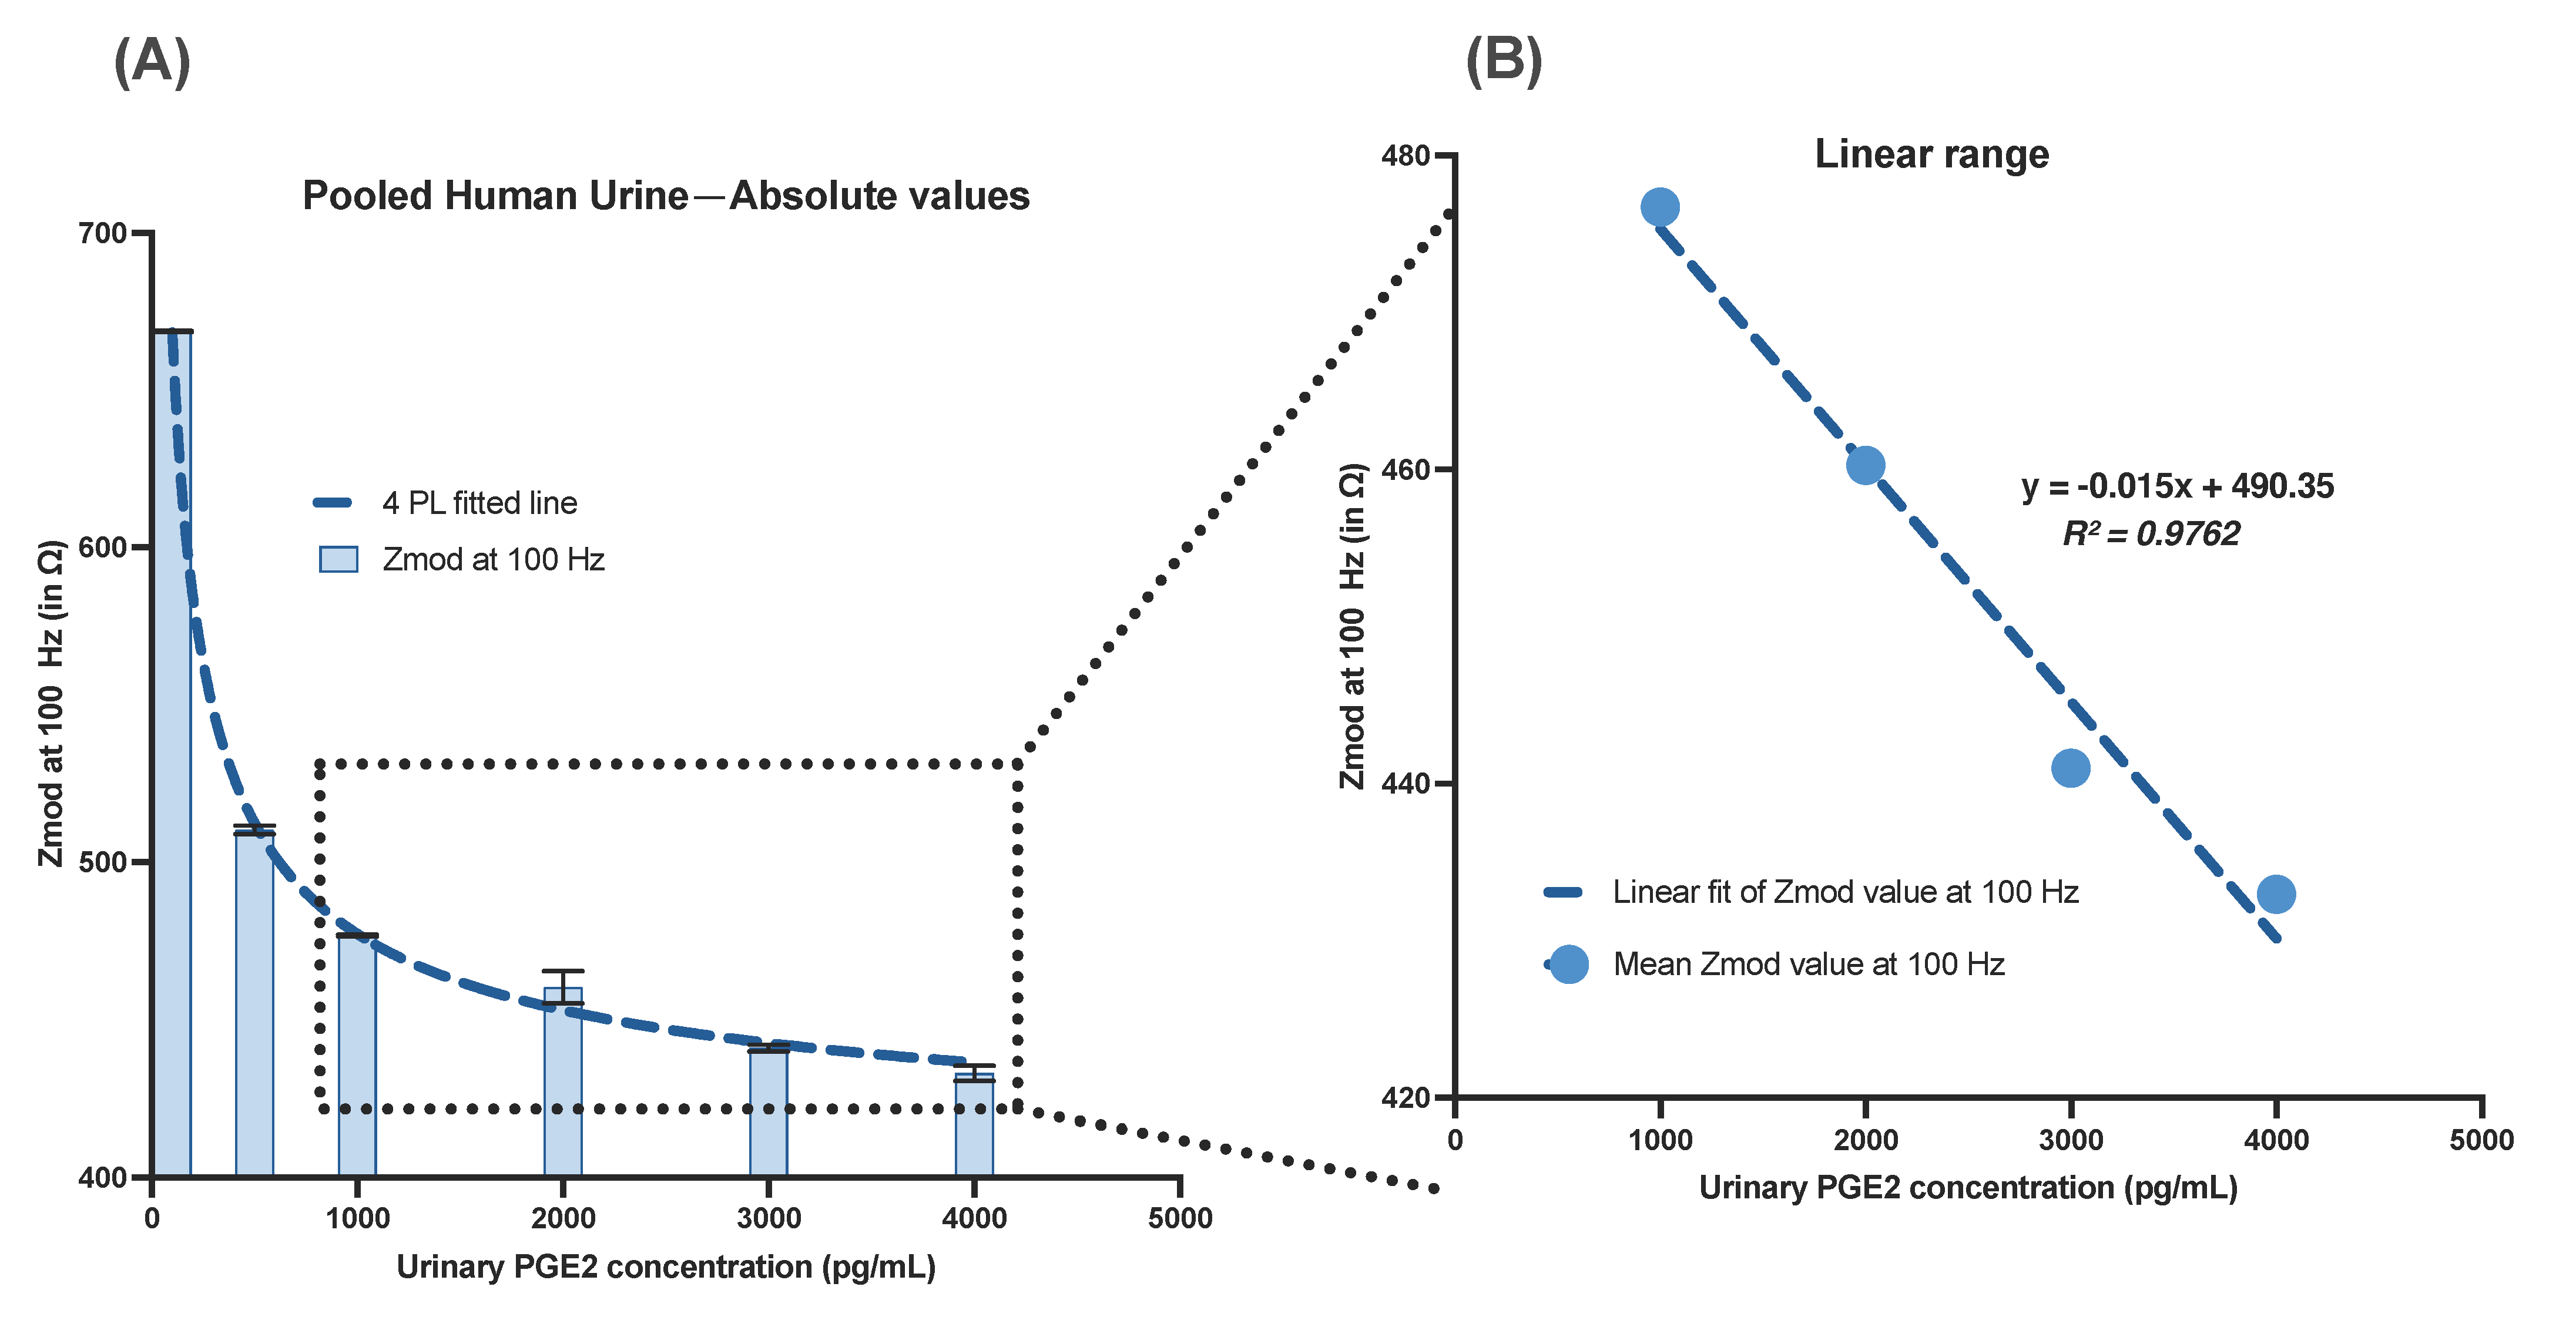
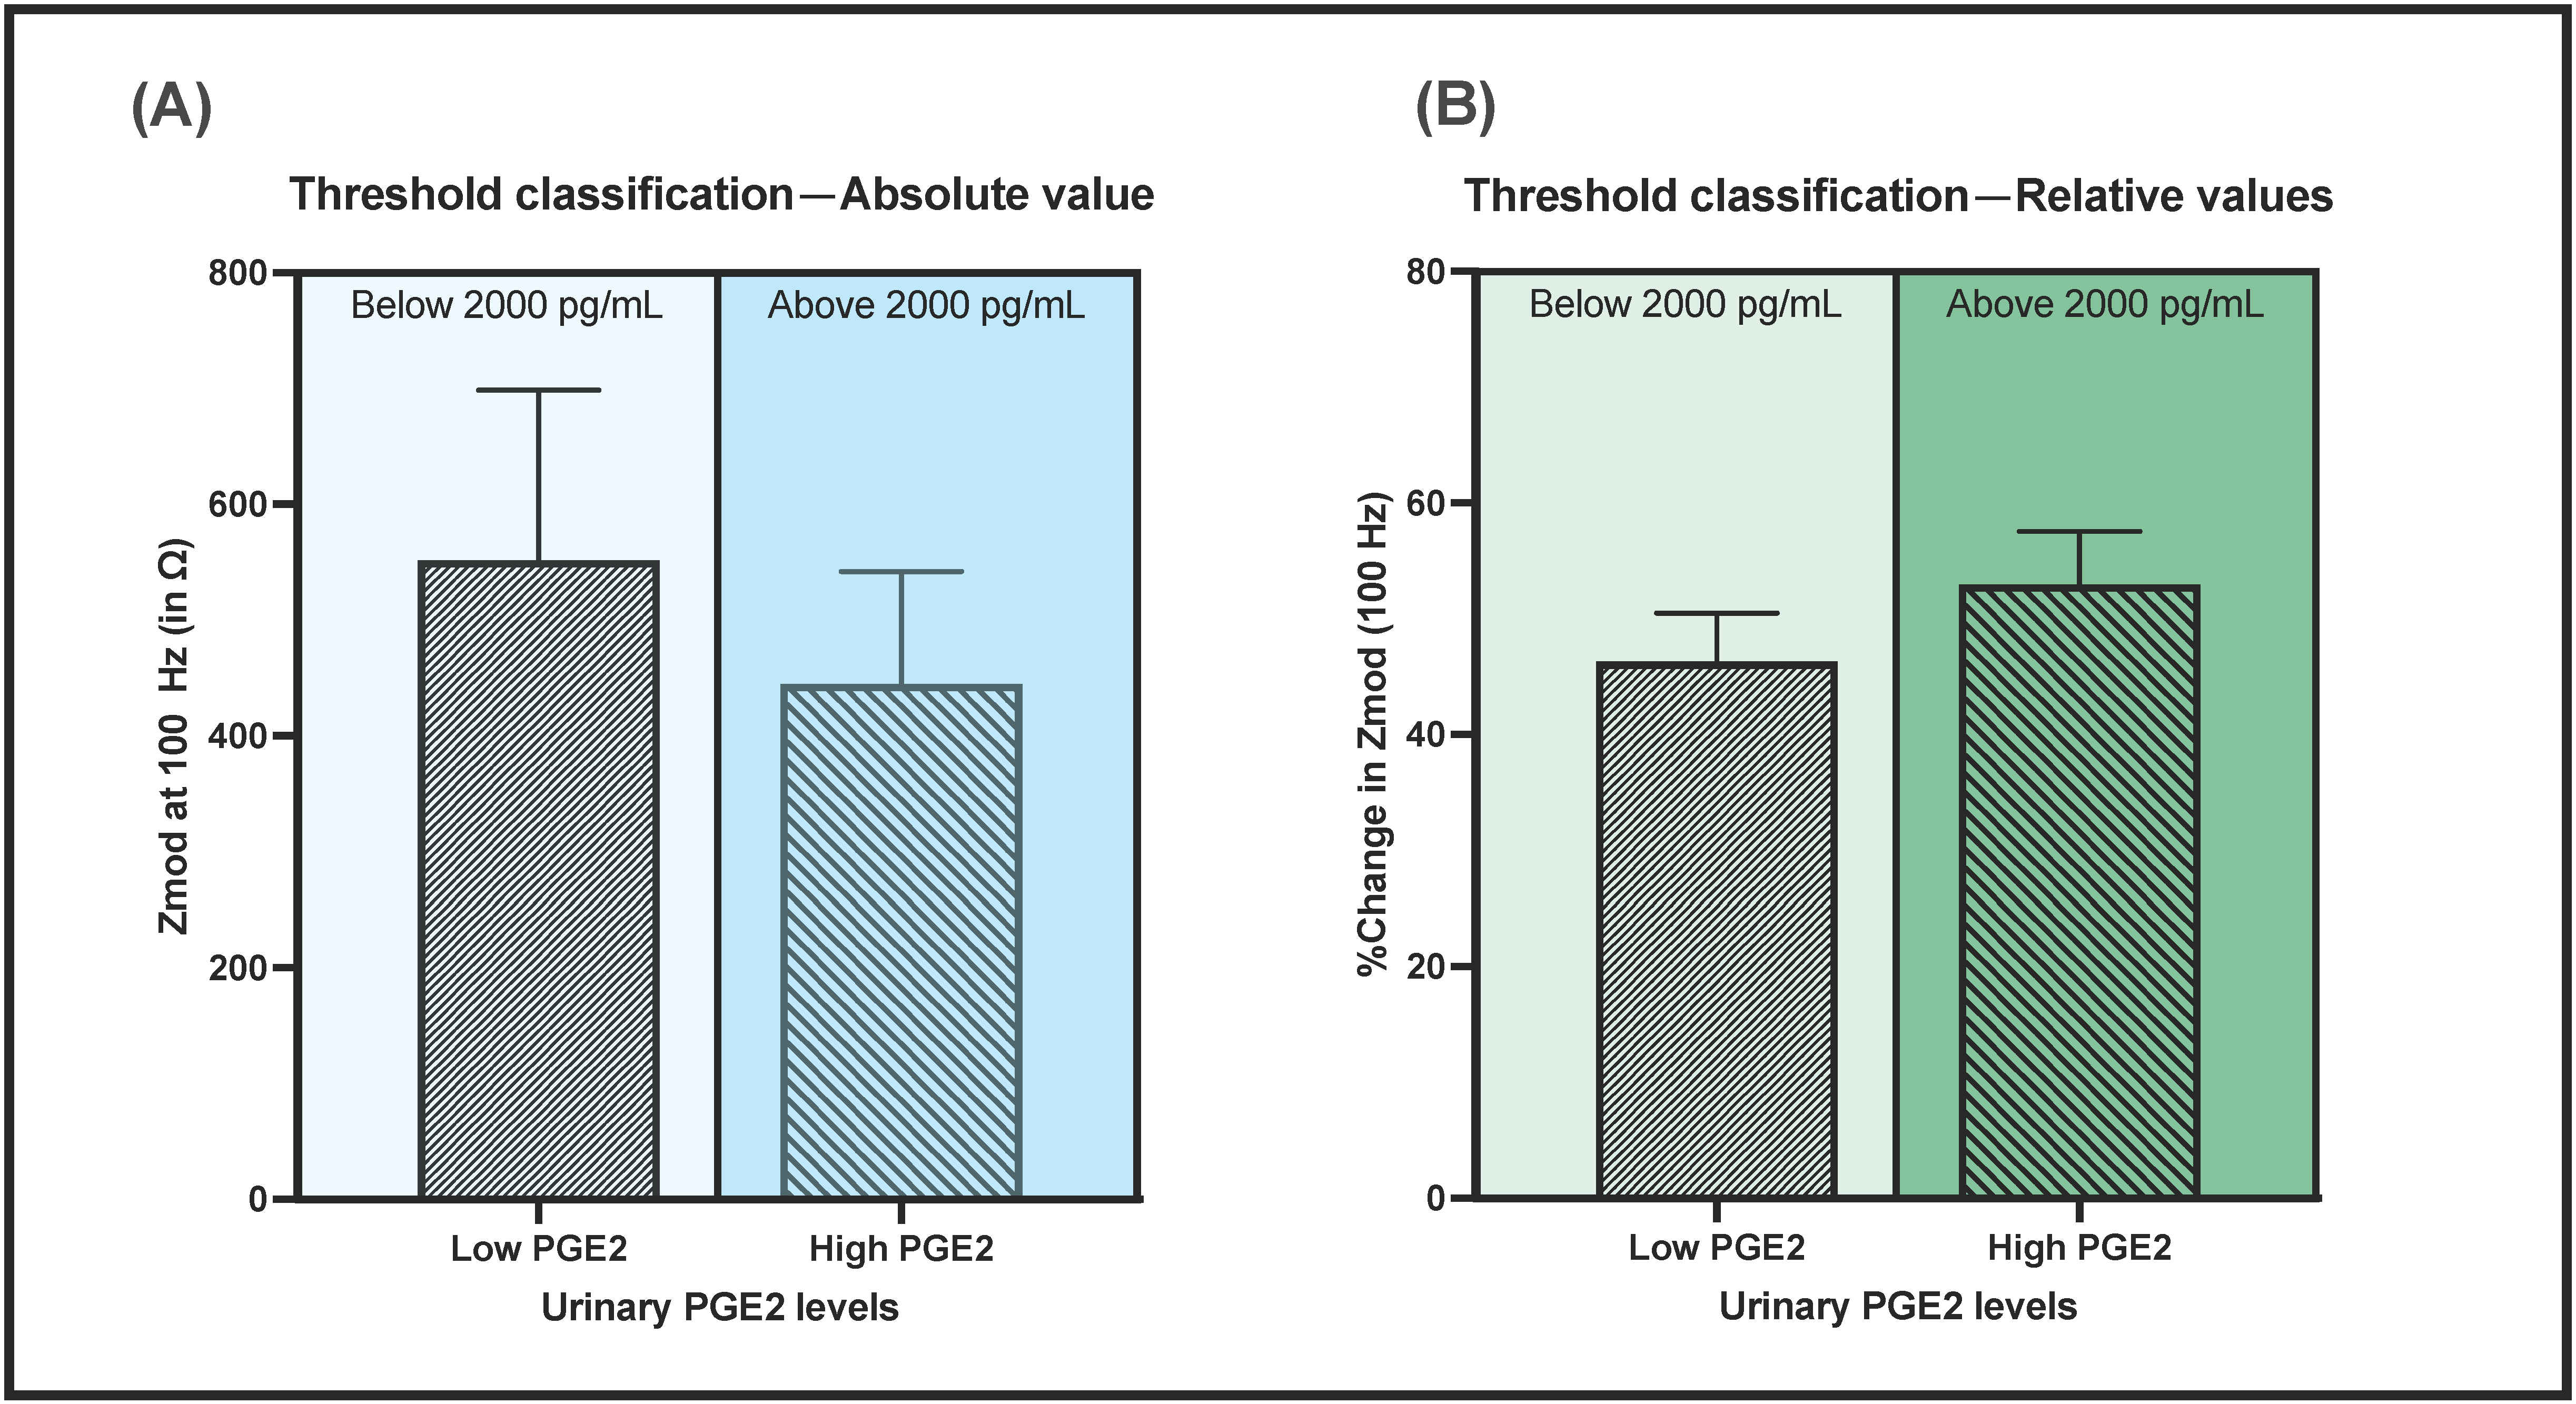
3.4. Performance Evaluation of Lateral Flow Electrochemical Sensor
3.5. Effect of Urine pH and Matrix Composition on Sensor Performance
4. Conclusions
Supplementary Materials
Author Contributions
Funding
Institutional Review Board Statement
Informed Consent Statement
Data Availability Statement
Acknowledgments
Conflicts of Interest
References
- Franz, M.; Hö, W.H. Nephrology Dialysis Transplantation A Primer in Nephrological Practice Common errors in diagnosis and management of urinary tract infection. I: Pathophysiology and diagnostic techniques. Nephrol. Dial. Transplant. 1999, 14, 2746–2753. [Google Scholar] [CrossRef]
- Catheter-Associated Urinary Tract Infections (CAUTI) | HAI | CDC. Available online: https://www.cdc.gov/hai/ca_uti/uti.html (accessed on 16 September 2021).
- Mach, K.E.; Wong, P.K.; Liao, J.C. Biosensor diagnosis of urinary tract infections: A path to better treatment? Trends Pharmacol. Sci. 2011, 32, 330–336. [Google Scholar] [CrossRef] [Green Version]
- Schmiemann, G.; Kniehl, E.; Gebhardt, K.; Matejczyk, M.M.; Hummers-Pradier, E. Diagnose des harnwegsinfekts: Eine systematische übersicht. Dtsch. Aerzteblatt 2010, 107, 361–367. [Google Scholar] [CrossRef]
- Medina, E.C.-P.M. An introduction to the epidemiology and burden of urinary tract infections. Ther. Adv. Urol. 2019, 11. [Google Scholar] [CrossRef] [Green Version]
- Cortes-Penfield, N.W.; Trautner, B.W.; Jump, R.L. Urinary Tract Infection and Asymptomatic Bacteriuria in Older Adults. Infect. Dis. Clin. N. Am. 2017, 31, 673–688. [Google Scholar] [CrossRef] [PubMed] [Green Version]
- Simmering, J.; Tang, F.; Cavanaugh, J.E.; Polgreen, L.; Polgreen, P.M. The Increase in Hospitalizations for Urinary Tract Infections and the Associated Costs in the United States, 1998–2011. Open Forum Infect. Dis. 2017, 4. [Google Scholar] [CrossRef] [PubMed]
- Taylor, R.A.; Moore, C.L.; Cheung, K.-H.; Brandt, C. Predicting urinary tract infections in the emergency department with machine learning. PLoS ONE 2018, 13, e0194085. [Google Scholar] [CrossRef] [PubMed]
- Hannan, T.; Roberts, P.L.; Riehl, T.E.; van der Post, S.; Binkley, J.M.; Schwartz, D.; Miyoshi, H.; Mack, M.; Schwendener, R.A.; Hooton, T.M.; et al. Inhibition of Cyclooxygenase-2 Prevents Chronic and Recurrent Cystitis. EBioMedicine 2014, 1, 46–57. [Google Scholar] [CrossRef] [Green Version]
- Murgia, L.; Stalio, O.; Arienzo, A.; Ferrante, V.; Cellitti, V.; Somma, S. Di; Visca, P.; Antonini, G. Management of Urinary Tract Infections: Problems and Possible Solutions. In Urinary Tract Infection—The Result of the Strength of the Pathogen, or the Weakness of the Host; IntechOpen: London, UK, 2018. [Google Scholar]
- Point-of-Care Testing for Urinary Tract Infections—NIHR Community Healthcare MIC. Available online: https://www.community.healthcare.mic.nihr.ac.uk/reports-and-resources/horizon-scanning-reports/point-of-care-testing-for-urinary-tract-infections (accessed on 29 June 2021).
- Ebrahimzadeh, T.; Kuprasertkul, A.; Neugent, M.L.; Lutz, K.C.; Fuentes, J.L.; Gadhvi, J.; Khan, F.; Zhang, C.; Sharon, B.M.; Orth, K.; et al. Urinary prostaglandin E2 as a biomarker for recurrent UTI in postmenopausal women. Life Sci. Alliance 2021, 4, e202000948. [Google Scholar] [CrossRef]
- Shanmugam, N.R.; Muthukumar, S.; Selvam, A.P.; Prasad, S. Electrochemical nanostructured ZnO biosensor for ultrasensitive detection of cardiac troponin-T. Nanomedicine 2016, 11, 1345–1358. [Google Scholar] [CrossRef] [PubMed]
- Ganguly, A.; Lin, K.C.; Muthukumar, S.; Prasad, S. Autonomous, Real-Time Monitoring Electrochemical Aptasensor for Circadian Tracking of Cortisol Hormone in Sub-Microliter Volumes of Passively Eluted Human Sweat. ACS Sens. 2020, 6, 63–72. [Google Scholar] [CrossRef]
- Ganguly, A.; Lin, K.; Muthukumar, S.; Nagaraj, V.J.; Prasad, S. Label-Free Protein Glycosylation Analysis Using NanoMonitor—An Ultrasensitive Electrochemical Biosensor. Curr. Protoc. 2021, 1, e150. [Google Scholar] [CrossRef]
- Ganguly, A.; Rice, P.; Lin, K.-C.; Muthukumar, S.; Prasad, S. A Combinatorial Electrochemical Biosensor for Sweat Biomarker Benchmarking. SLAS Technol. Transl. Life Sci. Innov. 2019, 25, 25–32. [Google Scholar] [CrossRef]
- Sarigul, N.; Korkmaz, F.; Kurultak, I. A New Artificial Urine Protocol to Better Imitate Human Urine. Sci. Rep. 2019, 9, 1–11. [Google Scholar] [CrossRef] [PubMed]
- Lateral Flow Format, Materials and Methods. US7867780B2. Available online: https://patents.google.com/patent/US7867780B2/en (accessed on 7 July 2021).
- Whatman Fusion 5. Cytiva. Available online: https://www.cytivalifesciences.com/en/us/shop/whatman-laboratory-filtration/whatman-dx-components/lateral-flow-pads/fusion-5-p-00787#tech-spec-table (accessed on 7 July 2021).
- Parolo, C.; Sena-Torralba, A.; Bergua, J.F.; Calucho, E.; Fuentes-Chust, C.; Hu, L.; Rivas, L.; Álvarez-Diduk, R.; Nguyen, E.P.; Cinti, S.; et al. Tutorial: Design and fabrication of nanoparticle-based lateral-flow immunoassays. Nat. Protoc. 2020, 15, 3788–3816. [Google Scholar] [CrossRef] [PubMed]
- Pellitero, M.A.; Kitsara, M.; Eibensteiner, F.; Del Campo, F.J. Rapid prototyping of electrochemical lateral flow devices: Stecilled electrodes. Anayst 2016, 141, 2515–2522. [Google Scholar] [CrossRef] [PubMed] [Green Version]
- Najian, A.N.; Syafirah, E.E.N.; Ismail, N.; Mohamed, M.; Yean, C.Y. Development of multiplex loop mediated isothermal amplification (m-LAMP) label-based gold nanoparticles lateral flow dipstick biosensor for detection of pathogenic Leptospira. Anal. Chim. Acta 2016, 903, 142–148. [Google Scholar] [CrossRef]
- Tanak, A.S.; Jagannath, B.; Tamrakar, Y.; Muthukumar, S.; Prasad, S. Non-faradaic electrochemical impedimetric profiling of procalcitonin and C-reactive protein as a dual marker biosensor for early sepsis detection. Anal. Chim. Acta X 2019, 3, 100029. [Google Scholar] [CrossRef] [PubMed]
- Ganguly, A.; Prasad, S. Passively Addressable Ultra-Low Volume Sweat Chloride Sensor. Sensors 2019, 19, 4590. [Google Scholar] [CrossRef] [PubMed] [Green Version]
- Churcher, N.K.M.; Upasham, S.; Rice, P.; Bhadsavle, S.; Prasad, S. Development of a flexible, sweat-based neuropeptide Y detection platform. RSC Adv. 2020, 10, 23173–23186. [Google Scholar] [CrossRef]
- Bhide, A.; Muthukumar, S.; Prasad, S. CLASP (Continuous lifestyle awareness through sweat platform): A novel sensor for simultaneous detection of alcohol and glucose from passive perspired sweat. Biosens. Bioelectron. 2018, 117, 537–545. [Google Scholar] [CrossRef] [PubMed]
- Stevenson, H.; Shanmugam, N.R.; Selvam, A.P.; Prasad, S. The Anatomy of a Nonfaradaic Electrochemical Biosensor. SLAS Technol. Transl. Life Sci. Innov. 2017, 23, 5–15. [Google Scholar] [CrossRef] [PubMed] [Green Version]
- Jagannath, B.; Muthukumar, S.; Prasad, S. Electrical double layer modulation of hybrid room temperature ionic liquid/aqueous buffer interface for enhanced sweat based biosensing. Anal. Chim. Acta 2018, 1016, 29–39. [Google Scholar] [CrossRef] [PubMed]
- Munje, R.D.; Muthukumar, S.; Jagannath, B.; Prasad, S. A new paradigm in sweat based wearable diagnostics biosensors using Room Temperature Ionic Liquids (RTILs). Sci. Rep. 2017, 7, 1950. [Google Scholar] [CrossRef] [Green Version]
- Zeta Potential - An introduction in 30 minutes | Malvern Panalytical. Available online: https://www.malvernpanalytical.com/en/learn/knowledge-center/technical-notes/TN101104ZetaPotentialIntroduction (accessed on 18 September 2021).
- Bono, M.J.; Reygaert, W.C. Urinary Tract Infection. StatPearls. November 2020. Available online: https://0-www-ncbi-nlm-nih-gov.brum.beds.ac.uk/books/NBK470195/ (accessed on 7 July 2021).
- Tech Tip#2. 2008. Available online: www.thermo.com/pierce (accessed on 7 September 2021).
- Tanak, A.S.; Muthukumar, S.; Hashim, I.A.; Prasad, S. Establish pre-clinical diagnostic efficacy for parathyroid hormone as a point-of-surgery-testing-device (POST). Sci. Rep. 2020, 10, 1–9. [Google Scholar] [CrossRef]
- Bard, A. J.; Faulkner, L. R. Electrochemical Methods Fundamentals and Applications, 2nd ed.; John Wiley&Sons: Hoboken, NJ, USA, 2001. [Google Scholar]
- Scholz, F. Electroanalytical Methods: Guide to Experiments and Applications. 2010. Available online: https://0-www-springer-com.brum.beds.ac.uk/gp/book/9783642029141 (accessed on 18 September 2021).
- Randviir, E.P.; Banks, C. Electrochemical impedance spectroscopy: An overview of bioanalytical applications. Anal. Methods 2013, 5, 1098–1115. [Google Scholar] [CrossRef]
- Daniels, J.S.; Pourmand, N. Label-Free Impedance Biosensors: Opportunities and Challenges. Electroanalysis 2007, 19, 1239–1257. [Google Scholar] [CrossRef]
- Carey, R.; Anderson, F.; George, H.; Hartmann, A.; Janzen, V.; Kallner, A.; Levine, J.; Schiffgens, J.; Srinivasan, A.; Tholen, D. User Verification of Performance for Precision and Trueness; Approved Guideline—Second Edition. CLSI Document EP15-A2. Available online: https://webstore.ansi.org/standards/clsi/clsiep15a2 (accessed on 18 September 2021).
- Tholen, D. W.; Kallner, A.; Kennedy, J. W.; Krouwer, J. S.; Meier, K. EP5-A2 Evaluation of Precision Performance of Quantitative Measurement Methods. Available online: https://webstore.ansi.org/standards/clsi/clsiep05a2 (accessed on 18 September 2021).


Publisher’s Note: MDPI stays neutral with regard to jurisdictional claims in published maps and institutional affiliations. |
© 2021 by the authors. Licensee MDPI, Basel, Switzerland. This article is an open access article distributed under the terms and conditions of the Creative Commons Attribution (CC BY) license (https://creativecommons.org/licenses/by/4.0/).
Share and Cite
Ganguly, A.; Ebrahimzadeh, T.; Zimmern, P.E.; De Nisco, N.J.; Prasad, S. Label Free, Lateral Flow Prostaglandin E2 Electrochemical Immunosensor for Urinary Tract Infection Diagnosis. Chemosensors 2021, 9, 271. https://0-doi-org.brum.beds.ac.uk/10.3390/chemosensors9090271
Ganguly A, Ebrahimzadeh T, Zimmern PE, De Nisco NJ, Prasad S. Label Free, Lateral Flow Prostaglandin E2 Electrochemical Immunosensor for Urinary Tract Infection Diagnosis. Chemosensors. 2021; 9(9):271. https://0-doi-org.brum.beds.ac.uk/10.3390/chemosensors9090271
Chicago/Turabian StyleGanguly, Antra, Tahmineh Ebrahimzadeh, Philippe E. Zimmern, Nicole J. De Nisco, and Shalini Prasad. 2021. "Label Free, Lateral Flow Prostaglandin E2 Electrochemical Immunosensor for Urinary Tract Infection Diagnosis" Chemosensors 9, no. 9: 271. https://0-doi-org.brum.beds.ac.uk/10.3390/chemosensors9090271