
Electrodes for Paracetamol Sensing Modified with Bismuth Oxide and Oxynitrate Heterostructures: An Experimental and Computational Study


Abstract
:1. Introduction
2. Materials and Methods
2.1. Materials
2.2. Bismuth Subnitrate Heterostructures Synthesis
2.3. Working Electrode Modification
2.4. Electrochemical Measurements
2.5. Computational Study
3. Results
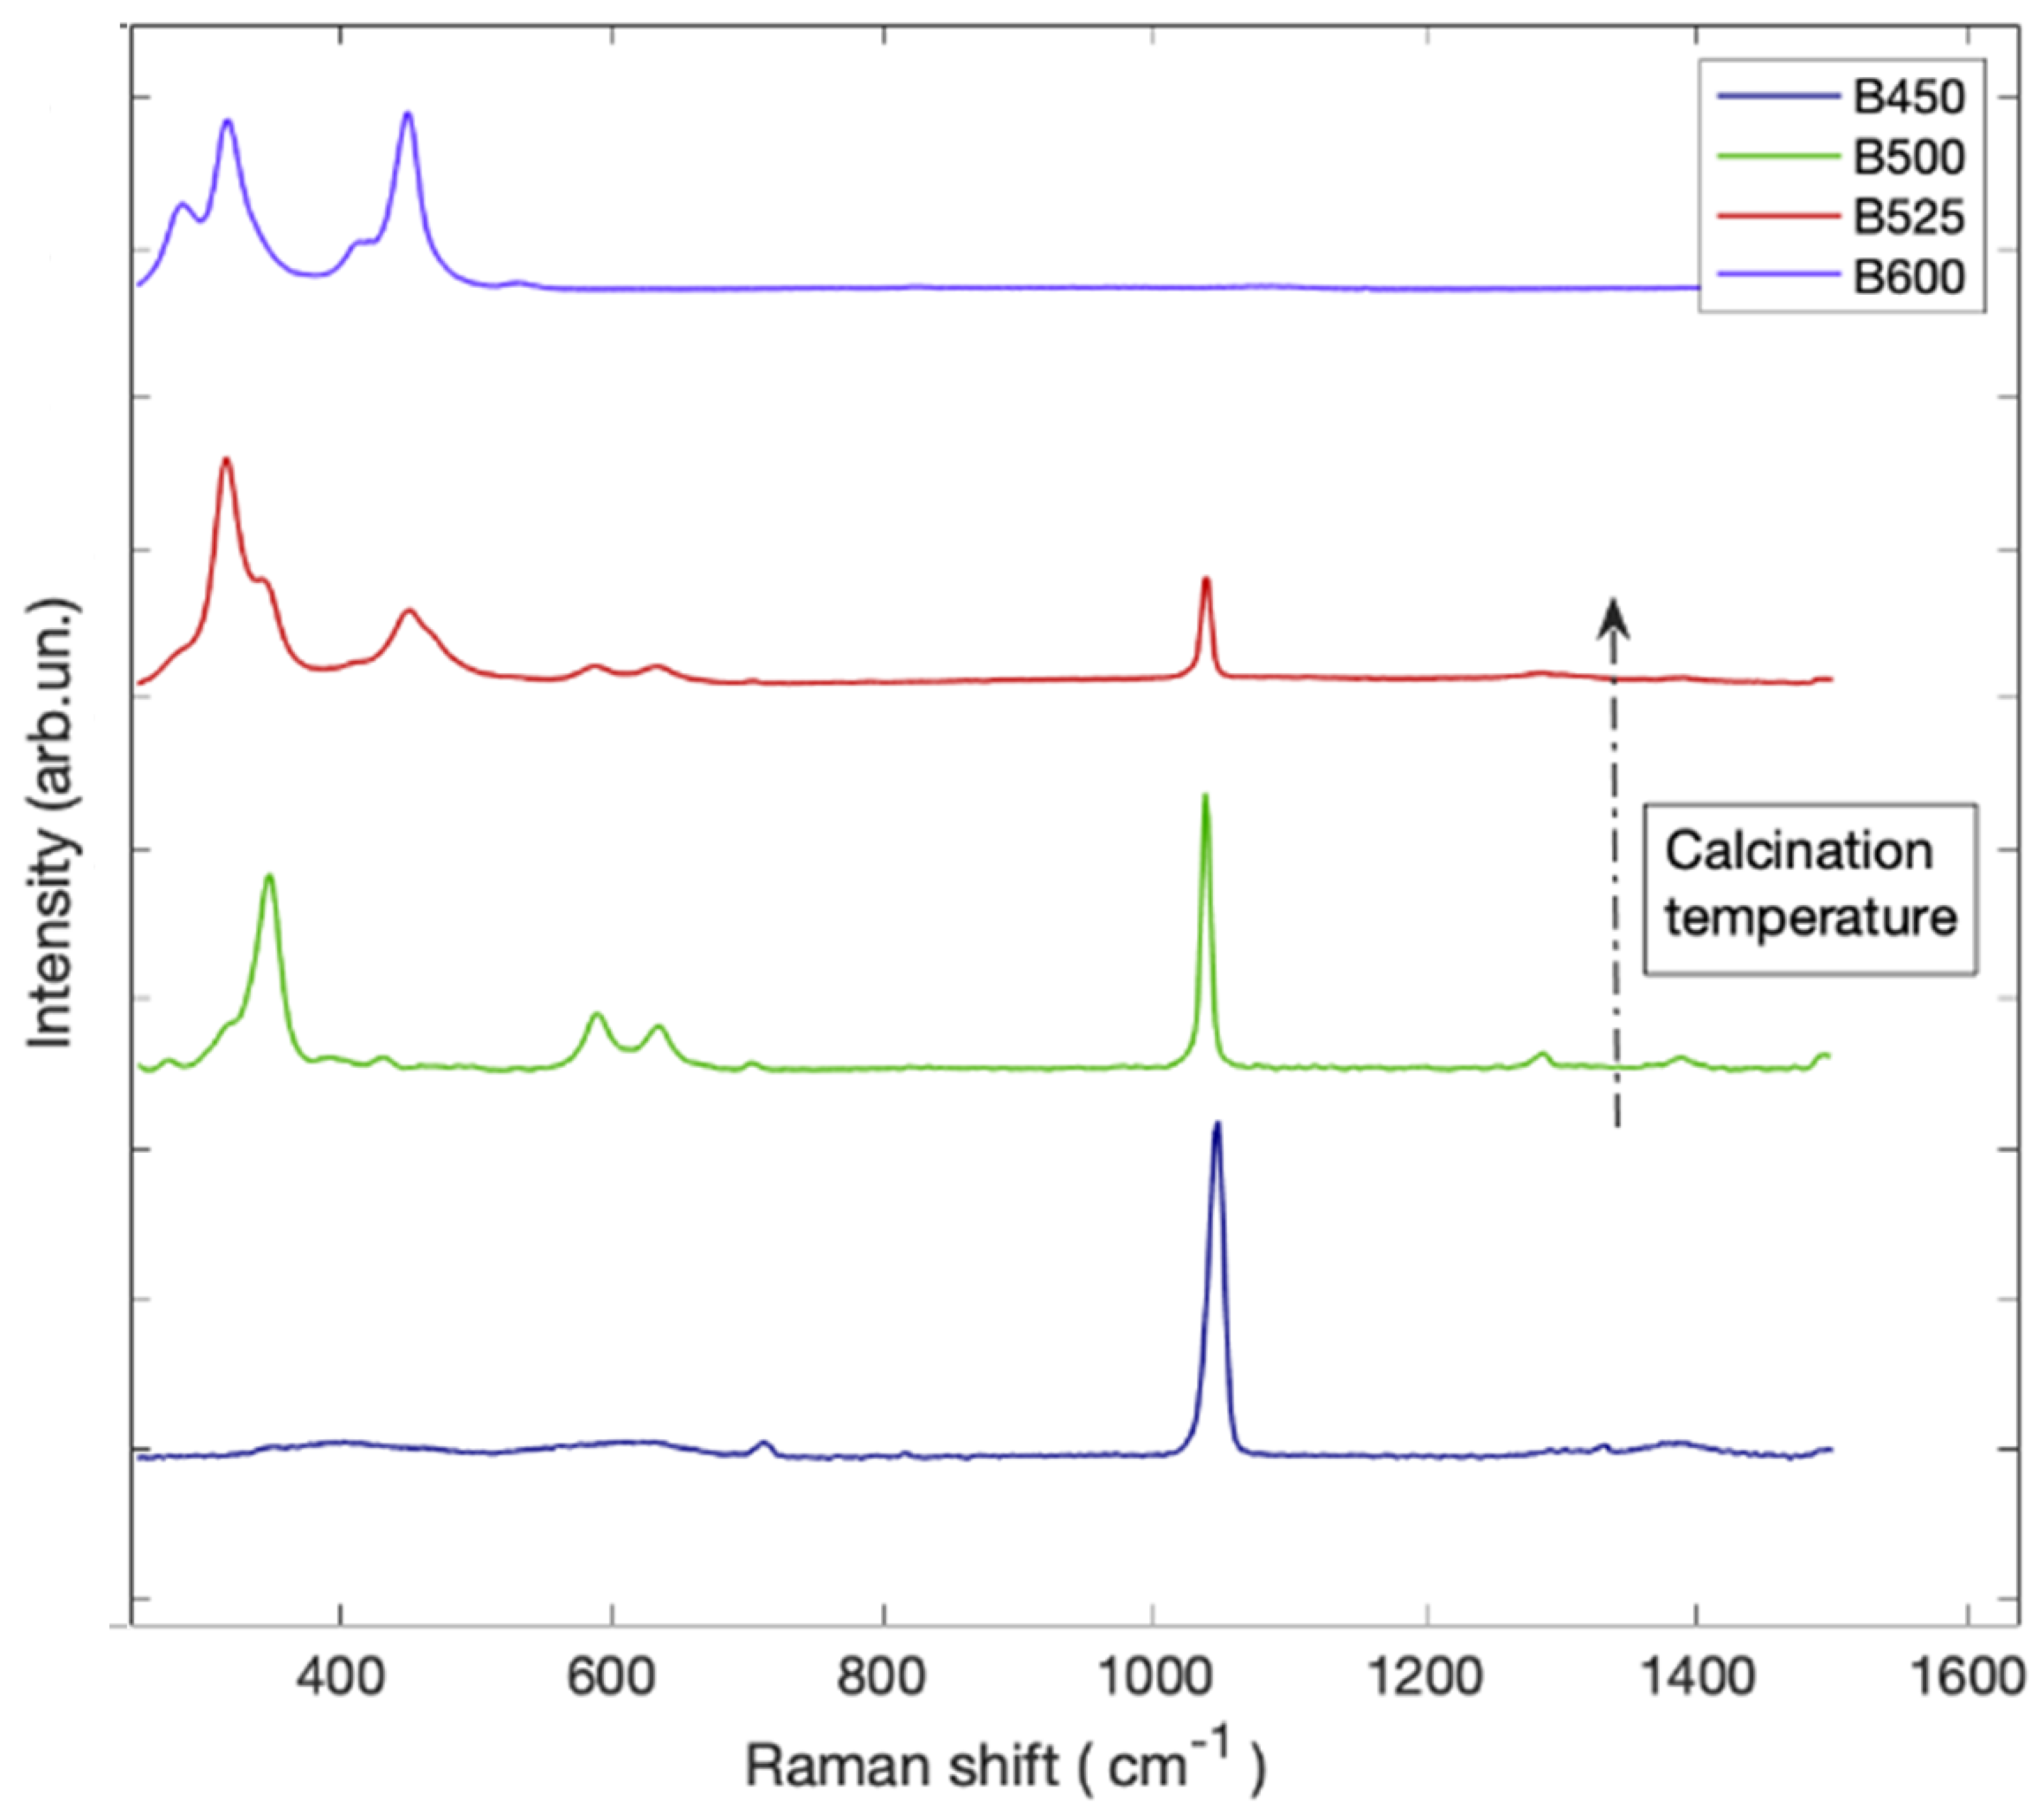
3.1. Characterization of Bismuth-Based Heterostructures through Raman Spectroscopy
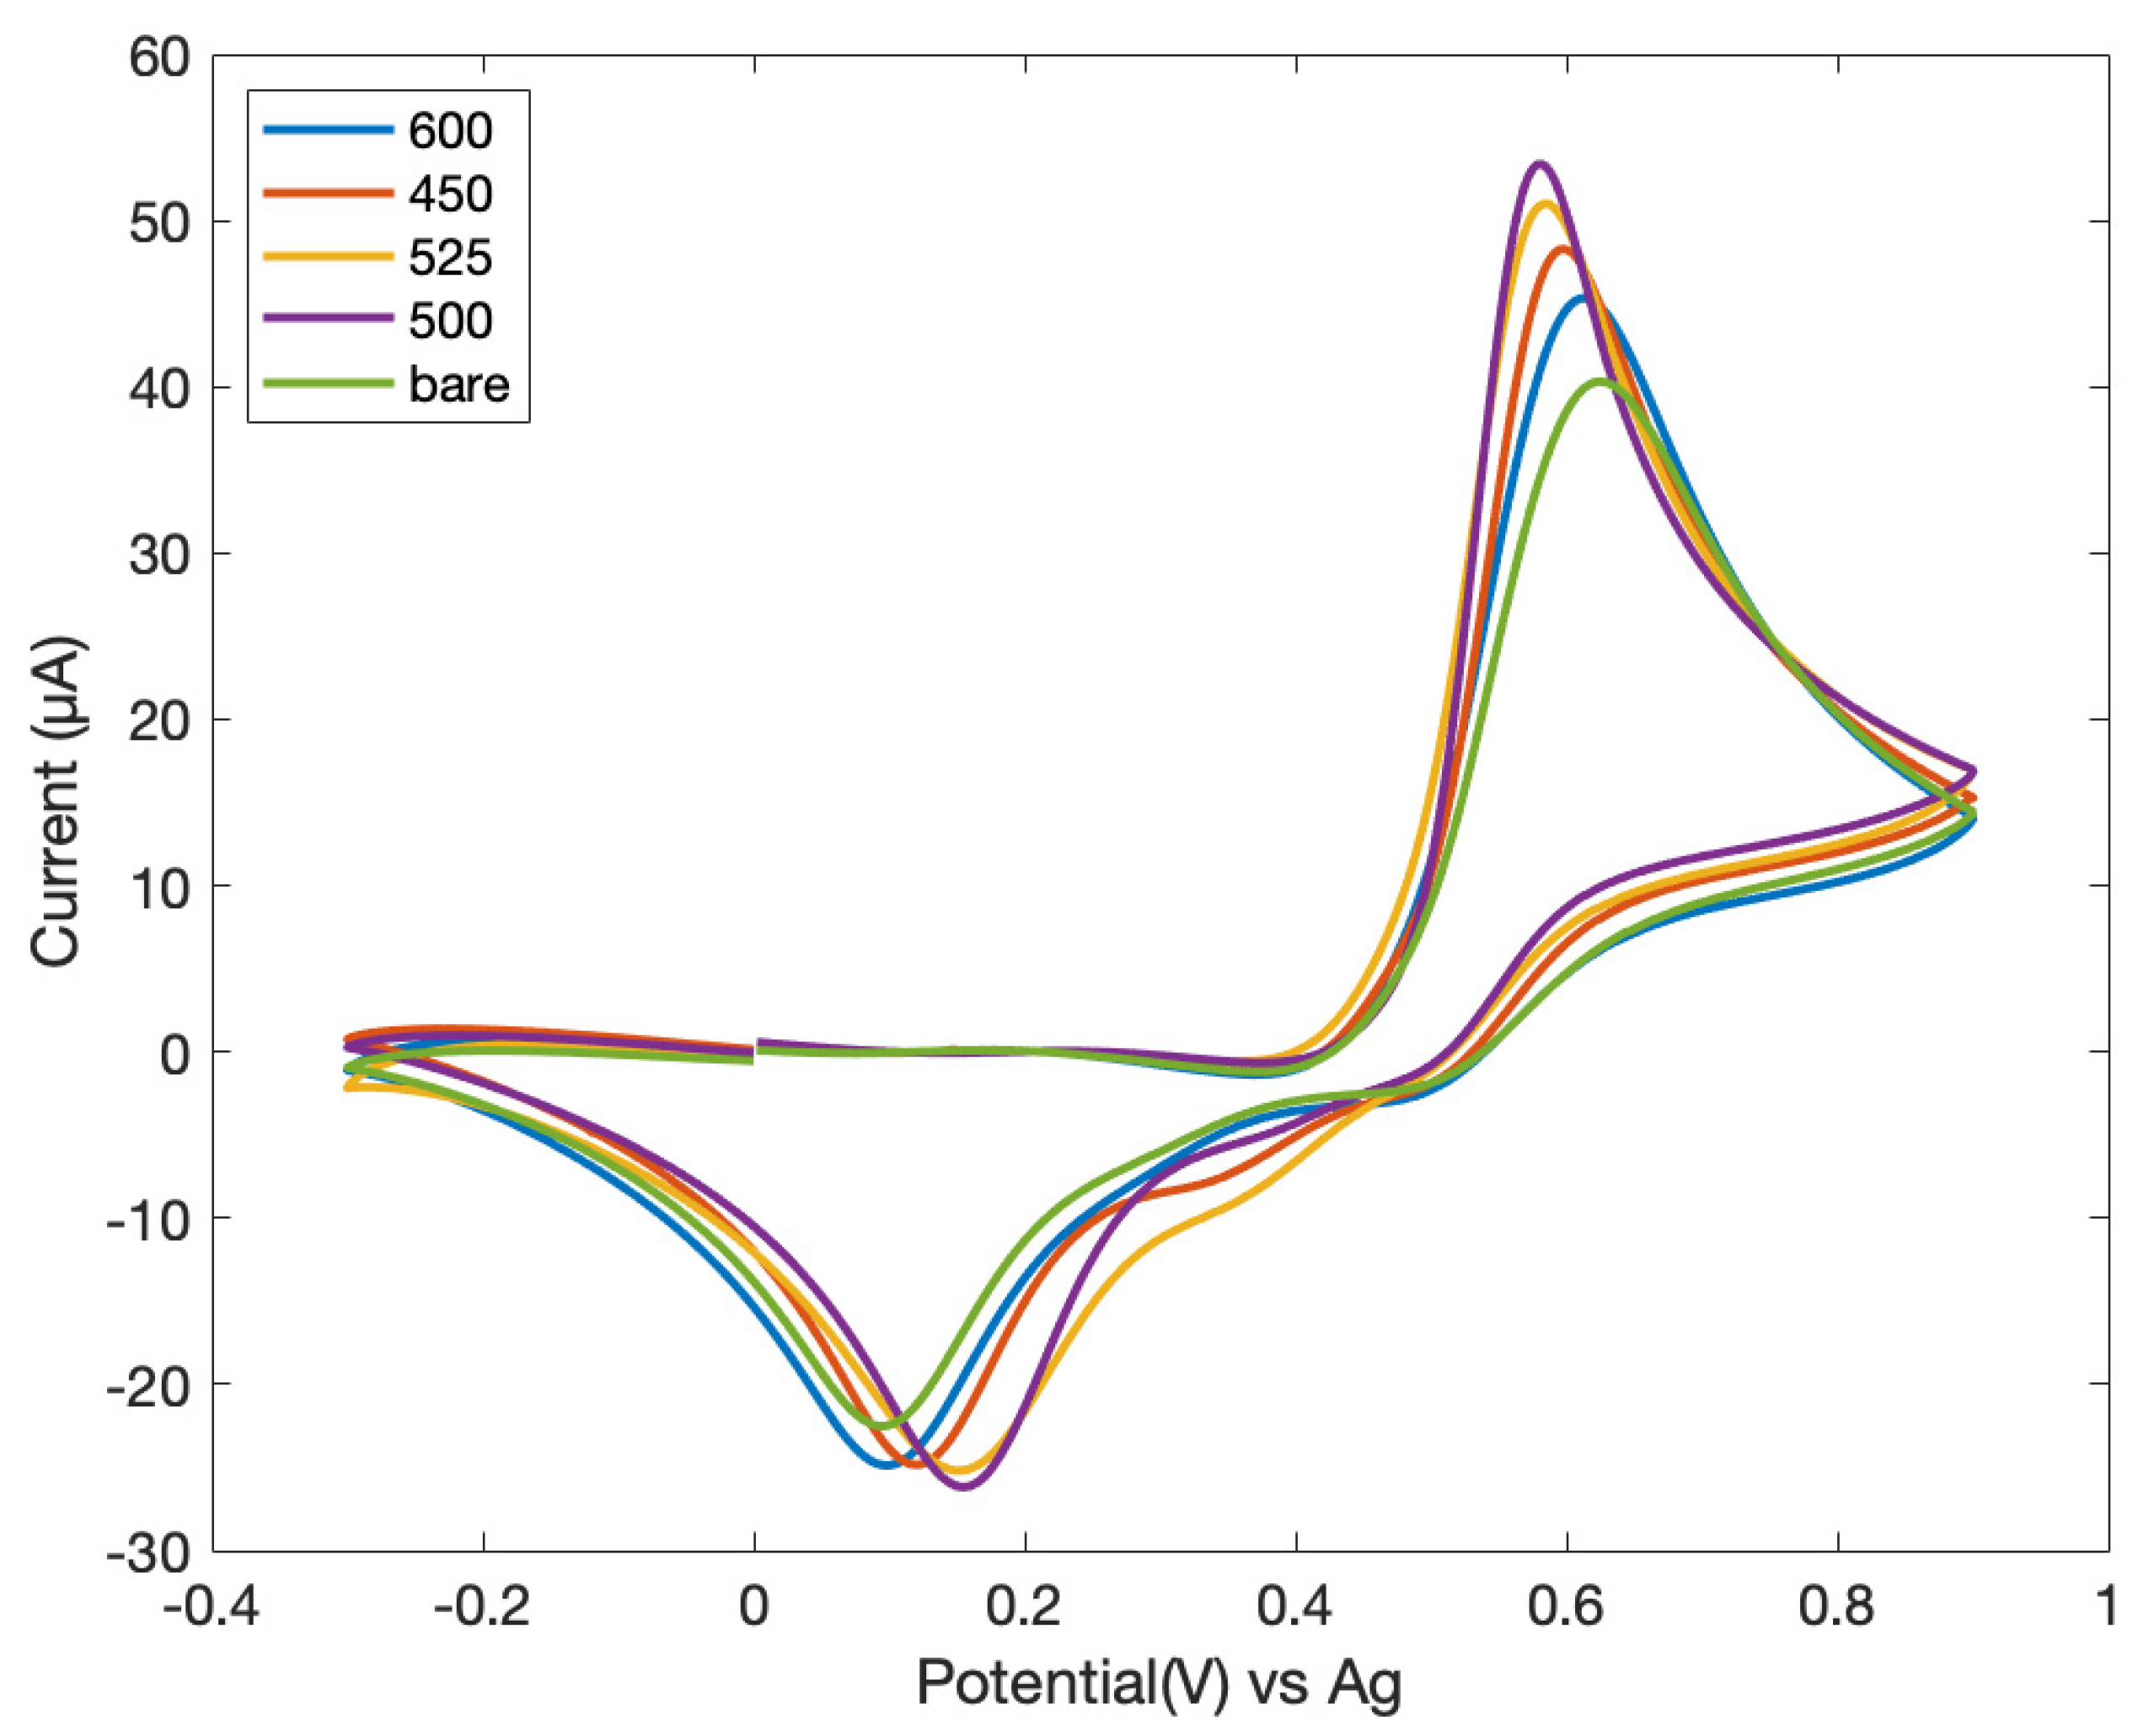
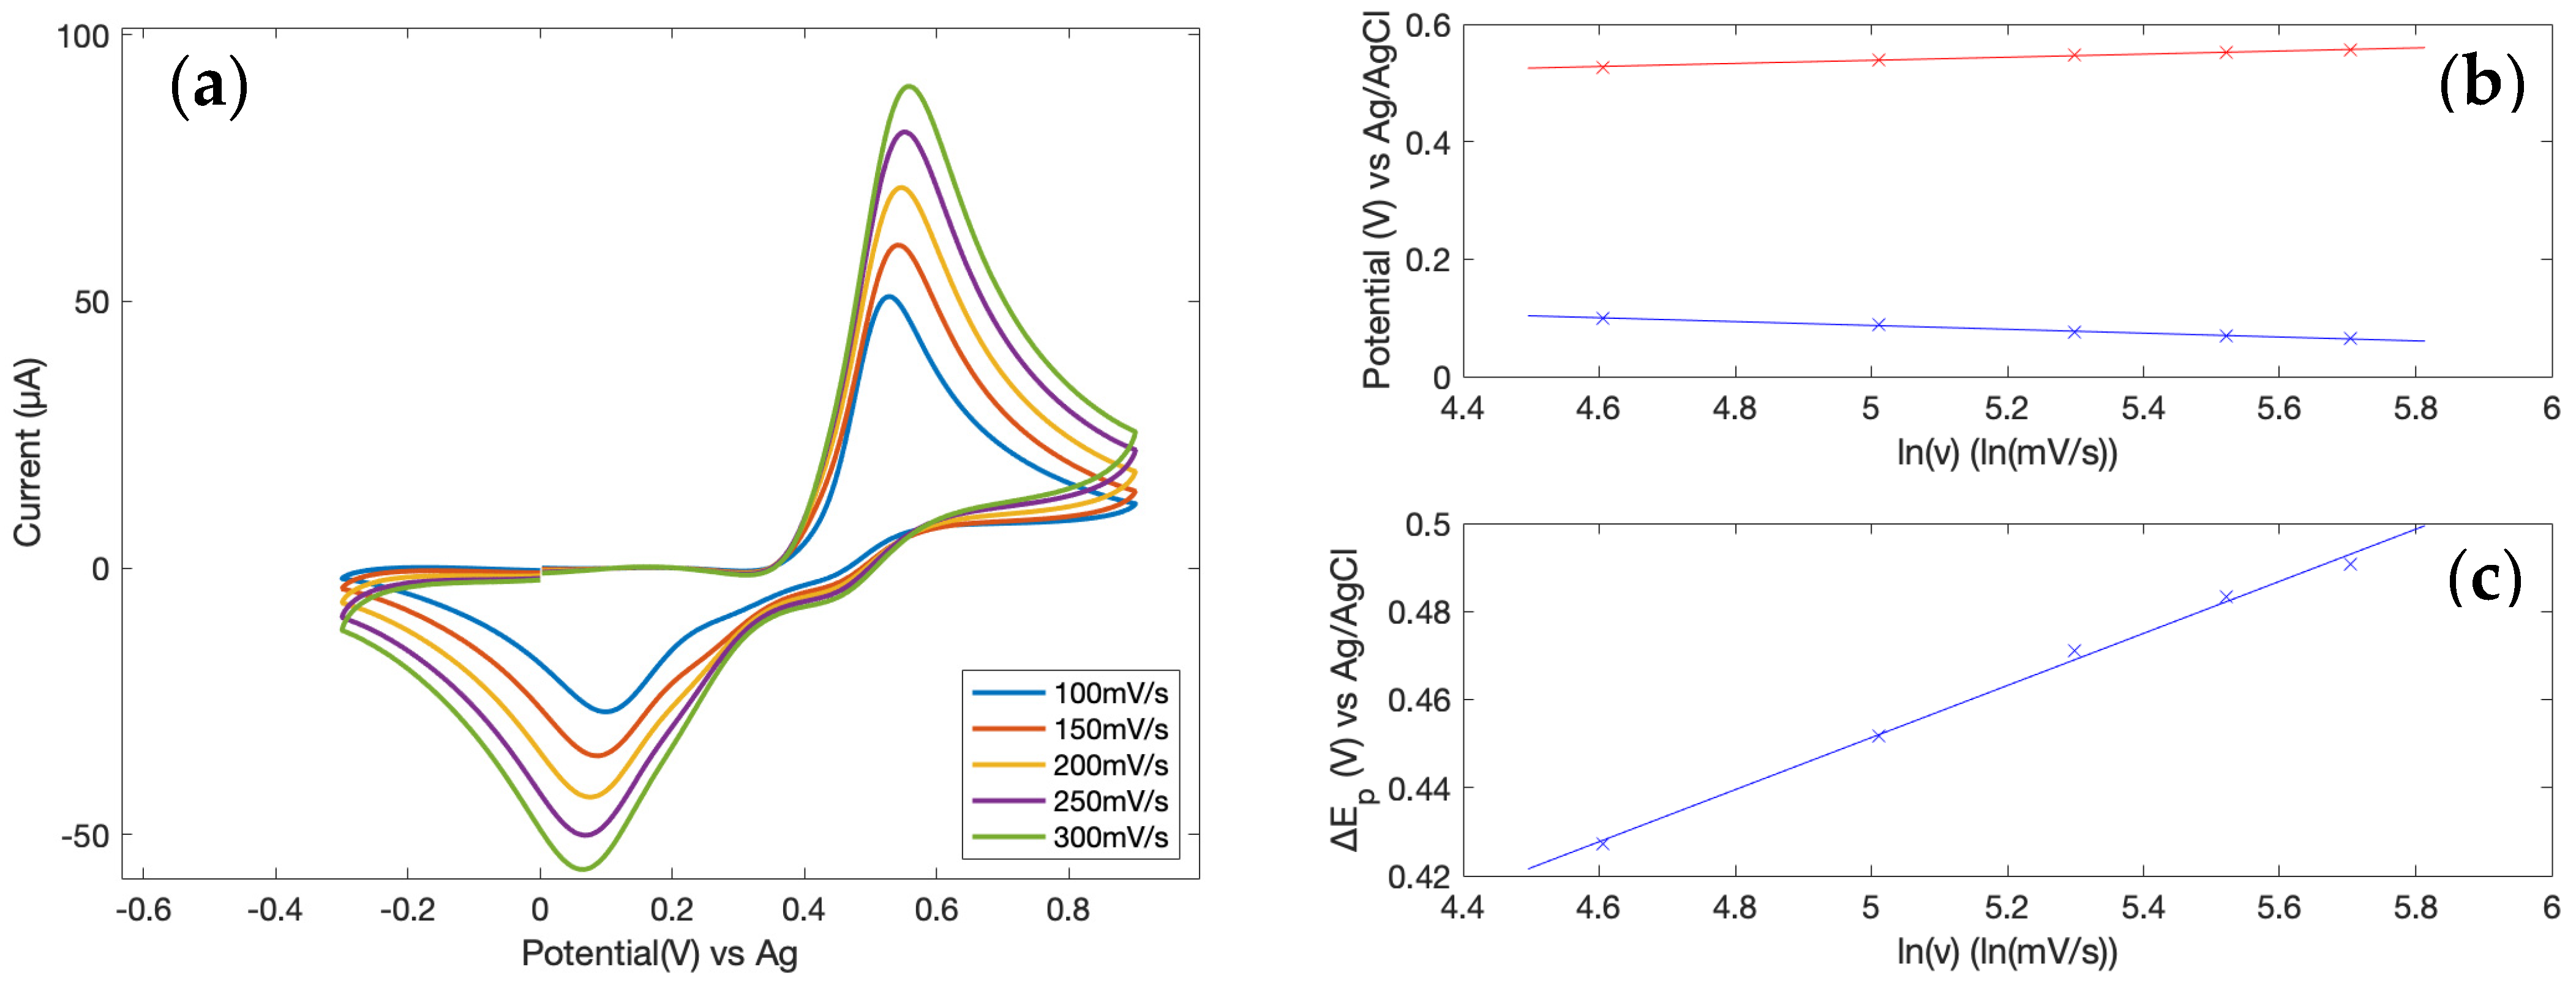
3.2. Electrochemical Measurements
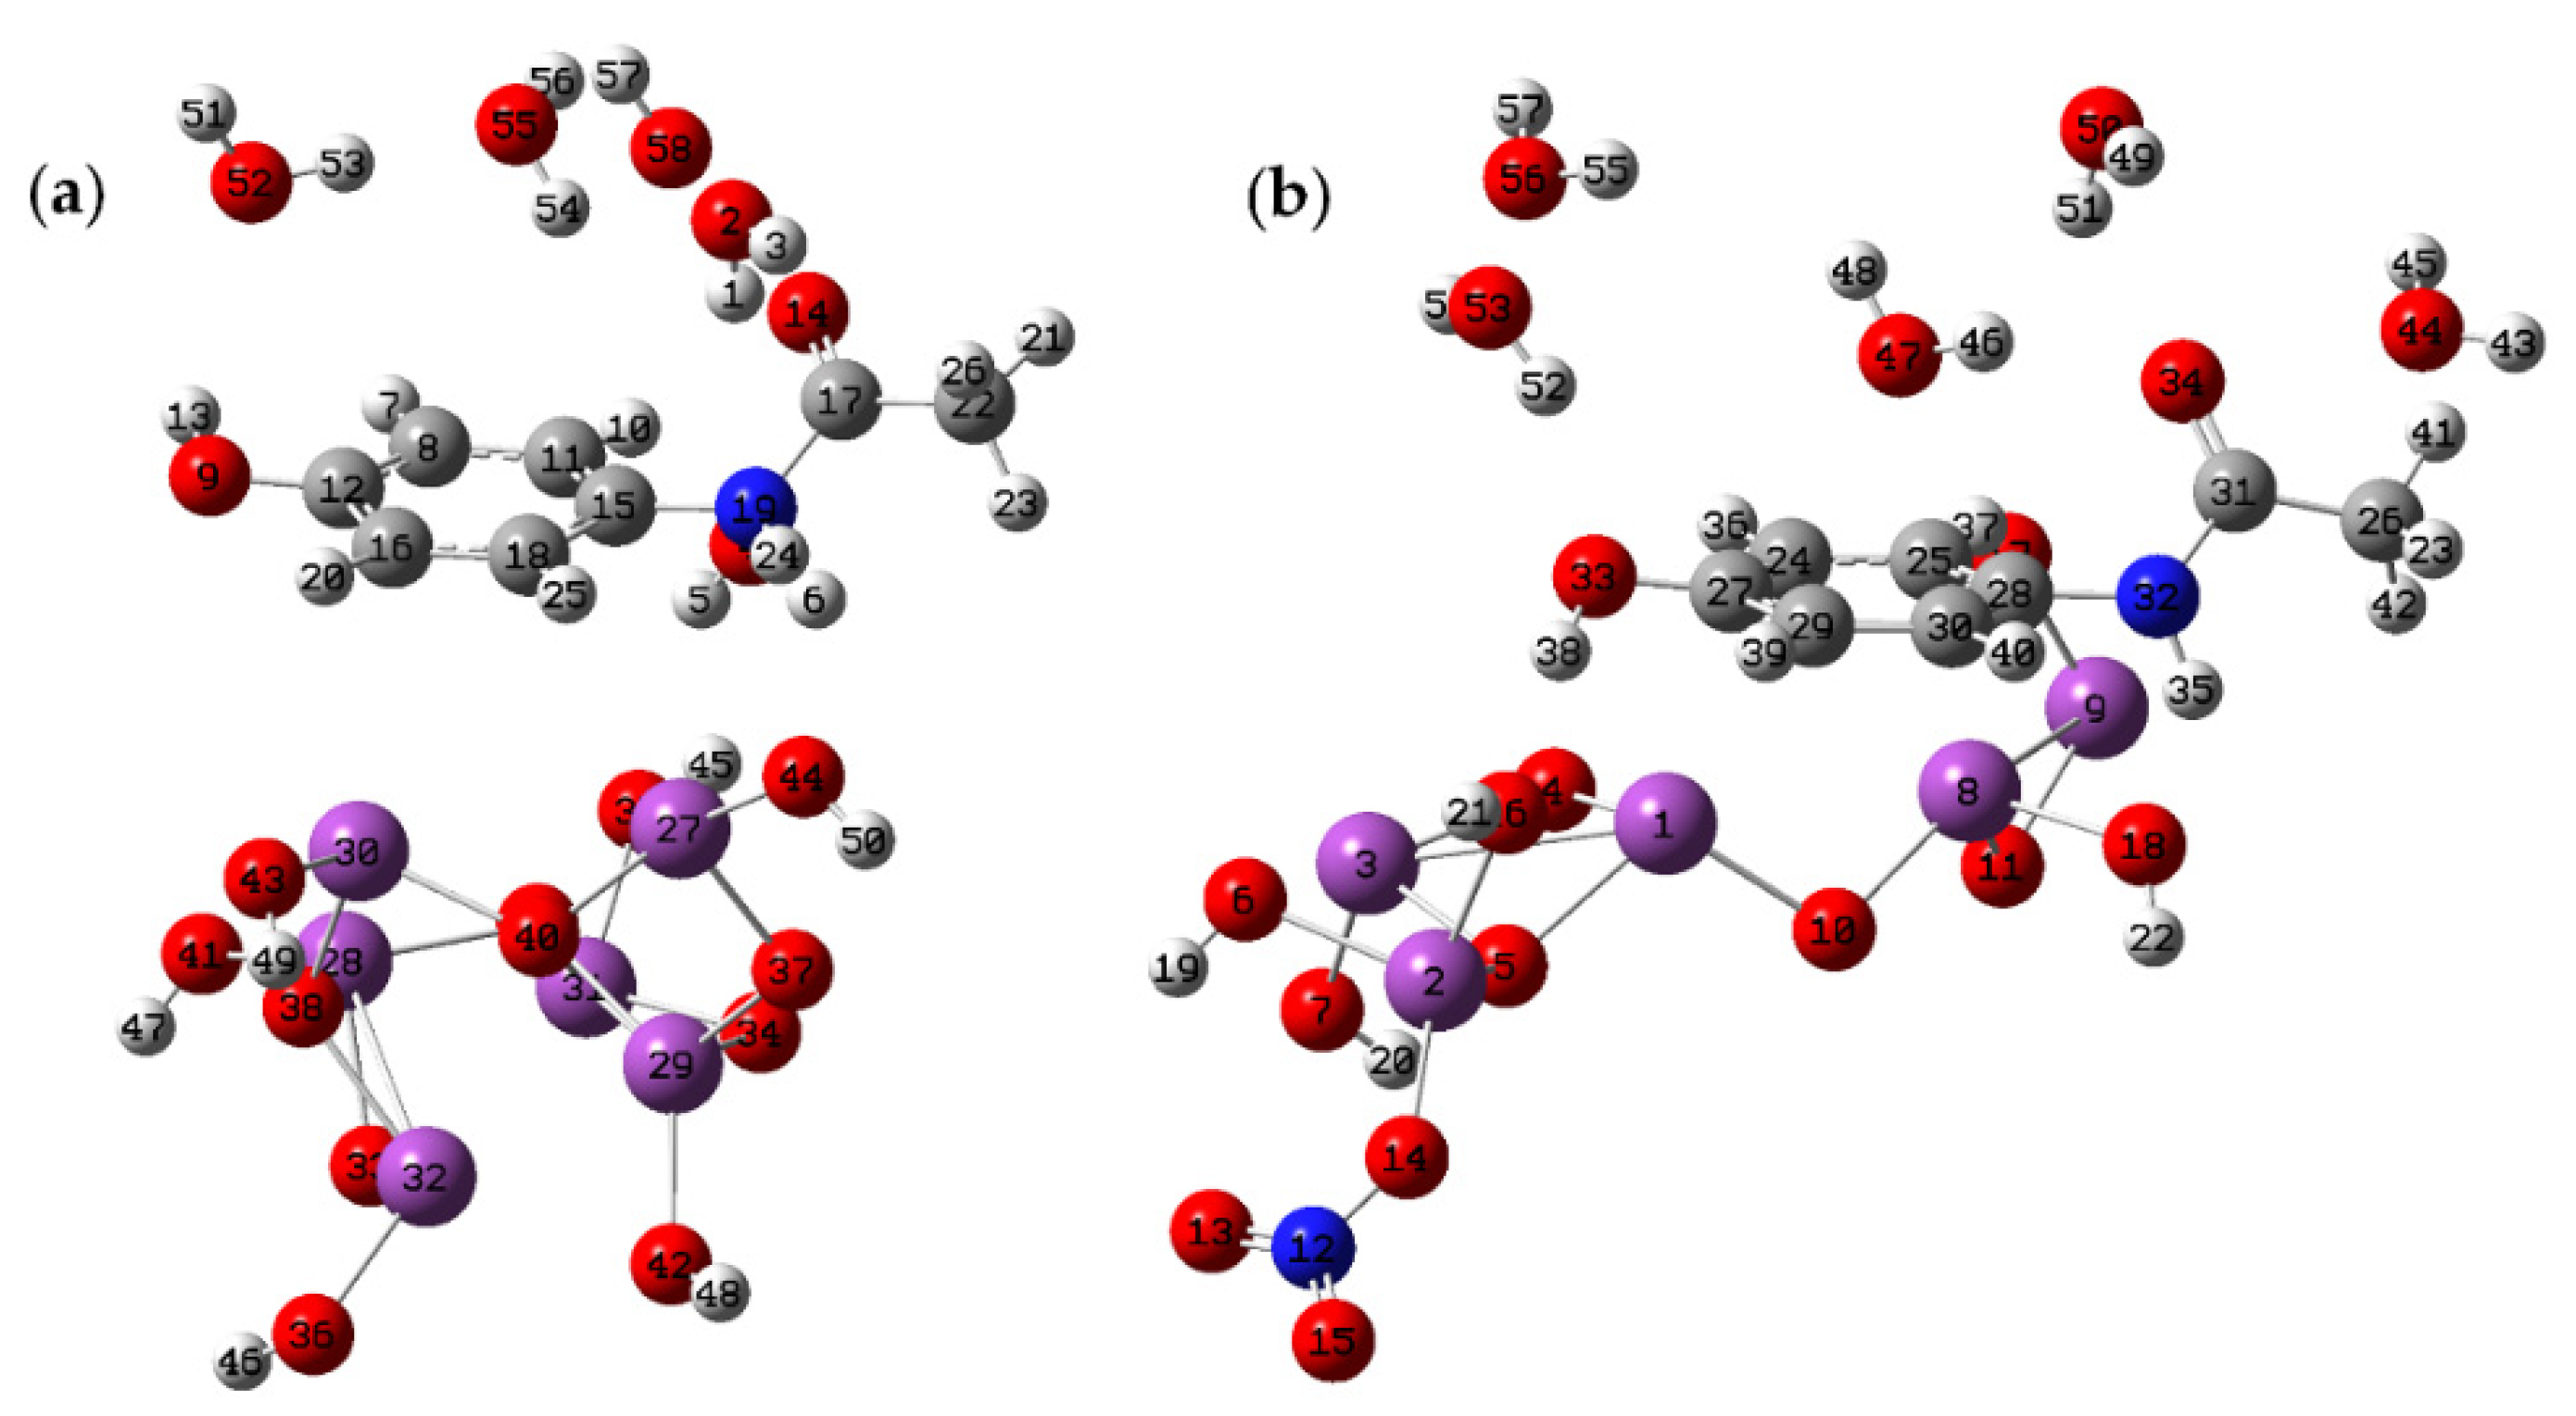
3.3. Computational Study
4. Conclusions
Author Contributions
Funding
Data Availability Statement
Conflicts of Interest
References
- Chiam, E.; Weinberg, L.; Bellomo, R. Paracetamol: A review with specific focus on the haemodynamic effects of intravenous administration. Heart Lung Vessel. 2015, 7, 121. [Google Scholar]
- Przybyła, G.W.; Szychowski, K.A.; Gmiński, J. Paracetamol—An old drug with new mechanisms of action. Clin. Exp. Pharmacol. Physiol. 2021, 48, 3–19. [Google Scholar] [CrossRef] [PubMed]
- Graham, G.G.; Scott, K.F. Mechanism of action of paracetamol. Am. J. Ther. 2005, 12, 46–55. [Google Scholar] [CrossRef]
- Graham, G.G.; Davies, M.J.; Day, R.O.; Mohamudally, A.; Scott, K.F. The modern pharmacology of paracetamol: Therapeutic actions, mechanism of action, metabolism, toxicity and recent pharmacological findings. Inflammopharmacology 2013, 21, 201–232. [Google Scholar] [CrossRef] [PubMed]
- Stravitz, R.T.; Lee, W.M. Acute liver failure. Lancet 2019, 394, 869–881. [Google Scholar] [CrossRef]
- Murray, K.E.; Thomas, S.M.; Bodour, A.A. Prioritizing research for trace pollutants and emerging contaminants in the freshwater environment. Environ. Pollut. 2010, 158, 3462–3471. [Google Scholar] [CrossRef]
- Żur, J.; Piński, A.; Marchlewicz, A.; Hupert-Kocurek, K.; Wojcieszyńska, D.; Guzik, U. Organic micropollutants paracetamol and ibuprofen—Toxicity, biodegradation, and genetic background of their utilization by bacteria. Environ. Sci. Pollut. Res. 2018, 25, 21498–21524. [Google Scholar] [CrossRef] [Green Version]
- Gogate, P.R.; Pandit, A.B. A review of imperative technologies for wastewater treatment I: Oxidation technologies at ambient conditions. Adv. Environ. Res. 2004, 8, 501–551. [Google Scholar] [CrossRef]
- Merciai, R.; Guasch, H.; Kumar, A.; Sabater, S.; García-Berthou, E. Trace metal concentration and fish size: Variation among fish species in a Mediterranean river. Ecotoxicol. Environ. Saf. 2014, 107, 154–161. [Google Scholar] [CrossRef]
- Elersek, T.; Milavec, S.; Korošec, M.; Brezovsek, P.; Negreira, N.; Zonja, B.; de Alda, M.L.; Barceló, D.; Heath, E.; Ščančar, J. Toxicity of the mixture of selected antineoplastic drugs against aquatic primary producers. Environ. Sci. Pollut. Res. 2016, 23, 14780–14790. [Google Scholar] [CrossRef]
- Alanazi, K.; Cruz, A.G.; Di Masi, S.; Voorhaar, A.; Ahmad, O.S.; Cowen, T.; Piletska, E.; Langford, N.; Coats, T.J.; Sims, M.R. Disposable paracetamol sensor based on electroactive molecularly imprinted polymer nanoparticles for plasma monitoring. Sens. Actuators B Chem. 2021, 329, 129128. [Google Scholar] [CrossRef]
- Claussen, J.; Shi, J.; Rout, C.S.; Artiles, M.; Roushar, M.; Stensberg, M.; Porterfield, D.M.; Fisher, T. Nano-sized biosensors for medical applications. In Biosensors for Medical Applications; Elsevier: Amsterdam, The Netherlands, 2012; pp. 65–102. [Google Scholar]
- Maduraiveeran, G.; Jin, W. Nanomaterials based electrochemical sensor and biosensor platforms for environmental applications. Trends Environ. Anal. Chem. 2017, 13, 10–23. [Google Scholar] [CrossRef]
- Roduner, E. Size matters: Why nanomaterials are different. Chem. Soc. Rev. 2006, 35, 583–592. [Google Scholar] [CrossRef] [PubMed]
- Sasidharan, S.; Raj, S.; Sonawane, S.; Sonawane, S.; Pinjari, D.; Pandit, A.; Saudagar, P. Nanomaterial synthesis: Chemical and biological route and applications. In Nanomaterials Synthesis; Elsevier: Amsterdam, The Netherlands, 2019; pp. 27–51. [Google Scholar]
- Kang, X.; Wang, J.; Wu, H.; Liu, J.; Aksay, I.A.; Lin, Y. A graphene-based electrochemical sensor for sensitive detection of paracetamol. Talanta 2010, 81, 754–759. [Google Scholar] [CrossRef]
- Li, Z.-Y.; Gao, D.-Y.; Wu, Z.-Y.; Zhao, S. Simultaneous electrochemical detection of levodapa, paracetamol and l-tyrosine based on multi-walled carbon nanotubes. RSC Adv. 2020, 10, 14218–14224. [Google Scholar] [CrossRef] [Green Version]
- Annadurai, K.; Sudha, V.; Murugadoss, G.; Thangamuthu, R. Electrochemical sensor based on hydrothermally prepared nickel oxide for the determination of 4-acetaminophen in paracetamol tablets and human blood serum samples. J. Alloys Compd. 2021, 852, 156911. [Google Scholar] [CrossRef]
- Veloso, A.; Cheng, X.; Kerman, K. Electrochemical biosensors for medical applications. In Biosensors for Medical Applications; Elsevier: Amsterdam, The Netherlands, 2012; pp. 3–40. [Google Scholar]
- Wu, W.; Huang, Z.-H.; Lim, T.-T. Recent development of mixed metal oxide anodes for electrochemical oxidation of organic pollutants in water. Appl. Catal. A Gen. 2014, 480, 58–78. [Google Scholar] [CrossRef]
- Xie, C.; Yan, D.; Chen, W.; Zou, Y.; Chen, R.; Zang, S.; Wang, Y.; Yao, X.; Wang, S. Insight into the design of defect electrocatalysts: From electronic structure to adsorption energy. Mater. Today 2019, 31, 47–68. [Google Scholar] [CrossRef]
- Bartoli, M.; Jagdale, P.; Tagliaferro, A. A Short Review on Biomedical Applications of Nanostructured Bismuth Oxide and Related Nanomaterials. Materials 2020, 13, 5234. [Google Scholar] [CrossRef]
- Gadhi, T.A.; Hernández, S.; Castellino, M.; Jagdale, P.; Husak, T.; Hernández-Gordillo, A.; Tagliaferro, A.; Russo, N. Insights on the role of β-Bi2O3/Bi5O7NO3 heterostructures synthesized by a scalable solid-state method for the sunlight-driven photocatalytic degradation of dyes. Catal. Today 2019, 321–322, 135–145. [Google Scholar] [CrossRef]
- Kodama, H. Synthesis of a new compound, Bi5O7NO3, by thermal decomposition. J. Solid State Chem. 1994, 112, 27–30. [Google Scholar] [CrossRef]
- Madagalam, M.; Bartoli, M.; Tagliaferro, A.; Carrara, S. Bismuth-nanocomposites modified SPCEs for non-enzymatic electrochemical sensors. IEEE Sens. J. 2021, 21, 11155–11162. [Google Scholar] [CrossRef]
- Bard, A.J.; Faulkner, L.R. Electrochemical Methods: Fundamentals and Applications; Wiley: New York, NY, USA, 1980. [Google Scholar]
- Harwig, H. On the Structure of Bismuthsesquioxide: The α, β, γ, and δ-Phase. Z. Für Anorg. Allg. Chem. 1978, 444, 151–166. [Google Scholar] [CrossRef]
- Ziegler, P.; Ströbele, M.; Meyer, H.-J. Crystal structure of pentabismuth heptaoxide nitrate, Bi5O7NO3. Z. Für Krist. New Cryst. Struct. 2004, 219, 91–92. [Google Scholar] [CrossRef] [Green Version]
- Syrovaya, A.O.; Levashova, O.L.; Andreeva, S.V. Investigation of quantum-chemical properties of paracetamol. J. Chem. Pharm. Res. 2015, 7, 307–311. [Google Scholar]
- Marcus, R.A. Chemical and electrochemical electron-transfer theory. Annu. Rev. Phys. Chem. 1964, 15, 155–196. [Google Scholar] [CrossRef]
- Tachiya, M. Generalization of the Marcus equation for the electron-transfer rate. J. Phys. Chem. 1993, 97, 5911–5916. [Google Scholar] [CrossRef]
- Xu, M.; Larentzos, J.P.; Roshdy, M.; Criscenti, L.J.; Allen, H.C. Aqueous divalent metal–nitrate interactions: Hydration versus ion pairing. Phys. Chem. Chem. Phys. 2008, 10, 4793–4801. [Google Scholar] [CrossRef]
- Madelung, O.; Rössler, U.; Schulz, M. Bismuth oxide (Bi2O3) IR absorption bands, Raman spectra. In Non-Tetrahedrally Bonded Elements and Binary Compounds I; Springer: Berlin, Germany, 1998; pp. 1–4. [Google Scholar]
- Hardcastle, F.D.; Wachs, I.E. The molecular structure of bismuth oxide by Raman spectroscopy. J. Solid State Chem. 1992, 97, 319–331. [Google Scholar] [CrossRef]
- Balint, R.; Bartoli, M.; Jagdale, P.; Tagliaferro, A.; Memon, A.S.; Rovere, M.; Martin, M. Defective Bismuth Oxide as Effective Adsorbent for Arsenic Removal from Water and Wastewater. Toxics 2021, 9, 158. [Google Scholar] [CrossRef]
- Miner, D.J.; Rice, J.R.; Riggin, R.M.; Kissinger, P.T. Voltammetry of acetaminophen and its metabolites. Anal. Chem. 1981, 53, 2258–2263. [Google Scholar] [CrossRef]
- Nematollahi, D.; Shayani-Jam, H.; Alimoradi, M.; Niroomand, S. Electrochemical oxidation of acetaminophen in aqueous solutions: Kinetic evaluation of hydrolysis, hydroxylation and dimerization processes. Electrochim. Acta 2009, 54, 7407–7415. [Google Scholar] [CrossRef]
- Elgrishi, N.; Rountree, K.J.; McCarthy, B.D.; Rountree, E.S.; Eisenhart, T.T.; Dempsey, J.L. A practical beginner’s guide to cyclic voltammetry. J. Chem. Educ. 2018, 95, 197–206. [Google Scholar] [CrossRef]
- Mirceski, V.; Stojanov, L.; Ogorevc, B. Step potential as a diagnostic tool in square-wave voltammetry of quasi-reversible electrochemical processes. Electrochim. Acta 2019, 327, 134997. [Google Scholar] [CrossRef]
- Laviron, E. General expression of the linear potential sweep voltammogram in the case of diffusionless electrochemical systems. J. Electroanal. Chem. Interfacial Electrochem. 1979, 101, 19–28. [Google Scholar] [CrossRef]
- Wu, J.; Chen, T.; Zhu, C.; Du, J.; Huang, L.; Yan, J.; Cai, D.; Guan, C.; Pan, C. Rational Construction of a WS2/CoS2 Heterostructure Electrocatalyst for Efficient Hydrogen Evolution at All pH Values. ACS Sustain. Chem. Eng. 2020, 8, 4474–4480. [Google Scholar] [CrossRef]
- Wu, Y.; Li, F.; Chen, W.; Xiang, Q.; Ma, Y.; Zhu, H.; Tao, P.; Song, C.; Shang, W.; Deng, T.; et al. Coupling Interface Constructions of MoS2/Fe5Ni4S8 Heterostructures for Efficient Electrochemical Water Splitting. Adv. Mater. 2018, 30, 1803151. [Google Scholar] [CrossRef] [PubMed]
- Jing, Y.; Mu, X.; Xie, C.; Liu, H.; Yan, R.; Dai, H.; Liu, C.; Zhang, X.-D. Enhanced hydrogen evolution reaction of WS2–CoS2 heterostructure by synergistic effect. Int. J. Hydrogen Energy 2019, 44, 809–818. [Google Scholar] [CrossRef]


| Dehydration (1 h) | 2° Step (2 h) | 3° Step (1 h) | |
|---|---|---|---|
| B450 | 200 °C | 300 °C | 450 °C |
| B500 | 200 °C | 300 °C | 500 °C |
| B525 | 200 °C | 300 °C | 525 °C |
| B600 | 200 °C | 300 °C | 600 °C |
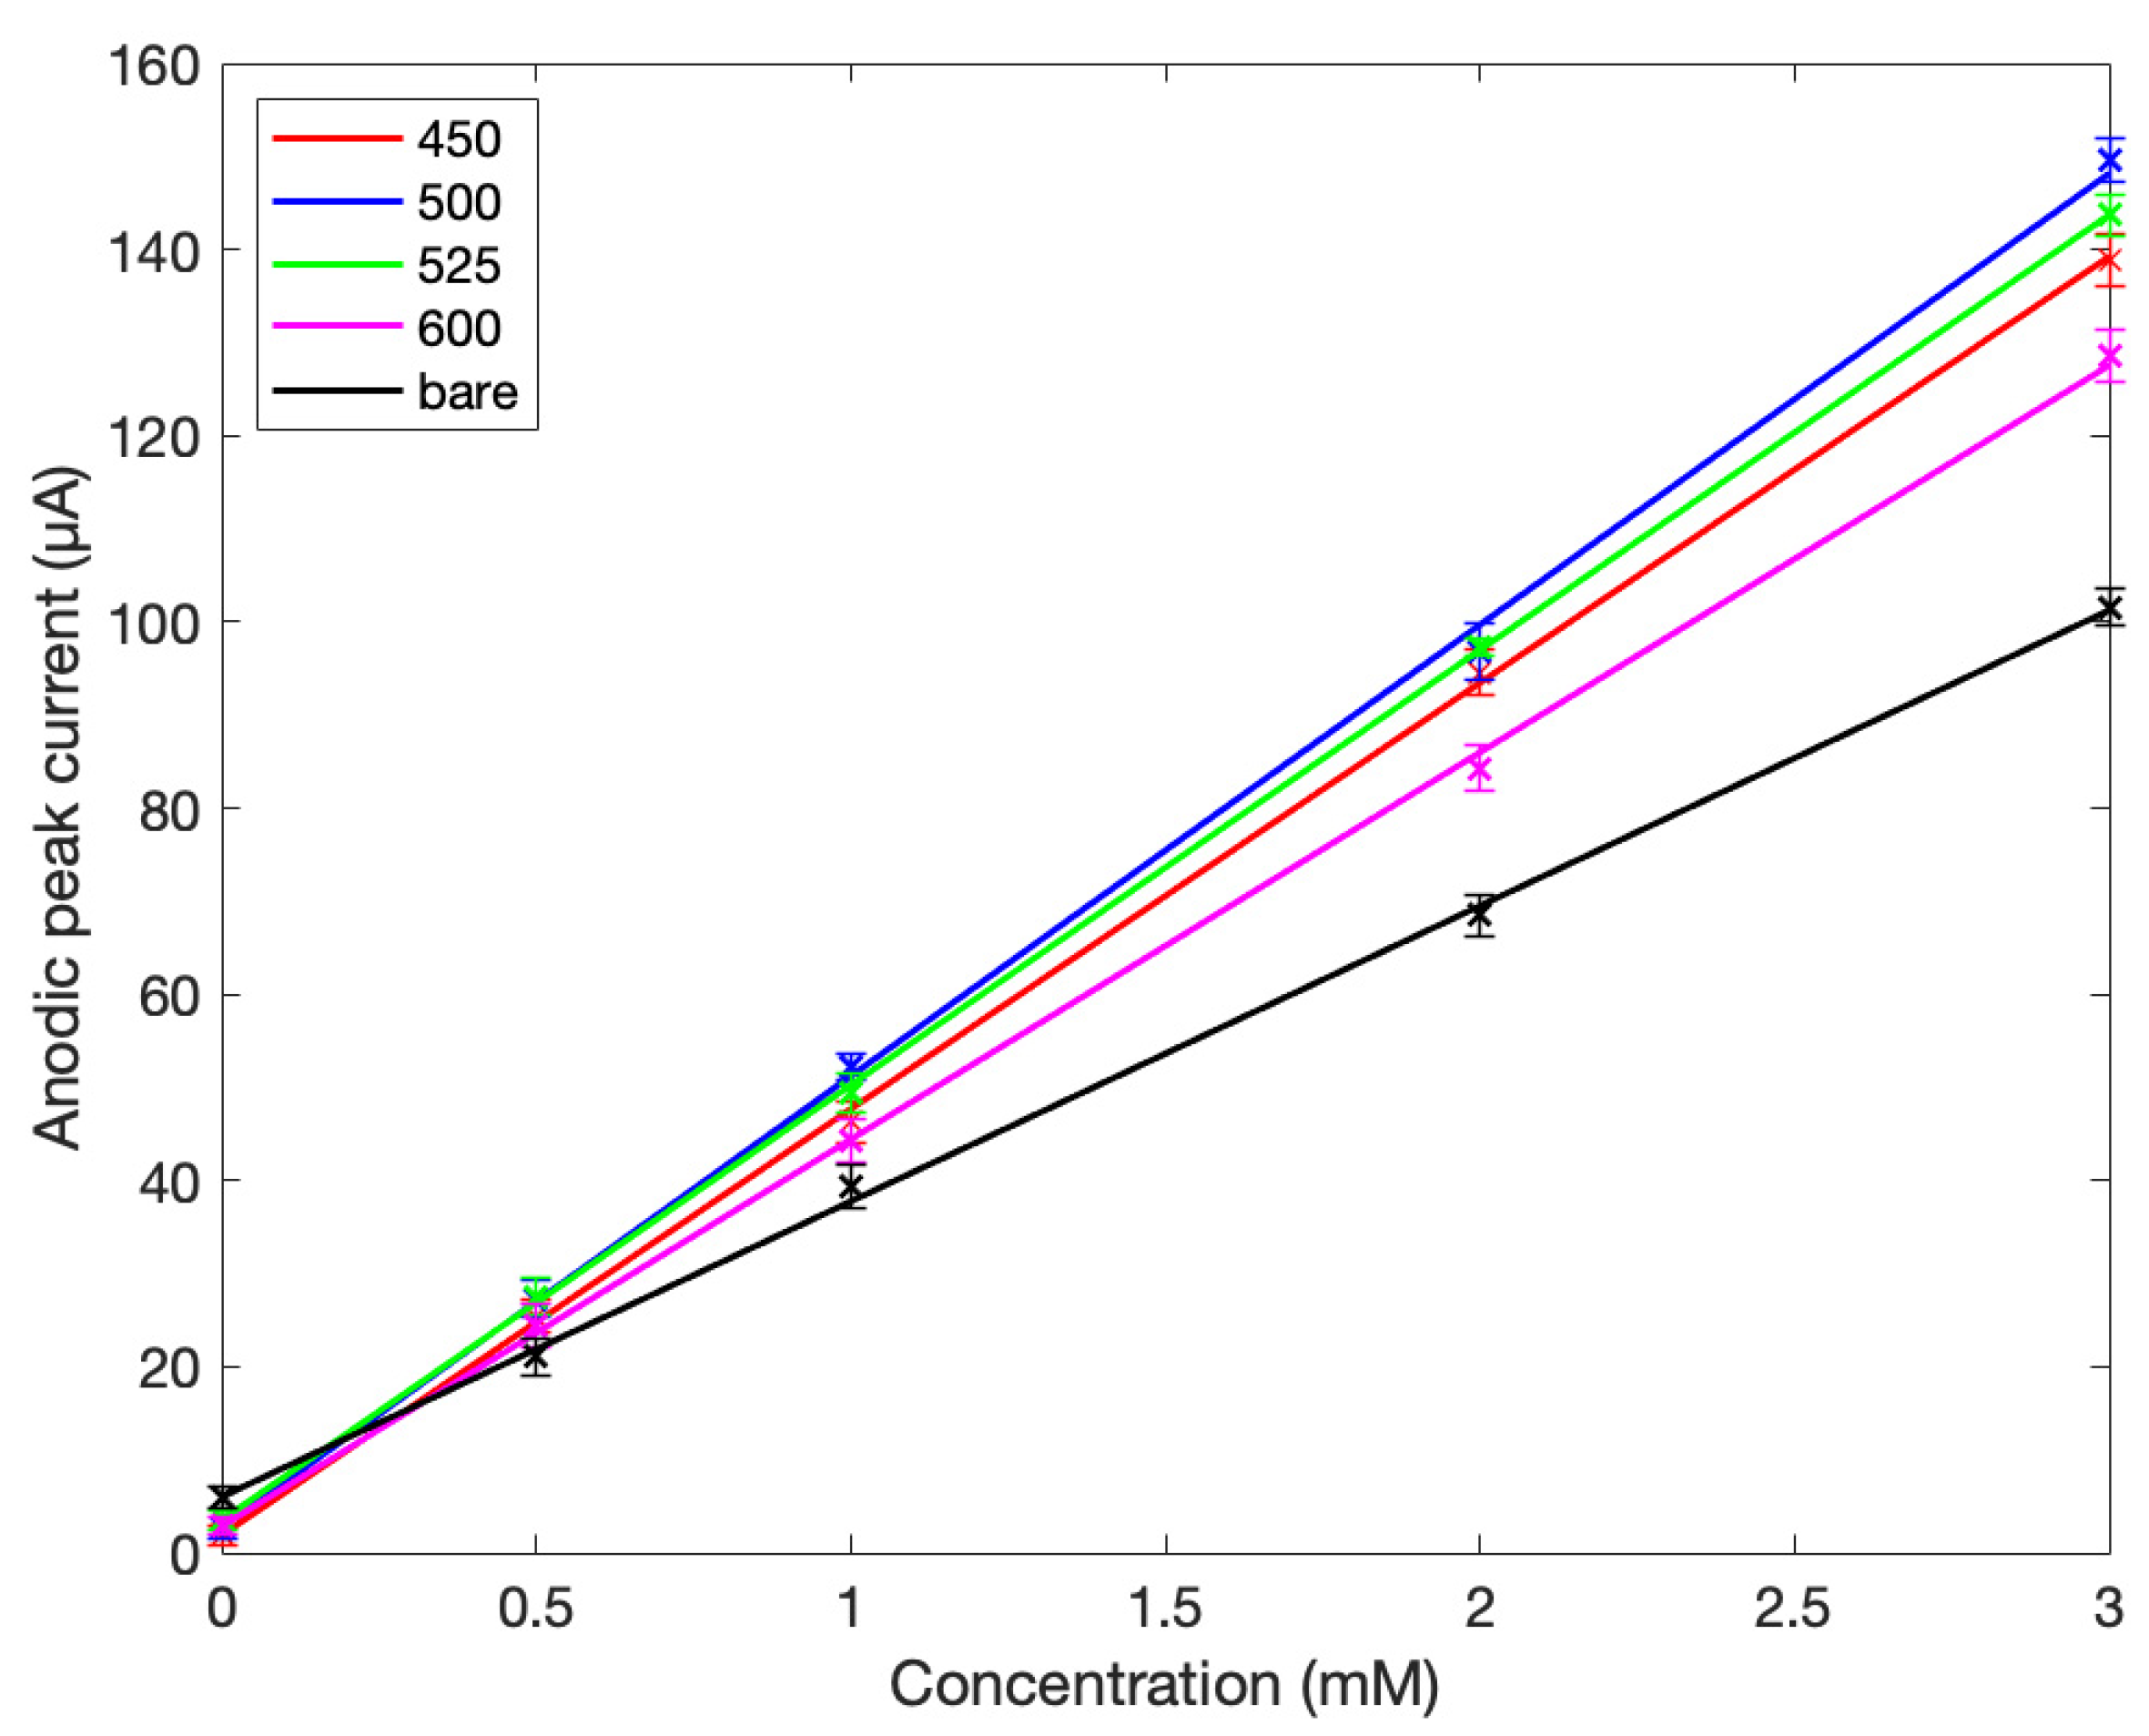
| Material | Anodic Peak (μA) | |
|---|---|---|
| Bare electrode | ||
| B450 | ||
| B500 | ||
| B525 | ||
| B600 |
| Material | D (cm2/s) | ||
|---|---|---|---|
| Bare electrode | 3.84 + 2.81 | 0.996 | |
| B450 | 4.37 + 5.58 | 0.992 | |
| B500 | 5.12 + 2.79 | 0.995 | |
| B525 | 4.93 + 2.85 | 0.996 | |
| B600 | 4.29 + 2.43 | 0.995 |
| Material | k (ms−1) | Alpha (α) |
|---|---|---|
| Bare electrode | ||
| B450 | ||
| B500 | ||
| B525 | ||
| B600 |
| Material | Sensitivity (μA/mM) | LOD (μM) |
|---|---|---|
| Bare electrode | ||
| B450 | ||
| B500 | ||
| B525 | ||
| B600 |
Publisher’s Note: MDPI stays neutral with regard to jurisdictional claims in published maps and institutional affiliations. |
© 2021 by the authors. Licensee MDPI, Basel, Switzerland. This article is an open access article distributed under the terms and conditions of the Creative Commons Attribution (CC BY) license (https://creativecommons.org/licenses/by/4.0/).
Share and Cite
Franceschini, F.; Bartoli, M.; Tagliaferro, A.; Carrara, S. Electrodes for Paracetamol Sensing Modified with Bismuth Oxide and Oxynitrate Heterostructures: An Experimental and Computational Study. Chemosensors 2021, 9, 361. https://0-doi-org.brum.beds.ac.uk/10.3390/chemosensors9120361
Franceschini F, Bartoli M, Tagliaferro A, Carrara S. Electrodes for Paracetamol Sensing Modified with Bismuth Oxide and Oxynitrate Heterostructures: An Experimental and Computational Study. Chemosensors. 2021; 9(12):361. https://0-doi-org.brum.beds.ac.uk/10.3390/chemosensors9120361
Chicago/Turabian StyleFranceschini, Filippo, Mattia Bartoli, Alberto Tagliaferro, and Sandro Carrara. 2021. "Electrodes for Paracetamol Sensing Modified with Bismuth Oxide and Oxynitrate Heterostructures: An Experimental and Computational Study" Chemosensors 9, no. 12: 361. https://0-doi-org.brum.beds.ac.uk/10.3390/chemosensors9120361