A Complementary Sensory Tool for Children with Autism Spectrum Disorders
by
 , ,
, ,
Sabina Barrios-Fernández
1,* ,
,
Margarita Gozalo
2 ,
,
Beatriz Díaz-González
3 and
Andrés García-Gómez
4
1
Medical-Surgical Therapeutics Department, University of Extremadura, 10003 Cáceres, Spain
2
Psychology and Anthropology Department, University of Extremadura, 10003 Cáceres, Spain
3
Nursing and Occupational Therapy College, University of Extremadura, 10003 Cáceres, Spain
4
Education Sciences Department, University of Extremadura, 10003 Cáceres, Spain
*
Author to whom correspondence should be addressed.
Children 2020, 7(11), 244; https://0-doi-org.brum.beds.ac.uk/10.3390/children7110244
Submission received: 30 September 2020
/
Revised: 8 November 2020
/
Accepted: 18 November 2020
/
Published: 20 November 2020
(This article belongs to the Special Issue New Research in Children with Neurodevelopmental Disorders)
Abstract
:Background: Sensory integration (SI) issues are widely described in people with autism spectrum disorder (ASD), impacting in their daily life and occupations. To improve their quality of life and occupational performance, we need to improve clinical and educational evaluation and intervention processes. We aim to develop a tool for measuring SI issues for Spanish children and adolescents with ASD diagnosis, to be used as a complementary tool to complete the Rivière’s Autism Spectrum Inventory, a widely used instrument in Spanish speaking places to describe the severity of ASD symptoms, recently updated with a new sensory scale with three dimensions. Methods: 458 Spanish participants complemented the new questionnaire, initially formed by 73 items with a 1–5 Likert scale. Results: The instrument finally was composed of 41 items grouped in three factors: modulation disorders (13 items), discrimination disorders (13 items), and sensory-based motor disorders (15 items). The goodness-of-fit indices from factor analyses, reliability, and the analysis of the questionnaire’s classification capability offered good values. Conclusions: The new questionnaire shows good psychometric properties and seems to be a good complementary tool to complete new the sensory scale in the Rivière’s Autism Spectrum Inventory.
1. Introduction
1.1. Sensory Integration Process
Sensory integration (SI) is “the neurological process that organizes sensations from one’s own body (internal) and the environment (external) and makes it possible to use the body effectively within the environment” [1] (p. 11). An adequate organization of sensory information is necessary for producing adaptive responses in daily life, which includes different end products: motor, cognitive, behavioral, emotional, or learning outcomes [2]. SI is considered a prerequisite so that more complex functions, as perceptual-motor and cognitive ones, can be appropriately developed [3].
The SI process runs through a series of stages. Firstly, the sensory organs capture fragments of sensory information, which can have either an internal or an external origin. Later, that information is integrated in the central nervous system (CNS) to become a meaningful whole [4]. The SI process takes place in different brain structures in a coordinated way, classifying, and organizing the sensory flow through a series of stages. Firstly, in registration, the CNS detects the sensory sensations from our sensory receptors and we become aware of those sensations [5]. Next, in modulation, the CNS regulates and processes the sensory stimuli [6]. Then, during discrimination the CNS distinguishes between different sensory stimuli, perceiving their specific qualities and becoming meaningful [6,7,8]. Finally, we elicit a response, intended to adaptive, which can include attention, organization, self-esteem, self-confidence, movement, reasoning, and learning outcomes [1,7,9]. Within that end products, and in the group of adaptive motor-based responses, we must refer to praxis. Praxis is the ability to conceptualize, plan, and execute unusual motor actions. Thus, it allows us to organize and manage a purposeful interaction with the physical world, thus involving both motor and cognitive skills [8,10].
Although traditionally we have focused in five senses (vision, hearing, smell, taste, and touch), there are three more sensory systems essential to be successful in daily life: proprioception, vestibular system, and interoception. Proprioceptive sense reports on sensations from muscles, ligaments, and joints, providing information about the compression and stretching of muscles and joints. Proprioception and touch together form the somatosensory pathway, considered essential for praxis and movement [11,12]. The vestibular system provides information on movement, gravity and balance, so it is crucial for the building of spatial and temporal relationships [13]. It also provides information about the speed and the direction of the head movement and our position with relation to gravity [9]. Interoception sense processes sensory stimuli within the body, including body sensations (hunger, thirst, body temperature, heart, breathing rate, etc.) and emotional states (happiness, sadness, shame, anger), being intimately related to self-regulation and well-being [14,15].
1.2. Sensory Processing Disorders
When sensations flow in an organized and integrated way, our brain can use those sensations to form perceptions, behaviors, and learning; when the flow of sensations is disorganized, perception, behavior, and learning are like a traffic jam at a rush hour [16]. Therefore, when SI is not working properly, motor, cognitive, emotional, behavioral, and adaptive issues produce a decrease in daily living functioning and learning [17,18,19,20]. This dysfunction can be mild, medium, or severe [21]. Sensory processing disorder (SPD) is a neurological disorder in which the ability to process and interpret sensory stimuli results in abnormal responses, causing a decrease in the quality of life and occupational performance [22,23]. Several models have been developed to understand the SPD [1,6,24], being Miller’s model one of the most accepted. According to it, SPD can be classified into three categories with their corresponding subtypes: sensory modulation disorders, sensory discrimination disorders, and sensory-based motor disorders. Sensory modulation disorders happen when the CNS has problems in regulating the sensory information (degree, nature, or intensity) resulting in the following subtypes: sensory over-responsivity (exaggerated response), sensory under-responsivity (lack or insufficient response), or sensory craving (desperate seeking for sensory information). Sensory discrimination disorders happen when there is difficulty interpreting the qualities of the sensory stimuli. As a result, the responses are often slow, and sometimes, wrong. Finally, sensory-based motor disorders cause difficulty with motor planning and movement, resulting in postural disorder or dyspraxia subtypes [6,25].
1.3. Autism Spectrum Disorders and SPD Relationships
Taking the latest version of the Diagnostic and Statistical Manual of Mental Disorders (DSM-5) as a reference [26], ASD are included in the neurodevelopmental disorders group, and they are defined by the presence of (a) persistent deficits in social communication and interaction, and (b) restricted, repetitive patterns of behavior, interests, or activities. Within the (b) criterion and, for the first time in the DSM, sensory abnormalities were included as “Hyper- or hyporeactivity to sensory input or unusual interest in sensory aspects of the environment (e.g., apparent indifference to pain/temperature, adverse response to specific sounds or textures, excessive smelling or touching of objects, visual fascination with lights or movement)” (p. 50).
With regards to etiology, and although it is widely recognized that genetic and environmental factors and their interactions contribute to the phenotypes of ASD, the precise causal mechanisms keep still unclear [27]. On a neuroanatomical basis, it is hypothesized that ASD symptoms should be a consequence of brain disconnection since hypomyelination of the brain nerves occurs simultaneously with the main behavioral symptoms [28]. Other studies complement this hypoconnectivity hypothesis by suggesting that in addition to hypoconnectivity in some regions of the cerebral cortex and at an interhemispheric level, a compensatory hyperconnectivity between the thalamus and the cerebral cortex, explaining sensory, and social symptoms [29]. Under this assumption, sensory issues in ASD have as origin atypical connectivity of neuronal structures. Nevertheless, it seems that topography of hypoconnectivity in ASD is unique and different from other conditions, such as SPD. In ASD, areas related to socio-emotional processing are highly affected; whereas, in SPD, there is lower connectivity in the brain’s perception and integration pathways, which serve as connections for the auditory, visual, and somatosensory systems involved in SI [30].
SI issues are commonly reported in ASD, compared to their peers [31]. Various studies have tried to explain the most frequent sensory profiles or those issues that cause the biggest issues in children with ASD, as well as the proposals of intervention to improve their occupational performance [19,31,32,33,34,35,36,37]. With regards to ASD specific sensory profiles, hyporeactivity/under-responsivity is one of the most consistent issues found [24], although hyperreactivity/over-responsivity and sensory seeking have been also reported [38]. Several studies have found relationships between the core symptoms of ASD and sensory impairments, such as repetitive behaviors [34,39], with social communication and interaction [31,40,41], but also, with movement issues, including coordination, planning, and timing [42,43], impacting in their daily life [44]. With regards to the interventions, some of the studies focused on Ayres’s Sensory Integration Therapy [36,45], and others in using specific sensory techniques and environmental modifications, thus the promotion of ecological approaches to improve occupational performance [4,37].
1.4. Autism Spectrum Disorders and SPD Assessment
There are different tools to measure SI functioning, including questionnaires, observational tools, and comprehensive tests administered to the children or adolescents. Some reviews have been performed to resume information about SI tools, noticing that there are a large number of proposals [46,47]. Other reviews have checked for the most used SI tools in ASD, providing information about their characteristics and limitations [48,49,50]. Some of the most representative instruments are the Sensory Profile (SP) [51] and its second version (SP2) [52], a group of standardized questionnaires for assessing sensory processing including the infant, toddler, child, short, and school companion forms, from birth to 14.11 years. The Sensory Processing Measure (SPM), formed by a set of questionnaires to assess SI in home and the school, in children between 5–12 years. It also includes self-evaluation forms to be completed by the children and adolescents. There is a preschool version from 2–5 years [53]. The Sensory Integration and Praxis Test (SIPT) is a comprehensive test formed by 17 subtests to assess visual, tactile, kinesthetic, and motor tasks in children from 4–8.11 years [16]. There are several emerging SI assessment tools. The Sensory Processing 3-Dimensions (SP3D) is a tool composed of a series of task to elicit typical and atypical behavioral responses in children, covering sensory modulation, discrimination, and sensory-based motor disorders; and by a questionnaire with five subscales: sensory over-responsiveness, sensory under-responsiveness, sensory craving, postural disorder, dyspraxia, and sensory discrimination disorder [25,54]. The Evaluation in Ayres Sensory Integration (EASI) is a comprehensive assessment test for SI which includes measures related to sensory perception, sensory responsiveness, postural, ocular and bilateral integration, and praxis [24,55].
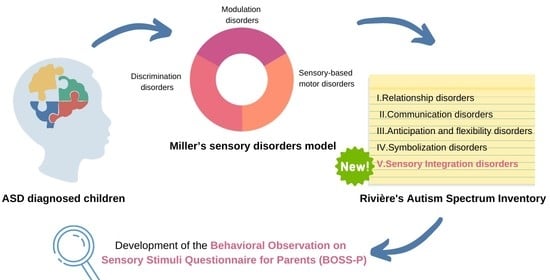
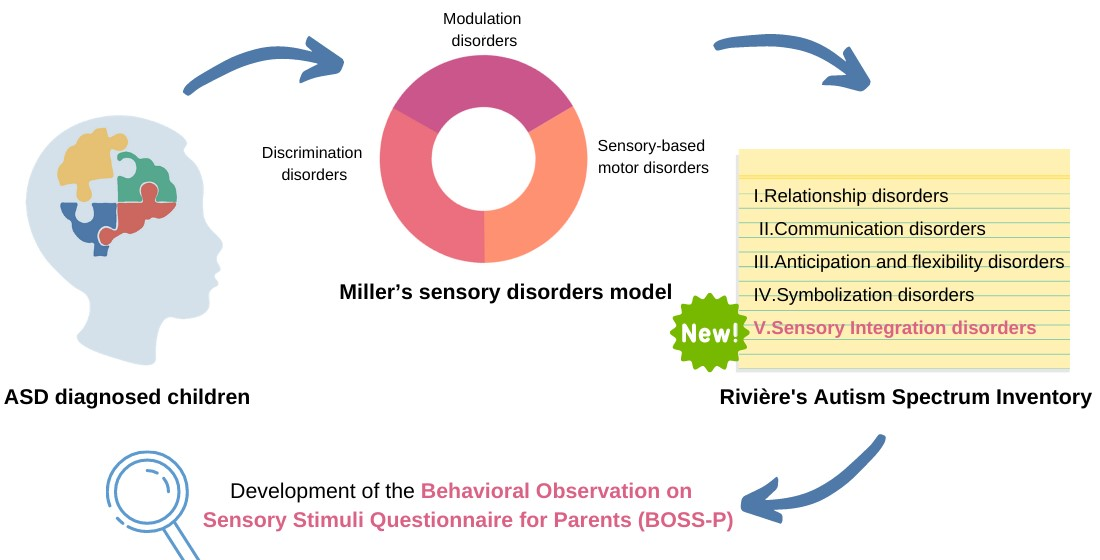
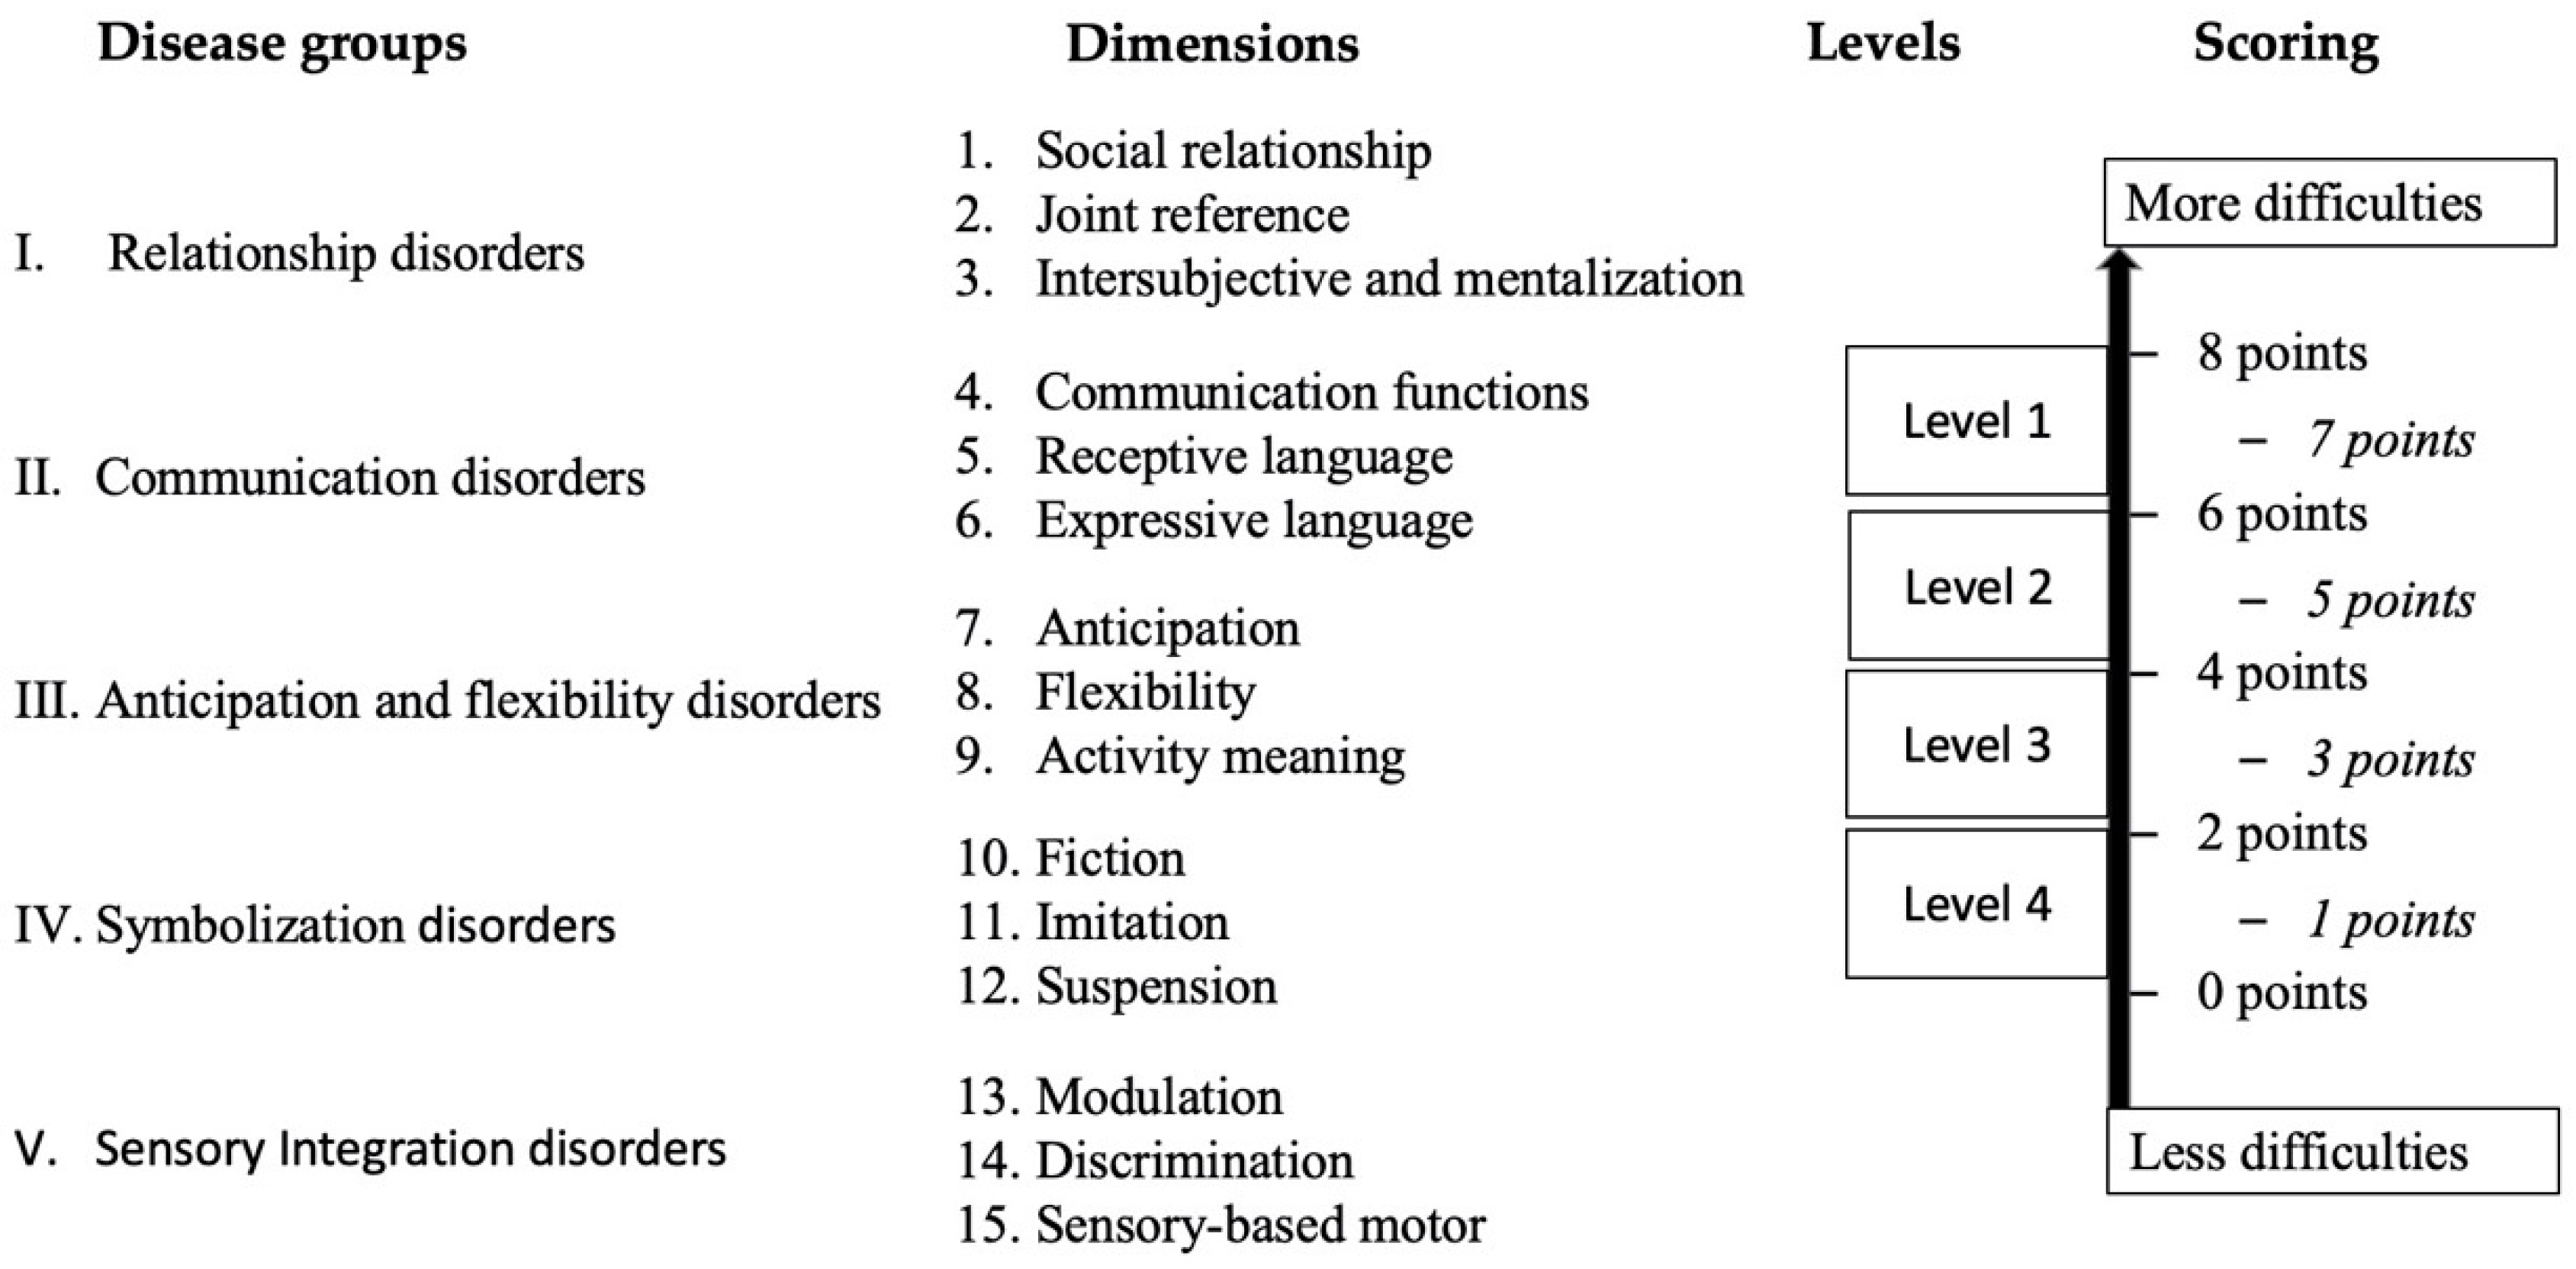
Tools for ASD assessment, including detection [56,57], diagnosis and measuring changes after interventions [58,59] are also available. In any case, the assessment of the severity of ASD should be complete and comprehensive and must include the measure of the SI and its impact in daily life. Within these tools, the Autism Spectrum Disorders Inventory developed by Rivière [60,61], is a widely used tool both in Spain and Latin America. It examines the severity of ASD by establishing four disease groups: relationship disorders, communication disorders, anticipation and flexibility, and symbolization, resulting in 12 dimensions, all of which can be scored from 0 to 8 points. The Rivière’s Autism Spectrum Inventory was set up before the importance of the SI was spread so, recently, a new sensory scale has been incorporated [62] updating the tool to the current knowledge of ASD. Now it is formed by five disease groups and 15 dimensions (Figure 1). An advantage of the Rivière’s Autism Spectrum Inventory is the fact that, as being designed by severity levels, it can help the clinicians’ in their judgment to determine the levels of severity required in DSM-5 [26]. However, and although this instrument explains the four levels of affectation in each dimension, it does not define specific behaviors to observe, so using complementary tools to collect information is strongly recommended.
1.5. Aim
We aim to create a questionnaire to be used as a support for scoring the new sensory scale in the Rivière’s Autism Spectrum Inventory, a widely used tool to assess ASD severity in Spanish speaking places.
2. Methods
2.1. Participants
The sample was formed by 458 children and adolescents (308 males, 68.7%, and 144 females, 31.3%) from 4 to 19 years (x = 9.6, dt = 4.42). Of these, 259 were individuals with typical development (57.2%), 145 presented ASD clinical diagnosis (32%) and 54 had other diagnoses different than ASD resulting in intellectual, sensory, and/or motor disabilities (11.95%).
2.2. Procedure
After conducting a literature review, a group of experts in the fields of Occupational Therapy and Psychology, with clinical experience, created a preliminary version of the tool composed of 73 items. Then a pilot study was carried out with 31 ASD families with diagnosed children. The 50 items with the best indicators were selected. Participants were recruited using the snowball technique in the case of typical development children, and through different associations, in the case of diagnosed children. The data collection was carried out between May and August 2020. This protocol adheres to the updates of the Declaration of Helsinki, and the study was approved by the Committee on Biomedical Ethics of the University of Extremadura (97/2020).
Our instrument, the Behavioral Observation on Sensory Stimuli Questionnaire for Parents (BOSS-P) was administered to the families. They were also asked for socio-demographic data, including age, sex, clinical diagnosis, intellectual capacity, language level, comorbidities, and the need for aids in their daily life. Once the questionnaire was administered to the sample, the items were analyzed by the group of experts, discarding those which did not fit on the theoretical model, being the final version composed of 41 items (Supplementary Table S1). The BOSS-P was administered together with the Sensory Profile 2 (SP2) Short Form [63,64] to 31 participants, to obtain validity indicators.
2.3. Instrument
The BOSS-P, a new instrument to better characterize ASD children and adolescents to fulfil the three new sensory dimensions from Rivière’s Autism Spectrum Inventory based on Miller’s model, must be completed interviewing with main caregivers, which may answer the 41 items through a Likert scale with five response options, from 1 to 5 (higher scores mean greater SI dysfunction). It takes about 25–30 min to complete the interview.
2.4. Statistics
To perform the validation process of the BOSS-P we have carried out: (1) an exploratory factor analysis (EFA), (2) confirmatory factor analysis (CFA), (3) reliability analysis, (4) the assessment of concurrent validity through the correlations with the SP2, and (5) provide descriptive statistics from the typical development and the ASD subsamples.
Because we are handling ordinal variables from a Likert-type scale with five response categories, the EFA was carried out with the FACTOR software [65,66,67] using polychoric correlations and robust methods [68]. Items with factorial weights below 0.30 were excluded. The CFA was carried out with the IBM SPSS AMOSTM 24 [69] using the Maximum Likelihood estimation procedure, suitable for Likert-type scales of five response categories. The CFA supports the factorial solution provided by the EFA and also offers the model of relations between the variables that best fits with the data [70,71,72].
The evaluation of the model fit was made taking into account the Chi-Square divided by degrees of freedom (CMIN/DF) and the p of Chi-square following Byrne’s criteria [73]. The statistical p of Chi-square is dependent on the sample size, so it was convenient to use other goodness-of-fit indicators choosing the Tucker–Lewis index (TLI), the comparative fit index (CFI) following Hu and Bentler’s criteria [74], the root-mean-square error of approximation (RMSEA), and the root-mean-square residuals (RMSR) [75,76].
Ordinal alpha coefficients were calculated [77,78] to assess reliability, considering values >0.70 acceptable and >0.90, excellent [79]. The analysis of the correlations between our tool and the SP2, the descriptive statistics of the subsamples and the relative operating characteristic (ROC) analysis were carried out to check the instrument’s ability to classify between the two subsamples, using the IBM SPSSTM 24 [80] statistical package. Cohen’s d statistic [81] was also calculated to check the magnitude of the effect size of the differences between the subsamples scores.
3. Results
3.1. Exploratory Factor Analysis
After administering the experimental version of the questionnaire to the sample, a solution of 41 items grouped into three correlated factors was obtained. Bartlett’s (5025.4; df = 820; p = 0.000) and Kaiser–Meyer–Olkin test (0.912) statistics showed a very good sample suitability [82]. In Table 1, can be found both the rotated factorial matrix and factorial weights of each item. The three factors obtained represent (F1) modulation disorders with 13 items, (F2) discrimination disorders with 13 items, and (F3) sensory-based motor disorders with 15 items.
With regards to the correlation between factors, moderate relationships were found between F1–F2 (0.38); F1–F3 (0.61), and F2–F3 (0.53) [81], which was to be expected since they are different stages within the same neurobiological process.
3.2. Confirmatory Factor Analysis
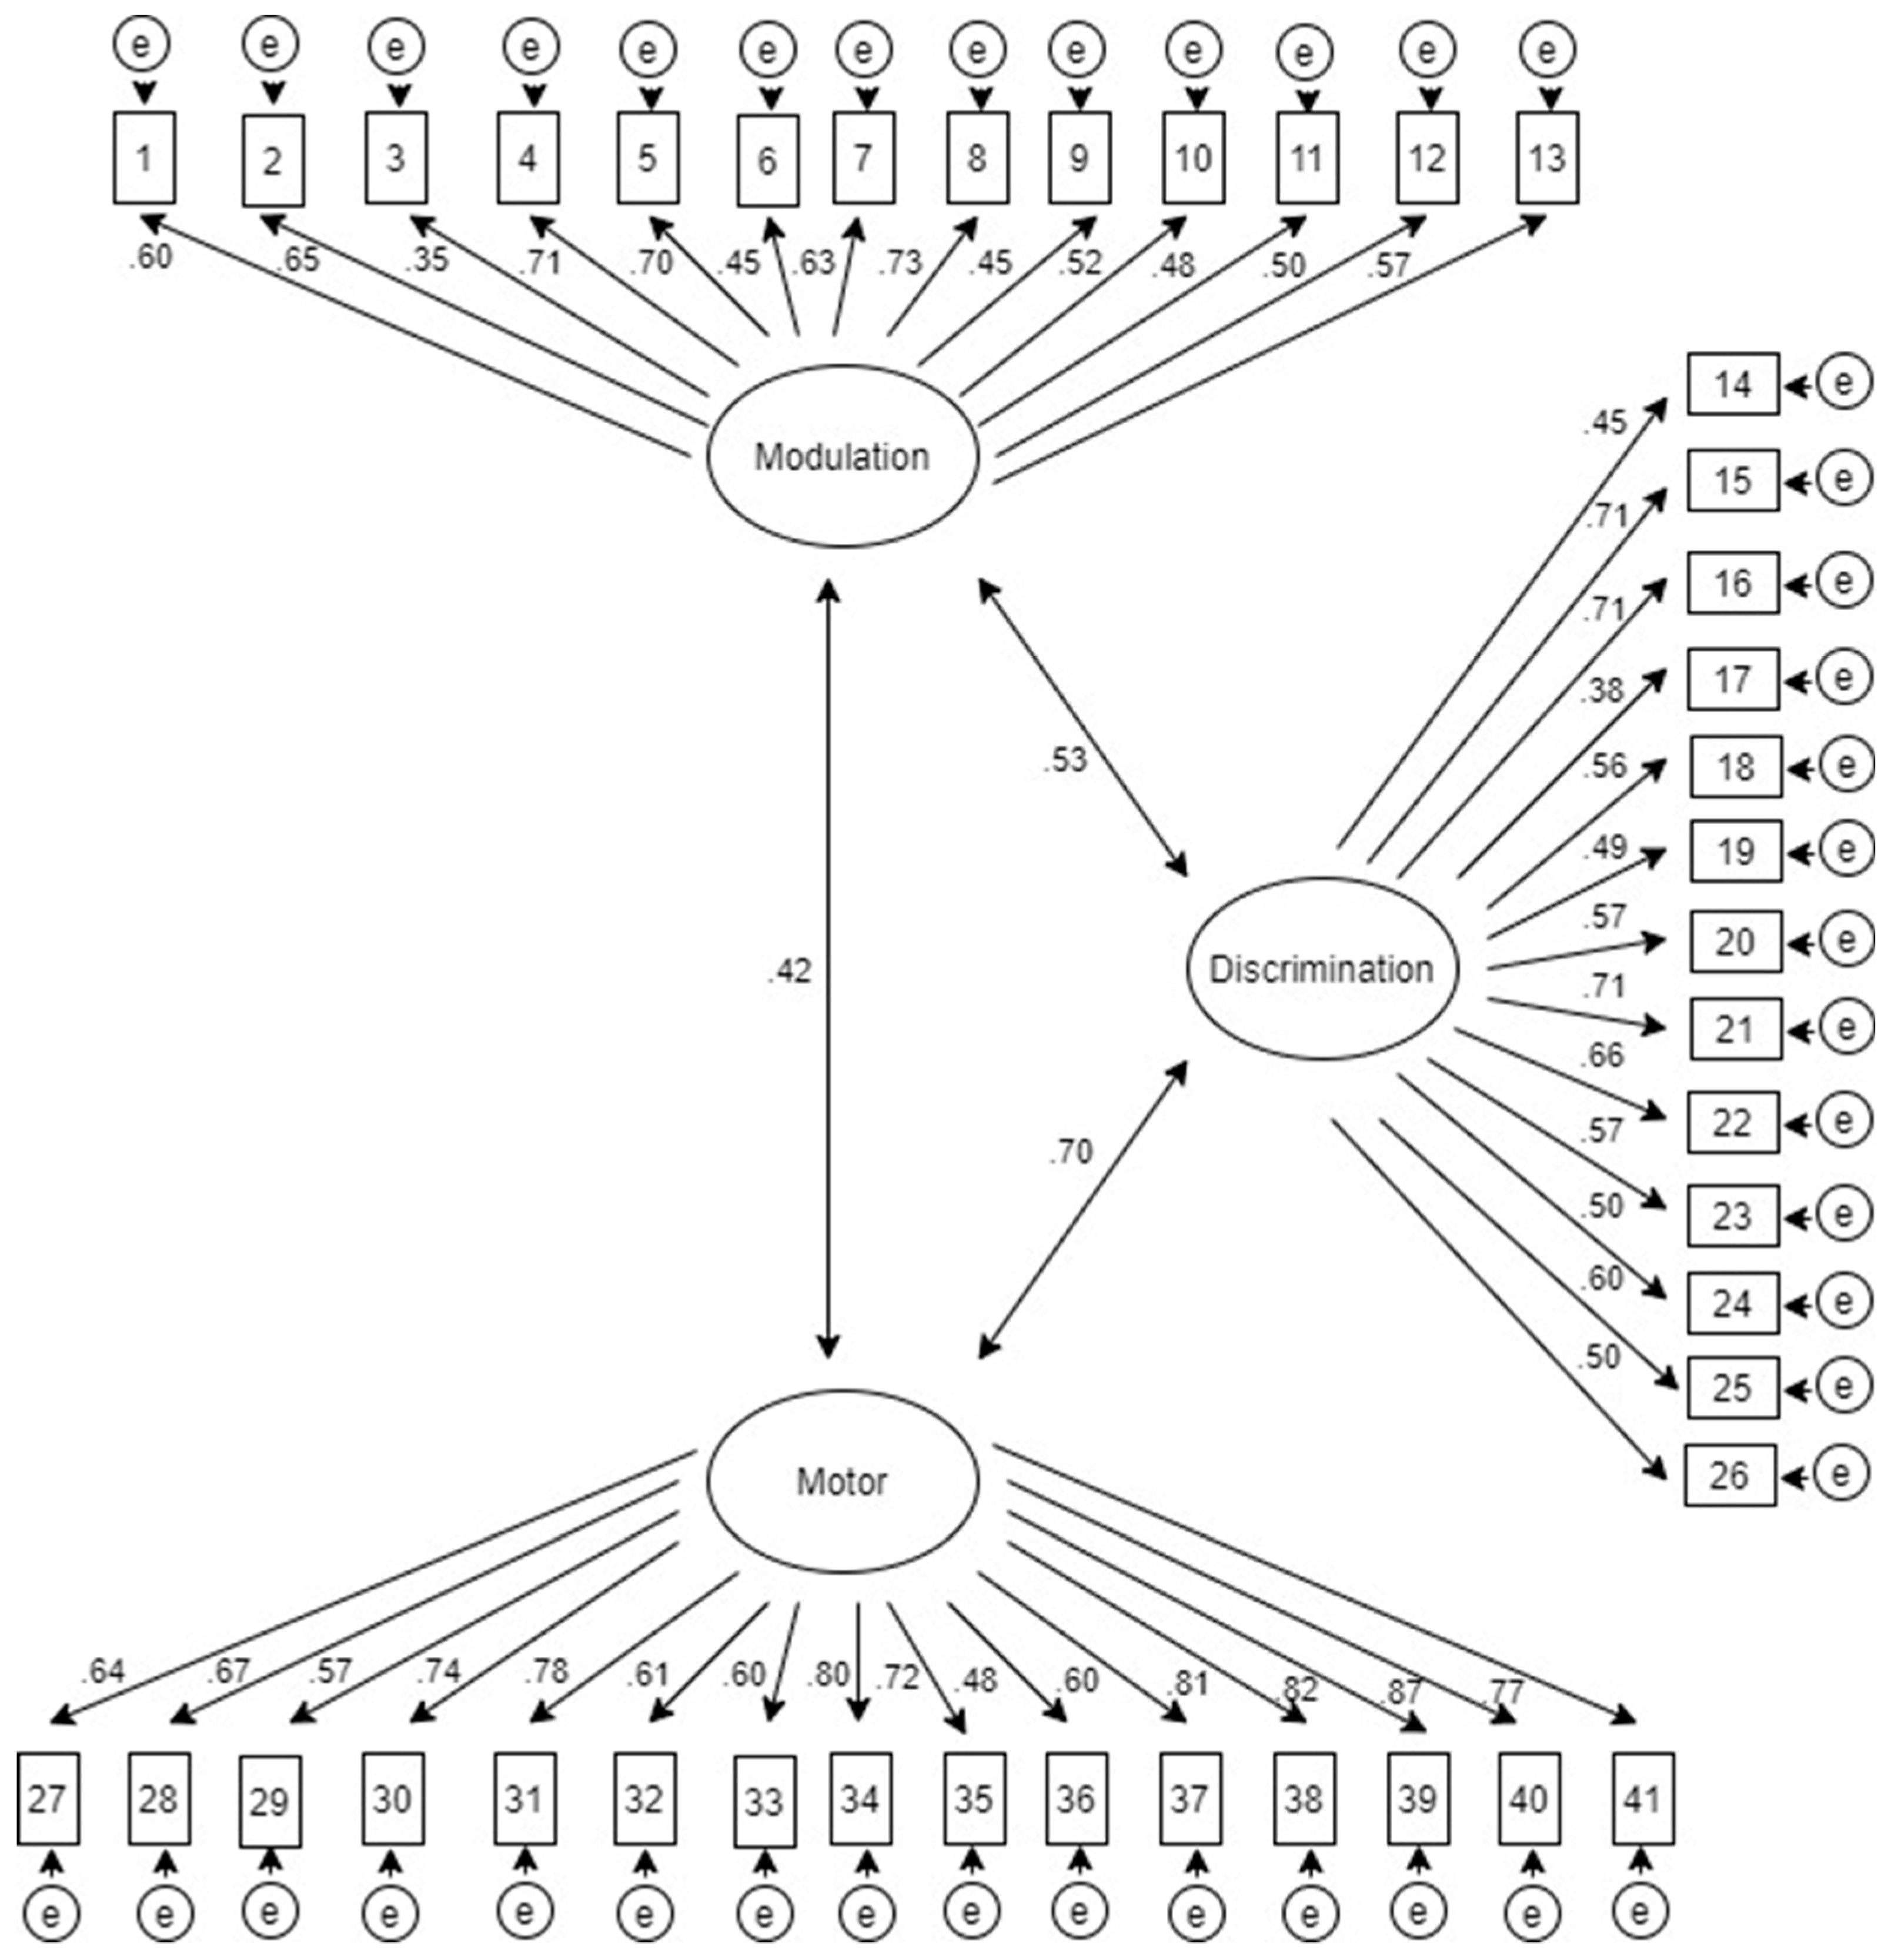
The CFA confirms the exploratory factorial solution revealing three latent variables which group the 41 observable variables (items). Figure 2 shows the graphical representation of the analyzed model, being (F1) modulation disorders, (F2) discrimination disorders, and (F3) sensory-based motor disorders. The factorial weights of every item and the covariation relations between the latent variables are shown.
In Table 2, are represented the goodness-of-fit indices from the CFA, showing good values.
3.3. Reliability
To analyze the concurrent validity, we compared the BOSS-P with the SP2, a tool for SI assessment validated for Spanish children and adolescents. Both questionnaires were administered to 31 participants with ASD to study their correlations. As shown in Table 3, the modulation disorders factor (F1) from the BOSS-P was the only with significant and moderate correlations with the factors analyzed in the SP2.
3.4. Questionnaire’s Capability to Classify between ASD and Typical Development
Descriptive statistics of participants with ASD (n = 145) and with typical development (n = 259) subsamples are shown in Table 4. It can be checked that both, mean and standard deviation of every subsample offer different scores.
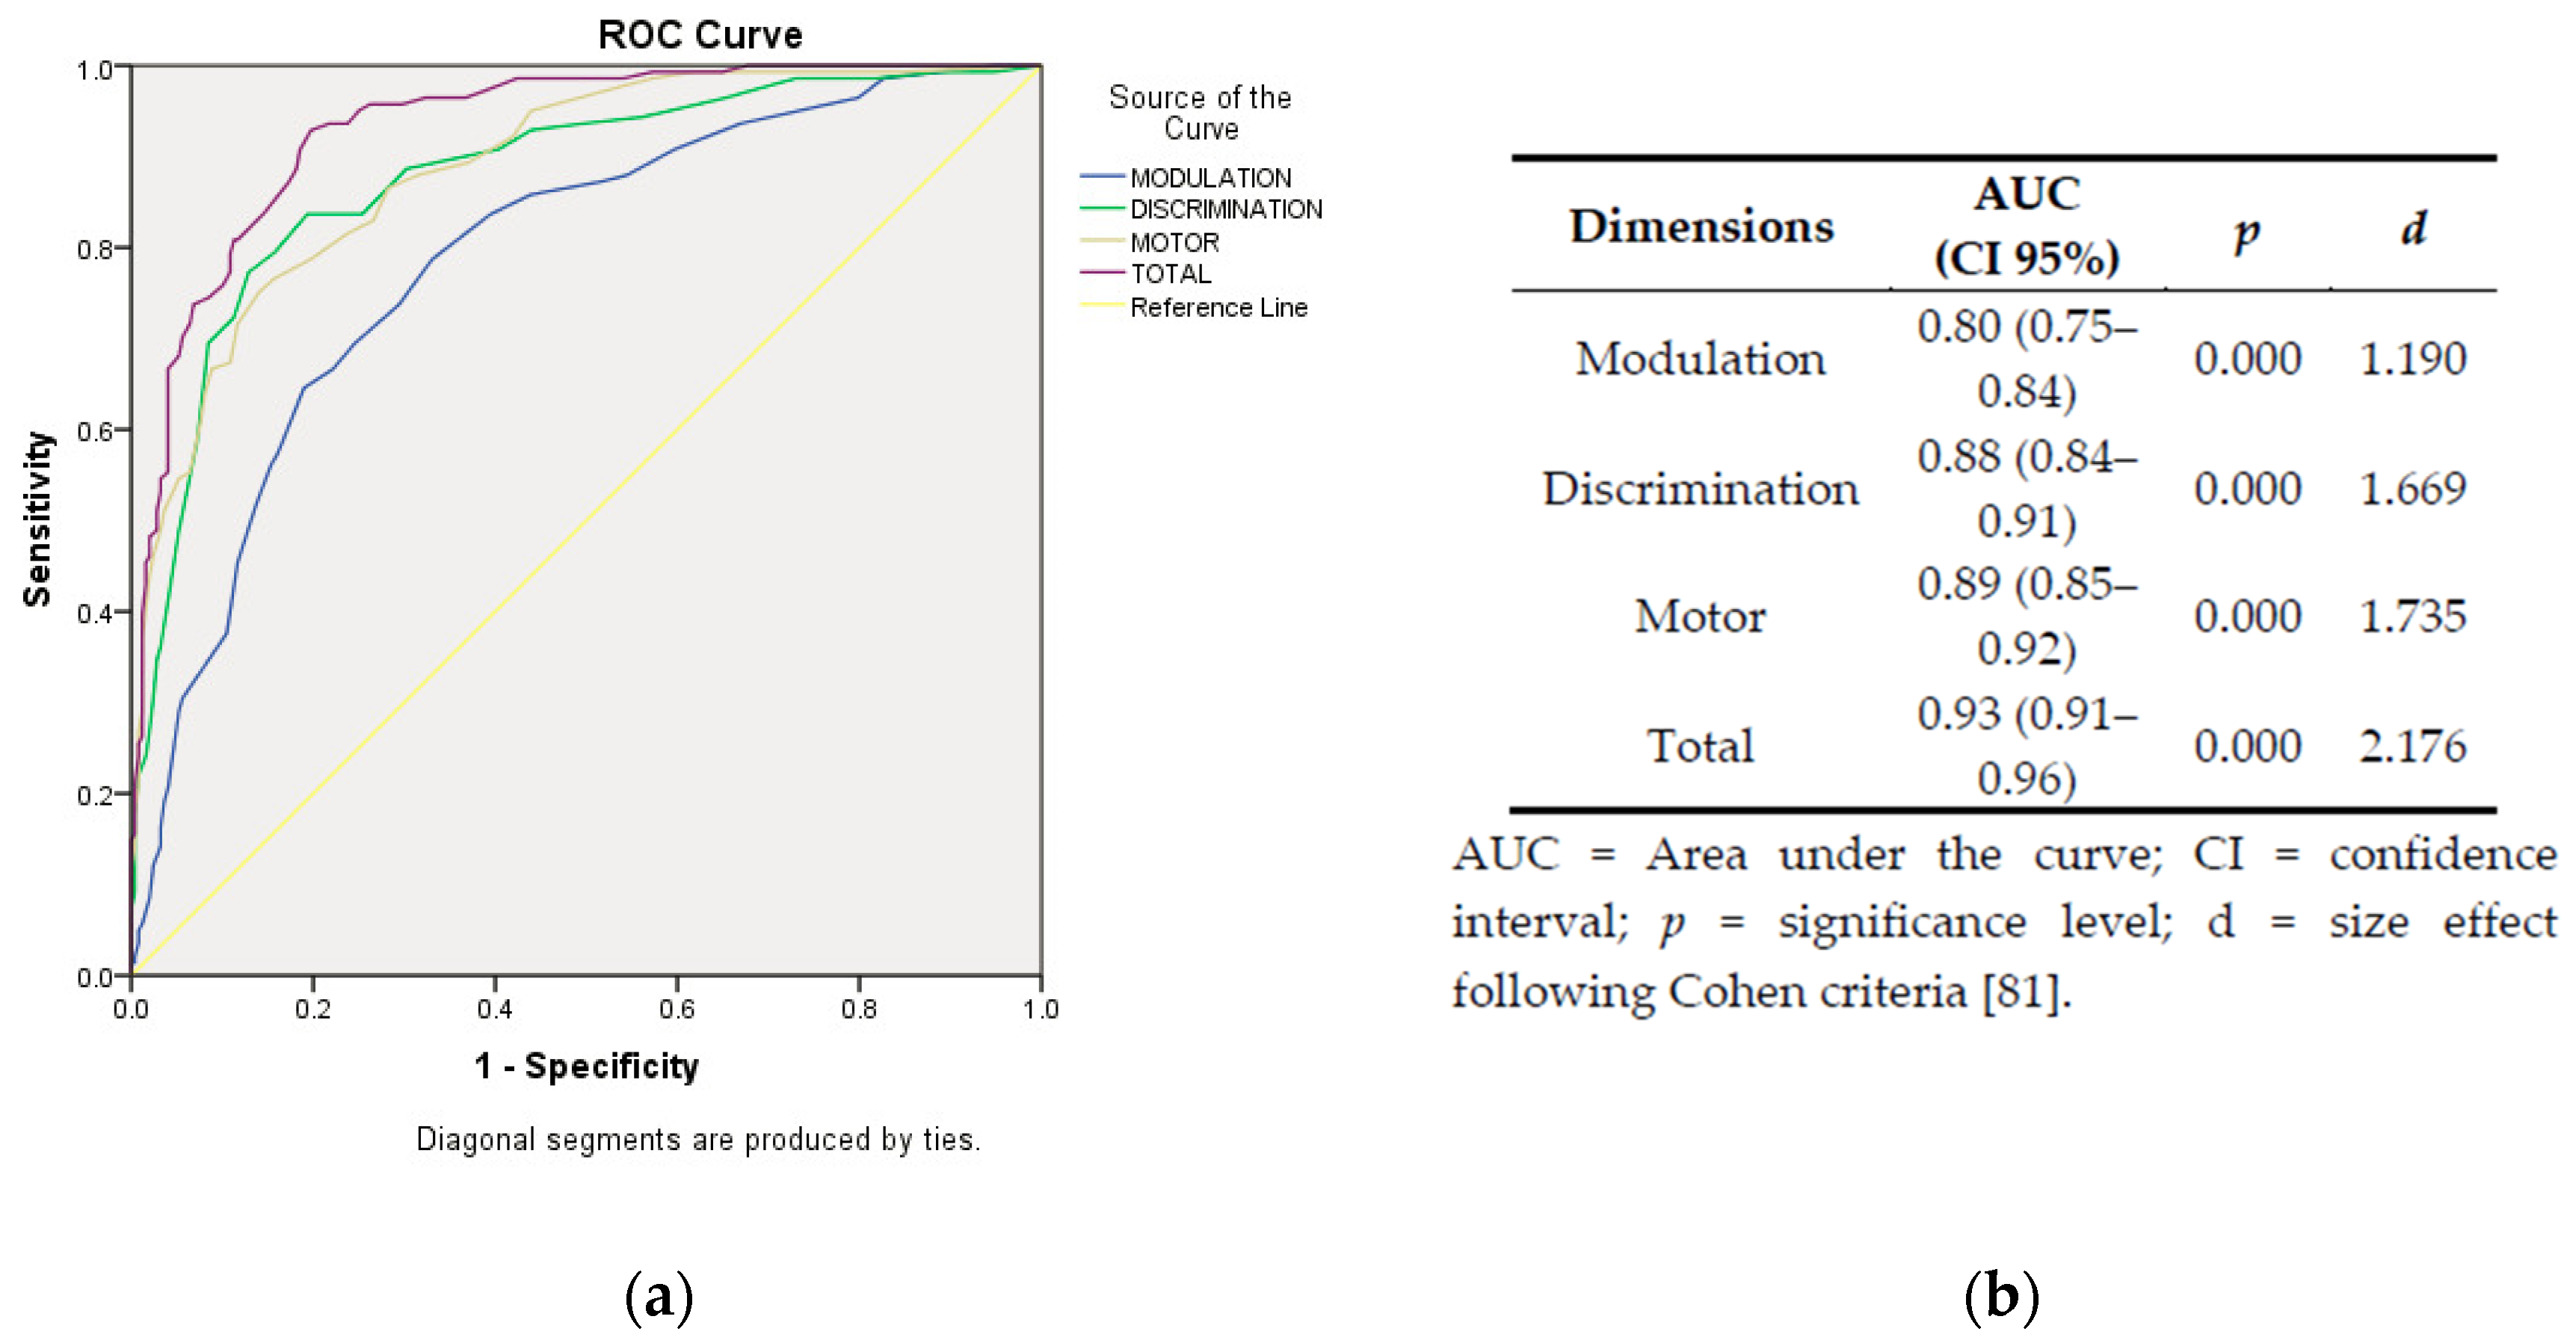
In Figure 3, graphical representation and statistics from ROC curves are provided. The area under the curve (AUC) shows differences with large effect magnitudes between the three factors, being the BOSS-P total score the most capable dimension to establish a correct classification of subjects according to their reference group.
Considering the Rivière’s Autism Spectrum Inventory scoring system, an approximation to the level of SI severity using the level of affectation in the Rivière’s inventory and the BOSS-P interquartile scores was obtained in the ASD sample (see Table 5).
4. Discussion
4.1. About the BOSS-P Questionnaire
We aimed to create a questionnaire to support the new SI scale [62] added to the Rivière’s Autism Spectrum Inventory [60,61]. The Rivière’s Inventory is a widely used instrument in Spain and Latin America, which allows us to establish the level of the ASD severity, in line with the levels proposed in the DSM-5 [26]. The Rivière’s Inventory is useful both during the diagnosis and intervention processes.
The BOSS-P is a screening instrument, administered through an interview with parents or carers, which is not intended to replace other comprehensive assessments, existing or emerging, with good psychometric properties on SI. However, our instrument has several advantages: (1) it is a quick test which is administered in 25–30 min; (2) that does not require specific training; (3) is open access; (4) is a complete tool, as it assesses items within the three areas described by Miller [6]: sensory modulation, sensory discrimination, and sensory-based motor disorders; (5) with good psychometric properties in terms of validity, reliability, and discrimination capacity; (6) created in Spain and therefore, adapted to the cultural characteristics of this country; (7) which fills a gap in terms of SI tools in Spanish-speaking population; and (8) which complements a psychological test widely used in the Spanish-speaking world, the Rivière’s Inventory for people with ASD.
We have also provided an attempt to the combined use of the BOSS-P and the Rivière’s Inventory, by linking the Rivière’s level of severity and the BOSS-P quartile scores. Our instrument showed good psychometric values, offering a factorial structure formed by the three groups proposed by Miller [6]. These data are interesting because let us verify that Miller’s model is consistent in different cultures and because. The BOSS-P’s ability to classify between participants with ASD and typical development children seems adequate (AUC = 0.938), corresponding to a large effect size between the scores of both subsamples (d = 2.176) [83].
4.2. The BOSS-P and Other Instruments
Some reviews have found that psychometric properties of some of the SI tools are from poor to moderate, so the professionals must use the obtained data with caution [48,50], selecting appropriate SI assessments depending on the detected SI needs [47]. However, as aforementioned, there are few available instruments for Spanish children and adolescents. According to our best knowledge, neither the SIPT—considered as a Gold Standard for SI assessment [84]—nor the SPM are available for Spanish population, while the SP3D and the EASI are not yet published, being the SP2 the only tool of choice in Spain. The SP2 Spanish version covers a little shorter age range than the original, from 3 to 14.11 years. The BOSS-P covers from 4 to 19 years, a wider range including the full adolescent stage. The correlations between the BOSS-P and the SP2 only find relationships in modulation disorders, which could lead us to consider the necessity of using different tools to obtain information about SI if using the SP2.
Concerning its psychometric properties, the BOSS-P items present excellent internal consistency (alpha > 0.87), similar or superior other questionnaires used in the international context [46]. The ability of the questionnaire to discriminate between sub-samples offers a large effect size (d = 2.176), which is slightly higher than the size effect of the difference reported in other instruments [85].
4.3. Limitations and Future Lines
This research has some limitations. The information was completed through parents, and although instruments completed by families are considered to be valid [86], we must be careful because some parents should overestimate or underestimate the development of their children [87]. The sample was one of convenience. Another limitation was that we could not perform a test–retest. As future lines, we will try to improve the psychometric properties of the questionnaire, as well as to perform studies for its use in other Spanish-speaking countries different than Spain.
5. Conclusions
The preliminary study of the psychometric properties of Behavioral Observation on Sensory Stimuli Questionnaire for Parents (BOSS-P) shows good values for its use in Spanish children and adolescents diagnosed with ASD between 4 and 19 years. This tool was designed to help clinicians and educational professionals to establish the level of severity in children and adolescents with ASD diagnosis through the new SI scale in the Rivière’s Autism Spectrum Inventory.
Supplementary Materials
The following are available online at https://0-www-mdpi-com.brum.beds.ac.uk/2227-9067/7/11/244/s1, Table S1: Behavioral Observation on Sensory Stimuli Questionnaire for Parents (BOSS-P) Versión original española: Cuestionario de Observación de la Conducta ante Estímulos Sensoriales para Padres de niños/as y adolescentes con Autismo/TEA (OCS-P).
Author Contributions
Conceptualization, S.B.-F., M.G., and B.D.-G.; Methodology, A.G.-G.; Software, A.G.-G.; Formal analysis, A.G.-G.; Writing—original draft preparation, S.B.-F., M.G.; Writing—review and editing, S.B.-F. and M.G.; Supervision, A.G.-G. All authors have read and agreed to the published version of the manuscript.
Funding
This research received no external funding.
Acknowledgments
We want to thank all the participants who kindly dedicated their time to help us in this research.
Conflicts of Interest
The authors declare no conflict of interest.
References
- Ayres, A.J. Sensory Integration and Learning Disorders; Western Psychological Services: Los Angeles, CA, USA, 1972; ISBN 978-0-87424-303-1. [Google Scholar]
- Humphries, T.; Wright, M.; McDougall, B.; Vertes, J. The Efficacy of Sensory Integration Therapy for Children with Learning Disability. Phys. Occup. Ther. Pediatr. 1990, 10, 1–17. [Google Scholar] [CrossRef]
- Williams, M.S.; Shellenberger, S. The Alert Program for Self-Regulation; TherapyWorks Inc.: Albuquerque, NM, USA, 1995; ISBN 978-0-9643041-1-6. [Google Scholar]
- Dunn, W. Supporting Children to Participate Successfully in Everyday Life by Using Sensory Processing Knowledge. Infants Young Child. 2007, 20, 84–101. [Google Scholar] [CrossRef] [Green Version]
- Kilroy, E.; Aziz-Zadeh, L.; Cermak, S.A. Ayres Theories of Autism and Sensory Integration Revisited: What Contemporary Neuroscience Has to Say. Brain Sci. 2019, 9, 68. [Google Scholar] [CrossRef] [Green Version]
- Miller, L.J.; Anzalone, M.E.; Lane, S.J.; Cermak, S.A.; Osten, E.T. Concept Evolution in Sensory Integration: A Proposed Nosology for Diagnosis. Am. J. Occup. Ther. 2007, 61, 135–140. [Google Scholar] [CrossRef] [Green Version]
- Sher, B. Everyday Games for Sensory Processing Disorder: 100 Playful Activities to Empower Children with Sensory Differences; Althea Press: Berkeley, CA, USA, 2016; ISBN 978-1-62315-700-5. [Google Scholar]
- Lane, S.J.; Bundy, A.C. Kids Can Be Kids: A Childhood Occupations Approach; Lane, S., Bundy, A.C., Eds.; F.A. Davis Co.: Philadelphia, PA, USA, 2012; ISBN 978-0-8036-1228-0. [Google Scholar]
- Lane, S.J.; Mailloux, Z.; Schoen, S.; Bundy, A.; May-Benson, T.A.; Parham, L.D.; Roley, S.S.; Schaaf, R.C. Neural Foundations of Ayres Sensory Integration®. Brain Sci. 2019, 9, 153. [Google Scholar] [CrossRef] [Green Version]
- Cermak, S.A. Reflections on 25 Years of Dyspraxia Research. In Ayres Dyspraxia Monograph; Pediatric Therapy Network: Torrance, CA, USA, 2011. [Google Scholar]
- Ackerley, R.; Kavounoudias, A. The role of tactile afference in shaping motor behaviour and implications for prosthetic innovation. Neuropsychologia 2015, 79, 192–205. [Google Scholar] [CrossRef] [Green Version]
- Beaudry Bellefeuille, I.; Sánchez Padrón, O. Tengo Duendes en Las Piernas; Nobel: Oviedo, Spain, 2011; ISBN 978-84-8459-654-7. [Google Scholar]
- Pfeiffer, C.; Serino, A.; Blanke, O. The vestibular system: A spatial reference for bodily self-consciousness. Front. Integr. Neurosci. 2014, 8, 31. [Google Scholar] [CrossRef] [Green Version]
- Mahler, K.J.; Craig, A.D. Interoception: The Eighth Sensory System: Practical Solutions for Improving Self-Regulation, Self-Awareness and Social Understanding of Individuals with Autism Spectrum and Related Disorders; AAPC Publishing: Shawnee Mission, KS, USA, 2016; ISBN 978-1-942197-14-0. [Google Scholar]
- Farb, N.A.S.; Daubenmier, J.; Price, C.J.; Gard, T.; E Kerr, C.; Dunn, B.D.; Klein, A.C.; Paulus, M.P.; Mehling, W.E. Interoception, contemplative practice, and health. Front. Psychol. 2015, 6, 763. [Google Scholar] [CrossRef] [Green Version]
- Ayres, A.J. Sensory Integration and Praxis Tests; Western Psychological Services: Los Angeles, CA, USA, 1989. [Google Scholar]
- Gourley, L.; Wind, C.; Henninger, E.M.; Chinitz, S. Sensory Processing Difficulties, Behavioral Problems, and Parental Stress in a Clinical Population of Young Children. J. Child Fam. Stud. 2013, 22, 912–921. [Google Scholar] [CrossRef] [Green Version]
- Miller, L.J.; Nielsen, D.M.; Schoen, S.; Brett-Green, B.A. Perspectives on sensory processing disorder: A call for translational research. Front. Integr. Neurosci. 2009, 3, 3. [Google Scholar] [CrossRef] [Green Version]
- Galiana-Simal, A.; Vela-Romero, M.; Romero-Vela, V.M.; Oliver-Tercero, N.; García-Olmo, V.; Benito-Castellanos, P.J.; Muñoz-Martinez, V.; Beato-Fernandez, L. Sensory processing disorder: Key points of a frequent alteration in neurodevelopmental disorders. Cogent Med. 2020, 7. [Google Scholar] [CrossRef]
- Butera, C.; Ring, P.; Sideris, J.; Jayashankar, A.; Kilroy, E.; Harrison, L.; Cermak, S.; Aziz-Zadeh, L. Impact of Sensory Processing on School Performance Outcomes in High Functioning Individuals with Autism Spectrum Disorder. Mind Brain Educ. 2020, 14, 243–254. [Google Scholar] [CrossRef]
- Baranek, G.T.; David, F.J.; Poe, M.D.; Stone, W.L.; Watson, L.R. Sensory Experiences Questionnaire: Discriminating sensory features in young children with autism, developmental delays, and typical development. J. Child Psychol. Psychiatry 2006, 47, 591–601. [Google Scholar] [CrossRef] [PubMed]
- Dunn, W. The Sensations of Everyday Life: Empirical, Theoretical, and Pragmatic Considerations. Am. J. Occup. Ther. 2001, 55, 608–620. [Google Scholar] [CrossRef] [PubMed] [Green Version]
- Ismael, N.; Lawson, L.M.; Hartwell, J. Relationship Between Sensory Processing and Participation in Daily Occupations for Children with Autism Spectrum Disorder: A Systematic Review of Studies That Used Dunn’s Sensory Processing Framework. Am. J. Occup. Ther. 2018, 72. [Google Scholar] [CrossRef]
- Schaaf, R.C.; Mailloux, Z. Clinician’s Guide for Implementing Ayres Sensory Integration: Promoting Participation for Children with Autism; AOTA Press: Bethesda, MD, USA, 2015; ISBN 978-1-56900-365-7. [Google Scholar]
- Mulligan, S.; A Schoen, S.; Miller, L.J.; Valdez, A.; Magalhaes, D. The Sensory Processing 3-Dimensions Scale: Initial Studies of Reliability and Item Analyses. Open J. Occup. Ther. 2019, 7, 4. [Google Scholar] [CrossRef] [Green Version]
- APA. Diagnostic and Statistical Manual of Mental Disorders, 5th ed.; American Psychiatric Association: Washington, DC, USA, 2013; p. 5. [Google Scholar]
- Bölte, S.; Girdler, S.; Marschik, P.B. The contribution of environmental exposure to the etiology of autism spectrum disorder. Cell. Mol. Life Sci. 2019, 76, 1275–1297. [Google Scholar] [CrossRef] [Green Version]
- Steinman, G.; Mankuta, D. Molecular biology of autism’s etiology—An alternative mechanism. Med. Hypotheses 2019, 130, 109–272. [Google Scholar] [CrossRef]
- Linke, A.C.; Keehn, R.J.J.; Pueschel, E.B.; Fishman, I.; Müller, R.-A. Children with ASD show links between aberrant sound processing, social symptoms, and atypical auditory interhemispheric and thalamocortical functional connectivity. Dev. Cogn. Neurosci. 2018, 29, 117–126. [Google Scholar] [CrossRef]
- Chang, Y.-S.; Owen, J.P.; Desai, S.S.; Hill, S.S.; Arnett, A.B.; Harris, J.; Marco, E.J.; Mukherjee, P. Autism and Sensory Processing Disorders: Shared White Matter Disruption in Sensory Pathways but Divergent Connectivity in Social-Emotional Pathways. PLoS ONE 2014, 9, e103038. [Google Scholar] [CrossRef]
- Schaaf, R.C.; Lane, A.E. Toward a Best-Practice Protocol for Assessment of Sensory Features in ASD. J. Autism Dev. Disord. 2015, 45, 1380–1395. [Google Scholar] [CrossRef] [PubMed]
- Posar, A.; Visconti, P. Sensory abnormalities in children with autism spectrum disorder. J. Pediatr. 2018, 94, 342–350. [Google Scholar] [CrossRef]
- Marco, E.J.; Hinkley, L.B.N.; Hill, S.S.; Nagarajan, S.S. Sensory Processing in Autism: A Review of Neurophysiologic Findings. Pediatr. Res. 2011, 69, 48R–54R. [Google Scholar] [CrossRef] [PubMed]
- Suarez, M.A. Sensory Processing in Children with Autism Spectrum Disorders and Impact on Functioning. Pediatr. Clin. North Am. 2012, 59, 203–214. [Google Scholar] [CrossRef] [PubMed]
- Glod, M.; Riby, D.M.; Rodgers, J. Sensory processing profiles and autistic symptoms as predictive factors in autism spectrum disorder and Williams syndrome. J. Intellect. Disabil. Res. 2020, 64, 657–665. [Google Scholar] [CrossRef] [PubMed]
- Schoen, S.; Lane, S.J.; Mailloux, Z.; May-Benson, T.; Parham, L.D.; Roley, S.S.; Schaaf, R.C. A systematic review of ayres sensory integration intervention for children with autism. Autism Res. 2019, 12, 6–19. [Google Scholar] [CrossRef] [PubMed]
- Bodison, S.C.; Parham, L.D. Specific Sensory Techniques and Sensory Environmental Modifications for Children and Youth with Sensory Integration Difficulties: A Systematic Review. Am. J. Occup. Ther. 2017, 72, 72011–90040. [Google Scholar] [CrossRef]
- Ben-Sasson, A.; Hen, L.; Fluss, R.; Cermak, S.A.; Engel-Yeger, B.; Gal, E. A Meta-Analysis of Sensory Modulation Symptoms in Individuals with Autism Spectrum Disorders. J. Autism Dev. Disord. 2009, 39, 1–11. [Google Scholar] [CrossRef]
- Di Renzo, M.; Di Castelbianco, F.B.; Vanadia, E.; Petrillo, M.; Racinaro, L.; Rea, M. Sensory Processing and Repetitive Behaviors in Clinical Assessment of Preschool Children with Autism Spectrum Disorder. J. Child Adolesc. Behav. 2017, 5, 5. [Google Scholar] [CrossRef] [Green Version]
- Dakopolos, A.J.; Jahromi, L.B. Differences in sensory responses among children with autism spectrum disorder and typical development: Links to joint attention and social competence. Infant Child Dev. 2018, 28, e2117. [Google Scholar] [CrossRef] [Green Version]
- Thye, M.D.; Bednarz, H.M.; Herringshaw, A.J.; Sartin, E.B.; Kana, R.K. The impact of atypical sensory processing on social impairments in autism spectrum disorder. Dev. Cogn. Neurosci. 2018, 29, 151–167. [Google Scholar] [CrossRef] [PubMed]
- Miller, M.; Chukoskie, L.; Zinni, M.; Townsend, J.; Trauner, D. Dyspraxia, motor function and visual–motor integration in autism. Behav. Brain Res. 2014, 269, 95–102. [Google Scholar] [CrossRef] [PubMed] [Green Version]
- Kaur, M.; Srinivasan, S.M.; Bhat, A.N. Comparing motor performance, praxis, coordination, and interpersonal synchrony between children with and without Autism Spectrum Disorder (ASD). Res. Dev. Disabil. 2018, 72, 79–95. [Google Scholar] [CrossRef] [PubMed]
- Günal, A.; Bumin, G.; Huri, M. The Effects of Motor and Cognitive Impairments on Daily Living Activities and Quality of Life in Children with Autism. J. Occup. Ther. Sch. Early Interv. 2019, 12, 444–454. [Google Scholar] [CrossRef]
- Wong, C.; Odom, S.L.; Hume, K.A.; Cox, A.W.; Fettig, A.; Kucharczyk, S.; Brock, M.E.; Plavnick, J.B.; Fleury, V.P.; Schultz, T.R. Evidence-Based Practices for Children, Youth, and Young Adults with Autism Spectrum Disorder: A Comprehensive Review. J. Autism Dev. Disord. 2015, 45, 1951–1966. [Google Scholar] [CrossRef]
- Jorquera-Cabrera, S.; Romero-Ayuso, D.; Rodriguez-Gil, G.; Triviño-Juárez, J.-M. Assessment of Sensory Processing Characteristics in Children between 3 and 11 Years Old: A Systematic Review. Front. Pediatr. 2017, 5, 57. [Google Scholar] [CrossRef] [Green Version]
- Eeles, A.L.; Spittle, A.J.; Anderson, P.J.; Brown, N.; Lee, K.J.; Boyd, R.; Doyle, L.W. Assessments of sensory processing in infants: A systematic review. Dev. Med. Child Neurol. 2012, 55, 314–326. [Google Scholar] [CrossRef] [Green Version]
- Burns, C.O.; Dixon, D.R.; Novack, M.; Granpeesheh, D. A Systematic Review of Assessments for Sensory Processing Abnormalities in Autism Spectrum Disorder. Rev. J. Autism Dev. Disord. 2017, 4, 209–224. [Google Scholar] [CrossRef]
- Dubois, D.; Lymer, E.; Gibson, B.E.; Desarkar, P.; Nalder, E.J. Assessing Sensory Processing Dysfunction in Adults and Adolescents with Autism Spectrum Disorder: A Scoping Review. Brain Sci. 2017, 7, 108. [Google Scholar] [CrossRef]
- Yeung, L.H.J.; Thomacos, N. Assessments of sensory processing in infants and children with autism spectrum disorder between 0–12 years old: A scoping review. Res. Autism Spectr. Disord. 2020, 72, 101517. [Google Scholar] [CrossRef]
- Dunn, W. Sensory Profile User’s Manual; Pearson Psychcop: San Antonio, TX, USA, 1999. [Google Scholar]
- Dunn, W. Sensory Profile 2 Manual; Pearson Psychcop: San Antonio, TX, USA, 2014. [Google Scholar]
- Parham, L.D.; Ecker, C.; Miller Kuhaneck, H.; Henry, D.A.; Glennon, T.J. Sensory Processing Measure (SPM): Manual; Western Psychological Services: Los Angeles, CA, USA, 2007. [Google Scholar]
- Mulligan, S.; Schoen, S.; Miller, L. Scientific Research Panel 304C Reliability and Item Analyses of the Sensory Processing 3-Dimensions Scale. Am. J. Occup. Ther. 2018, 72, 7211500055. [Google Scholar] [CrossRef]
- Mailloux, Z.; Parham, L.D.; Roley, S.S.; Ruzzano, L.; Schaaf, R.C. Introduction to the Evaluation in Ayres Sensory Integration® (EASI). Am. J. Occup. Ther. 2017, 72, 72011–95030. [Google Scholar] [CrossRef]
- Petrocchi, S.; Levante, A.; Lecciso, F. Systematic Review of Level 1 and Level 2 Screening Tools for Autism Spectrum Disorders in Toddlers. Brain Sci. 2020, 10, 180. [Google Scholar] [CrossRef] [Green Version]
- Towle, P.O.; Patrick, P.A. Autism Spectrum Disorder Screening Instruments for Very Young Children: A Systematic Review. Autism Res. Treat. 2016, 2016, 1–29. [Google Scholar] [CrossRef] [Green Version]
- Payakachat, N.; Tilford, J.M.; Kovacs, E.; Kuhlthau, K. Autism spectrum disorders: A review of measures for clinical, health services and cost–effectiveness applications. Expert Rev. Pharm. Outcomes Res. 2012, 12, 485–503. [Google Scholar] [CrossRef] [Green Version]
- Randall, M.; Egberts, K.J.; Samtani, A.; Scholten, R.J.; Hooft, L.; Livingstone, N.; Sterling-Levis, K.; Woolfenden, S.; Williams, K. Diagnostic tests for autism spectrum disorder (ASD) in preschool children. Cochrane Database Syst. Rev. 2018, 7, CD009044. [Google Scholar] [CrossRef] [Green Version]
- Rivière, Á. Tratamiento y Definición del Espectro Autista. In Tratamiento del Autismo. Nuevas Perspectivas; Instituto de Migraciones y Servicios Sociales: Madrid, Spain, 1998; ISBN 84-88986-70-X. [Google Scholar]
- Rivière, A. IDEA: Inventario de Espectro Autista; Fundec: Buenos Aires, Argentina, 2002. [Google Scholar]
- García-Gómez, A. A proposal of three additional dimensions to the Rivière’s Autism Spectrum Inventory. Psicol. Educ. in press. [CrossRef]
- Williams, Z.J.; Failla, M.D.; Gotham, K.O.; Woynaroski, T.G.; Cascio, C. Psychometric Evaluation of the Short Sensory Profile in Youth with Autism Spectrum Disorder. J. Autism Dev. Disord. 2018, 48, 4231–4249. [Google Scholar] [CrossRef]
- Dunn, W. Perfil Sensorial 2 Breve; Adaptación Española; Pearson Psychcop: Madrid, Spain, 2016; ISBN 978-84-9035-547-3. [Google Scholar]
- Ferrando, P.J.; Lorenzo-Seva, U. Program FACTOR at 10: Origins, development and future directions. Psicothema 2017, 29, 236–240. [Google Scholar]
- Lorenzo-Seva, U.; Ferrando, P.J. Factor: A computer program to fit the exploratory factor analysis model. Behav. Res. Methods 2006, 38, 88–91. [Google Scholar] [CrossRef] [Green Version]
- Manual of the Program. Available online: http://psico.fcep.urv.es/utilitats/factor/documentation/Manual-of-the-Factor-Program-v92.pdf (accessed on 20 August 2020).
- Timmerman, M.E.; Lorenzo-Seva, U. Dimensionality assessment of ordered polytomous items with parallel analysis. Psychol. Methods 2011, 16, 209–220. [Google Scholar] [CrossRef] [PubMed]
- Arbuckle, J. Amos 24.0 User’s Guide; IBM SPSS: Chicago, IL, USA, 2015. [Google Scholar]
- Flora, D.B.; LaBrish, C.; Chalmers, R.P. Old and New Ideas for Data Screening and Assumption Testing for Exploratory and Confirmatory Factor Analysis. Front. Psychol. 2012, 3, 3. [Google Scholar] [CrossRef] [Green Version]
- Lloret-Segura, S.; Ferreres-Traver, A.; Hernández-Baeza, A.; Tomás-Marco, I. Exploratory Item Factor Analysis: A practical guide revised and updated. An. Psicol. 2014, 30, 1151–1169. [Google Scholar] [CrossRef]
- Ferrando, P.J.; Anguiano-Carrasco, C. Factor analysis as a research technique in psychology. Pap. Psicólogo 2010, 31, 18–33. [Google Scholar]
- Byrne, B.M. A Primer of LISREL. In Texto original: Basic Applications and Programming for Confirmatory Factor Analytic Models; Springer: New York, NY, USA, 1989; ISBN 978-1-4613-8887-6. [Google Scholar]
- Hu, L.-T.; Bentler, P.M. Cutoff criteria for fit indexes in covariance structure analysis: Conventional criteria versus new alternatives. Struct. Equ. Model. Multidiscip. J. 1999, 6, 1–55. [Google Scholar]
- Hair, J.F. Multivariate Data Analysis: A Global Perspective; Pearson Education: London, UK, 2010; ISBN 978-0-13-515309-3. [Google Scholar]
- Browne, M.W.; Cudeck, R. Alternative Ways of Assessing Model Fit. Sociol. Methods Res. 1992, 21, 230–258. [Google Scholar] [CrossRef]
- Gadermann, A.M.; Guhn, M.; Zumbo, B.D. Ordinal Alpha. Encycl. Qual. Life Well Being Res. 2014, 4513–4515. [Google Scholar] [CrossRef]
- Oliden, P.E.; Zumbo, B.D. Reliability coefficients for ordinal response scales. Psicothema 2008, 20, 896–901. [Google Scholar]
- Pallant, J. SPSS Survival Manual: A Step by Step Guide to Data Analysis Using IBM SPSS, 5th ed.; McGraw Hill: Berkshire, UK, 2013; ISBN 978-0-335-26258-8. [Google Scholar]
- IBM Corp IBM SPSS Statistics for Windows, Version 24.0. Available online: https://he02.tci-thaijo.org/index.php/ramajournal/statistical_software_references_format (accessed on 22 August 2020).
- Cohen, J. Statistical Power Analysis for the Behavioral Sciences. Lawrence Earlbaum Associates Hillsdale, NJ, USA. Available online: http://www.utstat.toronto.edu/~brunner/oldclass/378f16/readings/CohenPower.pdf (accessed on 15 October 2020).
- Jöreskog, K.G.; Sörbom, D. LISREL 8: Structural Equation Modeling with the SIMPLIS Command Language; Scientific Software International: Lincolnwood, IL, USA, 1993; ISBN 978-0-89498-033-6. [Google Scholar]
- Salgado, J.F. Transforming the Area under the Normal Curve (AUC) into Cohen’s d, Pearson’s r pb, Odds-Ratio, and Natural Log Odds-Ratio: Two Conversion Tables. Eur. J. Psychol. Appl. Leg. Context 2018, 10, 35–47. [Google Scholar] [CrossRef] [Green Version]
- Roley, S.S.; Blanche, E.I.; Schaaf, R.C. Understanding the Nature of Sensory Integration with Diverse Populations; PRO-ED: Indianapolis, IN, USA, 2007; ISBN 978-1-4164-0332-6. [Google Scholar]
- Schoen, S.; Miller, L.J.; Sullivan, J.C. Measurement in Sensory Modulation: The Sensory Processing Scale Assessment. Am. J. Occup. Ther. 2014, 68, 522–530. [Google Scholar] [CrossRef] [Green Version]
- Ministerio de Sanidad, Servicios Sociales e Igualdad. Salud Mental y Calidad de Vida en la Población Infantil; Serie Informes Monográficos no2; Ministerio de Sanidad, Servicios Sociales e Igualdad: Madrid, Spain, 2014.
- Van Gameren-Oosterom, H.B.; Van Dommelen, P.; Schönbeck, Y.; Oudesluys-Murphy, A.M.; Van Wouwe, J.P.; Buitendijk, S.E. Prevalence of Overweight in Dutch Children with Down Syndrome. Pediatrics 2012, 130, e1520–e1526. [Google Scholar] [CrossRef] [PubMed] [Green Version]
Figure 1.
Summary of Rivière’s Autism Spectrum Inventory [60,61]. Disease groups from I–IV with their 12 dimensions correspond to Rivière’s original version. The V scale with the dimensions 13–15 was added by García-Gómez [62]. Preferred scores for rating the Inventory are the even ones, while odd scores are used to describe intermediate stages.

Figure 2.
The Behavioral Observation on Sensory Stimuli Questionnaire for Parents’ (BOSS-P) graphical representation after confirmatory factor analysis (CFA).
Figure 2.
The Behavioral Observation on Sensory Stimuli Questionnaire for Parents’ (BOSS-P) graphical representation after confirmatory factor analysis (CFA).

Figure 3.
Graphical representation (a) and statistics (b) from the receiver operating characteristic (ROC) curves.
Figure 3.
Graphical representation (a) and statistics (b) from the receiver operating characteristic (ROC) curves.


Table 1.
Rotated factorial matrix and factorial weights of each item.
| Items | F1 | F2 | F3 |
|---|---|---|---|
| 1. Shows disproportionate reactions if touched. | 0.491 | ||
| 2. Shows panic reactions to loud noises. | 0.624 | ||
| 3. Shows rejection of water when showering or washing. | 0.340 | ||
| 4. He is bothered by noisy and crowded places. | 0.829 | ||
| 5. When something goes wrong, it takes a long time to calm down. | 0.566 | ||
| 6. Shows discomfort with activities that involve spinning. | 0.507 | ||
| 7. Cannot concentrate or perform tasks when background noise. | 0.627 | ||
| 8. He gets agitated in the presence of very powerful light sources. | 0.760 | ||
| 9. Frequently touches or puts body parts or objects in his mouth. | 0.394 | ||
| 10. He is bothered with strong smells. | 0.702 | ||
| 11. Some clothes bother him; he feels itchy about some fabrics. | 0.730 | ||
| 12. He dislikes personal hygiene or grooming activities. | 0.452 | ||
| 13. Quick movements are unpleasant for him. | 0.643 | ||
| 14. Attends to his name or when he is called. | 0.492 | ||
| 15. Communicates feelings aimed at satisfying basic needs. | 0.620 | ||
| 16. Realizes when he is tired or exhausted. | 0.639 | ||
| 17. Shows comfort when hugged by parents or close relatives. | 0.837 | ||
| 18. Shows satisfaction when basic needs are met | 0.959 | ||
| 19. When he is disconsolate, he gets calmed by his parents. | 0.720 | ||
| 20. Expresses enjoyment or feels comfortable in certain situations. | 0.897 | ||
| 21. Can perceive danger in situations that could harm. | 0.475 | ||
| 22. Can identify basic emotions in himself and others. | 0.442 | ||
| 23. Can orientate himself in the environment. | 0.418 | ||
| 24. Notices that his heart is racing when he is tired or excited. | 0.522 | ||
| 25. Recognizes the elements that make him nervous. | 0.578 | ||
| 26. Has difficulty in recognizing people’s faces. | 0.374 | ||
| 27. Has difficulty identifying parts of his own body. | 0.655 | ||
| 28. Presents inability to reproduce speech movements. | 0.737 | ||
| 29. Can ride a bicycle, rollerblades or a skateboard. | 0.623 | ||
| 30. Can perform simple motor imitations. | 0.724 | ||
| 31. Can fasten buttons or make loops to get dressed. | 0.927 | ||
| 32. Can stack small blocks or string beads on a string. | 0.569 | ||
| 33. Can use cutlery with both hands. | 0.634 | ||
| 34. Can make copies from simple drawings. | 0.930 | ||
| 35. Shows clumsiness in typing or using the computer keyboard. | 0.814 | ||
| 36. Shows insecurity going downstairs/hills, holds on to railings. | 0.485 | ||
| 37. Can adjust his strength when grasping objects. | 0.452 | ||
| 38. Can cut with scissors properly for his age. | 0.929 | ||
| 39. Can draw or colour within the proposed margins. | 0.924 | ||
| 40. Can follow motor imitations containing multiple steps. | 0.892 | ||
| 41. Can complete drawings with one half of it missing. | 0.930 |
(F1) Modulation disorders; (F2) discrimination disorders; and (F3) sensory-based motor disorders. Items translated for readability; no cross-cultural adaptation performed.
Table 2.
BOSS-P goodness-of-fit indices from the confirmatory factor analysis (CFA).
| Indices | Cut-Off | Value |
|---|---|---|
| CMIN/DF | <2 | 1.995 |
| p (χ2) | >0.05 | 0.000 |
| TLI | >0.90 | 0.912 |
| CFI | >0.90 | 0.925 |
| RMSEA | <0.06 | 0.047 (0.043–0.051) |
| RMSR | <0.08 | 0.071 |
p (χ2): chi-squared probability; CFI: comparative fit index; NNFI: non-normed fit index, RMSEA: root mean square error of approximation; RMSR: root mean square of residuals.
Table 3.
Correlation matrix between the Behavioral Observation on Sensory Stimuli Questionnaire for Parents (BOSS-P) and the Short Sensory Profile 2 (SP2).
Table 3.
Correlation matrix between the Behavioral Observation on Sensory Stimuli Questionnaire for Parents (BOSS-P) and the Short Sensory Profile 2 (SP2).
| BOSS-P | SP2 | ||||||
|---|---|---|---|---|---|---|---|
| F1 | F2 | F3 | Total | Sensory | Behavioral | Total | |
| F1 | 1 | ||||||
| F2 | −0.076 | 1 | |||||
| F3 | −0.134 | 0.297 | 1 | ||||
| Total | 0.438 * | 0.636 ** | 0.701 ** | 1 | |||
| Sensory | 0.448 * | 0.084 | 0.027 | 0.309 | 1 | ||
| Behaviour | 0.600 ** | 0.034 | 0.147 | 0.446 * | 0.613 ** | 1 | |
| total | 0.590 ** | 0.063 | 0.103 | 0.426 * | 0.879 ** | 0.915 ** | 1 |
*. Correlation is significant at the 0.05 level (2-tailed). **. Correlation is significant at the 0.01 level (2-tailed) F1 = Modulation Disorders factor; F2 = Discrimination Disorders factor; F3 = Sensory-Based Motor Disorders factor; Sensory = Sensory Processing; Behavioral = Behavioral Responses associated with Sensory Processing.
Table 4.
Descriptive statistics of ASD and typical development samples.
| Autism Spectrum Disorder | Typical Development | |||||||
|---|---|---|---|---|---|---|---|---|
| F1 | F2 | F3 | Total | F1 | F2 | F3 | Total | |
| x | 33.8 | 31.9 | 40.3 | 106 | 24.8 | 20.5 | 23.1 | 68.4 |
| SD | 8.9 | 8.0 | 11.9 | 19 | 7.7 | 5.5 | 7.8 | 16.0 |
x: mean; SD: standard deviation.
Table 5.
Combination of the level of affectation in the Rivière’s Inventory and the Behavioral Observation on Sensory Stimuli Questionnaire for Parents’ (BOSS-P) interquartile scores.
Table 5.
Combination of the level of affectation in the Rivière’s Inventory and the Behavioral Observation on Sensory Stimuli Questionnaire for Parents’ (BOSS-P) interquartile scores.
| BOSS-P | ||||
|---|---|---|---|---|
| F1 | F2 | F3 | ||
| Rivière’s inventory levels of severity | 1 (8 points) | >40 | >36 | >50 |
| 2 (6 points) | 34–40 | 30–36 | 40–50 | |
| 3 (4 points) | 27–34 | 27–30 | 31.5–40 | |
| 4 (2 points) | <27 | <27 | <31.5 |
F1 = modulation disorders factor; F2 = discrimination disorders factor; F3 = sensory-based motor disorders factor.
Publisher’s Note: MDPI stays neutral with regard to jurisdictional claims in published maps and institutional affiliations. |
© 2020 by the authors. Licensee MDPI, Basel, Switzerland. This article is an open access article distributed under the terms and conditions of the Creative Commons Attribution (CC BY) license (http://creativecommons.org/licenses/by/4.0/).
Share and Cite
MDPI and ACS Style
Barrios-Fernández, S.; Gozalo, M.; Díaz-González, B.; García-Gómez, A. A Complementary Sensory Tool for Children with Autism Spectrum Disorders. Children 2020, 7, 244. https://0-doi-org.brum.beds.ac.uk/10.3390/children7110244
AMA Style
Barrios-Fernández S, Gozalo M, Díaz-González B, García-Gómez A. A Complementary Sensory Tool for Children with Autism Spectrum Disorders. Children. 2020; 7(11):244. https://0-doi-org.brum.beds.ac.uk/10.3390/children7110244
Chicago/Turabian StyleBarrios-Fernández, Sabina, Margarita Gozalo, Beatriz Díaz-González, and Andrés García-Gómez. 2020. "A Complementary Sensory Tool for Children with Autism Spectrum Disorders" Children 7, no. 11: 244. https://0-doi-org.brum.beds.ac.uk/10.3390/children7110244
Note that from the first issue of 2016, this journal uses article numbers instead of page numbers. See further details here.