
The Feasibility of Studying Metabolites in PICU Multi-Organ Dysfunction Syndrome Patients over an 8-Day Course Using an Untargeted Approach

 , , and
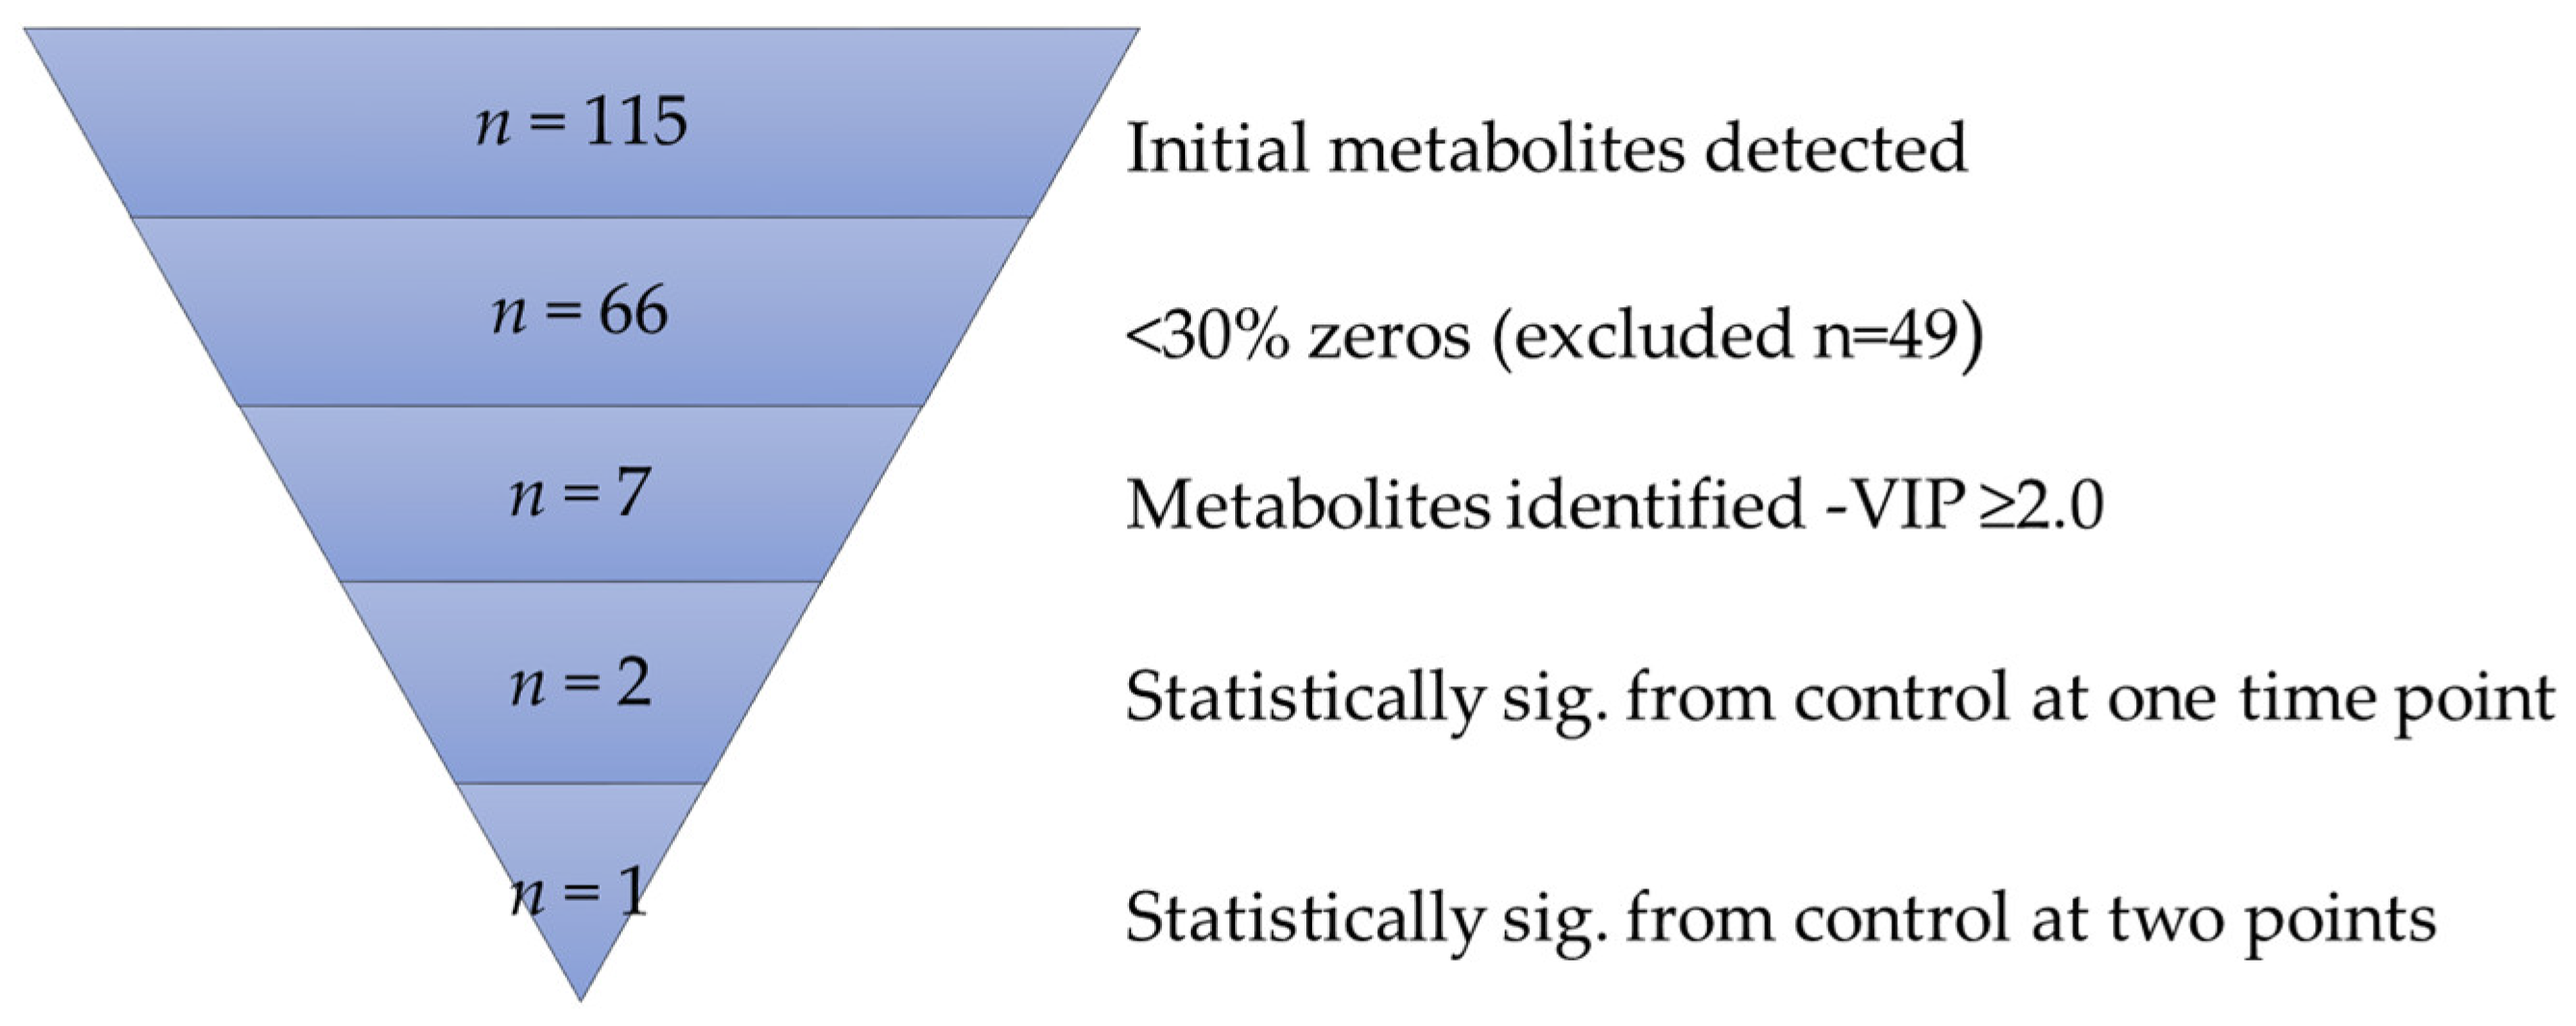
Abstract
:1. Introduction
2. Materials and Methods
2.1. Study Population, Site, and Sample Collection
2.2. Metabolite Extraction and Liquid Chromatography-Mass Spectrometry (LC-MS)
2.3. Data Analysis
3. Results
3.1. Metabolite Ontology and Origin
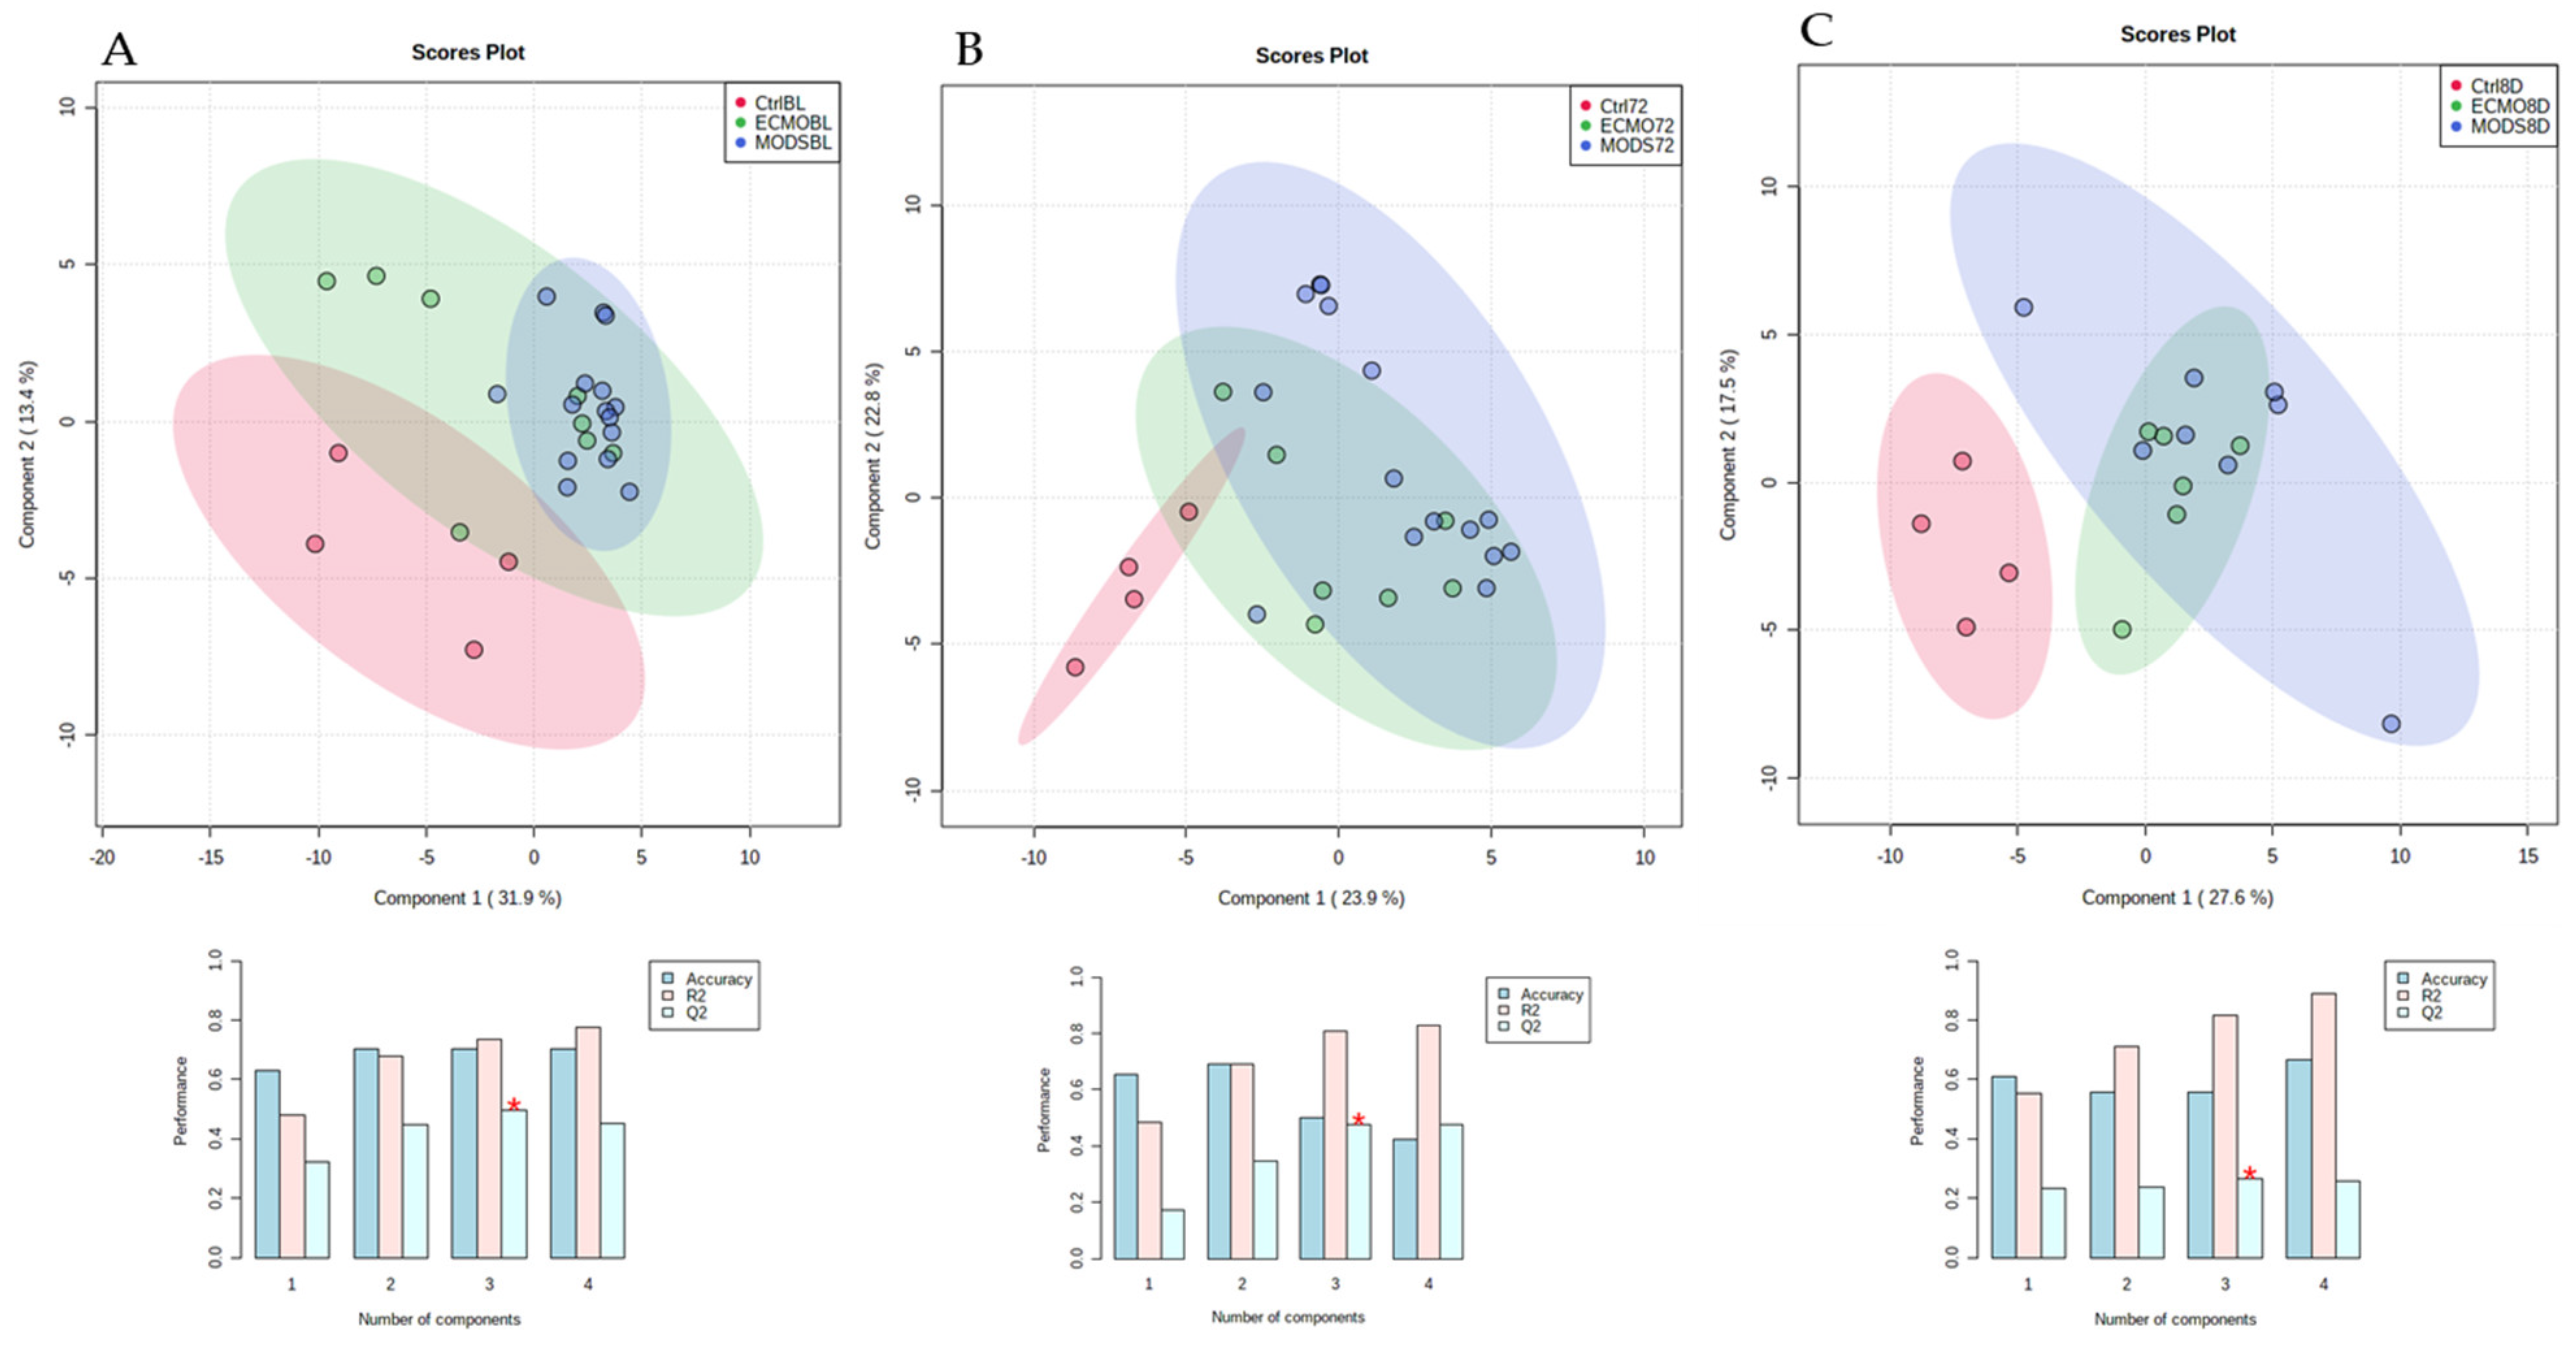
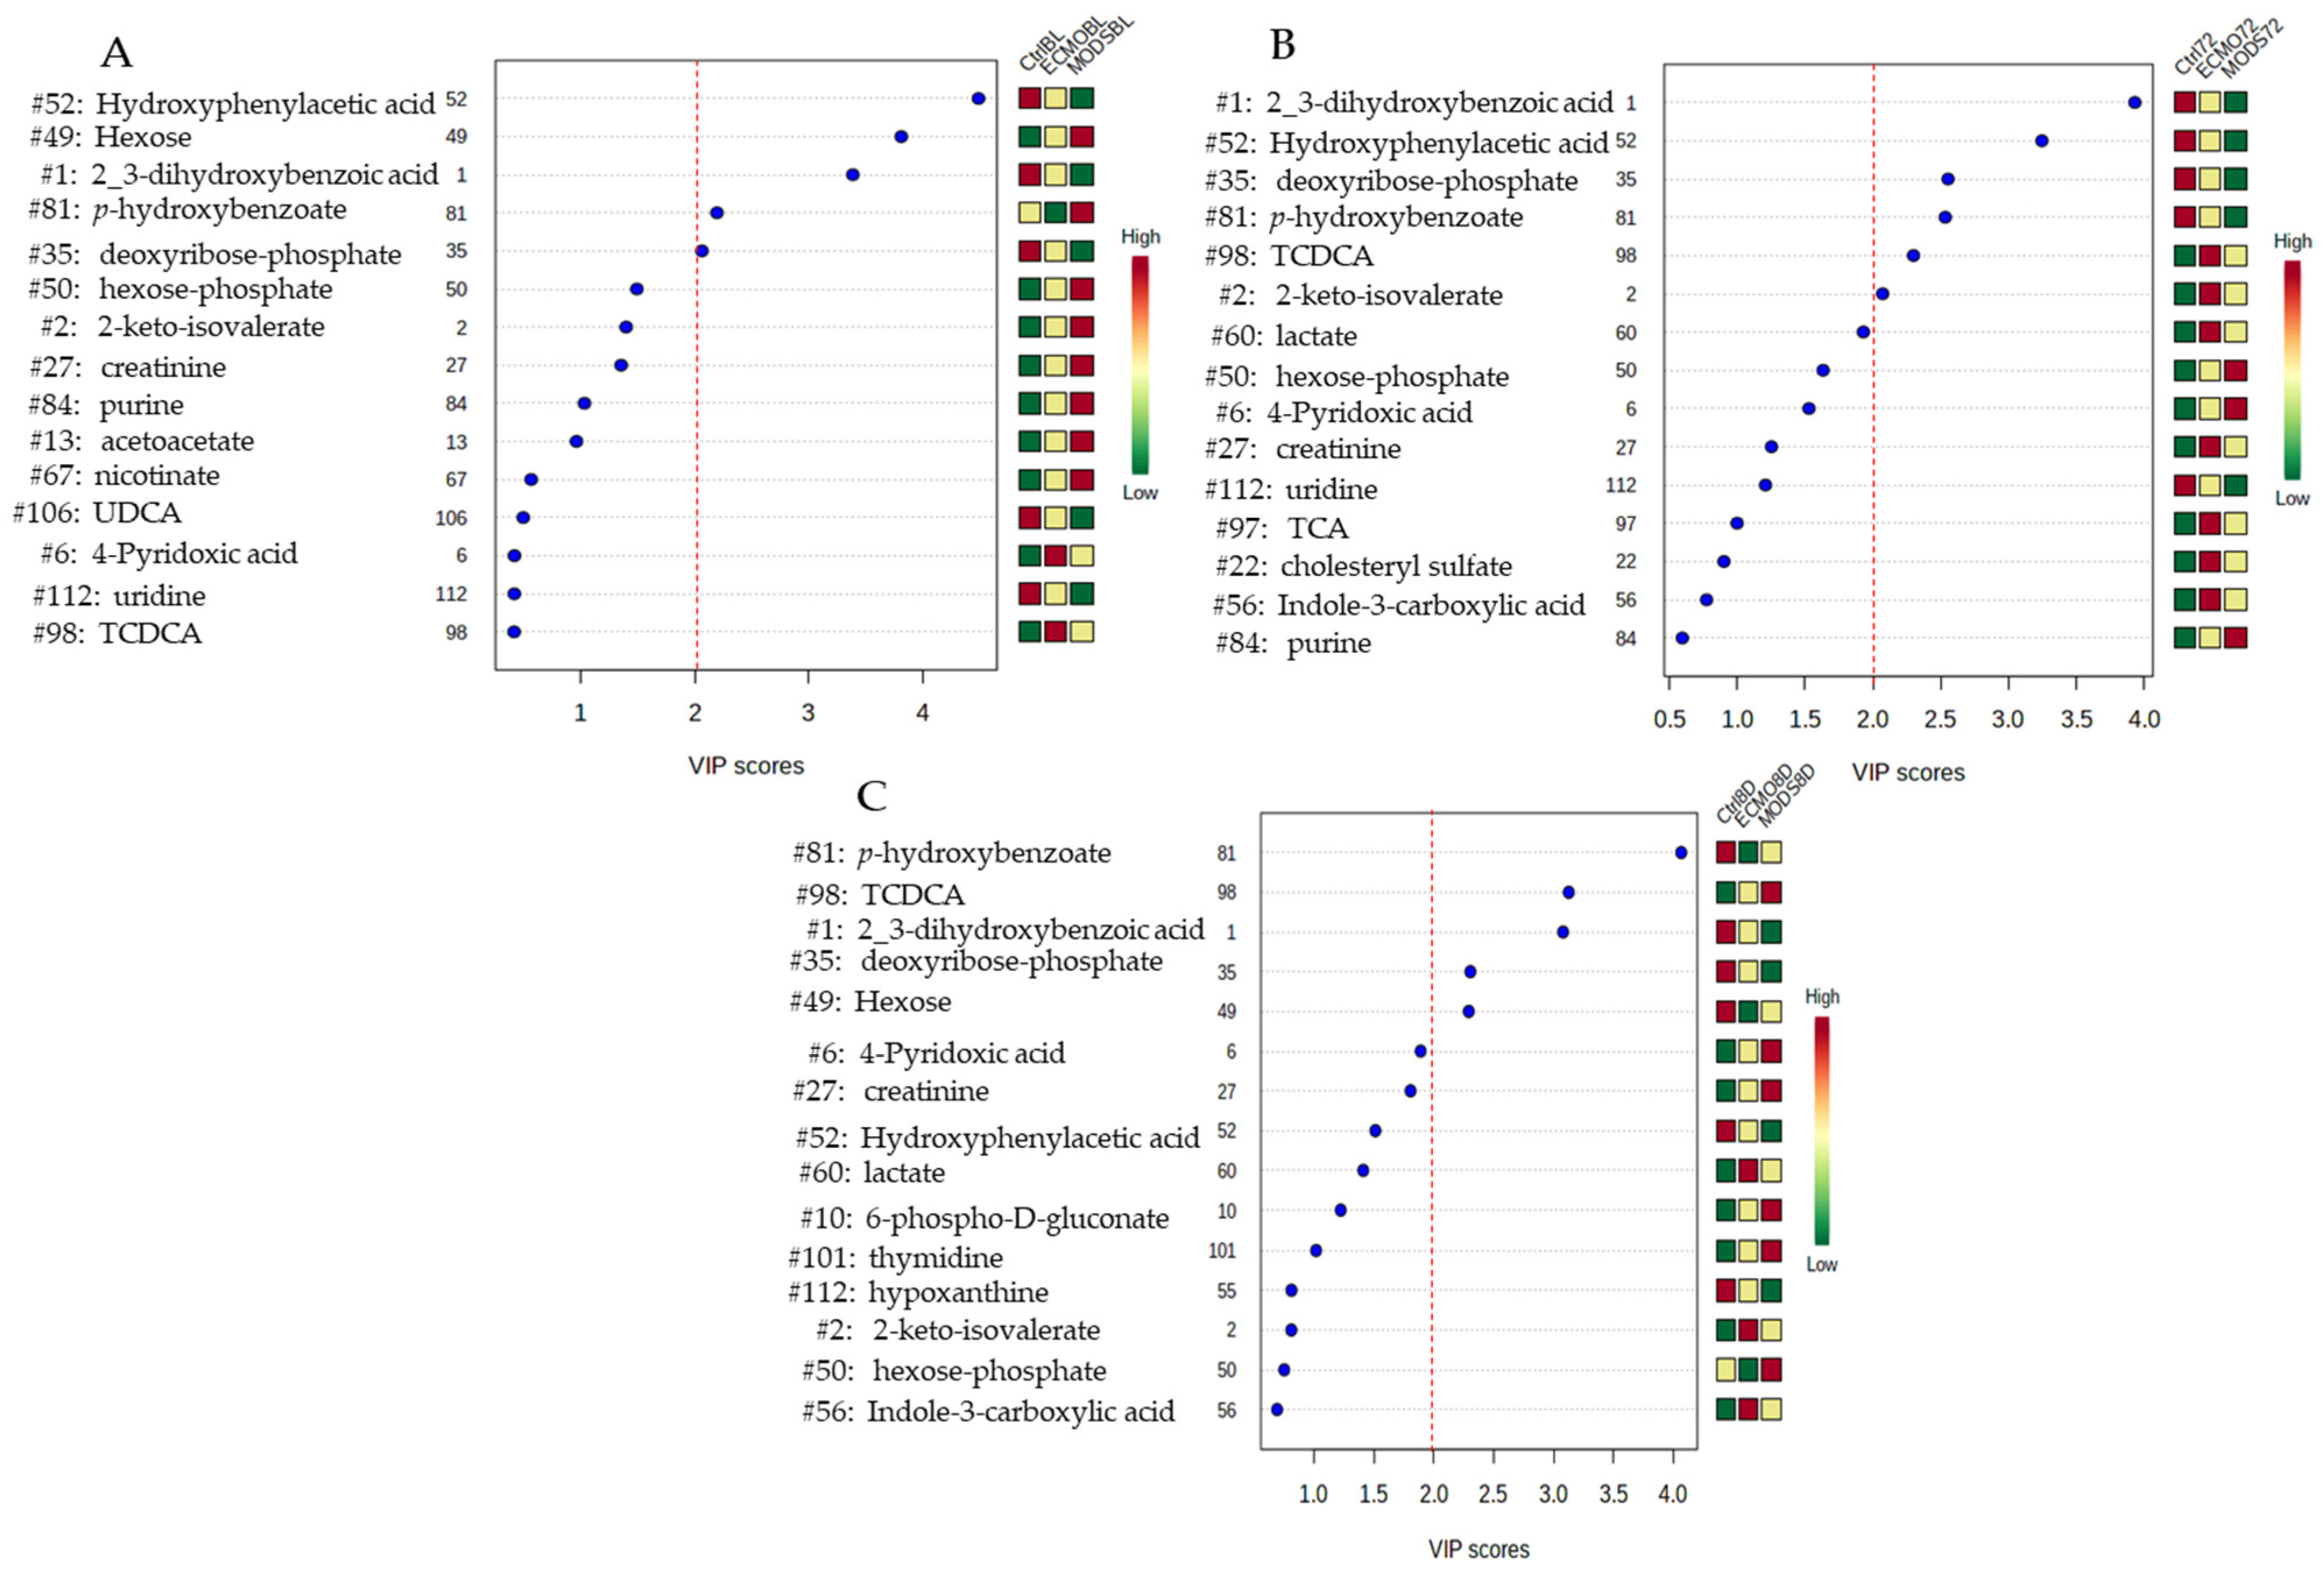
3.2. Bioinformatic Analysis
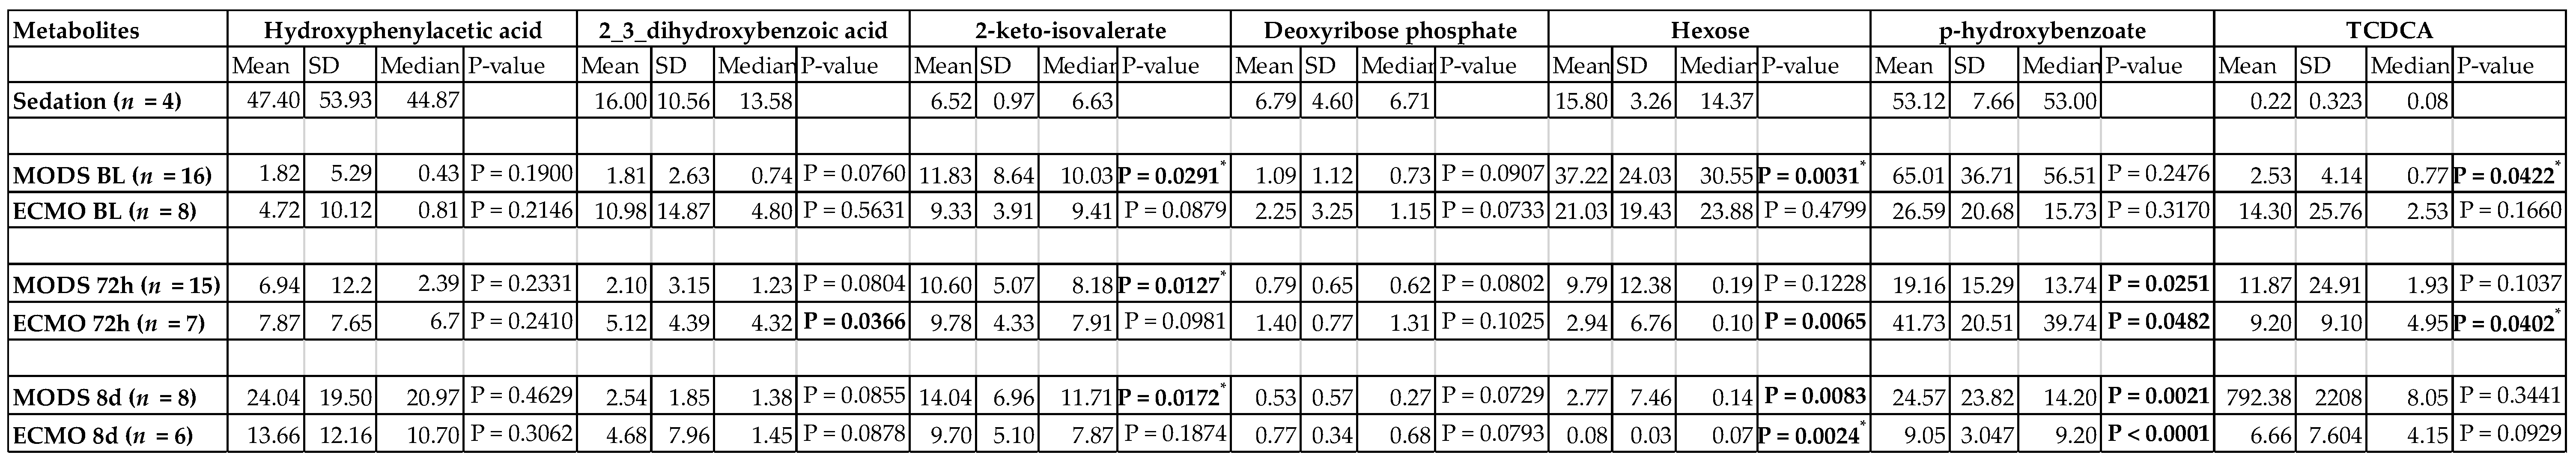
3.3. Repeated Measures over Three Time Points
3.4. Internal Validation
4. Discussion
5. Conclusions
Supplementary Materials
Author Contributions
Funding
Institutional Review Board Statement
Informed Consent Statement
Data Availability Statement
Acknowledgments
Conflicts of Interest
Abbreviations
| HMDB | Human Metabolite Data Base |
| HPLA | hyroxyphenylacetic acid |
| HPLC | high-performance liquid chromatography |
| LC-MS | Liquid chromatography–mass spectrometry |
| MODS | multi-organ dysfunction syndrome |
| PICU | pediatric intensive care unit |
| PLS-DA | partial least squares-discriminant analysis |
| VA-ECMO | veno-atrial extracorporeal membrane oxygenation |
| VIP | variance of importance |
| TCDCA | tauro-chenodeoxycholic acid |
References
- Leimanis Laurens, M.L.; Kraus-Friedberg, C.; Kar, W.; Sanfilippo, D.; Rajasekaran, S.; Comstock, S.S. Dietary Intake Influences Metabolites in Infants: A Scoping Review. Nutrients 2020, 12, 2073. [Google Scholar] [CrossRef] [PubMed]
- Shen, B.; Yi, X.; Sun, Y.; Bi, X.; Du, J.; Zhang, C.; Quan, S.; Zhang, F.; Sun, R.; Qian, L.; et al. Proteomic and Metabolomic Characterization of COVID-19 Patient Sera. Cell 2020, 182, 59–72. [Google Scholar] [CrossRef] [PubMed]
- Kyle, J.E.; Burnum-Johnson, K.E.; Wendler, J.P.; Eisfeld, A.J.; Halfmann, P.J.; Watanabe, T.; Sahr, F.; Smith, R.D.; Kawaoka, Y.; Waters, K.M.; et al. Plasma lipidome reveals critical illness and recovery from human Ebola virus disease. Proc. Natl. Acad. Sci. USA 2019, 116, 3919–3928. [Google Scholar] [CrossRef] [Green Version]
- Louis, P.; Hold, G.L.; Flint, H.J. The gut microbiota, bacterial metabolites and colorectal cancer. Nat. Rev. Microbiol. 2014, 12, 661–672. [Google Scholar] [CrossRef]
- Lai, F.Y.; Erratico, C.; Kinyua, J.; Mueller, J.F.; Covaci, A.; van Nuijs, A.L. Liquid chromatography-quadrupole time-of-flight mass spectrometry for screening in vitro drug metabolites in humans: Investigation on seven phenethylamine-based designer drugs. J. Pharm. Biomed. Anal. 2015, 114, 355–375. [Google Scholar] [CrossRef] [Green Version]
- Reed, G.A. Stability of Drugs, Drug Candidates, and Metabolites in Blood and Plasma. Curr. Protoc. Pharmacol. 2016, 75. [Google Scholar] [CrossRef] [PubMed]
- Shin, S.Y.; Fauman, E.B.; Petersen, A.K.; Krumsiek, J.; Santos, R.; Huang, J.; Arnold, M.; Erte, I.; Forgetta, V.; Yang, T.P.; et al. An atlas of genetic influences on human blood metabolites. Nat. Genet. 2014, 46, 543–550. [Google Scholar] [CrossRef] [PubMed] [Green Version]
- Beger, R.D.; Dunn, W.; Schmidt, M.A.; Gross, S.S.; Kirwan, J.A.; Cascante, M.; Brennan, L.; Wishart, D.S.; Oresic, M.; Hankemeier, T.; et al. Metabolomics enables precision medicine: “A White Paper, Community Perspective”. Metabolomics 2016, 12, 149. [Google Scholar] [CrossRef] [PubMed] [Green Version]
- Wishart, D.S. Emerging applications of metabolomics in drug discovery and precision medicine. Nat. Rev. Drug Discov. 2016, 15, 473–484. [Google Scholar] [CrossRef]
- Prokop, J.W.; Shankar, R.; Gupta, R.; Leimanis, M.L.; Nedveck, D.; Uhl, K.; Chen, B.; Hartog, N.L.; Van Veen, J.; Sisco, J.S.; et al. Virus-induced genetics revealed by multidimensional precision medicine transcriptional workflow applicable to COVID-19. Physiol. Genom. 2020, 52, 255–268. [Google Scholar] [CrossRef] [PubMed]
- Shankar, R.; Leimanis, M.L.; Newbury, P.A.; Liu, K.; Xing, J.; Nedveck, D.; Kort, E.J.; Prokop, J.W.; Zhou, G.; Bachmann, A.S.; et al. Gene expression signatures identify paediatric patients with multiple organ dysfunction who require advanced life support in the intensive care unit. EBioMedicine 2020, 62, 103122. [Google Scholar] [CrossRef]
- Leimanis-Laurens, M.L.; Ferguson, K.; Wolfrum, E.; Boville, B.; Sanfilippo, D.; Lydic, T.; Prokop, J.; Rajasekaran, S. Pediatric Multi-Organ Dysfunction Syndrome: Analysis by an Untargeted Shotgun Lipidomic Approach Reveals Low-abundance Plasma Phospholipids and Dynamic Recovery Over 8-Day Period, a Single-Center Observational Study. medRxiv 2020. [Google Scholar] [CrossRef]
- Proulx, F.; Fayon, M.; Farrell, C.A.; Lacroix, J.; Gauthier, M. Epidemiology of sepsis and multiple organ dysfunction syndrome in children. Chest 1996, 109, 1033–1037. [Google Scholar] [CrossRef] [Green Version]
- Typpo, K.V.; Petersen, N.J.; Hallman, D.M.; Markovitz, B.P.; Mariscalco, M.M. Day 1 multiple organ dysfunction syndrome is associated with poor functional outcome and mortality in the pediatric intensive care unit. Pediatr. Crit. Care Med. 2009, 10, 562–570. [Google Scholar] [CrossRef] [PubMed]
- Typpo, K.; Watson, R.S.; Bennett, T.D.; Farris, R.W.D.; Spaeder, M.C.; Petersen, N.J.; Pediatric Existing Data Analysis Investigators; Pediatric Acute Lung Injury; Sepsis Investigators Network. Outcomes of Day 1 Multiple Organ Dysfunction Syndrome in the PICU. Pediatr. Crit. Care Med. 2019, 20, 914–922. [Google Scholar] [CrossRef] [PubMed]
- Brain, M.J.; Butt, W.W.; MacLaren, G. Physiology of Extracorporeal Life Support (ECLS). In Extracorporeal Life Support for Adults; Humana Press: New York, NY, USA, 2016; Volume 16, pp. 1–60. [Google Scholar]
- Busik, J.V.; Reid, G.E.; Lydic, T.A. Global analysis of retina lipids by complementary precursor ion and neutral loss mode tandem mass spectrometry. Methods Mol. Biol. 2009, 579, 33–70. [Google Scholar] [CrossRef] [Green Version]
- Luo, B.; Groenke, K.; Takors, R.; Wandrey, C.; Oldiges, M. Simultaneous determination of multiple intracellular metabolites in glycolysis, pentose phosphate pathway and tricarboxylic acid cycle by liquid chromatography-mass spectrometry. J. Chromatogr. A 2007, 1147, 153–164. [Google Scholar] [CrossRef]
- Clasquin, M.F.; Melamud, E.; Rabinowitz, J.D. LC-MS data processing with MAVEN: A metabolomic analysis and visualization engine. Curr. Protoc. Bioinform. 2012, 14. [Google Scholar] [CrossRef] [Green Version]
- Chong, J.; Wishart, D.S.; Xia, J. Using MetaboAnalyst 4.0 for Comprehensive and Integrative Metabolomics Data Analysis. Curr. Protoc. Bioinform. 2019, 68, e86. [Google Scholar] [CrossRef]
- Mevik, B.-H.; Wehrens, R. The pls Package: Principal Component and Partial Least Squares Regression in R. J. Stat. Softw. 2007, 18. [Google Scholar] [CrossRef] [Green Version]
- Kuhn, M. Caret: Classication and Regression Training. 2008. Available online: https://www.academia.edu/12560544/Classification_and_Regression_Training (accessed on 3 December 2020).
- Bijlsma, S.; Bobeldijk, I.; Verheij, E.R.; Ramaker, R.; Kochhar, S.; Macdonald, I.A.; van Ommen, B.; Smilde, A.K. Large-Scale Human Metabolomics Studies: A Strategy for Data (Pre-) Processing and Validation. Anal. Chem. 2006, 78, 567–574. [Google Scholar] [CrossRef] [PubMed]
- Banacos, P.C. Box and Whisker Plots for Local Climate Datasets Interpretation and Creation Using Excel 2007/2010; U.S. Department of Commerce, National Oceanic and Atmospheric Administration, National Weather Service: Washington, DC, USA, 2011.
- Patki, V.K.; Chougule, S.B. Hyperglycemia in critically ill children. Indian J. Crit. Care Med. 2014, 18, 8–13. [Google Scholar] [CrossRef] [PubMed]
- Chong, J.; Soufan, O.; Li, C.; Caraus, I.; Li, S.; Bourque, G.; Wishart, D.S.; Xia, J. MetaboAnalyst 4.0: Towards more transparent and integrative metabolomics analysis. Nucleic Acids Res. 2018, 46, W486–W494. [Google Scholar] [CrossRef] [PubMed] [Green Version]
- Wong, H.R.; Cvijanovich, N.Z.; Allen, G.L.; Thomas, N.J.; Freishtat, R.J.; Anas, N.; Meyer, K.; Checchia, P.A.; Lin, R.; Shanley, T.P.; et al. Validation of a gene expression-based subclassification strategy for pediatric septic shock. Crit. Care Med. 2011, 39, 2511–2517. [Google Scholar] [CrossRef] [PubMed]
- Wong, H.R.; Cvijanovich, N.; Lin, R.; Allen, G.L.; Thomas, N.J.; Willson, D.F.; Freishtat, R.J.; Anas, N.; Meyer, K.; Checchia, P.A.; et al. Identification of pediatric septic shock subclasses based on genome-wide expression profiling. BMC Med. 2009, 7, 34. [Google Scholar] [CrossRef] [Green Version]
- Sweeney, T.E.; Shidham, A.; Wong, H.R.; Khatri, P. A comprehensive time-course-based multicohort analysis of sepsis and sterile inflammation reveals a robust diagnostic gene set. Sci. Transl. Med. 2015, 7, 287ra71. [Google Scholar] [CrossRef] [PubMed] [Green Version]
- Wikoff, W.R.; Anfora, A.T.; Liu, J.; Schultz, P.G.; Lesley, S.A.; Peters, E.C.; Siuzdak, G. Metabolomics analysis reveals large effects of gut microflora on mammalian blood metabolites. Proc. Natl. Acad. Sci. USA 2009, 106, 3698–3703. [Google Scholar] [CrossRef] [Green Version]
- Miller, E.W., Jr.; Peretti, S. Bioconversion of toluene to p-hydroxybenzoate via the construction and characterization of a recombinant Pseudomonas putida. Green Chem. 1999, 1, 143–152. [Google Scholar] [CrossRef]
- Verhoef, S.; Ruijssenaars, H.J.; de Bont, J.A.M.; Wery, J. Bioproduction of p-hydroxybenzoate from renewable feedstock by solvent-tolerant Pseudomonas putida S12. J. Biotechnol. 2007, 132, 49–56. [Google Scholar] [CrossRef]
- Lindsey, A.S.; Jeskey, H. The Kolbe-Schmitt Reaction. Chem. Rev. 1957, 57, 583–620. [Google Scholar] [CrossRef]
- Barker, J.L.; Frost, J.W. Microbial synthesis of p-hydroxybenzoic acid from glucose. Biotechnol. Bioeng. 2001, 76, 376–390. [Google Scholar] [CrossRef] [PubMed]
- Stadthagen, G.; Korduláková, J.; Griffin, R.; Constant, P.; Bottová, I.; Barilone, N.; Gicquel, B.; Daffé, M.; Jackson, M. p-Hydroxybenzoic Acid Synthesis in Mycobacterium tuberculosis. J. Biol. Chem. 2005, 280, 40699–40706. [Google Scholar] [CrossRef] [PubMed] [Green Version]
- Zhu, L.; She, Z.G.; Cheng, X.; Qin, J.J.; Zhang, X.J.; Cai, J.; Lei, F.; Wang, H.; Xie, J.; Wang, W.; et al. Association of Blood Glucose Control and Outcomes in Patients with COVID-19 and Pre-existing Type 2 Diabetes. Cell Metab. 2020, 31, 1068–1077. [Google Scholar] [CrossRef] [PubMed]
- Beloborodova, N.V.; Khodakova, A.S.; Olenin, A.J. Are phenylcarboxylic acids really markers in severe sepsis? Crit. Care 2009, 13, P41. [Google Scholar] [CrossRef] [Green Version]


Publisher’s Note: MDPI stays neutral with regard to jurisdictional claims in published maps and institutional affiliations. |
© 2021 by the authors. Licensee MDPI, Basel, Switzerland. This article is an open access article distributed under the terms and conditions of the Creative Commons Attribution (CC BY) license (http://creativecommons.org/licenses/by/4.0/).
Share and Cite
Leimanis-Laurens, M.; Gil, D.; Kampfschulte, A.; Krohn, C.; Prentice, E.; Sanfilippo, D.; Prokop, J.W.; Lydic, T.A.; Rajasekaran, S. The Feasibility of Studying Metabolites in PICU Multi-Organ Dysfunction Syndrome Patients over an 8-Day Course Using an Untargeted Approach. Children 2021, 8, 151. https://0-doi-org.brum.beds.ac.uk/10.3390/children8020151
Leimanis-Laurens M, Gil D, Kampfschulte A, Krohn C, Prentice E, Sanfilippo D, Prokop JW, Lydic TA, Rajasekaran S. The Feasibility of Studying Metabolites in PICU Multi-Organ Dysfunction Syndrome Patients over an 8-Day Course Using an Untargeted Approach. Children. 2021; 8(2):151. https://0-doi-org.brum.beds.ac.uk/10.3390/children8020151
Chicago/Turabian StyleLeimanis-Laurens, Mara, Danny Gil, Andrew Kampfschulte, Claire Krohn, Elizabeth Prentice, Dominic Sanfilippo, Jeremy W. Prokop, Todd A. Lydic, and Surender Rajasekaran. 2021. "The Feasibility of Studying Metabolites in PICU Multi-Organ Dysfunction Syndrome Patients over an 8-Day Course Using an Untargeted Approach" Children 8, no. 2: 151. https://0-doi-org.brum.beds.ac.uk/10.3390/children8020151