Review

Framework for Validation of Permanently Installed MEMS-Based Acquisition Devices Using Soft Sensor Models

1
School of Mechanical and Chemical Engineering, The University of Western Australia, Perth, WA 6009, Australia
2
Department of Mathematics and Statistics, The University of Western Australia, Perth, WA 6009, Australia
3
Oceans Graduate School, The University of Western Australia, Perth, WA 6009, Australia
4
Department of Defence, Defence Science and Technology Group, Rockingham 6958, Australia
*
Author to whom correspondence should be addressed.
These authors contributed equally to this work.
Submission received: 13 June 2020 / Revised: 17 July 2020 / Accepted: 24 July 2020 / Published: 28 July 2020
(This article belongs to the Special Issue Addressing Risk in Engineering Asset Management)

Abstract

:
Asset integrity and predictive maintenance models require field data for an accurate assessment of an asset’s condition. Historically these data collected periodically in the field by technicians using portable units. The significant investment in inexpensive microelectromechanical (MEMS) sensors mounted on untethered (energy-harvesting or battery-powered) microprocessors communicating wirelessly to the cloud is expected to change the way we collect asset health data. Permanently installed MEMS-based sensing units will enable near-real time data collection and reduce the safety exposure of technicians by eliminating the need to manually collect field data. With hundreds of MEMS-based sensing units expected to be installed at a single site it is vital to assure the data they produce and maintain them cost effectively. An asset management framework for validation of MEMS-based sensing units for condition monitoring and structural integrity (CM&SI) applications is proposed. An integral part of this framework is the proposed use of soft sensor models to replace technician inspections in the field. Soft sensor models are used in the process industry to stabilize product quality and process operations but there are few examples in asset management applications. The contributions of this paper are twofold. Firstly, we use an interdisciplinary approach drawing on electronics, process control, statistics, machine learning, and asset management fields to describe the emerging field of permanently installed MEMS-based sensing units for CM&SI. Secondly, we development a framework for assuring validation of the data these sensing units generate.

1. Introduction

There are safety and economic benefits if appropriate corrective action can be taken before asset failure occurs [1]. Condition monitoring and structural integrity (CM&SI) programs are integral to failure prevention. Both are cyclic asset management processes involving program design, data collection and analysis, execution of maintenance recommendations and program review. The key decisions for engineers involved in CM&SI programs are what, where, and when to collect asset health data [2]. Once these are decided, engineers are often reliant on technicians using portable devices to collect data at pre-set intervals in specific locations. This exposes the technicians to hazards as well as being expensive due to the need for trained and certified technicians and specialist equipment. The historical reliance on technicians with portable devices is partially due to the high costs of power and communication infrastructure associated with permanently installed systems [3]. Any move to have more permanently installed sensors necessitates the development of validation and maintenance programs for the sensing network. Currently validation inspections on permanently installed sensing units are usually conducted at fixed intervals, regardless of any indication the sensing unit has a fault. We might be sending technicians to test sensing units that are healthy [4], thus exposing them to unnecessary risk and incurring considerable manpower costs if the sensor population is significant. In many sectors, for example oil and gas and mining, there has been a move in the last decade to unmanned facilities. While reducing the exposure of employees to operational risks, this situation also complicates the maintenance effort involved in sensor calibration as trips to the remote sites by technicians are infrequent.
The implementation of many inexpensive, permanently installed microelectromechanical (MEMS) sensing units creates a critical challenge to ensure that the near-real time data coming from individual MEMS-based sensing units is valid. Motivated by this we propose the use of on-line mathematical models to identify out-of-calibration or malfunctioning sensing units. This will facilitate a move to an on-condition approach to managing the integrity of the permanently installed CM&SI sensing units.
The objective of this paper is to present a framework for sensor validation management in CM&SI applications using permanently installed MEMS-based sensing units. The paper draws on topics from electronics, process control, statistics and machine learning, asset management and reliability engineering fields. We start with an overview of elements in a MEMS-based sensing units and their reliability. A description of on-line monitoring (also known as soft sensor) models follows with specific examples of developments in sensor validation. Steps necessary to manage maintenance of the model(s) ensure confidence in the analysis, and cost effectiveness of the program are then described. Experiences of the process industry in using soft sensor models are used throughout the paper. Finally we identify opportunities to improve sensor validation practice for the CM&SI community.

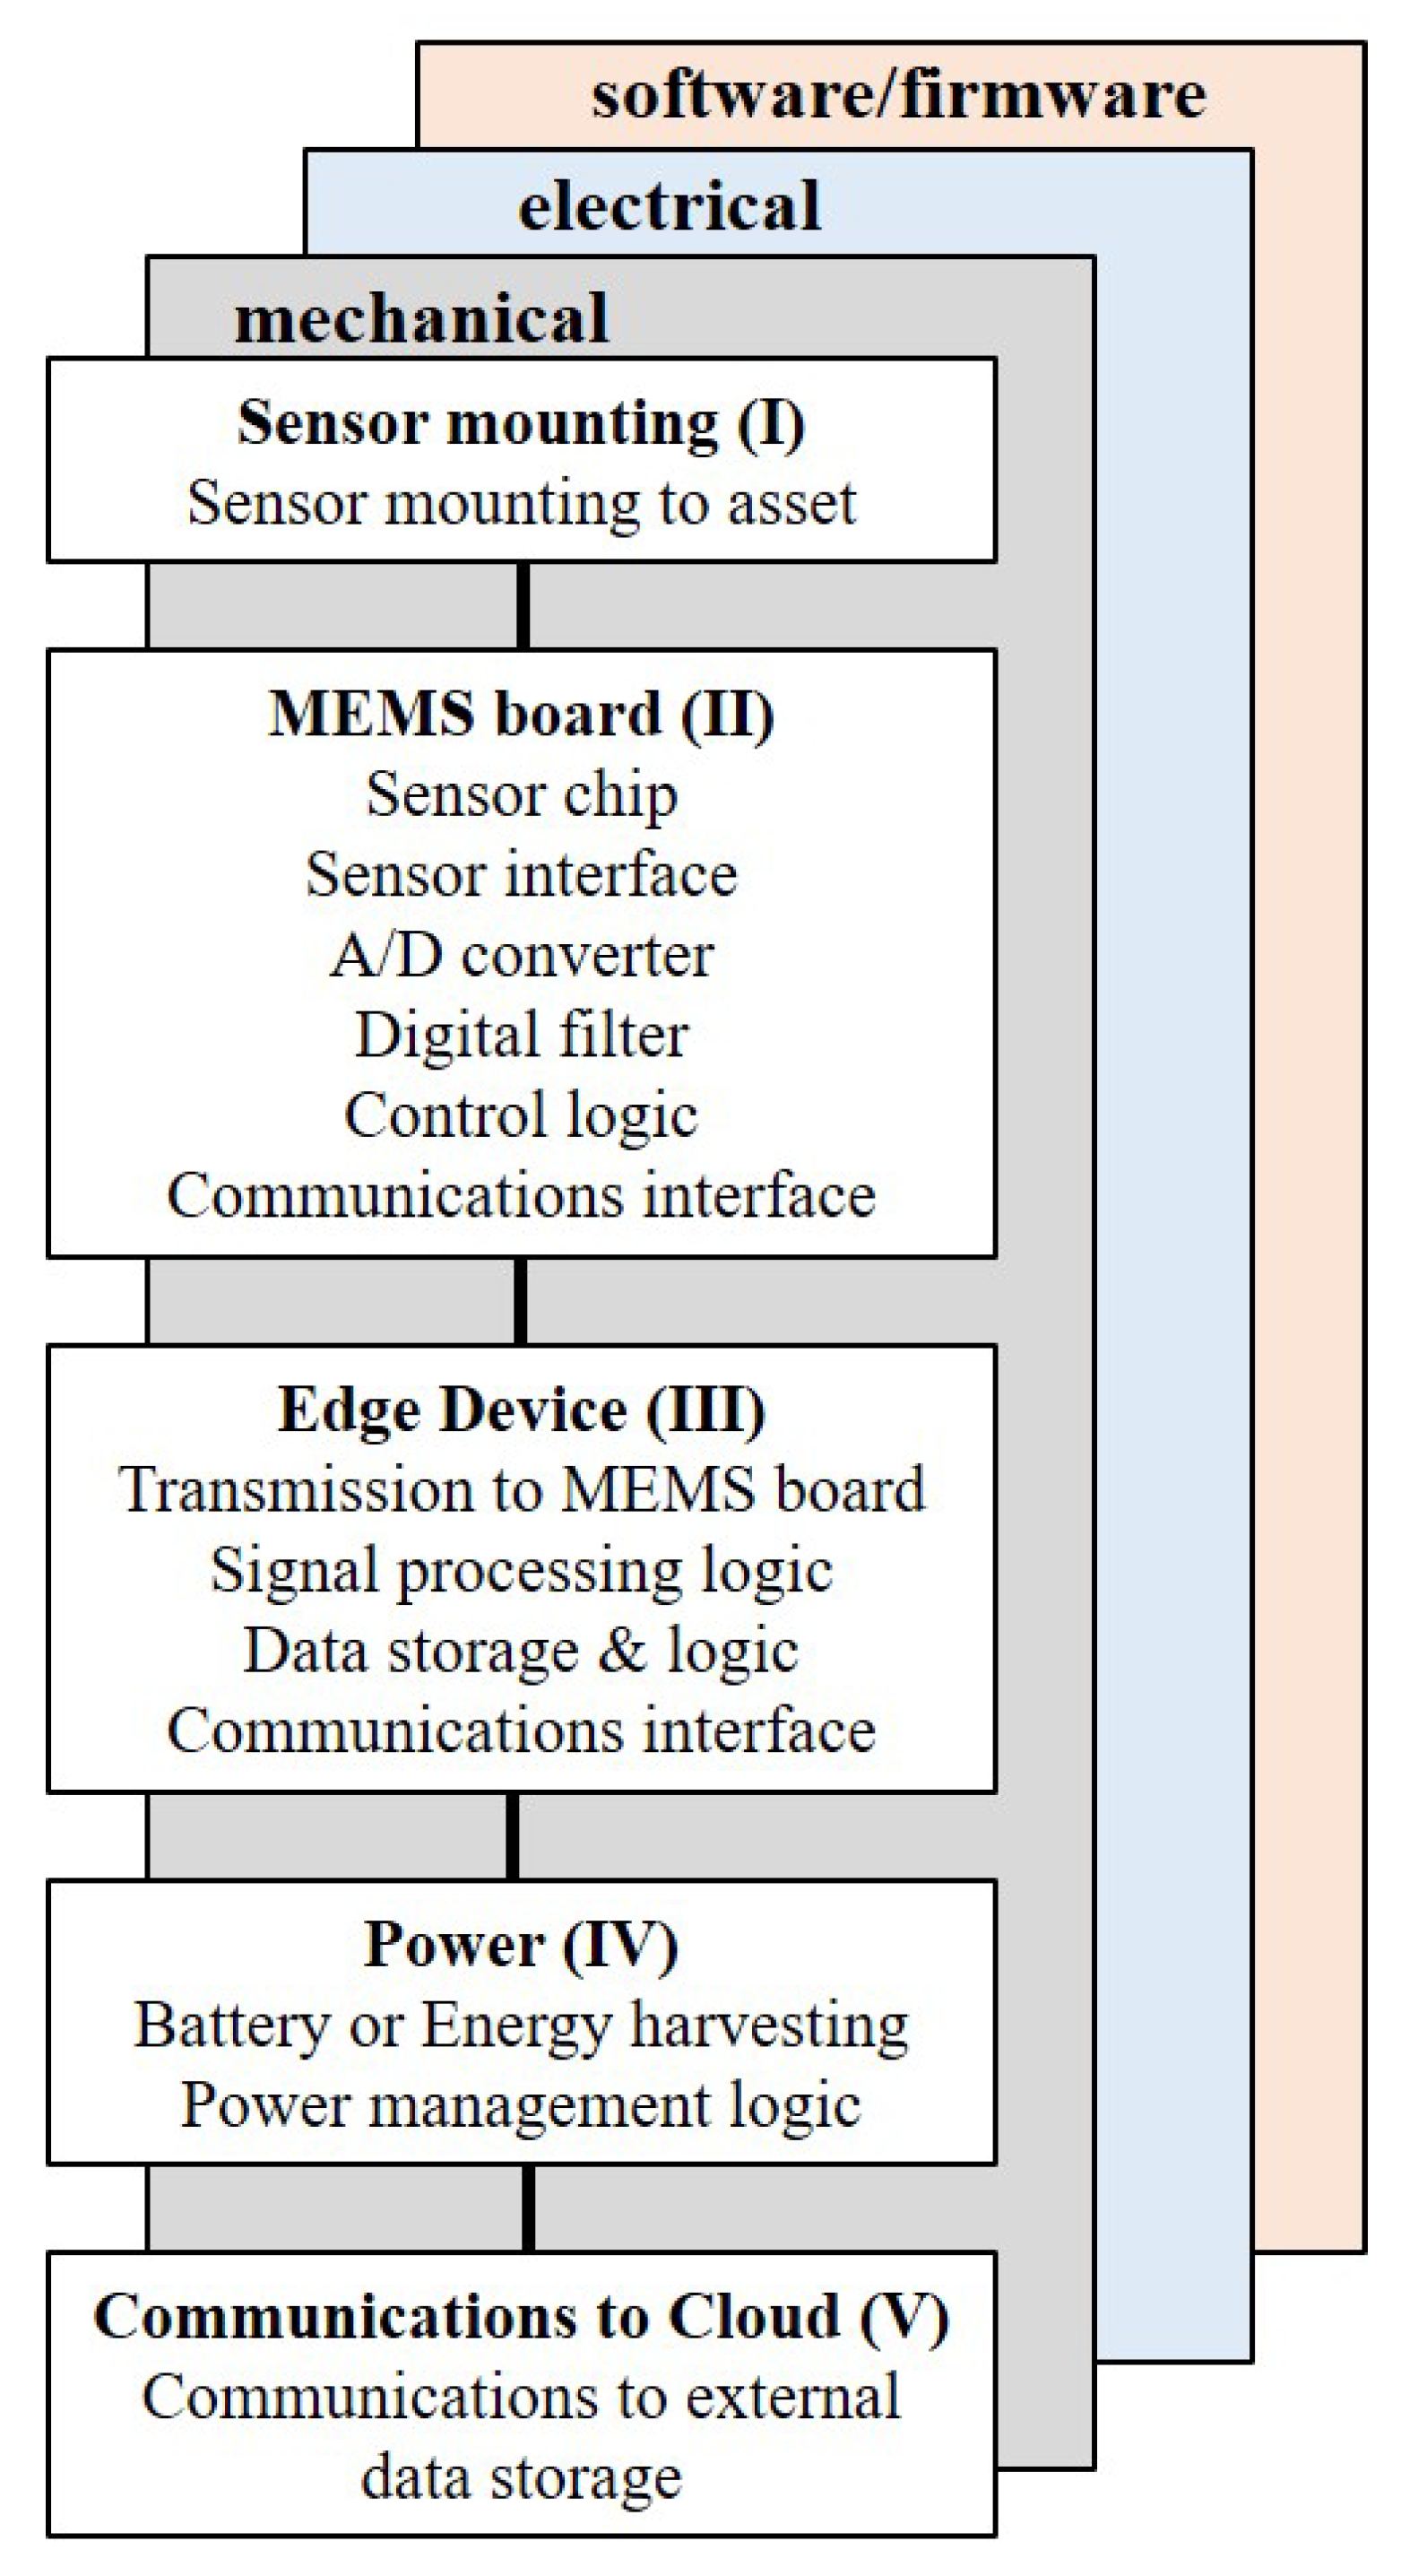
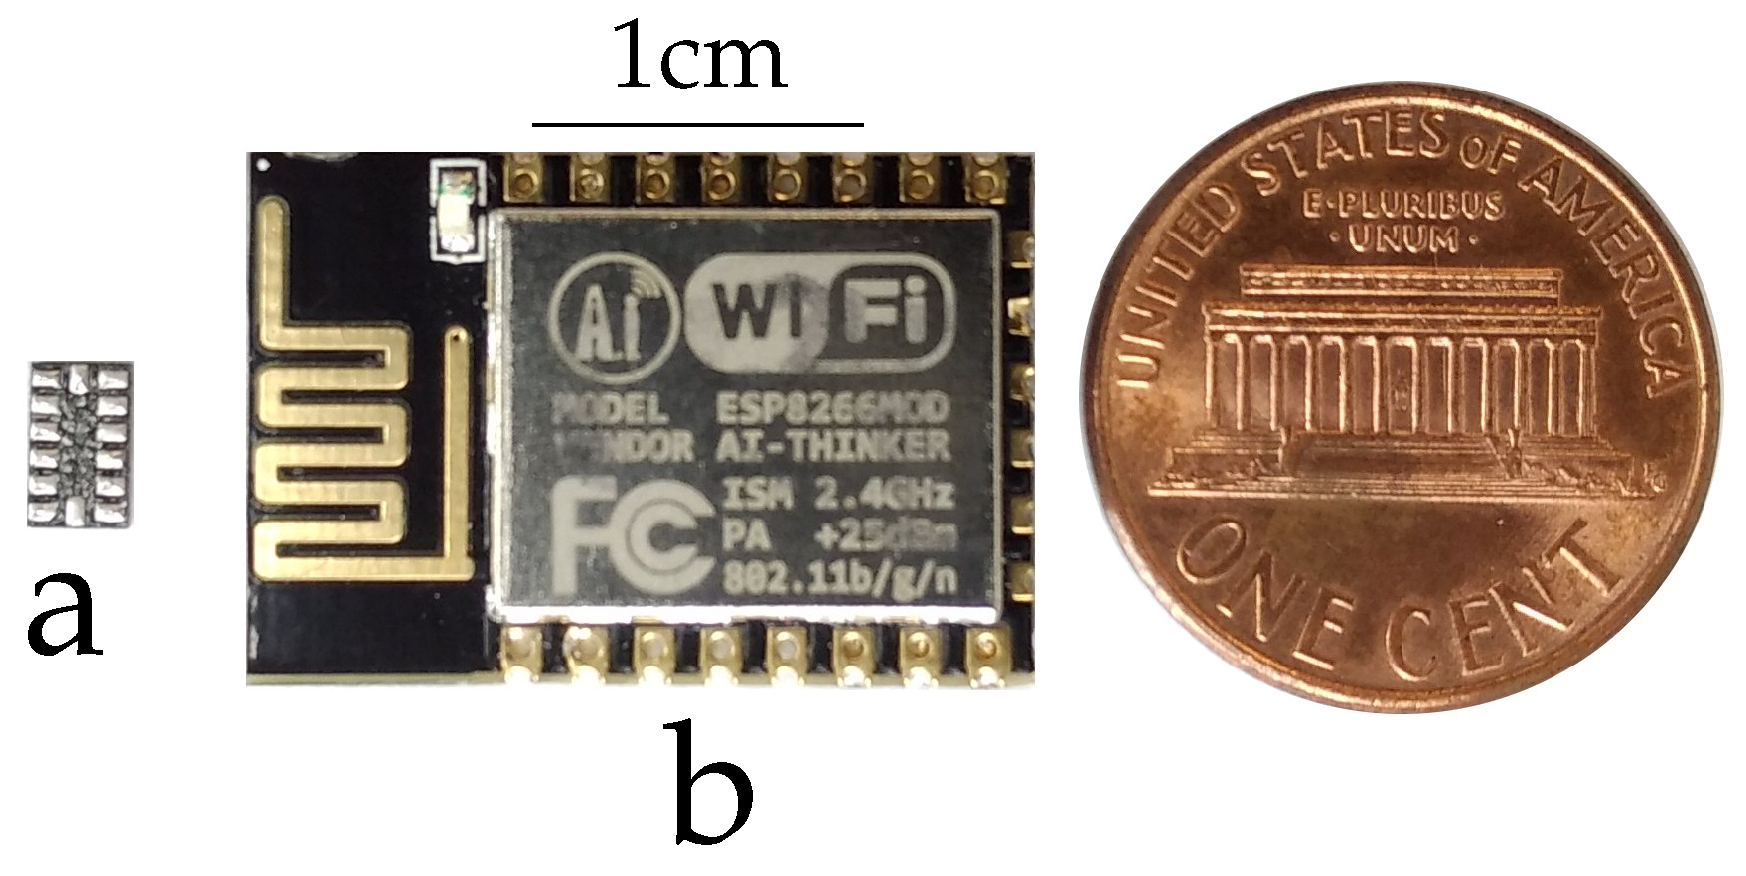
2. MEMS-Based Sensing Systems

A MEMS-based sensing node has five functional elements as shown in Figure 1. The key physical components of a MEMS-based sensing node are the sensing device (II) and the edge device (III) generally consisting of a microcontroller with an inbuilt communications system. Each require power (IV) and firmware/software to operate. The sensing node also needs to be physically mounted to the asset (I), and needs to communicate to the cloud (V). From a reliability perspective this sensing node is a series system. Failure of any one element leads to failure of the node.
A typical sensing device comprises a MEMS sensor, an analogue to digital converter (ADC), filters and associated logic. The sensing device communicates with the edge device. The edge device performs multiple functions including on-board power management, data storage, signal processing and wireless data transmission. It can have on-board power supplies such as rechargeable or replaceable batteries or energy harvesting components and extra ports for additional sensors. Settings such as sampling triggers, sampling rates and on-off-sleeping modes are adjustable through software. Advances in microprocessor capabilities now allow the ability to perform on-board signal processing and data compression, called edge computing, is increasing rapidly. Microprocessors can support a range of wireless communication technologies including RFID, Bluetooth, WiFi, Zigbee, Ultra-wideband and Wireless USB [5]. There are also a range of low-power wide-area network (LPWAN) protocols such as Lora and Sigfox which are becoming increasingly available. The cost of the commercial off-the-shelf (COTS) parts for one of these sensing nodes is presently around US $100. An example of the size for a single COTS capacitive MEMS accelerometer sensor and an edge device is shown in Figure 2.
We envisage many sensing nodes being permanently installed on assets. For example, as many as 13 could be installed on a single motor-pump system if we adopt recommended guideline ISO 13371 for condition monitoring of machines [6]. Data are therefore collected from multiple nodes in near-real time. To manage the challenge of ensuring the quality of this data we propose a framework for validation of these multiple redundant MEMS-based sensing nodes.
In developing this framework we draw on guidelines from ISO 17359 for condition monitoring and diagnostics of machines and ISO 19902 for in-service inspection and integrity management of steel structures [2,7]. Figure 3 shows a proposed closed loop process starting with defining the scope of the management system, design of the process, data collection and analysis, execution of actions, review of their technical and cost effectiveness and then ongoing review of the scope and process.

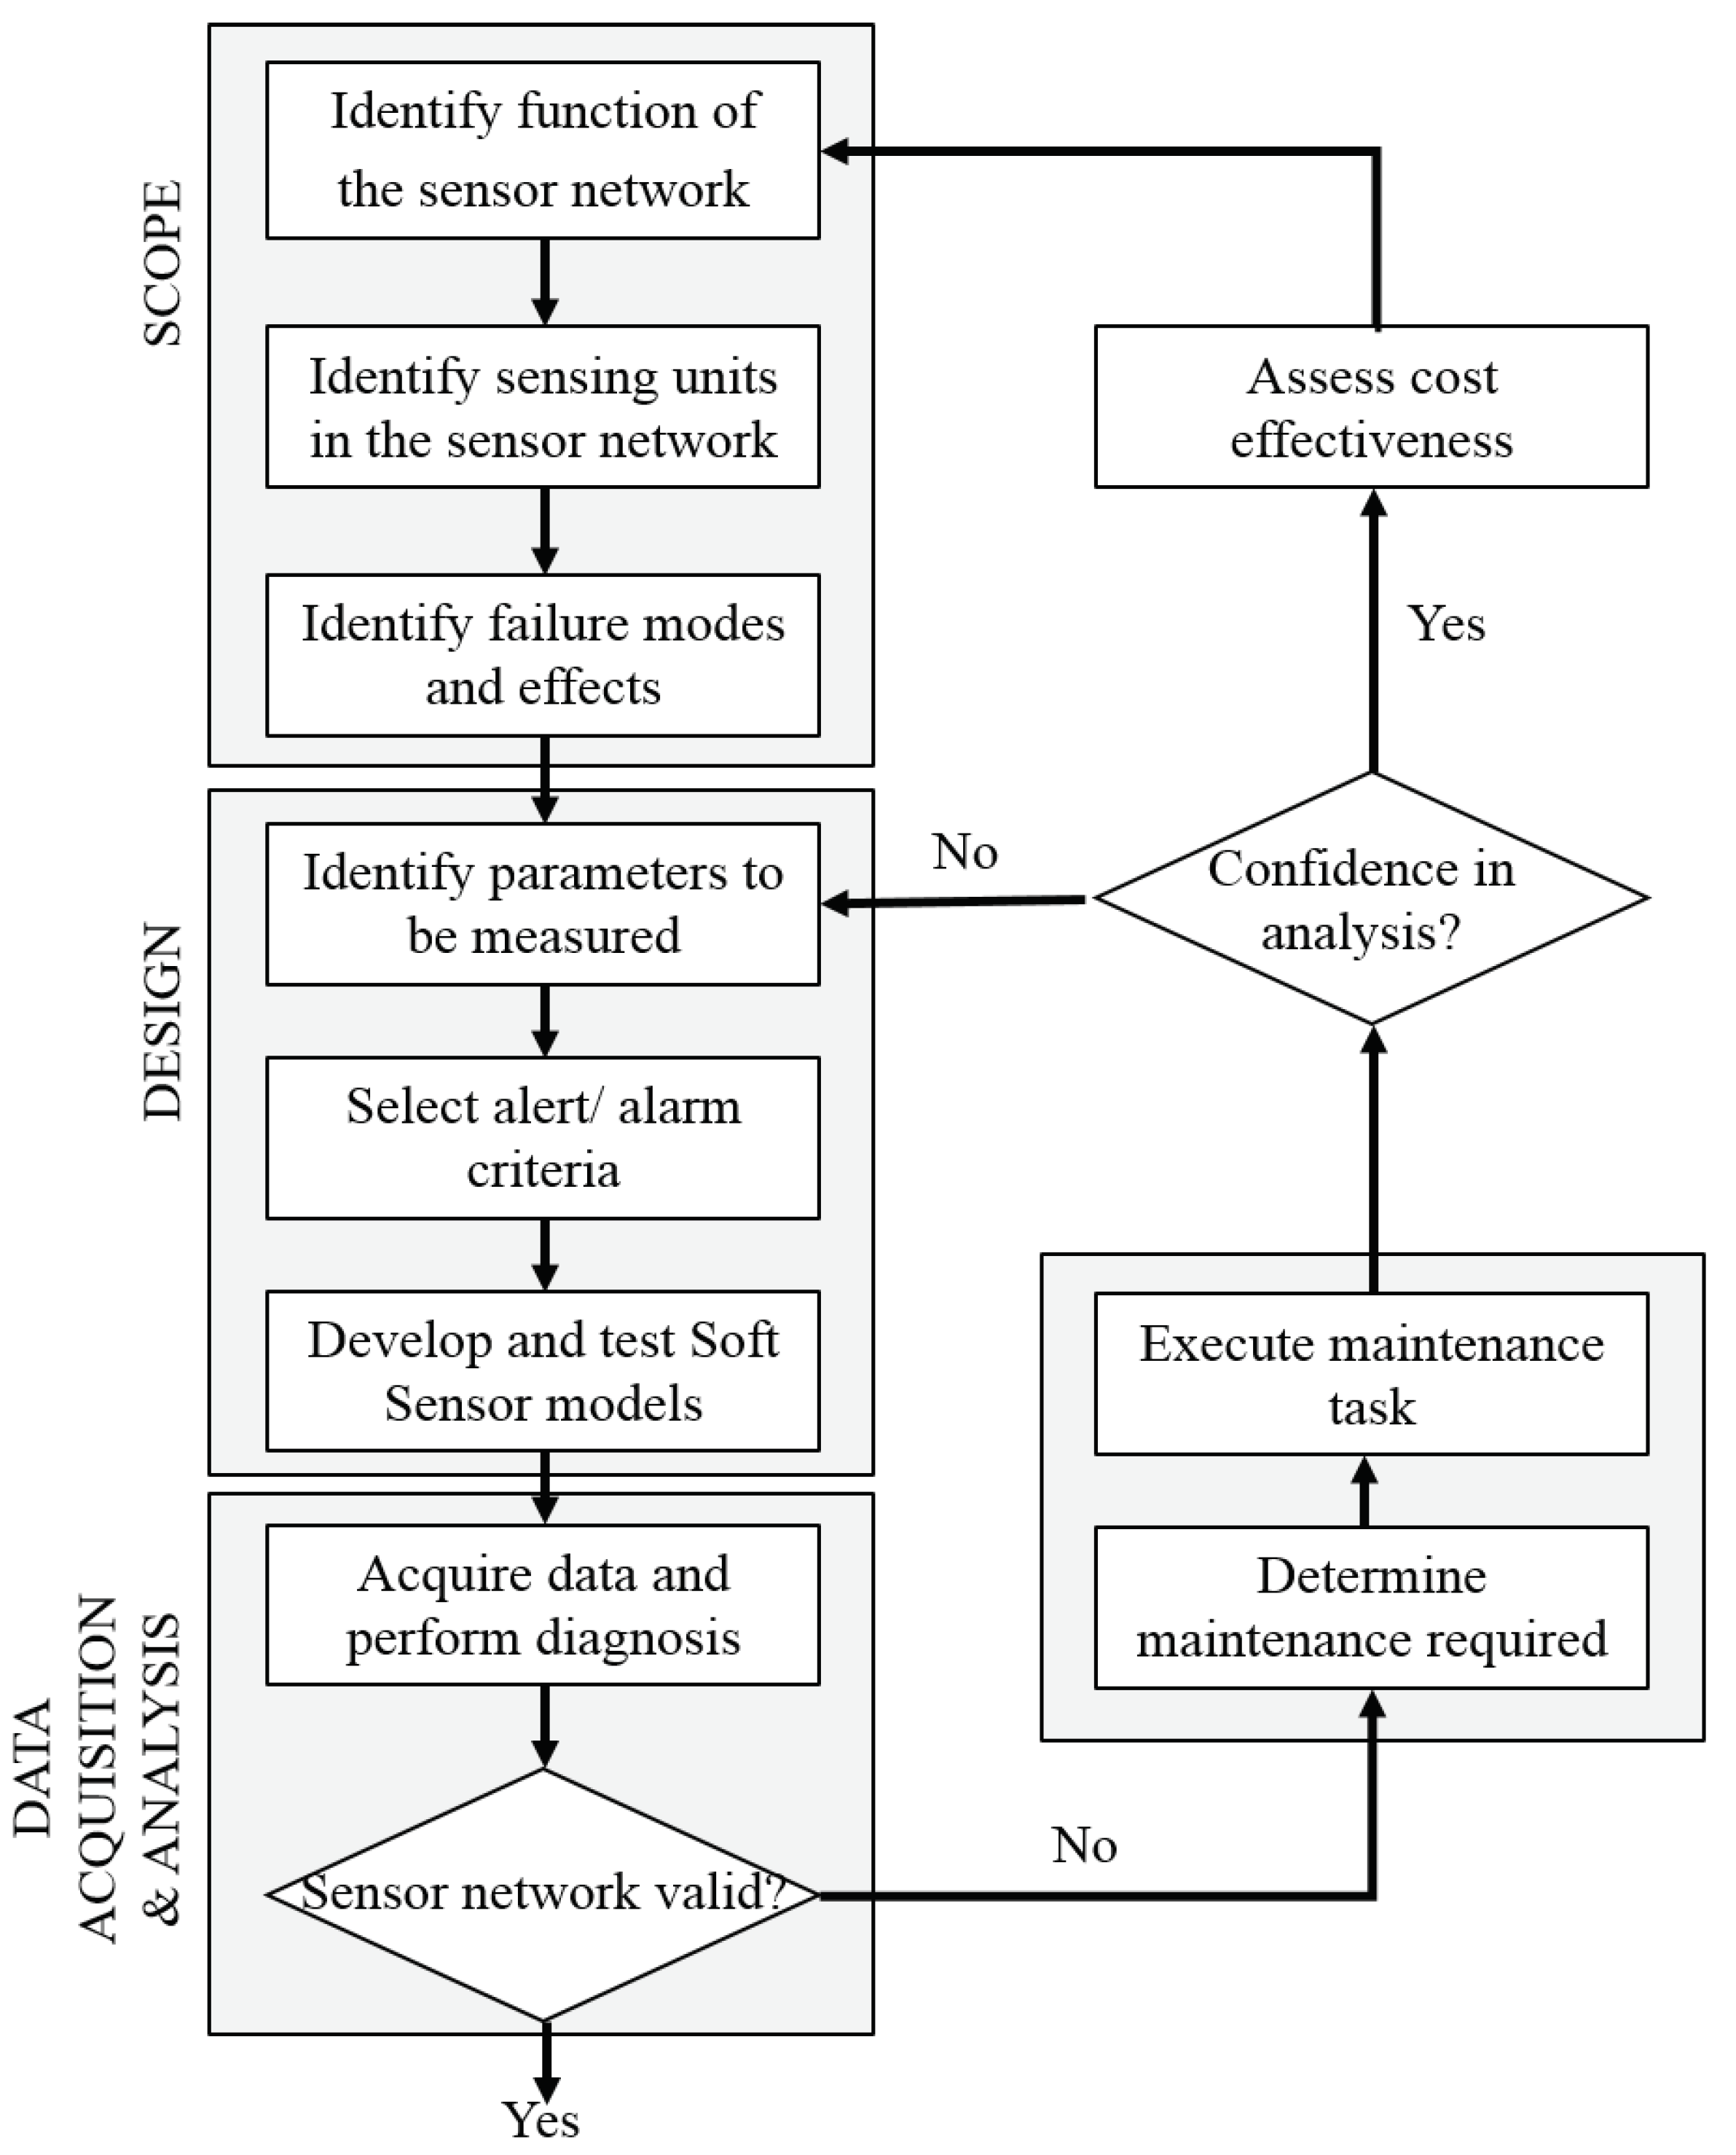
3. Scope of the Management System

Determining the scope of the validation management system involves defining the number, location and function of each sensing system. A sensing system is a group of sensing nodes on a single asset. The function of the sensing system is to detect events or changes in the monitored asset and accurately transmit information about these changes in an appropriate format and at an appropriate frequency to the cloud. Functional failures can occur in any of the elements of an individual sensing node shown in Figure 1.
Each element in the sensing node requires a functional statement against which a failure modes and effects analysis (FMEA) for the specific node can be conducted. Practical issues such as how the sensing node is attached to the asset can be of vital importance and consideration needs to be given to how the mounting method responds to temperature, moisture, and UV degradation, for instance [3].
Drawing on the work of Kullaa [8] we suggest an initial list of functional failures for the sensor element are bias, drift, scaling and hard failure. These are described mathematically as follows [9]. The variable y f ( t ) represents the faulty sensor readout, y ( t ) is the nominal sensor measurement and η ( t ) corresponds to inherent noise. A bias fault, y f ( t ) = y ( t ) + α + η ( t ) , is characterized by a constant offset (i.e., α ). A drift-type failure y f ( t ) = y ( t ) + β ( t ) + η ( t ) is represented as a time-varying offset factor (i.e., β ( t ) ). Bias and drift faults can also be categorized as additive-type sensor failures. Scaling, gain or precision degradation failures occur when the nominal sensor outputs are scaled or multiplied by a factor (i.e., g ( t ) ) as in y f ( t ) = g ( t ) y ( t ) + η ( t ) . Finally, the hard-fault type occurs when the sensor readings are stuck at a particular constant value (i.e., δ ) in y f ( t ) = δ + η ( t ) . A complete loss of signal can also be represented by this type of fault by assuming that the output from the sensor is zero (i.e., δ = 0 ).
There has been considerable research into specific failure mechanisms of individual types of MEMS sensors [10,11,12,13,14,15,16]. However information regarding operational failure modes in MEMS and how the mechanisms described in the literature link to the functional failures (bias, drift, scaling and hard failure) is lacking [16]. Additionally, there are few FMEA examples for components used in MEMS sensing devices [5] and we located none that provide a comprehensive examination of the links between operational failure modes at the sensing system level and failure mechanisms in the constituent node elements (sensor, sensor mounting, MEMS sensing device, edge device, power and communications elements).
A key element of the sensing system is wireless communications and the wireless sensor network. Technical issues to be considered include time synchronisation between the sensor nodes, network topology and the ability to scale. This is an active research field that could be useful in developing a FMEA for the wireless element of the sensing system, for instance [3].
The specific context of the asset and nature of the monitoring needs to be considered. For example structural response requires accurate and synchronized measurements from different points on the asset, whereas analysis of slow varying phenomena require low frequency sampling over long periods [17]. Other design considerations especially important in an untethered system are what data to process on the edge device, how often and what to communicate, and the effect of these decisions on the sensing node’s power budget [5,18].

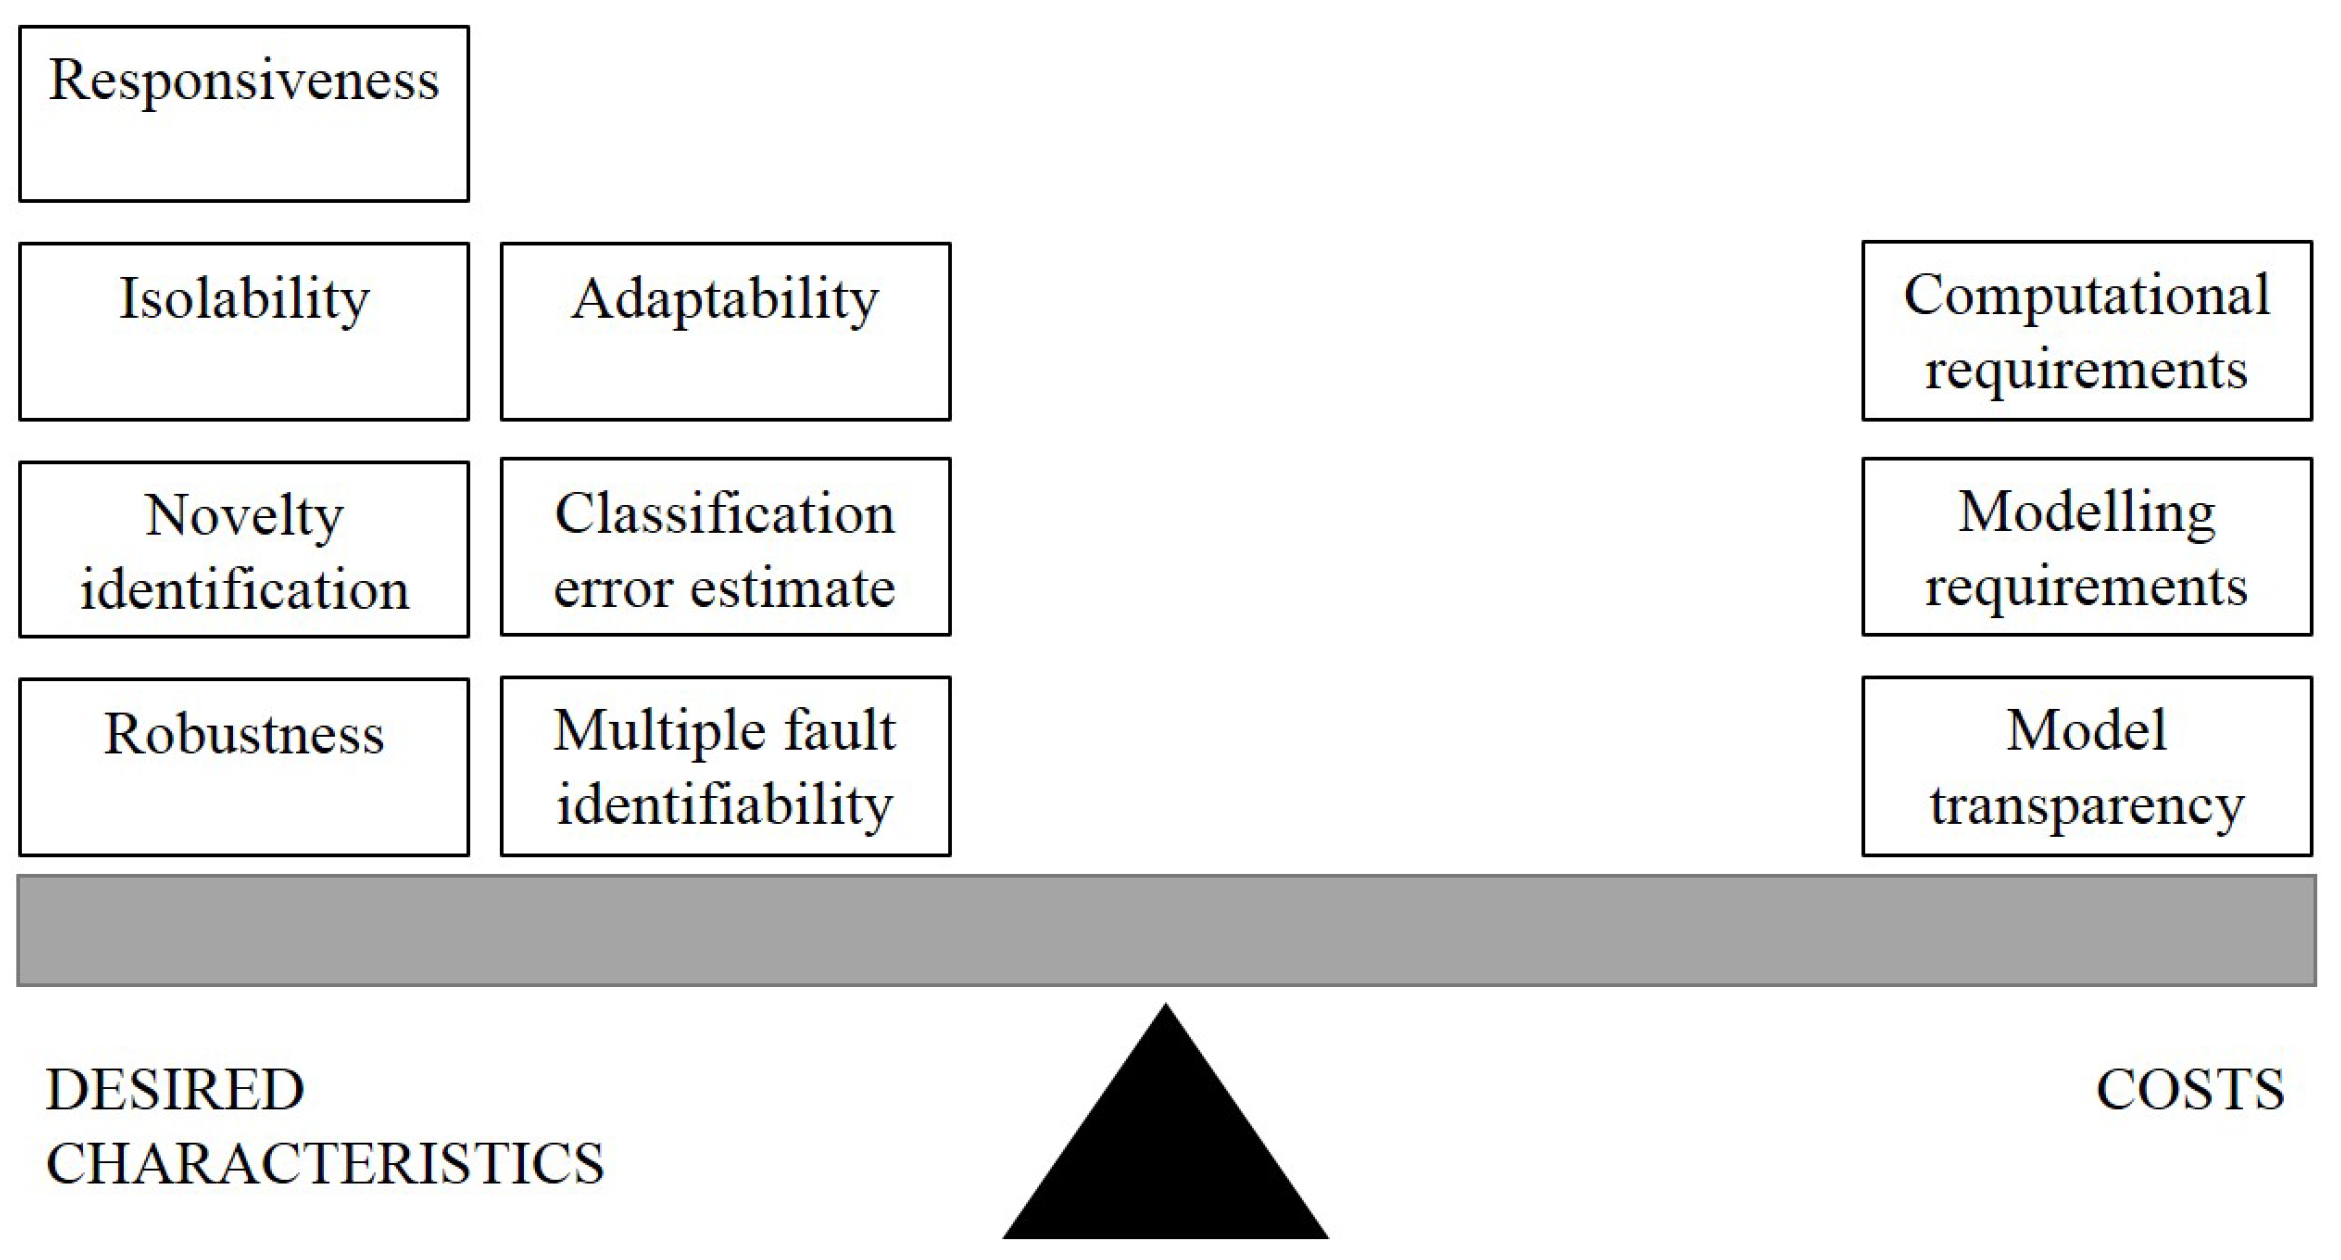
4. Validation System Design

The first stage of the framework’s design process (Figure 3) is the selection of suitable indicators for the failure modes of the sensing system. This process is informed by the FMEA described previously. Once indicators are selected a sensing system can be installed to acquire data. The data are then reviewed against performance thresholds. In a simple system this can be performed manually but once there are tens or hundreds of sensing systems this will need to be actioned on-line in an automated way. To manage this process we propose the use of soft sensor models.

4.1. Soft Sensor Models

Soft sensor models, also known as inferential models and virtual sensors, refer to mathematical models developed to infer indicators from real-time measurable variables. The concept of soft sensors is superficially simple. The measured responses of multiple redundant sensors on a single structure are naturally correlated as the data they measure is related to a common generating process. Consider the example of the motor and pump with 13 vibration sensors referred to earlier. The development of a fault with the pump, for example due to a loose hold-down bolt, will result in an increase in amplitude in the vibration of all the vertically mounted sensing nodes.
To assure that all the sensor nodes are functioning to specification we need to be able to detect when any single sensing node (a ‘target’) has a fault. We achieve this by developing a mathematical model of the relationship between a target node and the other sensing nodes on the structure. Once this relationship has been established the model can be used to infer when the target sensing node is performing as expected, or not.
There are only limited examples of soft sensor models for sensor validation in the CM&SI context. This situation is understandable due to the historical reliance in the CM&SI community on periodic, manually collected inspection and condition monitoring data. Conversely, soft sensor models rely on the availability of on-line data from permanently installed sensors. To move forward we propose the CM&SI community consider the experience the process industry has in developing soft sensor models for estimating difficult to measure process variables and product quality [19,20,21,22,23] and for validation of process sensors such as temperature, pressure and other process sensors [24,25,26,27].

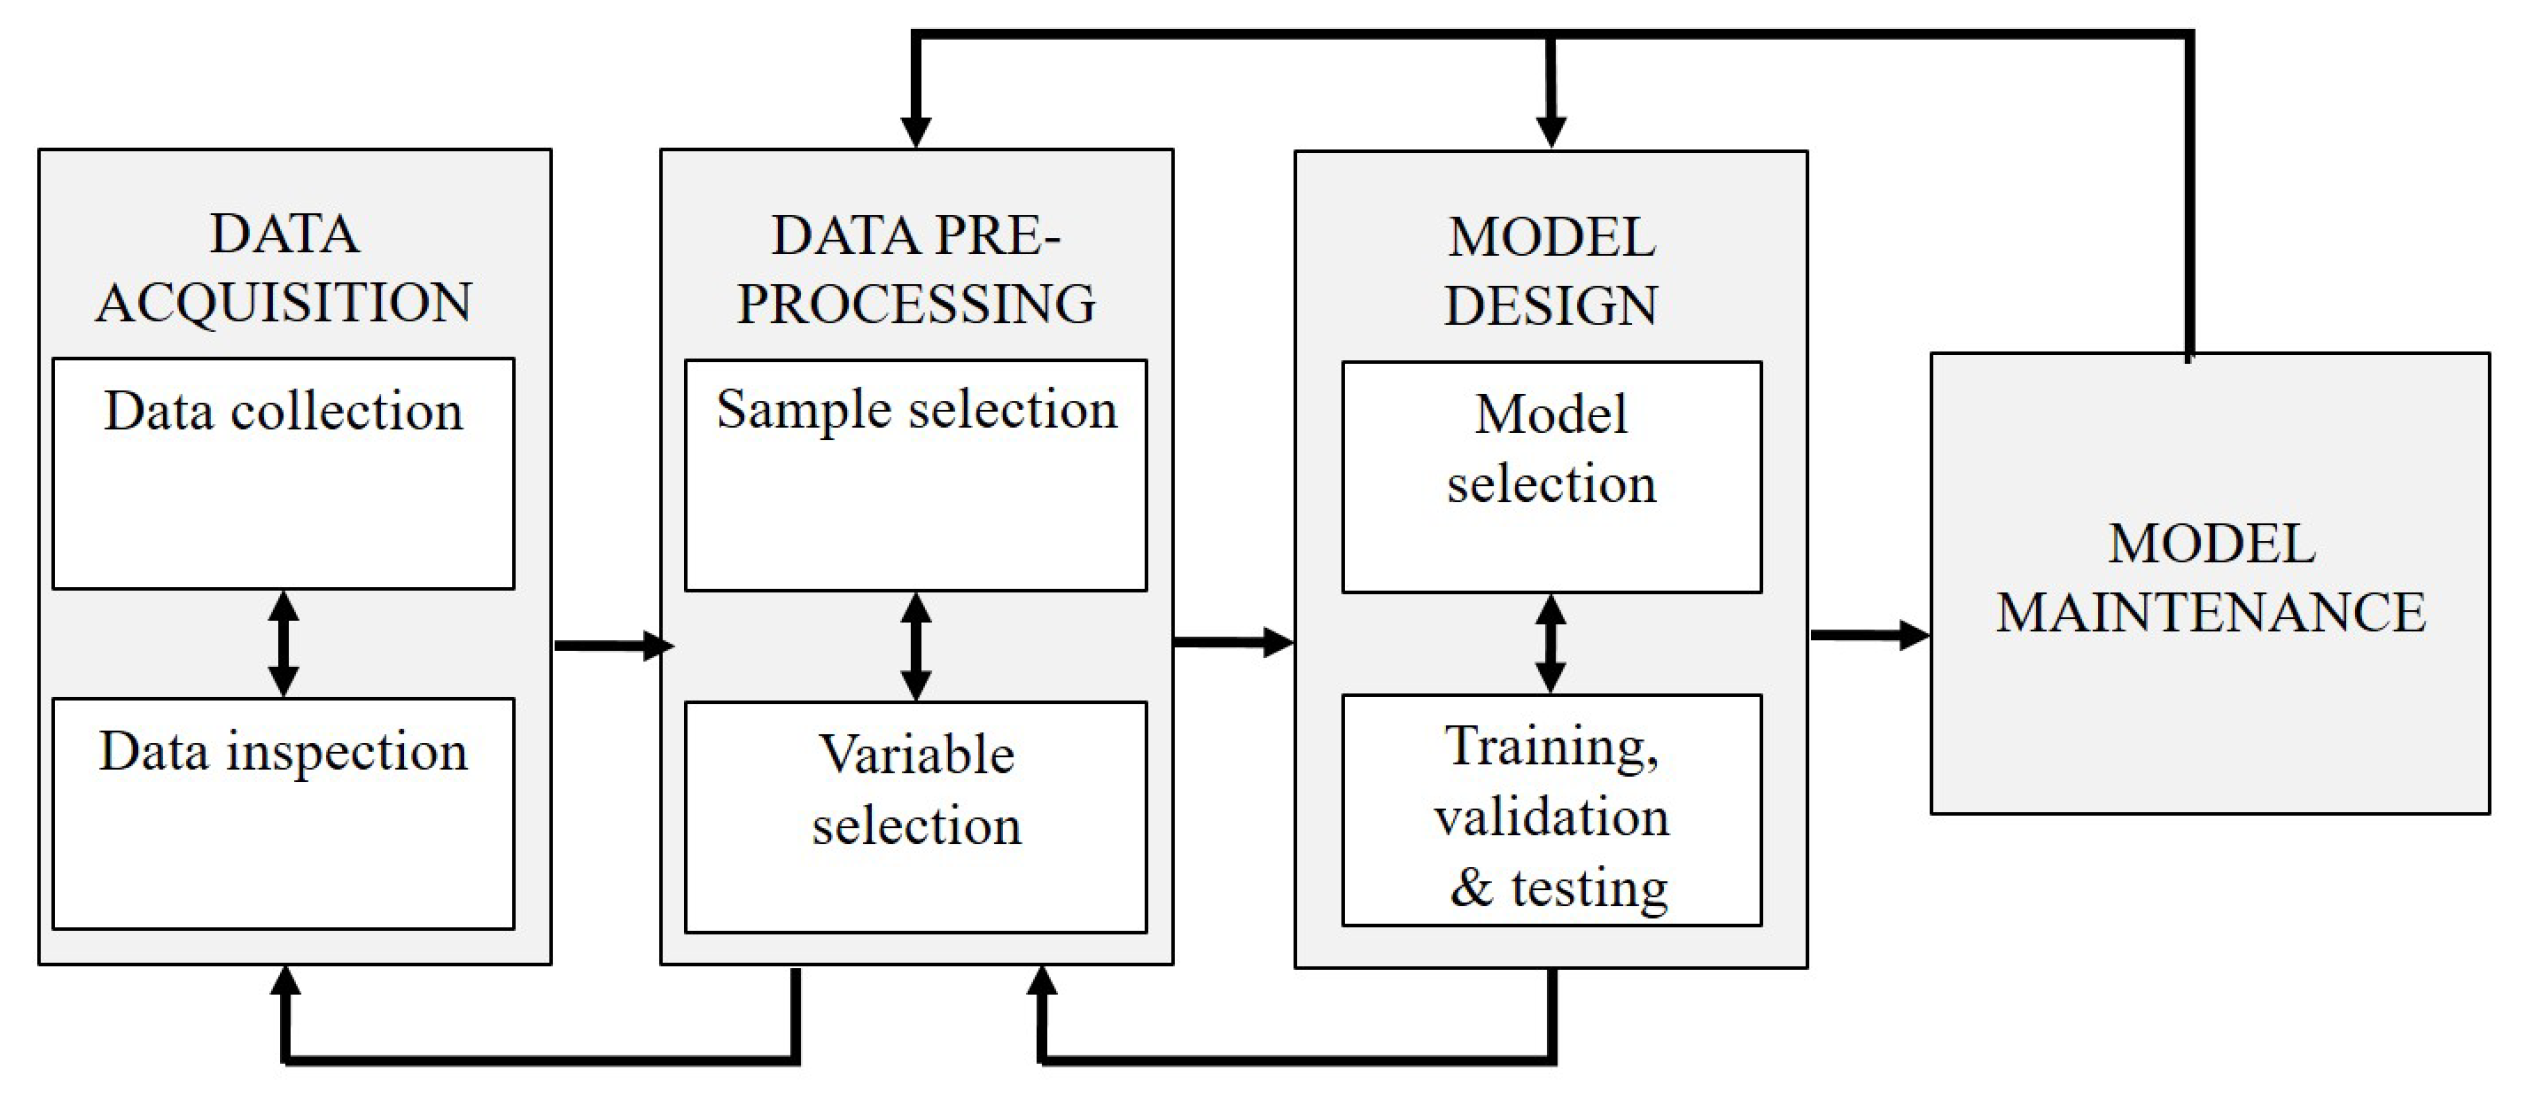
4.2. Model Development Process

The development and maintenance of soft sensor models is categorised by [28] into four stages, as depicted in Figure 4. These are data acquisition, data pre-processing, model design and model maintenance. The remainder of this section discusses what we consider to be the most important aspects of the first three stages. Attention is given to model maintenance in the next section.
The first stage in model development is data acquisition from the permanently installed sensing nodes. Consider a single target sensor and denote by Y t = ( y 1 , y 2 , , y t ) the data arriving sequentially in time from that sensor. A soft sensor model is concerned with modelling Y t . The data collection stage is often overlooked, but we believe it is of vital importance. Previous routine operations and field testing can aid informing the signatures of Y t that may indicate failure mechanisms, asset behaviour and sensing system issues. Data inspection identifies and irons out issues involved with missing measurements, outliers, multi-rate data, measurement delay and drift factors et cetera. It can take time to assess the quality, variability and coverage of Y t but if the incorrect signatures of the sensor are being measured, and/or the quality is sub-par, a soft sensor model will be ineffective. A description of approaches to handle these issues in the sensor validation context is provided in [29].
There are often reasons to believe other factors, say environmental conditions, may help explain failure modes and hence be used to model Y t . Denote by X t = ( x 1 , x 2 , , x t ) the data that encodes these other factors. Each x i in X t is a vector of inputs to be used for modelling Y t . Additional acquisition and inspection issues exist for X t as for Y t . For starters, good explanatory power may require the spatial and temporal alignment of X t with Y t . This sounds obvious, but our experience suggests this is a real headache in industrial data sets, and makes the mathematical modelling that much harder. Early collaboration between the modeller and the technicians can help avoid this problem.
Given the data acquisition stage is satisfactorily carried out, the development of a suitable data analytic model can commence. Data pre-processing and model design in Figure 3 are concerned with the question ‘How is Y t related to X t ?’. Simple, interpretable, computationally efficient models should be used where possible, conditional on producing results at an acceptable level of accuracy. All models should be cross validated on independent data or scrutinized in terms of their predictive coverages of future measurements when they arrive.
Conceptually, models can be considered as white-box, black-box and grey-box. White box models use physical knowledge of the process, for example based on differential and algebraic equations or derived from numerical models, to construct a function over X t to imitate the behaviour of Y t . Black box methods are approximations to non-parametric models and are used when physical models do not exist or are too complex. They are mostly associated with computational/artificial intelligence models where classification rules, estimated using ( X t , Y t ) , inform us about the current or future states of the process. However, there are many statistical models that also fit the black box criteria. For example, Gaussian processes are methods for flexible data fitting and have been used for sensor validation in the nuclear industry [30,31].
In practice many soft sensor models fall into the grey-box category. These grey-box models start with the identification of what is known about the process and synthesize this with information obtained from the observed data and expert knowledge. Being parametric, these tend to be statistical. Regression techniques have proved useful to soft sensor models, for example ridge regression when collinearity exists [32], principal component analysis (PCA) and partial least squares regression (PLS) in higher dimensional problems [33] and kernel regression to approximate non linear relationships in process industry applications [31]. Where a linear relationship cannot be assumed, artificial neural networks and neuro-fuzzy systems have been popular. For a review of PCA, PLS and neural network models applied to soft sensors for process industry applications, see [28,34].
While the above grey-box approaches have been effective, they are not well equipped to take full advantage of physical knowledge of the system. Here, we take the view that Bayesian statistical models are the most adept at combining physical, often non-linear, models with statistical ones. There is increasing interest in, and examples of, first principles and data driven soft sensor models being constructed in a Bayesian framework [35]. There is another advantage to Bayesian approaches in that they have a structure well suited to updating the predictive densities that represent our uncertainty of, say, y t + 1 as new data arrives. This allows the calculation of maximized expected utilities for formal decision making based on soft sensor models.
Kalman and particle filter approaches are examples of a Bayesian modelling approach used both in data-driven and first principles contexts. Kalman filters are used when the mean process evolves linearly, and the observational errors are Gaussian. Extended Kalman filters are an analytical approximation method used when the underlying process is non-linear but the noise distributions can be assumed Gaussian. Particle filters are used when the process evolves non-linearly and the observational error is potentially non-Gaussian. An accessible description of Bayesian methods for soft sensor models is provided by [29] with example process industry applications in [23,35,36]. However, examples of Kalman or particle filter models for sensor validation in CM&SI contexts are scarce.

4.3. Maintenance of the Validation System

A soft sensor model must be maintained and, if necessary, tuned over its life cycle (Figure 4). In practice the life span of a soft sensor model is limited as most processes and assets do not operate in a stable state for extended periods of time [37]. There is usually no objective measure for assessing model performance. A judgement if the model is working or not is often dependent on the subjective perception of the engineer [34].
Once a fault with a sensing node is suspected there are two options. The first is to manually investigate the faulty sensing node, and the second to exclude the faulty sensing node from the soft sensor model, update the model and continue to operate the sensor network. If gradual degradation occurs then the failing node may not be immediately detected but, once it is, its influence on the model parameter estimates can be reduced. The viability for using weights based on a posterior probability of failure was explored by [27].
The potential advantage of using inspection to provide confirmation that the fault was indeed correctly identified and that the nature of the fault was as-diagnosed is considerable [38]. The disadvantage is the cost of sending a technician into the field to inspect and, if necessary, replace the faulty sensor. In some situations this work can only be executed safely when equipment is taken off-line.
If a technician is sent to investigate, the following data should be recorded: date and time of the validation, the as-found condition, what action was taken and the node’s as-left condition should be recorded clearly and consistently [39]. Discussions between the authors and industry personnel suggest that data collection quality is highly variable and that a successful sensing system validation program is highly dependent on the motivation and training of personnel and a culture of adherence to scheduled maintenance procedures and plans. This is in line with previous work on maintenance data quality [40,41].
In response to the challenges with tracking data on calibration of permanently installed sensors instrumentation vendors have been working to improve the capability of sensing nodes to self-check and develop supervisory systems. These developments have the potential to improve calibration fault detection. However interviews by the authors with industry personnel report that integrating these external systems into existing business process, particularly transferring the meta data to describe the failure mode (complete failure, bias, drift etc.) remains a challenge.

4.4. Confidence in the Analysis

CM&SI sensing nodes are installed as part of a risk management program to identify and prevent asset failures. It is therefore paramount to have confidence in the data generated by the sensing systems. This requires all elements in the framework shown in Figure 3 to function appropriately and for their function to be assessed regularly.
The soft sensor models in the framework should theoretically produce few false negatives (fail to detect a fault when there is one) and few false positives (suggest there is a fault when there is not one). Both of these situations undermine confidence of the decision makers in the sensing system. The main concerns with soft sensor models are that they (1) do not have an accurate reference but compare the measured value to a calculated reference that itself is less accurate compared to the simulated input used in the traditional calibration process, (2) do not provide accuracy traceable to Standards, and (3) do not allow frequent physical inspection of the instrument or allow technicians to observe instrument anomalies [42].
Given the stochastic nature of asset deterioration there is also a need for decision makers to understand uncertainties in the process, from data collection through modelling and diagnosis. There is presently considerable focus, particularly in the US nuclear industry, in Bayesian-based soft sensor models that can quantify uncertainty [31].

4.5. Cost Effectiveness

We consider cost effectiveness from two perspectives. First, is a single model for a single sensing system cost effective? Secondly, what is the cost of the management system for many models and many sensing systems? The cost elements of supporting a single soft sensor model are depicted in Figure 5.
The requirements listed on the left hand side of the balance are responsiveness, isolability, novelty identification, robustness, adaptability, classification error estimate and multiple fault identifiability [43]. An ideal model would be responsive to faults without being too sensitive and generating false alarms. A system should be robust to different noise contributions. As discussed earlier in Section 4.2 the model might need to be adaptive to changes in the underlying system it is monitoring and to conditions such as sensor drift. Finally, model developers should provide an a priori estimate on the expected error measures so that the model user can compare actual with anticipated performance. These requirements should be balanced against the costs of developing and maintaining the model. These costs are shown on the right hand side of the balance and include computational requirements, modelling requirements and model transparency.
Direct cost elements relevant to the deployment of a permanently installed, untethered, MEMS-based sensing system include sensing system purchase, installation and maintenance costs, soft sensor model development and maintenance costs described above. Other costs are those relating to dealing with false alarms, as well as false negatives associated with the failure to detect faulty sensors. These need to be balanced against the costs of periodic manual data collection by qualified technicians, either internal or (more commonly) external to the organisation.
Periodic manual data approaches to sensor validation are expensive, time consuming, and can result in longer outages, increased maintenance cost, and additional safety exposure to technicians [44]. A single sensor calibration in the nuclear industry can cost US $3000–$6000 [45]. Assuming a plant has 1000 sensors with a mean of two calibration checks per year, the annual cost is US $6 m. Reviews of calibration logs found 90 percent of sensing systems in a nuclear plant did not exceed their calibration acceptance criteria over a single fuel cycle, (presently 1.5 years) [46]. Studies have found calibration can be counter-productive, introducing errors in calibration of previously fault-free sensors [47]. Fixed interval calibration is required for all safety-related sensors, and validation has emerged as a critical path item for shortening outage duration in some plants [45]. Furthermore, fixed interval based calibration practice involves only periodic assessment of the calibration status. Therefore, a sensor could potentially operate out of calibration for periods up to the recalibration interval.

5. Evolution of Soft Sensor Models for Sensing Node Validation

To understand how soft sensor validation practices have evolved we conducted a search in the Science Direct database for papers on Soft, Virtual or Inferential sensors since 1984. This search identified over 880 papers. We filtered the results for papers on using soft sensor models for validation. This resulted in a much reduced number. Further filtering to identified soft sensor validation papers for CM&SI applications with associated industry and/or laboratory tests and Process applications with an industry example resulted in the 18 papers reported in Table 1.
All of the early models in Table 1 are for process sector examples. The interest from structural integrity practitioners started in the mid 2000s and has mainly been focussed on bridges and using piezoelectric accelerometers. There is an example of using MEMS accelerometers in [61] on a bridge but examples for MEMS based permanently installed sensors in CM with a real asset are scarce. We note also that the papers identified in Table 1 concentrate on the soft sensor modelling part of the process with only passing mention given to issues associated with managing the process of sensor validation over the life cycle of the soft sensor model installation.

6. Lessons Learned

Sensor validation is vital to ensure appropriate data for CM&SI diagnostics and prognostics programs. There is much that the CM&SI community can learn from the process industry community about soft sensor models and their use for sensor validation. Many issues such the need for models to be adaptive and the need to quantify uncertainty are being actively explored in the process and nuclear industries.
Research into wireless, untethered (battery or self-powered), MEMS-based sensing networks is very active but there are, as yet, few practical applications in CM&SI applications. As products emerge and are shown to contribute to improved CM&SI practices through reduced cost and near-real time data collection, there is expected to be growing interest in how to assure the data they are generating.
There are a number of stages involved in sensor validation as shown in the framework in Figure 3. However most of the focus in the literature is on soft sensor model development, and very little on the other steps in the process such as scoping, maintenance and cost. Understanding the end-to-end process and ensuring that there are competent people and an organisational structure to support it is necessary. Maintenance of the soft sensor models needs to be cost-effective for the risks that are being managed [19,21].
The development of FMEA(s) and collection of failure data on the sensing system as a whole including mechanical, electrical and software elements is necessary. Data should include performance of sensing nodes in the field and meta data associated with their operational environment and maintenance practices. FMEAs will inform selection of appropriate variables to measure for validation assurance. While vendors of the COTS components may publish results of specific accelerated life tests on their MEMS sensors or microcontrollers, the data rarely include failure mode and mechanism information or in-service estimates of failure rates. We suggest that industry considers supporting a reliability data handbook for components used in MEMS-based sensing systems.
While the academic literature has a tendency to develop complex models our review finds that these are seldom used in industry. A survey of engineers in 21 Japanese organisations responsible for 439 process-focussed soft sensor applications [21] found that the major modelling method used was multiple regression analysis (67%) followed by partial least squares regression (21%). More complex models, such as ANN, were found to be rarely used and it was concluded that this is “an interesting gap between theory and practice”.
In an assurance process, managing uncertainty is a crucial consideration. It is apparent from developments in the nuclear sector that deciding if you need to quantify uncertainty or not should be discussed at the start of the model selection process. If quantifying uncertainty is important then we suggest using a Bayesian framework for the modelling.

7. Concluding Remarks

The attraction of low cost MEMS-based sensing nodes connected wirelessly to a cloud platform is obvious for condition monitoring and structural health applications. These sensing nodes offer the opportunity for real time data, and much greater physical coverage of the asset at a fraction of the cost of current practice. As the cost of MEMS-based systems reduces, and the reliability improves there is risk that there will be a rush to install these systems without due consideration for the costs of validation. An efficient, safe and cost effective validation program will require the use of soft sensor models. These have been widely applied in the process industries for many years and there is much the CM&SI community can learn from this sector. Despite the plethora of models reported in the academic literature, reports from the process industry indicate that mainly simple models are dominant in industry applications and model maintenance is a critical issue. The cost and safety benefits of soft sensors could be substantial but will need appropriate management and a validation led sensing systems for CM&SI application.

Author Contributions

Conceptualization, A.B., A.K., I.M., B.T. and M.H.; Formal analysis, E.C. and M.H.; Investigation, A.B. and B.T.; Methodology, A.B., E.C., A.K., B.T. and M.H.; Project administration, M.H.; Supervision, B.T. and M.H.; Validation, E.C.; Writing—original draft, A.B., E.C., A.K., I.M., B.T. and M.H.; Writing—review and editing, A.B., E.C., A.K., I.M., B.T. and M.H. All authors have read and agreed to the published version of the manuscript.

Funding

This work was supported by the ARC Industrial Transformation Research Hub for Offshore Floating Facilities, which is funded by the Australia Research Council, Woodside Energy, Shell, Bureau Veritas and Lloyds Register (grant no. IH140100012).

Acknowledgments

The authors would like to thank the BHP Fellowship for Engineering for Remote Operations for support in the preparation of this paper.

Conflicts of Interest

The authors declare no conflict of interest.

References

  1. Farrar, C.R.; Worden, K. An introduction to structural health monitoring. Philos. Trans. R. Soc. Lond. A Math. Phys. Eng. Sci. 2007, 365, 303–315. [Google Scholar] [CrossRef] [PubMed]
  2. BSI. BS ISO 17359:2018 Condition Monitoring and Diagnostics of Machines; General Guidelines; BSI: London, UK, 2018. [Google Scholar]
  3. Karbhari, V.M.; Ansari, F. Structural Health Monitoring of Civil Infrastructure Systems; Woodhead Publishing: Cambridge, UK, 2009. [Google Scholar]
  4. EPRI. On-Line Monitoring Cost-Benefit Guide. EPRI Report 1006777; Technical Report; Electric Power Research Institute: Palo Alto, CA, USA, 2003. [Google Scholar]
  5. Cheng, S.; Azarian, M.H.; Pecht, M.G. Sensor systems for prognostics and health management. Sensors 2010, 10, 5774–5797. [Google Scholar] [CrossRef] [PubMed] [Green Version]
  6. ISO. ISO 13373-1:2002 Condition Monitoring and Diagnostics of Machines: Vibration Condition Monitoring—Part 1: General Procedures; ISO: Geneva, Switzerland, 2002. [Google Scholar]
  7. BSI. BS EN ISO 19902:2007 Petroleum and Natural Gas Industries; Fixed Steel Offshore Structures; ISO: London, UK, 2008. [Google Scholar]
  8. Kullaa, J. Virtual sensing of structural vibrations using dynamic substructuring. Mech. Syst. Signal Process. 2016, 79, 203–224. [Google Scholar] [CrossRef]
  9. Hernandez-Garcia, M.R.; Masri, S.F. Application of statistical monitoring using latent-variable techniques for detection of faults in sensor networks. J. Intell. Mater. Syst. Struct. 2014, 25, 121–136. [Google Scholar] [CrossRef]
  10. Huang, Y.; Vasan, A.S.S.; Doraiswami, R.; Osterman, M.; Pecht, M. MEMS reliability review. IEEE Trans. Device Mater. Reliab. 2012, 12, 482–493. [Google Scholar] [CrossRef] [Green Version]
  11. Li, Y.; Jiang, Z. An overview of reliability and failure mode analysis of microelectromechanical systems (MEMS). In Handbook of Performability Engineering; Springer: Berlin, Germany, 2008; pp. 953–966. [Google Scholar]
  12. Syed, Z.; Aggarwal, P.; Goodall, C.; Niu, X.; El-Sheimy, N. A new multi-position calibration method for MEMS inertial navigation systems. Meas. Sci. Technol. 2007, 18, 1897. [Google Scholar] [CrossRef]
  13. Ompusunggu, A.P.; Bey-Temsamani, A. 2-Level error (drift) compensation for low-cost MEMS-based inertial measurement unit (IMU). Microsyst. Technol. 2016, 22, 1601–1612. [Google Scholar] [CrossRef]
  14. Aggarwal, P.; Syed, Z.; Niu, X.; El-Sheimy, N. Cost-effective testing and calibration of low cost MEMS sensors for integrated positioning, navigation and mapping systems. In Proceedings of the XXIII FIG Congress, Munich, Germany, 8–13 October 2006. [Google Scholar]
  15. Dai, G.; Li, M.; He, X.; Du, L.; Shao, B.; Su, W. Thermal drift analysis using a multiphysics model of bulk silicon MEMS capacitive accelerometer. Sensors Actuators A Phys. 2011, 172, 369–378. [Google Scholar] [CrossRef]
  16. Fonseca, D.J.; Sequera, M. On MEMS reliability and failure mechanisms. Int. J. Qual. Stat. Reliab. 2011, 2011. [Google Scholar] [CrossRef]
  17. Federici, F.; Alesii, R.; Colarieti, A.; Graziosi, F.; Faccio, M. Design and validation of a wireless sensor node for long term structural health monitoring. In Proceedings of the 2013 IEEE Sensors, Baltimore, MD, USA, 3–6 November; IEEE: Piscataway, NJ, USA, 2013; pp. 1–4. [Google Scholar]
  18. Ha, D.W.; Park, H.S.; Choi, S.W.; Kim, Y. A wireless MEMS-based inclinometer sensor node for structural health monitoring. Sensors 2013, 13, 16090–16104. [Google Scholar] [CrossRef] [Green Version]
  19. Kano, M.; Nakagawa, Y. Data-based process monitoring, process control, and quality improvement: Recent developments and applications in steel industry. Comput. Chem. Eng. 2008, 32, 12–24. [Google Scholar] [CrossRef] [Green Version]
  20. Lin, B.; Recke, B.; Knudsen, J.K.; Jørgensen, S.B. A systematic approach for soft sensor development. Comput. Chem. Eng. 2007, 31, 419–425. [Google Scholar] [CrossRef]
  21. Kano, M.; Fujiwara, K. Virtual sensing technology in process industries: Trends and challenges revealed by recent industrial applications. J. Chem. Eng. Jpn. 2013, 46, 1–17. [Google Scholar] [CrossRef] [Green Version]
  22. Tham, M.T.; Montague, G.A.; Morris, A.J.; Lant, P.A. Soft-sensors for process estimation and inferential control. J. Process Control 1991, 1, 3–14. [Google Scholar] [CrossRef]
  23. Fortuna, L.; Graziani, S.; Rizzo, A.; Xibilia, M.G. Soft Sensors for Monitoring and Control of Industrial Processes; Springer Science & Business Media: Berlin, Germany, 2007. [Google Scholar]
  24. Kerschen, G.; De Boe, P.; Golinval, J.C.; Worden, K. Sensor validation using principal component analysis. Smart Mater. Struct. 2004, 14, 36. [Google Scholar] [CrossRef]
  25. Garvey, J.; Garvey, D.; Seibert, R.; Hines, J. Nuclear power plant on-line sensor calibration monitoring implementation issues. Int. J. Nucl. Knowl. Manag. 2007, 2, 204–223. [Google Scholar] [CrossRef]
  26. Nair, A.M. Bayesian framework for high confidence signal validation for online monitoring systems in nuclear power plants. Master’s Thesis, University of Tennessee, Knoxville, TN, USA, 2016. [Google Scholar]
  27. Ray, A.; Desai, M. A calibration and estimation filter for multiply redundant measurement systems. ASME J. Dyn. Syst. Meas. Control 1984, 106, 149–156. [Google Scholar] [CrossRef]
  28. Haimi, H.; Mulas, M.; Corona, F.; Vahala, R. Data-derived soft-sensors for biological wastewater treatment plants: An overview. Environ. Model. Softw. 2013, 47, 88–107. [Google Scholar] [CrossRef]
  29. Khatibisepehr, S. Bayesian Solutions to Multi-Model Inferential Sensing Problems. Ph.D. Thesis, University of Alberta, Edmonton, AB, Canada, 2013. [Google Scholar]
  30. Grbić, R.; Kurtagić, D.; Slišković, D. Stream water temperature prediction based on Gaussian process regression. Expert Syst. Appl. 2013, 40, 7407–7414. [Google Scholar] [CrossRef]
  31. Ramuhalli, P.; Lin, G.; Crawford, S.; Konomi, B.; Coble, J.; Shumaker, B.; Hashemian, H. Uncertainty Quantification Techniques for Sensor Calibration Monitoring in Nuclear Power Plants; Technical Report; Pacific Northwest National Laboratory: Richland, WA, USA, 2014. [Google Scholar]
  32. Hines, J.W. Improved methods for on-line sensor calibration verification. In Proceedings of the ICONE 88th International Conference on Nuclear Engineering, Baltimore, MD, USA, 2–6 April 2000. [Google Scholar]
  33. Grbić, R.; Slišković, D.; Kadlec, P. Adaptive soft sensor for online prediction and process monitoring based on a mixture of Gaussian process models. Comput. Chem. Eng. 2013, 58, 84–97. [Google Scholar] [CrossRef]
  34. Kadlec, P.; Gabrys, B.; Strandt, S. Data-driven Soft Sensors in the process industry. Comput. Chem. Eng. 2009, 33, 795–814. [Google Scholar] [CrossRef] [Green Version]
  35. Khatibisepehr, S.; Huang, B. A Bayesian approach to robust process identification with ARX models. AIChE J. 2013, 59, 845–859. [Google Scholar] [CrossRef]
  36. Khatibisepehr, S.; Huang, B.; Xu, F.; Espejo, A. A Bayesian approach to design of adaptive multi-model inferential sensors with application in oil sand industry. J. Process Control 2012, 22, 1913–1929. [Google Scholar] [CrossRef]
  37. Lu, B.; Chiang, L. Semi-supervised online soft sensor maintenance experiences in the chemical industry. J. Process Control 2018, 67, 23–34. [Google Scholar] [CrossRef]
  38. Campbell, J.D.; Reyes-Picknell, J.V. Uptime: Strategies for Excellence in Maintenance Management; CRC Press: Cleveland, OH, USA, 2015. [Google Scholar]
  39. Kelly, A. Maintenance Systems and Documentation; Butterworth-Heinemann: Oxford, UK, 2006. [Google Scholar]
  40. Molina, R.; Unsworth, K.; Hodkiewicz, M.; Adriasola, E. Are managerial pressure, technological control and intrinsic motivation effective in improving data quality? Reliab. Eng. Syst. Saf. 2013, 119, 26–34. [Google Scholar] [CrossRef]
  41. Unsworth, K.; Adriasola, E.; Johnston-Billings, A.; Dmitrieva, A.; Hodkiewicz, M. Goal hierarchy: Improving asset data quality by improving motivation. Reliab. Eng. Syst. Saf. 2011, 96, 1474–1481. [Google Scholar] [CrossRef]
  42. EPRI. On-Line Monitoring of Instrument Channel Performance: TR-104965-R1 NRC SER; Technical Report; Electric Power Research Institute: Palo Alto, CA, USA, 2000. [Google Scholar]
  43. Venkatasubramanian, V.; Rengaswamy, R.; Yin, K.; Kavuri, S.N. A review of process fault detection and diagnosis: Part I: Quantitative model-based methods. Comput. Chem. Eng. 2003, 27, 293–311. [Google Scholar] [CrossRef]
  44. Hines, J. On-Line Monitoring for Calibration Extension: An Overview and Introduction; Technical Report; University of Tennessee: Knoxville, TN, USA, 2008. [Google Scholar]
  45. Coble, J.; Ramuhalli, P.; Meyer, R.; Hashemian, H.; Shumaker, B.; Cummins, D. Calibration monitoring for sensor calibration interval extension: Identifying technical gaps. In Proceedings of the 2012 Future of Instrumentation International Workshop (FIIW) Proceedings, Gatlinburg, TN, USA, 8–9 October 2012; pp. 1–4. [Google Scholar] [CrossRef]
  46. Hashemian, H.M.; Bean, W.C. State-of-the-Art Predictive Maintenance Techniques. IEEE Trans. Instrum. Meas. 2011, 60, 3480–3492. [Google Scholar] [CrossRef]
  47. Coble, J.; Meyer, R.; Ramuhalli, P.; Bond, L.; Hashemian, H.; Schumaker, B.; Cummins, D. A Review of Sensor Calibration Monitoring for Calibration Interval Extension in Nuclear Power Plants; Technical Report; Pacific Northwest National Laboratory: Richland, WA, USA, 2012. [Google Scholar]
  48. Qin, S.J.; Yue, H.; Dunia, R. Self-validating inferential sensors with application to air emission monitoring. Ind. Eng. Chem. Res. 1997, 36, 1675–1685. [Google Scholar] [CrossRef]
  49. Dunia, R.; Qin, S.J. Joint diagnosis of process and sensor faults using principal component analysis. Control Eng. Pract. 1998, 6, 457–469. [Google Scholar] [CrossRef]
  50. Alag, S.; Agogino, A.M.; Morjaria, M. A methodology for intelligent sensor measurement, validation, fusion, and fault detection for equipment monitoring and diagnostics. AI EDAM 2001, 15, 307–320. [Google Scholar] [CrossRef] [Green Version]
  51. Kamohara, H.; Takinami, A.; Takeda, M.; Kano, M.; Hasebe, S.; Hashimoto, I. Product quality estimation and operating condition monitoring for industrial ethylene fractionator. J. Chem. Eng. Jpn. 2004, 37, 422–428. [Google Scholar] [CrossRef]
  52. Wang, S.; Xiao, F. AHU sensor fault diagnosis using principal component analysis method. Energy Build. 2004, 36, 147–160. [Google Scholar] [CrossRef]
  53. Shengwei, W.; Xiao, F. Sensor fault detection and diagnosis of air-handling units using a condition-based adaptive statistical method. HVAC&R Res. 2006, 12, 127–150. [Google Scholar]
  54. Wang, S.; Cui, J. Sensor-fault detection, diagnosis and estimation for centrifugal chiller systems using principal-component analysis method. Appl. Energy 2005, 82, 197–213. [Google Scholar] [CrossRef]
  55. Abdelghani, M.; Friswell, M.I. Sensor validation for structural systems with multiplicative sensor faults. Mech. Syst. Signal Process. 2007, 21, 270–279. [Google Scholar] [CrossRef]
  56. Kaneko, H.; Arakawa, M.; Funatsu, K. Development of a new soft sensor method using independent component analysis and partial least squares. AIChE J. 2009, 55, 87–98. [Google Scholar] [CrossRef]
  57. Liu, J.; Chen, D.S.; Shen, J.F. Development of self-validating soft sensors using fast moving window partial least squares. Ind. Eng. Chem. Res. 2010, 49, 11530–11546. [Google Scholar] [CrossRef]
  58. Kullaa, J. Sensor validation using minimum mean square error estimation. Mech. Syst. Signal Process. 2010, 24, 1444–1457. [Google Scholar] [CrossRef]
  59. Kullaa, J. Detection, identification, and quantification of sensor fault in a sensor network. Mech. Syst. Signal Process. 2013, 40, 208–221. [Google Scholar] [CrossRef]
  60. Kullaa, J. Distinguishing between sensor fault, structural damage, and environmental or operational effects in structural health monitoring. Mech. Syst. Signal Process. 2011, 25, 2976–2989. [Google Scholar] [CrossRef]
  61. Rao, A.R.M.; Kasireddy, V.; Gopalakrishnan, N.; Lakshmi, K. Sensor fault detection in structural health monitoring using null subspace–based approach. J. Intell. Mater. Syst. Struct. 2015, 26, 172–185. [Google Scholar] [CrossRef]
  62. Huand, H.B.; Yi, T.H.; Li, H.N. Bayesian combination of weighted principal-component analysis for diagnosing sensor faults in structural monitoring systems. J. Eng. Mech. 2017, 143, 1–16. [Google Scholar]
Figure 1. Elements of a MEMS based sensing node.
Civileng 01 00007 g001
Figure 2. (a) The ADXL345 chip is an example of a MEMS-based sensing device. (b) The ESP8266 is an example of a wifi-enabled edge device.
Civileng 01 00007 g002
Figure 3. Framework for sensor validation management in CM&SI applications.
Civileng 01 00007 g003
Figure 4. Development and maintenance steps for a soft sensor model, adapted from [28].
Civileng 01 00007 g004
Figure 5. Elements impacting cost-effectiveness of soft sensor models.
Civileng 01 00007 g005
Table 1. Soft sensor validation models with industry applications.
First Author & YearApproachFieldIndustry Sector
Ray, 1984 [27]Adaptive filterProcess variables (11)Operating nuclear reactor
Qin, 1997 & Dunia, 1998 [48,49]PCAProcess variables (8)Industrial boiler
Alag, 2000 [50]Fuzzy-neural networkProcess variables (NA)Gas turbine
Kamohara, 2004 [51]PLSProcess variables (18)Ethylene plant
Wang, 2004 & 2006 [52,53]PCAProcess variables (8)Air handling unit
Wang, 2005 [54]PCAProcess variables (8)Centrifugal chiller
Fortuna, 2007 [23]Neural networkStrain gauges (32)Experimental fusion reactor
Abdelghani, 2007 [55]Modal residualsPiezo accelerometers (28)Lab steel subframe
Kaneko, 2009 [56]PLS & ICAProcess variables (19)Distillation column
Liu, 2010 [57]PLS with moving windowProcess variables (18)Air separation process
Kulaa, 2010-2013 [58,59,60]MMSE & Gaussian processPiezo accelerometers (15)Lab-scale Wooden bridge
Hernandez-Garcia, 2014 [9]PCA & ICAPiezo accelerometers (15)Cable suspension bridge
Rao, 2015 [61]Null subspaceMEMS accelerometers (20)Lab-scale concrete bridge
Huang, 2017 [62]Bayesian inference and PCAPiezo accelerometers (16)Lab-scale benchmark model

