
Development of Roughness Prediction Models for Laos National Road Network


Graduate School of Engineering, Nagasaki University, 1-14 Bunkyo-Machi, Nagasaki 852-8521, Japan
*
Author to whom correspondence should be addressed.
CivilEng 2021, 2(1), 158-173; https://0-doi-org.brum.beds.ac.uk/10.3390/civileng2010009
Submission received: 23 December 2020
/
Revised: 22 January 2021
/
Accepted: 28 January 2021
/
Published: 11 February 2021
(This article belongs to the Special Issue Advances in Civil Engineering)
Abstract
:The International Roughness Index (IRI) has been accepted globally as an essential indicator for assessing pavement condition. The Laos Road Management System (RMS) utilizes a default Highway Development and Management (HDM-4) IRI prediction model. However, developed IRI values have shown the need to calibrate the IRI prediction model. Data records are not fully available for Laos yet, making it difficult to calibrate IRI for the local conditions. This paper aims to develop an IRI prediction model for the National Road Network (NRN) based on the available Laos RMS database. The Multiple Linear Regression (MLR) analysis technique was applied to develop two new IRI prediction models for Double Bituminous Surface Treatment (DBST) and Asphalt Concrete (AC) pavement sections. The final database consisted of 83 sections with 269 observations over a 1850 km length of DBST NRN and 29 sections with 122 observations over a 718 km length of AC NRN. The proposed models predict IRI as a function of pavement age and Cumulative Equivalent Single-Axle Load (CESAL). The model’s parameter analysis confirmed their significance, and R2 values were 0.89 and 0.84 for DBST and AC models, respectively. It can be concluded that the developed models can serve as a useful tool for engineers maintaining paved NRN.
1. Introduction
As a landlocked country [1], the Lao People’s Democratic Republic’s (Lao PDR) connectedness with adjoining countries is of pivotal significance [2]. As the country has no harbor and has only 3.5 km of the railway link at the Thai border, the road network is an essential means of transportation to link Laos with its neighbors and within the country [3]. The transport sector is dominated by the road subsector, sharing 98% of the entire passenger-kilometers traveled and 86% of freight moved in the homeland [4].
The Laos road network is split into six classes: (I) National Roads (NRs) link the national capital to other provincial capitals and commercial centers and reach the global borders; (ii) Provincial Roads (PRs) link provincial capitals to district centers, river ports, tourist and important historic sites of the province; (iii) District Roads (DRs) link district commercial centers to rural areas; (iv) Urban Roads (URs), which are internal to cities and towns; (v) Rural Roads (RRs) link rural areas and utilities serving the rural houses; and (vi) Special Roads (SRs) serve definite purposes, such as connecting to sightseeing areas [5,6].
Significant expansion in the Lao PDR’s road network has occurred over the last three decades [3]. The road network length has increased from 14,000 km in 1990 to 60,560 km in 2018. As shown in Table 1 [7], the highest share of the total length of the network was RRs (43.23%), followed by PRs (14.02%) and NRs (12.45%), and the remaining 30.30% were DRs, URs, and SRs.
Paved roads are grouped into three families: Cement Concrete (CC), Asphalt Concrete (AC), and Double Bituminous Surface Treatment (DBST). While the road network in Laos is extensive, only 19.27% of the roads’ total length is paved (using CC, AC, and DBST), 38.29% is gravel, and the residual 42.45% is of earth construction.
The NRs cover approximately 7540 km of the road network, the majority of which (86.30%) have a paved surface, whereas RRs, URs, DRs, PRs, and SRs are generally earth or gravel roads and are vulnerable to pouring rain and floods. Most NRs’ paved sections are DBST (71.96%), while AC and CC comprise only 13.20% and 1.14% of them, respectively.
Pavement condition can be assessed depending on four aspects: structural capacity, surface distress, skid resistance, and ride quality [8]. Ride quality is commonly connected with users’ comfort level regarding the traveled roadway, which is influenced by pavement roughness [9]. Pavement roughness illustrates unevenness in the roadways’ surface, which is calculated in terms of the International Roughness Index (IRI) [10].
The IRI is so-called because it was an output of the International Road Roughness Experiment (IRRE), executed by researchers from the United States, England, Brazil, Belgium, and France to identify such an index [11]. In 1982 [12], the IRRE was launched by the World Bank to create correlation and a calibration standard for roughness measurements [13]. The IRRE involved the controlled measurement of road roughness for several roads under various conditions and by a variety of methods and equipment [11].
The prime principles in designing the IRI were being transportable, relevant, and settled over time while also being measured easily [11,14]. It had to be measurable with a broad range of equipment to secure transportability, including response-type systems. It had to be described as a mathematical conversion of a measured profile to be steady over time [15].
The IRI is defined as “the accumulated suspension vertical motion divided by the distance traveled as obtained from a mathematical model of a simulated quarter-car traversing a measured profile at 80 km/h” [15,16]. IRI values are expressed as the slope units (m/km, in/mi, etc.), with a high value indicating extremely rough road [17]. The lower the IRI value, the flatter the paved surface [18].
The IRI epitomizes the roughness condition that affects vehicle response and is of utmost suitability for evaluating overall vehicle operating cost, overall ride quality, dynamic wheel loads [14], and general surface condition [19].
The IRI data are usually surveyed by the Laos Public Works and Transport Institute (PTI) at different frequencies, depending on the available funds [20]. The NRN is monitored at frequent intervals, often 2–3-year intervals. Paved sections are categorized into six groups, based on predetermined criteria for roughness adequacy, as shown in Table 2.
A well-constructed pavement, newly laid, also has an initial IRI value (IRI just after construction), and it continues to rise over time where the pavement deteriorates [21]. Pavement deterioration can be attributed to different factors such as traffic loads, pavement age, material properties, environment condition, subgrade properties, and pavement strength, which influence the pavement’s mechanical characteristics [8]. Many highway agencies worldwide deal with the initial IRI value as a quality assertion norm and the terminal IRI as an index of required pavement maintenance and rehabilitation activities [22].
An IRI condition survey of the NRN was conducted in 2016, which pointed out that 48% of the paved sections were in excellent, good, or fair condition, with nearly 30% in bad or poor condition and approximately 22% categorized as having failed [20]. A Vehicle Intelligent Monitoring System (VIMS) was introduced as the IRI survey equipment. It was found to be relatively accurate and less expensive than other systems, which usually require a specially equipped vehicle to measure IRI. VIMS was introduced under the technical support of Nagasaki University [23].
In 2004, as a result of limited budget and growing challenges in pavement maintenance and rehabilitation strategies, the Road Management System (RMS) was developed for NRs based on Highway Development and Management (HDM-4) models with aid from the World Bank [24]. RMS comprises several analysis modules, such as a Road Database (RDB), Bridge Management System (BMS), Pavement Management System (PMS), and Traffic Monitoring System (TMS).
RMS is used to formulate road’s short- and medium-term maintenance strategies, select priority projects, and choose optimum maintenance activity plans. In 2008, RMS was incorporated with the Provincial and Rural Roads Management System (PRoMMS), so it became achievable to develop maintenance plans for rural and provincial roads too [24].
The RMS/PRoMMS database has been improved and updated throughout the period (2012–2016) by the JICA expert team as part of the Project “Improvement of Road Management Capability in Lao PDR” [23]. The pavement deterioration models are essential for PMS and are utilized to define various functions [8], as follows:
- Rate of pavement degradation at both the project and network level,
- Evaluation of pavement assets (residual service life), and
- Road user costs.
Laos PMS utilizes a default HDM-4 pavement deterioration models to predict IRI. However, developed IRI values have illustrated the need to calibrate the IRI forecasting model based on Laos’ local conditions or create a new IRI model.
Over the years, research agencies and individual researchers have developed various IRI prediction models [21,22,25,26,27,28,29,30,31,32,33,34,35]. Some of these models were developed utilizing the Long-Term Pavement Performance (LTPP) database, whereas others were derived depending on direct field measurements or the domestic agency database. The results from some of these studies are summed up in Table 3.
From the above literature review, it is apparent that the variables such as pavement age, the structural strength of pavement, traffic loads, pavement defects, and environmental conditions enormously affect the progression of roughness (IRI value). The calibration and application of the Mechanistic–Empirical Pavement Design Guide (MEPDG) or HDM-4 models by highway agencies demand detailed and precise distress data [36]. Such data records are not quite available for Laos yet, making it difficult to calibrate the HDM-4 IRI prediction model for local conditions.
So, the domestic roughness deterioration models for various pavement categories have to be developed covering the influence of Laos’ local conditions, which would have direct implementation without any calibration factors based on accessible data in the Laos RMS. The developed models’ primary objective is to evaluate and predict the Laos NRN’s condition to assist the responsible authorities in making consistent and cost-effective decisions related to pavement sections’ maintenance and rehabilitation.
2. Methodology
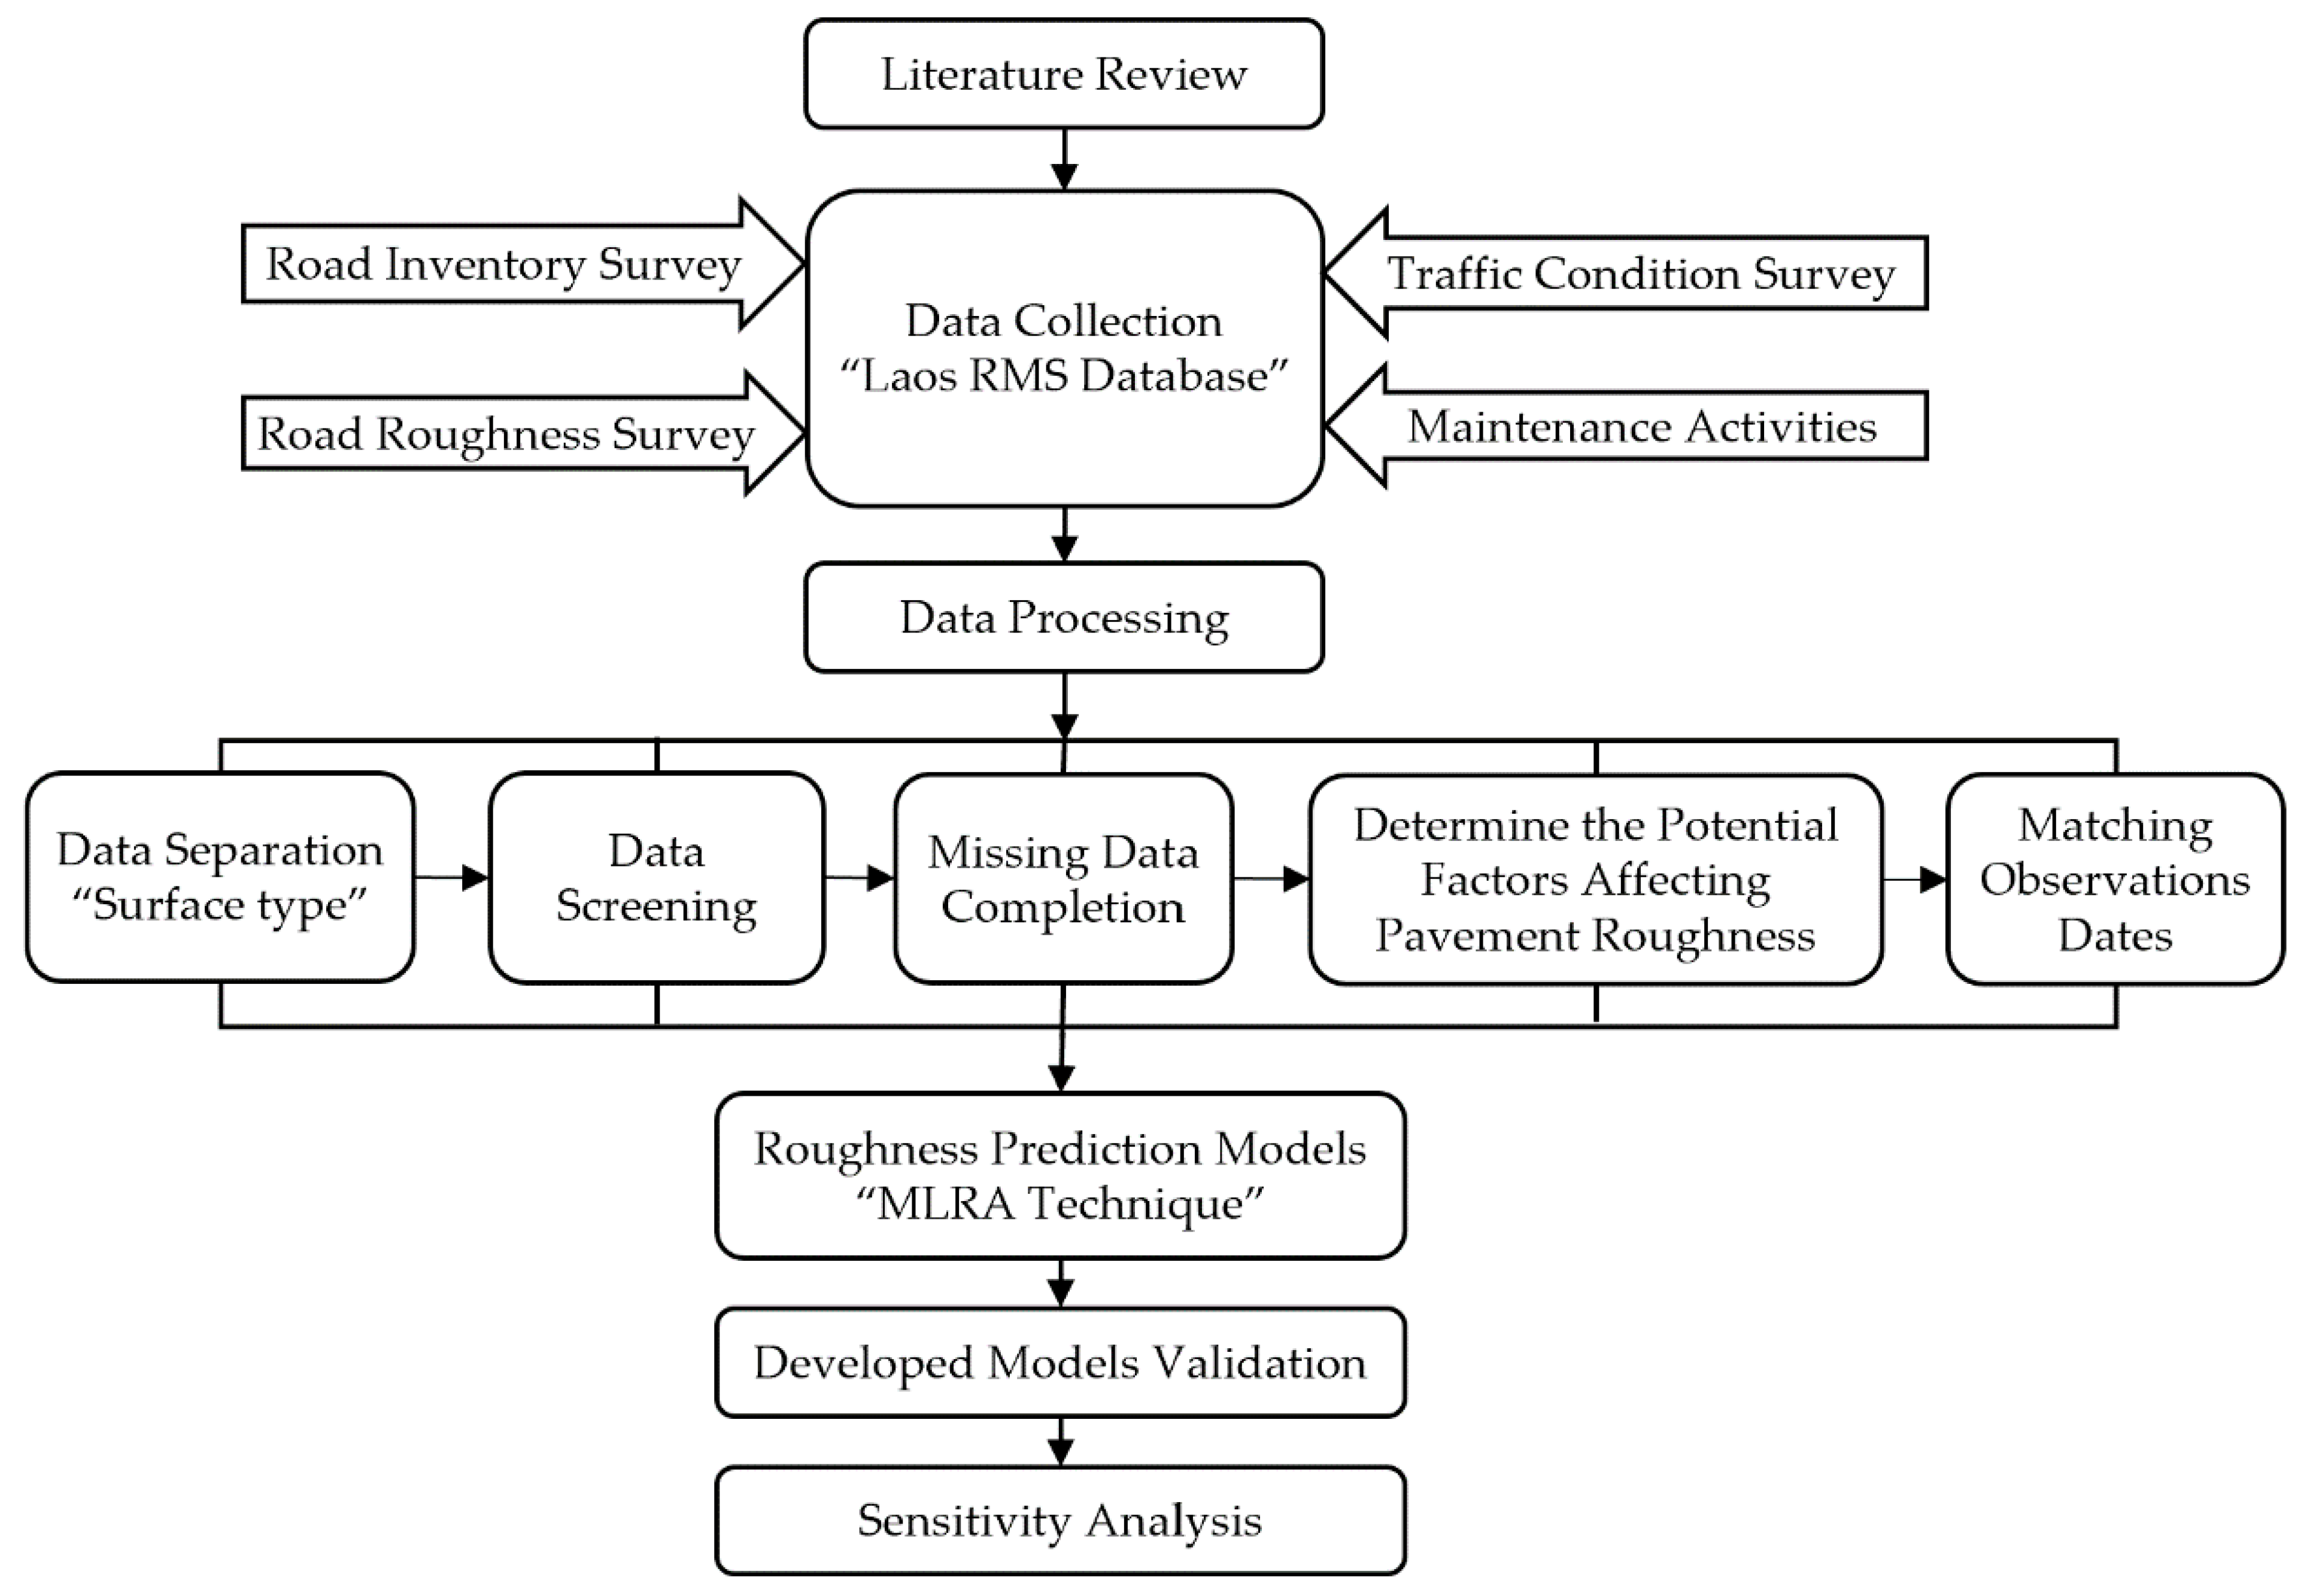
The research methodology followed in this study began by reviewing the pertinent literature. The required data were then collected from different resources, mainly from the Laos RMS database. After that, the data processing was accomplished. Finally, the MLR analysis technique in Statistical Package for the Social Sciences (SPSS) was applied to evolve a regression model to correlate IRI with the study’s variables. Fundamental statistical analyses were conducted to verify and explain the proposed models’ sensitivity. The research methodology is summed up in Figure 1.
2.1. Data Collection
A broad number of precise and valid data are necessary to develop a regression model of the IRI and the variable’s effect on it. This study was planned to cover 14 years, starting from 2001 to 2015, to track development trends of pavement roughness condition over a total length of 7540 km of the NRN.
Every road in the NRN is separated into homogeneous sections. A homogeneous section can be defined as “a section of pavement that has uniform characteristics along its length, for instance; structural design, pavement materials, subgrade condition, number of lanes, construction (by the same contract), age since opening for service, the proportion of truck traffic, and maintenance actions applied” [37]. Then, each pavement section is divided into 100 m sample units. For every homogeneous section, the following data are obtainable from the Laos RMS database:
- Road Inventory Survey (RIS): road and section number, section length and width, surface type, no. of lanes, shoulder type and width, kilometric stations, road category, and survey date.
- Road Roughness Survey (ROS): 100 m interval IRI values over each section’s entire length. The IRI data were measured at an approximate speed of 80 km/h for the right (outer) wheel track without any specific criteria for the distance from the road’s pavement edge.
- Traffic Condition Survey (TCS): annual average daily traffic (AADT), traffic growth rates, classified traffic volume survey, and vehicle classification (See Table 4).
- Last maintenance activity type and date.
2.2. Data Separation
In this study, the pavement family approach is applied [38], in which pavement sections with identical surface properties are clustered into families. The pavement sections in the NRN are clustered into families as following; AC, DBST, and CC.
After the pavement families are specified and the sections clustered correspondingly, the data for homogeneous sections are gathered from the Laos RMS database. There are six observations for each section in the following years: 2001, 2004, 2008, 2013, 2014, and 2015. An identification code is applied to define each observation. It is an unparalleled collection of attributes as follows: road number, section number, and the IRI survey year (e.g., 13N_S_2008).
2.3. Data Screening
The assembled data were thoroughly checked for irregularities and missing data from collection or documentation. The data were also reviewed and cleaned for oddity and gross data errors. In this study, the total number of 1214 observations from 254 sections covered the paved NRN. The 100 m interval IRI values were averaged over each section’s entire length.
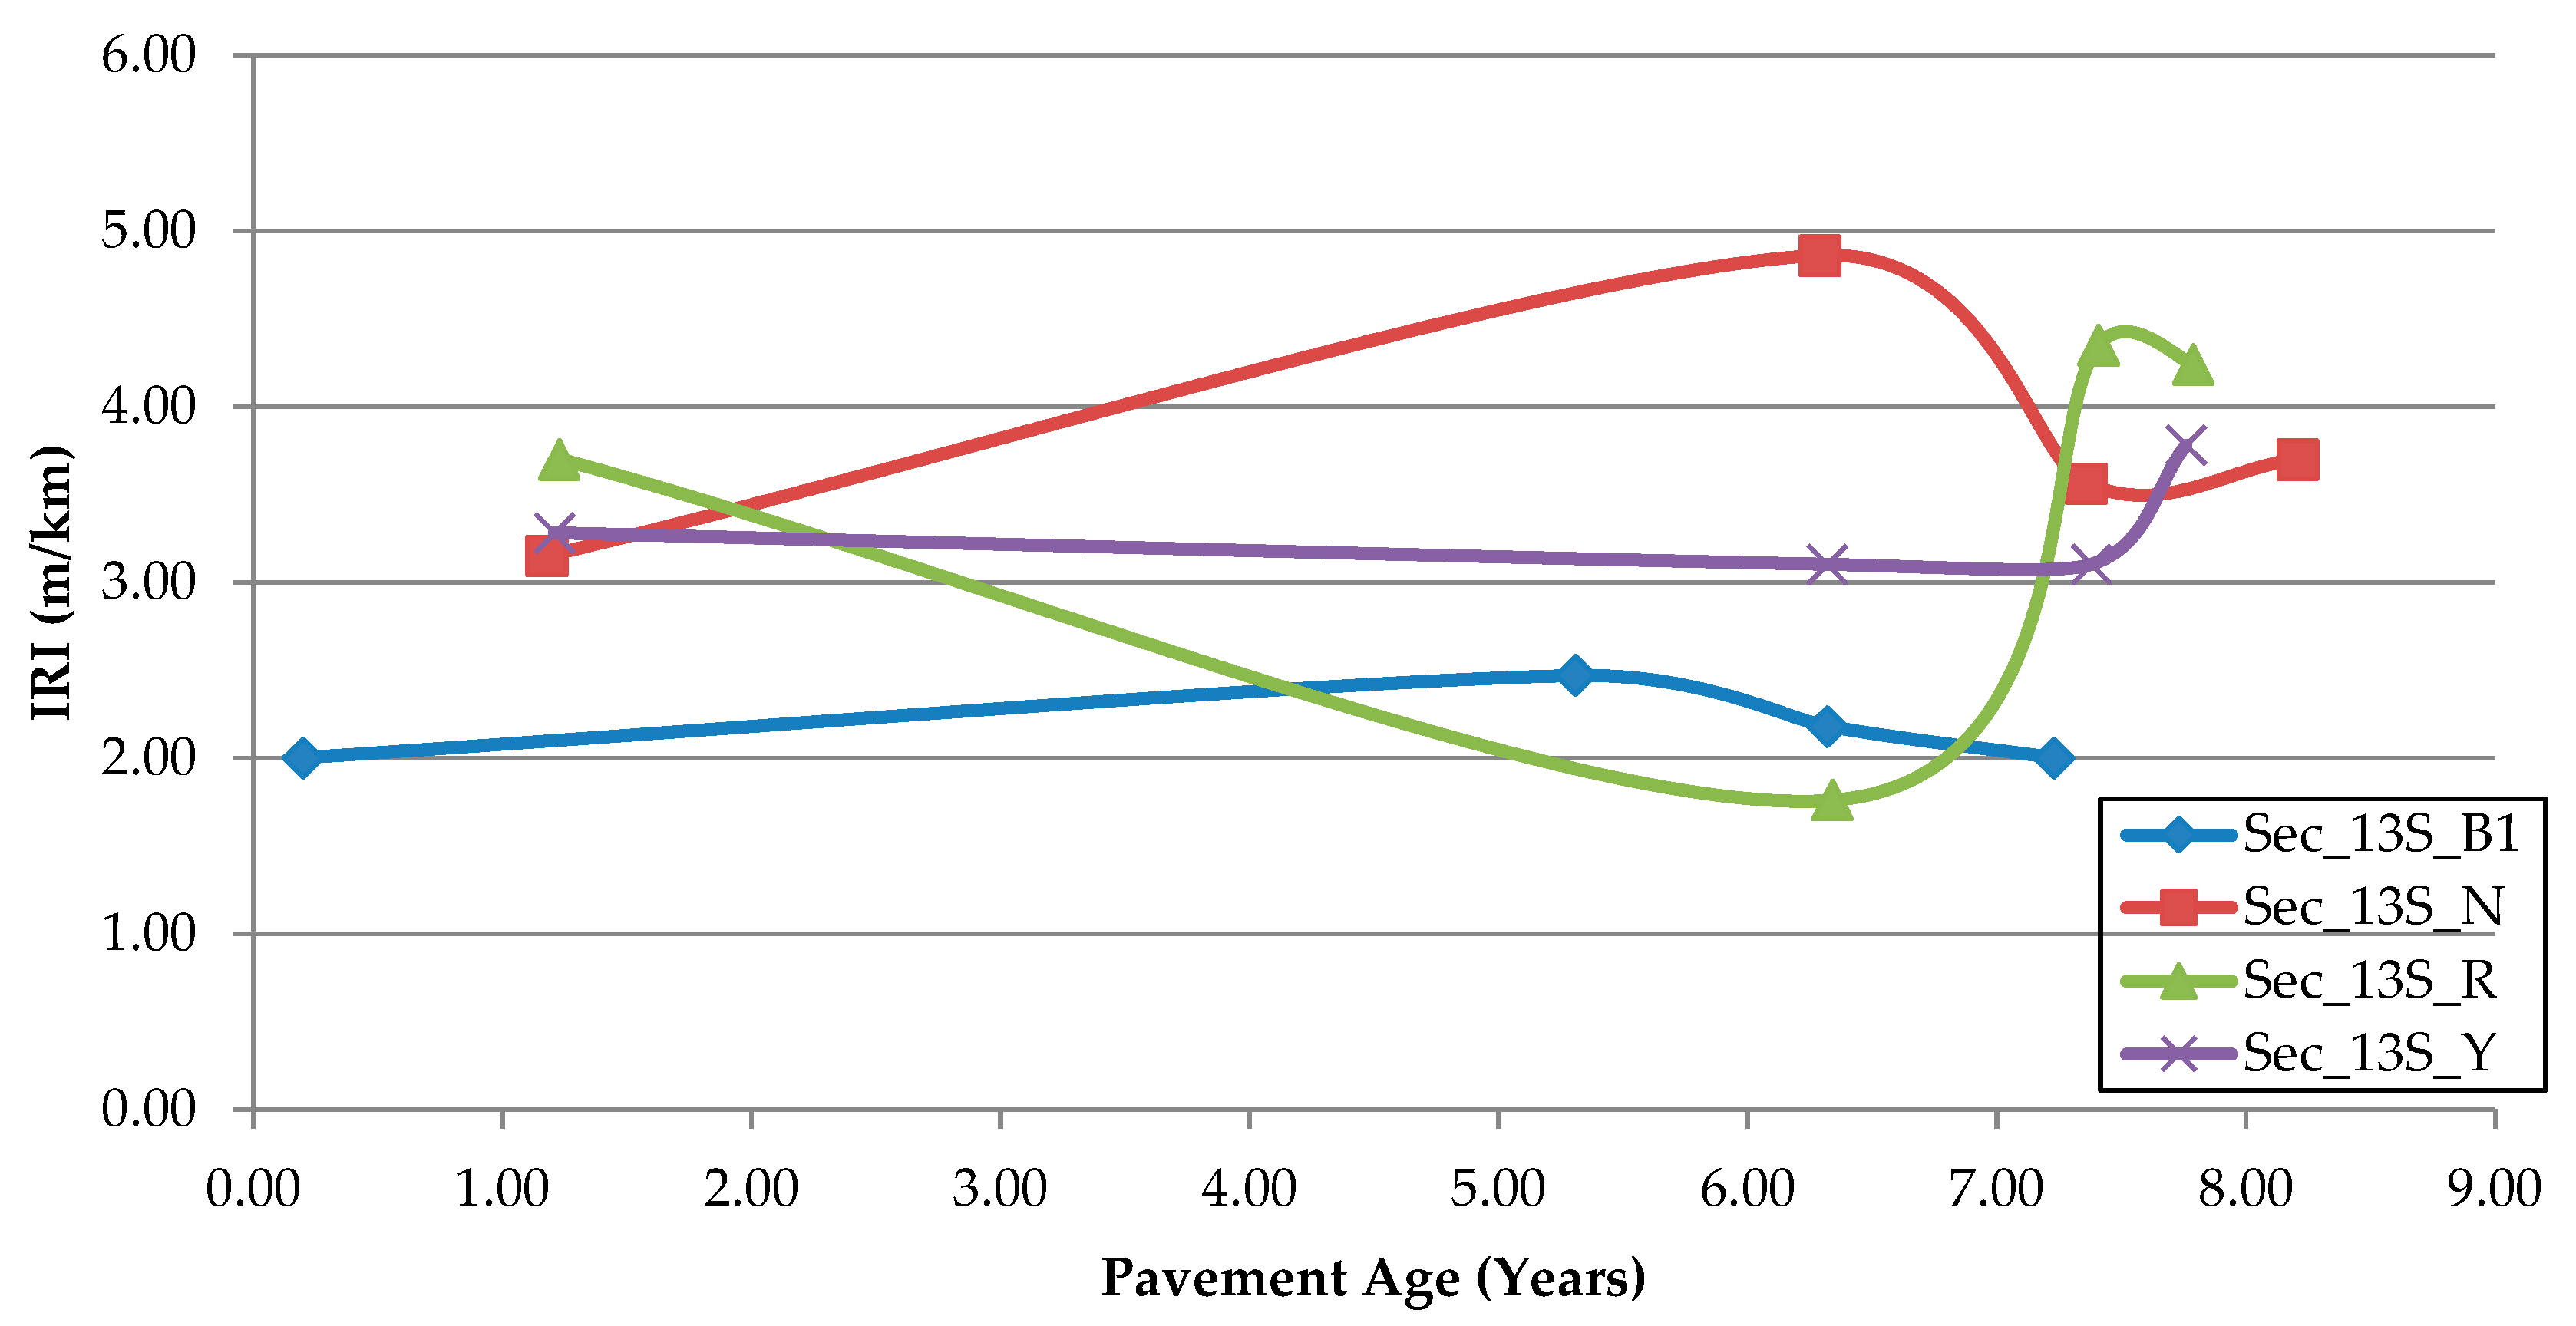
A linear relation between IRI and pavement age for whole sections was investigated to examine the IRI data against possible irregularities. The sections that demonstrated the negative trend (lessening IRI value over time) and unexplainable fluctuations in condition were excluded from this study. The negative IRI trend was observed due to the implementation of some maintenance activities on the pavement section without registration in the RMS database. Accordingly, IRI values decreased, and a negative trend appeared with pavement age, contrary to expectations of increasing IRI values due to the positive effect of the traffic loads and not carrying out any maintenance activities according to the RMS database. Figure 2 shows examples of the negative trend and fluctuations of IRI along with pavement age.
Thus, the valid number of sections and observations was diminished, as presented in Table 5. The number of valid observations available for the CC surface type was inadequate for developing a reliable model. Therefore, the analysis was limited to DBST and AC surface types, utilizing the valid number of observations, including 269 observations from 83 sections covering a total length of 1849.26 km of DBST NRs and 122 observations from 29 sections covering a total length of 718.55 km of AC NRs.
2.4. Missing Data Completion
The Laos RMS database lacks the initial AADT measurements. To overcome this problem, a regression model for every section among measured AADT and corresponding pavement age (started from the traffic opening date) was developed based on the available observations for backcasting the initial AADT data. The statistics of the developed regression models of the studied sections are summarized in Table 6.
2.5. Determining the Potential Factors Affecting Pavement Roughness
This study considered the factors of pavement age and Cumulative Equivalent Single-Axle Loads (CESAL). Despite the significant influence of the initial IRI0 value, pavement structural capacity, and subgrade soil properties on the progression of the unevenness [21,22,31,33,34,35], an assessment of the effect of those factors on IRI progression was not possible, since the Laos RMS database does not have any information regarding those variables. The same usually happens in many developing countries where pavement history data are not available, especially for the network level [39,40]. The data required to calculate pavement age and CESAL factors were extracted mainly from the Laos RMS database. Below is a brief description of these factors and how they were calculated.
2.5.1. Pavement Age
The pavement age is the usual factor employed in roughness modeling [41]. The Laos RMS database provides a survey date for IRI inspection and last maintenance activity type and application date. The variable age is calculated for every observation by subtracting the IRI survey date from the last major rehabilitation (overlay) or reconstruction date (those actions that directly influence the IRI in terms of improving smoothness after their application). The pavement age is expressed in days.
2.5.2. Cumulative Equivalent Single-Axle Load (CESAL)
A load applied on pavement varies based on the wheel configuration, traffic volume, gross vehicle weight, and the number of lanes in each direction. The impact of uneven traffic loads is transformed to a standard axle (18 kips), referred to as the Equivalent Single-Axle Load (ESAL).
Data required for calculating CESAL were collected mainly from the Laos RMS database, and other data were collected from governmental reports and the Laos road design manual. The following steps explain how to calculate CESAL:
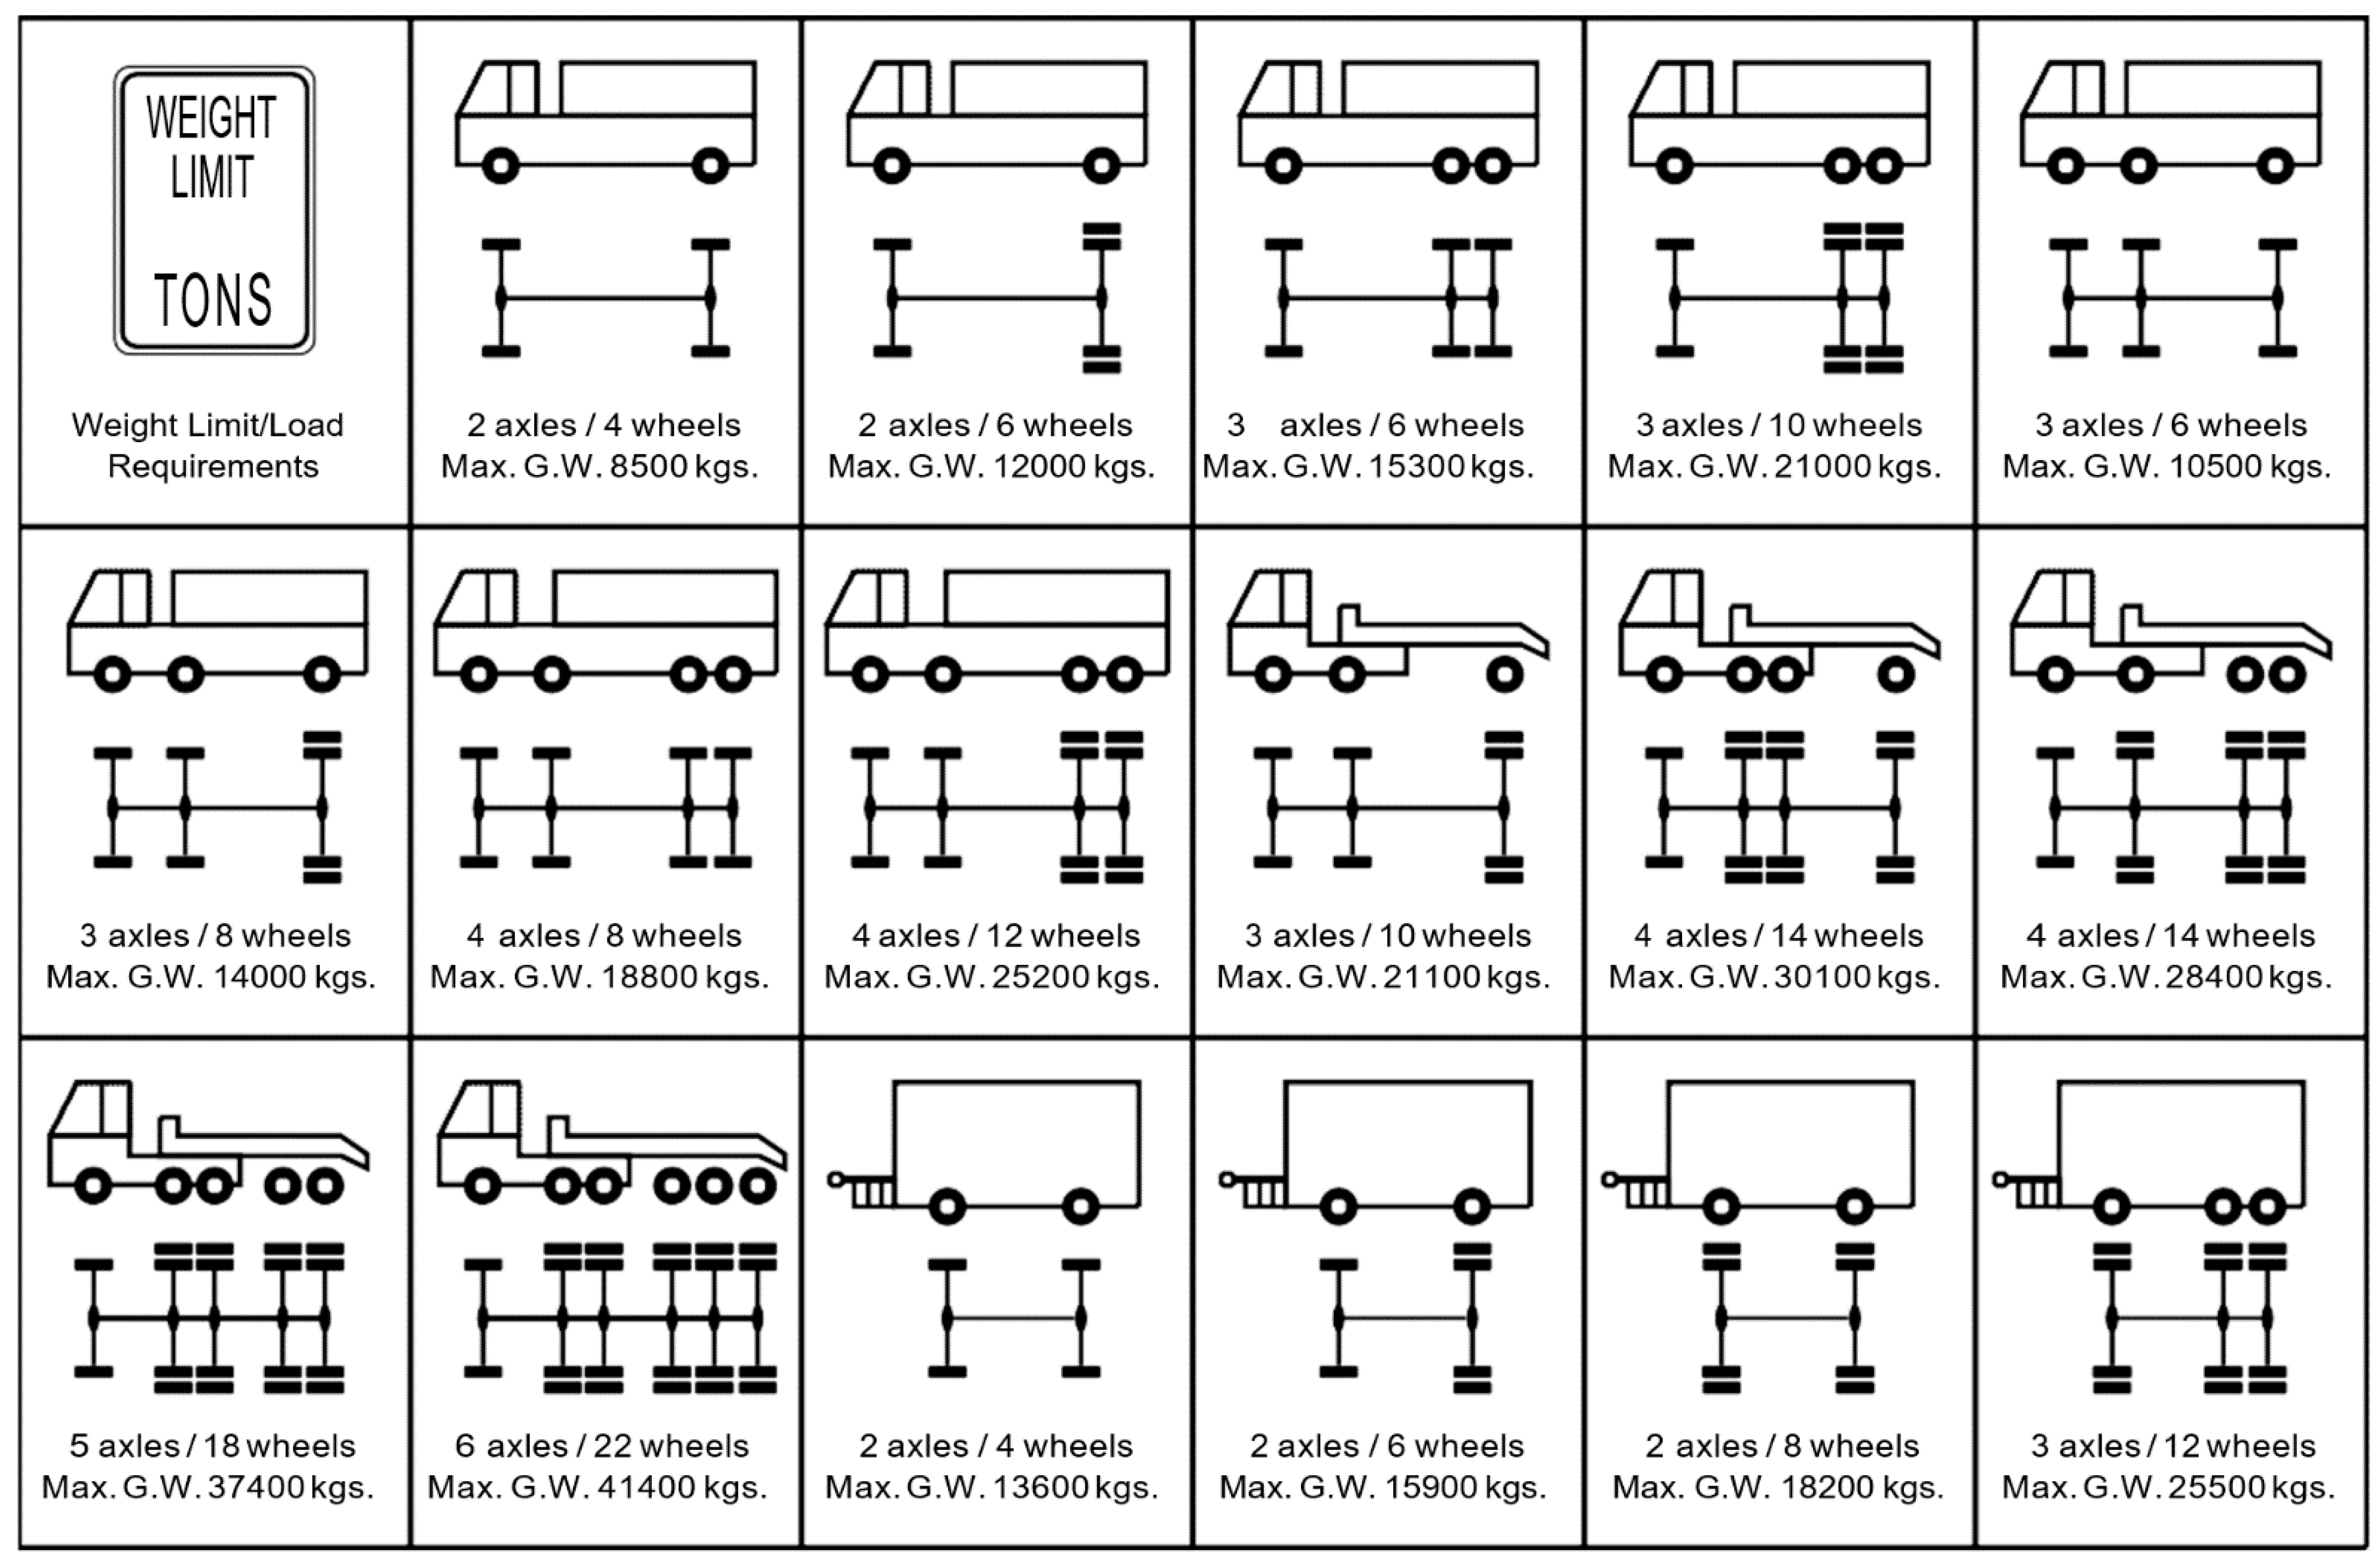
- Axle load distribution: The axle load distribution, wheel configuration, and maximum gross vehicle weight amongst commercial vehicles that use NRs were collected from the Ministry of Public Work and Transport (MPWT), Lao PDR (as shown in Figure 3). The legal axle load limits enforced in Lao PDR are as follows: 9.10 tons for single-axle 4-wheelers, 6.80 tons for single-axle 2-wheelers, 6.10 tons (per axle) for tandem-axle 4-wheelers, and 6.80 tons (per axle) for triple-axle 4-wheelers [6,42].
- Equivalent Axle Load Factor: The ratio of the destructive effect of a nonstandard axle load to a standard axle load is called the Equivalent Axle Load Factor (EALF) [44]. The number of repetitions under every single-, tandem-, or triple-axle load should be multiplied by its EALF to get the equivalent effect depending on an 80 kN single-axle load. Equation (1) is used to calculate the EALF for different axle loads applied in Laos commercial vehicles [6].
- Truck Factor (TF): TF can be counted for every vehicle by collecting all vehicle EALF values. Then, an average TF is calculated for each vehicle class (e.g., medium trucks, heavy trucks, and truck trailers) by collecting the ESAL of all vehicles in every class and dividing by the number of vehicles using Equation (2).where:TFi = Truck factor for the ith vehicle class,n = vehicle number in the ith vehicle class,EALFj = Equivalent Axle Load Factor for the jth vehicle.
- Cumulative Equivalent Single-Axle Load: The data and parameters obtained from the prior sections can now be utilized to calculate the CESAL using Equation (3) [45].where:DF = Directional Factor is the ratio of ESAL allocation by direction.LF = Lane distribution Factor is the ratio of traffic volume allocation over lanes in one direction.(AADT0)i = Initial annual average daily traffic for the ith vehicle category in both directions.TFi = Truck factor for the ith vehicle category.r = Traffic growth rate, found in the Laos RMS database.n = Design period.

2.6. Matching Observation Dates
It was noticed that both IRI measurements and traffic survey dates in Laos RMS were not necessarily surveyed simultaneously. The IRI survey date was taken as a reference date to solve this issue, where CESAL measurements for homogenous sections were calculated at its corresponding IRI survey date.
3. Result
3.1. Regression Model Development
Before the data could be analyzed, the significance of each variable calculated was first studied utilizing the Pearson correlation coefficient. Another issue that needed special attention was the problem of multicollinearity among variables. Multicollinearity emerges in the model when independent variables that are strongly correlated exist [46]. For instance, the moderate correlation between the age variable and the CESAL is 0.57 in AC data modeling.
The average Yearly Equivalent Single-Axle Loads (YESAL) ratio (average CESAL over pavement age) was used instead to overcome this problem [38]. As shown in Table 7, a good correlation exists between IRI and independent variables, while a low correlation exists between independent variables themselves to avoid multicollinearity.
The database was randomly sorted and split into two sets to eliminate any possible bias, referred to as the “in-sample” and “out-of-sample” data. The in-sample group composed most of the data, at around 80 percent, which was utilized to develop the regression models. The residual 20 percent of the data, referred to as the “out-of-sample” or “testing data”, was utilized to assess the regression equations’ prediction efficiency. The developed models would represent all sections’ mean behavior in a particular pavement family. The basic statistics of data utilized for the model’s development and validation are shown in Table 8.
IRI was chosen as the dependent variable in these models, and the counted pavement parameters—age, CESAL (DBST model), and YESAL (AC model)—were selected as the independent variables. After many modeling attempts, the most precise regression models were determined, as depicted in Table 9.
The above models show that the IRI’s average initial values for DBST and AC pavement sections after overlay or reconstruction (when age and CESAL/YESAL are considered to be zero) are 3.006 and 1.782 m/km, respectively. Further, IRI has a direct relationship with both age and CESAL/YESAL, as they appear with positive coefficients. Also observed was the high values of the coefficient of determination (R2), indicating a good correlation between the dependent variable IRI and independent variables such as age and CESAL/YESAL. This agrees with the previous studies’ findings [22,32,33,34] that IRI is directly affected by pavement age and traffic loads.
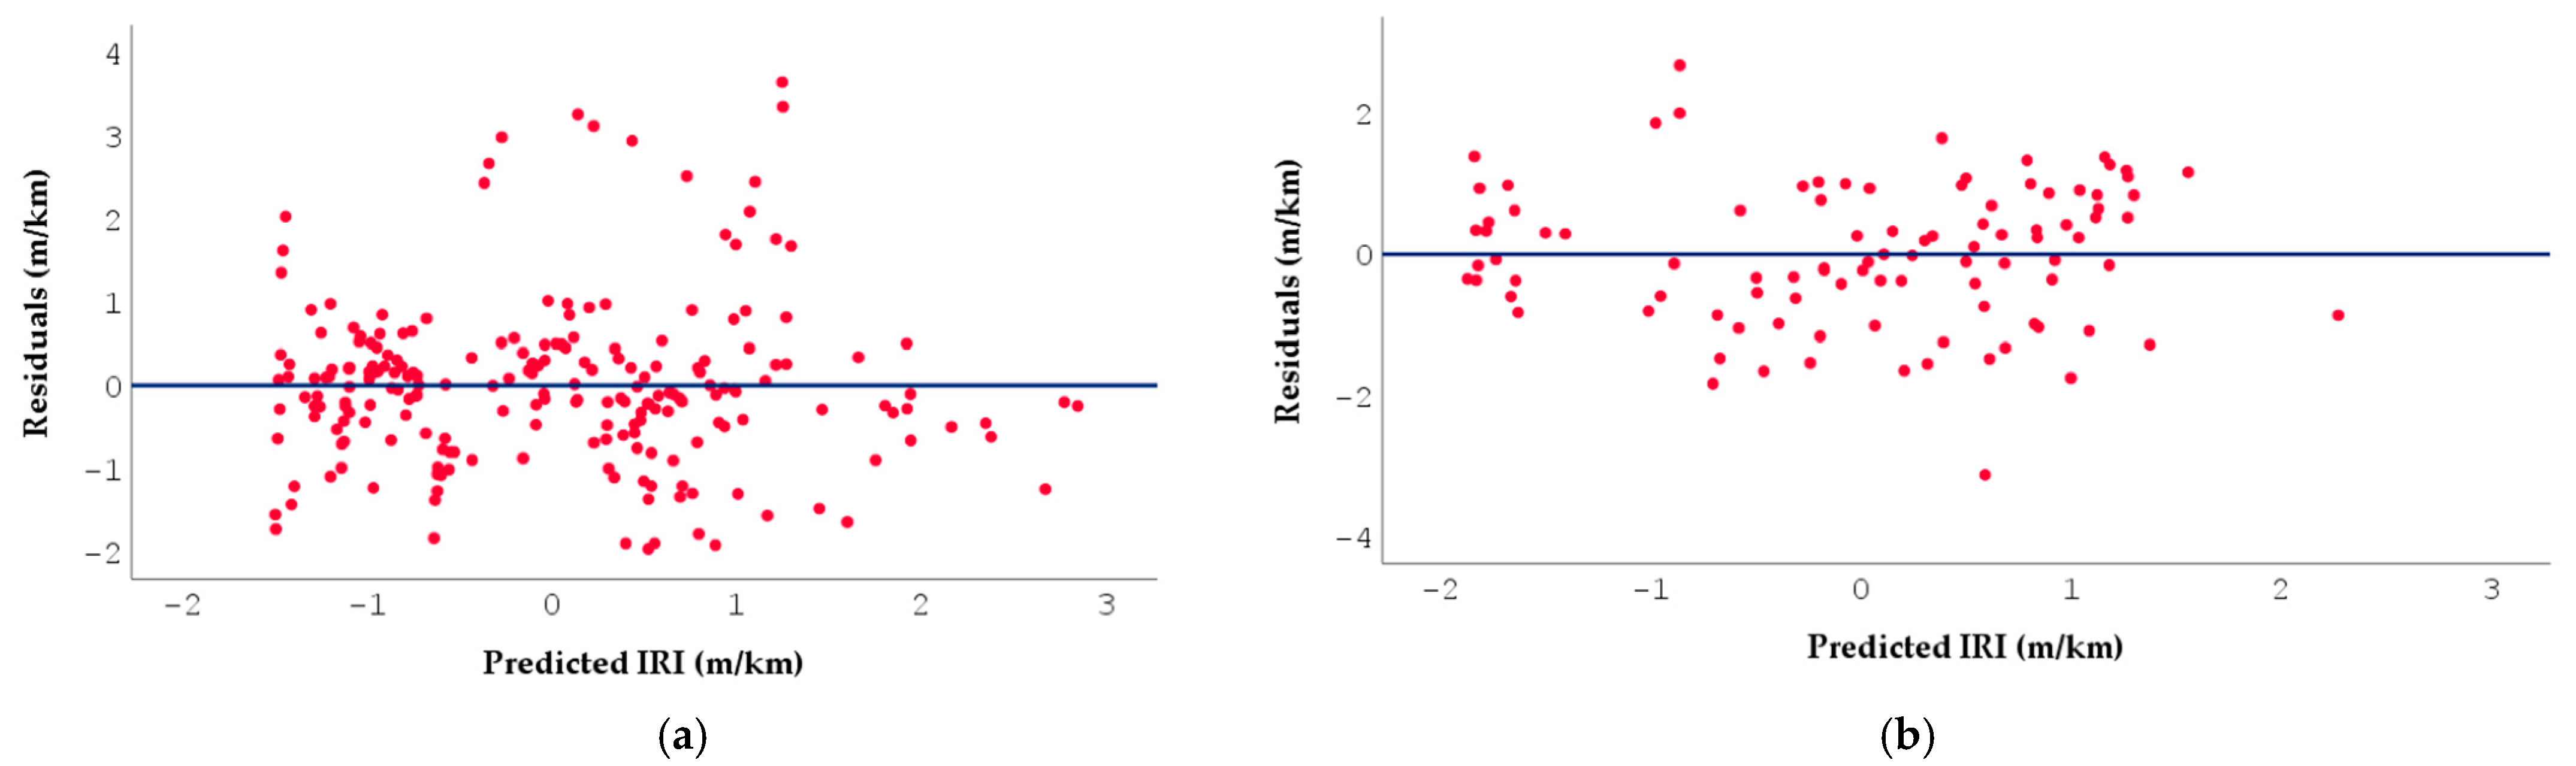
The difference between the predicted and observed IRI values (residuals) are plotted against the predicted IRI values in Figure 4. The residuals vary mainly between −2 and 2 m/km and expand in a horizontal band around the zero line. No specific pattern is observed in the residuals’ distribution, indicating a good fit for a linear model.
3.2. Model Validation
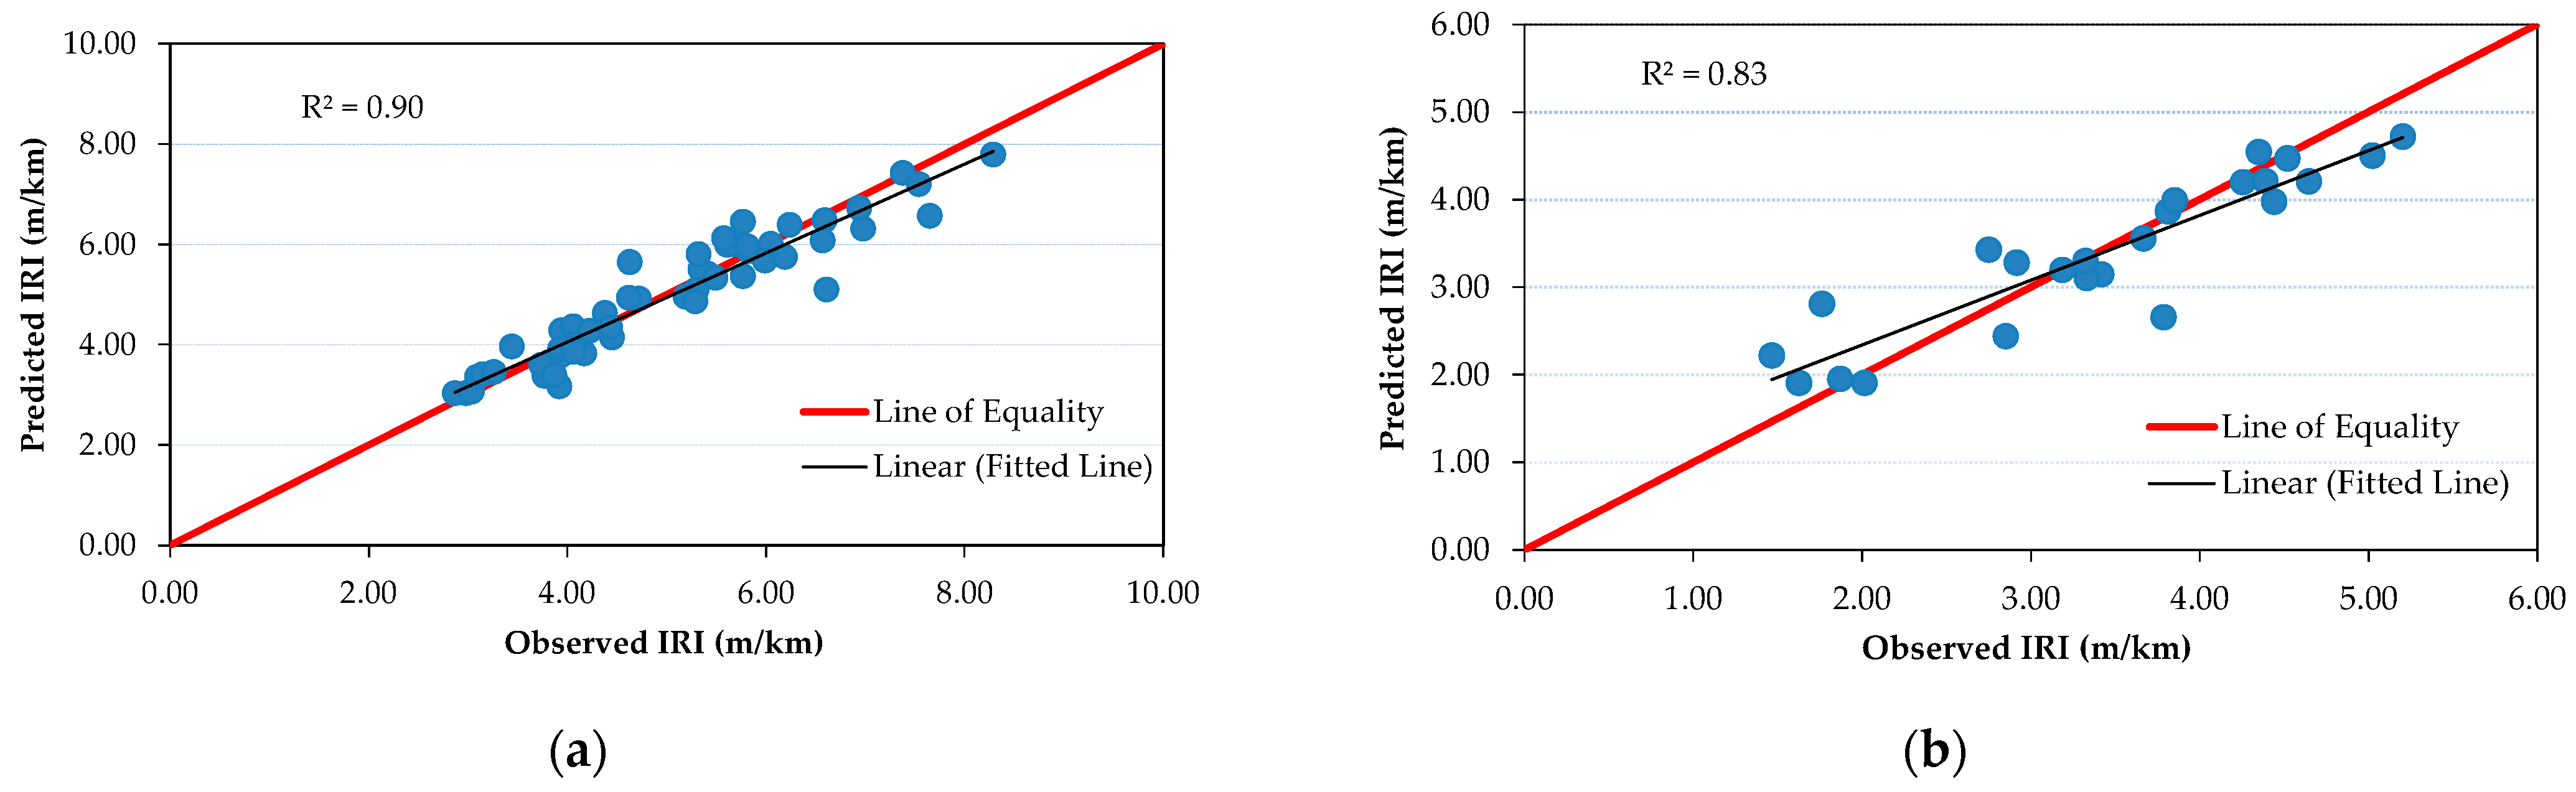
A graph of the observed IRI values of the “out of sample” data and predicted IRI values from proposed models was outputted to assess the developed models’ robustness, as illustrated in Figure 5. The alignment of sketched points along the line of equality points out the developed models’ soundness.
3.3. Statistical Validity of the Developed Models
In order to verify the models’ statistical validity and to audit the significance of the variables, an Analysis of Variance (ANOVA) was conducted on the regression outcomes. It was implemented with the null hypothesis that the IRI is not linked to pavement age and CESAL/YESAL. In contrast, the alternative hypothesis was that IRI is linked to the aforesaid independent variables. Furthermore, every independent variables’ coefficient was assessed by another hypothesis test, where the coefficient was equal to zero in the null hypothesis and was not equal to zero in the alternative hypothesis.
Table 10 and Table 11 illustrate the regression coefficients obtained from the ANOVA test and the hypothesis test. The null hypothesis in both tests is unacceptable as the p-value was less than 0.05 in both of them. Thus, all models’ variables are agreeable and significant for predicting IRI value. Also, it was observed that the Variance Inflation Factor (VIF), as shown in Table 11, has a small value (less than 10) [47] for all independent variables, which eliminates the potential of multicollinearity among them.
3.4. Sensitivity Analysis of Roughness Models
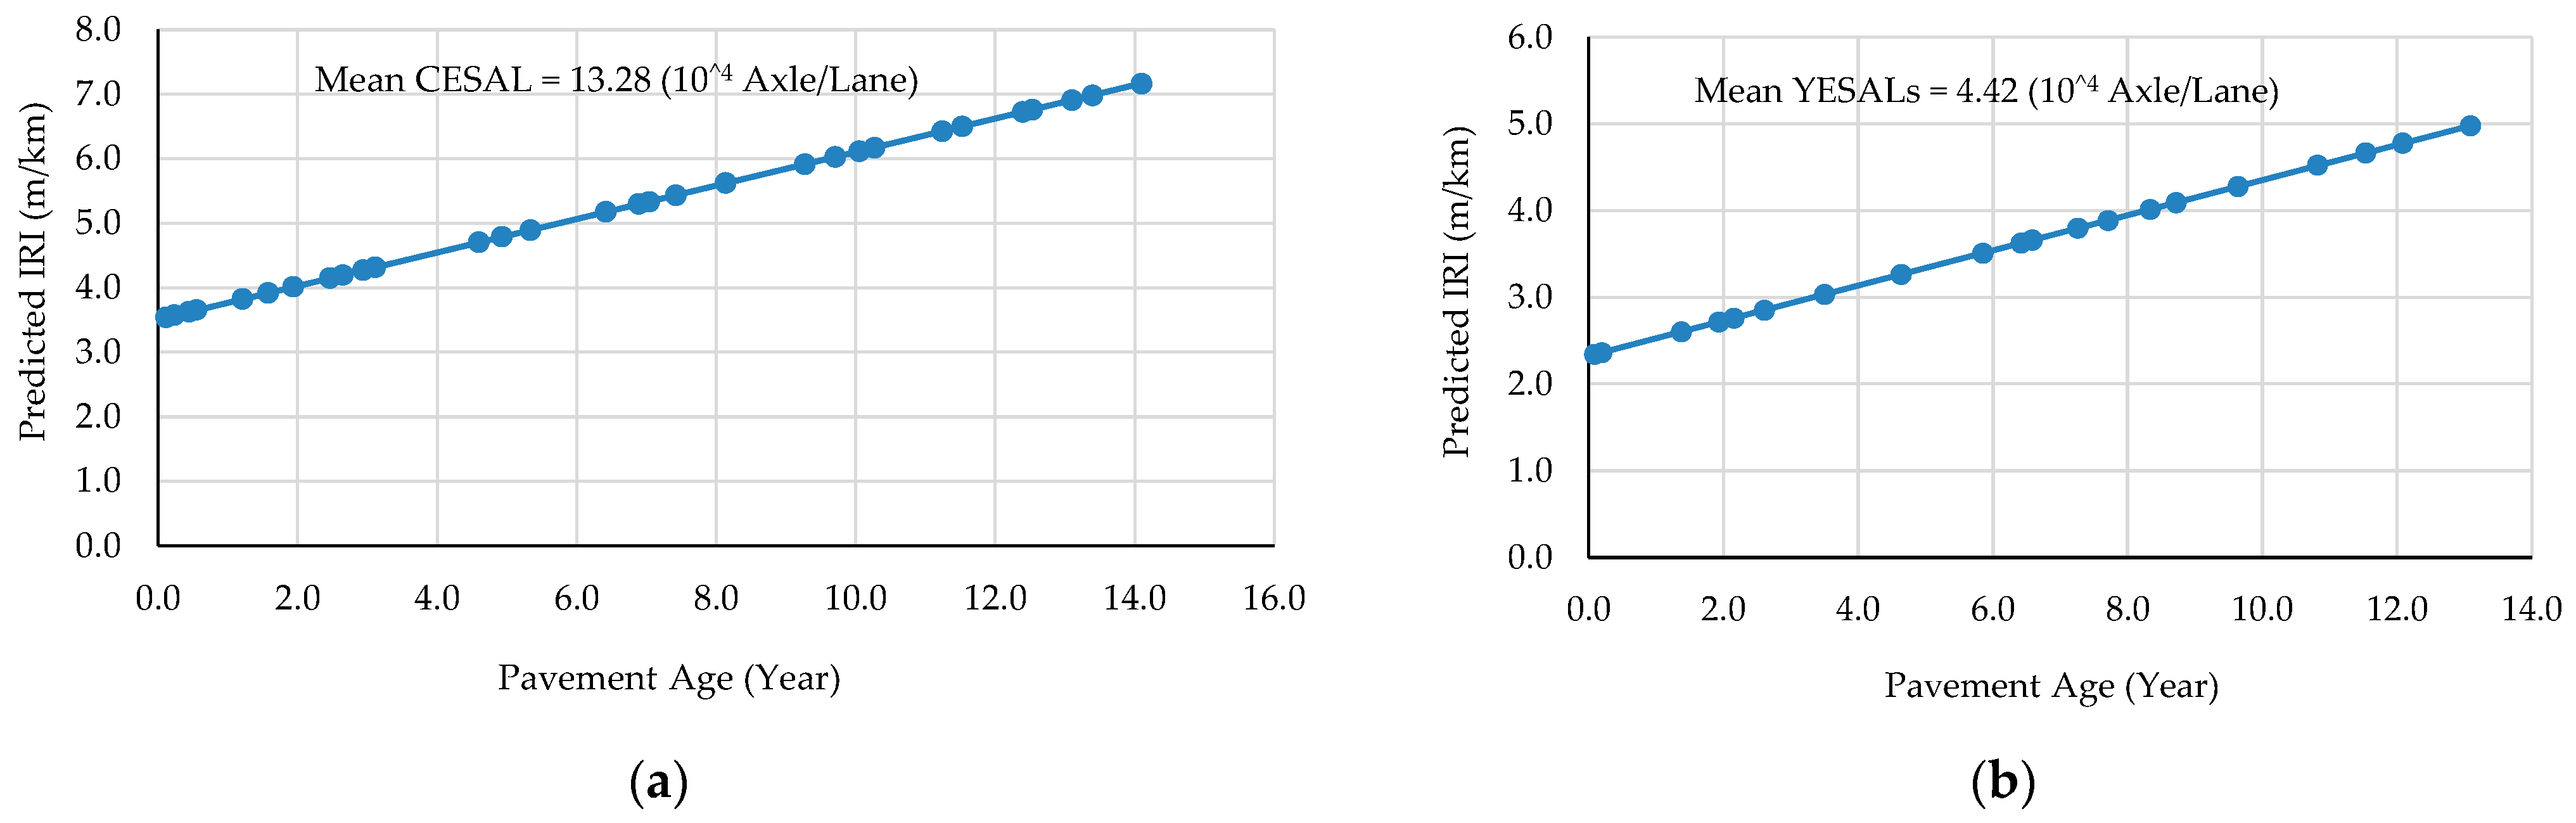
To explain the IRI model’s sensitivity to pavement age, a graph was made among random pavement age values, and the corresponding IRI values were gained from the proposed model considering the mean value (13.28) of CESAL for DBST sections and the mean value (4.42) of YESAL for AC sections. Figure 6 shows the line’s steepness, indicating the models’ sensitivity for slight variation in pavement age value. It can be noticed that the IRI value in the DBST model increases by 0.259 m/km and by 0.203 m/km in the AC model when the age value rises by one year.
Also, to explain the IRI model’s sensitivity to traffic loads, a graph was made of random CESAL/YESAL values and the corresponding IRI values gained from the proposed model considering the mean age values of 6.03 years for DBST and 5.95 years for AC sections. Figure 7 shows the line’s steepness, indicating the models’ sensitivity for slight variation in CESAL/YESAL value. It can be noticed that the IRI value rises by 0.03 and 0.123 m/km in DBST and AC models, respectively, when the CESAL/YESAL value rises by 104 axles/lane.
4. Discussion
The data available in the Laos RMS were utilized to develop two indigenous IRI prediction models for DBST and AC pavement sections. Regression analysis revealed that for DBST sections, age and CESAL are linearly correlated with IRI. Furthermore, the IRI for AC sections was found to depend on age and YESAL. The developed models can be incorporated into the Laos RMS to provide a better estimation of IRI values, which in turn will improve the evaluation and prediction of Laos NRs’ pavement condition, thus assisting in making consistent and cost-effective maintenance decisions. The effect of pavement structural capacity as an independent variable on IRI progression will be further studied.
Author Contributions
Investigation, methodology, data curation, formal analysis, and writing—original draft preparation, M.G.; conceptualization, resources, validation, writing—review and editing, and supervision, T.N. All authors have read and agreed to the published version of the manuscript.
Funding
This research was funded by JICA, Road Asset Management Project, grant number (D1810488).
Institutional Review Board Statement
Not applicable.
Informed Consent Statement
Not applicable.
Data Availability Statement
The data presented in this study are available on request from the corresponding author. The data are not publicly available due to privacy restrictions.
Acknowledgments
The authors would like to thank the Laos Public Works and Transport Institute (PTI), Ministry of Public Work and Transport, for granting permission to use the Laos RMS database for developing the pavement roughness models.
Conflicts of Interest
The authors declare no conflict of interest.
Appendix A
Table A1 illustrates the abbreviations and definitions of variables that have been used in the IRI literature review models.

Table A1.
The abbreviation and definition of variables used in the IRI literature review models.
| Abbreviation Symbols | Variable Name | Abbreviation Symbols | Variable Name |
|---|---|---|---|
| IRI0 | Initial IRI | TLF | Time Lapse Factor |
| AGE | Pavement age since last overlay reconstruction or new construction | RL | Ravelling as percent of total lane area |
| AGE0 | Initial age | RUT | Rutting |
| ΔAGE0 | Difference in AGE0 | SDRU | Standard Deviation of Rut Depth |
| AADT | Average Annual Daily Traffic | COVRU | Rut Depth Coefficient of Variation |
| ESAL | Equivalent Single-Axle Load | TC | Transverse Cracking |
| CESAL0 | Initial Cumulative ESAL | MC | Miscellaneous Cracking |
| ΔCESAL0 | Difference in CESAL0 | FC | Fatigue Cracking |
| CVPD | No. of Commercial Vehicles per day | BC | Block Cracking |
| MSN | Modified Structural Number | PI | Plasticity Index |
| SNPKb | Adjusted Structural Number due to Cracking | ΔRDS | Incremental change in standard deviation of rut depth |
| BTH | Base Layer Thickness | P | Patches as percent of total lane area |
| HSOLD | Total thickness of previous underlying surfacing layers | LCSNWP | Sealed Non-Wheel Path Longitudinal Cracking (WPLC) |
| HSNEW | Thickness of most recent surfacing | LCNWP | Non-WPLC |
| ACTH | Asphalt Concrete Overlay Thickness | LCS | Sealed WPLC |
| Rm | Average Annual Rainfall | ACXa | Area of Indexed Cracking |
| RSD | Standard Deviation in Monthly Rainfall | PACK | Area of Previous Indexed Cracking in the old surfacing |
| FI | Freezing Index | ΔACRA | Incremental change in area of total cracking |
| M | Environmental Coefficient | NPTa | Number of Potholes per km |
| P200 | Percent Passing No.200 sieve | ΔNPT | Incremental change in NPTa |
| P0.02 | Percent Passing 0.02 sieve | PH | Potholes as percent of total lane area |
| FM | Freedom of Maneuvering Index |
References
- ADB. Technical Assistance Consultant’s Report, Lao People’s Democratic Republic: Road Sector Governance and Maintenance Project (ADB TA-8492 LAO); ADB: Mandaluyong, Philippines, 2015. [Google Scholar]
- The World Bank. Implementation Status Results Report, Lao People’s Democratic Republic-Road Sector Project (P 102398); The World Bank: Washington, DC, USA, 2018. [Google Scholar]
- AIIB. Lao People’s Democratic Republic—National Road 13 Improvement and Maintenance Project (PD000066-LAO); AIIB: Beijing, China, 2009. [Google Scholar]
- ADB. Lao People’s Democratic Republic: Transport Sector Assessment, Strategy, and Road Map; ADB: Mandaluyong, Philippines, 2011. [Google Scholar]
- ABD. Independent Evaluation Department. Sector Assistance Program Evaluation for The Transport Sector in the Lao People’s Democratic Republic (LAO 2010-44); ABD, Independent Evaluation Department: Vientiane, Laos, 2010. [Google Scholar]
- Laos Ministry of Public Works and Transport. D. of R. Road Design Manual; Laos Ministry of Public Works and Transport: Vientiane, Laos, 2018.
- Laos Ministry of Public Works and Transport. D. of R. Summary of Road Network Statistics Year; Laos Ministry of Public Works and Transport: Vientiane, Laos, 2018.
- Gupta, A.; Kumar, P.; Rastogi, R. Pavement deterioration and maintenance model for low volume roads. Int. J. Pavement Res. Technol. 2011, 4, 195–202. [Google Scholar] [CrossRef]
- Arhin, S.A.; Williams, L.N.; Ribbiso, A.; Anderson, M.F. Predicting Pavement Condition Index Using International Roughness Index in a Dense Urban Area. J. Civ. Eng. Res. 2015, 5, 10–17. [Google Scholar] [CrossRef]
- Múčka, P. International Roughness Index specifications around the world. Road Mater. Pavement Des. 2017, 18, 929–965. [Google Scholar] [CrossRef]
- Sayers, M.W.; Gillespie, T.D.; Paterson, W.D.O. Guidelines for Conducting and Calibrating Road Roughness Measurements; The World Bank: Washington, DC, USA, 1986. [Google Scholar]
- Sayers, M.; Queiroz, C.; Queiroz, C. International Experiment to Establish Correlation and Standard Calibration Methods for Road Roughness Measurements, Draft Report to World Bank (UMTRI-82-45-1); The University of Michigan, Transportation Research Institute: Ann Arbor, MI, USA, 1982. [Google Scholar]
- Sayers, M.; Gillespie, T.; Queiroz, C. International Experiment to Establish Correlation and Standard Calibration Methods for Road Roughness Measurements; The World Bank: Washington, DC, USA, 1982. [Google Scholar]
- Sayers, M.W.; Karamihas, S.M. The Little Book of Profiling—Basic Information about Measuring and Interpreting Road Profiles; University of Michigan: Ann Arbor, MI, USA, 1998. [Google Scholar]
- Sayers, M.W. On the Calculation of International Roughness Index from Longitudinal Road Profile. Transp. Res. Rec. 1995. Available online: https://trid.trb.org/view/452992 (accessed on 1 February 2021).
- ARA. Guide for Mechanistic-Empirical Design of New and Rehabilitated Pavement Structures. Appendix A: Glossary of Terms. National Cooperative Highway Research Program. 2004. Available online: http://onlinepubs.trb.org/onlinepubs/archive/mepdg/appendix_A_Glossary.pdf (accessed on 1 February 2021).
- Jagadeesh, H.S.; Harikeerthan, M.K. Pavement roughness modelling on arterial roads in Bangalore City. Int. J. Sci. Res. Dev. 2017, 5, 123–126. [Google Scholar]
- Park, K.; Thomas, N.E.; Lee, K.W. Applicability of the international roughness index as a predictor of asphalt pavement condition. J. Transp. Eng. 2007, 133, 706–709. [Google Scholar] [CrossRef]
- Chang, L.-W.; Chou, C.-P.; Tsai, C.-Y.; Chen, A.-C. Analysis the Relationship between Pavement Smoothness Indices. J. East. Asia Soc. Transp. Stud. 2011, 9, 1376–1390. [Google Scholar] [CrossRef]
- Laos Public Works and Transport Institute. D. of I. and T. Annual Road Asset Report; Laos Public Works and Transport Institute: Vientiane, Laos, 2017.
- Sandra, A.K.; Sarkar, A.K. Development of a model for estimating International Roughness Index from pavement distresses. Int. J. Pavement Eng. 2013, 14, 715–724. [Google Scholar] [CrossRef]
- Abdelaziz, N.; Abd El-Hakim, R.T.; El-Badawy, S.M.; Afify, H.A. International Roughness Index prediction model for flexible pavements. Int. J. Pavement Eng. 2020, 21, 88–99. [Google Scholar] [CrossRef]
- Japan International Cooperation Agency (JICA). The Project for Improvement of Road Management Capability in Lao PDR; Japan International Cooperation Agency: Yokosuka, Japan, 2018.
- Japan International Cooperation Agency (JICA). Mitsubishi Research Institute, I. Information Collection and Confirmation Survey on Road and Bridge Maintenance Management Final Report (Summary); International Cooperation Agency: Yokosuka, Japan, 2013.
- Hamdi; Hadiwardoyo, S.P.; Correia, A.G.; Pereira, P.; Cortez, P. Prediction of surface distress using neural networks. AIP Conf. Proc. 2017, 1855. [Google Scholar] [CrossRef] [Green Version]
- Xu, G.; Bai, L.; Sun, Z. Pavement deterioration modeling and prediction for Kentucky interstate and highways. In Proceedings of the 2014 Industrial and Systems Engineering Research Conference, Nashville, TN, USA, 30 May–2 June 2014; pp. 993–1002. [Google Scholar]
- Knudsen, F.; Kirk, J. Pavement management in finland: Decision-making from national policies to project-level programming. In Proceedings of the 4th International Conference on Managing Pavements, Durban, South Africa, 17–21 May 1998; International Convention Centre (ICC): Sydney, Australia, 1998; Volume 26, p. 15. [Google Scholar]
- Lin, J.; Yau, J.-T.; Hsiao, L.-H. Correlation Analysis Between International Roughness Index (IRI) By. In Proceedings of the 82nd Annual Meeting of the Transportation Research Board, Washington, DC, USA, 12–16 January 2003; pp. 1–21. [Google Scholar]
- Ziari, H.; Sobhani, J.; Ayoubinejad, J.; Hartmann, T. Prediction of IRI in short and long terms for flexible pavements: ANN and GMDH methods. Int. J. Pavement Eng. 2015, 17, 776–788. [Google Scholar] [CrossRef] [Green Version]
- Hossain, M.I.; Gopisetti, L.S.P.; Miah, M.S. International roughness index prediction of flexible pavements using neural networks. J. Stomatol. 2019, 145, 1–10. [Google Scholar] [CrossRef]
- ARA. Guide for Mechanistic-Empirical Design of New and Rehabilitated Pavement Structures. Appendix OO-1: Background and Preliminary Smoothness Prediction Models for Flexible Pavements. National Cooperative Highway Research Program. 2001. Available online: http://onlinepubs.trb.org/onlinepubs/archive/mepdg/2appendices_oo.pdf (accessed on 1 February 2021).
- Nassiri, S.; Shafiee, M.H.; Bayat, A. Development of roughness prediction models using alberta transportation’s pavement management system. Int. J. Pavement Res. Technol. 2013, 6, 714–720. [Google Scholar] [CrossRef]
- Makendran, C.; Murugasan, R.; Velmurugan, S. Performance prediction modelling for flexible pavement on low volume roads using multiple linear regression analysis. J. Appl. Math. 2015, 2015. [Google Scholar] [CrossRef] [Green Version]
- Mazari, M.; Rodriguez, D.D. Prediction of pavement roughness using a hybrid gene expression programming-neural network technique. J. Traffic Transp. Eng. 2016, 3, 448–455. [Google Scholar] [CrossRef] [Green Version]
- Odoki, J.B.; Kerali, G.R.H. Volume Four: Analytical Framework and Model Descriptions. Highway Development and Management Model HDM-4 (Version 1.2). 2001. Available online: http://hdm4.piarc.org/ (accessed on 23 December 2020).
- Aggarwal, S.; Jain, S.S.; Parida, M. Calibration of HDM-4 bituminous road deterioration models for Indian conditions. Proc. Conf. Aust. Road Res. Board 2003, 21, 1535–1553. [Google Scholar]
- Darter, M.I. Concrete pavement evaluation system (COPES)-nationwide prediction model demonstration. In Proceedings of the 3rd International Conference on Cocrete Pavement Design and Rehabilitation, Indianapolis, IN, USA, 23–25 April 1985; pp. 453–468. [Google Scholar]
- Sadek, A.W.; Freeman, T.E.; Demetsky, M.J. The Development of Performance Prediction Models for Virginia’s Interstate Highway System, Volume II: Model Development; FHWA/VTRC: Springfield, VA, USA, 1995. [Google Scholar]
- Han, D.; Kobayashi, K.; Do, M. Improved calibration for HDM-4 implementation: A lesson from Korean experiences. JSCE 2009, 4. Available online: http://library.jsce.or.jp/jsce/open/00039/200911_no40/pdf/84.pdf (accessed on 23 December 2020).
- Han, D.; Kobayashi, K.; Do, M. Section-based multifunctional calibration method for pavement deterioration forecasting model. KSCE J. Civ. Eng. 2013, 17, 386–394. [Google Scholar] [CrossRef]
- Pérez-Acebo, H.; Linares-Unamunzaga, A.; Rojí, E.; Gonzalo-Orden, H. IRI performance models for flexible pavements in two-lane roads until first maintenance and/or rehabilitation work. Coatings 2020, 10, 97. [Google Scholar] [CrossRef] [Green Version]
- ADB. Technical Assistance Consultant’s Report, Regional: Knowledge Development Support for Southeast Asia, Assessment of Axle Load Control Operations in Greater Mekong Subregion Countries (Project Number: 49150-001); ADB: Mandaluyong, Philippines, 2019. [Google Scholar]
- Ksoll, C.; Apthorp, P.F.; Phimphachanh, P. Transport Costs and Prices in Lao PDR: Unlocking the Potential of an Idle Fleet; The World Bank: Washington, DC, USA, 2018. [Google Scholar]
- Tjan, A.; Fung, C. Determination of Equivalent Axle Load Factor of Trailer with Multiple Axles on Flexible Pavement Structures. J. East. Asia Soc. Transp. Stud. 2005, 6, 1194–1206. [Google Scholar]
- AASHTO. Guide for the Design of Pavement Structures; AASHTO: Washington, DC, USA, 1986; p. 1993. [Google Scholar]
- Alin, A. Multicollinearity. Wiley Interdiscip. Rev. Comput. Stat. 2010, 2, 370–374. [Google Scholar] [CrossRef]
- Kutner, M.H.; Nachtsheim, C.J.; Neter, J. Simultaneous inferences and other topics in regression analysis. In Applied Linear Regression Models, 4th ed.; McGraw-Hill Irwin: New York, NY, USA, 2004; pp. 168–170. [Google Scholar]
Figure 1.
Flow chart of the research methodology.

Figure 2.
Examples of irregularities in IRI data along with pavement age.

Figure 4.
Graph of residuals versus predicted IRI for the (a) DBST model and (b) AC model.

Figure 5.
Observed IRI versus predicted IRI values for the (a) DBST model and (b) AC model.

Figure 6.
The relation among predicted IRI and pavement age for sensitivity analysis for the (a) DBST model and (b) AC model.
Figure 6.
The relation among predicted IRI and pavement age for sensitivity analysis for the (a) DBST model and (b) AC model.

Figure 7.
The relation among predicted IRI and traffic loads (CESAL/YESAL) for sensitivity analysis of the (a) DBST model and (b) AC model.
Figure 7.
The relation among predicted IRI and traffic loads (CESAL/YESAL) for sensitivity analysis of the (a) DBST model and (b) AC model.

Table 1.
Summary of Laos road network statistics from 2018.
| Type of Road | Concrete | Asphalt | DBST | Gravel | Earth | Total | Percent |
|---|---|---|---|---|---|---|---|
| National Roads (km) | 85.73 | 995.23 | 5426.01 | 794.95 | 238.05 | 7539.96 | 12.45% |
| Provincial Roads (km) | 81.73 | 64.70 | 1770.69 | 5614.85 | 959.77 | 8491.74 | 14.02% |
| District Roads (km) | 67.78 | 0.00 | 586.20 | 4244.73 | 2289.38 | 7188.09 | 11.87% |
| Urban Roads (km) | 255.42 | 127.67 | 1219.02 | 1325.52 | 706.86 | 3634.50 | 6.00% |
| Rural Roads (km) | 29.61 | 4.00 | 559.31 | 10,007.72 | 15,577.05 | 26,177.69 | 43.23% |
| Special Roads (km) | 31.74 | 11.53 | 352.37 | 1198.02 | 5933.89 | 7527.56 | 12.43% |
| Total Length (km) | 552.02 | 1203.13 | 9913.60 | 23,185.79 | 25,705.00 | 60,559.54 | |
| Percent | 0.91% | 1.99% | 16.37% | 38.29% | 42.45% |
DBST—Double Bituminous Surface Treatment.
Table 2.
The Roughness Scale of the International Roughness Index (IRI).
| Pavement Condition | Excellent | Good | Fair | Poor | Bad | Failed |
|---|---|---|---|---|---|---|
| IRI (m/km) | <3 | 3 to 4 | 4 to 5 | 5 to 6 | 6 to 8 | >8 |
Table 3.
Synopsis of Literature IRI Prediction Models.
| First Author, Year | Pavement Type | Source of Data | Prediction Method | Independent Variables 1 | Goodness of Fit |
|---|---|---|---|---|---|
| Von Quintus, 2001 [31] | Conventional HMA with thick granular base | LTPP database, GPS and SPS | Stepwise linear regression | IRI0, TC, COVRU, FC, BC, LCSNWP, AGE, RSD, Rm, P200, P0.02, PI, FI | R2 = 0.62, RMSE = 0.387 m/km, N = 353 |
| HMA deep-strength with asphalt-treated base | IRI0, AGE, FI, TC, FC, P | R2 = 0.49, RMSE = 0.29 m/km, N = 428 | |||
| HMA semi-rigid with cement-treated base | IRI0, SDRUT, FC, TC, BC, LCNWP | R2 = 0.83, RMSE = 0.23 m/km, N = 50 | |||
| HMA overlay of flexible pavement | IRI0, AGE, FC, TC, LCS, P, PH | R2 = 0.70, RMSE = 0.18 m/km, N = 797 | |||
| Nassiri (2013) [32] | New AC | Alberta’s PMS database | Multiple Linear Regression (MLR) | AGE, AADT, P200, TC, MC, RUT | R2 = 0.39, SEE = 0.42 m/km, N = 1000 |
| Straight AC overlay | AGE, AADT, FI, BTH, CTH, RUT, PI. | R2 = 0.39, SEE = 0.452 m/km, N = 501 | |||
| Makendran, 2015 [33] | Flexible pavement | Direct field measurement, India | MLR | AGE, MSN, CVPD | R2 = 0.89, SE = 0.77 m/km, N = 120 |
| Mazari, 2016 [34] | AC over unbound granular layers | LTPP, SPS database | Gene expression programming algorithm | IRI0, AGE0, CESAL0, SN, ΔAGE, ΔCESAL | R2 = 0.99, SE = 0.112 m/km, N = 80 |
| Abdelaziz, 2018 [22] | AC overlay | LTPP database for six sections; GPS-1, 2, 6; SPS-1, 3, 5 | MLR | IRI0, AGE, FC, TC, SDRUT | R2 = 0.57, SE = 0.325 m/km, N = 2439 |
| Sandra, 2012 [21] | AC overlay | Direct field measurement, India | MLR | IRI0, RUT, P, PH, MC, RL | R2 = 0.98, RMSE = 0.17 m/km, N = 355 |
| Odoki, 2000 [35] | Asphalt mix and surface treatment | Sections from more than 100 developed and developing countries | Structured empirical approach | IRI0, AGE, ESAL, AADT, SNPKb, ACXa, PACK, HSNEW, HSOLD, M, ΔACRA, ΔRDS, TLF, FM, NPTa, ΔNPT | N/A |
1 All abbreviation definitions are provided in Appendix A.
Table 4.
Laos vehicle classifications.
| Class Group | Description | Class Group | Description |
|---|---|---|---|
| Class 1 | Bicycle | Class 8 | Small bus (max 12 seats) |
| Class 2 | Oxcart | Class 9 | Medium bus (from 13 to 25 seats) |
| Class 3 | Minitractor | Class 10 | Heavy bus (more than 25 seats) |
| Class 4 | Motorcycle | Class 11 | Light truck (less than 4 tons) |
| Class 5 | Tuk-tuk | Class 12 | Medium truck (2 axles) |
| Class 6 | Passenger car | Class 13 | Heavy truck (3 axles or more) |
| Class 7 | Pick-up | Class 14 | Truck trailer |
Table 5.
Summary of the number of sections and observations in each surface-type group.
| Surface Type | Total No. of Sections | Total No. of Observations | Valid No. of Sections | Valid No. of Observations |
|---|---|---|---|---|
| DBST | 214 | 997 | 83 | 269 |
| AC | 36 | 184 | 29 | 122 |
| CC | 4 | 33 | 2 | 6 |
Table 6.
Statistics of developed regression models for backcasting initial AADT.
| Surface Type | No. of the Best Fitting Relationship Type | Avg. R2 | |||
|---|---|---|---|---|---|
| Exponential | Linear | Logarithmic | Power | ||
| DBST | 44 | 27 | 8 | 4 | 0.94 |
| AC | 10 | 10 | - | 9 | 0.97 |
Table 7.
Pearson correlation coefficient matrixes.
| DBST Model | AC Model | ||||||
|---|---|---|---|---|---|---|---|
| Variable | IRI | AGE | CESAL | Variable | IRI | AGE | YESAL |
| IRI | 1 | 0.85 | 0.73 | IRI | 1 | 0.82 | 0.64 |
| AGE | 0.85 | 1 | 0.42 | AGE | 0.82 | 1 | 0.31 |
| CESAL | 0.73 | 0.42 | 1 | YESAL | 0.64 | 0.31 | 1 |
YESAL—Yearly Equivalent Single-Axle Loads.
Table 8.
Basic statistics of data utilized for the model’s development and validation.
| Variable Description | Notation | Unit | Range | Mean | Std. Deviation | |
|---|---|---|---|---|---|---|
| Min | Max | |||||
| DBST Model | ||||||
| Roughness | IRI | m/km | 2.20 | 8.91 | 5.09 | 1.44 |
| Pavement age since the last overlay | Age | years | 0.10 | 14.10 | 6.03 | 3.73 |
| Cumulative Equivalent Single-Axle Load | CESAL | 104 axles/lane | 0.02 | 99.26 | 13.28 | 16.55 |
| AC Model | ||||||
| Roughness | IRI | m/km | 1.47 | 5.46 | 3.54 | 1.02 |
| Pavement age since the last overlay | Age | years | 0.09 | 13.08 | 5.95 | 3.44 |
| The average Yearly Equivalent Single-Axle Load | YESAL | 104 axles/lane | 0.03 | 20.53 | 4.42 | 3.34 |
Table 9.
Summary of regression statistics by pavement type.
| Pavement Type | Model Equation | R2 | Std. Error of Estimate | No. of Observations |
|---|---|---|---|---|
| DBST | IRI = 3.006 + 0.259 age + 0.038 CESAL | 0.892 | 0.483 | 215 |
| AC | IRI = 1.782 + 0.203 age + 0.123 YESAL | 0.847 | 0.395 | 98 |
Table 10.
ANOVA results.
| df | Sum of Squares | Mean Square | F | p-Value | |
|---|---|---|---|---|---|
| DBST Model | |||||
| Regression | 2 | 406.912 | 203.456 | 872.091 | 3.6858 × 10−103 |
| Residual | 212 | 49.459 | 0.233 | ||
| Total | 214 | 456.370 | |||
| AC Model | |||||
| Regression | 2 | 82.508 | 41.254 | 263.848 | 8.0861 × 10−39 |
| Residual | 95 | 14.854 | 0.156 | ||
| Total | 97 | 97.362 | |||
Table 11.
The performance prediction models’ statistics.
| Independent Variable | Coefficient | Std. Error | Student’s t | p-Value | VIF |
|---|---|---|---|---|---|
| DBST Model | |||||
| Age | 0.259 | 0.010 | 26.426 | 3.7348 × 10−71 | 1.214 |
| CESAL | 0.038 | 0.002 | 18.265 | 1.5469 × 10−45 | 1.214 |
| AC Model | |||||
| Age | 0.203 | 0.012 | 16.405 | 2.4503 × 10⁻²⁹ | 1.105 |
| YESAL | 0.123 | 0.012 | 10.230 | 2.6803 × 10⁻¹⁶ | 1.105 |
VIF—Variance Inflation Factor.
Publisher’s Note: MDPI stays neutral with regard to jurisdictional claims in published maps and institutional affiliations. |
© 2021 by the authors. Licensee MDPI, Basel, Switzerland. This article is an open access article distributed under the terms and conditions of the Creative Commons Attribution (CC BY) license (http://creativecommons.org/licenses/by/4.0/).
Share and Cite
MDPI and ACS Style
Gharieb, M.; Nishikawa, T. Development of Roughness Prediction Models for Laos National Road Network. CivilEng 2021, 2, 158-173. https://0-doi-org.brum.beds.ac.uk/10.3390/civileng2010009
AMA Style
Gharieb M, Nishikawa T. Development of Roughness Prediction Models for Laos National Road Network. CivilEng. 2021; 2(1):158-173. https://0-doi-org.brum.beds.ac.uk/10.3390/civileng2010009
Chicago/Turabian StyleGharieb, Mohamed, and Takafumi Nishikawa. 2021. "Development of Roughness Prediction Models for Laos National Road Network" CivilEng 2, no. 1: 158-173. https://0-doi-org.brum.beds.ac.uk/10.3390/civileng2010009