Critical Material Applications and Intensities in Clean Energy Technologies

1
Golisano Institute for Sustainability, Rochester Institute of Technology, 1 Lomb Memorial Drive, Rochester, NY 14623, USA
2
Inamori School of Engineering, Alfred University, 1 Saxon Drive, Alfred, NY 14802, USA
*
Author to whom correspondence should be addressed.
Clean Technol. 2019, 1(1), 164-184; https://0-doi-org.brum.beds.ac.uk/10.3390/cleantechnol1010012
Submission received: 30 June 2019
/
Revised: 25 July 2019
/
Accepted: 30 July 2019
/
Published: 1 August 2019
Abstract
:Clean energy technologies have been developed to address the pressing global issue of climate change; however, the functionality of many of these technologies relies on materials that are considered critical. Critical materials are those that have potential vulnerability to supply disruption. In this paper, critical material intensity data from academic articles, government reports, and industry publications are aggregated and presented in a variety of functional units, which vary based on the application of each technology. The clean energy production technologies of gas turbines, direct drive wind turbines, and three types of solar photovoltaics (silicon, CdTe, and CIGS); the low emission mobility technologies of proton exchange membrane fuel cells, permanent-magnet-containing motors, and both nickel metal hydride and Li-ion batteries; and, the energy-efficient lighting devices (CFL, LFL, and LED bulbs) are analyzed. To further explore the role of critical materials in addressing climate change, emissions savings units are also provided to illustrate the potential for greenhouse gas emission reductions per mass of critical material in each of the clean energy production technologies. Results show the comparisons of material use in clean energy technologies under various performance, economic, and environmental based units.
1. Introduction
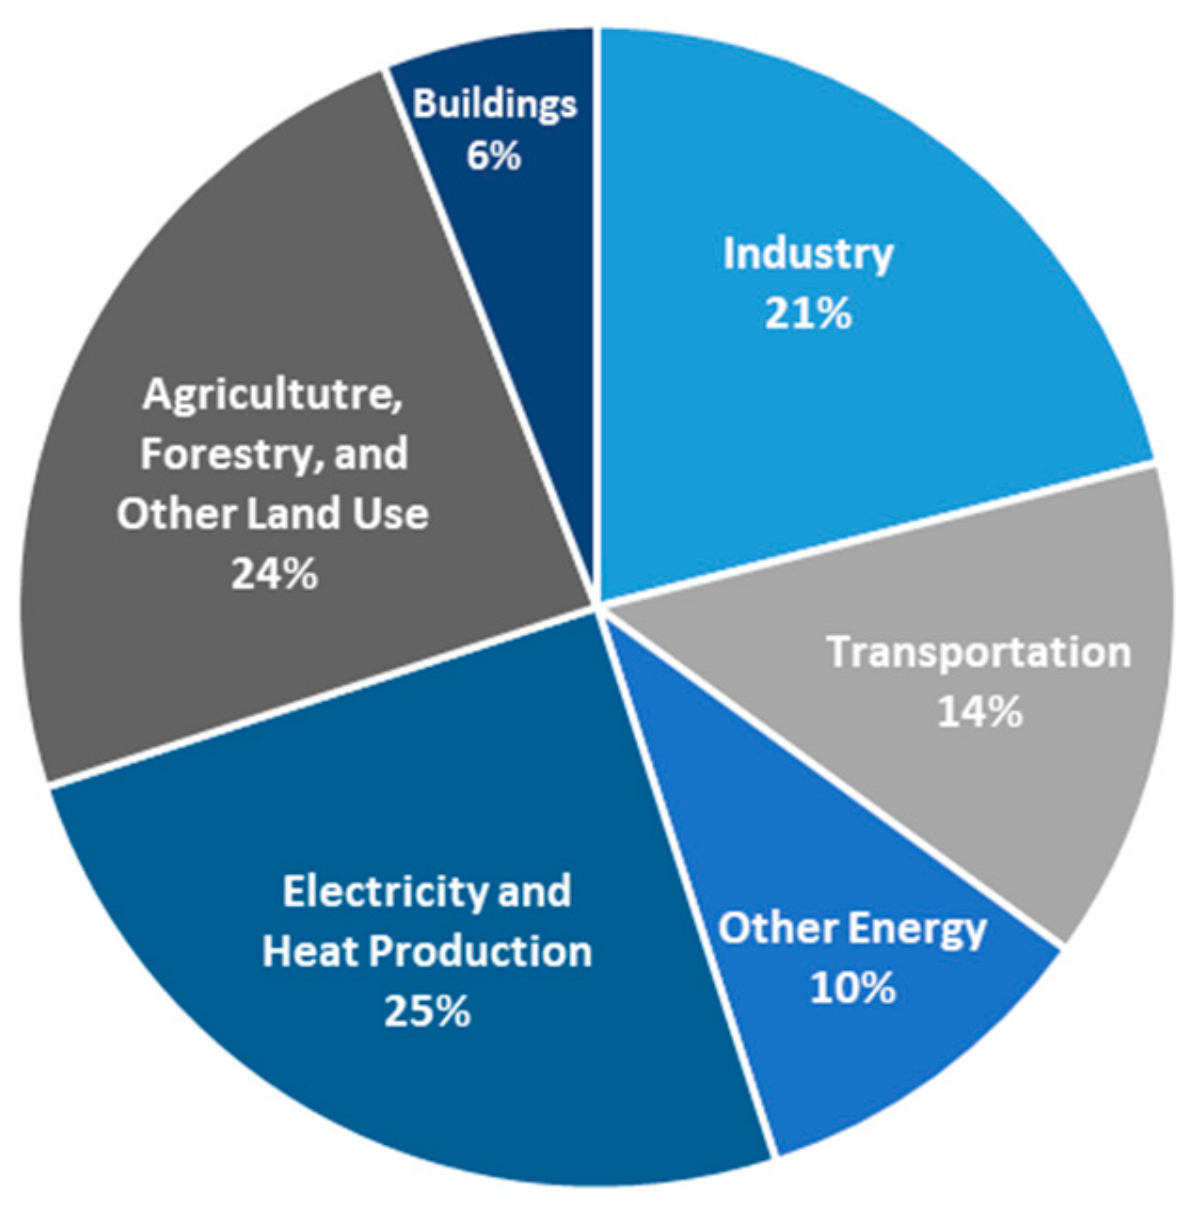
Anthropogenic greenhouse gas (GHG) emissions have been proven to contribute to global climate change [1]. Climate change is one of the world’s most pressing current issues and therefore new technologies are being developed rapidly to lessen GHG emissions [2]. In this research, several clean energy technologies which have been developed to reduce GHG emissions in the categories of electricity and heat production, buildings, industry, transportation, and “other energy”, address a total of 76 percent of the total global GHG emitting sectors, as seen in Figure 1 [3]. In this paper, the following clean energy production technologies were studied to identify their critical material requirements: solar panels, wind turbines, and gas turbines; the low emission mobility technologies of fuel cells, batteries, and motors; and the energy efficiency technology of efficient lighting devices. Throughout this research, these technologies are referred to as ‘clean energy technologies’, recognizing that while they still have environmental footprints associated with their lifecycle, these technologies aim to be less harmful to the environment than their comparative incumbent technologies. Each of the clean energy technologies studied here contain what are known as critical materials. These are materials that have both a high level of importance to the technology’s functionality as well as potential for supply disruption. Factors that may lead to supply disruption include a high concentration of the material’s production geographically, the location of the resource in politically unstable regions, large environmental impacts that might be subject to environmental regulations, and/or low recycling rates.
2. Literature Review
2.1. Overview of Critical Material Applications in Clean Technologies
Through literature review, critical metals, ceramics, and glasses contained in the previously described clean energy production, low emission mobility, and energy efficiency technologies are initially identified. This qualitative information is gathered from a variety of government reports, academic journals, and industry materials. The findings are discussed below and summarized in Table 1.
2.1.1. Clean Energy Production Technologies
As of 2016, approximately 6% of global solar energy production is from thin-film solar, 3.8% of which is CdTe panels and 1.6% of which is CI(G)S. The large majority of solar production (94%) is comprised of mono- and multi-silicon, at 24.5% and 69.5%, respectively [5]. Each of these types of solar panels relies on a distinct set of critical materials. In CdTe solar cells, the active/absorber layer is comprised of cadmium and tellurium in a ratio of approximately 48:52 [6]. The absorber layer will typically have a thickness of approximately 1–3 µm but can be as thick as 10µm in some cases [7]. In CIGS solar cells, indium and gallium are also located in the absorber layer, which has a typical thickness of approximately 1–2.5 µm [8]. More recently, studies have examined replacing a portion of the indium with gallium so as to increase the bandgap, and allow for greater efficiency [9]. Finally, in crystalline silicon solar panels, silver is used for its low electrical resistivity in the screen-printing pastes, and tin and indium are found within the transparent conducting oxide layers [5].
For this study, we consider the permanent magnets as the main critical material containing component in wind turbines. Approximately 23% of the globally installed wind capacity relies on those permanent magnets, which are found only in direct drive wind turbines, not the more popular geared variations. These NdFeB permanent magnets can contain neodymium, dysprosium, praseodymium, and terbium. The other 77% of globally installed wind turbines have electromagnetic generators which utilize primarily steel and copper, which are not considered critical materials, for their functionality [10]. In comparing the two primary categories of wind turbines, the gearless, direct-drive turbines considered in this study operate best at low speeds and have better overall efficiency, lower weight, and less maintenance requirements [10]. Geared turbines will tend to operate at higher speeds and on smaller turbines (<5 MW) [10]. While NdFeB magnets currently contain 29–32% Nd/Pr and 3–6% Dy, Pavel et al. estimate that they could be dematerialized to contain just 25% Nd/Pr and <1% Dy by 2020 [10]. Directly substituting other elements in place of the rare earth elements does not currently appear feasible, and therefore efforts are being focused on discovering new magnet compositions and/or using different turbines that do not rely on rare-earth-containing permanent magnets [10].
Natural gas turbines, although still utilizing a finite fossil fuel resource, are still considered in this study on clean energy technologies as natural gas is widely viewed as an imperfect step in the correct direction away from coal-based energy. The superalloy coating on the blades of the gas turbine is the portion of this technology that contains critical materials. Gas turbine blades must withstand both high centrifugal stresses and extreme temperatures [11]. The nickel-based superalloys containing rhenium and hafnium are the current solution to these extreme conditions due to their high temperature properties [11,12]. Rhenium is often focused on during dematerialization efforts because of its use in much greater quantities than hafnium in the superalloys. Rhenium has a history of price volatility, as witnessed in the large price spike of 2007 [13]. Companies such as General Electric, that rely on rhenium, began to look at dematerialization and in-house recycling as methods of risk reduction after the immense economic losses that the price spike caused [13]. One of the factors that creates the volatility in rhenium prices is the byproduct nature of production in which 80% of rhenium is mined as a byproduct of copper [14]. Alloys have been designed containing half as much, or even no rhenium, but are unable to match the high temperature creep resistance of those superalloy blends that are currently used [14].
2.1.2. Low Emission Mobility Technologies
This study focuses on several electric vehicle components for the quantification of critical materials in low emission mobility technologies. These electric vehicle components include the energy storage technologies of fuels cells and batteries, as well as the permanent magnets that are in the electric vehicle motors. Specifically, proton exchange membrane (PEM) fuel cells, seven different lithium-ion (Li-ion) battery chemistries, nickel metal-hydride (NiMH) batteries, and NdFeB permanent magnets used in electric vehicle motors are considered in this study. NiMH batteries are currently the dominant battery choice for hybrid electric vehicles, however, numbers as high as 70% of hybrid electric, and 100% of plug-in and full electric vehicles are expected to use Li-ion batteries by 2025 [15]. The materials of greatest concern that are considered in this study for low emission mobility technologies are the rare earth elements in the permanent magnets and NiMH batteries, lithium and cobalt in the Li-ion batteries, and platinum in the fuel cells [2].
We consider PEM fuel cells as they currently dominate the fuel cell electric vehicle marketplace. Fuel cells are a clean energy technology because they are highly efficient, reduce point source emissions, and are capable of running on fuels produced by renewable resources [16]. Pure hydrogen is used as a fuel input, and H2O is emitted as an output. PEM fuel cells have a high power density, operate at relatively low temperatures in comparison with other types of fuel cells, and have a quick start up, which makes them good candidates for electric vehicles [17]. Platinum is utilized in fuel cells for its excellent catalytic properties; however, platinum group elements are expensive and can be considered critical, as deposits that are concentrated enough to mine economically are rare [18].
Typically, Li-ion batteries will have a graphite anode and lithium-containing cathode [19]. The cathodes we include in this study are; LiFePO4 (LFP), Li[NiCoAl]O2 (NCA), Li[MnNiCo]O2 (NMC), LiMn2O4 (LMO), and LiCoO2 (LCO). Each chemistry provides different properties, and manufacturers must take into consideration factors such as weight, material use, and cost when choosing a chemistry to use. LFP batteries have good safety and long lifespans, but may lack in specific energy [20]. NCA batteries provide high energy and power densities, however, cost and safety are drawbacks [20]. NMC batteries are gaining popularity due to their high specific energy and power, and the ability for their active materials (nickel, manganese, and cobalt) to be blended at different concentrations to adjust the battery properties [20]. This study considers NMC batteries with Ni:Mn:Co ratios of 1:1:1, 6:2:2, and 8:1:1. LMO batteries are often found in combination with NMC batteries to achieve the current required for acceleration while still maintaining the longer range of the NMC battery [20]. LCO batteries are more commonly found in electronic devices because of their very high specific energy, but short lifespan, limited thermal stability, low specific power, and high price [20]. NiMH batteries are typically cheaper and safer than Li-ion batteries, however they also usually have a lower energy density [21]. NiMH batteries typically use a cathode called AB5, where “A” is a rare earth mischmetal (which may contain lanthanum, cerium, neodymium, and/or praseodymium) and “B” is a combination of nickel, cobalt, manganese and/or aluminum [22]. Different combinations of these materials can be utilized to create the desired low equilibrium pressure, corrosion resistance, mechanical stability, reversibility, and hydrogen storage properties [23].
The NdFeB magnets are the strongest known magnets and therefore are often utilized when space or weight are constraints, making them ideal for vehicle electric motors where keeping weight down is a priority [24]. While neodymium is the critical material used in the greatest quantities in these magnets, the dysprosium is important for its contribution of heat resistant properties [24].
2.1.3. Energy Efficiency Technologies
In representation of energy efficiency technologies, three types of light bulbs are studied; compact fluorescent lightbulbs (CFLs), linear fluorescent lightbulbs (LFLs), and light-emitting diodes (LEDs). All three of these bulb types are more energy efficient than the traditional incandescent bulbs. In these lighting devices, most of the critical materials (especially the rare earth elements) are used in the lamp phosphors [25]. The phosphor is coated onto the inside of the bulb and therefore the quantity of rare earths used often varies directly with the physical size of the bulb. The trend is especially visible for the linear fluorescent bulbs which are long and tubular [22]. Critical materials are used to create different colors in fluorescents; Eu and Y create red, Tb produces green, and Eu gives blue phosphors [26]. LEDs use less rare earths than fluorescent bulbs; however, they also contain gallium and indium in their semiconductor diodes [25].
2.2. Material Requirements for Meeting Climate Change Mitigation Targets
Material intensity data are often utilized to understand the larger picture of if the quantity of materials necessary to produce the clean energy technologies needed to mitigate climate change are available. For example, Alonso et al. considered rare earth elements used in wind turbines and electric vehicles. They found that to keep atmospheric CO2 under 450 ppm, neodymium and dysprosium may experience an increase in demand by those technologies of over 700 percent and 2600 percent, respectively from 2010 to 2035 [65]. A second analysis by Grandell et al. considers potential ‘bottlenecks’ for critical material supply through 2050. They consider solar panels, wind turbines, fuel cells, batteries, electrolysis, hydrogen storage, electric vehicles, and efficient lighting [51]. Silver is identified as the most problematic, with potential for bottleneck issues in tellurium, indium, dysprosium, lanthanum, cobalt, platinum, and ruthenium as well [51]. According to Grandell et al., those identified bottlenecks could cause the Intergovernmental Panel on Climate Change (IPCC) renewable energy scenarios to be “partly unrealistic from the perspective of critical metals” [51]. Another study by Jacobson and Delucchi theorizes what the material impact might be if all of the world’s energy were provided solely through wind, water, and solar power. Their findings show that even such an extreme system would not likely be inhibited by the availability of bulk materials, but rather other less common materials, such as neodymium, platinum, and lithium, would need to be recycled, substituted, or discovered in new deposits [2]. Finally, a study by Bustamante and Gaustad considers the case study of tellurium in CdTe solar cells [33]. Their findings show that tellurium availability is actually likely to slow CdTe adoption even based on conservative demand estimates [33]. They do find, however, that this is more likely if tellurium continues to be mined primarily as a byproduct of copper, rather than due to the overall resource quantity [33].
3. Methods
In addition to identifying critical materials utilized in clean energy technologies, it is also important to know the quantity of those materials required per functional unit of the technology. The functional units created in this study differ between technologies based on the functional use of the given technology. For example, in the case of a wind turbine, it is valuable to consider the mass of critical material used per the installed power capacity, whereas for a Li-ion battery in an electric vehicle the mass of material needed per energy storage potential is more pertinent.
Once the materials with the potential to be utilized in each technology were identified, more quantitative data were gathered from literature. The quantitative portion of this study focuses on the metals identified in the initial literature review. This is due to the large portion of the critical materials that are metals, data availability, and the overlap in metals and ceramics, as it is often the metal element in the ceramic that contributes toward its criticality. The data acquired were in some cases already provided in some form of a functional unit (such as mass of material per kW of power capacity) but in other instances were provided in other units or formats such as mass of material per electric vehicle or mass per light bulb. In the results section each point in the plots represent a data point found in literature. While most of these represent different sources, in a few instances (in which a high and low value were given within a single source), both were plotted.
After carefully considering the functionality of each of the clean energy technologies in this study, it was determined that the mass of a given material per kWh would be most appropriate unit to describe the energy storage purpose of Li-ion and NiMH batteries for electric vehicles. For electric vehicle motors, solar panels, wind turbines, gas turbines, and fuel cells, the data are normalized to units of mass of material per kW of power capacity. Both of these functional units were also found, at least occasionally, in literature, further validating their usefulness. Providing data aggregation in these units will likely be most useful for academic researchers who may utilize this data for further research. Finally, for efficient lighting devices, new functional units were created to accommodate the fact the efficient lighting devices use electricity (albeit less than conventional lighting) rather than storing or generating it as with the other discussed technologies. In addition, due to the large difference between the incumbent and efficient lighting devices’ lifespans and light quality or brightness (measured in lumens), those factors have been incorporated as well to generate the functional units of mass of material multiplied by the wattage input of the bulb and divided by the product of the lumens and hours of output (g-W/lumen-hr).
In cases where data were provided in mass per vehicle for NiMH battery electric vehicles an assumption of a 1.3 kWh battery was used, consistent with literature values for the third generation Toyota Prius NiMH battery [22,66]. When data are provided in literature as mass per motor, we utilize the assumption of 130 kW for an average 2018 electric motor for battery electric vehicles (not including Tesla) [67]. We use the average without Tesla because their motor power is typically much higher than other vehicles in part due to having separate motors for front and rear wheels in their all-wheel drive vehicles [67]. There is a large range in electric motor power in electric vehicles, from the lower end with the 2018 Hyundai IONIQ with 88 kW, to the 2018 Volkswagen e-golf with 100 kW, the 2018 Nissan Leaf with 110 kW, and the 2018 Chevrolet Bolt at 150 kW, to give a few examples [68]. For efficient lighting devices, average lifespans (in hours), kW per lumen, and color rendering index (CRI) from literature were used as seen in Table 2, below.
One important concept is that the functional units can be adjusted based on the factors that an individual is interested in, and it is only necessary that any comparisons are made between like units. The three primary functional units selected are deemed to be comprehensive and useful for further study or calculations. However, in this study, two examples of how these units may be adjusted to compare different technology functionalities are also demonstrated. First, for the case of efficient lighting devices, a secondary set of units which incorporates the color rendering index (CRI) into the denominator of the aforementioned unit was created. CRI is a quantitative measure of the color reproducibility of light source when compared to natural light, where a high value indicates closer to natural light (which has a value of 100) [80]. Second, an ‘emissions savings’ unit is demonstrated for the three clean energy production technologies (wind, solar, and gas turbines). These units describe the greenhouse gas reduction potential per the mass of each material if utilized in each of the clean energy technologies and are calculated using Equation 1. Because the functional units for the clean energy production technologies are kW of power capacity, the calculations are based on one hour of electricity generation. The emissions savings (∆kg CO2eq) are based on replacing one kWh of coal with one produced with the given clean energy production method. Lifecycle greenhouse gas emissions of 0.888 kg CO2eq/kWh for coal, 0.499 kg CO2eq/kWh for natural gas, 0.085 kg CO2eq/kWh for solar photovoltaics, and 0.026 kg CO2eq/kWh for wind are assumed [82].
Equation (1): Emissions savings units.
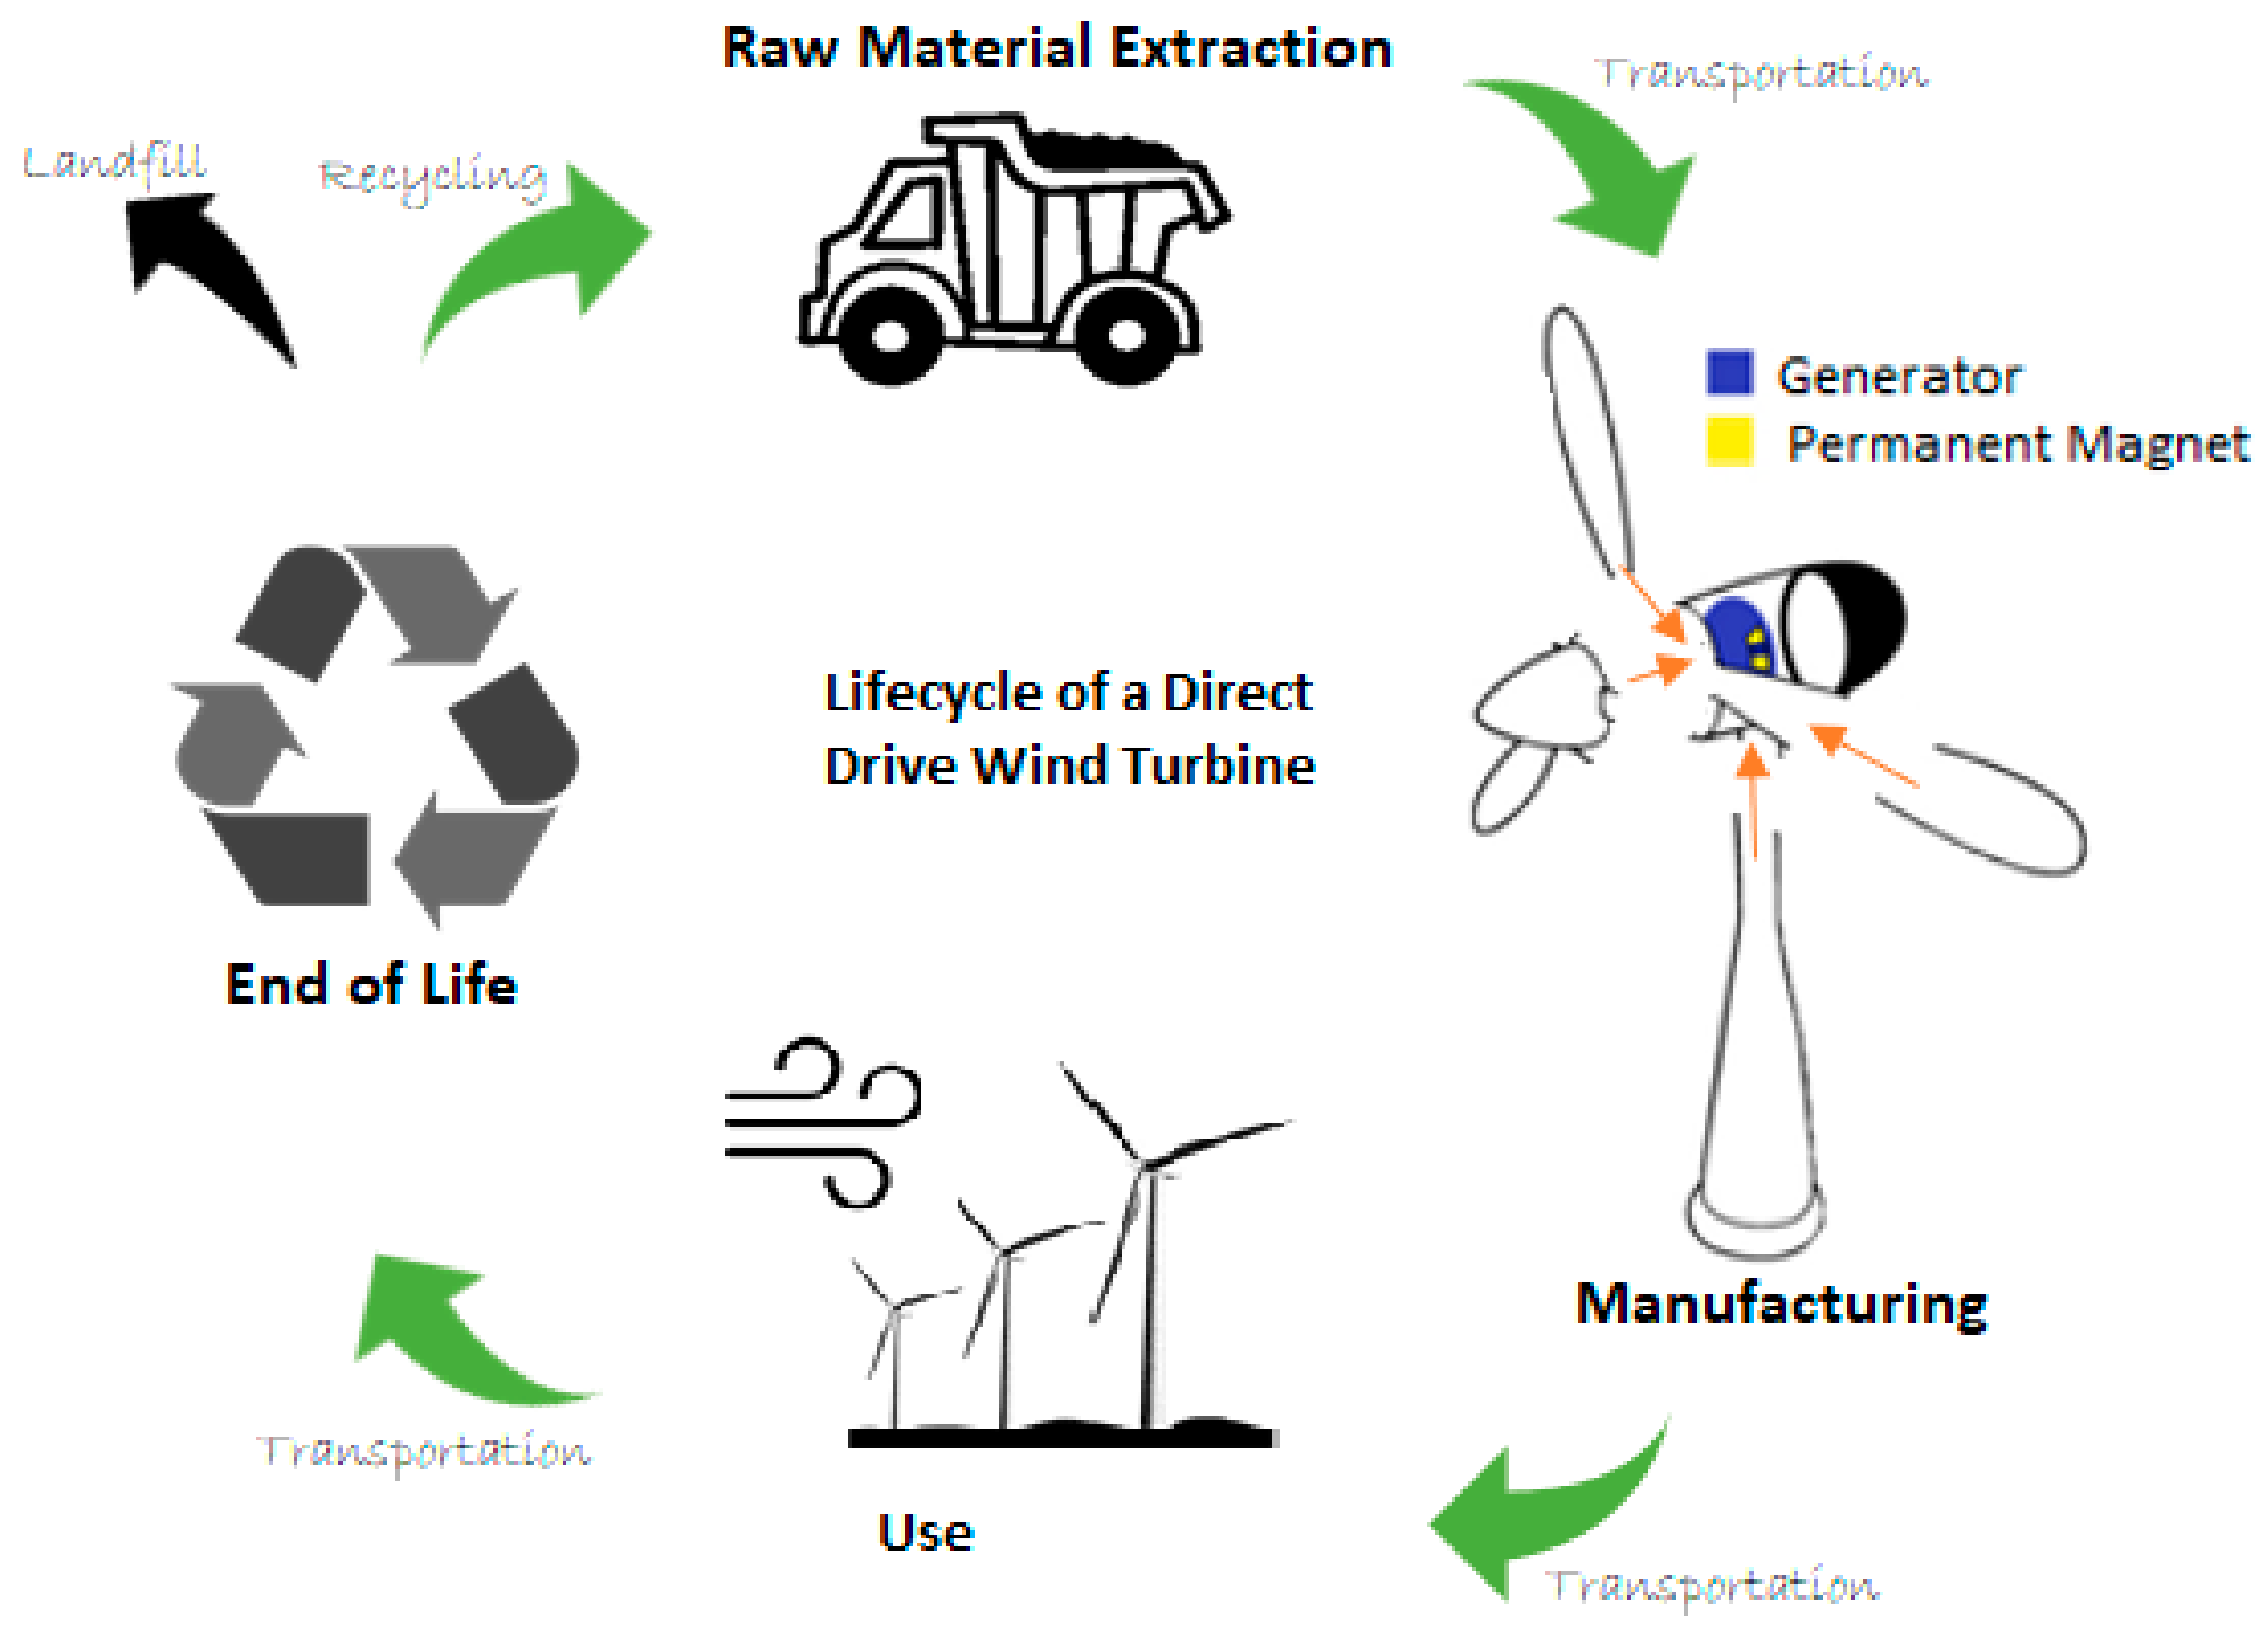
When lifecycle greenhouse gas emissions are used in the above calculation this means that the emissions from the technology’s entire lifecycle are quantified through lifecycle assessment including the raw material extraction, manufacturing, use, and disposal as seen in the example for a wind turbine in Figure 2 [83]. The quantified lifecycle greenhouse gas emissions listed above for each technology are mean values from a review article that takes 21 studies into account and therefore provide a good estimate for the lifecycle emission values [82]. With any lifecycle assessment, however, there are assumptions made that lead to uncertainty in the results. These lifecycle emissions per kWh for each technology are recognized to be estimates for these calculations as actual emissions would vary based on many factors including the technology’s specifications, transport distances, and location of their installation and use.
4. Results and Discussion
The quantitative data gathered, and presented in Figure 3, Figure 4, Figure 5, Figure 6, Figure 7 and Figure 8 below, are valuable for many applications, whether they be comparisons of the intensities between materials within a single technology, or of a single material across multiple technologies with the same function. These capture the inherent variability that exists in material intensities in clean energy technologies and provide data for material scarcity or supply issue predictions based on clean energy demand and adoption scenarios.
4.1. Clean Energy Production Technologies
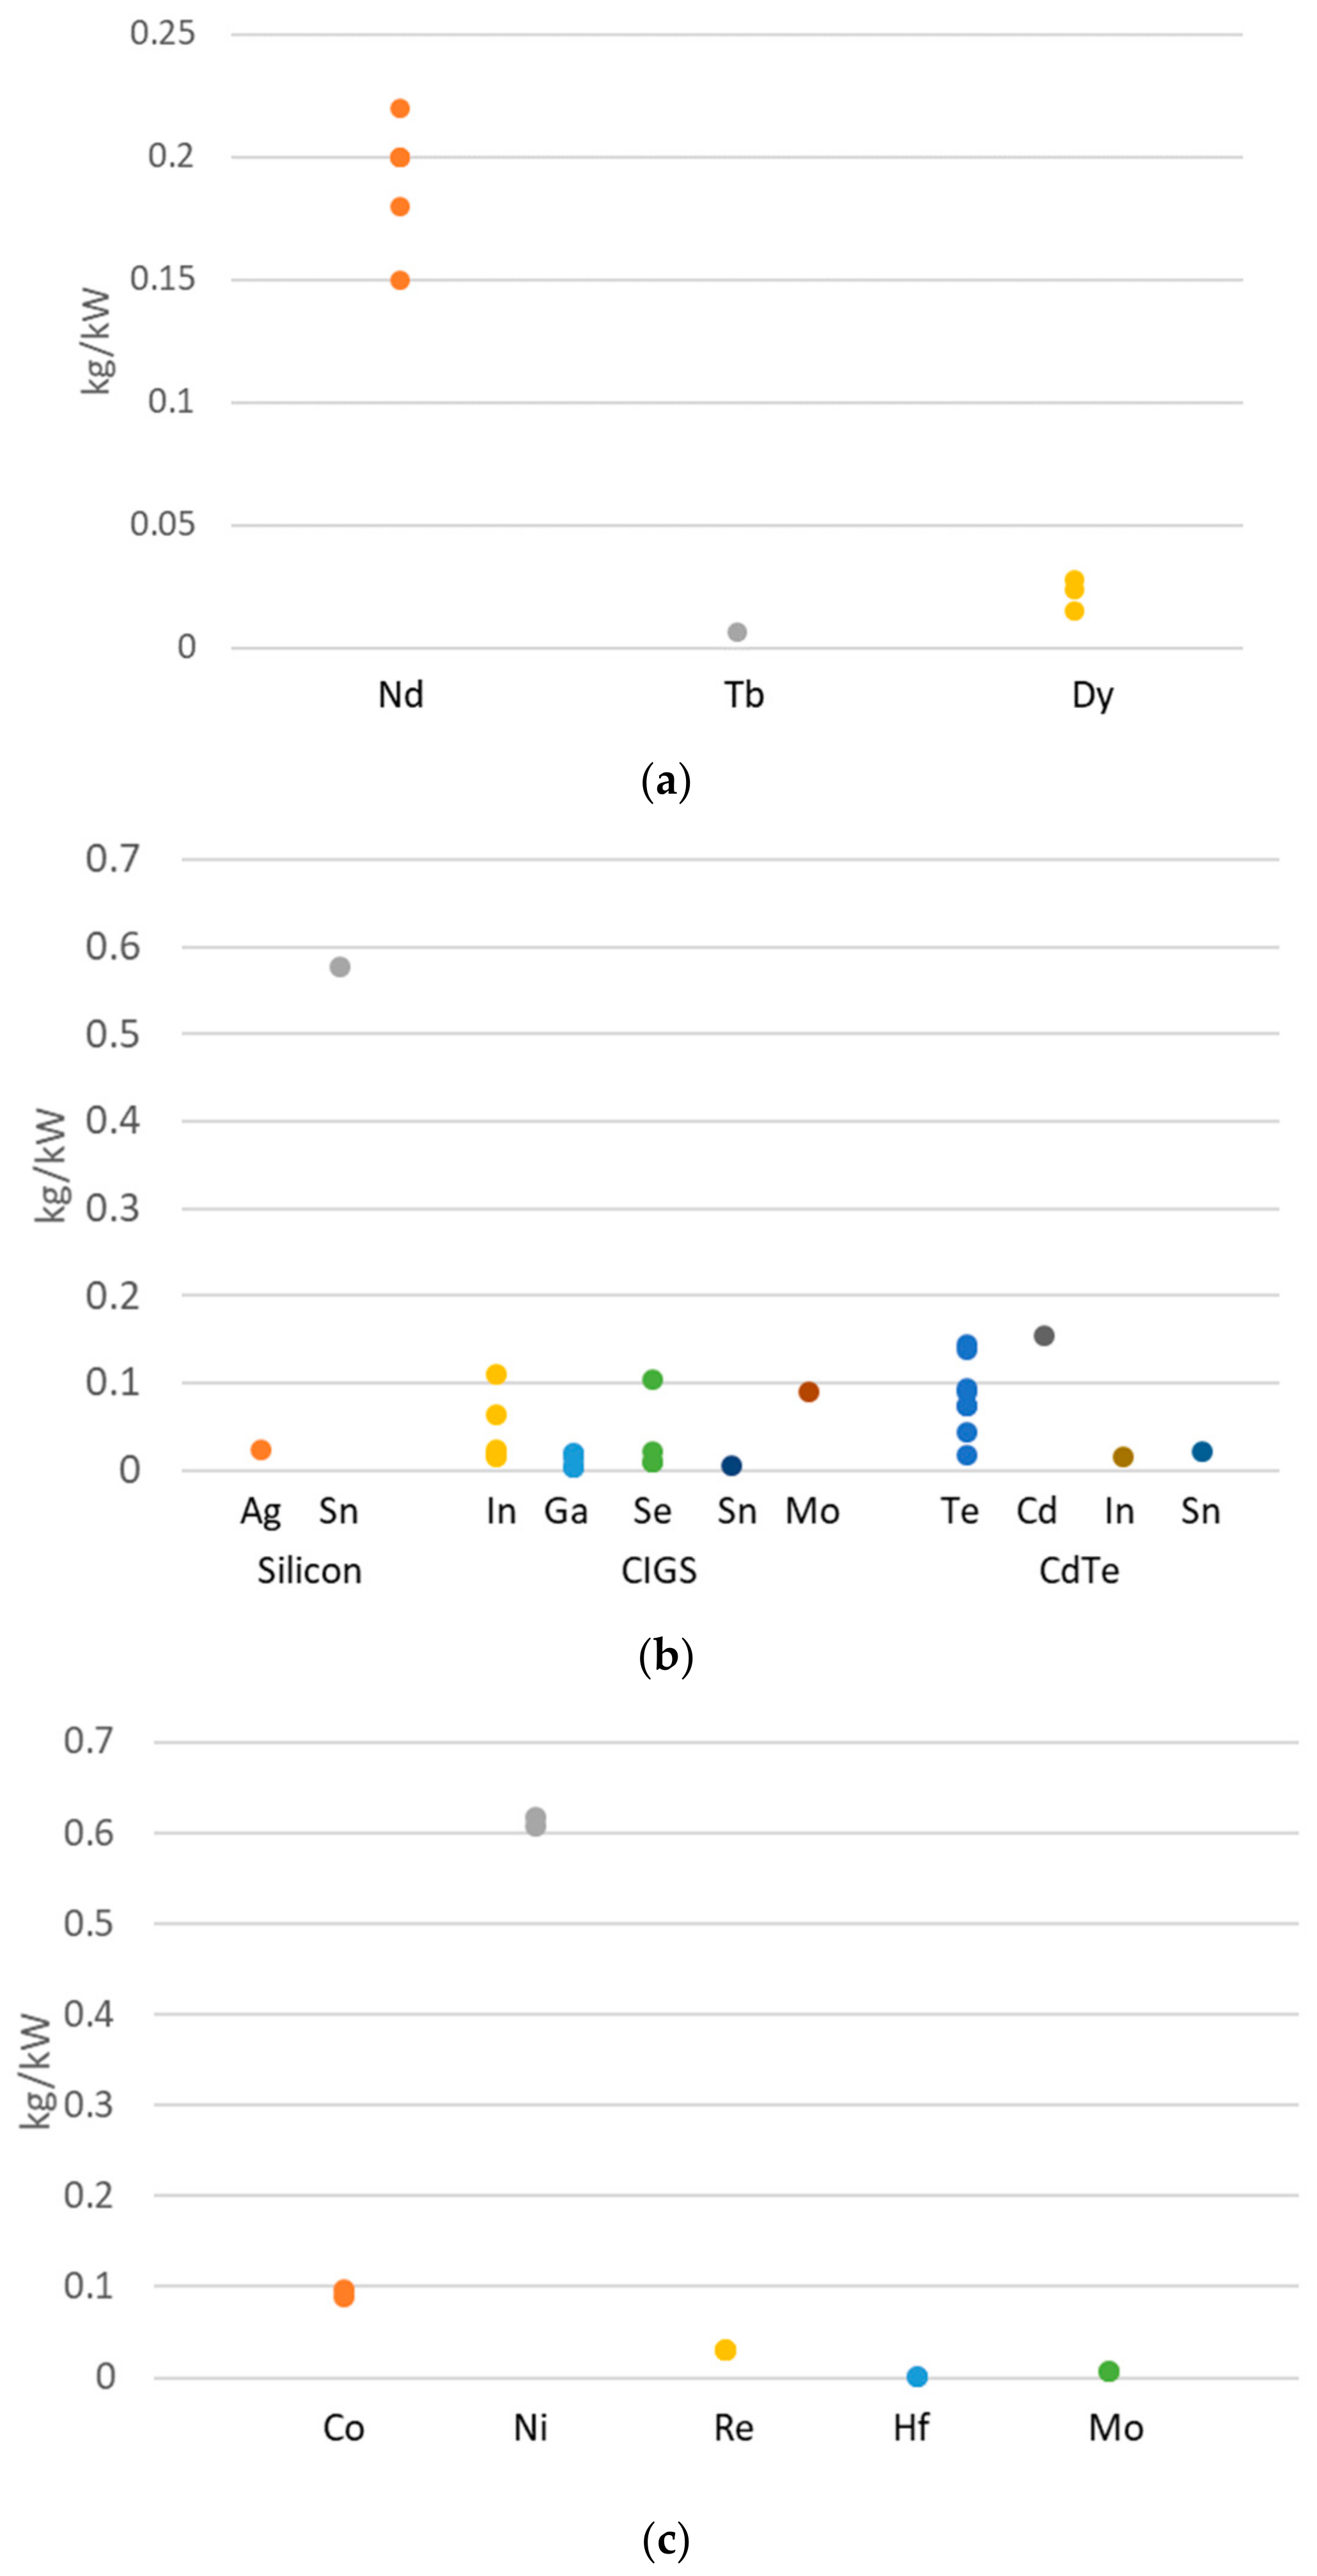
The material intensity data aggregated into functional units of kilograms of material per kW of power capacity for the clean energy production technologies can be seen in Figure 3. When reading these figures, it is important to note that a material with a greater intensity does not necessarily indicate that it is more problematic. For example, in Figure 3a, neodymium is seen to be used in much greater intensities in NdFeB magnets than terbium and dysprosium, however, terbium and dysprosium are “heavy rare earths” which are less abundant and more costly than neodymium [84]. When the costs of each material are taken into consideration along with the material intensities, each material contributes approximately 2.4–3.5% of the NdFeB magnet cost, showing that while there is large variation in material intensities between the three materials, their economic contributions to the permanent magnets are actually quite similar [85]. In addition to adding in economic considerations, the environmental impacts of each material may also be considered alongside the material intensities as well. For example, in the solar cases presented in Figure 3b, it may be important to consider that indium and tin typically have worse environmental impacts to human health and ecosystems than cadmium, and therefore just because they are found in lower intensities in CdTe solar panels does not mean that they have a lower impact [86]. Another important consideration is the variability in the data. For the superalloy coating on the gas turbine blades, shown in Figure 3c, a tight range can be seen in the data points (with a some overlapping) which is assumed to be due to the greater specificity of the technology being considered and the existence of fewer manufacturers. A nickel-based superalloy coating will likely have low variability in material intensity, especially as previous attempts to lower rhenium content have not been successful in maintaining the heat resistant properties [14].
4.2. Low Emission Mobility Technologies
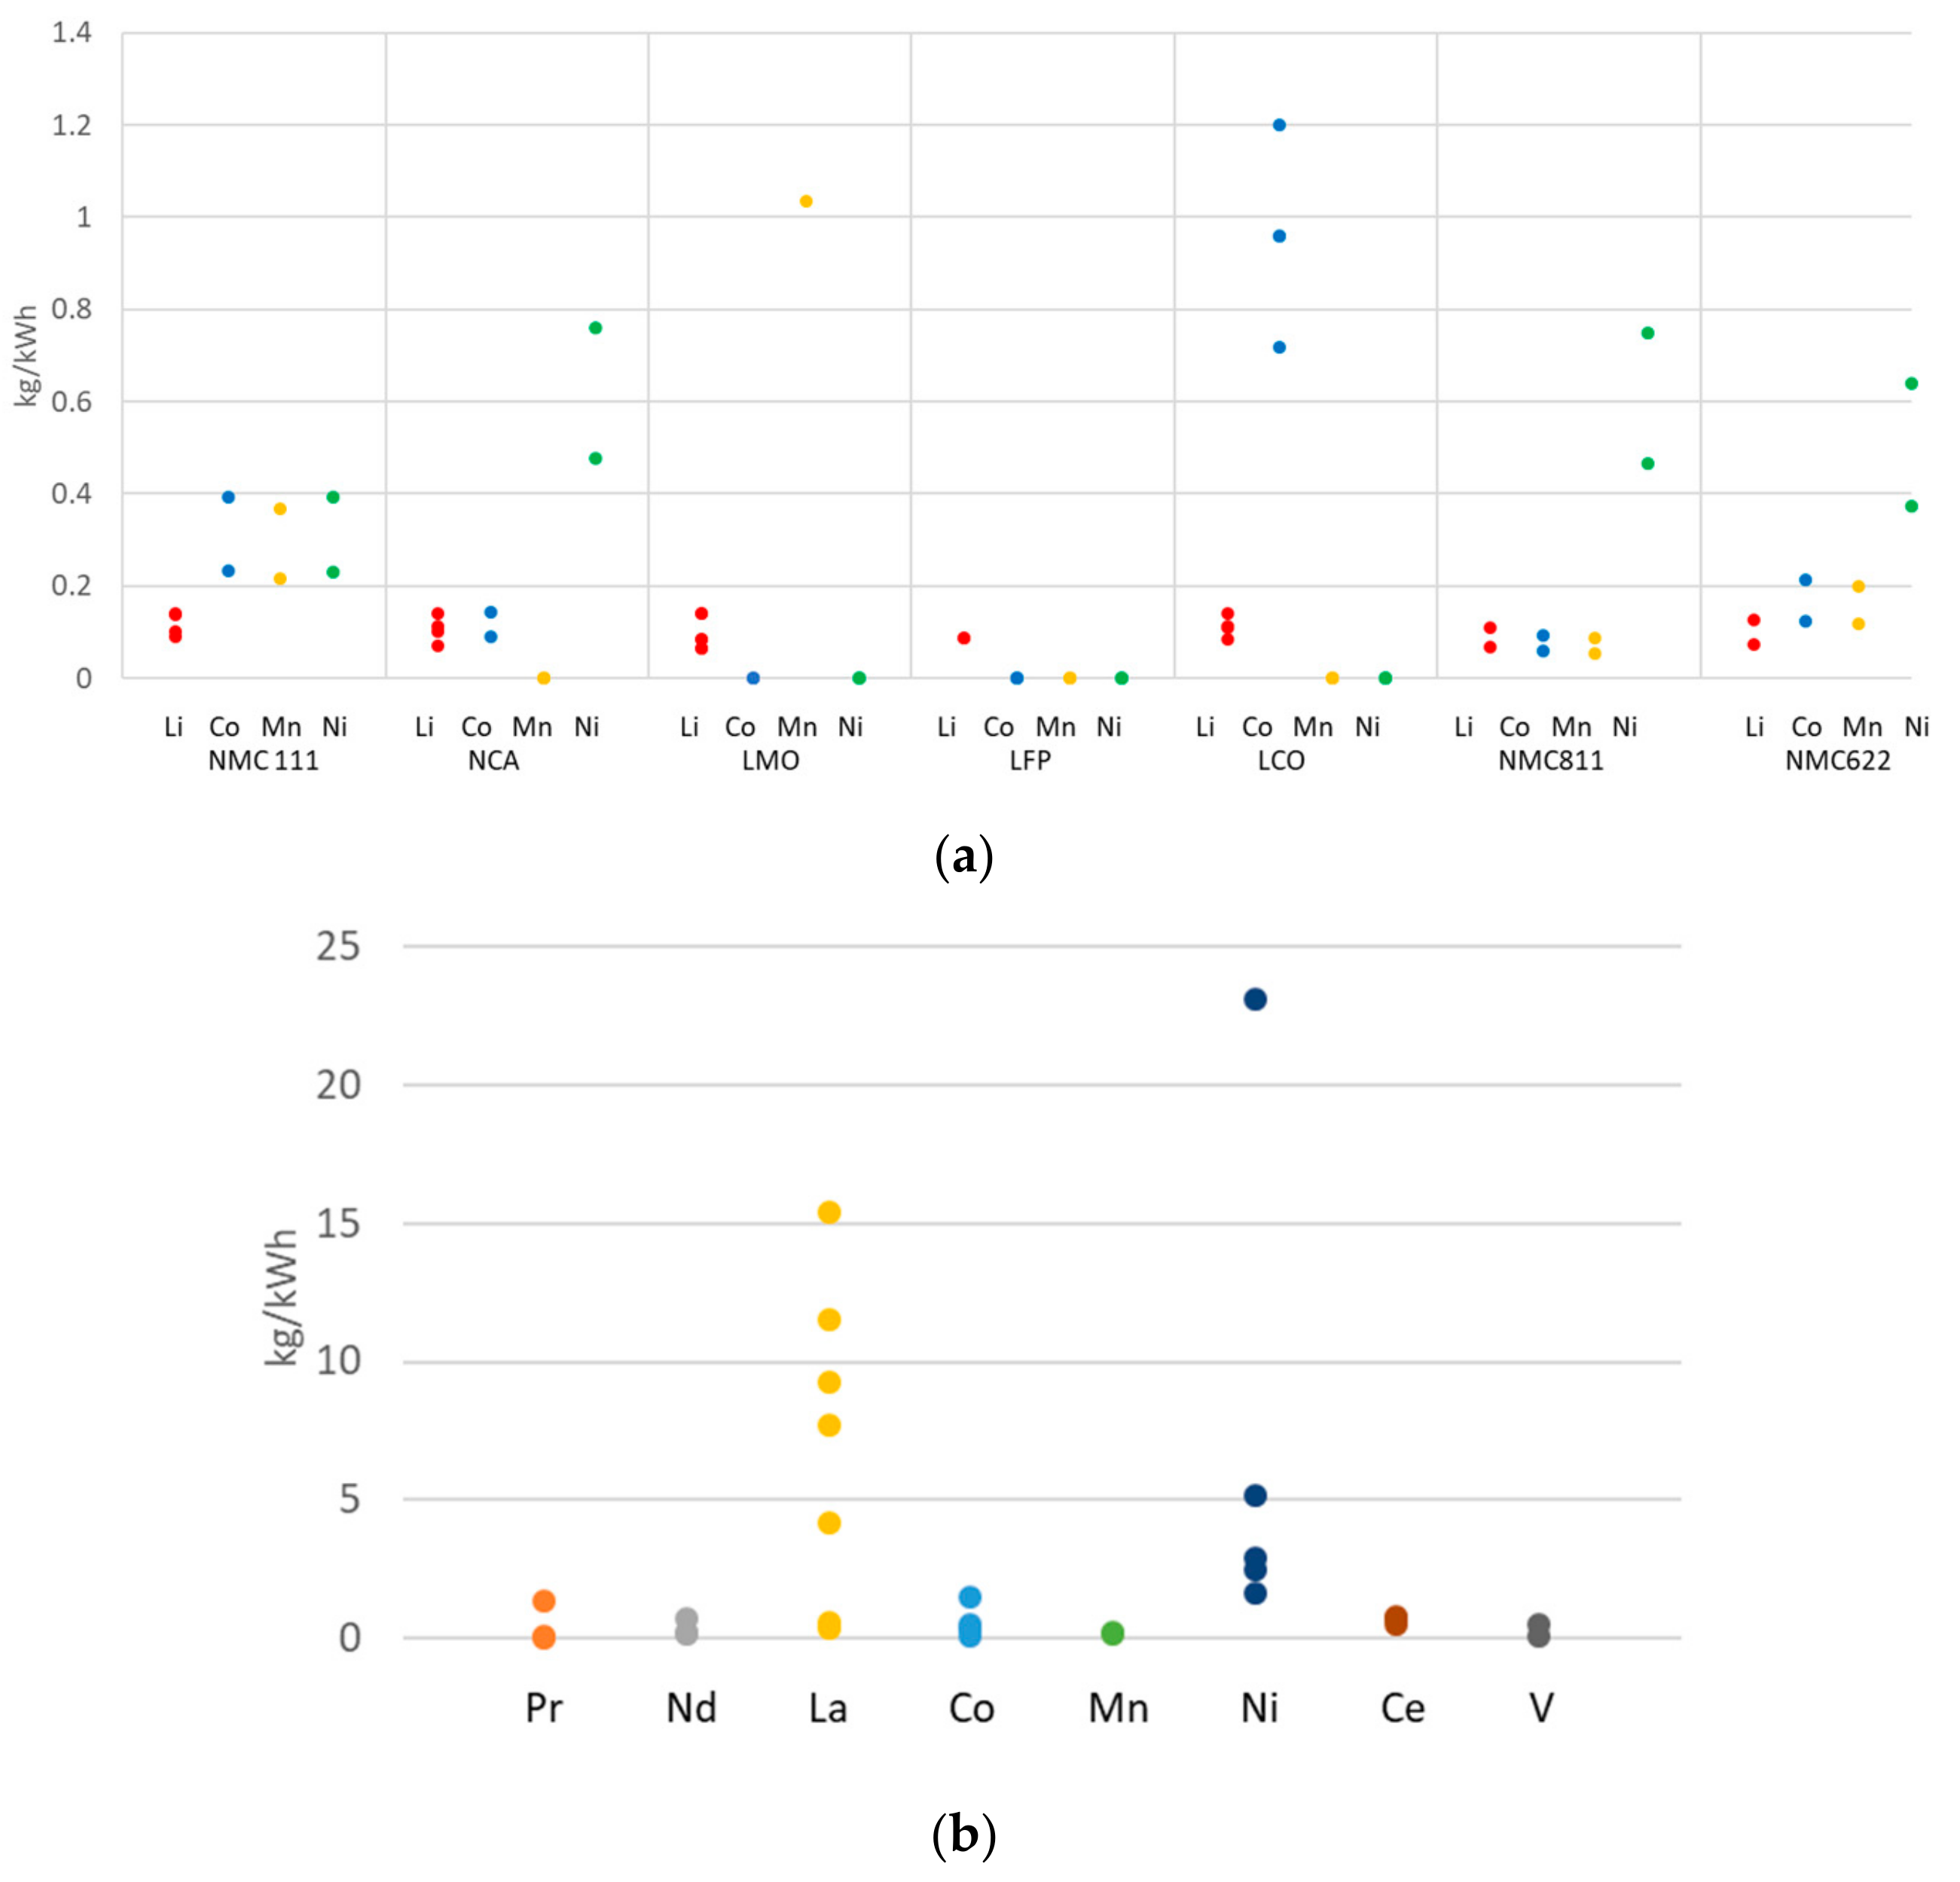
The material intensity data aggregated into functional units of kilograms of material per kWh of energy storage for the low emission mobility technologies can be seen for seven different Li-ion battery chemistries and NiMH batteries in Figure 4a,b, respectively. Comparisons can be made with ease between the material intensities of the seven different Li-ion battery chemistries as the same four critical materials are considered in each. For example, cobalt is one of the more critical materials used in this technology; therefore, as seen in Figure 4a, LCO batteries which have a very high cobalt intensity relative to the other chemistries would be at much greater risk of impact from cobalt supply disruption than the other chemistries. Lithium can be seen to have very little variation between chemistries and while manganese and nickel do vary somewhat those materials have less criticality concerns. This draws out an important point in that material intensity is not the entire story and other metrics (be they performance, environmental, or criticality indicators) can be incorporated into these functional units to provide the user with different information. Because NiMH and Li-ion batteries have the same functional units it is possible to also compare between technologies, observing for example that nickel intensities are typically greater in NiMH batteries than any of the seven Li-ion chemistries. One trend that can be clearly seen in Figure 4a is the increasing nickel intensity and decreasing manganese and cobalt intensities from NMC111 to NMC622 to NMC 811. This is to be expected as the numbers following ‘NMC’ represent the ratio of Ni:Mn:Co. This trend is important because more Li-ion batteries are moving towards these newer lower cobalt intensity NMC622 and NMC811 chemistries in part due to the lower criticality of manganese and nickel [85]. Criticality reduction is not the only benefit of replacing cobalt with nickel, as nickel can provide lower toxicity and the potential to increase capacity, tap density, and volumetric energy density [90].
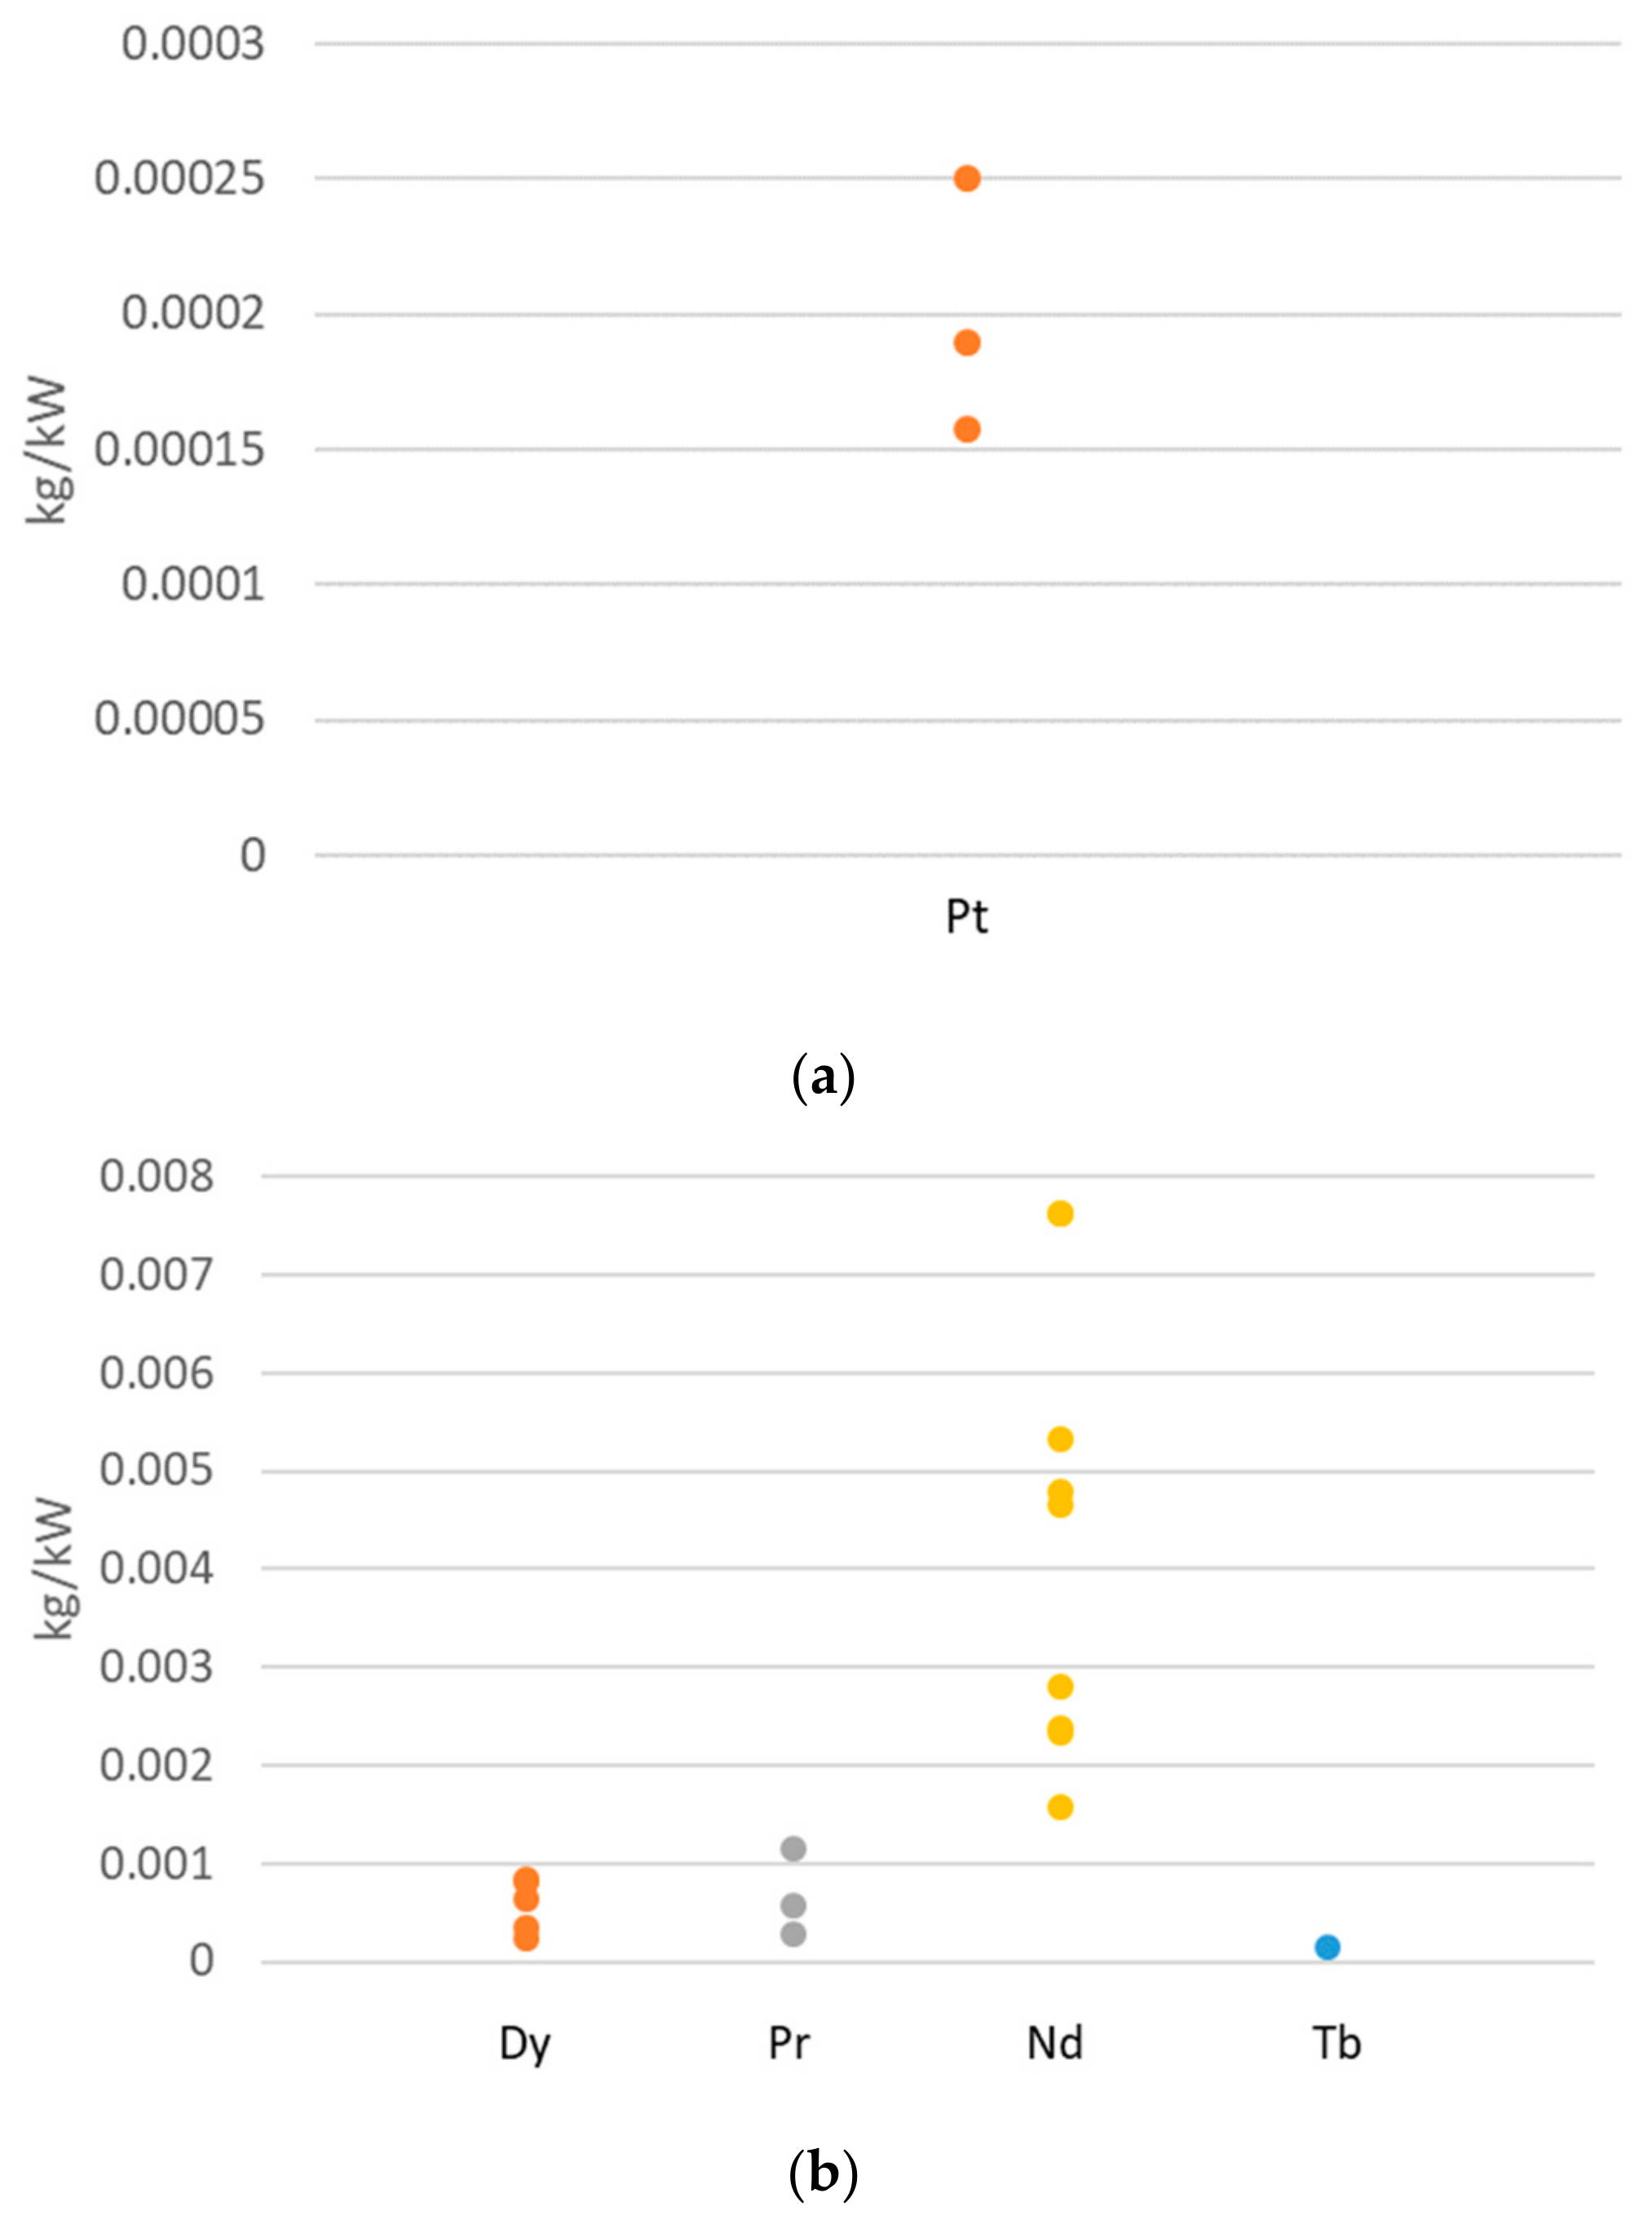
The material intensity data aggregated into functional units of kilograms of material per kW of power capacity for the low emission mobility technologies of PEM fuel cells and NdFeB permanent magnets in electric vehicle motors are shown in Figure 5a,b, respectively. In fuel cells, the platinum intensities shown are from 2011 or later which is important because due to active dematerialization efforts, platinum group metal intensities have been reduced by approximately 80% in PEM fuel cells since 2005 [94]. For the permanent magnet motors, it is assumed that the large range in neodymium intensities found in literature could be partially due to the potential for praseodymium to be substituted for neodymium or vice versa [10].
4.3. Energy Efficency Lighting
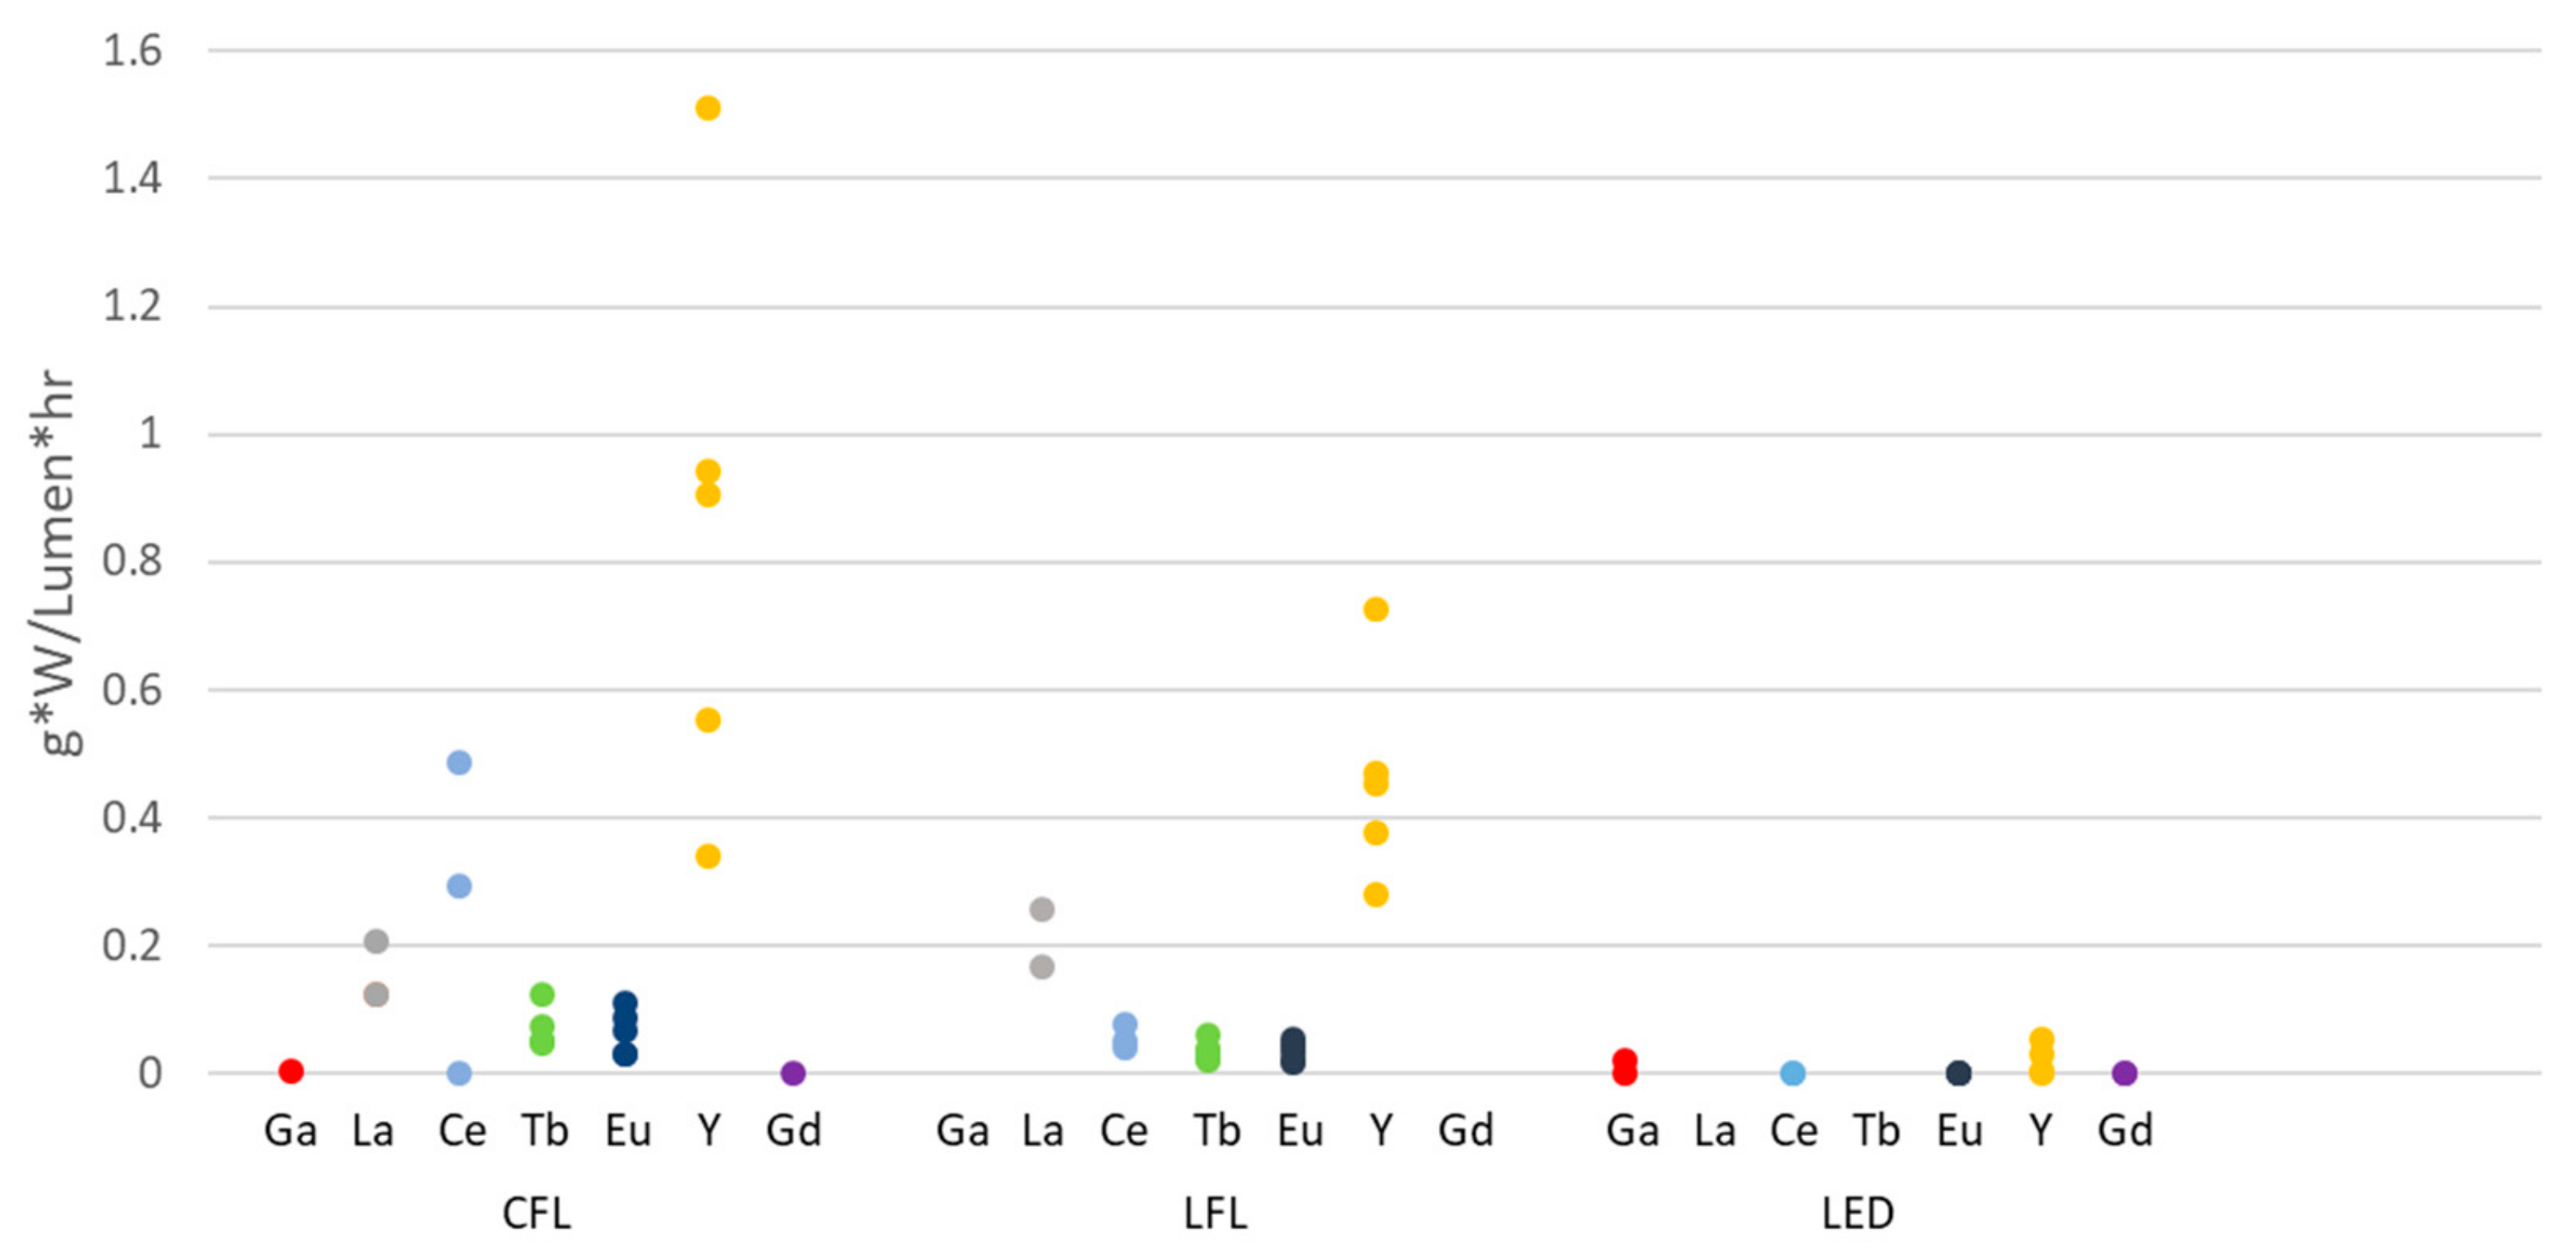
The material intensity data aggregated into functional units of g-W/lumen-hr can be seen for the three types of efficient lighting devices in Figure 6. Because the same seven materials are compared across all three bulb types, the material intensity comparisons in the given functional units can be made with ease. For example, one of the primary trends that can be seen in Figure 6 is the lower intensity of rare earth elements (Gd, La, Ce, Tb, Eu, and Y) in LEDs than in either of the fluorescent bulbs per the wattage input, and lumens and hours of output. This is mostly because of the utilization of less mass of rare earths per LED bulb, but is also magnified by the longer lifespan of LEDs when compared to fluorescents.
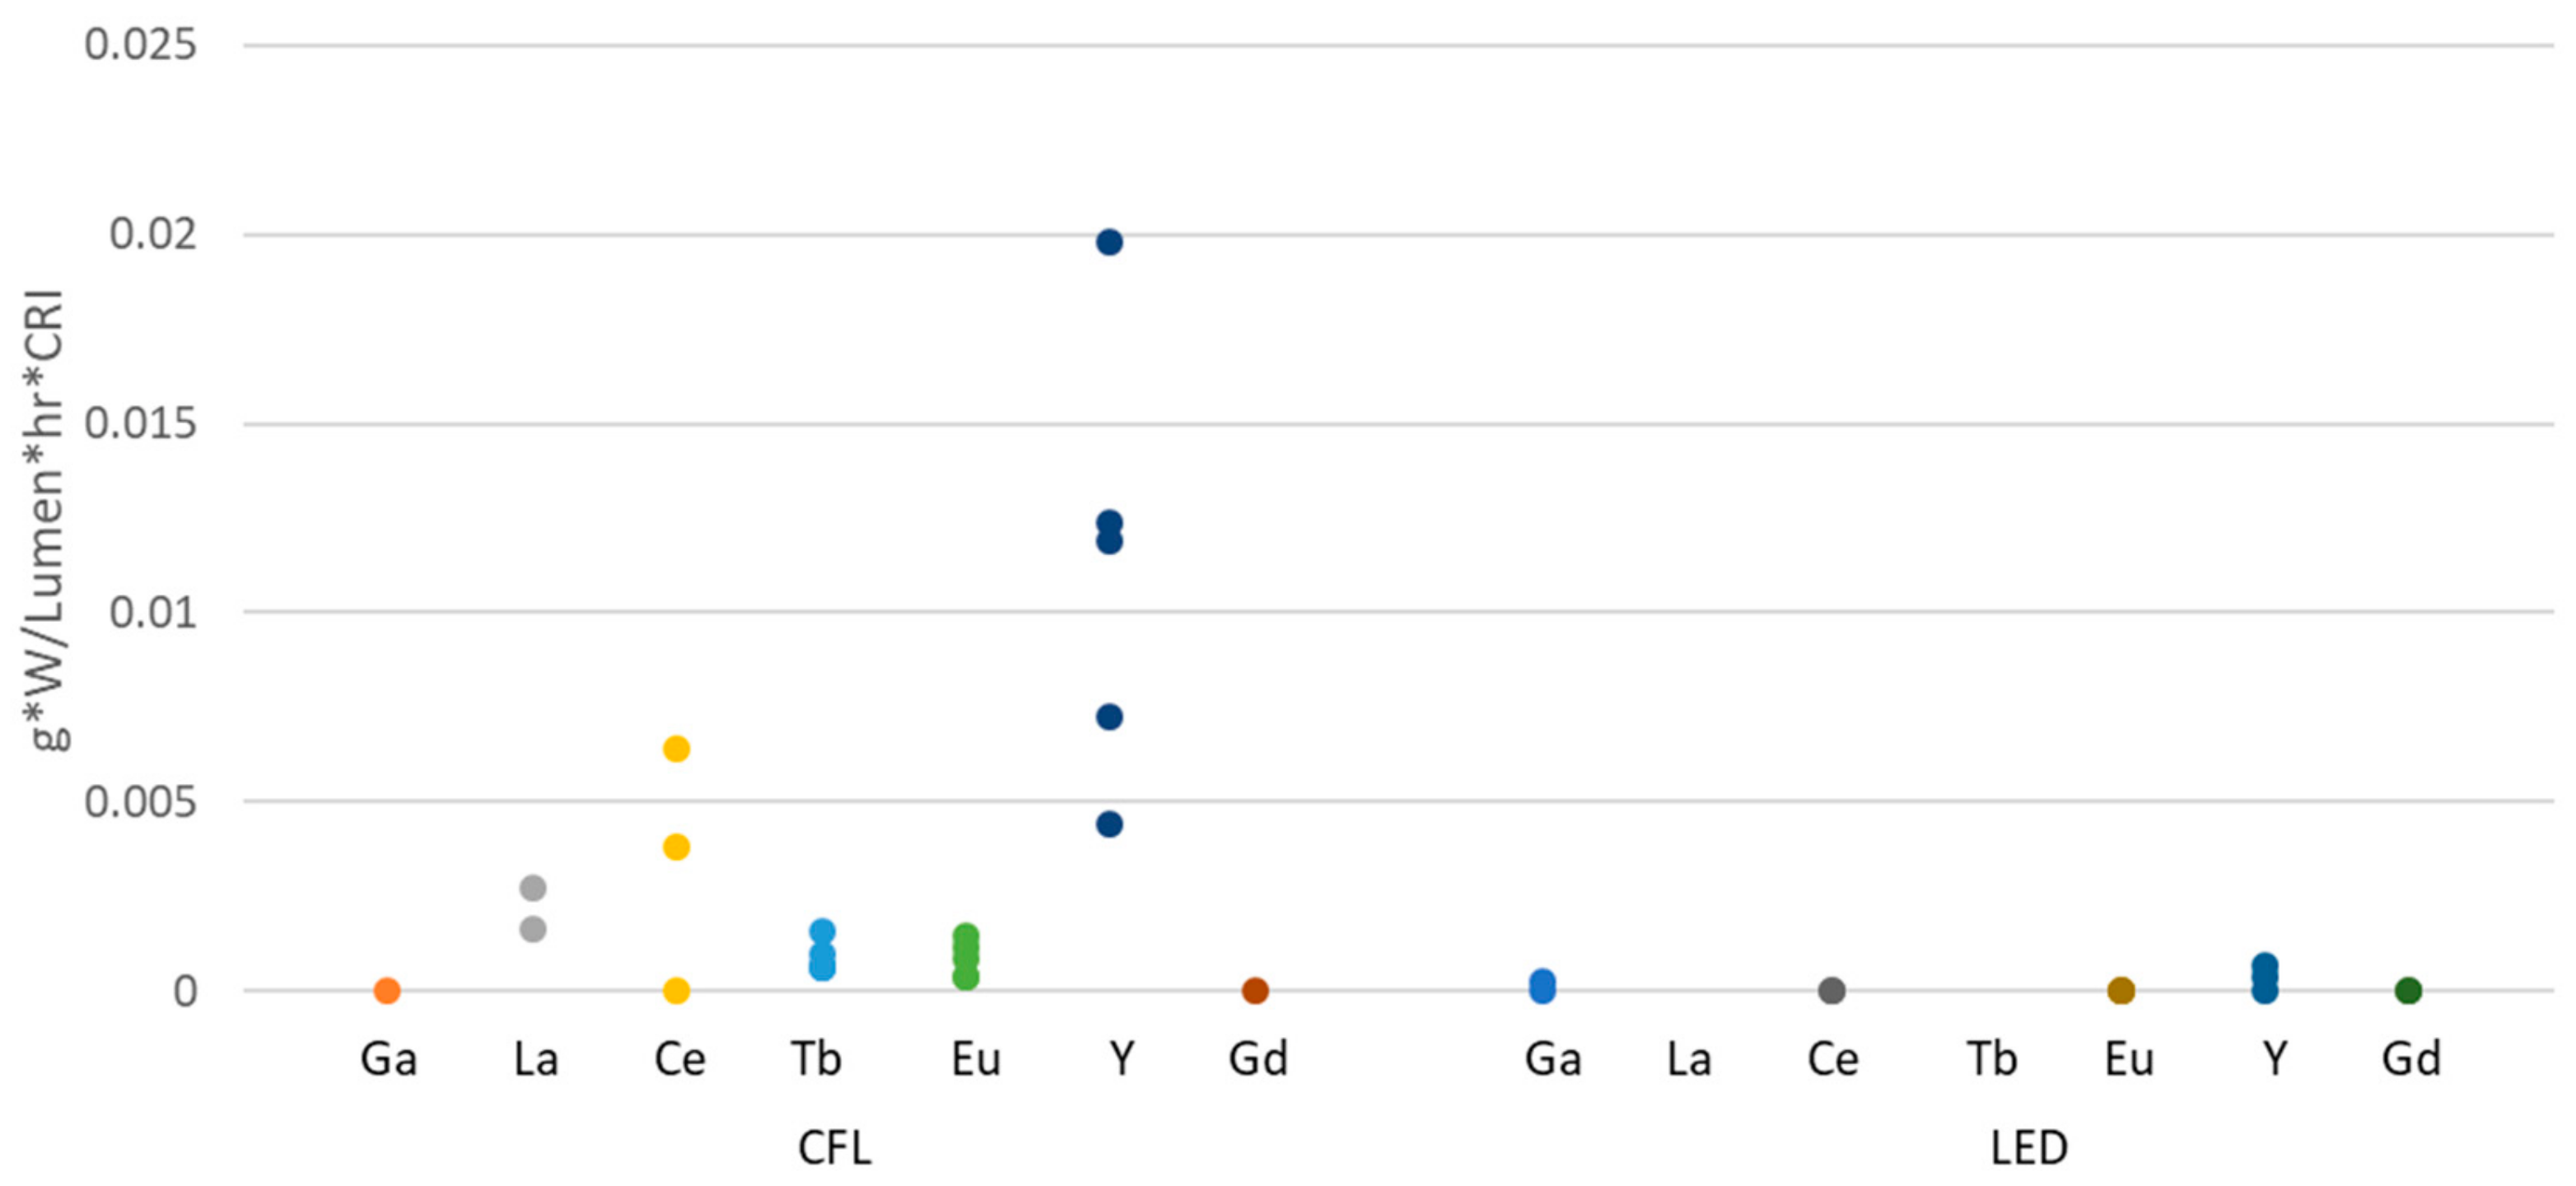
The material intensity data, aggregated into functional units of g-W/lumens-hr-CRI can be seen for the CFL and LED bulbs in Figure 7. Only these two cases are shown because the CRI value for fluorescents is the same for CFL and LFLs, and therefore those values would change by the same factor. The LED and CFL cases shown, however, are affected by the addition of the CRI values in the denominator of the functional unit, albeit very slightly. The CRI value averaged from literature is 76.2 for fluorescents and 81.1 for LEDs, as shown in Table 2. By incorporating this factor into the denominator, the LED bulbs are given a very slight advantage over the CFLs as the incorporation of CRI output into the functional unit would lower it slightly, as compared to the above units in Figure 6 which do not incorporate CRI.
4.4. Emissions Savings Units
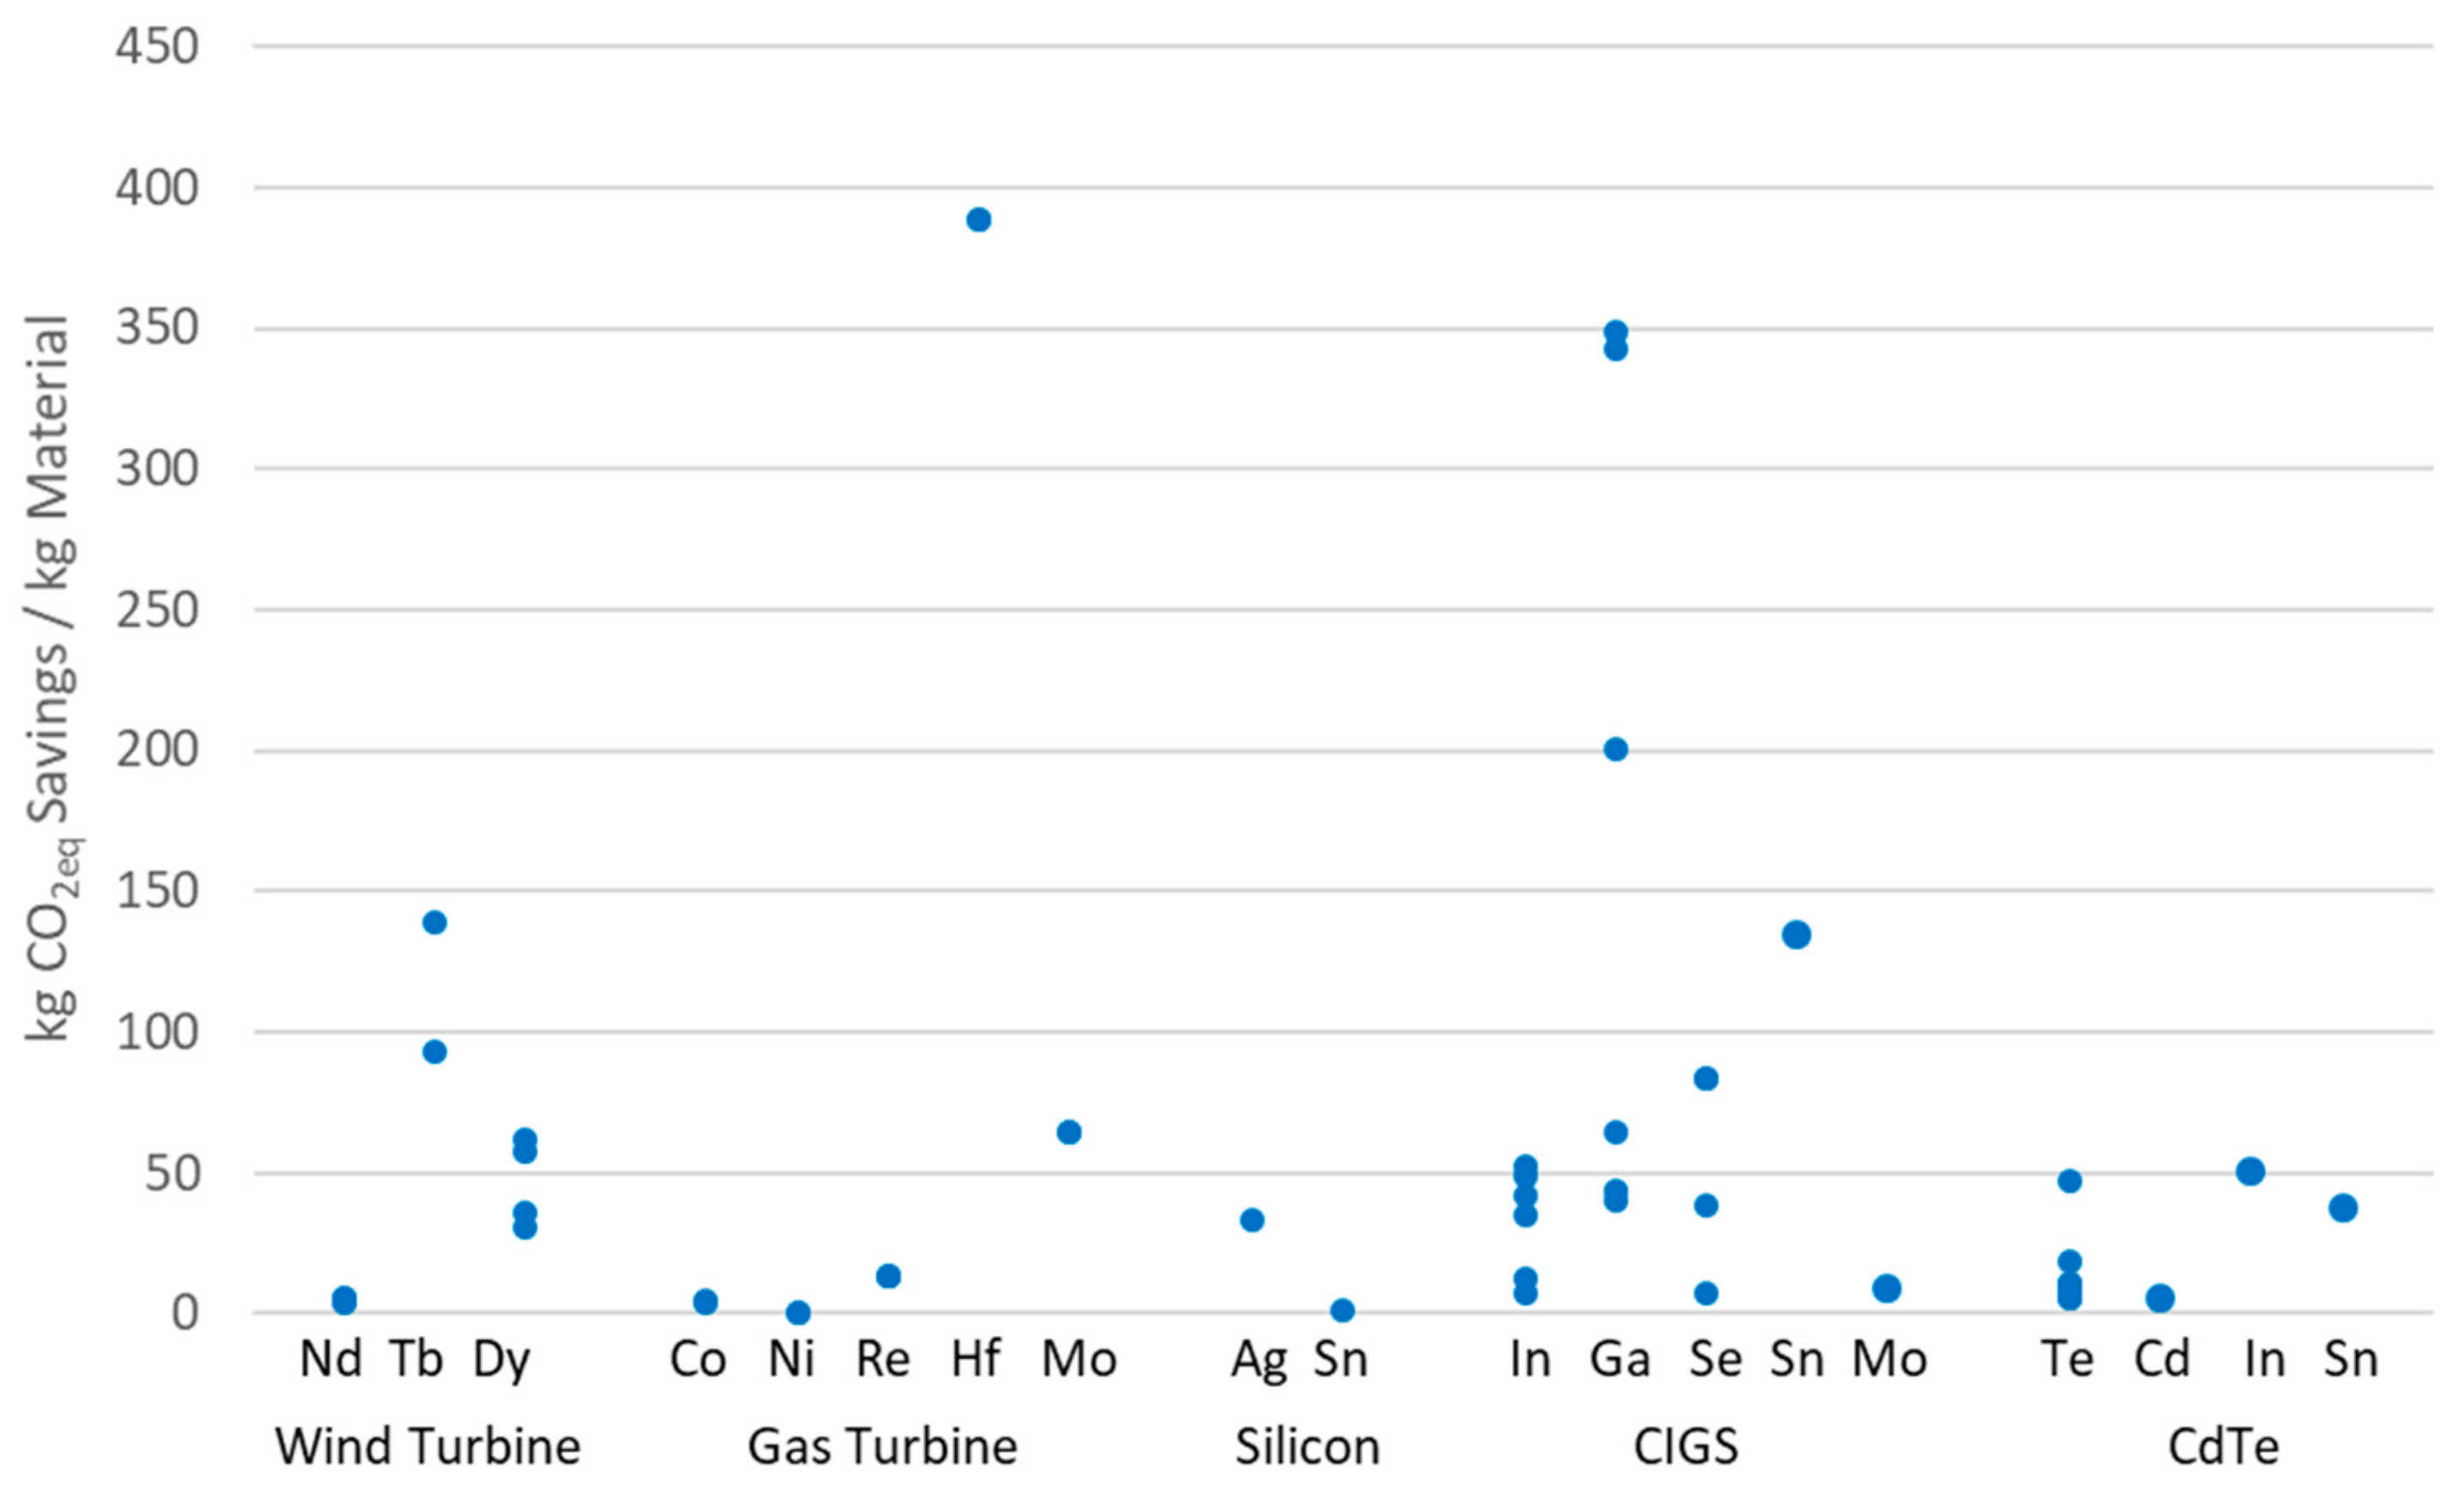
The emissions savings units are used to capture the environmental benefits of these clean energy production technologies in an adaptation of the previous functional units. The results can be seen in Figure 8.
In Figure 8, two factors are at play in the functional units displayed. The first is the difference in greenhouse gas emissions per kWh between the clean energy production technologies considered and coal. Natural gas has approximately 56% of the lifecycle greenhouse gas emissions of coal while wind and solar have approximately 3% and 10%, respectively [82]. These approximations are used in the calculation of the emissions savings functional units as described in the methods sections. The second factor that affects the functional units is the quantity of material utilized per kW of capacity of the technology. Therefore, when considering emissions savings per mass of material, the outcome may be a high emissions savings per mass of material due to either a low material mass per kWh, a high differential in GHG emissions per kWh, or a combination of these two factors. By referring back to Figure 3, it is possible to differentiate between the two factors by seeing where low material intensities may be the largest contributing factor.
This study assumes the replacement of coal with the adopted clean energy technologies because it would make sense that the fossil fuel source with the greatest greenhouse gas emissions per kWh of electricity production would be the first to be phased out during the adoption of clean energy production technologies. However, it would produce different results, for example, if it was assumed that the clean energy production technologies studied were replacing electricity produced by nuclear that was being phased out. If replacing nuclear (at 0.029 kg CO2eq per kWh) was assumed, then a very small emissions savings for utilizing wind, and negative emissions savings functional units (or increased emissions) for photovoltaic solar and gas turbine replacements would be realized [82]. There are, of course, other factors to consider when replacing one energy production method with another, including reliability, cost, and—for the case of nuclear power—significant legacy impacts from decommissioning. Decommissioning, along with the initial construction of nuclear power plants, actually account for the majority of the lifecycle greenhouse gas emissions associated with nuclear power [82]. While the greenhouse gas impacts of decommissioning are accounted for in the lifecycle units utilized in this study, the significant cost and safety issues of decommissioning a nuclear power plant—particularly stemming from handling the radioactive waste—are additional factors to be considered [98].
The results would also change if only the generation phase emissions were considered (rather than lifecycle emissions). The majority of coal and natural gas emissions (approximately 86% and 88%, respectively) come from the generation phase, so there would be slight decreases in those numbers and zero generation phase emissions for the renewable solar and wind technologies [99]. If it was assumed that coal was replaced under the generation phase emission scenario, there would be very similar results to those presented in Figure 8, with just slightly lower savings for the implementation of the clean energy technologies due to a slightly smaller differential. If, however, it was assumed that the clean energy technologies were replacing an average kWh in the United States or New York State electrical grids, at 0.46 or 0.21 kg CO2eq per kWh, respectively, there would be reductions in generation phase emissions from wind and solar renewable energy technologies whereas the natural gas emissions from the gas turbine would actually produce an increase in emissions (or a negative functional unit kg CO2eq savings/kg material) [100]. These are a few ways the units can be utilized to understand the environmental implications of critical material use in clean energy technologies, and as previously stated there are many other potential adaptations of the functional units from this study.
4.5. Economic Analysis
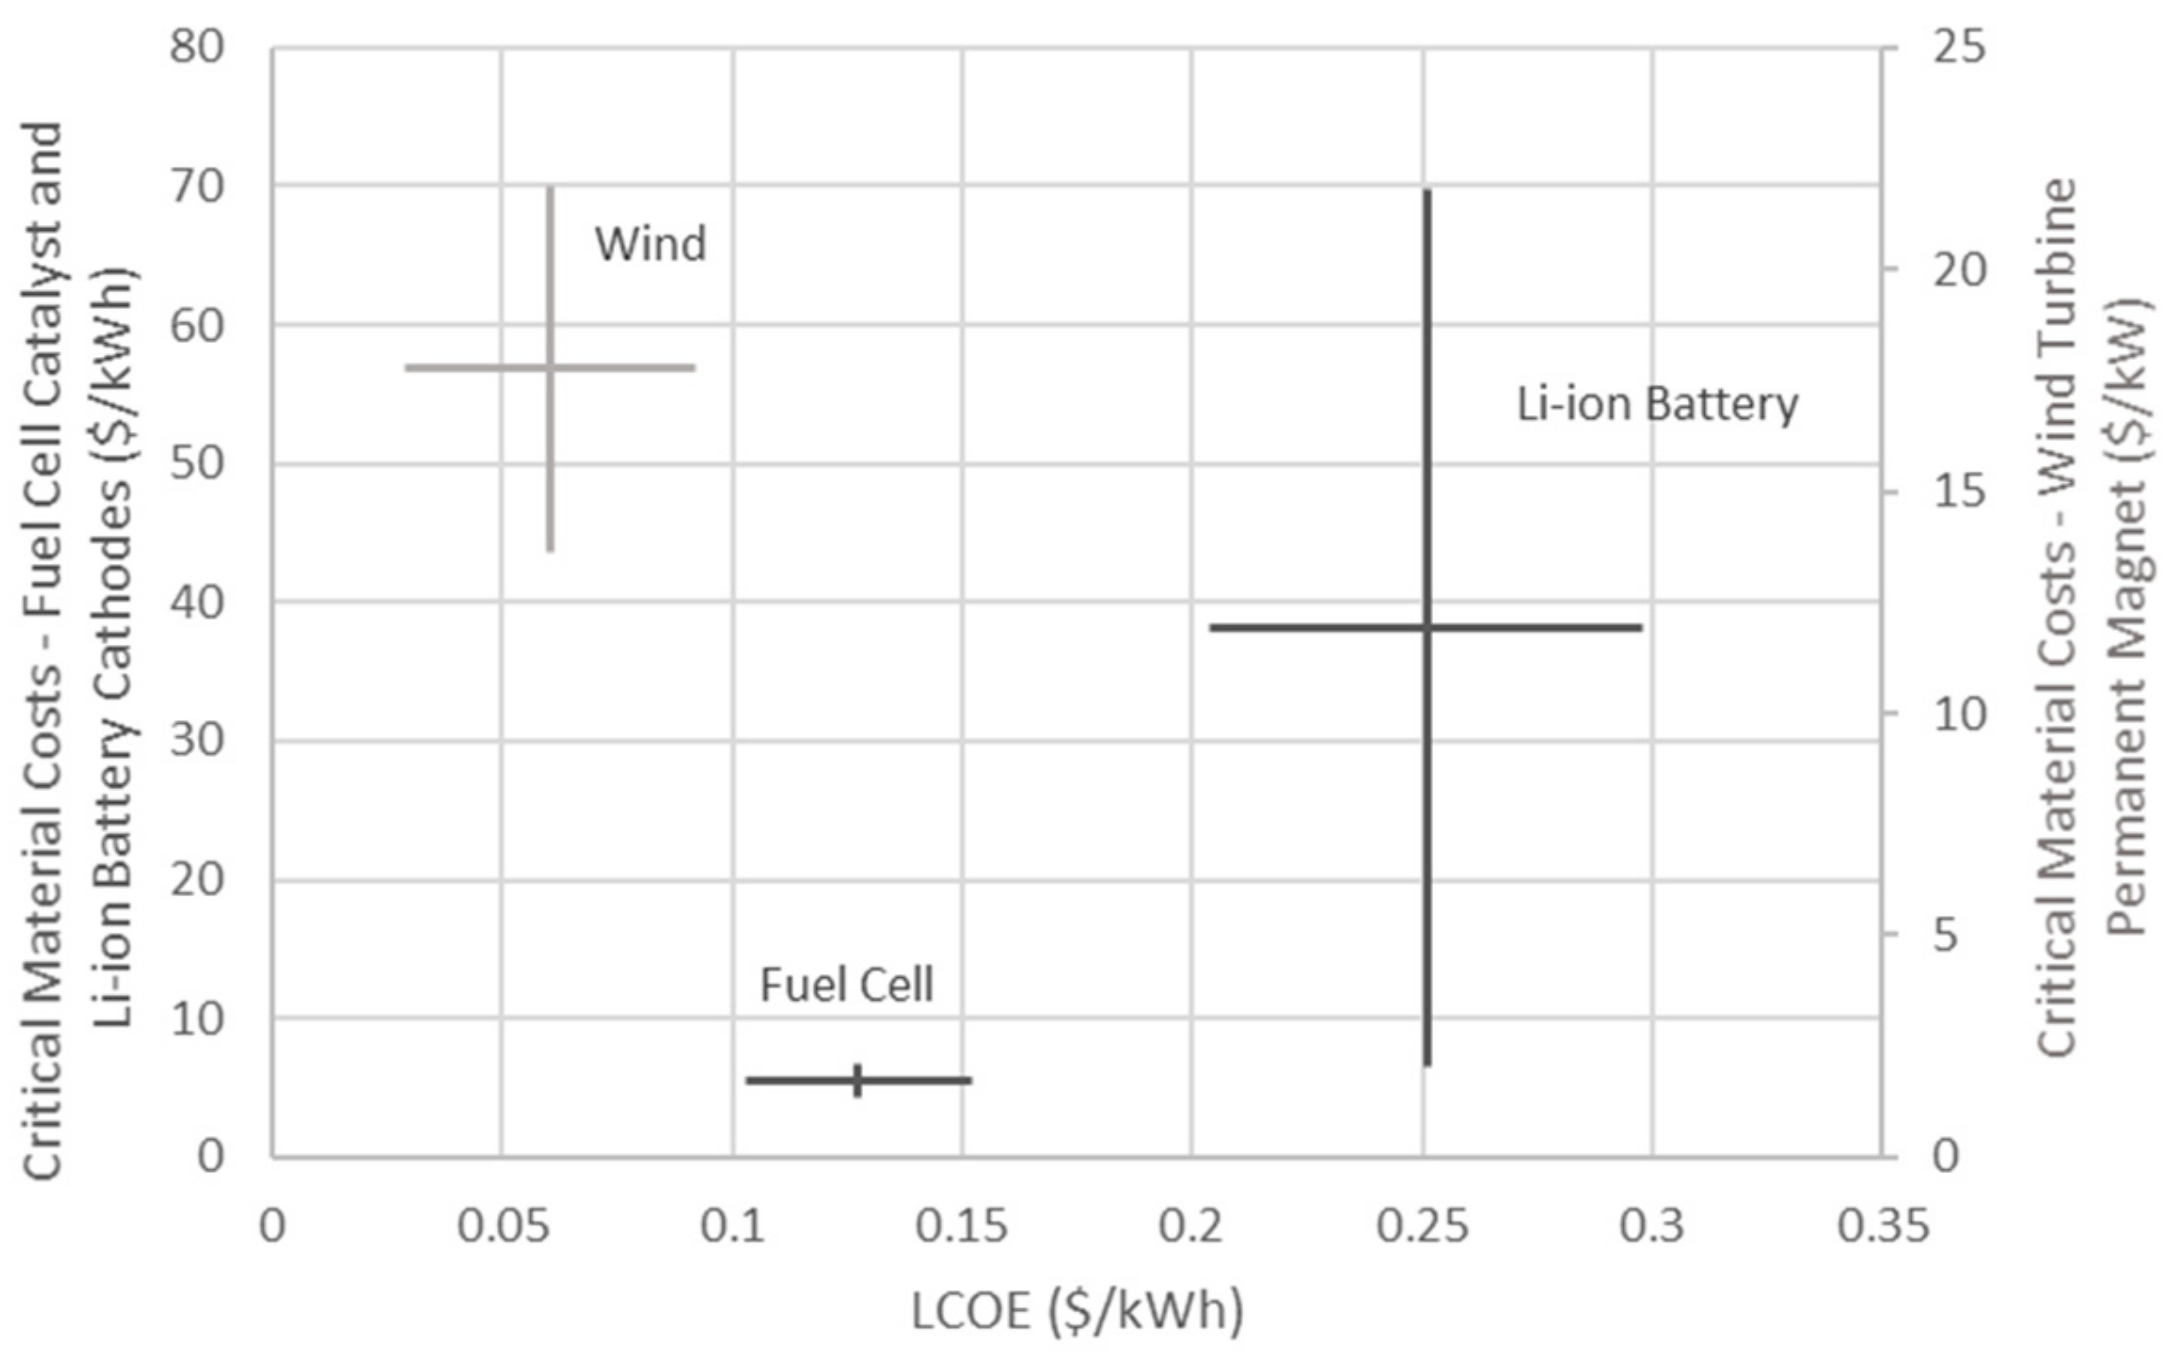
Levelized cost of energy takes into account all of the lifetime costs and divides them by the lifetime energy production (or discharge for storage technologies) to give a cost per kWh [101,102]. In Figure 9, the ranges in total critical material costs for each technology have been plotted against ranges in levelized cost of energy (LCOE). This means that for wind energy technologies, the range in total cost of the Nd, Dy, and Tb are plotted; for fuel cells, the range of Pt costs are plotted; and for Li-ion batteries, the figure shows the range in cost of Li, Co, Mn, and Ni across all seven Li-ion battery chemistries, illustrating a large range in critical material costs [85]. One important note is that the LCOE for offshore wind is much higher ($0.092/kWh) than onshore wind ($0.029–0.056/kWh) but both have been included in the overall range of LCOEs for wind in Figure 9. All LCOE values are based off unsubsidized technology costs [101,102].
The values provided in Figure 9 are meant to demonstrate the general ranges in critical material costs and levelized costs of energy for each of the three example technologies. These metrics are impacted by a number of factors including location of installation, scaling of technology size, and the specific type of the technology. The fuel cell, wind, and Li-ion LCOEs provided are generalized for those categories of technologies. Overall, a lower LCOE and lower critical material cost is preferred. In terms of the range in critical material costs, that of fuel cells is expectedly the shortest due to the inclusion of only one critical material. The wind turbine critical material cost range shows more variation because the material intensity variation of three materials are being considered. Finally, the Li-ion battery critical material cost range is the largest, as it not only includes the material intensity variation of four materials, but across seven different battery chemistries as well. Wind turbines can be seen to have the lowest LCOE of the three technologies considered, as well as the greatest critical material costs. One impact of this is that while wind power may currently seem appealing due to its lower LCOE, that low LCOE could be raised unexpectedly if the critical material prices increase suddenly which has been known to happen in rare earth elements such as Nd, Dy, and Tb in the past [85]. As recently as 2011, Chinese export restrictions caused rapid price increases in rare earth elements [103]. If those same price spikes were to occur again today under current material intensities, the cost of the generator component of a direct drive wind turbine would increase by approximately 41% [85].
5. Conclusions
This analysis provides the ability to compare and analyze performance indicators and environmental aspects of a wide range of clean energy technologies. As social, economic, and environmental sustainability concerns grow, the trend of considering broader implications of material selection beyond cost and functionality is becoming more common. The functional units discussed in this paper allow for the inclusion and comparison of metrics that consider environmental aspects of material use in technologies as well as the more traditional cost and functionality metrics. In addition, critical materials are commonly acquired through poor labor conditions, such as the improper recycling of critical materials from electronic waste in less developed countries, which can lead to health issues [104]. Cobalt mining in particular has been linked to funding conflict in the Democratic Republic of the Congo [105]. While this study does not delve into quantifying these social impacts, by quantifying critical material content in clean energy technologies, the technologies that demand more of these socially detrimental materials are identified.
Proactive design which considers the impacts of our material choices is necessary to not only ensure the uninterrupted development and implementation of clean energy technologies but also to ensure their social, economic, and environmental viability. In 2010, the US Department of Energy identified the material intensities of different clean energy technologies to be a “data gap” which has the potential to impede the ability of policymakers to understand the market situation and create strategies accordingly [31]. Providing data aggregation from across literature sources builds a more accurate range of the potential material intensities of clean energy technologies and better describes the inherent variation in material intensities that exists. This information is valuable for policymakers, as accurate data can allow for better characterization of markets and inform better decision making.
Author Contributions
Conceptualization, A.L. and G.G.; Methodology, A.L. and G.G.; Formal analysis, A.L. and G.G.; Investigation, A.L. and G.G.; Resources, G.G.; Data curation, A.L.; Writing—Original draft preparation, A.L.; Writing—Review and editing, A.L. and G.G.; Visualization, A.L.; Supervision, G.G.; Project administration, G.G.; Funding acquisition, G.G.
Funding
This research was funded by the National Science Foundation, under the grant numbers CBET–1454166 and CBET–1804554.
Acknowledgments
The authors would like to acknowledge Callie Babbitt for her helpful feedback on the concepts for this paper.
Conflicts of Interest
The authors declare no conflict of interest. The funders had no role in the design of the study; in the collection, analyses, or interpretation of data; in the writing of the manuscript, or in the decision to publish the results.
References
- IPCC. Global Warming of 1.5C—Summary for Policymakers. 2018. Available online: https://www.ipcc.ch/sr15/ (accessed on 20 July 2019).
- Jacobson, M.; Delucchi, M. Providing All Global Energy with Wind, Water, and Solar Power, Part I: Technologies, Energy Resources, Quantities and Areas of Infrastructure, and Materials. Energy Policy 2011, 39, 1154–1169. [Google Scholar] [CrossRef]
- US EPA. Global Greenhouse Gas Emissions Data. 2019. Available online: https://www.epa.gov/ghgemissions/global-greenhouse-gas-emissions-data (accessed on 5 November 2018).
- IPCC. Climate Change 2014: Mitigation of Climate Change. Contribution of Working Group III to the Fifth Assessment Report of the Intergovernmental Panel on Climate Change. 2014. Available online: https://www.ipcc.ch/report/ar5/wg3/ (accessed on 18 November 2018).
- EU SETIS. Photovoltaics Report. 2017. Available online: https://setis.ec.europa.eu/mis/technology/solar-photovoltaic (accessed on 26 November 2017).
- McGehee, M. An Overview of Solar Cell Technology. 2011. Available online: https://web.stanford.edu/group/mcgehee/presentations/McGehee2011.pdf (accessed on 20 November 2017).
- Helbig, C.; Bradshaw, A.M.; Kolotzek, C.; Thorenz, A.; Tuma, A. Supply Risks Associated with CdTe and CIGS Thin-Film Photovoltaics. Appl. Energy 2016, 178, 422–433. [Google Scholar] [CrossRef]
- NREL. Copper Indium Gallium Diselenide Solar Cells. 2017. Available online: https://www.nrel.gov/pv/copper-indium-gallium-diselenide-solar-cells.html (accessed on 26 November 2018).
- US DOE. Copper Indium Gallium Diselenide, Office of Energy Efficiency and Renewable Energy. 2017. Available online: https://energy.gov/eere/solar/copper-indium-gallium-diselenide (accessed on 20 November 2018).
- Pavel, C.C.; Lacal-Arántegui, R.; Marmier, A.; Schüler, D.; Tzimas, E.; Buchert, M.; Jenseit, W.; Blagoeva, D. Substitution Strategies for Reducing the Use of Rare Earths in Wind Turbines. Resour. Policy 2017, 52 (Suppl. C), 349–357. [Google Scholar] [CrossRef]
- Moss, R.; Tzimas, E.; Willis, P.; Arendorf, J.; Tercero Espinoza, L. Critical Metals in the Path Towards the Decarbonisation of the Eu Energy Sector. In Assessing Rare Metals as Supply-Chain Bottlenecks in Low-Carbon Energy Technologies; European Commission Joint Research Centre Institute for Energy and Transport: Luxembourg, 2013; Available online: https://publications.europa.eu/en/publication-detail/-/publication/505c089c-7655-4546-bd17-83f91d581190 (accessed on 1 November 2018).
- John, D. Rhenium—A Rare Metal Critical to Modern Transportation, United States Geological Survey. 2015. Available online: https://pubs.usgs.gov/fs/2014/3101/ (accessed on 26 November 2018).
- Konitzer, D.; Duclos, S.; Rockstroh, T. Materials for Sustainable Turbine Engine Development. Mater. Res. Soc. 2012, 37, 383–387. [Google Scholar] [CrossRef]
- Multi-Stakeholder Platform for a Secure Supply of Refractory Metals in Europe, Rhenium. Available online: http://prometia.eu/wp-content/uploads/2014/02/RHENIUM.pdf (accessed on 29 November 2017).
- Diouf, B.; Pode, R. Potential of Lithium-Ion Batteries in Renewable Energy. Renew. Energy 2015, 76 (Suppl. C), 375–380. [Google Scholar] [CrossRef]
- Fuel Cell Technology Office. 2016 Fuel Cells Section. 2016. Available online: https://www.energy.gov/sites/prod/files/2017/05/f34/fcto_myrdd_fuel_cells.pdf (accessed on 30 November 2017).
- Office of Energy Efficiency and Renewable Energy, Types of Fuel Cells. 2018. Available online: https://www.energy.gov/eere/fuelcells/types-fuel-cells (accessed on 17 November 2018).
- USGS. 2015 Minerals Yearbook: Platinum-Group Metals. 2018. Available online: https://s3-us-west-2.amazonaws.com/prd-wret/assets/palladium/production/mineral-pubs/platinum/myb1-2015-plati.pdf (accessed on 19 July 2019).
- Etacheri, V.; Marom, R.; Elazari, R.; Salitra, G.; Aurbach, D. Challenges in the Development of Advanced Li-Ion Batteries: A Review. Energy Environ. Sci. 2011, 4, 3243–3262. [Google Scholar] [CrossRef]
- Battery University Group, Types of Lithium-Ion Batteries. 2017. Available online: http://batteryuniversity.com/learn/article/types_of_lithium_ion (accessed on 18 December 2017).
- Battery University Group, Is Li-Ion the Solution for the Electric Vehicle? Available online: https://batteryuniversity.com/learn/archive/is_li_ion_the_solution_for_the_electric_vehicle (accessed on 19 July 2019).
- US Department of Energy. US Department of Energy Critical Materials Strategy. 2011. Available online: https://www.energy.gov/sites/prod/files/DOE_CMS2011_FINAL_Full.pdf (accessed on 12 February 2019).
- Kopera, J. Inside the Nickel Metal Hydride Battery. 2004. Available online: http://citeseerx.ist.psu.edu/viewdoc/download?doi=10.1.1.729.737&rep=rep1&type=pdf (accessed on 19 July 2019).
- USGS. Rare Earth Elements. 2017. Available online: https://pubs.usgs.gov/pp/1802/o/pp1802o.pdf (accessed on 19 July 2019).
- Punkkinen, H.; Mroueh, U.; Wahlström, M.; Youhanan, L.; Stenmarck, A. Critical Metals in End-of-Life Products; Recovery Potential and Opportunities for Removal of Bottlenecks of Recycling, Nordic Council of Ministers. 2017. Available online: http://norden.diva-portal.org/smash/get/diva2:1103956/FULLTEXT01 (accessed on 30 November 2017).
- Ku, A.; Setlur, A.; Loudis, J. Impact of Light Emitting Diode Adoption on Rare Earth Element Use in Lighting Implications for Yttrium, Europium, and Terbium Demand. Electrochem. Soc. 2015, 24, 45–49. [Google Scholar] [CrossRef]
- Leader, A.; Gaustad, G. Glasses, Ceramics, and Metals are Critical to a Clean Energy and Mobility Transition. Am. Ceram. Soc. Bull. 2019, 98, 29–33. [Google Scholar]
- Amin, N.; Matin, M.; Aliyu, M.; Alghoul, M.; Karim, M.; Sopian, M. Prospects of Back Surface Field Effect in Ultra-Thin High-Efficiency CdS/CdTe Solar Cells from Numerical Modeling. Int. J. Photoenergy 2010, 2010, 578580. [Google Scholar] [CrossRef]
- NREL. Cadmium Telluride Solar Cells. 2018. Available online: https://www.nrel.gov/pv/cadmium-telluride-solar-cells.html (accessed on 27 November 2018).
- Chakarvarty, U. Renewable Energy Materials Supply Implications; International Association for Energy Economics, Energy Forum First Quarter: Cleveland, OH, USA, 2018; pp. 37–39. [Google Scholar]
- Bauer, D.; Diamond, D.; Li, J.; Sandalow, D.; Telleen, P.; Wanner, B. US Department of Energy Critical Materials Strategy. 2010. Available online: https://www.osti.gov/servlets/purl/1000846-1gn61Q/ (accessed on 10 November 2018).
- Moss, R.L.; Tzimas, E.; Kara, H.; Willis, P.; Kooroshy, J. The Potential Risks from Metals Bottlenecks to the Deployment of Strategic Energy Technologies. Energy Policy 2013, 55 (Suppl. C), 556–564. [Google Scholar] [CrossRef]
- Bustamante, M.L.; Gaustad, G. Challenges in Assessment of Clean Energy Supply-Chains Based on Byproduct Minerals: A Case Study of Tellurium Use in Thin Film Photovoltaics. Appl. Energy 2014, 123, 397–414. [Google Scholar] [CrossRef]
- Woodhouse, M.; Goodrich, A.; Margolis, R.; James, T.; Dhere, R.; Gessert, T.; Barnes, T.; Eggert, R.; Albin, D. Perspectives on the Pathways for Cadmium Telluride Photovoltaic Module Manufacturers to Address Expected Increases in the Price for Tellurium. Sol. Energy Mater. Sol. Cells 2013, 115 (Suppl. C), 199–212. [Google Scholar] [CrossRef]
- Green Energy Blog, Crystalline Silicon Solar Cell Technology. 2016. Available online: http://cleangreenenergyzone.com/crystalline-silicon-solar-cell-technology/ (accessed on 5 November 2018).
- Shapley, Thin Film Solar Cells. 2011. Available online: http://butane.chem.uiuc.edu/pshapley/Environmental/L9/3.html (accessed on 27 November 2018).
- Chang, Y. Suppressing Lossy-Film-Induced Angular Mismatches between Reflectance and Transmittance Extrema: Optimum Optical Designs of Interlayers and AR Coating for Maximum Transmittance into Active Layers of CIGS Solar Cells. Opt. Express 2014, 22, A167–A178. [Google Scholar] [CrossRef]
- Magnetic Materials Producer Association, Standard Specifications for Permanent Magnet Materials. Available online: https://www.allianceorg.com/pdfs/MMPA_0100-00.pdf (accessed on 27 November 2018).
- Freiman, S.; Singh, M. Global Roadmap for Ceramic and Glass Technology, 1st ed.; John Wiley & Sons: Hoboken, NJ, USA, 2007; p. 554. ISBN 9780470104910. [Google Scholar]
- Habib, K.; Wenzel, H. Exploring Rare Earths Supply Constraints for the Emerging Clean Energy Technologies and the Role of Recycling. J. Clean. Prod. 2014, 84 (Suppl. C), 348–359. [Google Scholar] [CrossRef]
- Hoenderdaal, S.; Tercero Espinoza, L.; Marscheider-Weidemann, F.; Graus, W. Can a Dysprosium Shortage Threaten Green Energy Technologies? Energy 2013, 49 (Suppl. C), 344–355. [Google Scholar] [CrossRef]
- Biello, D. Rare Earths: Elemental Needs of the Clean-Energy Economy. 2010. Available online: https://www.scientificamerican.com/article/rare-earths-elemental-needs-of-the-clean-energy-economy/ (accessed on 29 November 2018).
- Seaman, J. Rare Earths and Clean Energy: Analyzing China’s Upper Hand. 2010. Available online: https://inis.iaea.org/collection/NCLCollectionStore/_Public/42/052/42052647.pdf (accessed on 30 November 2018).
- Hart, M. Evaluating United States and World Consumption of Neodymium, Dysprosium, Terbium, and Praseodymium in Final Products. Master’s Thesis, Colorado School of Mines, Golden, CO, USA, 2013. [Google Scholar]
- Du, X.; Graedel, T. Global Rare Earth in-Use Stocks in NdFeB Permanent Magnets. J. Ind. Ecol. 2017, 15, 836–843. [Google Scholar] [CrossRef]
- Lee, K. Protective Coatings for Gas Turbines, National Energy Technology Laboratory. 2006. Available online: https://www.netl.doe.gov/File%20Library/Research/Coal/energy%20systems/turbines/handbook/4-4-2.pdf (accessed on 27 November 2018).
- Harris, K.; Wahl, J. Improved Single Crystal Superalloys, CMSX-4(SLS)[La+Y] and CMSX-486, Superalloys; Green, K.A., Pollock, T.M., Harada, H., Howson, T.E., Reed, R.C., Schirra, J.J., Walston, S., Eds.; TMS (The Minerals, Metals & Materials Society): Pittsburgh, PA, USA, 2004; pp. 45–52. [Google Scholar]
- NPTEL. Fuel Cells—Types and Chemistry. Available online: https://nptel.ac.in/courses/103102015/introduction%20and%20overview%20of%20fuel%20cell/basic%20electrochemistry%20for%20all%20the%20fuel%20cells.html (accessed on 27 November 2018).
- Thijssen, J. Solid Oxide Fuel Cells and Critical Materials: A Review of Implications, National Energy Technology Laboratory. 2011. Available online: https://www.netl.doe.gov/File%20Library/research/coal/energy%20systems/fuel%20cells/Rare-Earth-Update-for-RFI-110523final.pdf (accessed on 14 September 2018).
- James, B.; DeSantis, D. Manufacturing Cost and Installed Price Analysis of Stationary Fuel Cell Systems, Strategic Analysis Inc. 2015. Available online: https://www.sainc.com/assets/site_18/files/publications/sa%202015%20manufacturing%20cost%20and%20installed%20price%20of%20stationary%20fuel%20cell%20systems_rev3.pdf (accessed on 27 November 2018).
- Grandell, L.; Lehtilä, A.; Kivinen, M.; Koljonen, T.; Kihlman, S.; Lauri, L. Role of Critical Metals in the Future Markets of Clean Energy Technologies. Renew. Energy 2016, 95, 53–62. [Google Scholar] [CrossRef]
- Chemistry Views, Fuel Cell Capacity and Cost Trends. 2013. Available online: https://www.chemistryviews.org/details/ezine/4817371/Fuel_Cell_Capacity_and_Cost_Trends.html (accessed on 5 November 2018).
- Piccirilli, D. Fact Sheet—Fuel Cells, White Papers—EESI. 2015. Available online: https://www.eesi.org/papers/view/fact-sheet-fuel-cells (accessed on 19 November 2018).
- Thackeray, M.; Wolverton, C.; Isaacs, E. Electrical Energy Storage for Transportation—Approaching the Limits of, and Going Beyond, Lithium-Ion Batteries. J. Energy Environ. Sci. 2012, 5, 7854–7863. [Google Scholar] [CrossRef]
- Andersson, B.A.; Råde, I. Metal Resource Constraints for Electric-Vehicle Batteries. Transp. Res. Part D: Transp. Environ. 2001, 6, 297–324. [Google Scholar] [CrossRef]
- Stamp, A.; Lang, D.J.; Wäger, P.A. Environmental Impacts of a Transition toward E-Mobility: The Present and Future Role of Lithium Carbonate Production. J. Clean. Prod. 2012, 23, 104–112. [Google Scholar] [CrossRef]
- Gaines, L.; Nelson, P. Lithium-Ion Batteries: Examining Material Demand and Recycling Issues. Argonne National Laboratory. 2010. Available online: https://anl.box.com/s/ywkdwjaqsc61vtqkakhmhg06tm3adfgl (accessed on 5 November 2018).
- Eriksson, T.; Olsson, D. The Product Chains of Rare Earth Elements Used in Permanent Magnets and NiMH Batteries for Electric Vehicles. 2011. Available online: http://publications.lib.chalmers.se/records/fulltext/147133.pdf (accessed on 30 November 2017).
- USGS Mineral Resources Program. The Rare-Earth Elements—Vital to Modern Technologies and Lifestyles. 2014. Available online: https://pubs.usgs.gov/fs/2014/3078/ (accessed on 30 November 2017).
- Maximum, E.V. Rare Earths and Neodymium. 2009. Available online: http://maximumev.blogspot.com/ (accessed on 29 November 2017).
- Pavel, C.; Marmier, A.; Tzimas, E.; Schleicher, T.; Schuler, D.; Buchert, M.; Blagoeva, D. Critical Raw Materials in Lighting Applications: Substitution Opportunities and Implication on their Demand. Phys. Status Solidi A 2016, 11, 2937–2946. [Google Scholar] [CrossRef]
- Chen, D.; Xiang, W.; Liang, X.; Zhong, J.; Yu, H.; Ding, M.; Lu, H.; Ji, Z. Advances in Transparent Glass–Ceramic Phosphors for White Light-Emitting Diodes—A Review. J. Eur. Ceram. Soc. 2015, 35, 859–869. [Google Scholar] [CrossRef]
- Bush, S. Discussing LED Lighting Phosphors. 2014. Available online: https://www.electronicsweekly.com/news/products/led/discussing-led-lighting-phosphors-2014-03/ (accessed on 8 November 2018).
- Balachandran, G. Case Study 1—Extraction of Rare Earths for Advanced Applications. Treatise Process Metall. 2014, 3, 1291–1340. [Google Scholar]
- Alonso, E.; Sherman, A.; Wallington, T.; Everson, M.; Field, F.; Roth, R.; Kirchain, R. Evaluating Rare Earth Element Availability: A Case with Revolutionary Demand from Clean Technologies. Environ. Sci. Technol. 2012, 46, 3406–3414. [Google Scholar] [CrossRef]
- Pihl, J. Table 33. Batteries for Selected Hybrid-Electric Vehicles, Model Years 2013–2014, Oak Ridge National Laboratory. 2014. Available online: https://web.archive.org/web/20141129052920/http://cta.ornl.gov/vtmarketreport/spreadsheets/T33_Batteries_for_Selected_HEV_Vehicles_2013_2014.xls (accessed on 30 June 2019).
- Argonne National Laboratory. Assessment of Light-Duty Plug-in Electric Vehicles in the United States, 2010–2018. 2019. Available online: https://tedb.ornl.gov/wp-content/uploads/2019/04/ANL_Assessment_of_LD_PEV_2010-2018.pdf (accessed on 16 July 2019).
- Kane, M. Over 50 Plug-in EVs Compared: Price, Range and More. 2018. Available online: https://insideevs.com/reviews/335499/over-50-plug-in-evs-compared-price-range-more-may-2018/ (accessed on 16 July 2019).
- The Light Company. Light Bulb Average Rated Life Time Hours. 2015. Available online: www.thelightbulb.co.uk/resources/light_bulb_average_rated_life_time_hours/ (accessed on 5 June 2019).
- US Department of Energy. How Energy-Efficient Light Bulbs Compare with Traditional Incandescents. 2019. Available online: https://www.energy.gov/energysaver/save-electricity-and-fuel/lighting-choices-save-you-money/how-energy-efficient-light (accessed on 5 June 2019).
- Energy Star, Lighting Technologies: A Guide to Energy-Efficient Illumination. Available online: https://www.energystar.gov/ia/partners/promotions/change_light/downloads/Fact%20Sheet_Lighting%20Technologies.pdf (accessed on 5 June 2019).
- Australian, State and Territory and New Zealand Governments. Factsheet: Light Bulb Buyers Guide. 2016. Available online: http://www.energyrating.gov.au/document/factsheet-light-bulb-buyers-guide (accessed on 5 June 2019).
- Lim, S.; Kang, D.; Ogunseitan, O.; Schoenung, J. Potential Environmental Impacts from the Metals in Incandescent, Compact Fluorescent Lamp (CFL), and Light-Emitting Diode (LED) Bulbs. Environ. Sci. Technol. 2013, 47, 1040–1047. [Google Scholar] [CrossRef]
- US Department of Energy. Life-Cycle Assessment of Energy and Environmental Impacts of LED Lighting Products Part 2: LED Manufacturing and Performance. 2012. Available online: https://www.pnnl.gov/main/publications/external/technical_reports/PNNL-21443.pdf (accessed on 5 June 2019).[Green Version]
- Myer, C. Lightbulb Efficiency Comparison Chart and Analysis. 2015. Available online: https://greatercea.org/lightbulb-efficiency-comparison-chart/ (accessed on 5 June 2019).
- Brown, B. How to Convert 1500 Lumens to Watts. 2019. Available online: https://www.hunker.com/12002783/how-to-convert-1500-lumens-to-watts (accessed on 5 June 2019).
- Staff, S.L. Lighting Comparison: LED vs. Fluorescent and CFL. Available online: https://www.stouchlighting.com/blog/fluorescent-vs-led-vs-cfl (accessed on 5 June 2019).
- Pimputkar, S.; Speck, J.; Denbaars, S.; Nakamura, S. Prospects for LED Lighting. Nat. Photonics 2009, 3, 180–182. [Google Scholar] [CrossRef]
- Cheng, Y.; Cheng, K. General Study for Using LED to Replace Traditional Lighting Devices. In Proceedings of the 2nd International Conference on Power Electronics Systems and Applications, Hong Kong, China, 12–14 November 2006; pp. 173–177. [Google Scholar]
- Botero-Valencia, J.; López, F.; Vargas-Bonilla, J. Classification of Artificial Light Sources and Estimation of Color Rendering Index Using RGB Sensors, K Nearest Neighbor and Radial Basis Function. Int. J. Smart Sens. Intell. Syst. 2014, 8, 1505–1524. [Google Scholar]
- Elvidge, C.; Keith, D.; Tuttle, B.; Baugh, K. Spectral Identification of Lighting Type and Character. Sensors 2010, 10, 3961–3988. [Google Scholar] [CrossRef]
- World Nuclear Association. Comparison of Lifecycle Greenhouse Gas Emissions of Various Electricity Generation Sources. Available online: http://www.world-nuclear.org/uploadedFiles/org/WNA/Publications/Working_Group_Reports/comparison_of_lifecycle.pdf (accessed on 11 June 2019).
- US EPA. Design for the Environment Life-Cycle Assessments. 2017. Available online: https://www.epa.gov/saferchoice/design-environment-life-cycle-assessments (accessed on 17 July 2019).
- USGS. Rare Earths. 2018. Available online: https://www.usgs.gov/centers/nmic/rare-earths-statistics-and-information (accessed on 14 September 2018).
- Leader, A.; Gaustad, G.; Babbitt, C. The Effect of Critical Material Prices on the Competitiveness of Clean Energy Technologies. Mater. Renew. Sustain. Energy 2019, 8, 8. [Google Scholar] [CrossRef]
- Harper, E.; Kavlak, G.; Burmeister, L.; Eckelman, M.; Erbis, S.; Espinoza, V.; Nuss, P.; Graedel, T. Criticality of the Geological Zinc, Tin, Lead Family. J. Ind. Ecol. 2015, 19, 628–644. [Google Scholar] [CrossRef]
- Du, X.E.; Graedel, T.E. Global in-Use Stocks of Rare Earth Elements: A First Estimate. Environ. Sci. Technol. 2011, 45, 4096–4101. [Google Scholar] [CrossRef]
- Zimmermann, T.; Gößling-Reisemann, S. Recycling Potentials of Critical Metals-Analyzing Secondary Flows from Selected Applications. Resources 2014, 3, 291–318. [Google Scholar] [CrossRef]
- Moss, R.; Tzimas, E.; Kara, H.; Willis, P.; Kooroshy, J. Critical Metals in Strategic Energy Technologies; Assessing Rare Metals as Supply-Chain Bottlenecks in Low-Carbon Energy Technologies. 2011. Available online: http://publications.jrc.ec.europa.eu/repository/handle/JRC65592 (accessed on 20 July 2019).
- Manthiram, A. An Outlook on Lithium Ion Battery Technology. Acs Cent. Sci. 2017, 3, 1063–1069. [Google Scholar] [CrossRef] [Green Version]
- Fickling, D. This Cobalt Chemistry Experiment Is Rich with Variables. 2017. Available online: https://www.bloomberg.com/gadfly/articles/2017-09-28/cobalt-s-chemistry-experiment (accessed on 30 November 2018).
- Olivetti, E.; Ceder, G.; Gaustad, G.; Fu, X. Lithium-Ion Battery Supply Chain Considerations: Analysis of Potential Bottlenecks in Critical Metals. Joule 2017, 1, 229–243. [Google Scholar] [CrossRef] [Green Version]
- Lifton, J. What’s the Play in Lanthanum? 2008. Available online: https://web.archive.org/web/20181019073126/http://www.resourceinvestor.com/2008/03/26/whats-play-lanthanum (accessed on 5 November 2018).
- US Department of Energy. Fuel Cell Technologies Office—FY 2017 Budget at-a-Glance. 2016. Available online: https://www.energy.gov/sites/prod/files/2016/03/f30/At_A_GLANCE%20%28FCTO%29.pdf (accessed on 29 November 2018).
- Xu, Y.; Chumbley, L.; Laabs, F. Liquid Metal Extraction of Nd from NdFeB Magnet Scrap. J. Mater. Res. 2000, 15, 2296–2304. [Google Scholar] [CrossRef]
- Gorman, S. As Hybrid Cars Gobble Rare Metals, Shortage Looms, Reuters. 2009. Available online: https://www.reuters.com/article/us-mining-toyota/as-hybrid-cars-gobble-rare-metals-shortage-looms-idUSTRE57U02B20090831 (accessed on 5 June 2019).
- Machacek, E.; Richter, J.; Habib, K.; Klossek, P. Recycling of Rare Earths from Fluorescent Lamps: Value Analysis of Closing-the-Loop under Demand and Supply Uncertainties. Resour. Conserv. Recycl. 2015, 104, 76–93. [Google Scholar] [CrossRef]
- World Nuclear Association. Decommissioning Nuclear Facilities. 2019. Available online: https://www.world-nuclear.org/information-library/nuclear-fuel-cycle/nuclear-wastes/decommissioning-nuclear-facilities.aspx (accessed on 17 July 2019).
- Rechenberger, D. Natural Gas Is the Most Climate-Friendly Fossil Fuel in Electricity Production, Wingas. Available online: https://www.wingas.com/fileadmin/Wingas/WINGAS-Studien/Energieversorgung_und_Energiewende_en.pdf (accessed on 13 June 2019).
- US Environmental Protection Agency. EGrid Summary Tables 2016. Available online: https://www.epa.gov/sites/production/files/2018-02/documents/egrid2016_summarytables.pdf (accessed on 6 June 2019).
- Lazard. Lazard’s Levelized Cost of Storage Analysis Version 4.0. 2018. Available online: https://www.lazard.com/media/450774/lazards-levelized-cost-of-storage-version-40-vfinal.pdf (accessed on 17 July 2019).
- Lazard. Lazard’s Levelized Cost of Energy Analysis Version 12.0. 2018. Available online: https://www.lazard.com/media/450784/lazards-levelized-cost-of-energy-version-120-vfinal.pdf (accessed on 17 July 2019).
- Majcher, K. Question of the Week: Rare Earth Metals. 2015. Available online: https://www.technologyreview.com/s/535381/what-happened-to-the-rare-earths-crisis/ (accessed on 11 September 2018).
- Williams, E.; Kahhat, R.; Allenby, B.; Kavazanjian, E.; Kim, J.; Xu, M. Environmental, Social, and Economic Implications of Global Reuse and Recycling of Personal Computers. Environ. Sci. Technol. 2008, 42, 6446–6454. [Google Scholar] [CrossRef]
- Home, A. Commentary: For Cobalt Buyers, Is Artisanal Mining the Problem or the Solution? 2018. Available online: https://uk.reuters.com/article/uk-artisanal-mining-ahome/commentary-for-cobalt-buyers-is-artisanal-mining-the-problem-or-the-solution-idUKKCN1G627E (accessed on 19 February 2019).
Figure 1.
Global greenhouse gas emissions by sector (2010), total emissions were 49 Gt CO2eq [4].
Figure 1.
Global greenhouse gas emissions by sector (2010), total emissions were 49 Gt CO2eq [4].

Figure 2.
Example of a wind turbine’s lifecycle. The lifecycle greenhouse gas emissions discussed in this study include the emissions produced by the raw material extraction, manufacturing, use phase, and end of life for each technology.
Figure 2.
Example of a wind turbine’s lifecycle. The lifecycle greenhouse gas emissions discussed in this study include the emissions produced by the raw material extraction, manufacturing, use phase, and end of life for each technology.

Figure 3.
Clean energy production technologies: (a) material intensity of direct drive wind turbines [2,32,40,41,42,43,44,87]; (b) material intensity of three types of photovoltaic solar panels [7,22,32,33,34,88,89]; (c) material intensity of the superalloy coating used on gas turbines blades [11,14,47].

Figure 4.
Low emission mobility technologies with functional units of kg of material per kWh of energy storage: (a) material intensity of seven different Li-ion battery chemistries in battery electric vehicles [55,91,92]; (b) material intensity of NiMH batteries in battery electric vehicles [22,40,43,55,58,59,93].

Figure 5.
Low emission mobility technologies with functional units of kg of material per kW of power capacity: (a) material intensity of PEM fuel cells in fuel cell electric vehicles [2,52,53]; (b) material intensity of the NdFeB permanent magnet motor in electric vehicles [2,22,40,41,43,45,58,67,95,96].


Figure 7.
Demonstration of other potential material intensity units as shown by adding CRI into the denominator of the functional units for CFL and LED lighting devices [22,25,26,97].

Figure 8.
Emissions savings units applied to the clean energy production technologies of direct drive wind turbines, three different types of photovoltaic solar panels, and gas turbines [2,7,11,14,22,32,33,34,40,41,42,43,44,47,82,87,88,89].

Figure 9.
Critical material costs versus levelized cost of energy (LCOE) for three example technologies, wind turbines, fuel cells, and Li-ion batteries [85,101,102]. Note the wind turbine critical material cost values are plotted against the secondary y axis.


Table 1.
Critical materials identified in clean energy technologies through literature review. Table reproduced from Leader and Gaustad, 2019 [27].
Table 1.
Critical materials identified in clean energy technologies through literature review. Table reproduced from Leader and Gaustad, 2019 [27].
| Glasses and Ceramics | Glasses and Ceramics Sources | Metals | Metals Sources | |||
|---|---|---|---|---|---|---|
| Clean Energy Production | Solar Panels | CdTe | SnO2, Zn2SnO4, ZnO, SnO2, Cd2SnO4 | [28,29] | Cd, Te, Ni, Cr, Mo | [7,22,30,31,32,33,34] |
| Crystalline Silicon | c-Si | [35] | Ag, Sn, Ni | [32] | ||
| CIGS | ZnO, NaO, CaO, SiO2 | [36,37] | In, Ga, Se, Sn, Ni, Cr, Mo | [22,30,31,32] | ||
| Wind Turbines | Permanent Magnet | Sr6Fe2O3, Ba6Fe2O3, Si3N4 | [38,39] | Dy, Nd, Mo, Tb, Pr | [2,32,40,41,42,43,44,45] | |
| Gas Turbines | Superalloy Coating | Y2O3-ZrO2, CMC, Si3N4, 1-xBaO·xSrO·Al2 O3·2SiO2, 0 ≤ x ≤ 1, Al2O3, Si3N4, SiC | [39,46] | Co, Ni, Re, Hf, Mo, Y | [14,47] | |
| Low Emission Mobility | Fuel Cells | SOFC | Ni/YSZ, LaMnO3, LSCF, ScSZ, LSGM, YSZ, LSM, LSC, LaMnSrO3, La(Sr, Mn, Ca)CrO3 | [39,48,49,50] | Y, La, Ce, Co, Sm, Gd, Sr, Ni | [49,51] |
| PEM | Pt | [2,22,52,53] | ||||
| Batteries | Li-ion | LiCoO2, LiMn2O4, LiFePO4, LiMn1.5Ni0.5O4, LiNiMnCoO2, LiNiCoAlO2, Li4Ti5O12 | [20,54] | Li, Co, Ni, Mn, Dy, Pr, Nd, V, Tb | [2,22,55,56,57] | |
| NiMH | Pr, Nd, La, Co, Mn, Ni, Ce, V, Tb, Dy | [22,40,43,55,58,59] | ||||
| Motors | Permanent Magnet | Sr6Fe2O3, Ba6Fe2O3, Si3N4 | [38,39] | Dy, Pr, Nd, Co, Tb | [22,40,41,43,45,58,60] | |
| Energy Efficiency | Lighting Devices | CFL | BAM, CAT, LAP, YAG, GaAs, GaN, InGaN | [61] | Ga, La, Ce, Tb, Eu, Y, Gd, Mn, Ge, In | [22,25,61] |
| LFL | BAM, CAT, LAP, YAG, GaAs, GaN, InGaN | [61] | La, Ce, Tb, Eu, Y, Mn, Ga, Ge, In | [22,25,61] | ||
| LED | Y3Al5O12:Ce3+, YAG, LuAG, GAL, LaPO4:Ce, Tb, BaMgAl10O17:Eu & (Sr, Ca, Ba)5(PO4)3Cl:Eu, Y2O3:Eu, (Y,Eu)2O3, InGaN | [61,62,63,64] | In, Ga, Ce, Eu, Y, Gd, La, Ni, Tb, Ge, Ag, Sn | [25] |
Table 2.
Values used in calculation of lighting units, averaged from literature values.
| Average Value (Used in Calculation of Functional Units) | Sources | ||
|---|---|---|---|
| Lifespan (hours) | CFL | 10,100 | [69,70,71,72,73,74,75] |
| LFL | 22,000 | [69,71,72,75] | |
| LED | 32,800 | [69,70,71,72,73,74,75] | |
| kW/Lumen | CFL | 16.4 | [71,73,74,75,76] |
| LFL | 11.0 | [71,75] | |
| LED | 16.7 | [71,73,74,75,76] | |
| CRI | CFL | 76.2 | [77,78,79,80,81] |
| LFL | 76.2 | [77,78,79,80,81] | |
| LED | 81.1 | [77,78,79,80,81] |
© 2019 by the authors. Licensee MDPI, Basel, Switzerland. This article is an open access article distributed under the terms and conditions of the Creative Commons Attribution (CC BY) license (http://creativecommons.org/licenses/by/4.0/).
Share and Cite
MDPI and ACS Style
Leader, A.; Gaustad, G. Critical Material Applications and Intensities in Clean Energy Technologies. Clean Technol. 2019, 1, 164-184. https://0-doi-org.brum.beds.ac.uk/10.3390/cleantechnol1010012
AMA Style
Leader A, Gaustad G. Critical Material Applications and Intensities in Clean Energy Technologies. Clean Technologies. 2019; 1(1):164-184. https://0-doi-org.brum.beds.ac.uk/10.3390/cleantechnol1010012
Chicago/Turabian StyleLeader, Alexandra, and Gabrielle Gaustad. 2019. "Critical Material Applications and Intensities in Clean Energy Technologies" Clean Technologies 1, no. 1: 164-184. https://0-doi-org.brum.beds.ac.uk/10.3390/cleantechnol1010012